Abstract
This paper presents a new approach based on the optimization of the blade pitching strategy of offshore wind turbines in order to maximize the global energy output considering the Gaussian wake model and including the effect of added turbulence. A genetic algorithm is proposed as an optimization tool in the process of finding the optimal setting of the wind turbines, which aims to determine the individual pitch of each turbine so that the overall losses due to the wake effect are minimised. The integration of the Gaussian model, including the added turbulence effect, for the evaluation of the wakes provides a step forward in the development of strategies for optimal operation of offshore wind farms, as it is one of the state-of-the-art analytical wake models that allow the evaluation of the energy output of the project in a more reliable way. The proposed methodology has been tested through the execution of a set of test cases that show the ability of the proposed tool to maximize the energy production of offshore wind farms, as well as highlights the importance of considering the effect of added turbulence in the evaluation of the wake.
1. Introduction
Offshore wind energy is one of the renewable generation technologies that has experienced the greatest technological and industrial progress in recent years, while achieving significant installation rates throughout the world despite its still relatively high costs compared to conventional technologies and photovoltaic technology in particular. According to the Global Wind Energy Council, the installed capacity of offshore wind technology globally was 29.1 GW at the end of 2019 (with a capacity addition during that year of 6.1 GW) [1]. The Global Wind Energy Council also predicts that this trend will continue in the coming years with the expectation of achieving an installed capacity of 235 GW by 2030.
This scenario of continuous expansion and technological development of offshore wind energy is leading to the emergence of many innovative solutions. Among them, one of the areas currently under research is the development of new operating strategies with the aim of increasing the techno-economic efficiency of the wind farm (WF). Among the different lines of research within this area, the work aimed at improving maintenance strategies [2,3,4], operation from the point of view of the electricity grid [5,6,7,8] or increasing production by mitigating the effect of the wakes, the area in which this work is included, stand out.
In particular, this work proposes a global operation strategy for a WF considering the pitch angle of each wind turbine (WT) as operational variables to be optimised, so that the objective is the global maximisation of the energy produced by the farm taking into account the existing interactions between the WTs as a consequence of the wakes. In this way, the global strategy can lead to certain WTs operating at derated power with the aim of increasing the production of other WTs located downstream and thus increasing the global production of the WF, in contrast to the classic strategy of operation based on a greedy approach in which each turbine is operated to maximize energy capture individually.
In the context of the addressed problem, one of the fundamental aspects in the assessment of the energy produced by a WF is the effect of the wakes between WTs. Within the existing models, two types should be highlighted: (i) Analytical models and (ii) models based on computational fluid simulation (CFD), the latter being more precise but with the main disadvantage of requiring a considerable computational effort (in the order of days or weeks for a single simulation) which makes their application impractical for solving optimization problems based on meta-heuristic techniques that require the evaluation of a large number of potential solutions. Therefore, existing work in the literature on the problem addressed in this paper are based on analytical wake models.
Corten and Schaak [9] presented in 2004 one of the first works proposing the possibility of increasing the power generated and reducing the load by individually selecting the tip speed ratio of each WT by means of an analysis of experimental results. Madjidian and Rantzer [10] proposed in 2011, a novel approach for optimizing the overall output power of a row of WTs being all operated by the same setpoint. The authors proposed a recursive model to evaluate the effect of the wake depending on the thrust coefficient. In 2012, Lee et al. [11] presented a genetic algorithm (GA) to optimize the strategy for individually controlling the pitch angle each of the WTs. In that work, the authors considered a row of WTs, achieving an improvement of 4.5% in the aerodynamic power, compared to the conventional operating strategy. Serrano et al. [12] also presented a GA to maximise the total power of a WF by individually selecting the operating point of each of the turbines using the Park analytical model proposed by Katic and Jensen [13].
In the same line of work, Hou et al. [14] proposed a particle swarm optimization algorithm for maximizing the energy produced. This work was later extended by the authors to include consideration of fatigue loads [15]. A similar approach based on global production optimisation and lifetime estimation was presented by Tian et al. [16] using the Park model for the calculation of wake effect.
Dilip and Porté-Agel [17] proposed the analysis for a two-turbine WF (with the second WT in the wake of the first one) by means of large-eddy simulations (LES) and analysing the results obtained for the entire operating range of the pitch angle, concluding that it is possible to maximise the total power of the WF by operating the upstream WT with a negative pitch, which increases turbulence and allows for greater energy production from the second WT, which has an impact on the total production of both generators as a whole.
Deljouyi et al. [18] presented a free learning algorithm to obtain the optimal axial induction factors of the turbines and maximize power production, based on the Park wake effect model. Ahmad et al. [19] also presented an approach for maximising the power output of a WF using the Park wake model, but with the particularity that the authors introduced a dependence on the model depending on the ambient turbulence intensity.
The approach proposed in this paper advances the current state of the art by including the Gaussian wake model developed by Bastankhah and Porté-Agel [20], which according to various works in the literature, presents a good correspondence with the results provided by simulations and real measurements [21,22,23,24]. Furthermore, in addition to introducing the Gaussian wake model, the present work has also added the influence of the turbulence intensity added by the WTs, which significantly affects the recovery of the wake, thus adding an additional degree of realism to the modelling of the problem posed.
After this brief introduction, the rest of the paper is structured as follows: Section 2 presents the energy production model of the WF, by describing the proposed wake model and the operating conditions according to the pitch angle of the WT; Section 3 introduces the optimisation approach used to maximise the power captured by the entire offshore WF; Section 4 presents the results obtained in the proposed tests and, finally, Section 5 presents the conclusions of the work carried out.
2. Offshore Wind Farm Energy Output Model
This section details the calculation model of the power generated by the WF based on two main aspects. On the one hand, the proposed wake calculation model is detailed and, on the other hand, the influence of pitch angle on the power generated by the WTs is introduced.
2.1. Wake Effect Model
The influence (i.e., the wake effect) that each WT has on downstream WTs must be evaluated in order to calculate the total energy of the WF.
Bastankhah and Porté-Agel [20] introduced a new wake model by applying equations of conservation of mass and momentum, assuming a Gaussian and self-similar profile in the wake:
where,
- is the standardised speed deficit, defined as:where is the speed of the free flow and the speed of the wake, both terms refer to the flow component.
- is defined as:is the diameter of the turbine, x is the distance downstream of the turbine, k∗ is associated with the wake growth rate, and ε is the independent term, that according to Niayifar and Porté-Agel [25] can be calculated as:where represents the relation between the cross-sectional area of the wake just after the initial wake expansion and the rotor swept area. This parameter is a function of the thrust coefficient; CT, and it was derived by Frandsen et al. [26] employing the Actuator-Disc Theory. The mathematical expression is as follows:
- Finally, z − zh is the distance in the vertical direction to the rotor axis, and y is the horizontal distance to the rotor axis in the spanwise direction of flow.
The accumulated effect of the wakes by multiple wind turbines has been considered in the same way as in the work of Niayifar and Porté-Agel [25], using the model proposed by Voutsinas et al. [27]:
where is the wind speed at the position of the i-th WT considering the cumulative wake effect introduced by upstream WTs (of the i-th WT), is the wind speed at the position of the k-th WT considering the cumulative effect of the wakes of the upstream WTs (of the k-th WT), and is the individual condition produced by the k-th WT on the i-th WT.
The proposed model has shown an acceptable agreement with the results obtained by large eddy simulations (LES) [28], LiDAR measurements [24,29], and wind tunnel [28,30]. It presents a significant improvement with respect to the models commonly used in commercial packages such as WAsP or OpenWind. In addition, it has the advantage of having a single parameter to be determined by calibration, the wake growth rate, k∗.
Niayifar and Porté-Agel [25] extended the wake model by obtaining an empirical expression to calculate this wake growth rate, k∗, from results obtained with LES simulations:
where I is the turbulence intensity of the flow immediately upstream of the rotor.
On the other hand, the increase in the turbulence intensity, I+, induced by a WT is calculated from the following expression obtained from [31].
where I0 is the turbulence intensity of free flow and a is the induction factor, determined by expression:
Once the turbulence intensity induced by the WTs has been calculated, the turbulence intensity in the wake can be determined using the following expression:
Finally, in a WF with several turbines interacting through their wakes, the increase in turbulence intensity for the j turbine can be calculated as follows:
where Nt is the number of turbines in the WF, Aw is the overlapped area between the wake produced by the k-th turbine and the sweep area of the j-th turbine rotor. corresponds to the increase in turbulence intensity produced by the k-th turbine at the position of the j-th turbine. Thus, the increase in turbulence intensity at the j-th WT position is determined as that of the upstream turbine that has the greatest impact on the j-th WT.
2.2. Captured Energy Calculation
The power generated by a WT, PWT, as a function of the power coefficient, CP, (which in turn depends on the pitch angle, β, and the tip speed ratio, , can be expressed as:
where is the air density, u the wind speed and R the radius of the WT.
In practical terms, the power generated by the WT can be controlled through the configuration of the pitch angle, β, and the tip speed ratio, , which allows the value of the power coefficient and in turn the power generated to be adjusted according to Equation (11).
The dependence of the power coefficient on both control variables is a characteristic that varies according to the specific WT model. As an example, Figure 1 shows the value of the power coefficient, CP, depending on the tip speed ratio, , and the pitch angle, β, for the NREL 5 MW reference turbine [32].
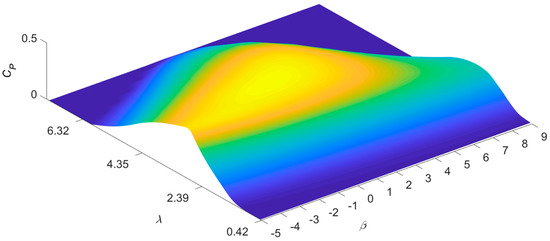
Figure 1.
Power coefficient of the NREL 5 MW reference turbine, CP, depending on the pitch angle, β, and the tip speed ratio, λ [32].
The usual way of setting a WT is to operate at maximum power coefficient for wind speeds below nominal, while for higher speeds the power coefficient is adjusted to obtain the rated power of the WT. In this way, the usual power curve of a WT is obtained, represented in Figure 2 by the black line. However, it is also possible to operate the WT at power coefficients different from the maximum for speeds between cut-in speed and nominal speed. Figure 2 also shows the curves corresponding to the power-speed ratio that would be obtained by setting the WT at different pitch angles—considering the full range of pitch angle operation, both in the case of β < 0° (pitch-to stall) and in the case of β ≥ 0° (pitch-to feather)—,while the tip speed ratio remains constant (note that in the figure only the power-speed characteristic is shown for operation at certain pitch angles for clarity of representation, the operating range of the pitch angle being wider than that shown).
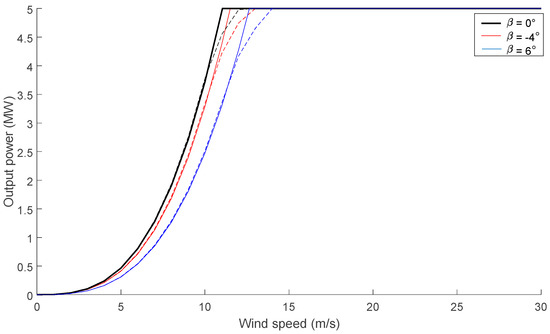
Figure 2.
Generated power by the NREL 5 MW reference turbine depending on wind speed.
In this way, for wind speeds below the rated speed, it is possible to derate the WTs operating at a different pitch angle than that corresponding to the maximum CP, which allows the establishment of a coordinated global strategy to reduce the power captured by the upstream wind turbines in order to increase the power capture by the remaining downstream wind turbines.
The influence of turbulence intensity, I, on the wind turbine power curve has been modelled by the following expression [33,34]:
In this way, the power curve obtained by Equation (12) without considering turbulence (usually referred to as zero-turbulence power curve) is corrected by taking into account the effect of fluctuations in wind speed induced by turbulence. In practical terms, the consideration of turbulence in the power generation model of a WT results in a slight increase in output for below-nominal operating conditions and a lower output for wind speeds in the transition zone (just below nominal the rated speed). This effect can be seen in Figure 2 by the dotted curves representing the corrected power curves considering the turbulence intensity for operation at each of the pitch angles shown in this example.
In addition, it is worth noting the influence of the thrust coefficient, CT, on the wake effect, as can be extracted from Equations (5) and (9). As it happens with the power coefficient, CP, the thrust coefficient depends on the tip speed ratio and the pitch angle of each WT. This way, the power and the perturbation produced over other WTs can be simultaneously controlled to some extent. Figure 3 shows the dependence of the thrust coefficient on both control variables, the pitch angle, β, and the tip speed ratio, , for the NREL 5 MW reference WT [32].
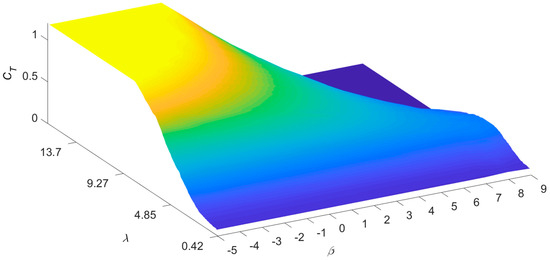
Figure 3.
Thrust coefficient, CT, depending on the pitch angle, β, and the tip speed ratio, λ, for the NREL 5 MW reference WT.
Finally, once all the perturbations among WTs have been calculated, the power produced by the offshore WF can be calculated as the sum of the individual powers generated by each of the WTs:
where is the actual wind speed at the position of the i-th WT accounting for the wake effect and Ii is the turbulence intensity at the position of the i-th WT.
3. Proposed Optimization Framework
3.1. Problem Formulation
The objective function of the proposed problem cannot be fully expressed analytically due to the fact that: (i) The value of the power coefficient depending on the pitch angle and tip speed ratio are not obtained using analytical expressions and (ii) the calculation of the wake effect involves the use of discrete and continuous variables making the problem non-derivable, preventing the use of classical analytical optimization techniques. As a result, the optimization problem has to be solved using a meta-heuristic technique. Therefore, this paper proposes a GA to undertake the task of optimization. GA are robust optimum search techniques that find the minimum or maximum of a function based on principles inspired by natural genetic and evolutionary mechanisms observed in nature [35,36].
The coding of the individual/potential solution, X, is done by means of a vector in which each element represents the pitch angle of each WT:
Thus, the optimization of the problem proposed in this paper can be formulated as follows:
where and are, respectively, the minimum and maximum pitch angles of the WT, is the rated power. It should be mentioned that the power coefficient depends on both the pitch angle and the tip speed ratio. However, as mentioned in the previous section in this work, it has been assumed that the tip speed ratio remains constant for the value that provides the maximum power coefficient, while the control variable to be optimised in this work is the pitch angle.
3.2. Flowchart of the Proposed Methodology
Figure 4 shows in a schematic way the flowchart of the proposed methodology. As can be seen, the input data required are composed of the layout of the WTs of the studied WF, the features of the WT model, including the power and thrust coefficient curves, and the wind data. All these data are used to evaluate the output power yielded by the WF when each WT has a certain operating configuration.
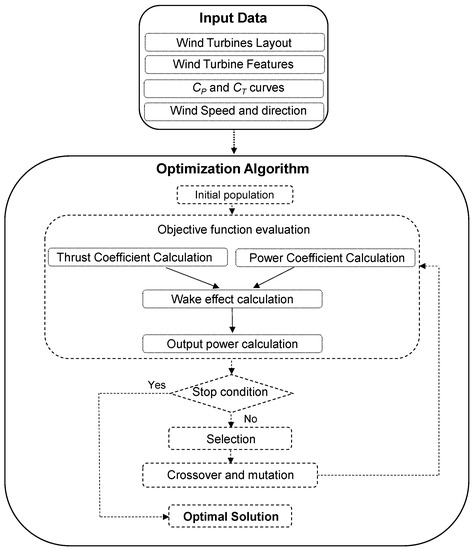
Figure 4.
Flowchart of the proposed methodology.
The optimal operating points are found using the optimization algorithm with the aim of maximizing the output power. These input data are provided to the GA that starts from an initial (randomly generated) population of individuals/potential solutions that is updated in successive generations by means of two kinds of operators: Crossover and mutation. Each of the individuals in the population is evaluated by means of the module for calculating the generated power detailed in the previous section. Next, the selection operator is then computed to determine the individuals that will be used in the crossover and mutation operators. The crossover operator is applied to two selected individuals to generate new potential solutions, with a mix of chromosomes (characteristics) from the parents. The mutation operator is applied to one individual to generate another by randomly changing one or more of the chromosomes. When the population is confined to a local maximum, this operator leads to the creation of individuals out of this zone of local attraction. In this way, the algorithm can evolve towards the global maximum. Finally, once the maximum number of generations is reached (convergence criterion considered in this work), the best solution obtained throughout the execution of the algorithm is considered as the optimal solution.
4. Results
This section proposes a set of test cases to show the capacity of the proposed optimisation tool. The analysis is proposed for a WF composed of 56 WTs, consisting of 7 rows separated from each other by 3 times the rotor diameter along the spanwise direction and 8 columns separated from each other by 6 times the rotor diameter along the streamwise direction. For the base test case, a wind speed of 9 m/s coming from west direction is assumed, with an ambient turbulence intensity of 8%. The WT model analysed is the NREL 5 MW reference turbine [32]. The rotor diameter is 126 m and power and thrust coefficient have been previously shown in Section 2. The optimisation process has been carried out using a population of the GA of 800 individuals, evolving over 100 generations with a crossover rate of 80% and a mutation rate of 20%. The algorithms have been developed in MATLAB and executed in PC Intel Xeon CPU E5-2630 v4 2.20 GHz with 32 GB RAM and 10 cores. The algorithm execution time to reach the optimal solution has been 3041 s.
Figure 5 shows the layout of the WF under analysis, as well as the optimal pitch configuration of each WT, in which the number in brackets indicates the pitch angle of each WT by means of the global optimization strategy proposed in this work. Note that the configuration of the classical approach consists of the individual maximization of the power generated by each turbine so that the pitch of each WT would be 0°, the value for which the maximum power coefficient is obtained.
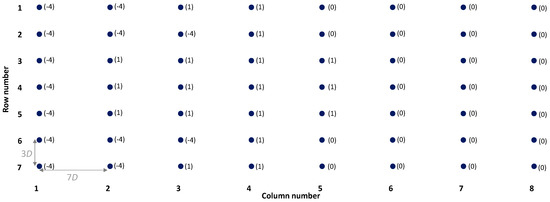
Figure 5.
Layout of the wind farm under study and pitch of each wind turbine (in brackets) obtained by means of the optimisation strategy proposed in this work.
Figure 6 shows a comparison of the results obtained by the classical pitching strategy operating at maximum power coefficient (markers in black) and by the optimized pitching strategy proposed in this paper (markers in red). As can be seen, the optimized strategy obtains less power generated for the first WT column (subject to free flow) than for the classical strategy operating at maximum power coefficient. This lower power produced by the optimized strategy in the first column is compensated by a higher output in the following columns (whose airflow is indeed disturbed by the effect of upstream wakes) compared to the classical strategy. The power produced in this situation by means of the solution obtained with the proposed algorithm is 106.92 MW, whereas with the classic setting it would be 95.96 MW, which represents an improvement of 11.42% obtained by means of the optimised solution proposed in this work. Finally, it should also be pointed out that, as the layout of the turbines is orthogonal and the wind direction is perpendicular to the columns, the solution obtained is symmetrical with respect to the central row (i.e., the fourth row), so that the resulting wind speed field is also symmetrical and, therefore, for the same column the power obtained by the turbine corresponding to rows 1 and 7 are identical. The same is true for rows 2 and 6, as well as 3 and 5, respectively.
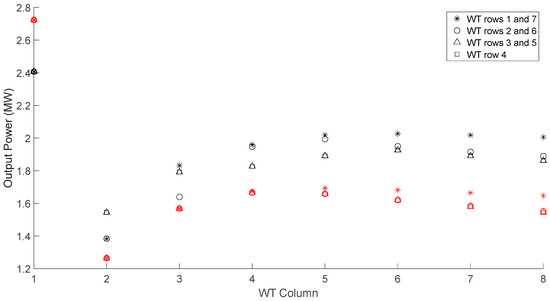
Figure 6.
Power generated by each wind turbine by means of the classic pitching strategy (markers in red) and the optimized pitching strategy proposed in this work (markers in black).
The dependence of the ambient and added turbulence intensity on the operation of the turbines can be seen in Figure 7. As can be observed, the first column of WTs is subjected to ambient turbulence, while the following columns are affected by the accumulated effect of ambient turbulence plus that added turbulence by the WTs located upstream. In the case of the optimised operating strategy, all the WTs in the first column operate with a negative pitch angle (pitch-to-stall) which, in addition to reducing the captured power, produces an increase in the added turbulence that is greater than that introduced by the operation with a pitch equal to zero (corresponding to the classic operating strategy). Similarly, in the second column the WTs corresponding to the first, second, sixth, and seventh rows also operate with a negative angle (β = −4°) in order to increase the added turbulence, while those in the third, fourth, and fifth rows operate with a positive angle of β = 1° (pitch-to-feather) closer to the point of maximum power coefficient. In the successive columns, from the third to the fifth column, most of the WTs operate with β = 1°, while in the last three columns, all the WTs operate with β = 0° maximising the power captured.
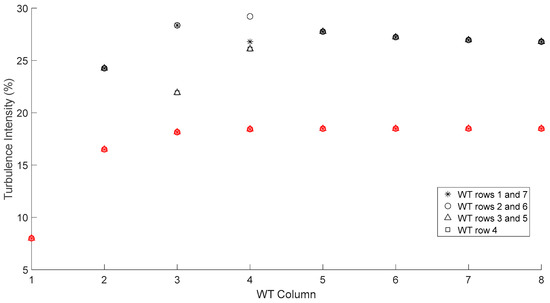
Figure 7.
Turbulence intensity in the inflow of each wind turbine using the classic pitching strategy (markers in red) and the optimised pitching strategy proposed in this paper (markers in black).
As can be seen in Figure 7, the added turbulence from the second column is significantly higher in the case of the optimised strategy. This has a positive effect on the recovery of wind speed along the wake, since as can be inferred from Equation (6), the growth rate of the wake, k*, is directly proportional to the turbulence intensity, which in turn influences lower speed deficits due to the wake effect, as can be deduced from Equations (1) and (3).
It should be noted that the proposed analysis has been repeated limiting the operation to the pitch-to-feather mode of operation for all the turbines so that the pitch angle can only take values greater than or equal to zero. In this situation, the proposed optimization algorithm does not obtain any improvement, as the optimized solution is the setting corresponding to the maximum power coefficient for all the WTs (i.e., all the WTs operating with β = 0°). However, it should also be noted that this strategy of setting the upstream turbines with a negative angle (in pitch-to-stall mode) in order to increase turbulence and favour the recovery of the wake to increase the production of the downstream WTs, so that the total production is higher than that of the classic approach, is fully in line with the study carried out by [17] for the case of two WTs.
Figure 8 shows the wind speed field resulting from the application of the proposed strategy while Figure 9 shows the wind speed field corresponding to the classical strategy (consisting of operating all the turbines at maximum power coefficient). As can be seen, with the optimised strategy, the wind speed for the turbines located downstream is higher than that corresponding to the case of operation at maximum CP. This is a consequence of the operation at derated power in the first WT columns at the same time as the pitch at which they are operated increases the turbulence, which favours the recovery of the wake and, consequently, allows greater production to be achieved by the WTs located downstream.
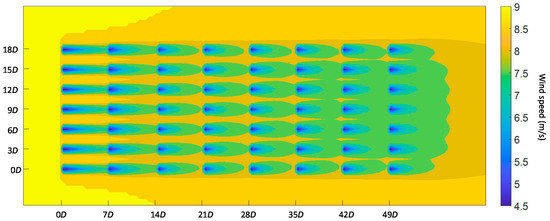
Figure 8.
Wind speed field corresponding to the optimal solution obtained by the proposed algorithm.
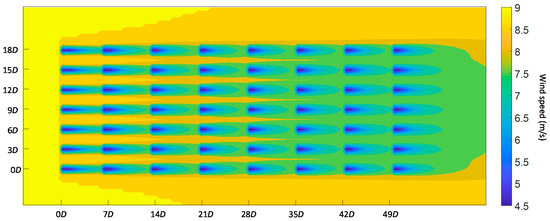
Figure 9.
Wind speed field corresponding to the classic operation strategy.
4.1. Sensitivity Analysis
In order to analyse the behaviour of the methodology proposed in this work, a sensitivity analysis has been carried out considering different assumptions. Firstly, the incoming free flow wind speed has been varied considering the remaining variables constant and equal to those defined in the base case (i.e., 8% turbulence intensity and west wind direction). Figure 10 shows the differences obtained by the proposed algorithm and the classical approach. As can be seen, the proposed strategy obtains greater energy production for the range of speeds between cut-in speed and 14 m/s, while for higher wind speeds the solution obtained by the proposed approach is the same as the classical approach, since for free-flow wind speeds above 14 m/s all WTs operate at rated power.
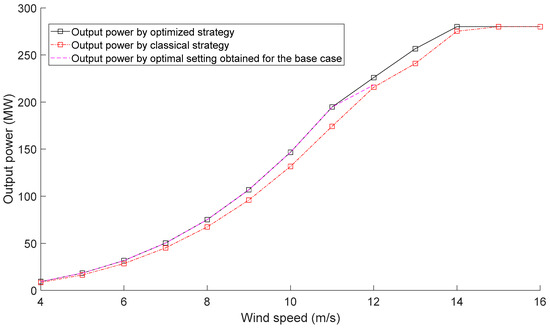
Figure 10.
Sensitivity analysis as a function of incoming wind speed.
For wind speeds between the cut-in speed and 11 m/s, the increase in power output follows a cubic relationship as a function of wind speed, with the higher the wind speed, the greater the increase in power output obtained by the proposed methodology. Likewise, the output power that would be obtained keeping constant the optimal setting obtained for the base case has also been plotted in Figure 10 (represented by the cyan line in the figure). As can be seen, for wind speeds equal to or lower than 11 m/s, the solution obtained for the base case is the same as the optimal solution obtained for each wind speed (in other words, the optimal setting remains constant for speeds equal to or lower than 11 m/s). For a speed of 12 m/s the configuration obtained for the base case would provide an output power similar to that of the classical approach, while for speeds above 12 m/s the base case solution would not be feasible, as some WTs would exceed the nominal operating conditions. On the other hand, for the speed range between 12–14 m/s, the increase in power generated as a function of wind speed no longer follows a cubic trend, mainly as a consequence of the operation of most WTs in transition zone, where the effect of turbulence on the power curve makes the power output lower than would correspond to the zero-turbulence power curve (as can be seen in Figure 2).
Figure 11 shows the results obtained by modifying the ambient turbulence intensity within the range of 6–12% while maintaining the rest of the variables equal to those defined in the base case (i.e., 9 m/s wind speed and west wind direction). The proposed algorithm also provides a higher power output during the whole range of turbulence intensities analysed, with the differences being greater as the turbulence intensities are lower. This is due to the fact that, for moderate turbulence intensities, the effect of the turbulence induced by the wakes operating with the proposed strategy is proportionally more relevant to the ambient turbulence, which allows a faster recovery of the wind speed along the wake. In this case, the sensitivity analysis has provided slightly different pitch angle settings for the WTs depending on the ambient turbulence intensity. However, in all cases, the first column of wind turbines is operated in pitch-to-stall mode with β = −4°. The greatest differences in pitch setting have been obtained mainly for the lower turbulence intensities, in which all the WTs in the second column are operated in pitch-to-feather mode with a pitch angle of β = 1° (as opposed to the setting obtained in the base case in which turbines 1, 2, 6, and 7 in the second row are operated in pitch-to-stall mode). Likewise, as it can be seen, the optimum configuration of the base case is relatively stable as the turbulence intensity is modified, obtaining an output power very similar to that obtained by the solution optimised for each turbulence intensity.
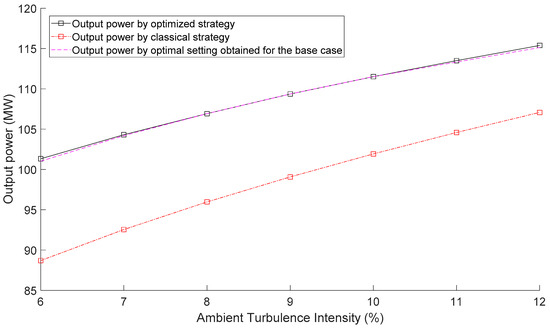
Figure 11.
Sensitivity analysis as a function of the ambient turbulence intensity.
Figure 12 shows the sensitivity analysis performed against the variation of the incoming wind direction angle (keeping the wind speed constant 9 m/s and the turbulence intensity constant 8%). In this analysis, the base case (where the angle of the incoming wind direction on the horizontal axis is 0°) has been initially considered and the angle has been increased up to a maximum value of 10° with respect to the horizontal axis (please note that as the WTs layout is symmetrical with respect to the horizontal axis, the analysis shown in the figure is equivalent for the case of negative angles of the incoming wind direction).
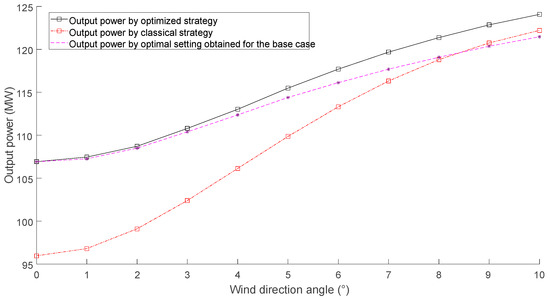
Figure 12.
Sensitivity analysis as a function of the incoming wind direction angle.
As can be seen, as the angle of the incoming wind direction increases, the lower the power increase obtained with the approach proposed in this work with respect to the classical approach. This is a consequence of the fact that as the angle increases, the rows of wind turbines are less aligned with the incoming wind direction, which reduces the effect of the global wake effect and, therefore, the potential gain of the approach proposed in this work. As can be seen, the optimal configuration changes depending on the angle of the wind direction. However, it is also important to note that the setting obtained for the base case (represented in the figure by the cyan line) outperforms the configuration of the classical approach within the range 0–8°, which shows a relatively stable behaviour of the optimal solution against moderate variations in the incoming wind direction.
The three sensitivity analyses shown above have focused on testing the performance of the proposed approach against the three variables that typically influence the varying wind conditions to which WTs are subjected: Wind speed, wind direction, and turbulence intensity. The analyses performed show that the proposed approach provides a solution that improves the performance of the classical approach configuration for several wind speed, direction, and turbulence conditions. However, it is also important to note that the solution obtained for the base case also presents a relatively stable behaviour (without resetting the pitch angle of each turbine) against variations in wind speed, turbulence intensity, and, to a lesser extent, wind direction. In particular, the solution obtained for the base case is very stable against variations in speed at operating conditions below the rated speed, as well as against changes in turbulence intensity. However, the solution obtained for the base case is less stable (although within acceptable levels) against variations in wind direction, outperforming the classical approach for changes in wind direction of less than 9°, while for larger variations in wind direction it would be necessary to reconfigure the wind turbines.
Finally, a sensitivity analysis has been carried out for the assumption of different layouts of the offshore WF, varying the distance between two consecutive columns of WTs, within the 4D–10D range and keeping the rest of the inputs the same as in the base case (wind speed 9 m/s, turbulence intensity 8% and west wind direction). In this sensitivity analysis, different optimal solutions for pitch setting have also been obtained depending on the distance between columns. Again, for all distances, the WTs in the first column are operated in pitch-to-stall mode. The greatest differences with respect to the optimum setting of the base case are obtained for the shorter distances between columns in which the optimum setting obtained is again mostly different in the setting of the second column, in which all the WTs are set to β = −4°, with the aim again of increasing the added turbulence and favouring the recovery of the wake.
As can be seen in Figure 13, the closer the WT columns are, the greater the increase in output power obtained by the optimized strategy. This is a consequence of a greater role of losses due to wake effect when the WTs are closer to each other, which allows the optimized strategy proposed in this paper to minimize overall losses by increasing turbulence through at derated power operation of the upstream WT columns. On the contrary, as the distance between the columns increases, the speed in the wake has a greater margin of recovery, so that the gain obtained by the proposed strategy as opposed to the classical approach is progressively reduced.
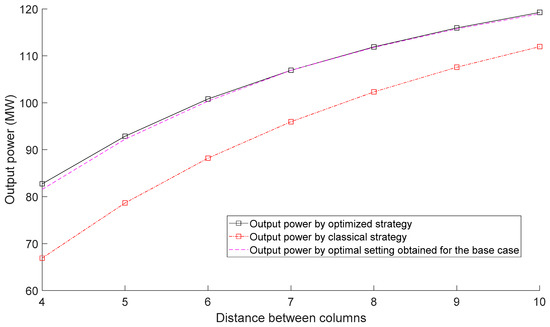
Figure 13.
Sensitivity analysis as a function of the distance between columns.
4.2. Performance Analysis of the Optimisation Algorithm
This section shows a behavioural analysis of the proposed optimisation algorithm. Genetic algorithms do not guarantee convergence to the global optimal solution, since they are founded on metaheuristic optimisation techniques based on the successive generation and evaluation of potential solutions that are generated by means of random search operators. Therefore, 10 runs of the genetic algorithm have been carried out (considering the base case) for different population sizes, starting from a minimum size of 50 individuals and successively doubling the population size until reaching 800 individuals. The results obtained in this sensitivity analysis are shown in Figure 14 by means of the black stars. As can be seen, for small population sizes, the dispersion in the fitness of the solution provided by the algorithm is high, while as the population increases this dispersion is smaller and more concentrated around the global optimum. It is important to note that, although for a population of 800 individuals the GA does not always converge to the same solution, all the solutions provided are very close to the global maximum and with differences in fitness of less than 0.1%.
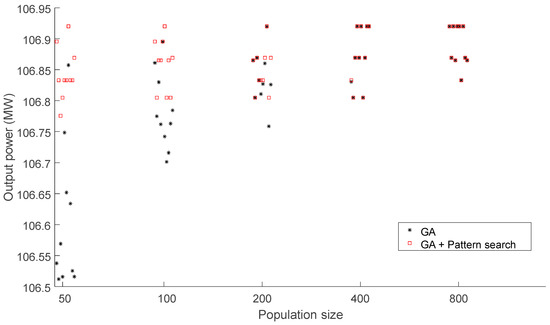
Figure 14.
Repeatability analysis of the optimisation algorithm depending on the population size.
Additionally, in order to improve performance of the algorithm, a sequential approach has also been implemented whereby the solution provided by the genetic algorithm is locally optimised by a Pattern search algorithm, that is, by iteratively modifying in small steps the value of each of the optimisation variables, βi, and moving (in each iteration) towards the solution with the highest power production. In the first iteration of this Pattern search routine, the incremental step size to perform the search is initially set to 1 and it is doubled or halved, respectively, in successive iterations depending on whether the objective function improves or not in the corresponding iteration. For the execution of this algorithm, a maximum of 100 iterations has been taken as the convergence criterion. The solutions provided by this hybrid approach are also shown in Figure 14 by the red squares. As can be seen, the hybrid approach achieves a considerable improvement over the solution obtained by the GA for small population sizes, while as the population size increases, the improvement obtained by the hybrid approach is gradually reduced until, for a population of 800 individuals, the Pattern search algorithm does not produce any additional improvement over the solutions provided by the GA. It is also worth mentioning that the Pattern search algorithm has also been run considering as initial solution the pitch angle configuration corresponding to the classical approach (i.e., all wind turbines with β = 0°). The solution provided by the Pattern search algorithm under this situation has a fitness of 105.05 MW for the base case, which is 1.7% less than the optimal solution provided by the GA but 9.5% higher than the classical approach. On the other hand, it is worth noting that the execution time is significantly lower, at 127 s (in contrast to 3041 s by the GA).
Finally, it should be noted that the results shown on the behaviour of the GA show that, even in the case of large populations, the optimisation algorithm does not always converge to the optimal solution, which is common when optimising highly complex problems that require the use of metaheuristic techniques. However, it is worth noting that the need to use large population sizes (with the consequent computational cost) is not a drawback when applying the proposed approach to a real wind farm. Although in a real situation with changing wind conditions the wind turbines must reconfigure their pitch angle in relatively short periods of time (and considerably shorter than the execution time of the optimisation algorithm), it is possible to pre-calculate and store the set of possible configurations depending on the wind conditions, which would speed up the pitch angle reconfiguration process without the need to run the optimisation algorithm online.
5. Conclusions
In this paper, a new approach to the problem of global pitch angle control to maximize energy capture has been presented considering the Gaussian wake model introduced by Bastankhah and Porté-Agel, and also considering the effect of added turbulence on the evolution of the wind speed in the wake.
In general terms, the proposed approach is based on a derated power operation strategy of upstream WTs, which has the potential for downstream WTs to increase their power capture and thus maximise the overall production of the WF.
Therefore, the proposed objective is to maximise, for a given incoming direction and wind speed, the total power generated by a WF as a function of the pitch angle of each of the WTs. To this end, GA has been implemented to efficiently solve the problem of finding the optimum solution.
The proposed approach has been tested through the analysis of a base case and introducing different variants that have allowed to demonstrate the capacity of the algorithms developed in this work compared to the classical approach in all the situations analysed. It is worth noting that the improvements obtained are greater the more compact the layout of the WF is, as well as the lesser the ambient turbulence and the higher the free flow wind speed.
It is also important to point out that the performed sensitivity analysis shows that the proposed algorithm provides solutions that overperform the classical approach for different conditions of wind speed, turbulence intensity, and wind direction. The tests carried out have also shown that the solutions obtained for analysed operating conditions present good stability under changing conditions of wind speed and turbulence, as well as under moderate variations in wind direction.
On the other hand, the results obtained show that one of the fundamental aspects is the consideration of the added turbulence and its effect on the recovery of wind speed along the wake. In particular, the results obtained are based on the operation of the first upstream turbines in pitch-to-stall mode which (in addition to derating the power captured by these turbines) increases the added turbulence, which has a positive effect on wind speed recovery in the wake. In this way, the turbines located downstream increase their production, maximising the total power yield for the wind farm. This pitching strategy based on operating the upstream wind turbines in pitch-to-stall mode is in line with the results obtained from other previous work and, in particular, the analysis carried out by Dilip and Porté-Agel through a case study on the operation of a WF comprising two wind turbines.
Finally, it is worth mentioning that the work carried out may be of interest to operators of wind projects progressing in the development of new strategies to maximise the energy produced, as well as to other researchers who may advance in other aspects such as the introduction into the optimisation model of other operating variables like the tip speed ratio or the yaw angle or the development of new strategies that combine the maximization of energy capture with the minimization of fatigue loads.
Author Contributions
Conceptualization, J.S.G.; methodology, J.S.G. and B.L.; formal analysis, J.S.G. and M.D.; investigation, J.S.G. and B.L.; writing—original draft preparation J.S.G. and M.D. All authors have read and agreed to the published version of the manuscript.
Funding
This research was co-funded by the CERVERA research programme of CDTI, the Industrial and Technological Development Centre of Spain, under the research Project HySGrid+ (CER-20191019), as well as by CYTED Programme by the MICRO-EOLO network (Red 718RT0564).
Institutional Review Board Statement
Not applicable.
Informed Consent Statement
Not applicable.
Data Availability Statement
Not applicable.
Conflicts of Interest
The authors declare that they have no know competing financial interests or personal relationships that could have appeared to influence the work reported in this paper.
References
- Global Offshore Wind Report 2020; Global Wind Energy Council: Brussels, Belgium, 2020.
- Hofmann, M. A Review of Decision Support Models for Offshore Wind Farms with an Emphasis on Operation and Maintenance Strategies. Wind Eng. 2011, 35, 1–15. [Google Scholar] [CrossRef]
- Poulsen, T.; Hasager, C.B.; Jensen, C.M. The Role of Logistics in Practical Levelized Cost of Energy Reduction Implementation and Government Sponsored Cost Reduction Studies: Day and Night in Offshore Wind Operations and Maintenance Logistics. Energies 2017, 10, 464. [Google Scholar] [CrossRef]
- Martin, R.; Lazakis, I.; Barbouchi, S.; Johanning, L. Sensitivity Analysis of Offshore Wind Farm Operation and Maintenance Cost and Availability. Renew. Energy 2016, 85, 1226–1236. [Google Scholar] [CrossRef]
- Kucuksari, S.; Erdogan, N.; Cali, U. Impact of Electrical Topology, Capacity Factor and Line Length on Economic Performance of Offshore Wind Investments. Energies 2019, 12, 3191. [Google Scholar] [CrossRef]
- Perveen, R.; Kishor, N.; Mohanty, S.R. Off-Shore Wind Farm Development: Present Status and Challenges. Renew. Sustain. Energy Rev. 2014, 29, 780–792. [Google Scholar] [CrossRef]
- Liang, J.; Jing, T.; Gomis-Bellmunt, O.; Ekanayake, J.; Jenkins, N. Operation and Control of Multiterminal HVDC Transmission for Offshore Wind Farms. IEEE Trans. Power Deliv. 2011, 26, 2596–2604. [Google Scholar] [CrossRef]
- Gomis-Bellmunt, O.; Junyent-Ferré, A.; Sumper, A.; Galceran-Arellano, S. Maximum Generation Power Evaluation of Variable Frequency Offshore Wind Farms When Connected to a Single Power Converter. Appl. Energy 2010, 87, 3103–3109. [Google Scholar] [CrossRef]
- Corten, G.P.; Schaak, P.; Bot, E. More Power and Less Loads in Wind Farms: ‘Heat and Flux’. In Proceedings of the European wind energy conference & exhibition, London, UK, 22–25 November 2004. [Google Scholar]
- Madjidian, D.; Rantzer, A. A Stationary Turbine Interaction Model for Control of Wind Farms. Ifac Proc. Vol. 2011, 44, 4921–4926. [Google Scholar] [CrossRef]
- Lee, J.; Son, E.; Hwang, B.; Lee, S. Blade Pitch Angle Control for Aerodynamic Performance Optimization of a Wind Farm. Renew. Energy 2013, 54, 124–130. [Google Scholar] [CrossRef]
- Serrano González, J.; Burgos Payán, M.; Riquelme Santos, J.; González Rodríguez, T.G. Maximizing the Overall Production of Wind Farms by Setting the Individual Operating Point of Wind Turbines. Renew. Energy 2015, 80. [Google Scholar] [CrossRef]
- Katic, I.; Højstrup, J.; Jensen, N.O. A Simple Model for Cluster Efficiency. In Proceedings of the European Wind Energy Association Conference and Exhibition, Thessaloniki, Greece, 10–14 October 1986; pp. 407–410. [Google Scholar]
- Hou, P.; Hu, W.; Zhang, B.; Soltani, M.; Chen, C.; Chen, Z. Optimised Power Dispatch Strategy for Offshore Wind Farms. Iet Renew. Power Gener. 2016, 10, 399–409. [Google Scholar] [CrossRef]
- Zhang, B.; Soltani, M.; Hu, W.; Hou, P.; Huang, Q.; Chen, Z. Optimized Power Dispatch in Wind Farms for Power Maximizing Considering Fatigue Loads. IEEE Trans. Sustain. Energy 2018, 9, 862–871. [Google Scholar] [CrossRef]
- Tian, J.; Zhou, D.; Su, C.; Blaabjerg, F.; Chen, Z. Optimal Control to Increase Energy Production of Wind Farm Considering Wake Effect and Lifetime Estimation. Appl. Sci. 2017, 7, 65. [Google Scholar] [CrossRef]
- Dilip, D.; Porté-Agel, F. Wind Turbine Wake Mitigation through Blade Pitch Offset. Energies 2017, 10, 757. [Google Scholar] [CrossRef]
- Deljouyi, N.; Nobakhti, A.; Abdolahi, A. Wind Farm Power Output Optimization Using Cooperative Control Methods. Wind Energy 2020, in press. [Google Scholar] [CrossRef]
- Ahmad, T.; Basit, A.; Anwar, J.; Coupiac, O.; Kazemtabrizi, B.; Matthews, P.C. Fast Processing Intelligent Wind Farm Controller for Production Maximisation. Energies 2019, 12, 544. [Google Scholar] [CrossRef]
- Bastankhah, M.; Porté-Agel, F. A New Analytical Model for Wind-Turbine Wakes. Renew. Energy 2014, 70, 116–123. [Google Scholar] [CrossRef]
- Bastankhah, M.; Porté-Agel, F. Experimental and Theoretical Study of Wind Turbine Wakes in Yawed Conditions. J. Fluid Mech. 2016, 806, 506–541. [Google Scholar] [CrossRef]
- Archer, C.L.; Vasel-Be-Hagh, A.; Yan, C.; Wu, S.; Pan, Y.; Brodie, J.F.; Maguire, A.E. Review and Evaluation of Wake Loss Models for Wind Energy Applications. Appl. Energy 2018, 226, 1187–1207. [Google Scholar] [CrossRef]
- Doubrawa, P.; Quon, E.W.; Martinez-Tossas, L.A.; Shaler, K.; Debnath, M.; Hamilton, N.; Herges, T.G.; Maniaci, D.; Kelley, C.L.; Hsieh, A.S.; et al. Multimodel Validation of Single Wakes in Neutral and Stratified Atmospheric Conditions. Wind Energy 2020, 23, 2027–2055. [Google Scholar] [CrossRef]
- Carbajo Fuertes, F.; Markfort, C.D.; Porté-Agel, F. Wind Turbine Wake Characterization with Nacelle-Mounted Wind Lidars for Analytical Wake Model Validation. Remote Sens. 2018, 10, 668. [Google Scholar] [CrossRef]
- Niayifar, A.; Porté-Agel, F. Analytical Modeling of Wind Farms: A New Approach for Power Prediction. Energies 2016, 9, 741. [Google Scholar] [CrossRef]
- Frandsen, S.; Barthelmie, R.; Pryor, S.; Rathmann, O.; Larsen, S.; Højstrup, J.; Thøgersen, M. Analytical Modelling of Wind Speed Deficit in Large Offshore Wind Farms. Wind Energy Int. J. Progress Appl. Wind Power Convers. Technol. 2006, 9, 39–53. [Google Scholar] [CrossRef]
- Voutsinas, S.; Rados, K.; Zervos, A. On the Analysis of Wake Effects in Wind Parks. Wind Eng. 1990, 14, 204–219. [Google Scholar]
- Bay, C.J.; King, J.; Martìnez-Tossas, L.A.; Mudafort, R.; Hulsman, P.; Kühn, M.; Fleming, P. Toward Flow Control: An Assessment of the Curled Wake Model in the FLORIS Framework. In Journal of Physics: Conference Series; IOP Publishing: Bristol, UK, 2020; Volume 1618, p. 022033. [Google Scholar]
- Brugger, P.; Debnath, M.; Scholbrock, A.; Fleming, P.; Moriarty, P.; Simley, E.; Jager, D.; Roadman, J.; Murphy, M.; Zong, H.; et al. Lidar Measurements of Yawed-Wind-Turbine Wakes: Characterization and Validation of Analytical Models. Wind Energy Sci. 2020, 5, 1253–1272. [Google Scholar] [CrossRef]
- Campagnolo, F.; Molder, A.; Schreiber, J.; Bottasso, C.L. Comparison of Analytical Wake Models with Wind Tunnel Data. In Journal of Physics: Conference Series; IOP Publishing: Bristol, UK, 2019; Volume 1256, p. 012006. [Google Scholar] [CrossRef]
- Crespo, A.; Herna, J. Turbulence Characteristics in Wind-Turbine Wakes. J. Wind Eng. Ind. Aerodyn. 1996, 61, 71–85. [Google Scholar] [CrossRef]
- Jonkman, J.; Butterfield, S.; Musial, W.; Scott, G. Definition of a 5-MW Reference Wind Turbine for Offshore System Development; 2009; p. NREL/TP-500-38060, 947422. Available online: https://www.nrel.gov/docs/fy09osti/38060.pdf (accessed on 5 December 2020).
- Hedevang, E. Wind Turbine Power Curves Incorporating Turbulence Intensity. Wind Energy 2014, 17, 173–195. [Google Scholar] [CrossRef]
- Gottschall, J.; Peinke, J. How to Improve the Estimation of Power Curves for Wind Turbines. Environ. Res. Lett. 2008, 3, 015005. [Google Scholar] [CrossRef]
- Yang, X.-S. Nature-Inspired Metaheuristic Algorithms; Luniver Press: Beckington, UK, 2010; ISBN 978-1-905986-28-6. [Google Scholar]
- Holland, J.H.; Goldberg, D.E. Genetic Algorithms in Search, Optimization and Machine Learning; Addison-Wesley: Reading, MA, USA, 1989. [Google Scholar]
Publisher’s Note: MDPI stays neutral with regard to jurisdictional claims in published maps and institutional affiliations. |
© 2021 by the authors. Licensee MDPI, Basel, Switzerland. This article is an open access article distributed under the terms and conditions of the Creative Commons Attribution (CC BY) license (http://creativecommons.org/licenses/by/4.0/).