Article

The Simultaneous Impacts of Seasonal Weather and Solar Conditions on PV Panels Electrical Characteristics

1
Department of Electrical Engineering, K. N. Toosi University of Technology, Tehran 1969764499, Iran
2
Department of Electrical Engineering, Golpayegan University of Technology, Golpayegan 87717-65651, Iran
3
School of Technology and Innovations, University of Vaasa, 65200 Vaasa, Finland
*
Author to whom correspondence should be addressed.
Energies 2021, 14(4), 845; https://doi.org/10.3390/en14040845
Submission received: 27 December 2020 / Revised: 31 January 2021 / Accepted: 2 February 2021 / Published: 5 February 2021
(This article belongs to the Section F: Electrical Engineering)

Abstract

:
Solar energy usage is thriving day by day. These solar panels are installed to absorb solar energy and produce electrical energy. As a result, the efficiency of solar panels depends on different environmental factors, namely, air temperature, dust (aerosols and accumulated dust), and solar incidence, and photovoltaic panel angles. The effects of real conditions factors on power and efficiency of photovoltaic panels are studied in this paper through testing the panel in real environmental tests. To study the mentioned parameters precisely, two panels with different angles are used. The case study is regarding a region of Tehran, Iran, in summer and winter seasons. The results show that panel efficiency during winter is higher than summer due to air temperature decrement. It is discovered that among air pollutants, Al and Fe have the most share in polluting the air that affect the photovoltaic efficiency. Moreover, measuring the accumulated dust on the panels shows more amount in winter in comparison with summer. The important point in studying the effect of tilt angle is that inconformity between solar incidence and photovoltaic panel angles would result in solar radiation absorption and eventually panel efficiency loss and also, photovoltaic panel installation angle would affect the amount of dust deposited on its surface.

1. Introduction

Recently, the need for utilizing distributed generation (DG) resources and renewable energies to reduce the irreparable damage due to consumption of fossil fuels as well as tendency towards reducing power generation costs, increasing reliability, power quality, and reducing losses is more than ever [1,2]. Photovoltaic (PV) panel is a type of DG that is capable of absorbing solar radiation and producing electricity.
The main elements of PV panel are semi-conductors. Essential features of semi-conductor substances limit the functionality of PV systems, but proper designing of installation and starting up of these systems to absorb the most solar radiation can result in improvement of its functionality. Since PV panels are placed outdoor, different environmental factors, including dust, bird excreta, moisture, precipitation, wind velocity, and solar radiation and air temperature, can affect the performance of PV systems.

1.1. Literature Review

In [3], the variations in the performance of different solar cell technologies related to the temperature in Amman, Jordan, are evaluated. Three PV systems (poly-crystalline, mono-crystalline and thin-film) of identical design parameters were collected. It was found that the thin-film solar panels are less affected by temperature. These results can be implemented in the preliminary design steps, specifically in the selection of the solar cell technology to be installed in a specific location.
Six different PV technologies performance installed at eight different sites in Brazil are evaluated in [4] through the calculation of the performance ratios for measured data for each PV technology. All the PVs were installed at a fixed-tilt. Among all technologies, the performance of Thin-film technology with the low temperature coefficient was excellent. [5] provides a regionally focused review of work conducted in the Middle East and North Africa region related to the effects of dust accumulation and ambient temperature on PV performance. It proposes models to simulate these effects, and suggests a financial method to determine cleaning frequency for a case study in Jordan. The optimal cleaning frequency is calculated to be 12–15 days depending on the model and length of exposure time adopted in the analysis.
The objective of [6] is measuring of soils and the effect on the PV performances of grid connected PV system during six months at Green. This facility is located in Morocco and with semi-arid climate. Chemical analysis has been conducted about aerosols origin emission source. In [7], the effect of dust accumulation on the PV power generation is investigated. That study has proposed shielding effect, temperature effect and corrosion effect. A brief summarize of studies about accumulated dust on PV panels of urban and desert areas and the effects of accumulated dust and particles is presented in [8].
In [9], temperature coefficient of different types of commercially available solar modules is evaluated. The testing has been carried out at PV test facility of Solar Energy Centre, New Delhi. The modules are selected randomly from various manufactures. It is found that the average temperature coefficients for mono-crystalline, multi-crystalline, amorphous silicon and CdTe based modules are −0.446 %/°C, −0.387 %/°C, −0.234 %/°C, and −0.172 %/°C, respectively. This study shows that the temperature coefficient for mono crystalline silicon module is higher than the other types of solar modules.
In [10], the effect of dust on PV panels is developed. It is found that the loss of power and PV efficiency in monocrystalline module is more compared to the polycrystalline module. Crystalline silicon PV modules are located under hot dry weather conditions in Algeria based on [11]. The analysis of PV modules in a remote located solar installation results in several failures and degradation modes.
The effect of natural dust and the effects of environmental parameters on PV performance are investigated in [12]. It is found that the most accurate correlation is a polynomial from seventh to cubic degrees. An experimental investigation in Surabaya, Indonesia, on the effect of these factors on output PV power reduction from the surface of a PV module is considered in Ref. [13]. The module was exposed to outside weather conditions and connected to a measurement system developed using a rule-based model to identify different environmental conditions. That study reveals that local environmental conditions, i.e., dust, rain, and partial cloud, significantly reduce PV power output. In [14], the efficiency of a multi-crystalline PV array installed in Greece is evaluated. TO determine the quantify of PV performance, measurements were done in two seasons. The experiment was shown the efficiency of PV panel in outdoor conditions is 18% lower than STC. The measured climate conditions are representative of the majority of Mediterranean regions.
Investigation of the effect of dust accumulation on PV under outdoor conditions is developed in [15] to output performance. In that study, climate conditions are very important and the results are presented, accordingly. In [16], the effect of dust density on PV and PV-thermal systems is done. All layers of a monocrystalline silicon module for both systems are considered. The objective of [17] is to investigate the reduction of PV panel characteristics due to accumulation of sand dust and sandstorm in the Saharan area of southern Algeria. That study reveals that leaving PV modules without any cleaning in the Saharan environmental conditions significantly reduces PV power output.
The results of [18] suggest that the chimney is greatly affected by dust deposition and consequently, the performance of PV panels is affected. The aim of [19] is to study the effects of environmental parameters on a PV system. Further, the performance of pure water and Al2O3-water Nano fluid are compared. The finding indicates the heat transfer coefficient and the efficiency of Al2O3-water Nano fluid are greater than pure water. The Nano fluid behavior through a water Photovoltaic Thermal (PV/T) system was numerically simulated and compared with pure water. The represented PV/T model is composed of a glazing section, a PV panel, a sheet and tube collector with five identical riser tubes.
The objective of [20] is to simulate the heat transfer model in each layer of PV panel coupling with the fluid flow model in detail using three-dimensional FEM based Comsol Multyphysics software. This study was investigated the high radiation effect on PV temperature and evaluated the PVT outcomes in terms of power and energy.
In [21], the effect of dust accumulation on the performance of crystalline PV modules is investigated experimentally under outdoor conditions in a Saharan environment, Ouargla, Algeria. The power generation of a 30 MW PV power plant during and after a sandstorm is evaluated. The power ratings of a concentrating PV mono crystalline module are determined in [22] using different methods and filtering criteria that account for the spectrum. In Baghdad city, the effects of atmospheric materials are investigated, separately [23]. The results of the study show that the accumulation of industrial gypsum of more than 25 g/m2 causes to reduce power output significantly. Furthermore, three methods including cleaning the PV daily in the evening, covering the PV with plastic during the night, and turning the PV in the evening to face the ground to prevent dew water of the building materials and dust accumulation. Ref. [24] outlines the features of a low-cost acquisition device to characterize a PV module under real operating conditions. In that study, the effects of operating temperature and solar radiation are investigated.
Moreover, ref. [25] investigates the aesthetic and technological integration of hidden colored PV modules in architecturally sensitive areas that seem to be the best possibility to favor a balance between conservation and energy issues. A multidisciplinary methodology for evaluating the aesthetic and technical integration of PV systems in architecturally sensitive areas is proposed. The experimental characterization of the technical performance specific BIPV modules and their comparison with standard modules under standard weather condition are analyzed. The paper describes the analyses carried out to define the final configuration of these experimental testbeds.

1.2. Contributions

According to the literature, it is shown that several studies are conducted about the effects of real weather conditions in different countries which some of the factors like the effect of PV panel angle on dust accumulation and absorption of solar radiation, air particles, etc. are not taken into account. However, because of high potential of solar radiation in Iran, it is necessary to study the effective parameters on PV panel efficiency in Tehran which is one of the biggest energy consumers (Population in 2019 is 13 million, Average daily solar radiation energy is 4.5 KWh/m2).
The goal of this study is to investigate the impact of different factors including air temperature, dust (aerosols and accumulated dust), solar incidence angle, and panel installation angle on efficiency and output power of PV panel through testing the panel in the real environment. The novelties on this paper are listed below:
  • Investigating panel installation angle and season changes effects on dust amount deposited on panel’s surface and accurate analysis and idntification of the elements of deposited dust and suspended particles in the air.
  • Investigating the effective parameters including air temperature, dust, solar incidence, and panel installation angle on PV panel efficiency in two seasons in Iran for the first time.
In Section 2 the experiment method and measuring devices specification are described. Theoretical analyzes and problem formulation are described in Section 3. In Section 4 the results of the experiment are analyzed. The conclusion is finally presented in Section 5.

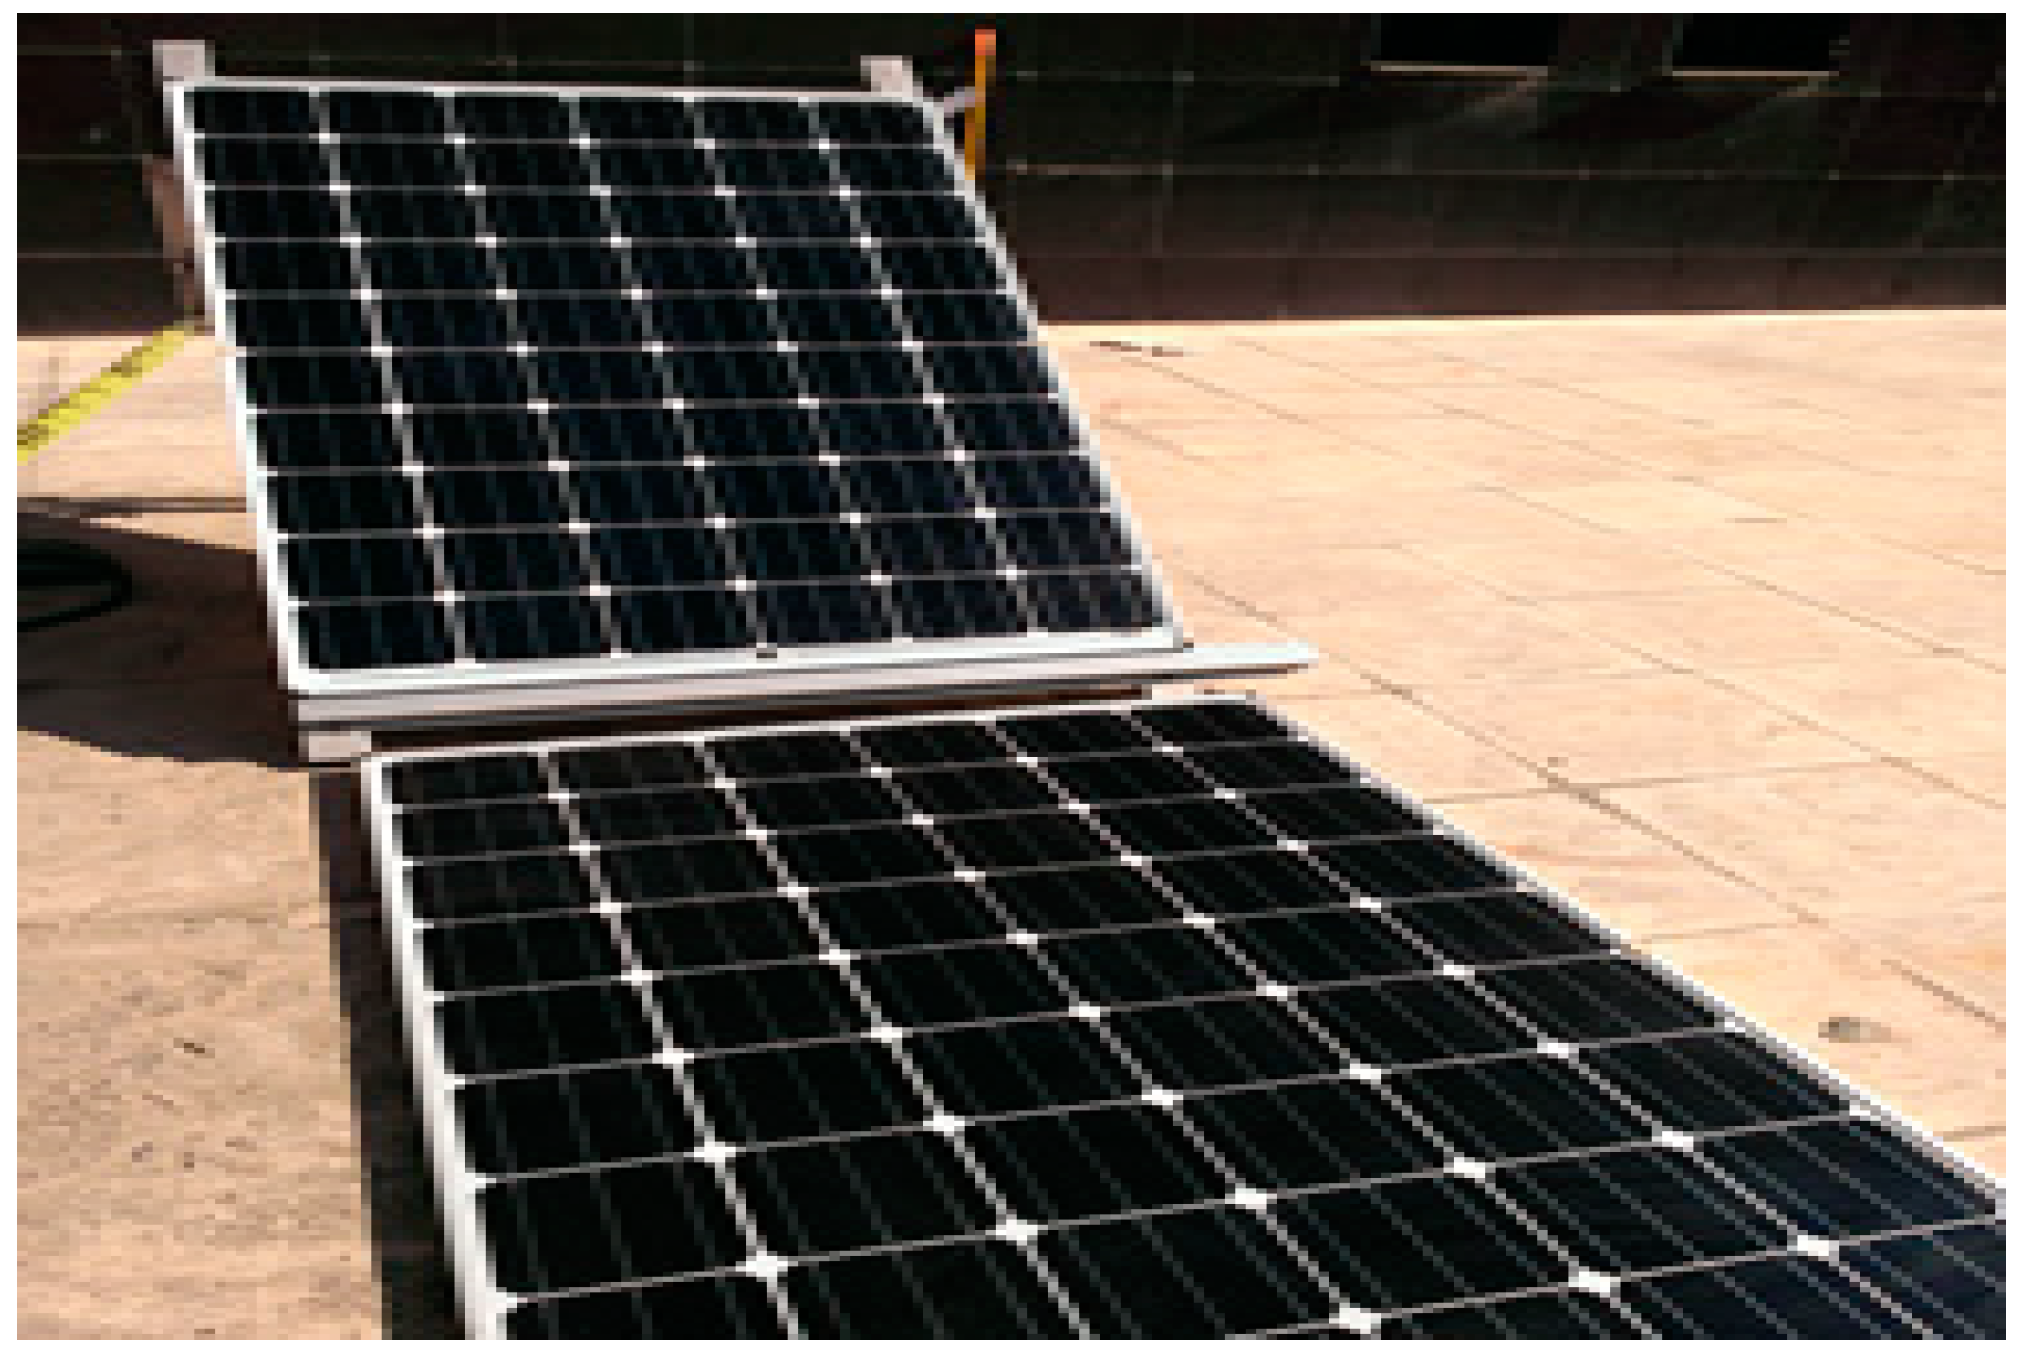
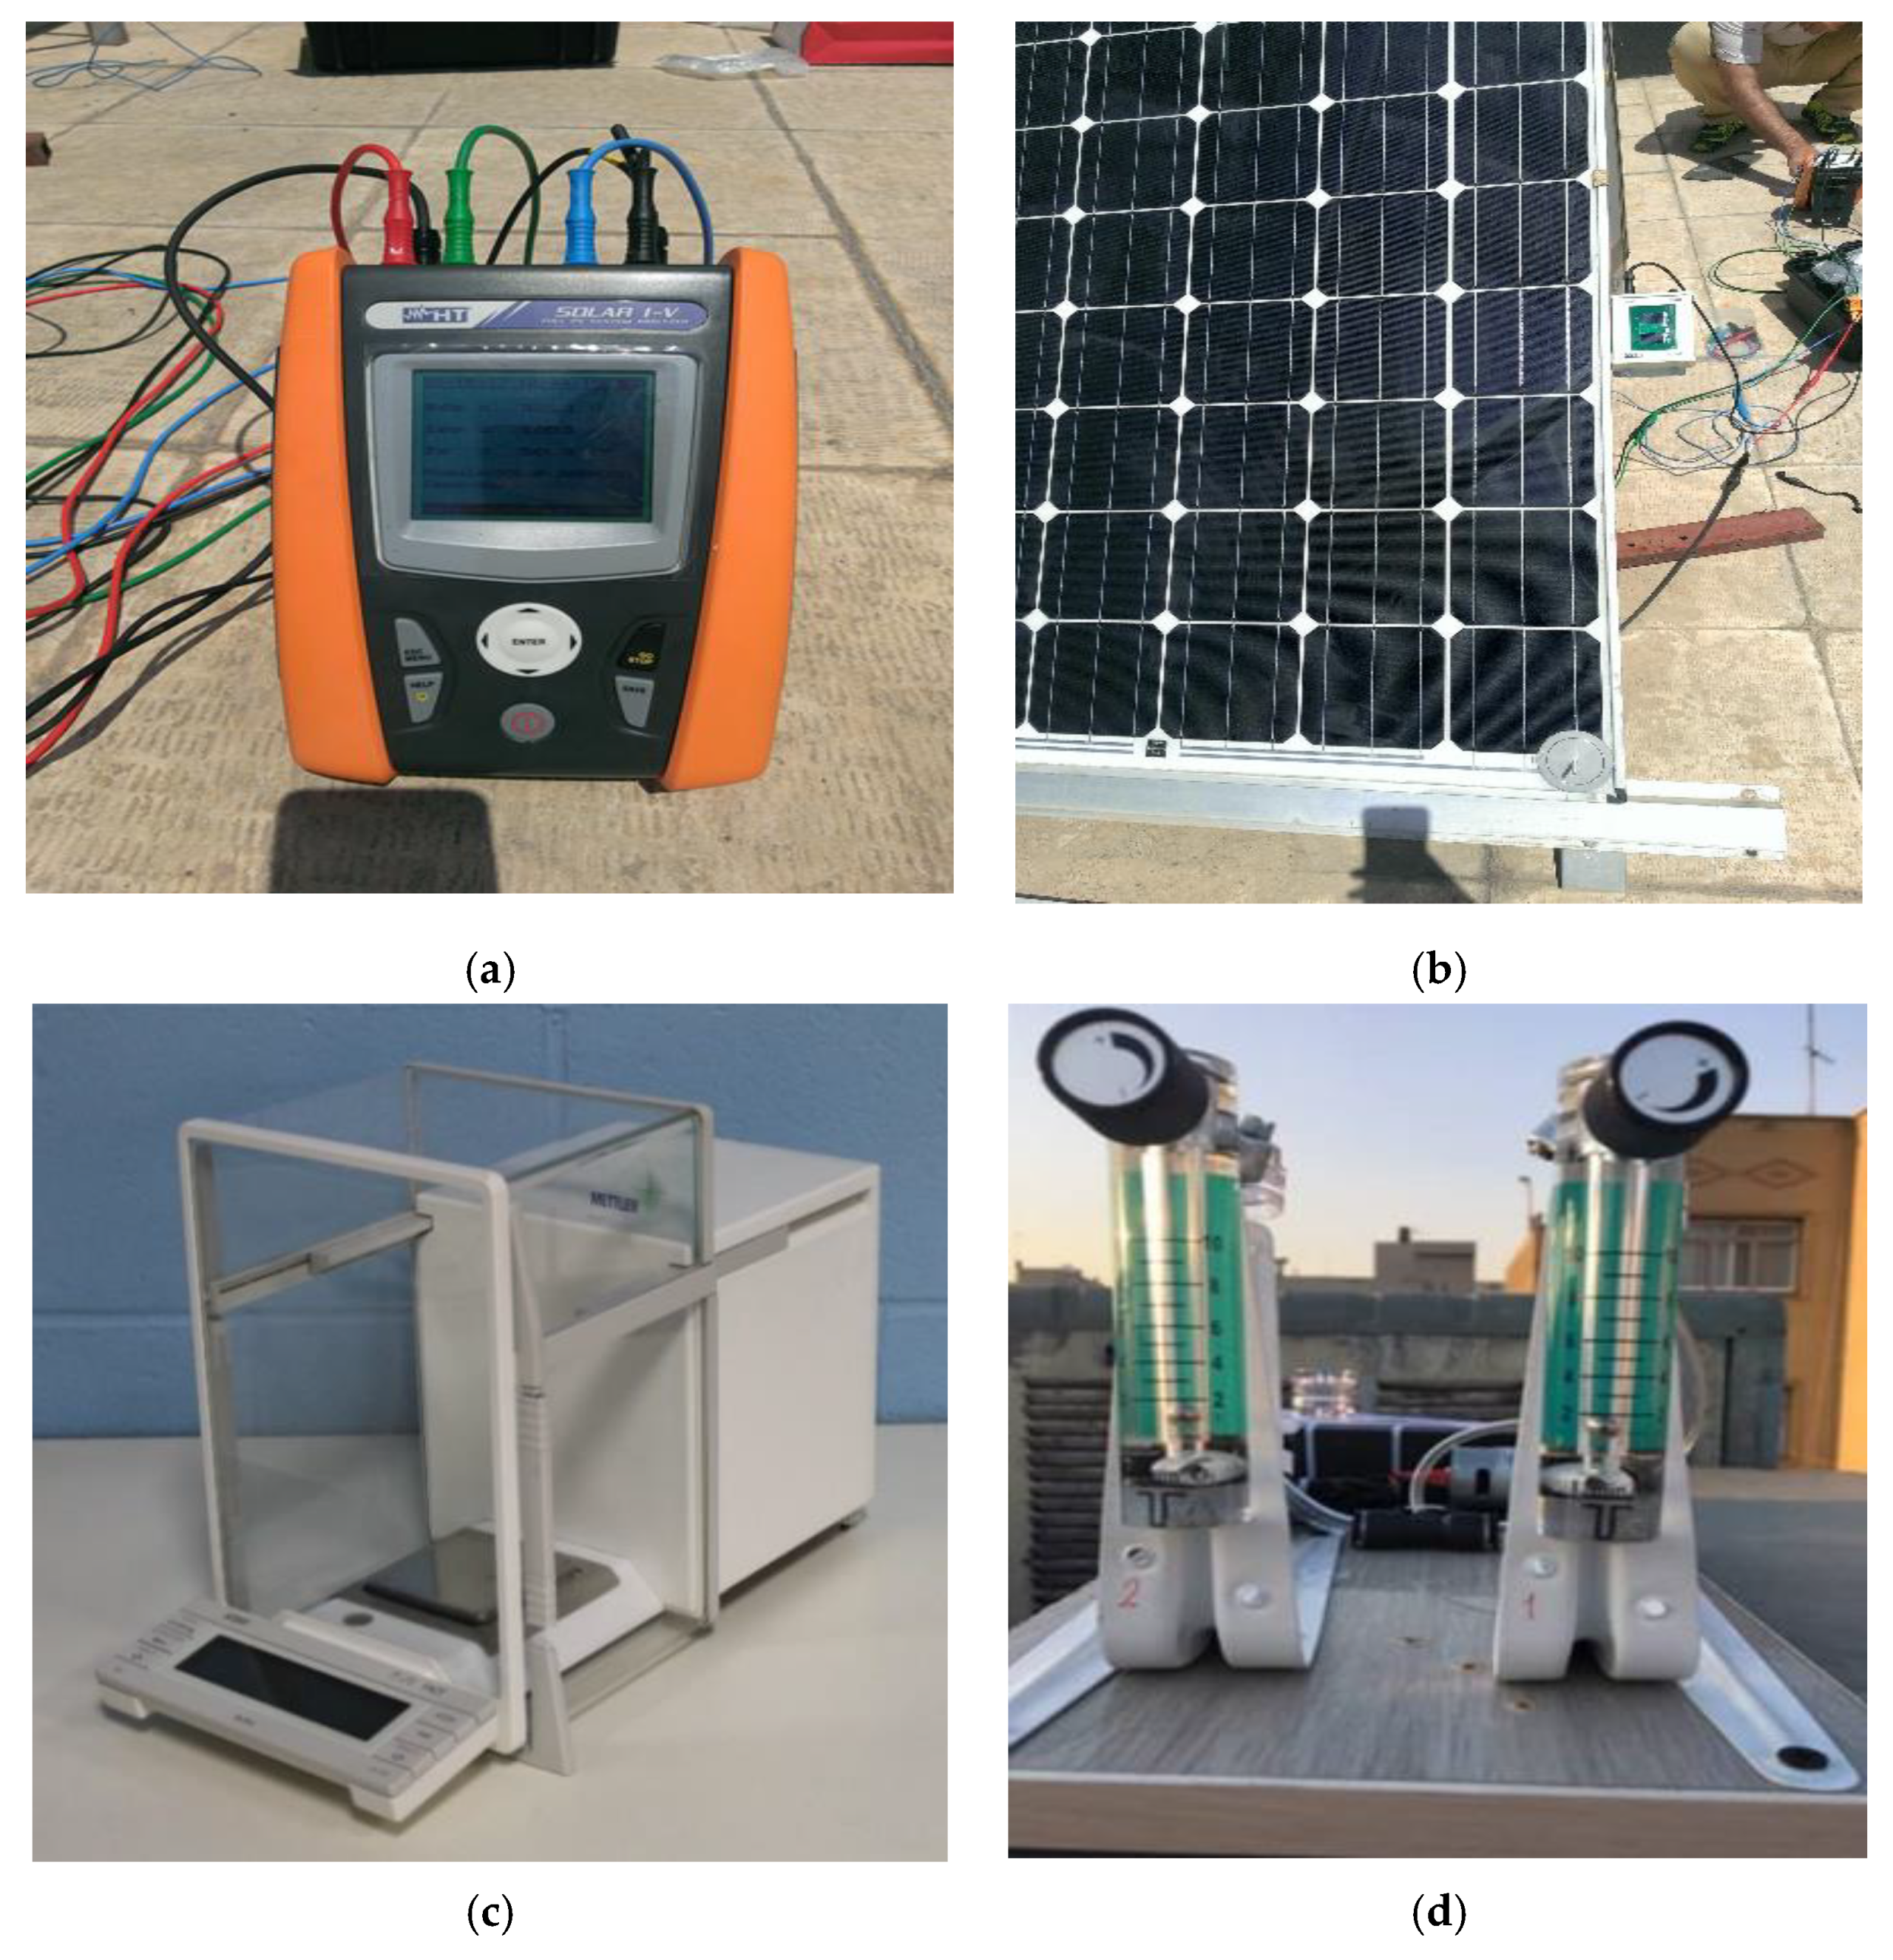
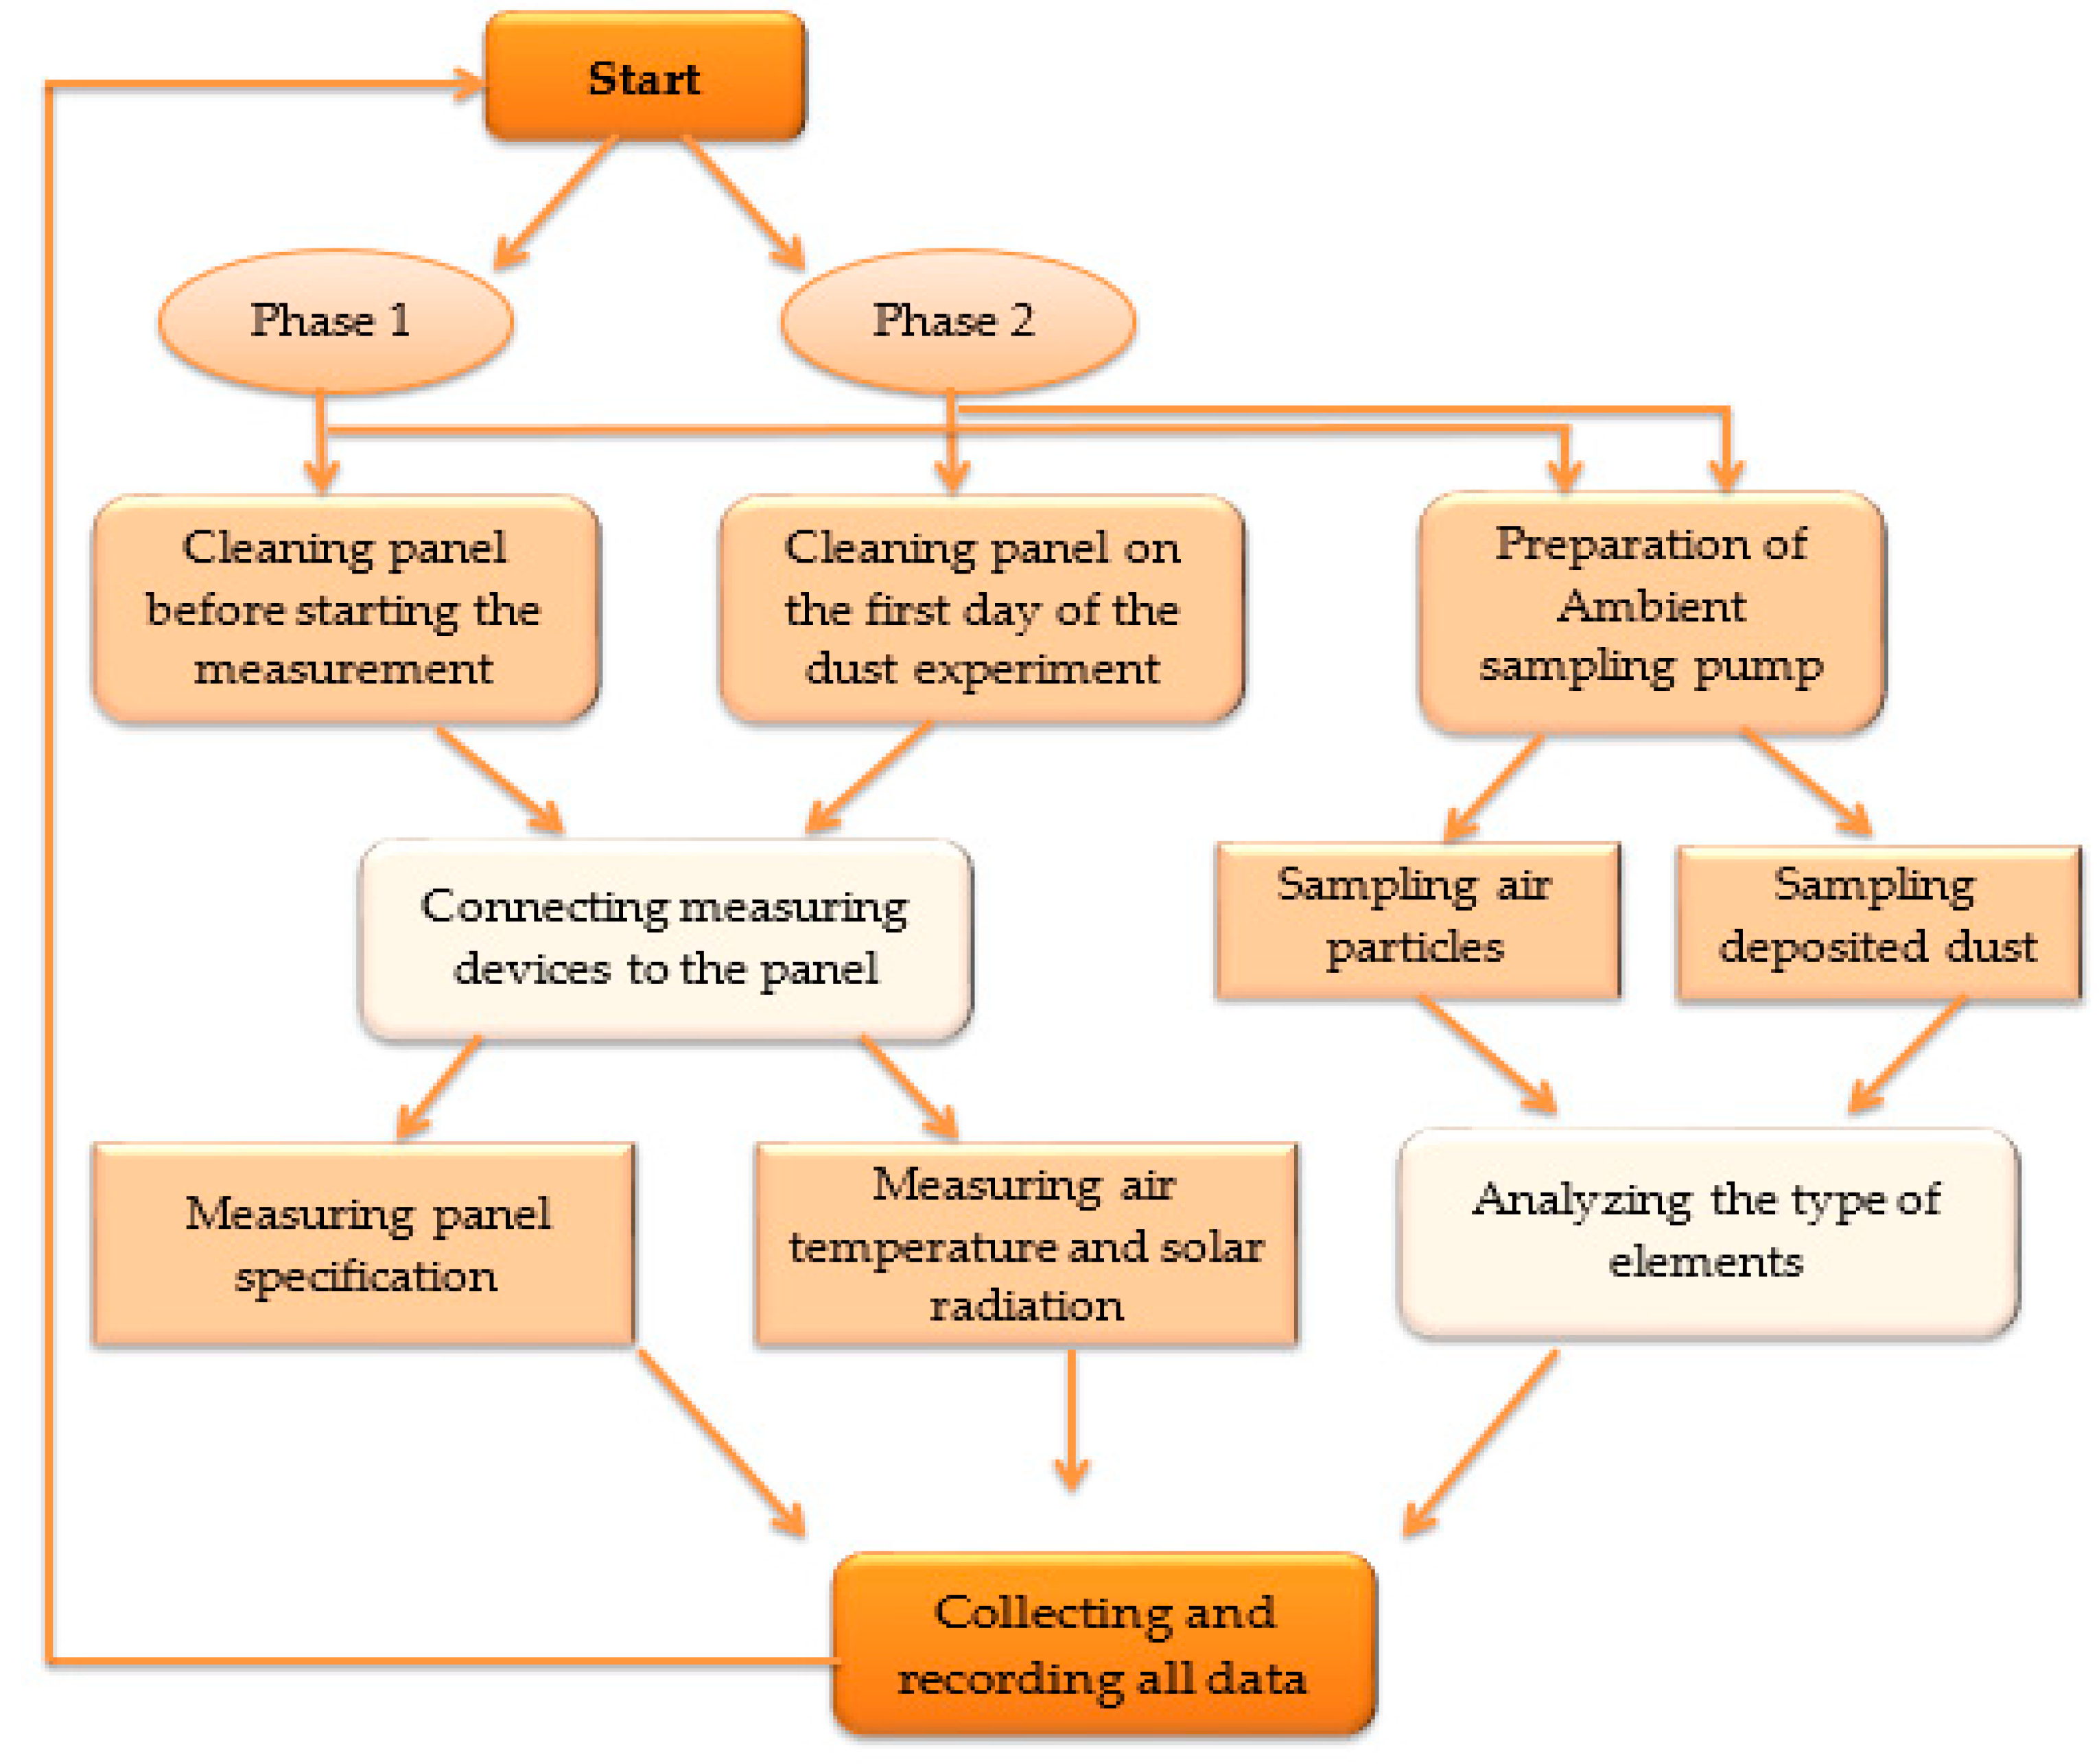
2. Description of Experiment

This study concentrates on the impact of air temperature, dust, solar incidence angle, and panel installation angle in Tehran, Iran. Air pollution in Tehran which is created by consumption of fossil fuels by industrial units and transportation system on one hand and appropriate climate (sufficient solar radiation, various air temperature, and wind flow) on the other hand, makes it suitable for authors to investigate and experiment effective parameters on PV panel efficiency according to the aim of the article.
In this study, to analyze the effect of each parameter, an experiment on two samples of mono-silicon panels is performed (one in horizontal and the other with 35° angle considering the latitude of the region) in the real environment. Figure 1 shows the arrangement of panels. The experiment is conducted in Tehran, Iran, with 51°: 21′ east longitude and 35°: 46′ north latitude. In order to study the impact of air temperature and dust on PV panels more precisely, the experiments are performed in both summer and winter season:
  • In summer, from 22 June to 22 September 2019 (Two months for radiation and air temperature sampling, one month for air particles, and dust sampling).
  • In winter, from 23 September to 22 December 2019 (Two months for radiation and air temperature sampling, one month for air particles, and dust sampling).
Metering of voltage and current of PV panels and air particles sampling have been done from 7 a.m. to 7 p.m. (with 1 h sample time). It is noted that surface of the panels was thoroughly cleaned at the beginning of each solar radiation and air temperature metering.
The surface azimuth angle is fixed to zero (South faced). Further, it is assumed that normal conditions are 31.49 °C and maximum radiation of 959.82 W/m2 for summer and, 15.93 °C and maximum radiation of 804.75 W/m2 for winter.
Two 260 W mono-silicon panels of German Solar World Company (Table 1) are used in the experiments. In order to measure power, voltage, and current of the PV panels, PVCHECKw Solar PV System Tester, and to measure solar radiation intensity, HT304N device which is calibrated in standard condition, are used. It is worth mentioning that tolerance of these devices is ±4% and ±3%, respectively. Moreover, to measure the dust settled on panel surfaces, Mettler AT201 digital laboratory scales with 0.1 mg precision is used. In addition, to collect the pollutants in the air, the ambient sampling pump machine with 1.5 L/m flow rate is used. The measuring tools used in the experiments are demonstrated in Figure 2.
To clarify steps of the experiment in different phases Figure 3 is provided. It is worth mentioning that the diagrams of this paper which are related to the voltage-current and generated power, are obtained from the “PVCHECKw Solar System Tester” device and “Top view”. Moreover, the MATLAB software is used for drawing voltage-current changes for the dust deposited.

3. Problem Formulation

In this section, the formulation of the effects of several parameters on PV cell characteristics is presented.

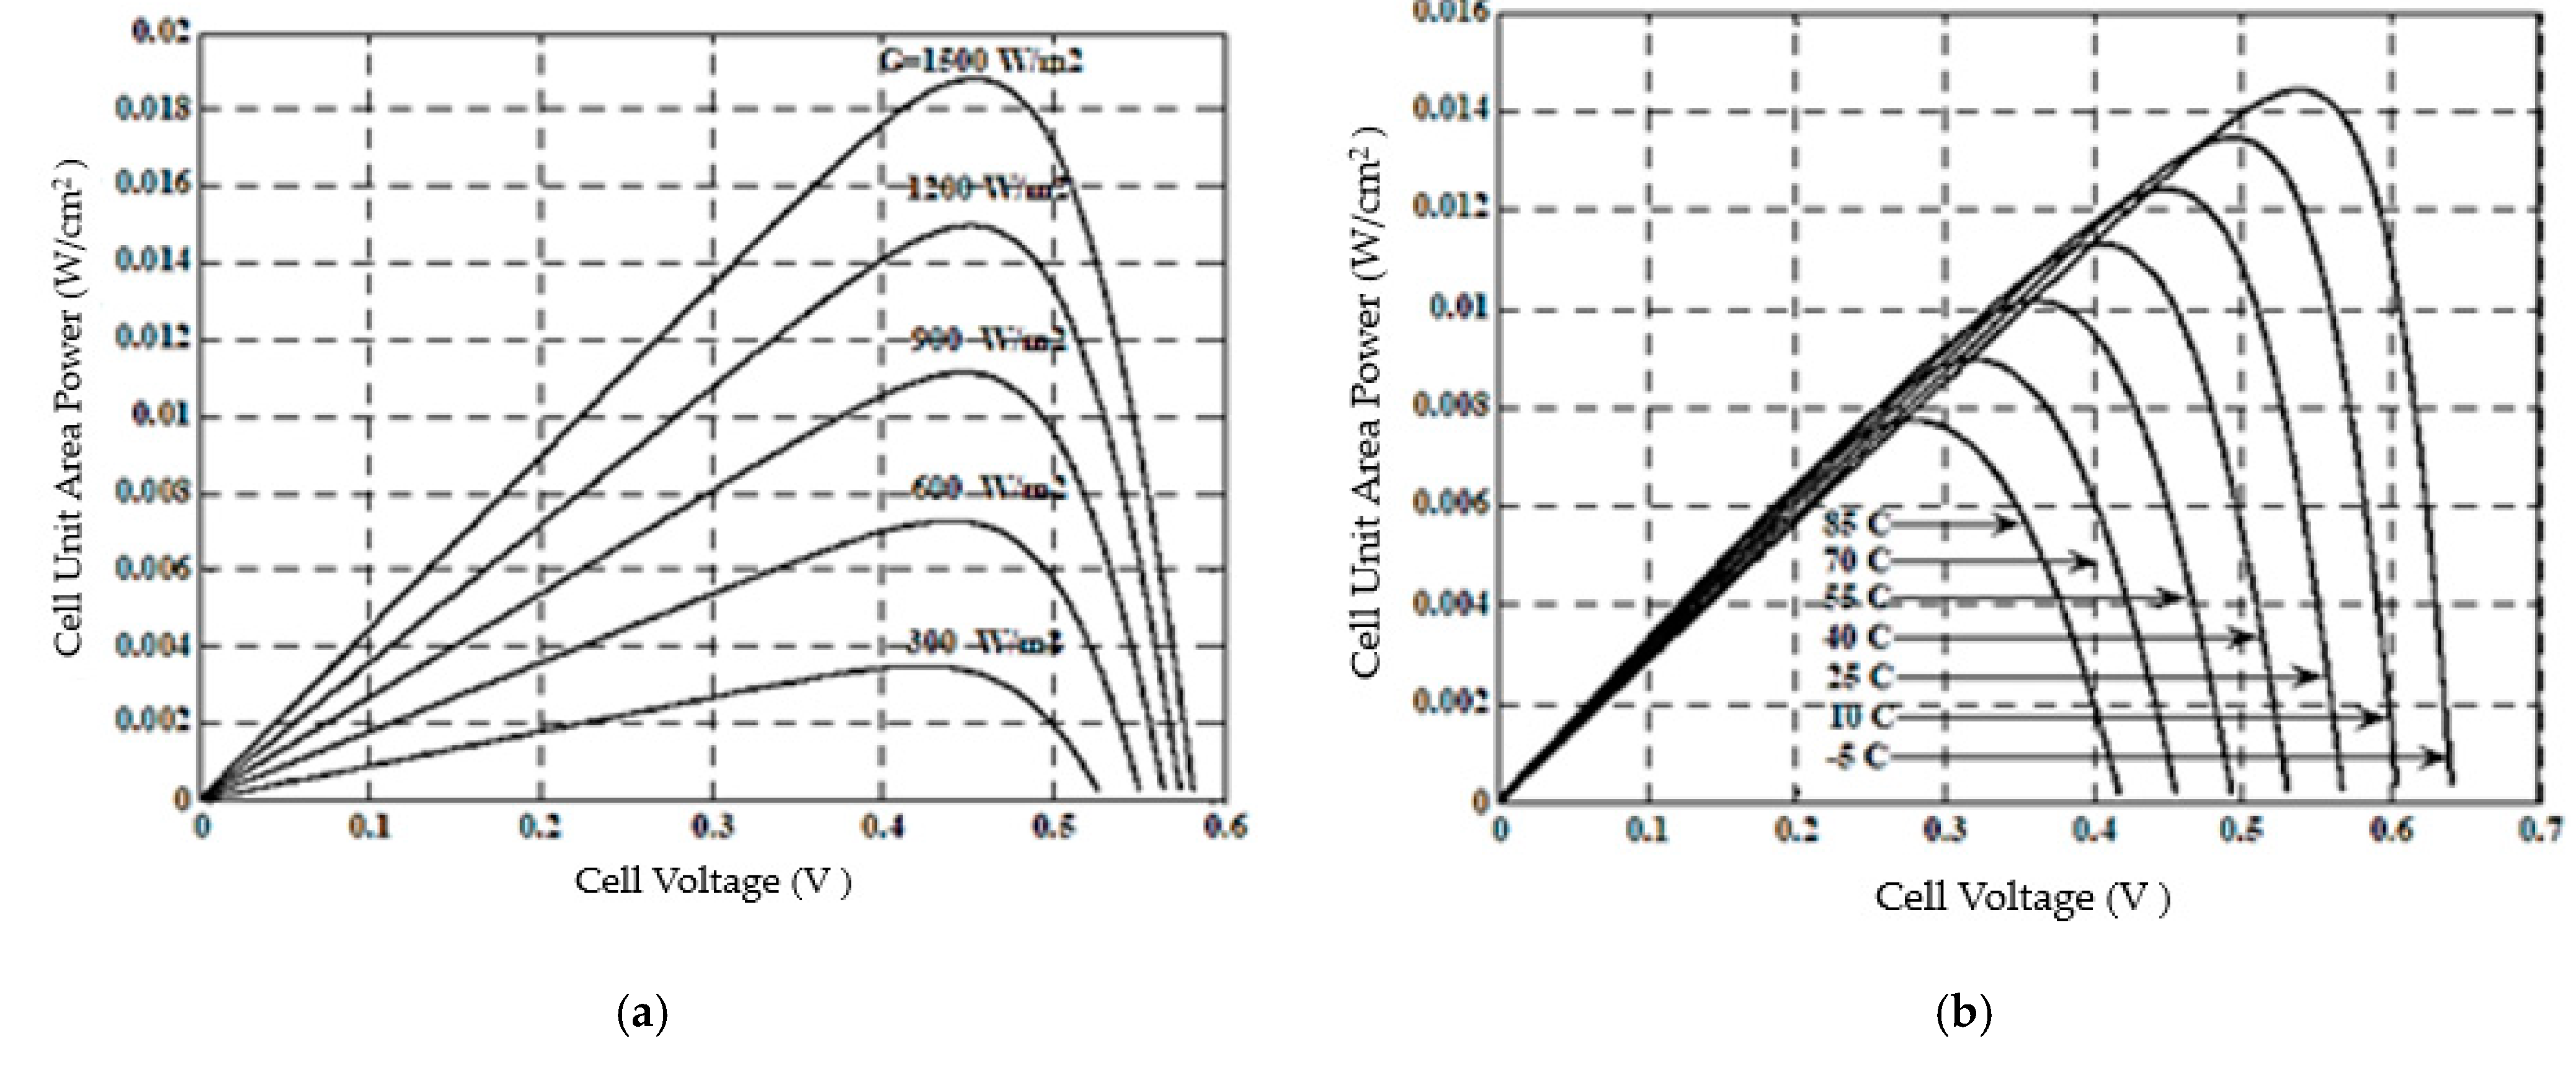
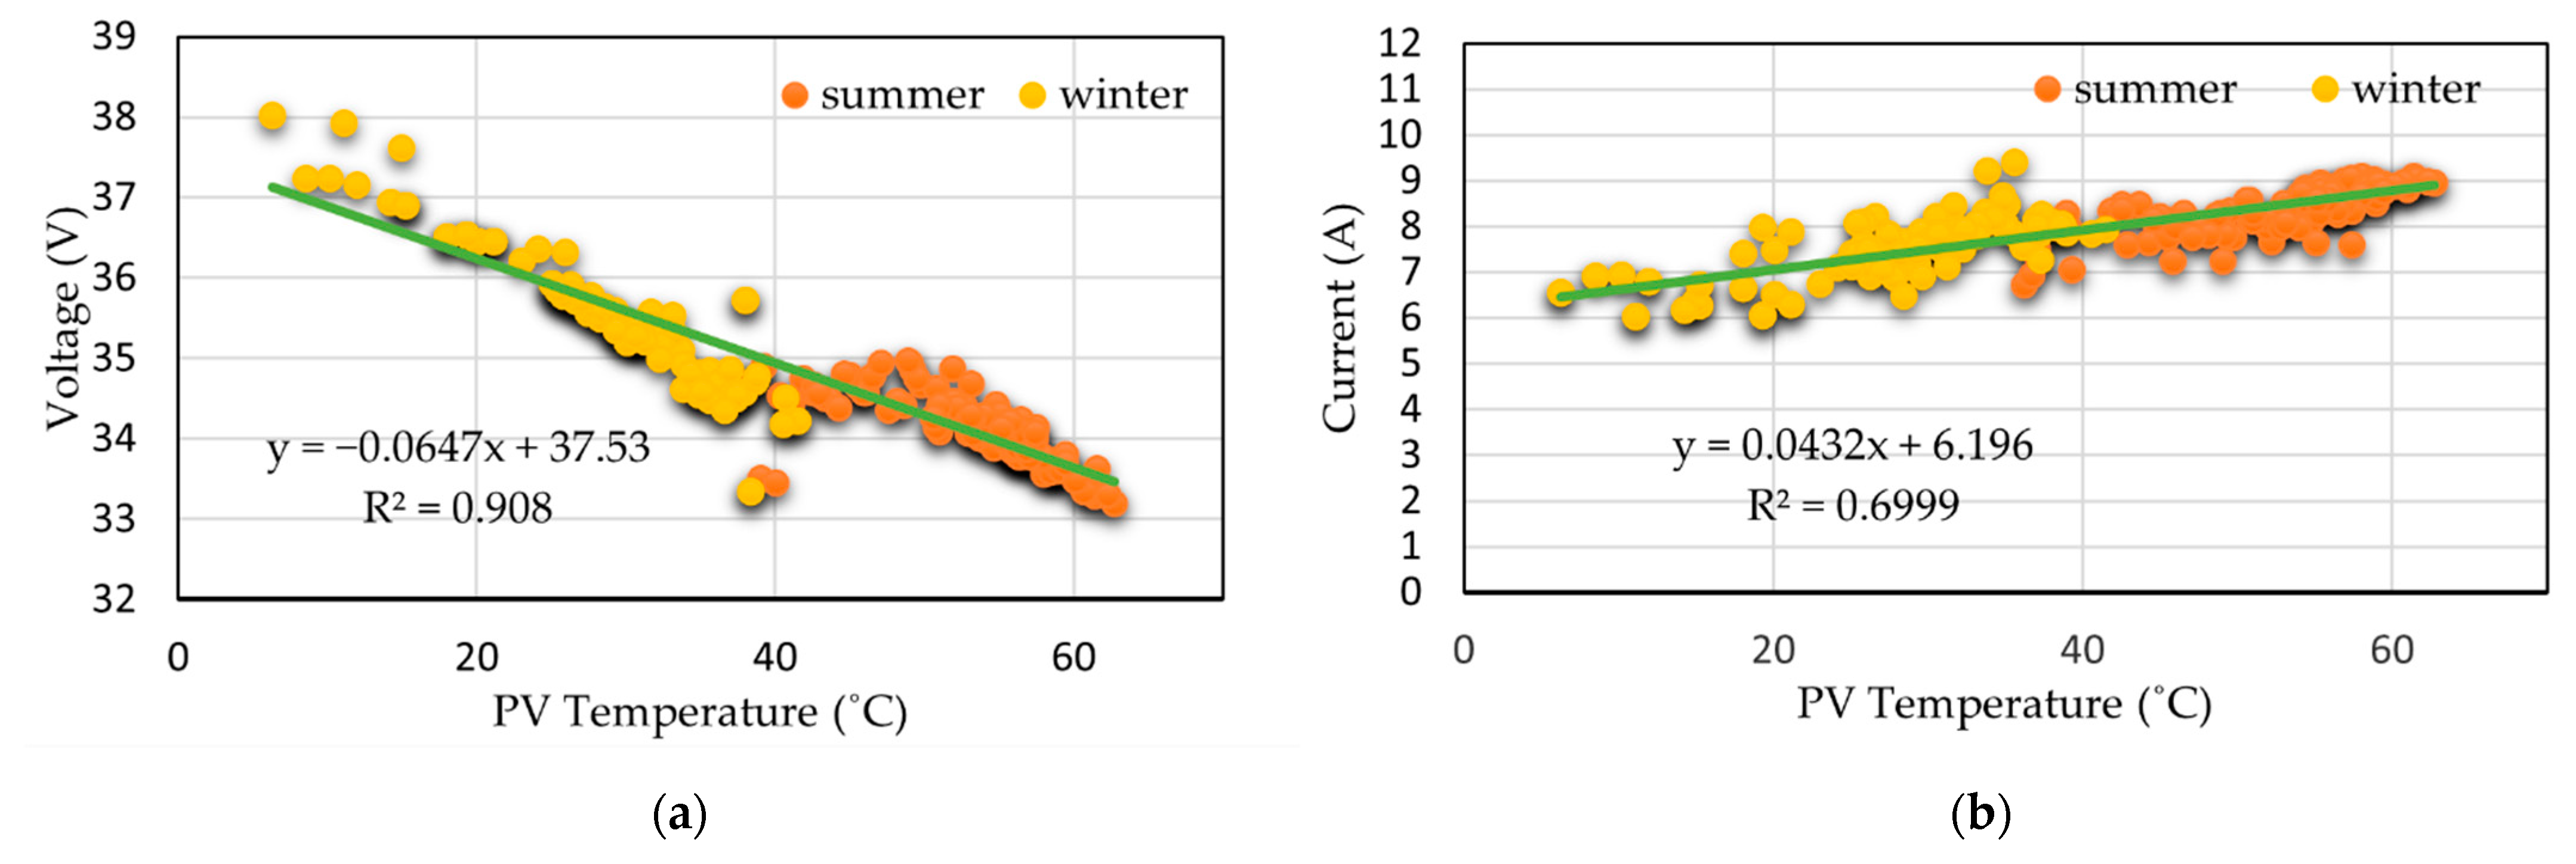
3.1. Effects of Temperature

Temperature is a very important factor that could affect the efficiency of PV panels. In general, determining factors of solar cell temperature are dividable into four categories:
  • Radiation
  • Air temperature
  • Electrical losses
  • Thermal losses including conduction and convection
Radiation is a form of energy transmission in which energy is transmitted from a source (sun) to another object (solar cell). Every object absorbs a portion of solar energy and reflects the other portion. In the solar cell, a part of radiation energy is converted to electrical energy P L e l c through PV operation, while the rest is Q e l c [26].
Q e l c = P L e l c   t Q e l c = f ( V P V , T c e l l )   t
where V P V and T c e l l are PV cell voltage and PV cell temperature, respectively. A portion of the electrical energy generated in the PV cell is converted as electrical power P L e l c to thermal energy Q e l c which is calculated as:
P L e l c = r s I P V 2 + ( V P V + r s I P V ) × I s ( exp ( q ( V P V + r s I P V ) / n k T c e l l ) 1 )
where r s , I P V , q and k are PV cell resistance, PV cell current, electric charge, and Boltzmann coefficient, respectively. As a result, the thermal energy originated from electrical loss is a function of output voltage and PV cell temperature per time unit.
Seasonal weather changes in summer and winter result in evaluating the effects of air temperature on PV efficiency. In summer as the warmest season, band gap of semiconductors reduces which affects electrical elements of the semiconductor in turn. To obtain the relation between solar radiation and panel surface temperature increase due to radiation energy, an experiment is performed in which a light thermometer is used. The experiment begins with sunrise and register of radiation values and panel temperature. By measuring the time passing, increasing in solar radiation, registering temperature and radiation values for each measuring instance, the relation between radiation amount and panel temperature increment reveals. The relation between solar radiation G and panel temperature is explained by the following equation [27]:
T c e l l = T 0 + 0.031 G
Based on the formula, increment in solar radiation results in the increment of panel temperature which in turn, results in the decrement of band gap energy and PV cell voltage. Also, the PV cell short-circuit current decreases which in turn results in the decrement of cell efficiency. In addition, shadow is a factor that limits availability of solar radiation for PV panels. Therefore, in designing and installing stages, it should be noted that the shade has not fallen on the panel, which reduces efficiency.
The impact of air temperature and solar radiation changes on solar cell parameters is demonstrated in Figure 4.
It is shown from Figure 4 that air temperature increment results in a linear decrement of open-circuit voltage, and increment of short-circuit current I S C . However, open-circuit voltage is affected by air temperature more than others. Hence, due to dependence on I0 (Equation (4)), air temperature increment reduces the open-circuit voltage [28].
I 0 = q A ( D n i 2 / L N D )
where D , A, L, and N D are air temperature-independence constant, cell area, wavelength, and the number of ionized donors, respectively. In Equation (4), many parameters depend on air temperature, but the most impact belongs to density of inherent carriers n i . This density depends on band gap energy (The lower band gap has more inherent carriers) and energy of the carriers (density of which increases with temperature increasing). Equation (5) corresponds to the density of energy carriers [29]:
n i = B T 3 exp ( E G 0 / k T )
where B and E G 0 are air temperature-independence constant and band gap between electrons and holes, respectively. According to Equations (4) and (5), the impact of I0 parameter on open-circuit voltage V O C is:
V O C = k T / q   ln ( I S C / I 0 ) = k T / q ( ln I S C ln B γ ln T + ( q V G 0 / k T ) )
Equation (6) shows solar cell sensitivity to air temperature changes on open-circuit voltage, whereas short-circuit current increases to a small extent with air temperature increase. This is because the band gap energy decreases and more photons have sufficient energy to create electron-hole pairing.
Therefore, since V O C , I S C , and power are effective in calculating the power, panel efficiency decreases with an increase of air temperature in compliance with the mentioned equation. In Equation (7), relation between ground reflectance and air temperature of panels will be presented [28].
P P V ρ 0 ( 1 + γ ( T T 0 ) )
where ρ 0 is the ground reflectance which is between 0.2 and 0.8 depending on the coating of the region [28] and is assumed 0.3 in this study considering the studied region.
Conduction Q c d , convection Q c v and radiation losses Q r a are other factors of determining temperature of solar panels. Heat transfer equations via conduction, convection, and radiation are expressed as [28]:
Q c d = V c d   A P V   Δ T
Q c v = V c v   A P V   Δ T
Q r a = V r a   A P V   Δ T
where A P V and Δ T are area of PV panel and temperature difference, respectively. It should be noted that conduction loss is due to the insulation behind the panel, while convection loss is due to wind blowing between protective glass and air and also between the insulation and air and between the main panel surface and the protective glass. Also, radiation losses are from glass to air, PV surface to glass, and insulator to air.

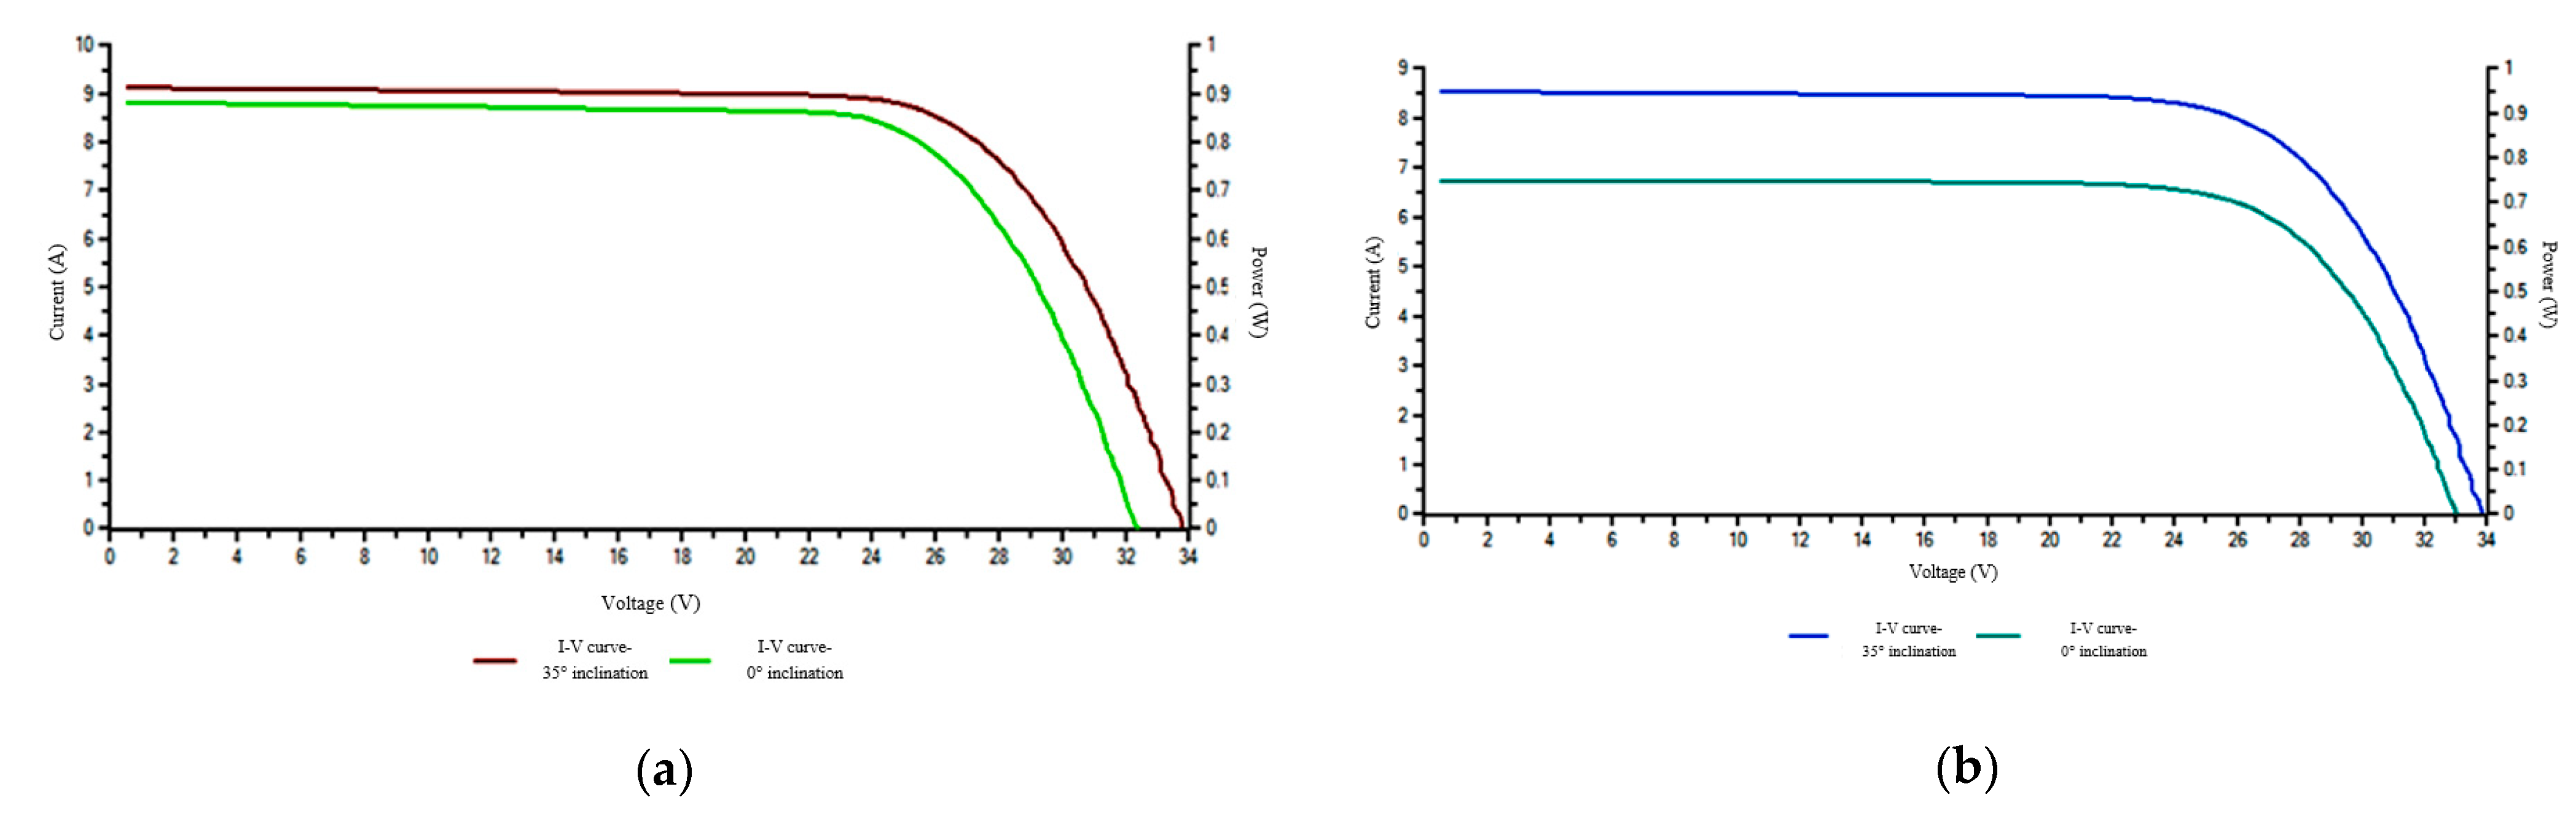
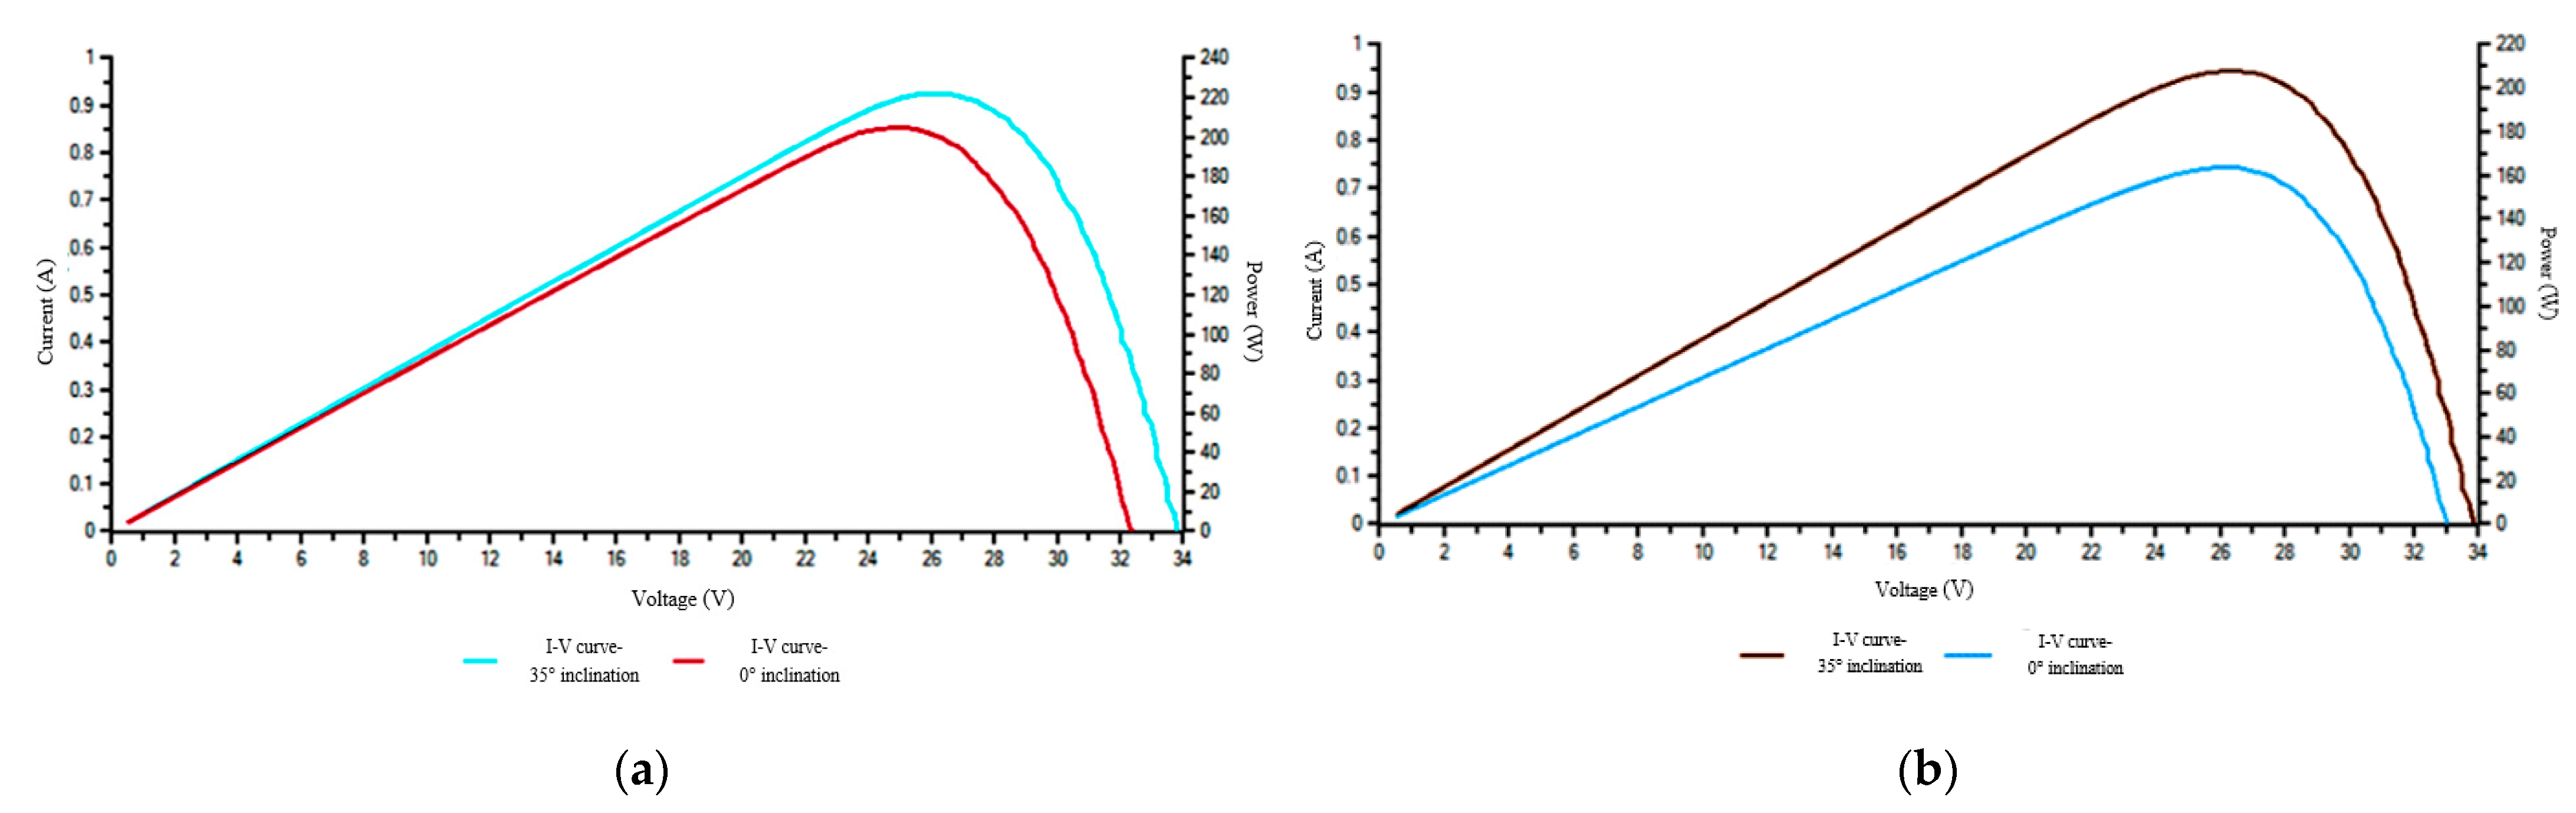
3.2. Effects of Solar Incidence Angle

Another factor that affects the efficiency of PV panels is solar incidence angle. In this study, the following conditions are considered to study the effect of this factor.
Earth has a constant rotation axis with 23.5° deviation from the line perpendicular earth’s orbit around the sun folio. Since this axis exposes various points on earth in different seasons to the sun, heat of earth in different points is different in accordance with solar incidence angle. Due to the mentioned deviation, solar incidence angle to earth and locations of sunset and sunrise in different seasons are different. Therefore, shifting of seasons can greatly impact solar incidence angle and reduce the radiation intensity. Moreover, panel installation tilted angle β is another factor affecting the efficiency for which 2 modes of horizontal (0°) and 35° angle are considered.
Total solar radiation over tilted surface H T is the sum of beam H B , diffuse H D , and ground reflectance radiation H R [30,31].
H T = H B + H D + H R = R . H
Many mathematical methods have been developed to calculate total radiation. The most conventional model which is used in most researches is the Liu & Jordan model [28] in which the value of radiation coefficient is obtained as [30,31].
R = ( 1 H d / H ) R b + H d / H ( 1 + cos β / 2 ) + ρ ( 1 cos β / 2 )
R b is the geometric factor which is obtained as following for locations of the northern hemisphere [30].
R b = ( cos ( φ β ) cos δ sin ω s + ( π / 180 ) ω s sin ( φ β ) sin δ ) / ( cos φ cos δ sin ω s + ( π / 180 ) ω s sin φ sin δ )
in which φ and δ are latitude and declination of earth axis in the desirable day, respectively [32].
δ = 23.5 sin [ 360 × ( n + 273 ) / 365 ]
In Equation (14), n is the day number of the year (Started from Jan.1). The angle of sunset on horizontal ( ω s ) and tilted surface ( ω s ) are obtained from (16) and (17), respectively [32].
ω s = cos 1 ( tan φ   tan δ )
ω s = min [ cos 1 ( tan φ tan δ ) , cos 1 ( tan ( φ β ) tan δ ) ]
In Equation (17), air clearness index ( k t h ) which expresses the ratio of total radiation on horizontal surface to radiation on the same surface if out of the earth atmosphere is presented. Extraterrestrial radiation (H0) is obtained from the following equation [32].
k t h = H / H 0
H 0 = G S C / π ( 1 + 0.033 cos ( 360 n / 365 ) ) × [ cos φ cos δ sin ω s + ( π ω s / 180 ) sin φ sin δ ]
In Equation (18), G S C is the solar constant which is taken 1367 W/m2 [32,33]. There are many different mathematical models to predict the ratio of scattered radiation to total radiation k t h . The equation used in this study which is expressed in compliance with Equation (19) is desirable for the climates of Iran.
H D / H = { 1.557 1.84 k t h     0.35 < k t h < 0.75 1 0.249 k t h                      k t h < 0.35 0.177                              0.75 < k t h

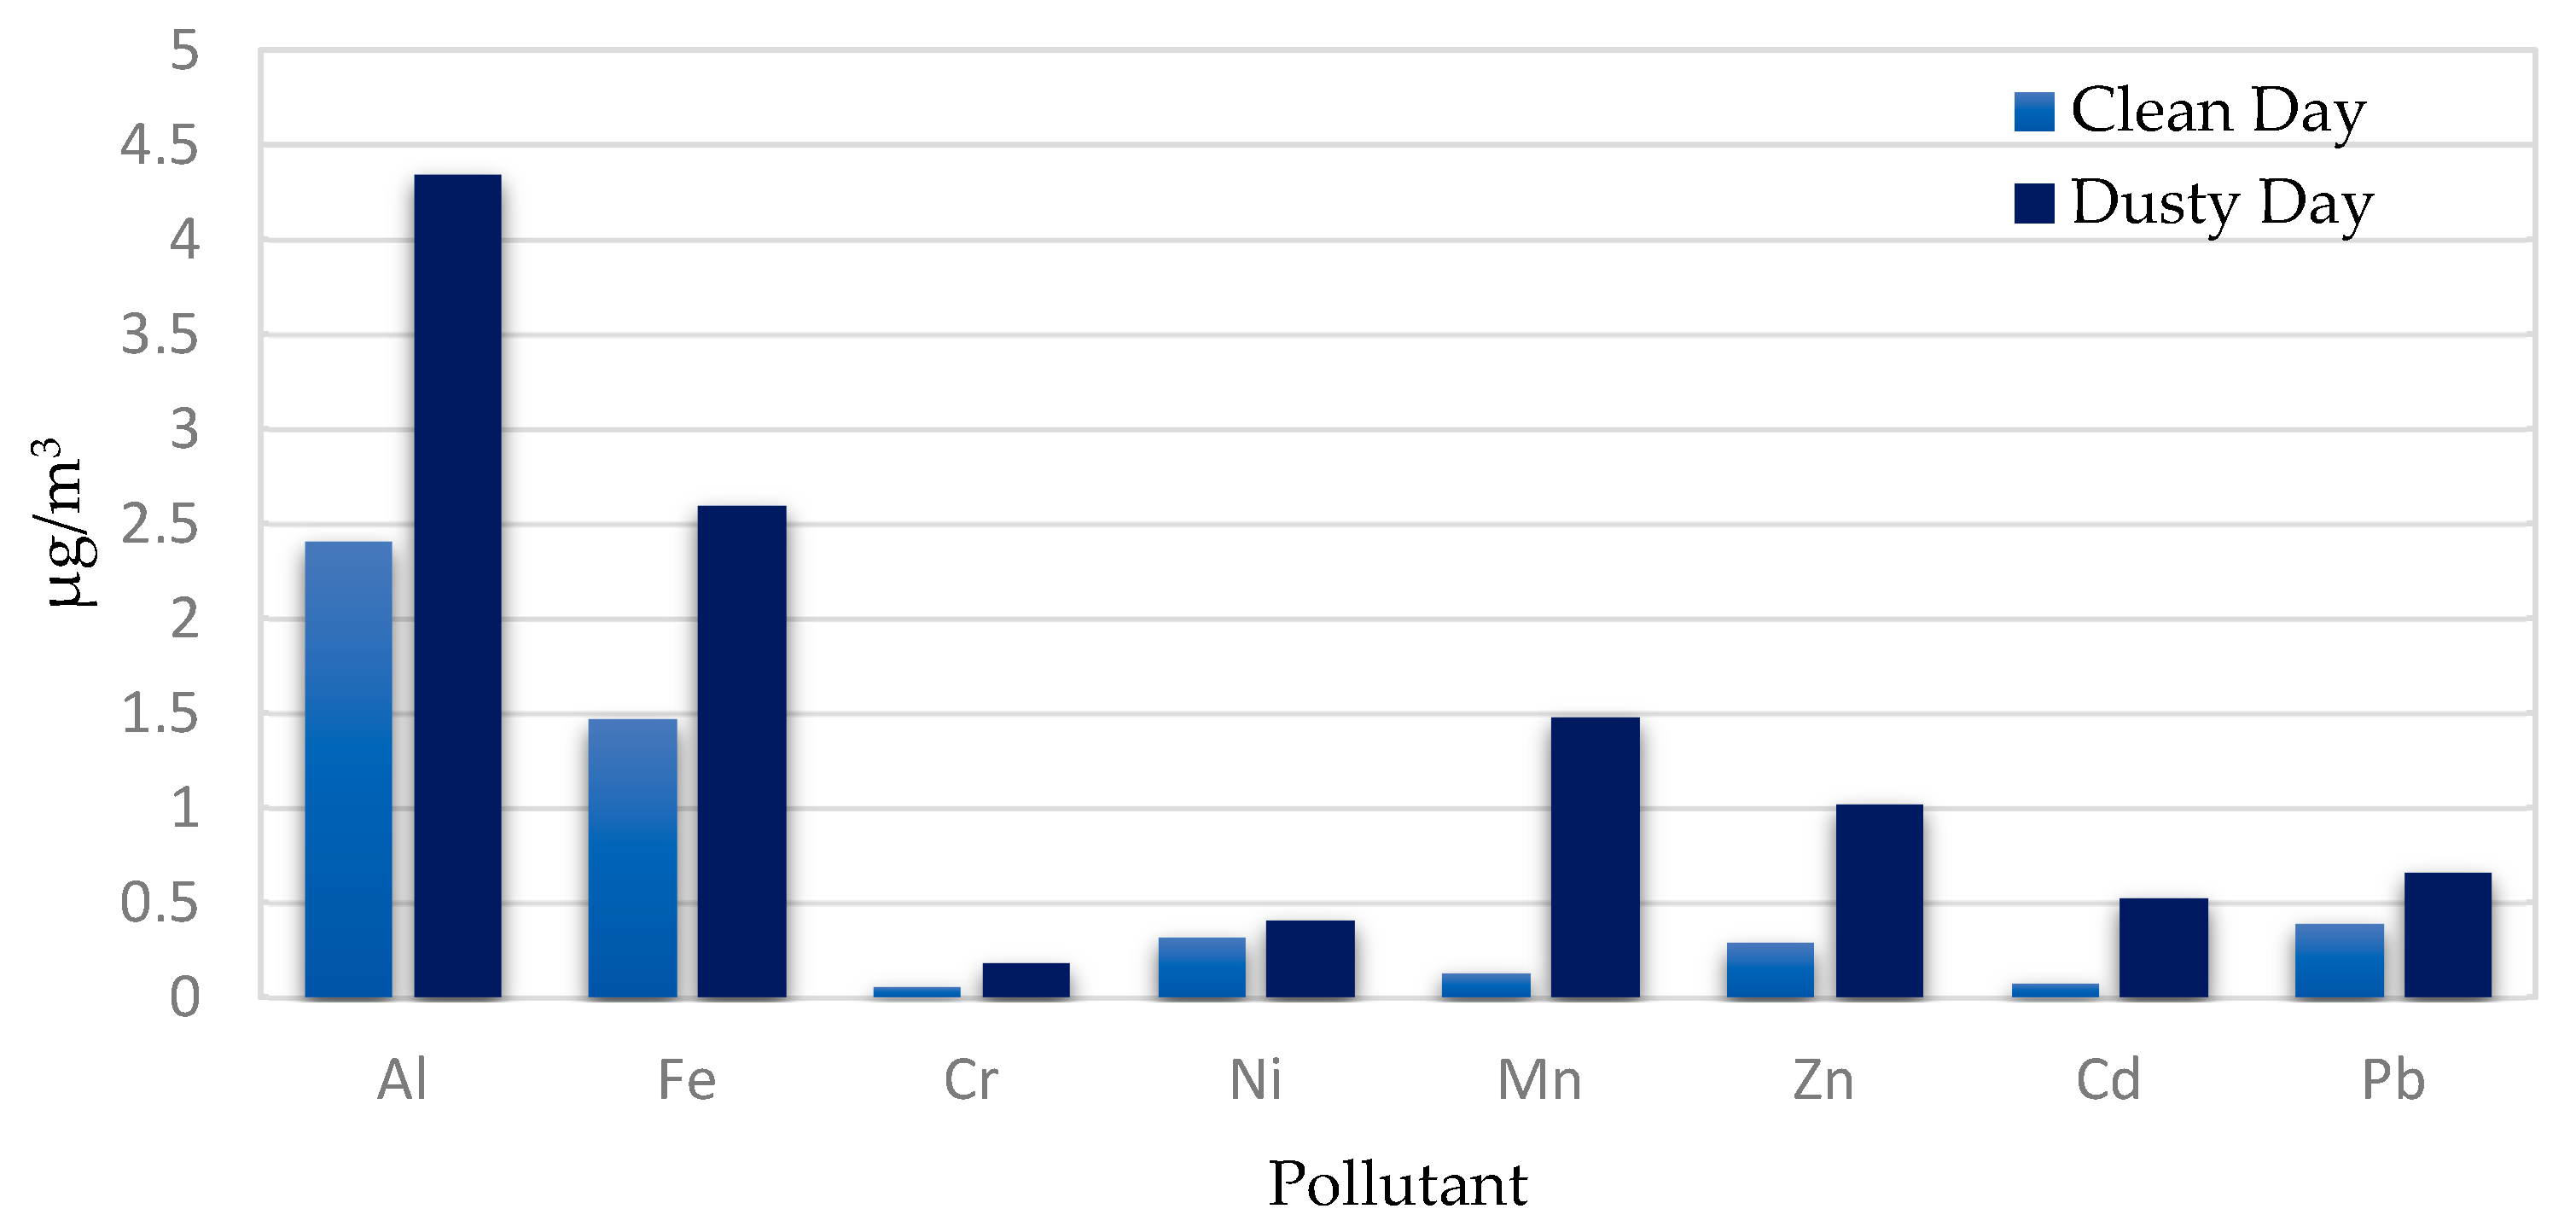
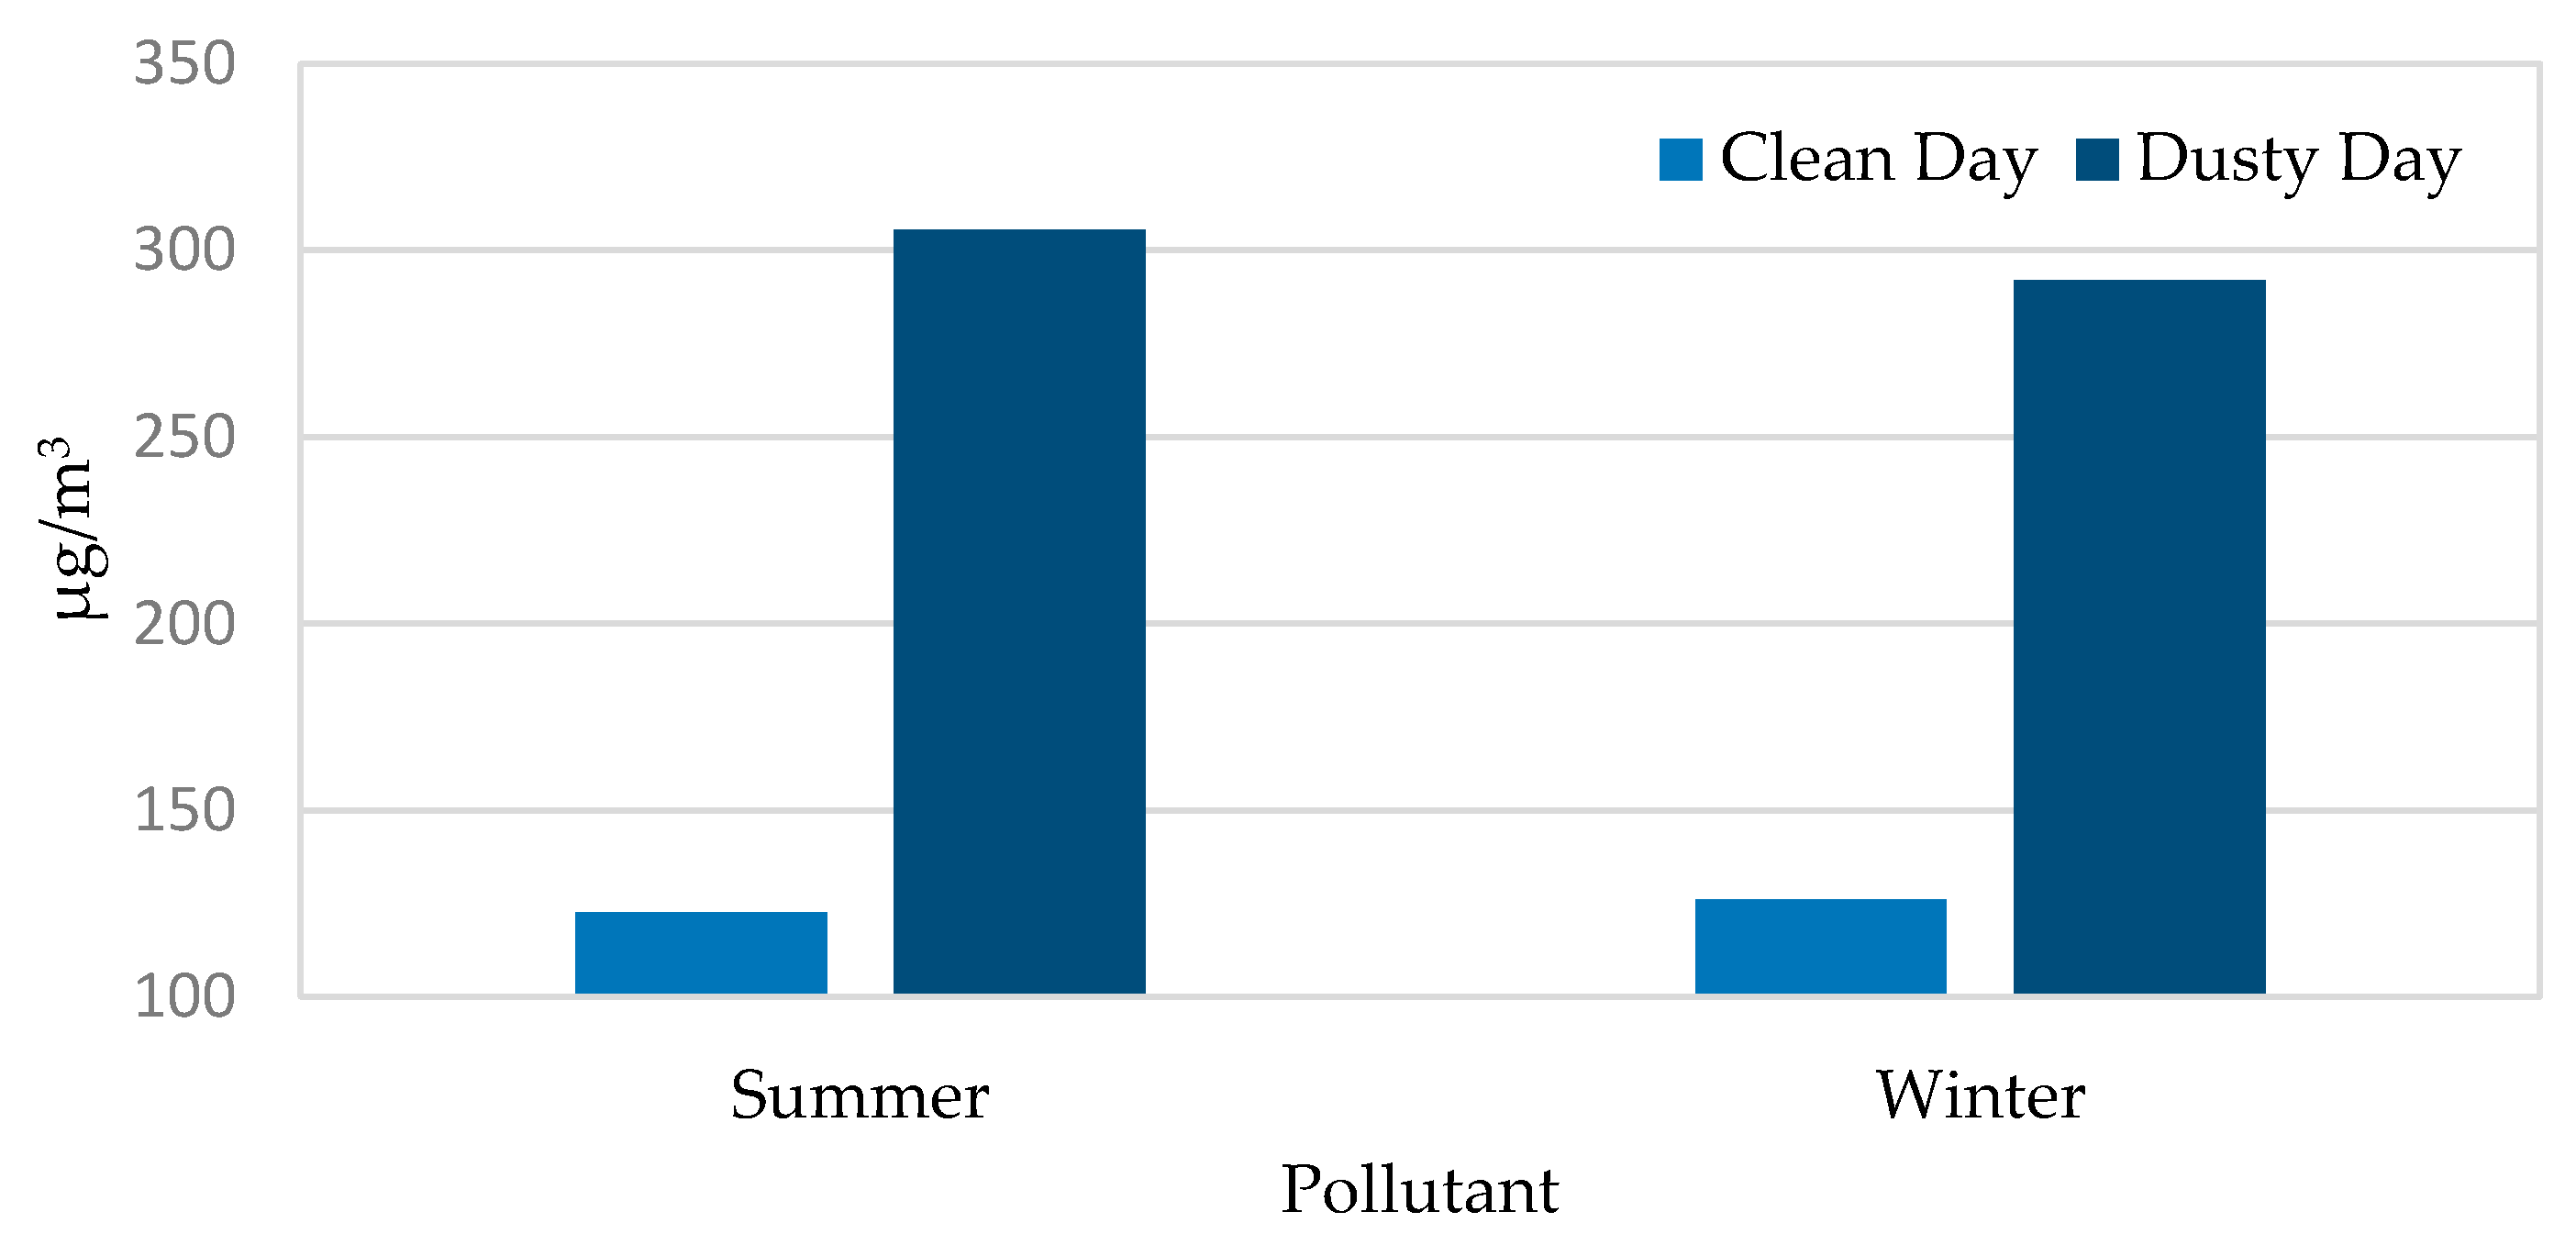
3.3. Effects of the Dust

Dust is an environmental factor which can affect the PV efficiency. In fact, to study the impact of this factor, the experiment was run in two states:
  • Presence of aerosols
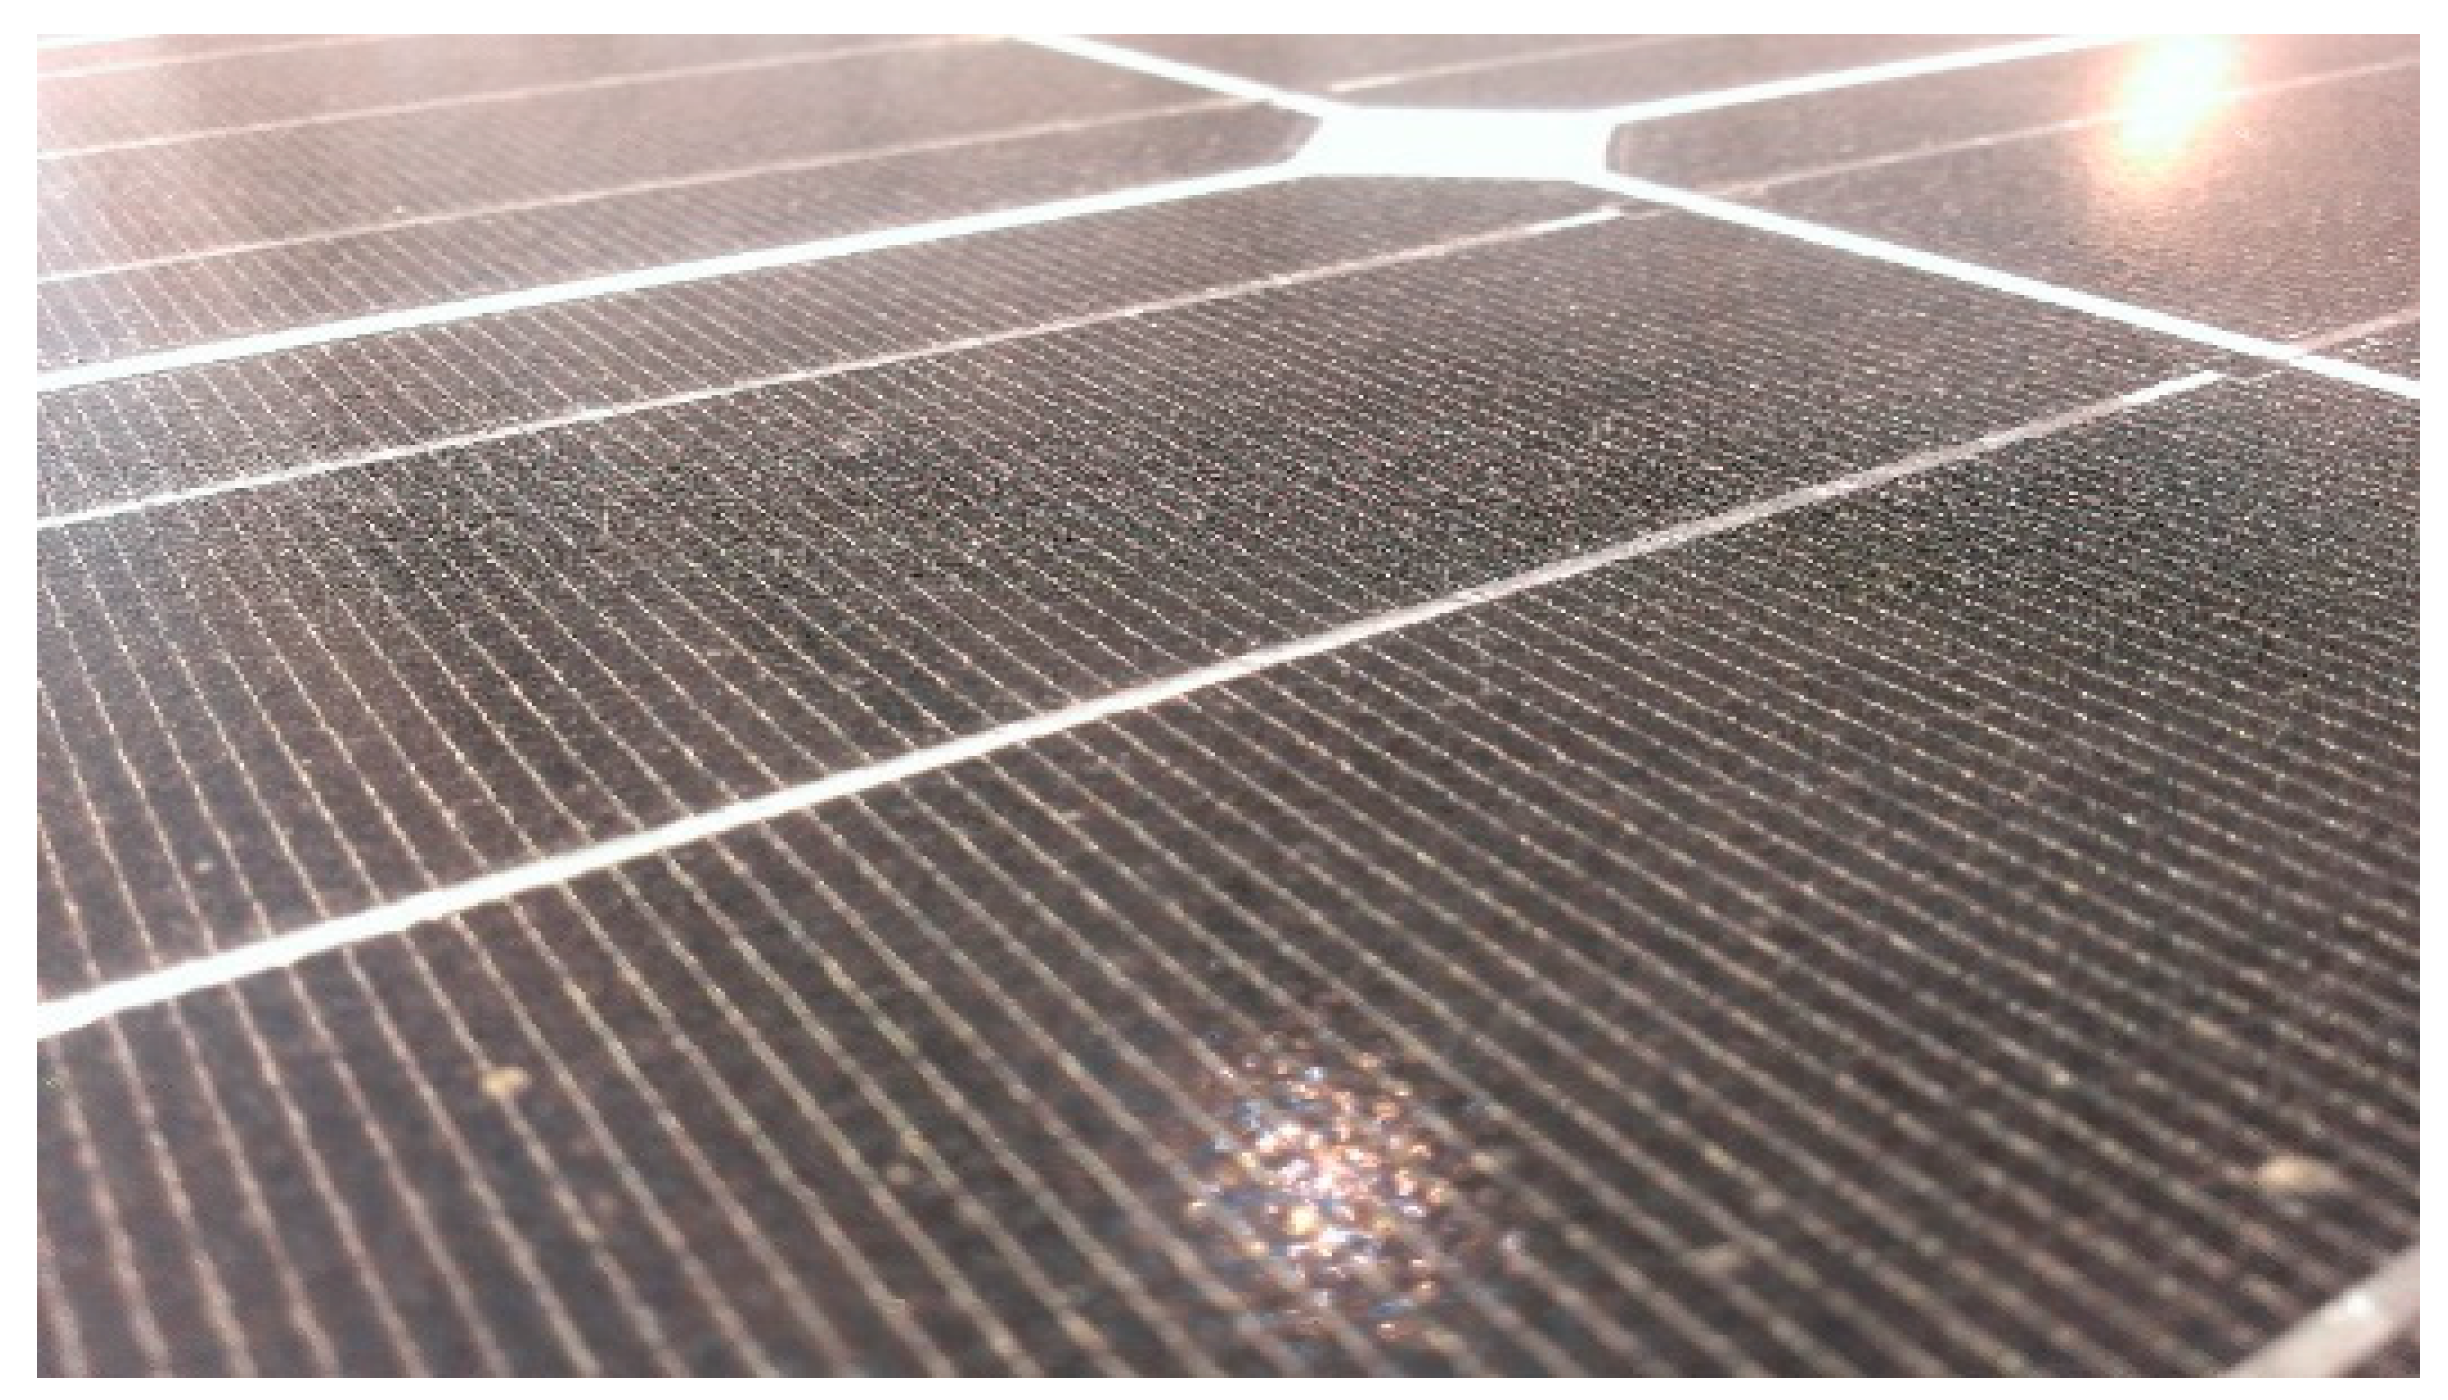
  • Accumulation of particles on panel surfaces
For the first state, aerosols interfere with solar radiation and decrease the daylight intake for some cities up to one third or more. Usually, solar radiation for cities is 15% to 20% lower than the vicinities [34]. This is due to the emission of pollutants resulted from wasteful consumption of fossil fuels in industrial and transportation units.
The presence of dust can affect the scattered and absorbed radiation. In the meantime, the type of airborne particles and their degree of correlation has a significant effect on solar radiation on the earth and indirectly affect the function of the PV panel. The main source of suspended particles is the activity of factories and vehicles that contaminate the city air, the dispersal of air contaminator is considerably greater in the surrounding area than the suburbs. On the other hand, settling of particles on surface results in reflection of solar radiation which in turn makes the radiation energy not fully absorbable. The most impactful factors in this regard are size and form of the particles. Performed studies suggest that the elements that belong to every particle resource (desert dust and urban pollution) are separable with size distribution [2].

4. Experiment Results

In this section, the experiment results to investigate the real conditions on PV panels are presented.
In Figure 5, solar radiation and air temperature for the first day of summer and winter, under metering period are shown. It is observed that maximum solar radiation is located at noon and, the maximum air temperature occurred at about 3–4 h afternoon.
In Figure 6, voltage-current and generated power diagrams expected from the panel in STC and the first measurement in the morning on the first day (22 June 2019) of the experiment are shown.
Corresponding to the diagrams, the generated power expected from the panel with tilt angle of 35° on standard condition is 246.28 W, while generated power of the panel on the first day of experiment in 29 °C and 953 W/m2 radiation is 211.81 W in the morning. This suggests that panel power on the real condition has decreased by 13.9% in comparison to the standard condition. Weather conditions for the first day of the experiment are shown in Table 2.

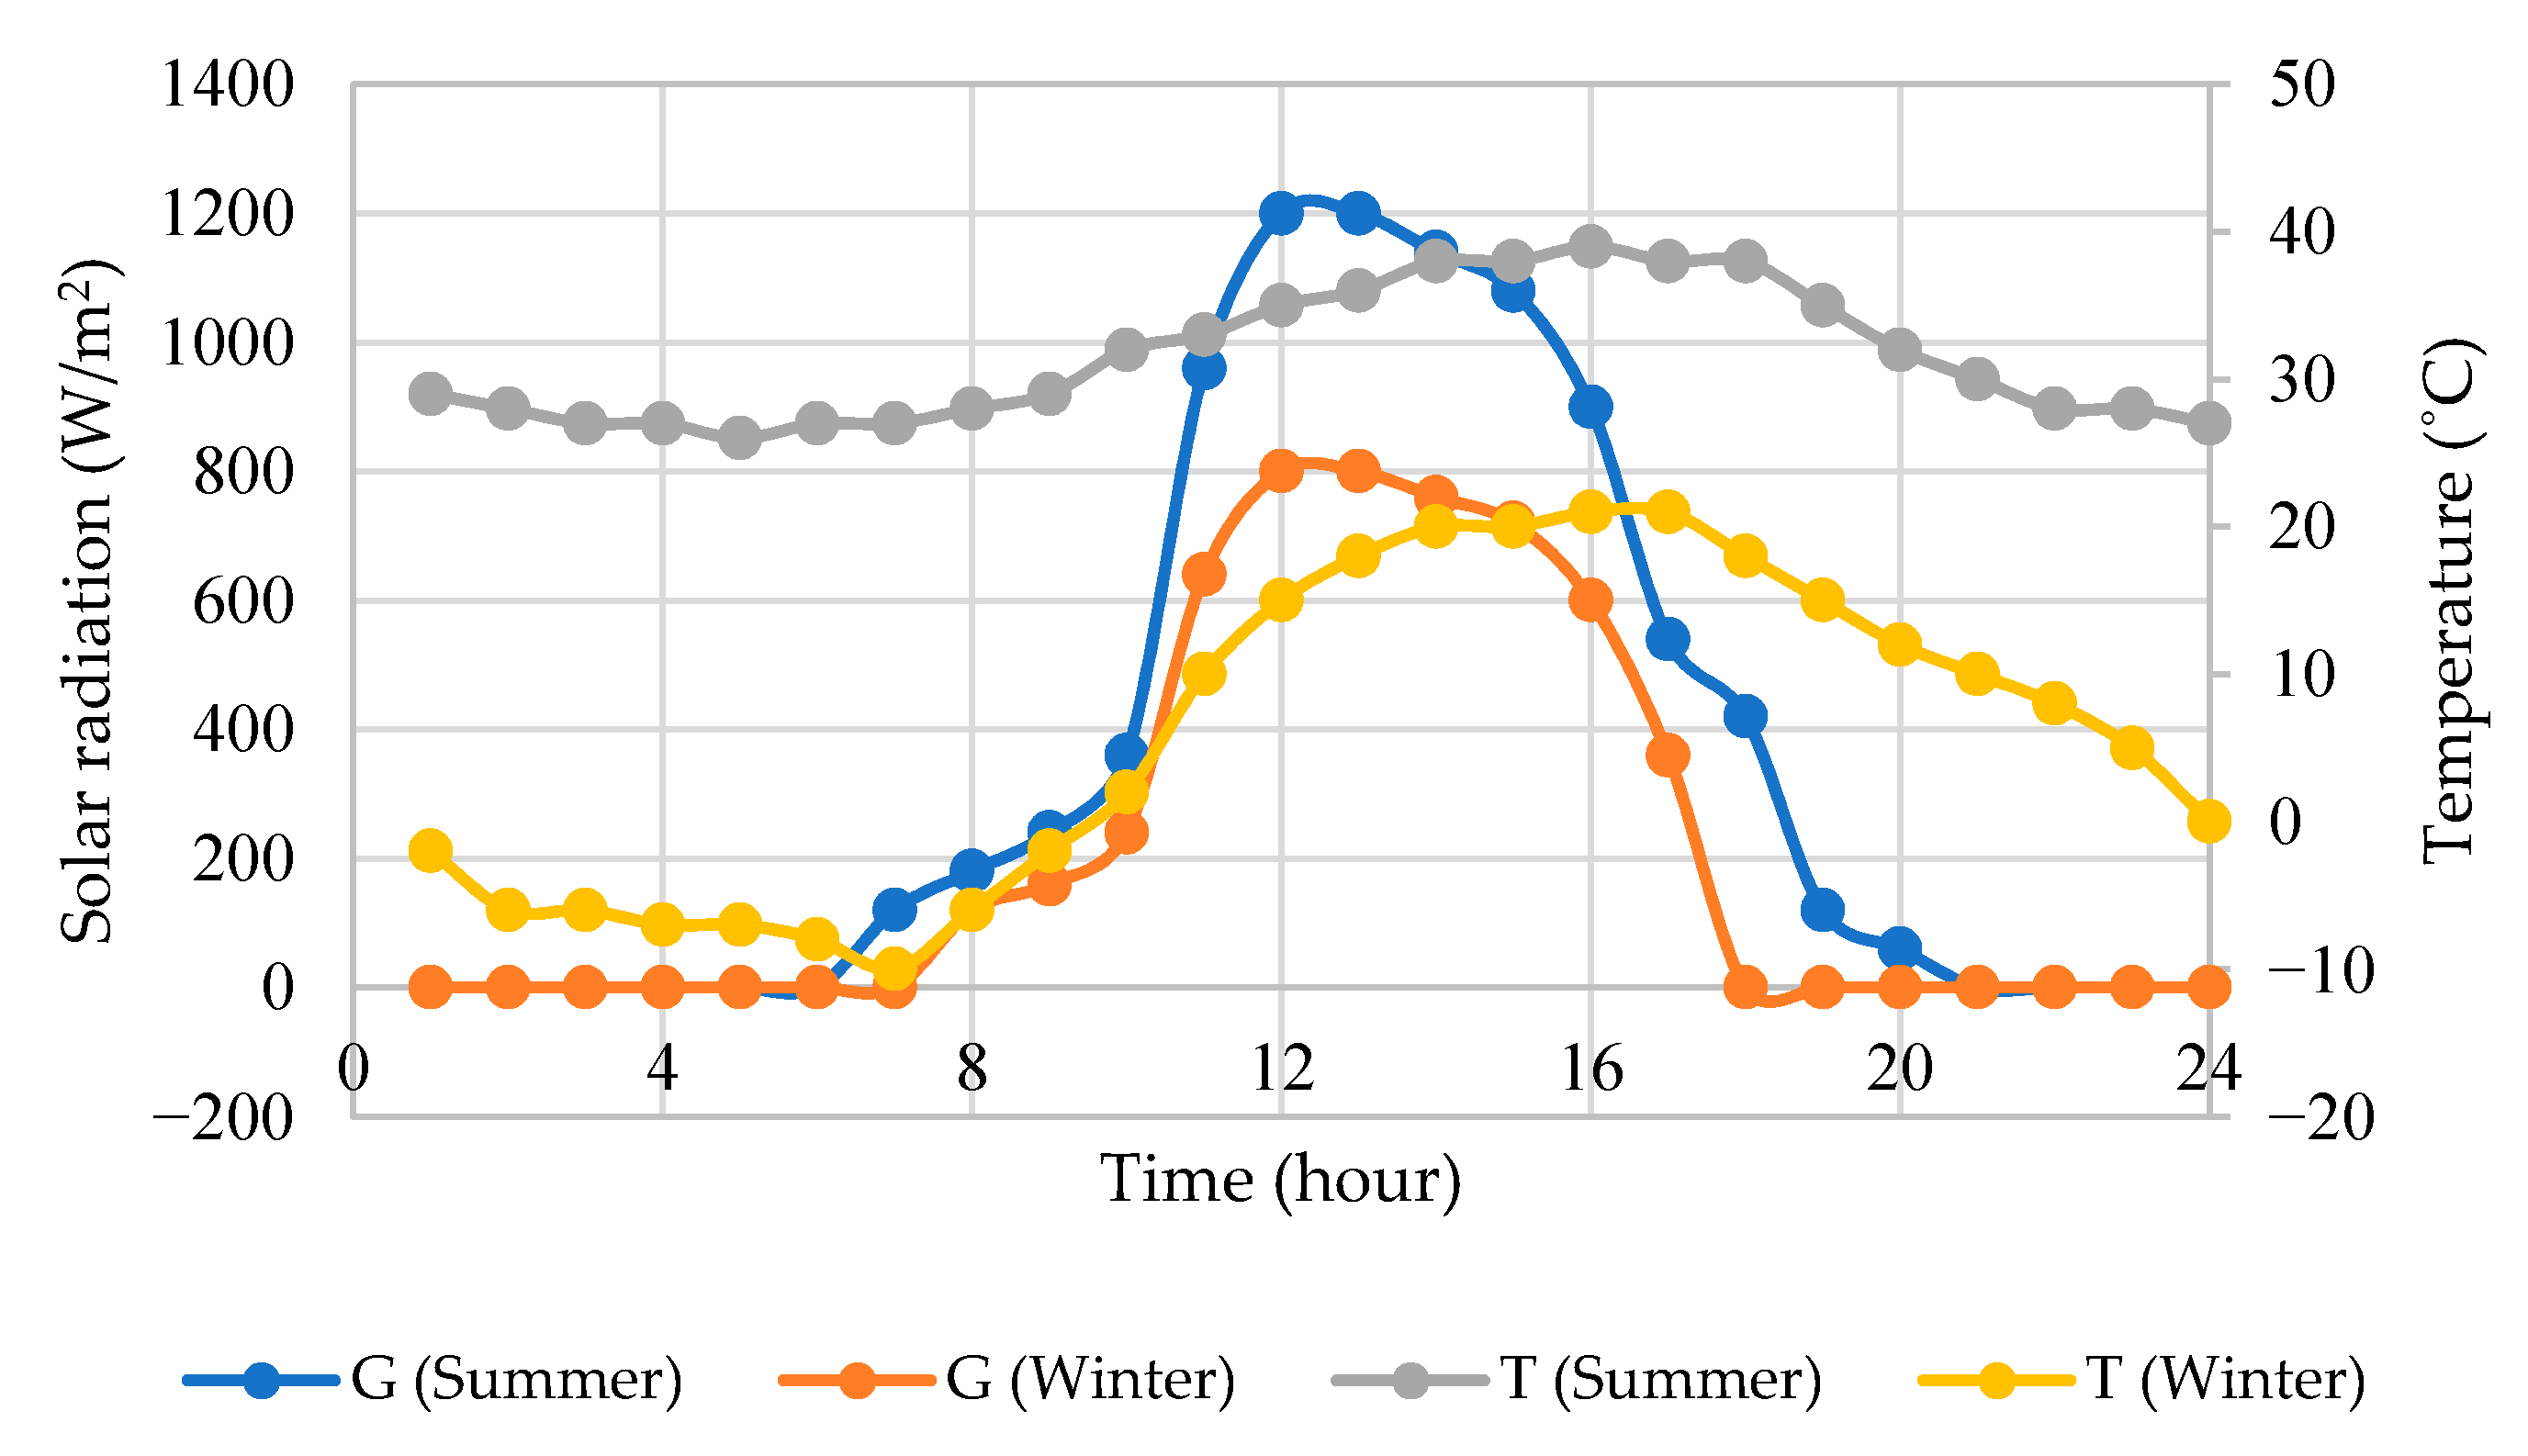
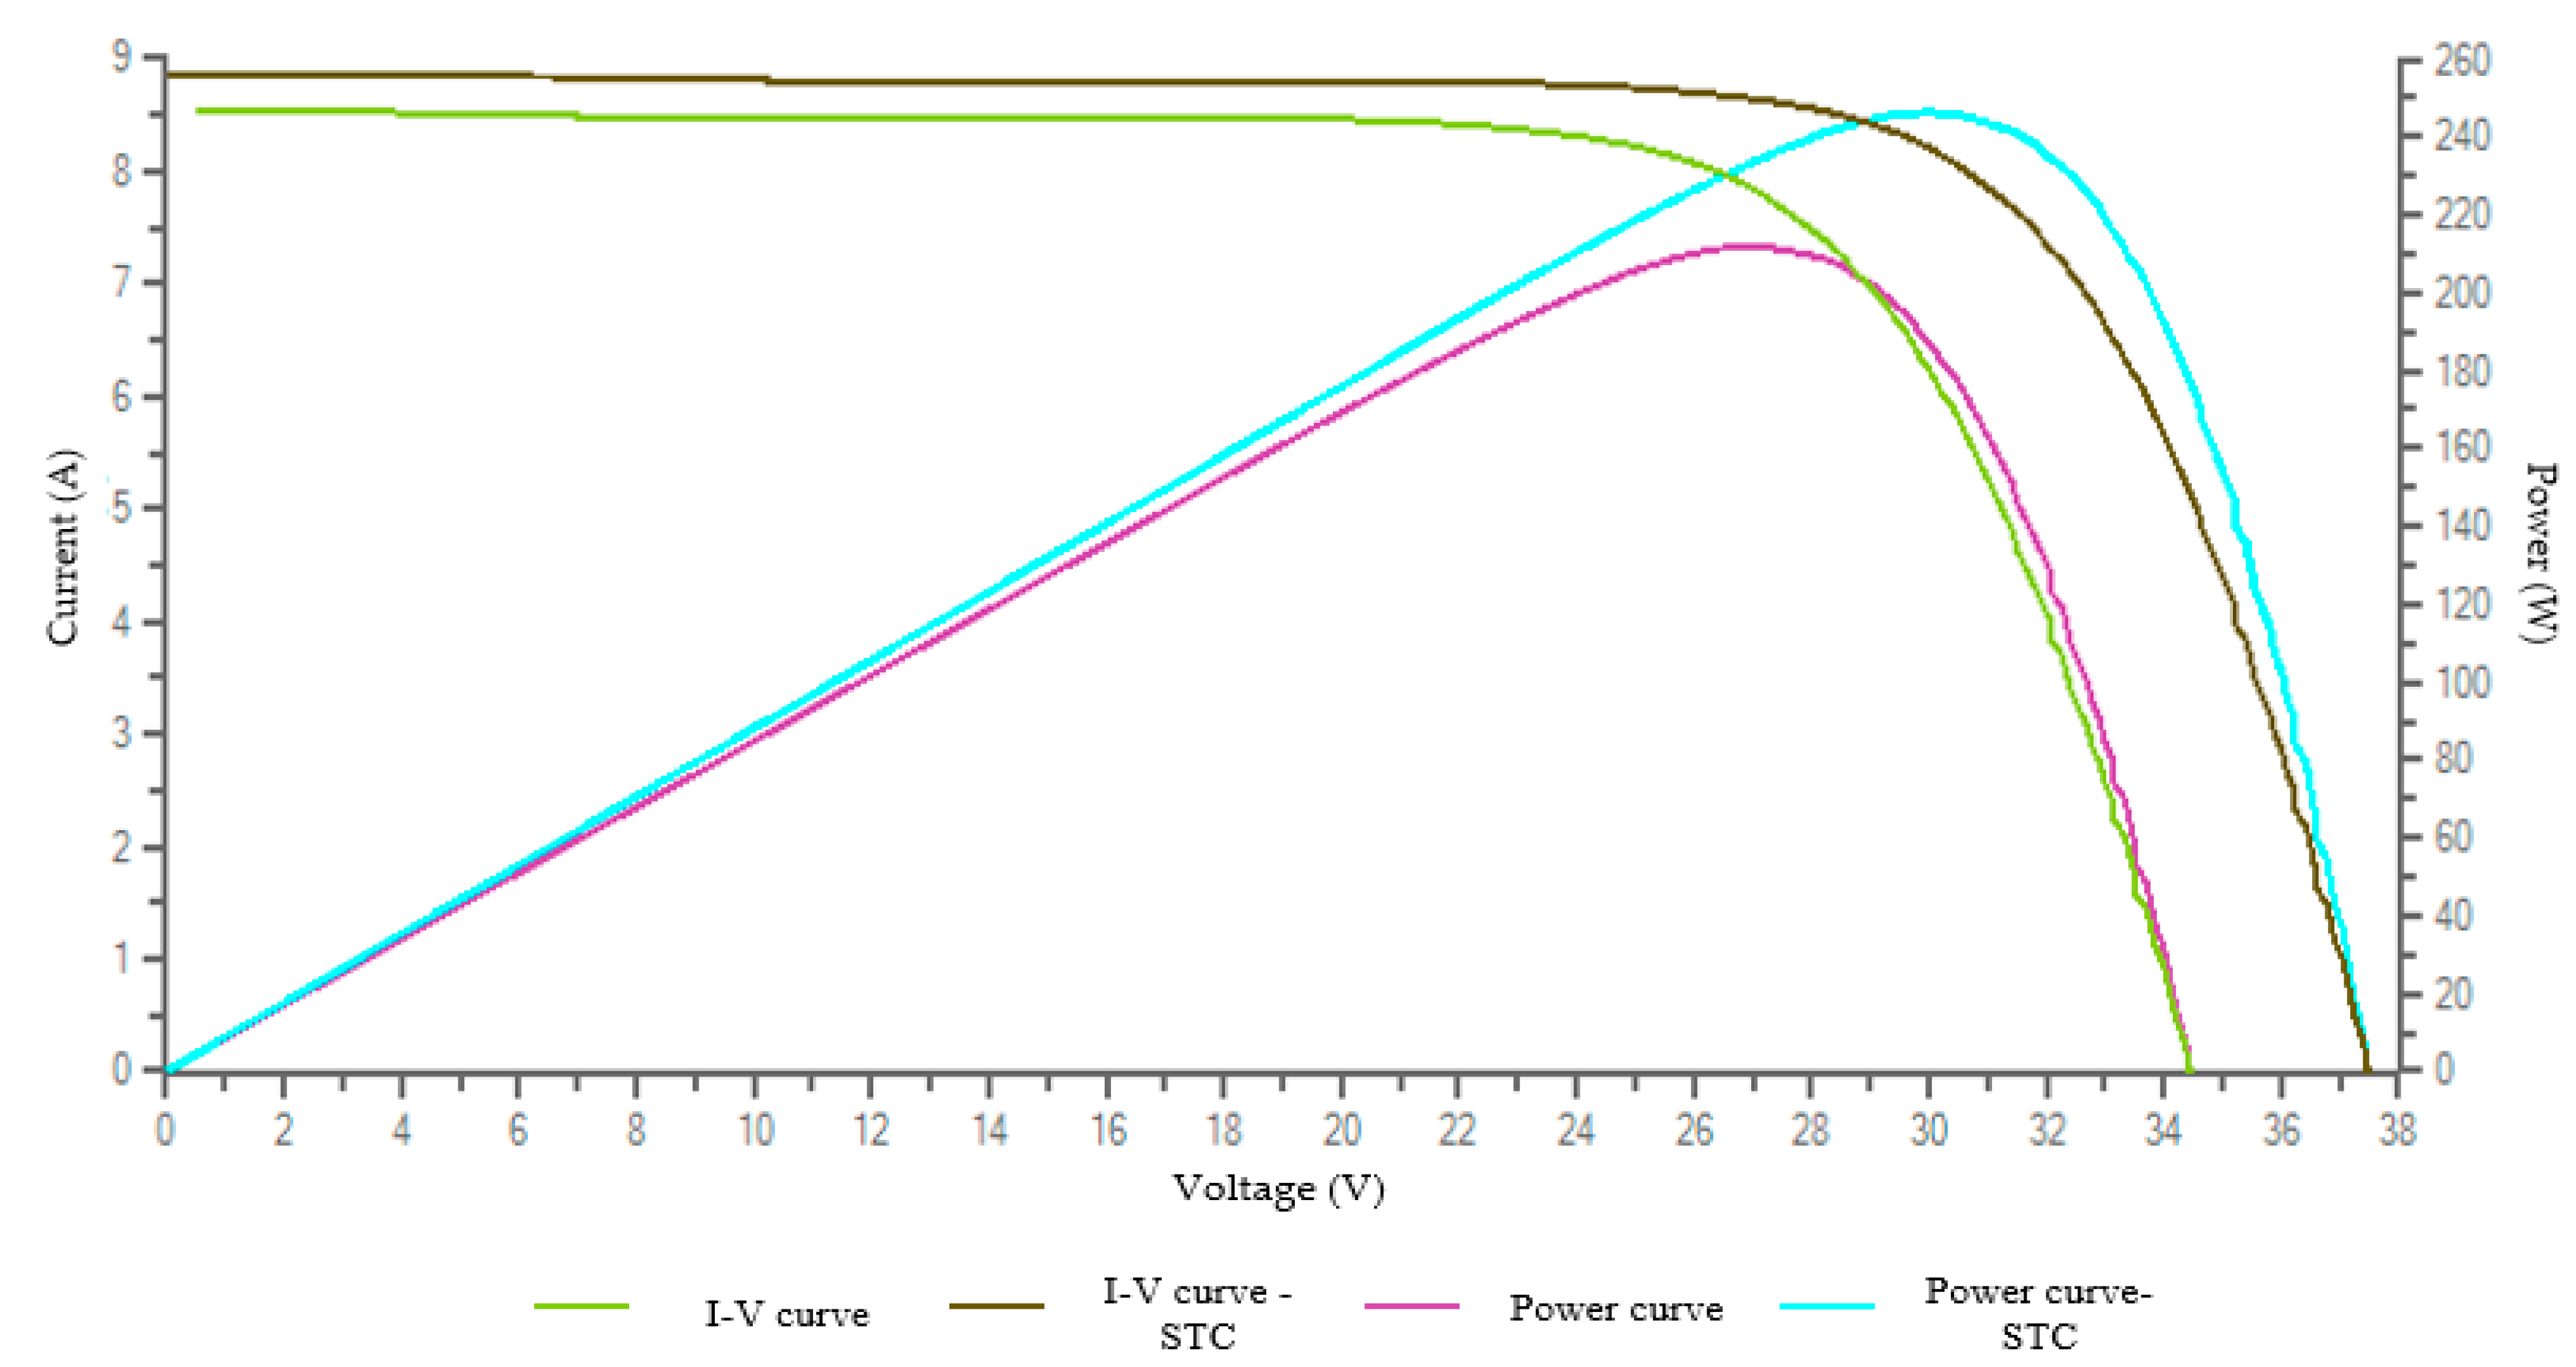
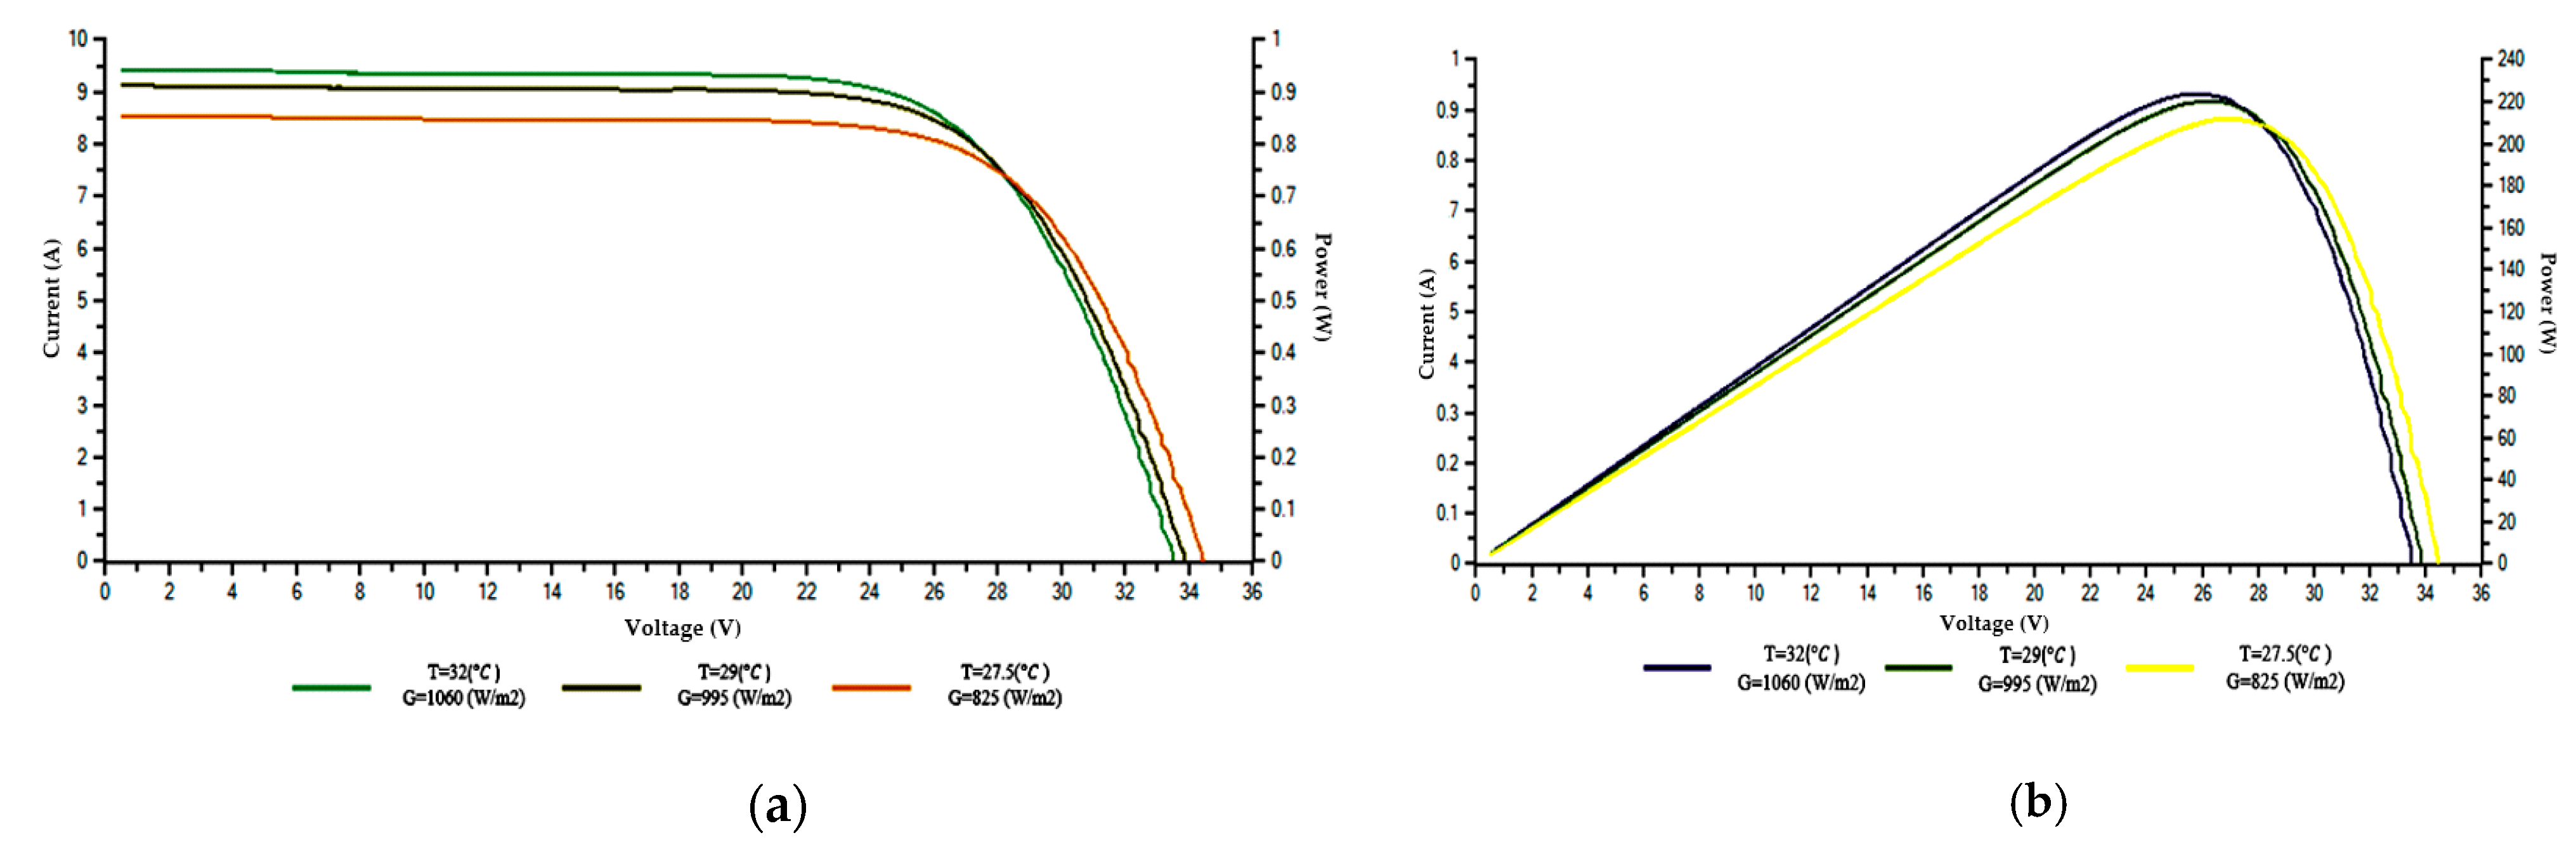
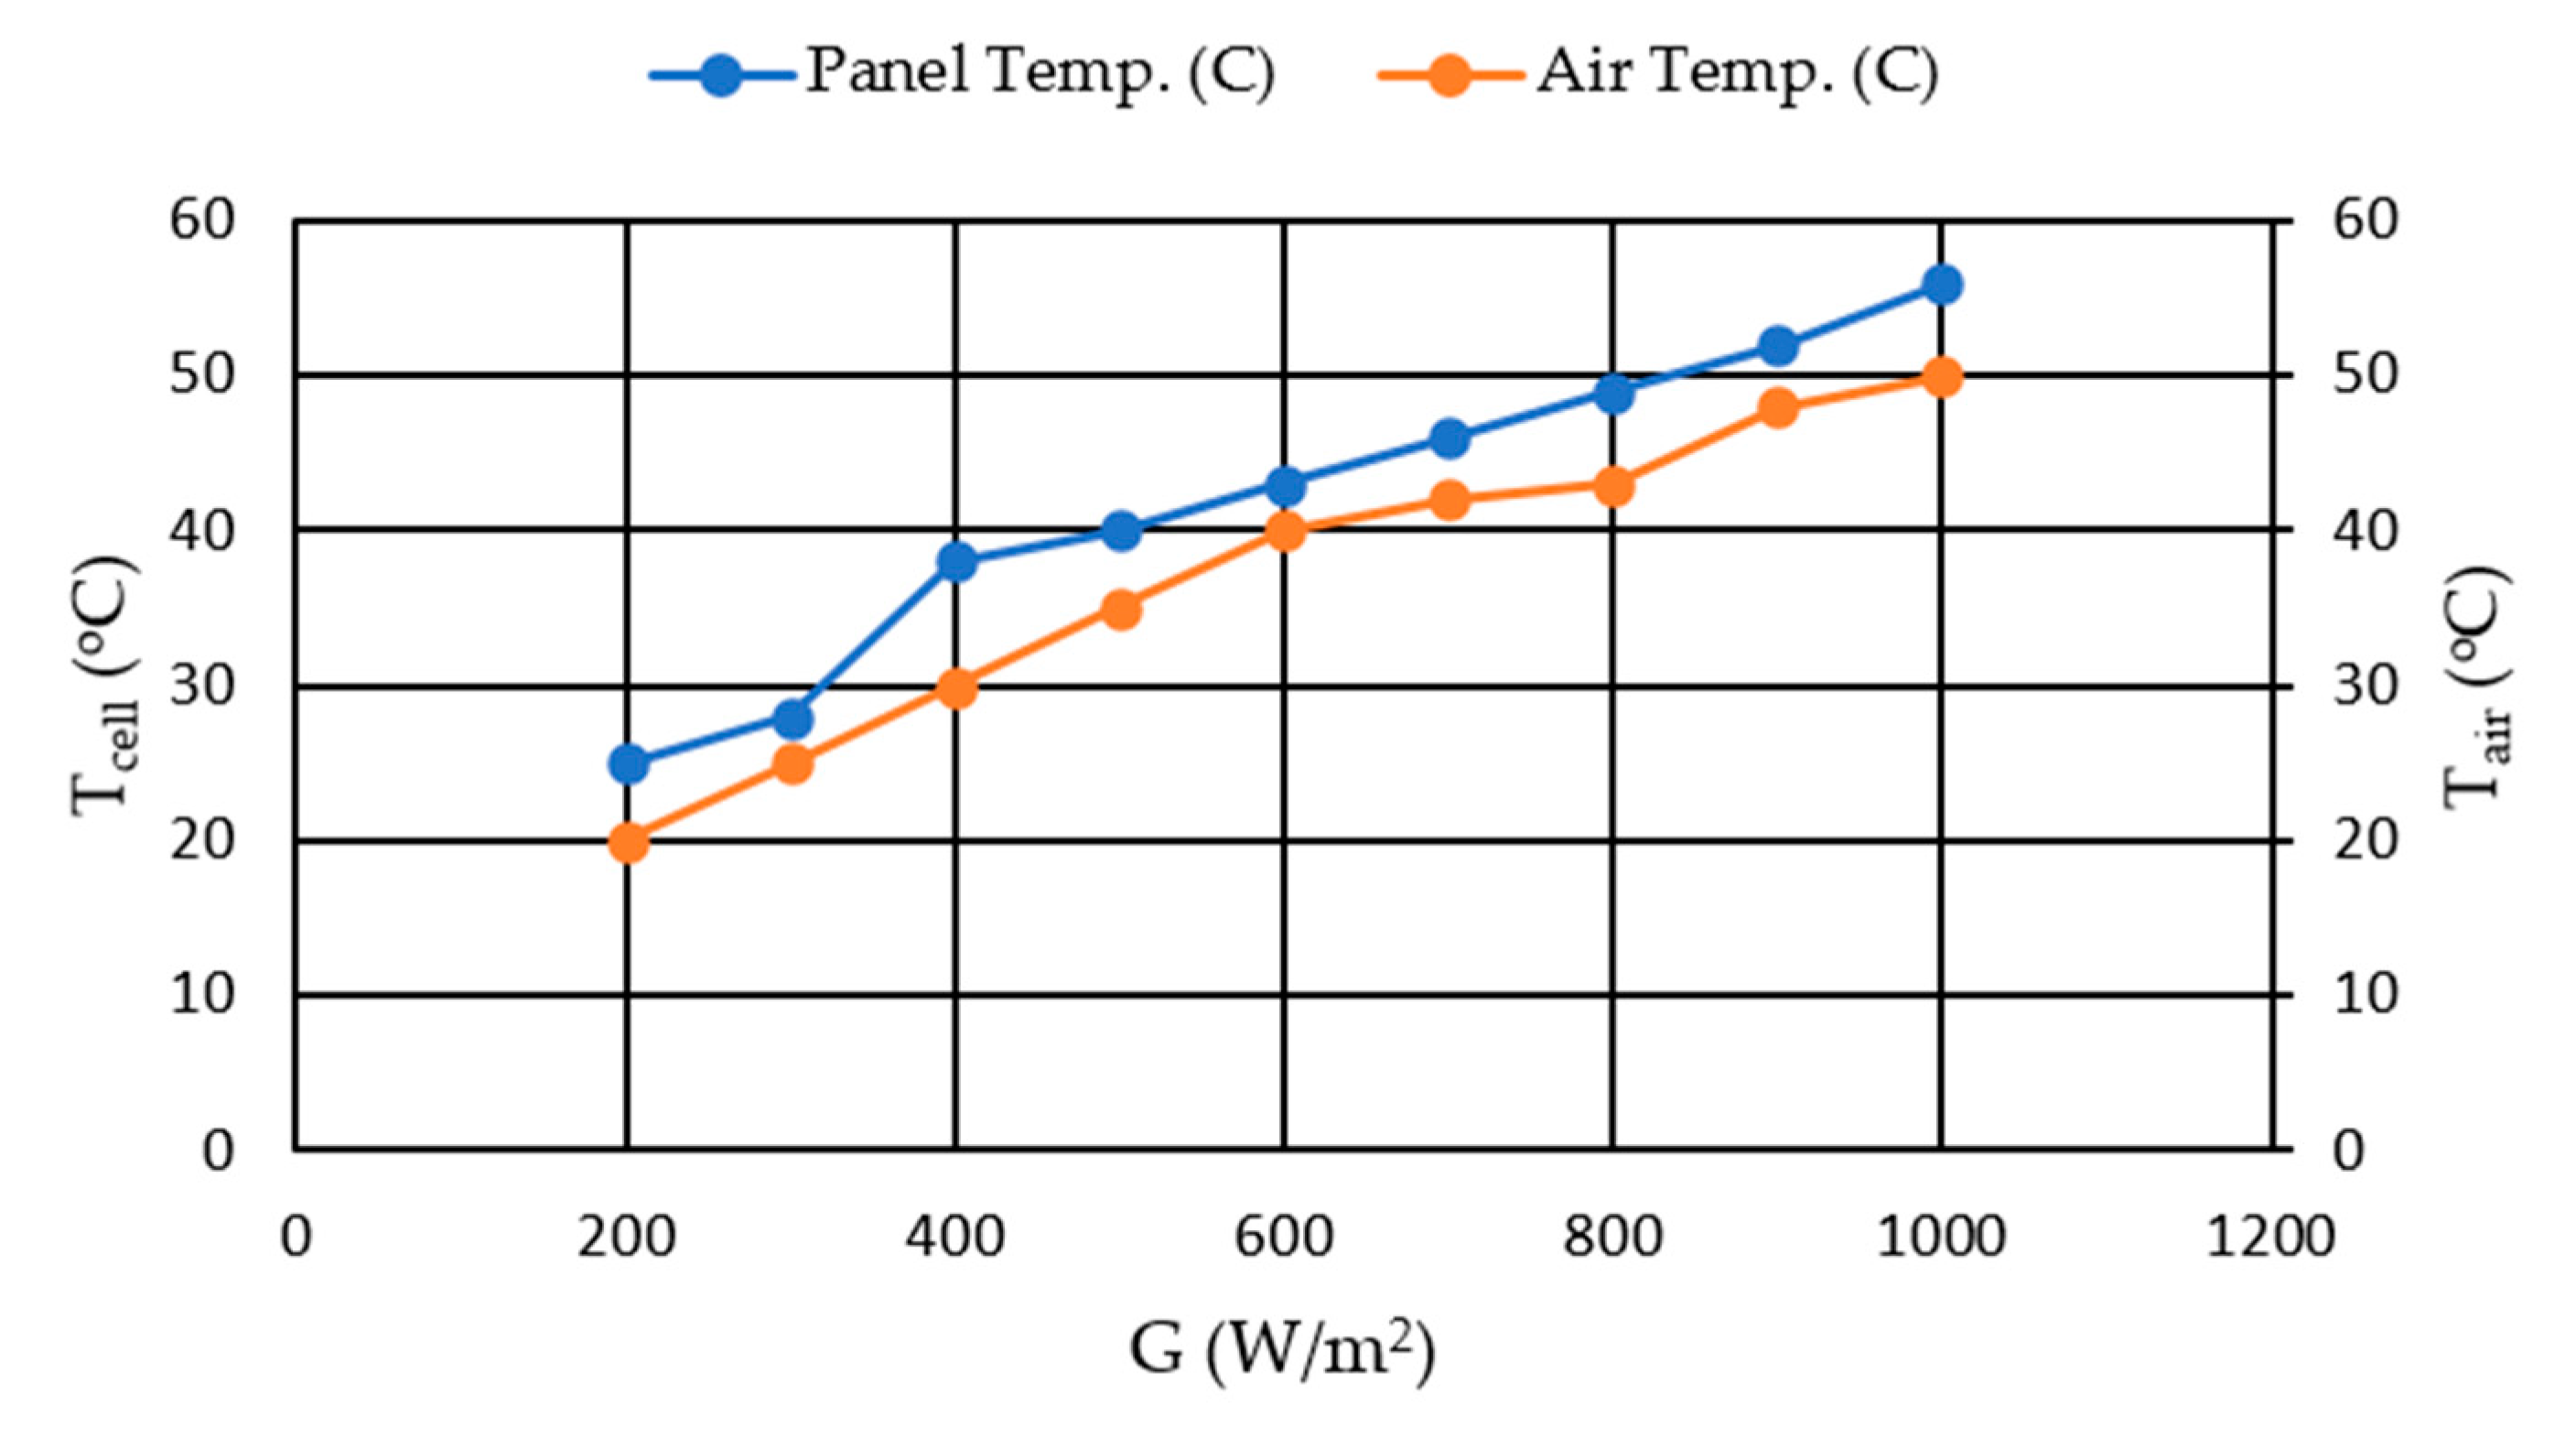
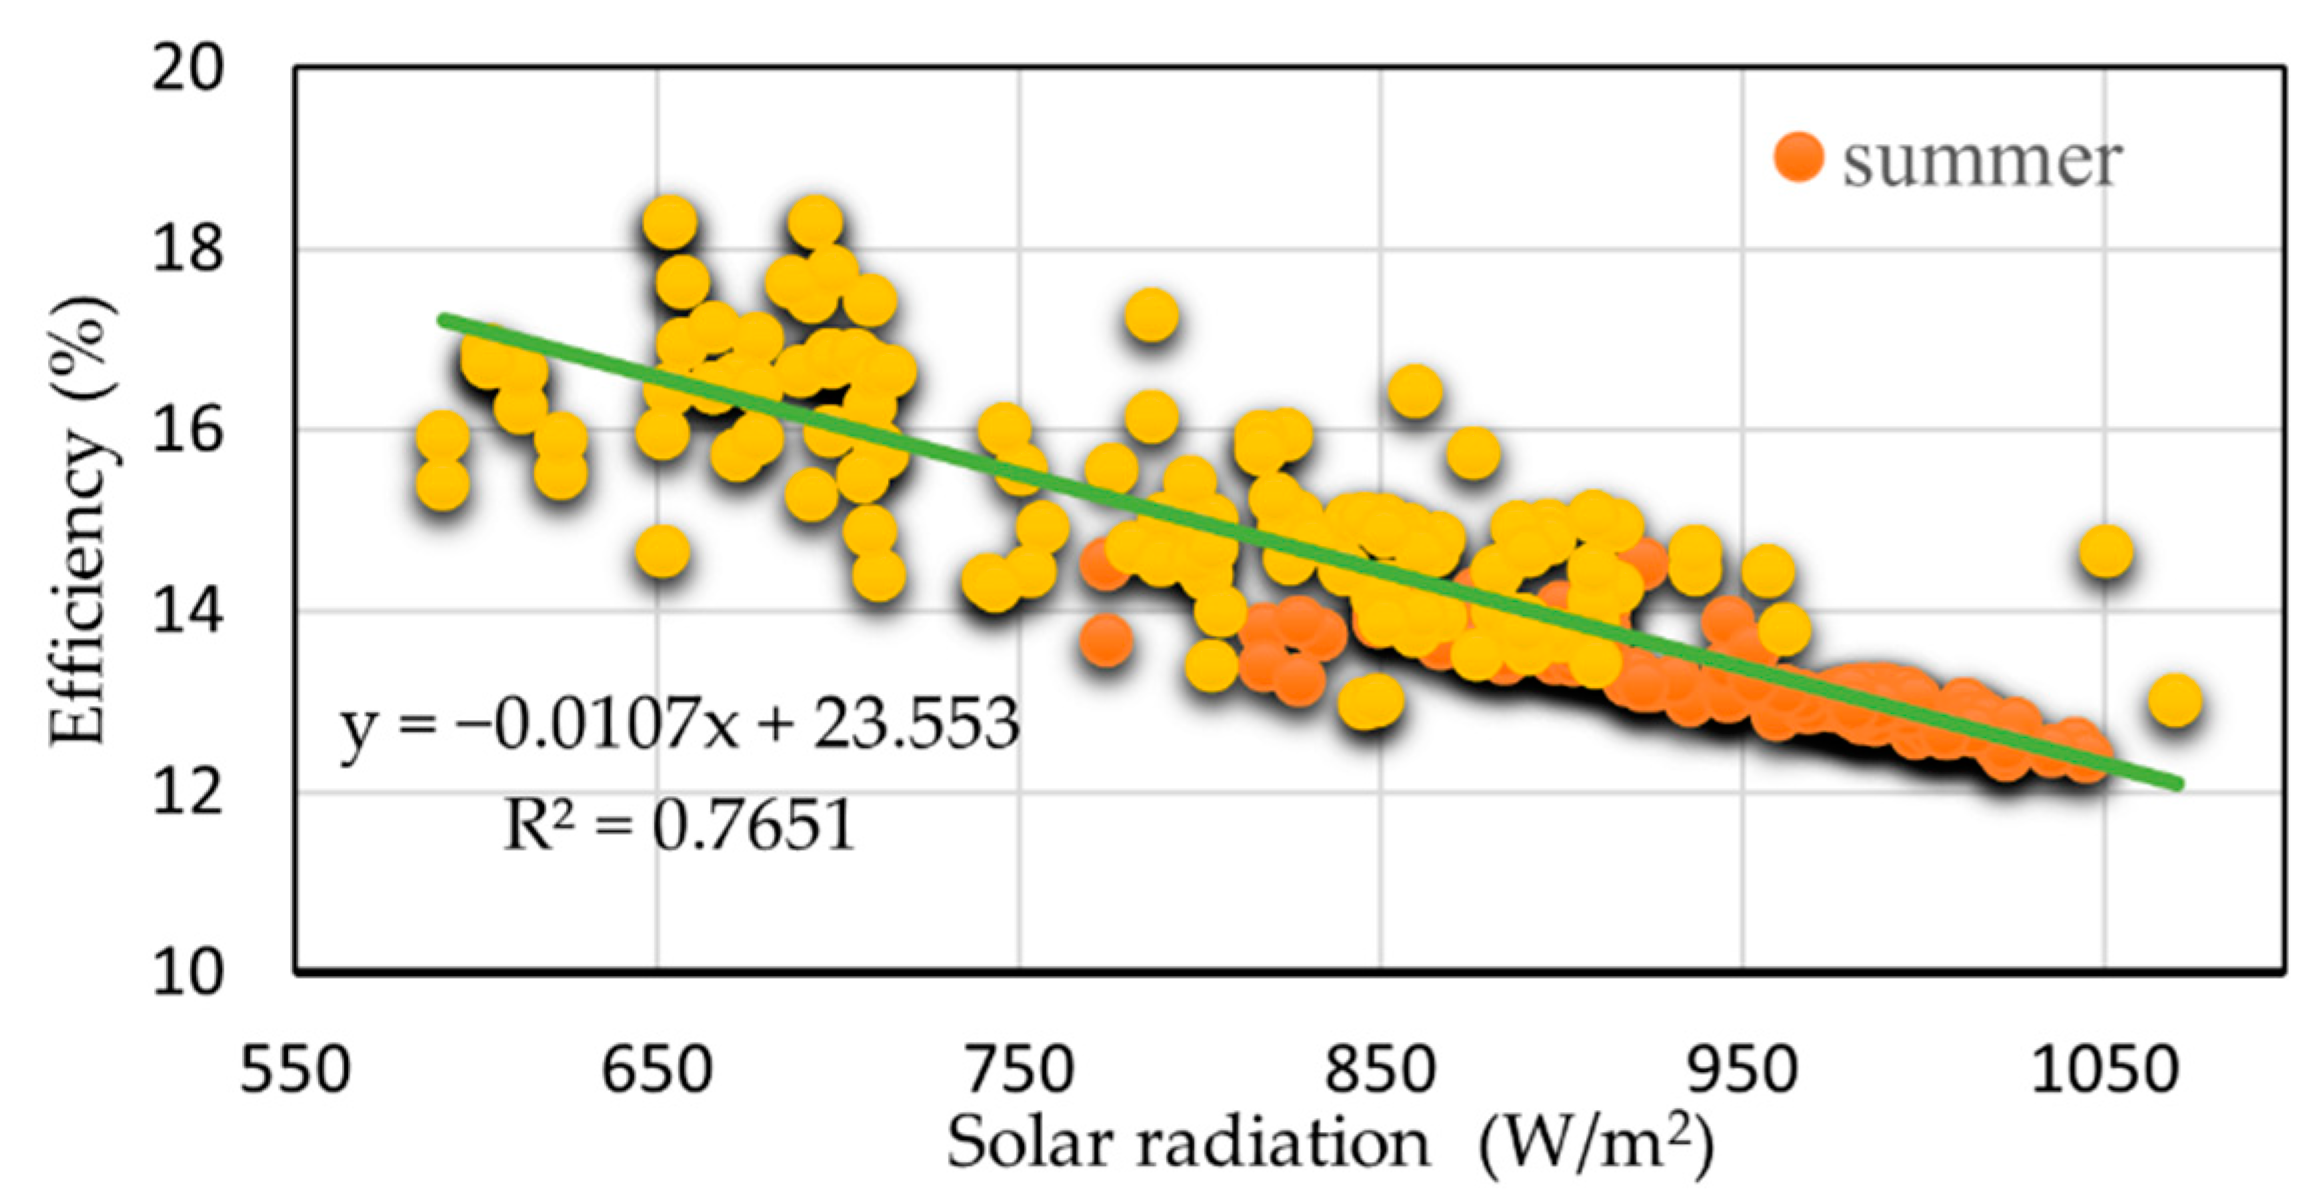
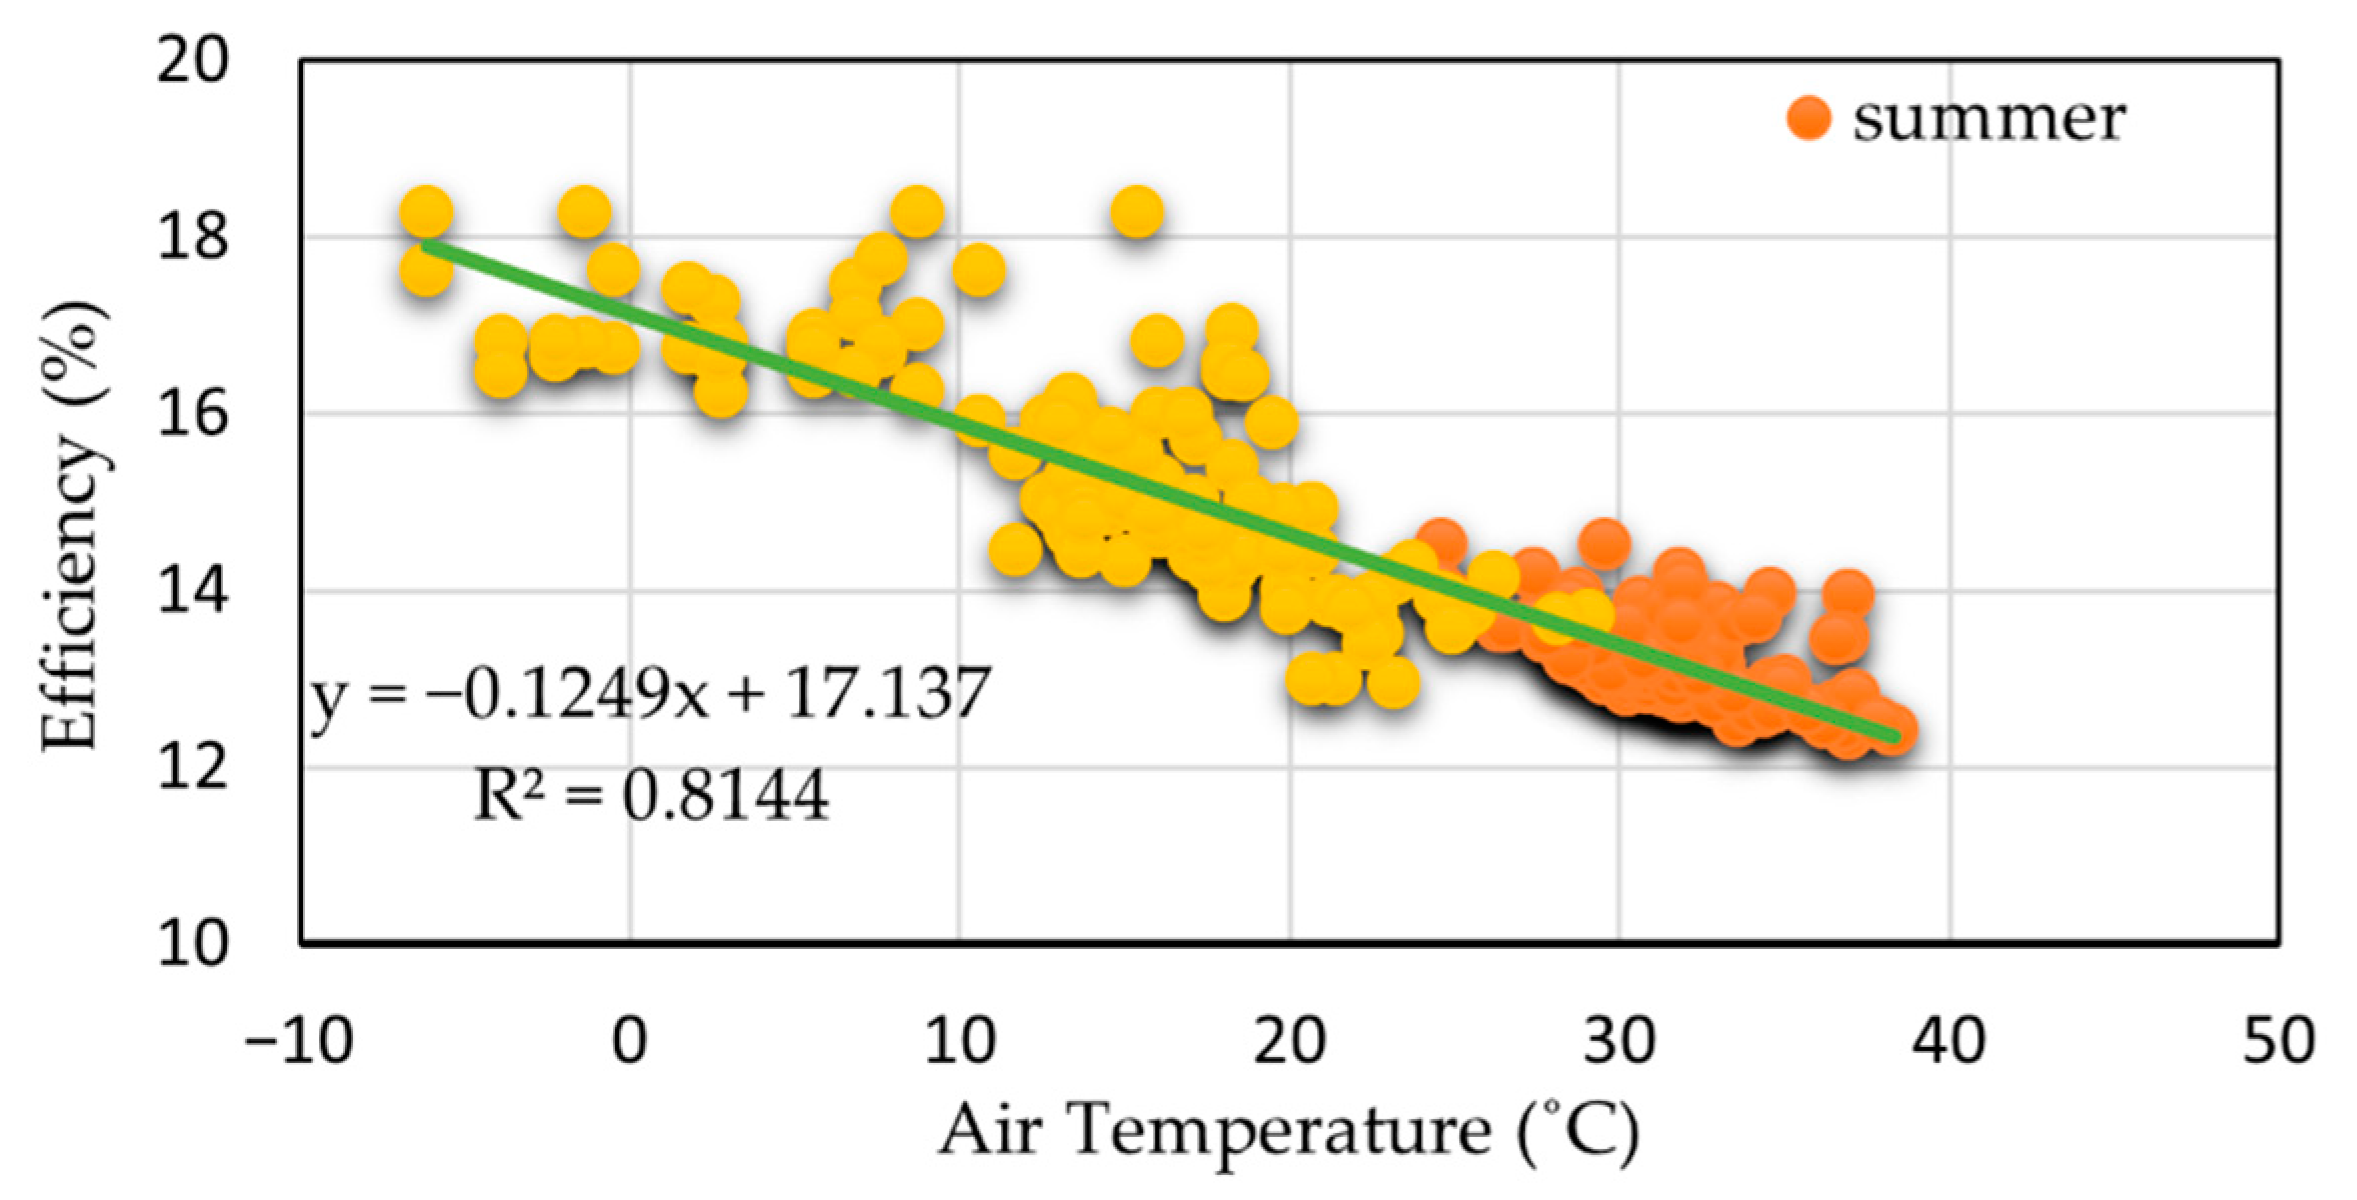
4.1. Effects of Air Temperature and Solar Radiation

As noted earlier, to show the effects of solar radiation and air temperature on 260 W panel, measurement have been done from 7 a.m. to 7 p.m. with the sampling period of 1 h for summer and winter seasons: In summer, from 22 June to 22 September 2019, two months for radiation and air temperature sampling, one month for air particles and dust sampling). In winter, from 23 September to 22 December 2019 (Two months for radiation and air temperature sampling, one month for air particles and dust sampling).
In Figure 7, power-voltage and current-voltage characteristics are shown for 35°, 260 W panel under three time periods (with different radiations and air temperatures). It can be seen that maximum and minimum output powers are reached at radiations of 1060 and 825 W/m2, respectively.
The variation of the PV efficiency for the first panel with 35° angle with solar radiation and air temperature is demonstrated in Figure 8 and Figure 9. The maximum PV efficiency is calculated during the winter season. As noted earlier, the presence of wind in winter help to keep PV temperature lower than in summer. As shown in Figure 8 and Figure 9, in the range of 650–750 W/m2 and the range of 5–10 °C maximum values of PV efficiency are obtained. The results show a correlation between output power with air temperature and solar radiation. It means increasing the air temperature due to the reverse effect on the panel’s performance reduces the output power. Furthermore, increase in solar radiation has increased the PV temperature which consequently reduced the short-circuit current. As the short-circuit current decreases, the efficiency of the PV also decreases. It is noted that, linear interpolation is used for Figure 8 and Figure 9 with R2 of 0.7651 and 0.8144, respectively.
As shown in Figure 10, by increasing the PV temperature, open-circuit voltage reduces remarkably, while the changes of short-circuit current are slightly ascending. Studying the data and diagrams obtained (Figure 10), suggest that the test results comply with what was studied in theory in Section 3.1. Further, due to the importance of the effect of solar radiation on PV temperature, the information of one day of experiment is shown in Figure 11. As is clear, solar radiation has a direct and linear effect on PV temperature.

4.2. Effects of Solar Incidence Angle

As explained before, changes in solar radiation due to shifting of seasons and installation angle can greatly affect the output power. To evaluate the power and current-voltage characteristic curve, two panels with the angle of 0° and 35° are used. Figure 12 and Figure 13 show current-voltage characteristic curve and output power of panels on the first day of summer at 32 °C and 1060 W/m2 radiation and the first day of winter at 29 °C and 860 W/m2 radiation at noon time. As shown in Figure 12a, Voc and Isc are reduced in panel with the angle of 0° because panel installation angle and solar incidence angle are not in the same direction and panel is incapable of absorbing sufficient solar radiation to generate electrical energy. However, Figure 12a is related to summer and Voc reduction in horizontal panel is effected by high air temperature too. Therefore, in this Figure Voc is under the effects of two parameters.
Also, Figure 12b shows V O C and I S C changes in winter. In this Figure, the effects of earth deviation and shifting of seasons and the importance of the panel installation angle on the panel specifications is completely clear. Based on formulas and descriptions in Section 3.1 and Figure 4 effects of solar radiation changes on Isc is in higher level. By reducing the radiation intensity in winter, Isc of the panel with angle of 35° is reduced. On the other hand, in addition to radiation intensity reduction, incapability of horizontal panel in solar radiation absorption due to inconformity with solar incidence angle has reduced the V O C and I S C . But this time the amount of V O C reduction is less than summer because of the low air temperature. Thus, V O C is reduced based on panel installation angle which changes the amount of solar radiation absorption.
In Figure 13, the differences between output powers of horizontal and 35° panels in summer and winter are shown. In winter, decreasing solar altitude angle results in 20.48% reduction of the output power of horizontal panel as compared with 35° panels. Then, not only solar altitude angle, but also tilt angle of panel affects output characteristics.
The results of measuring the specifications of the PV panels during the experiment period for investigating the effect of air temperature and solar radiation (from 22 June to 22 August and 23 September to 22 Novembe) are shown in Figure 14. This Figure shows the reduction of output power and short-circuit current of 0° panel in winter and summer as compared with 35° panels.
It is shown that output power and I S C is reduced by 11.6% and 8.76% in summer and 40.34% and 32.83% in winter, respectively. Obviously, the most reductions of output power and short-circuit current occur in winter that is significant for a small (260 W) panel.

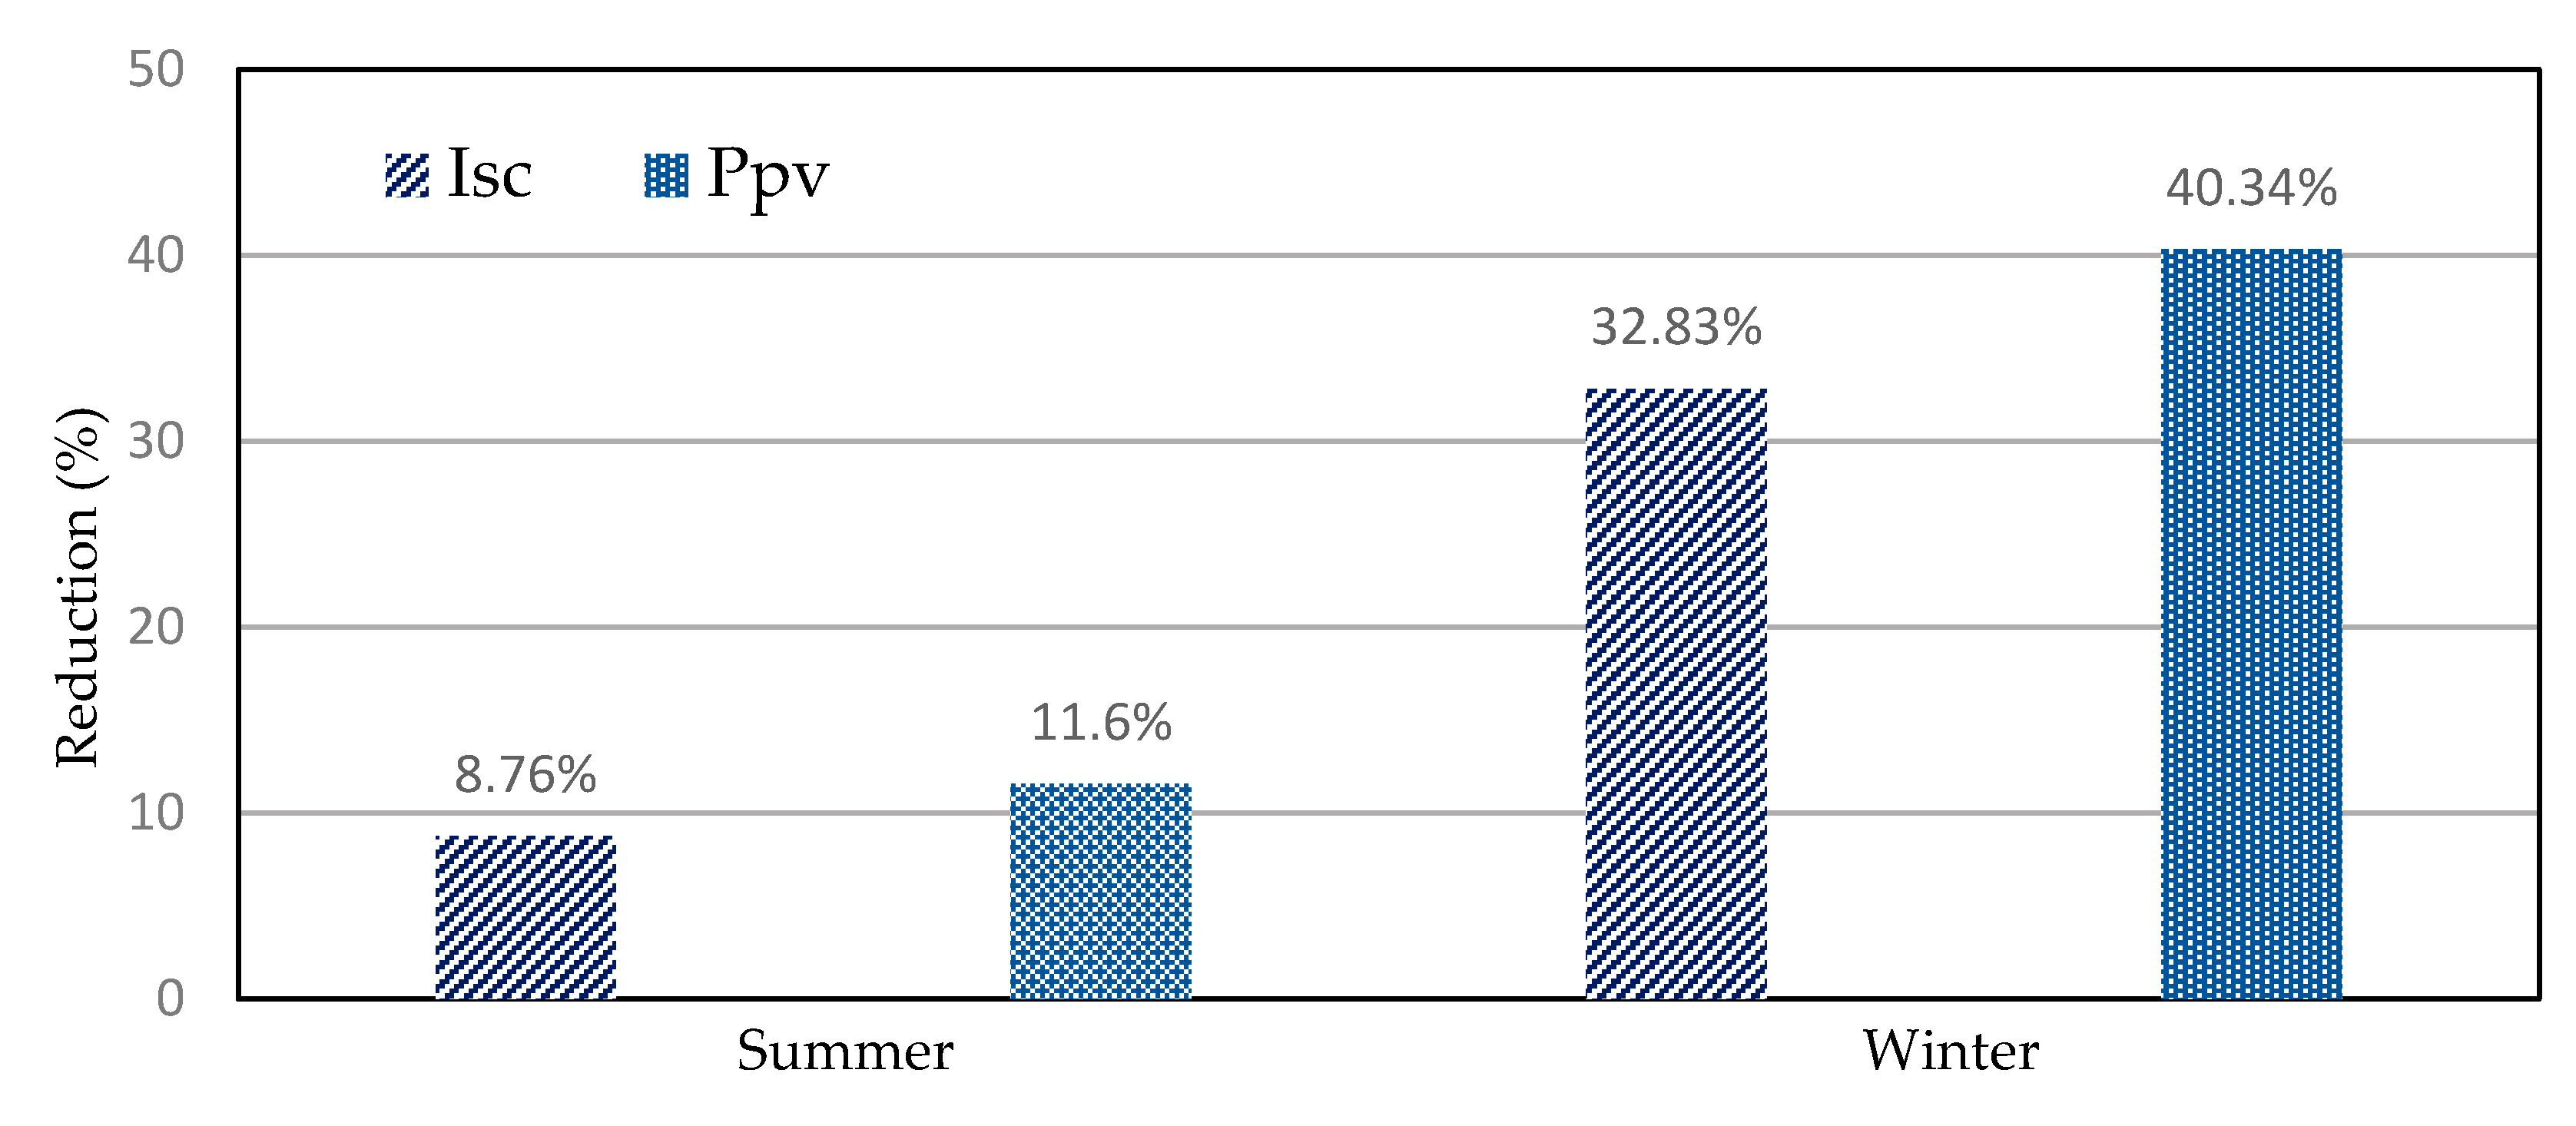
4.3. Effects of Dust

4.3.1. Dust in Air around the Panel

To evaluate existing metals, the air particles are sampled during winter and summer (six months) in clean and dirty days using the ambient sampling pump machine.
Figure 14 shows the average of the metals in the air particles in clean and dusty days that contain Al, Fe, Cr, Ni, Mn, Zn, Cd, and Pb. As shown in Figure 15, most of the particles in clean and dusty days are Al and Fe, but sampling carried out on dusty days indicates that the pollutants in the air have increased from 1.2 to 11.38 times. The remarkable point is that the highest change is related to Mn and Cd metals, which increased by 11.38 and 6.62 times, respectively. It is noted that, the least increase was 1.2 times that of Ni metal.
As noted in Section 3.3, weather change during the year not only affects the intensity of sunlight and air temperature, but also effects on the amount of dust particles in the air. The presence of particles in winter due to the air temperature inversion phenomenon is more than in the summer season. However, as shown in Figure 16, the results of the sampling in this paper indicate that in the clean days in the winter season, the particle concentration is higher than the summer season, while in dusty days, the concentration of particles in the summer season is more than the winter season.

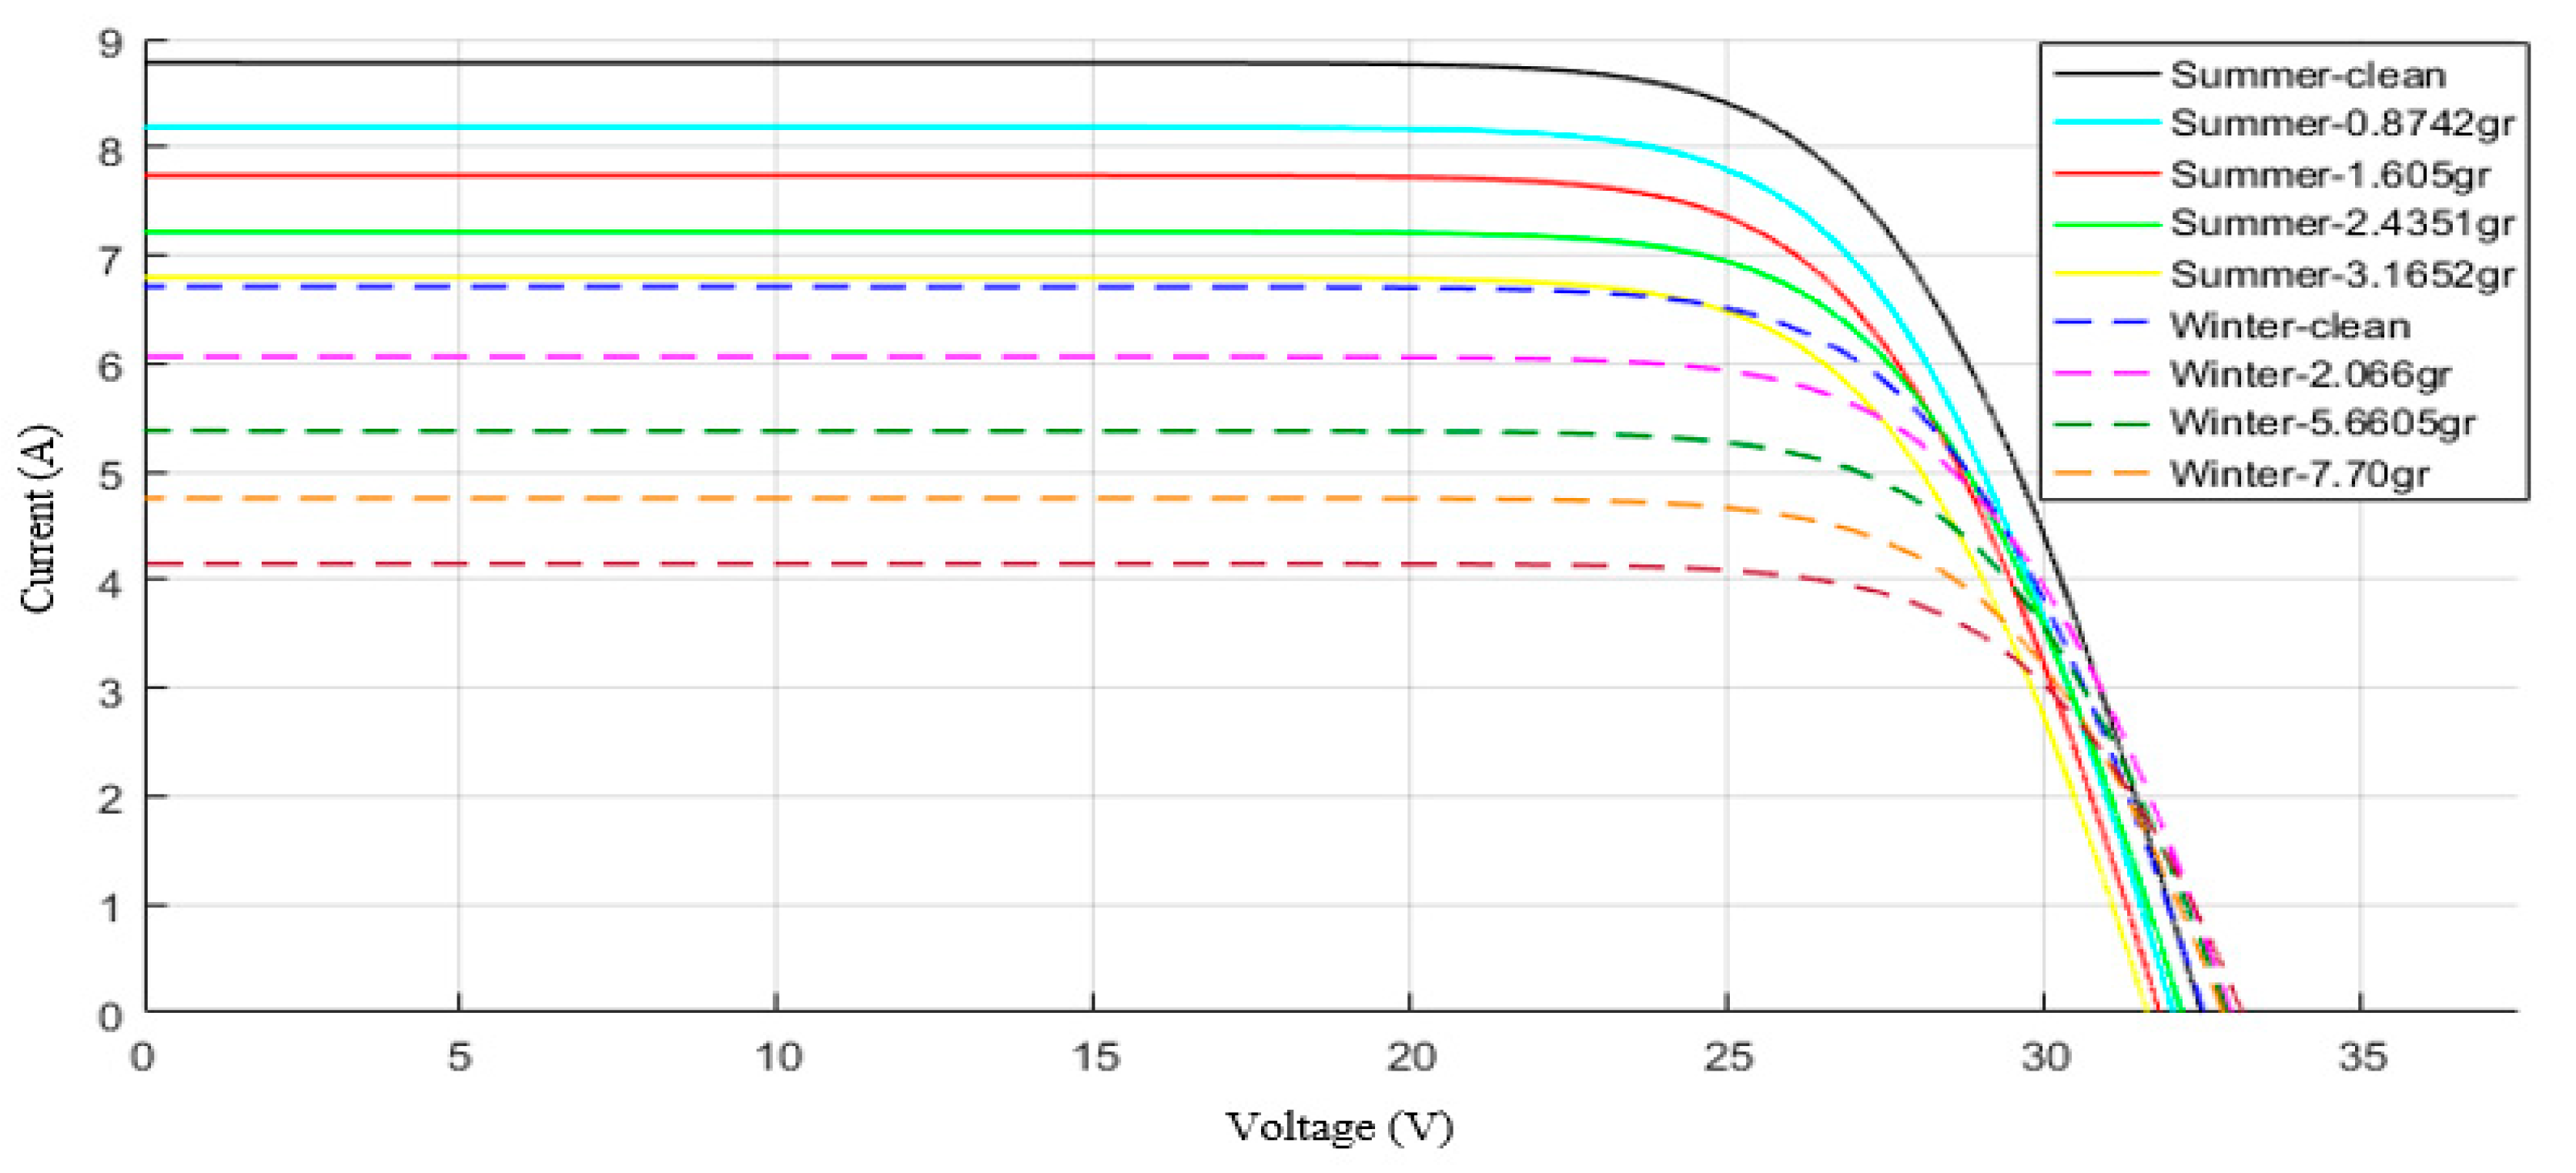
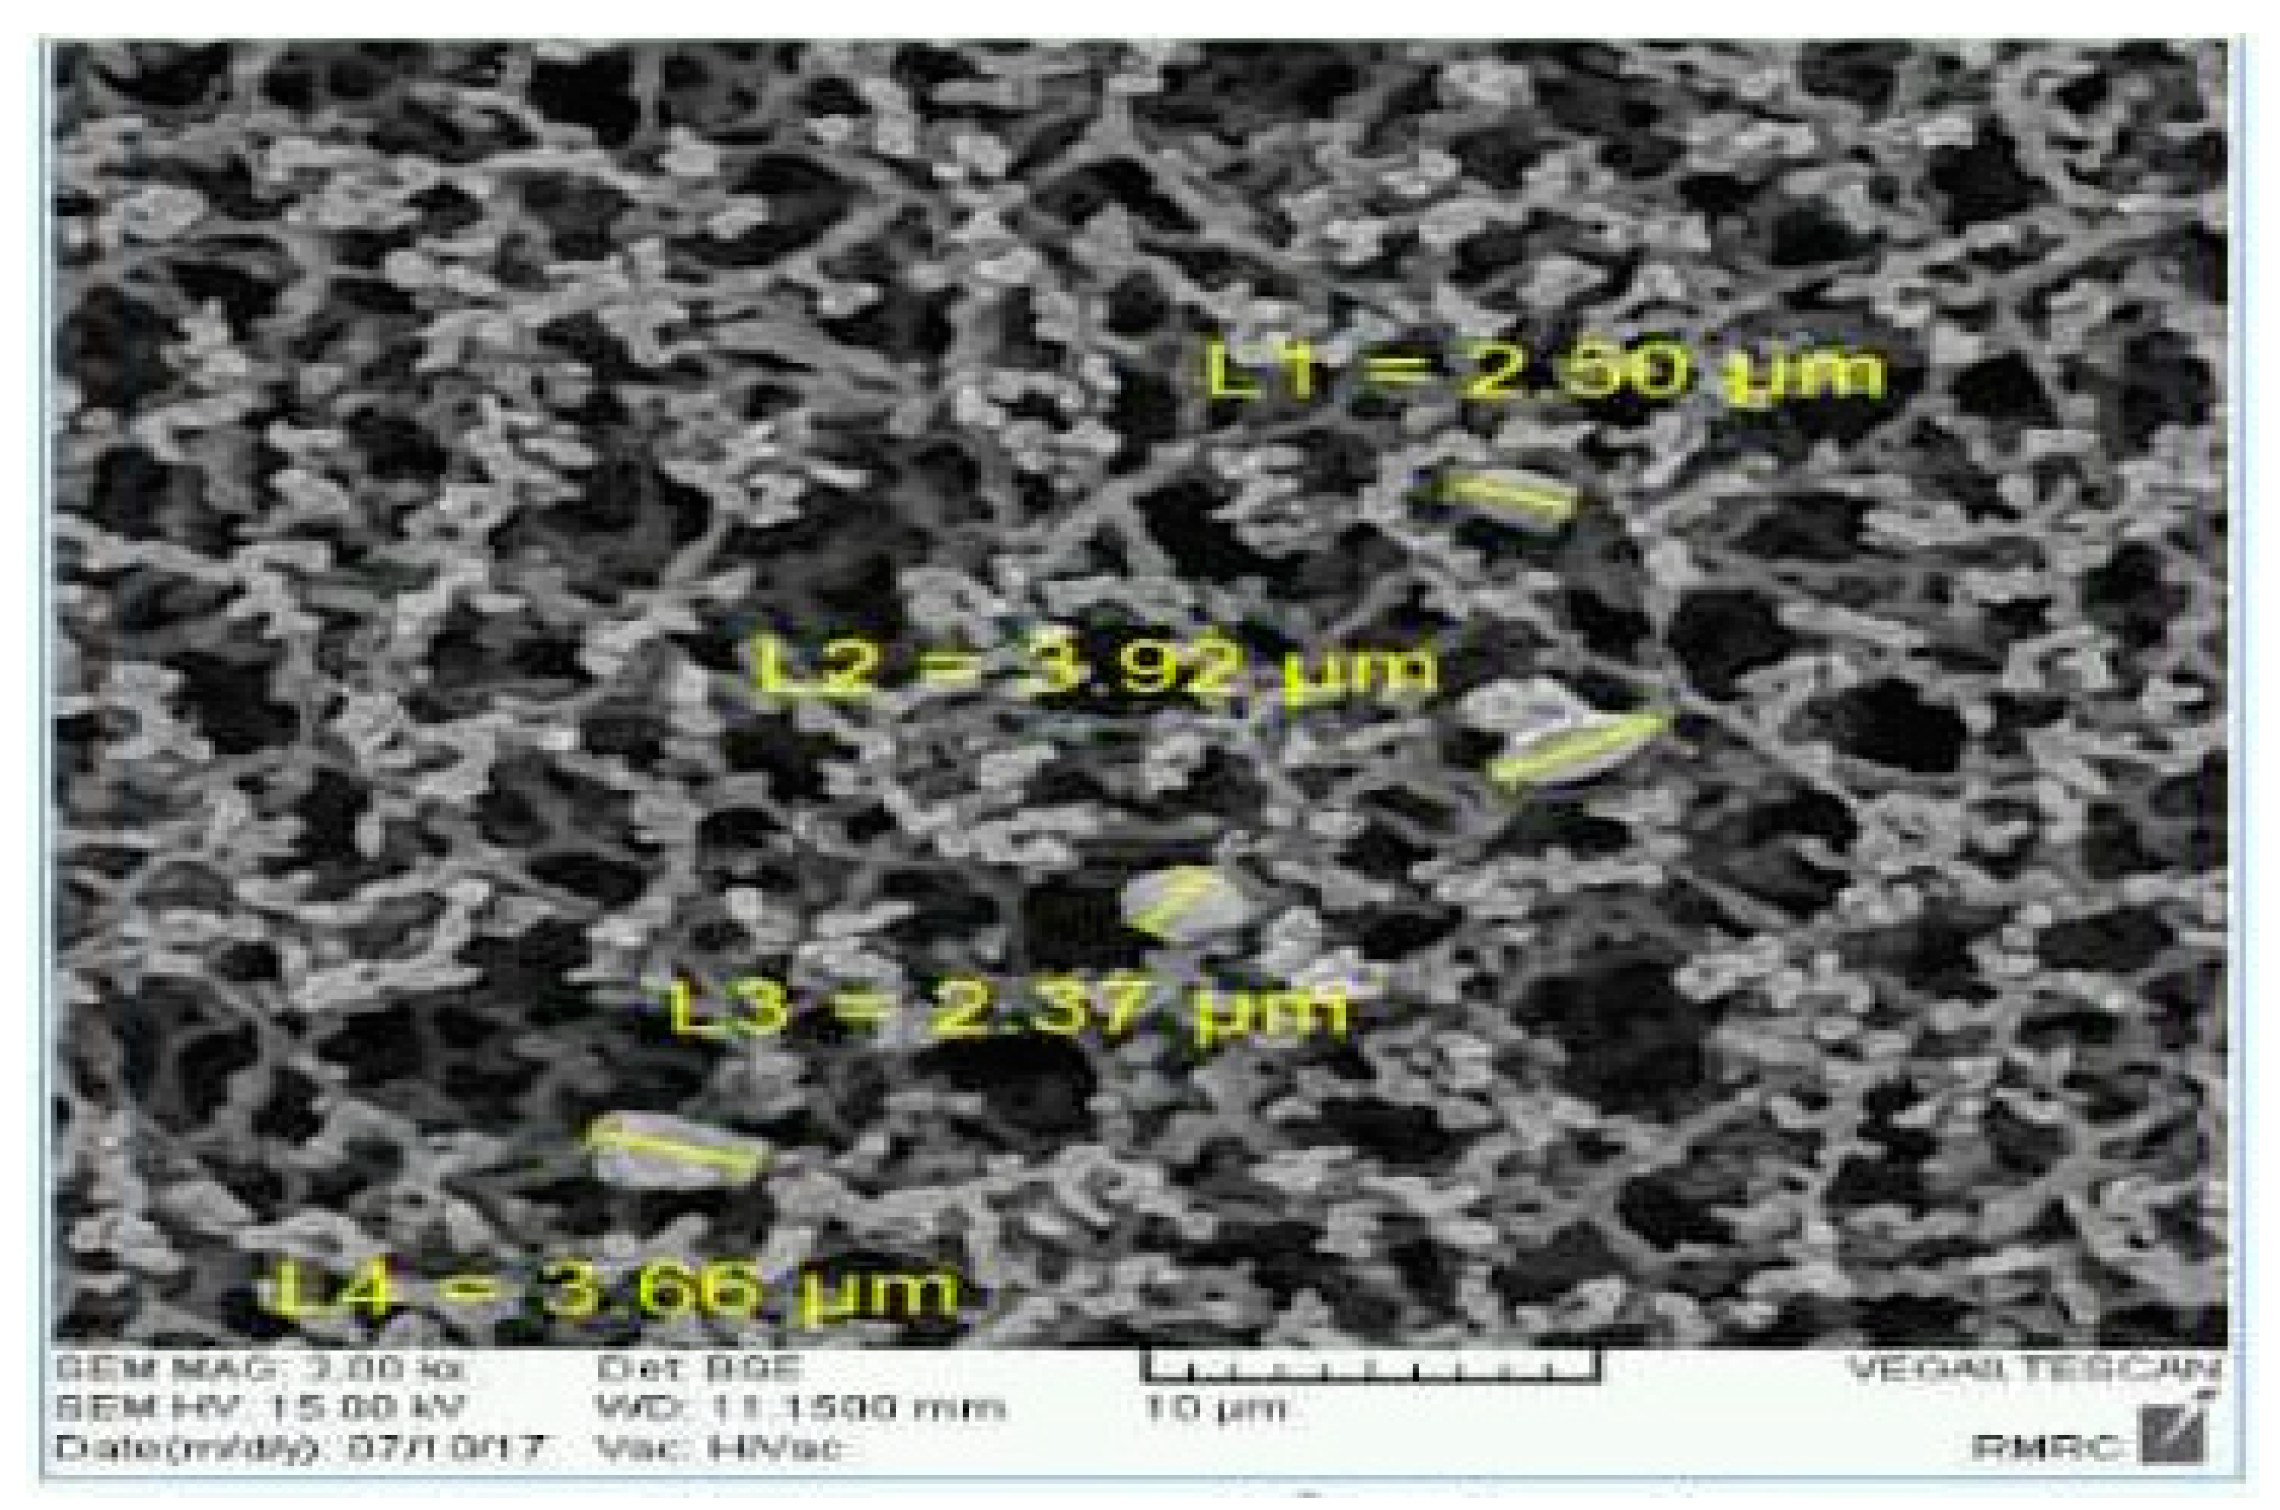
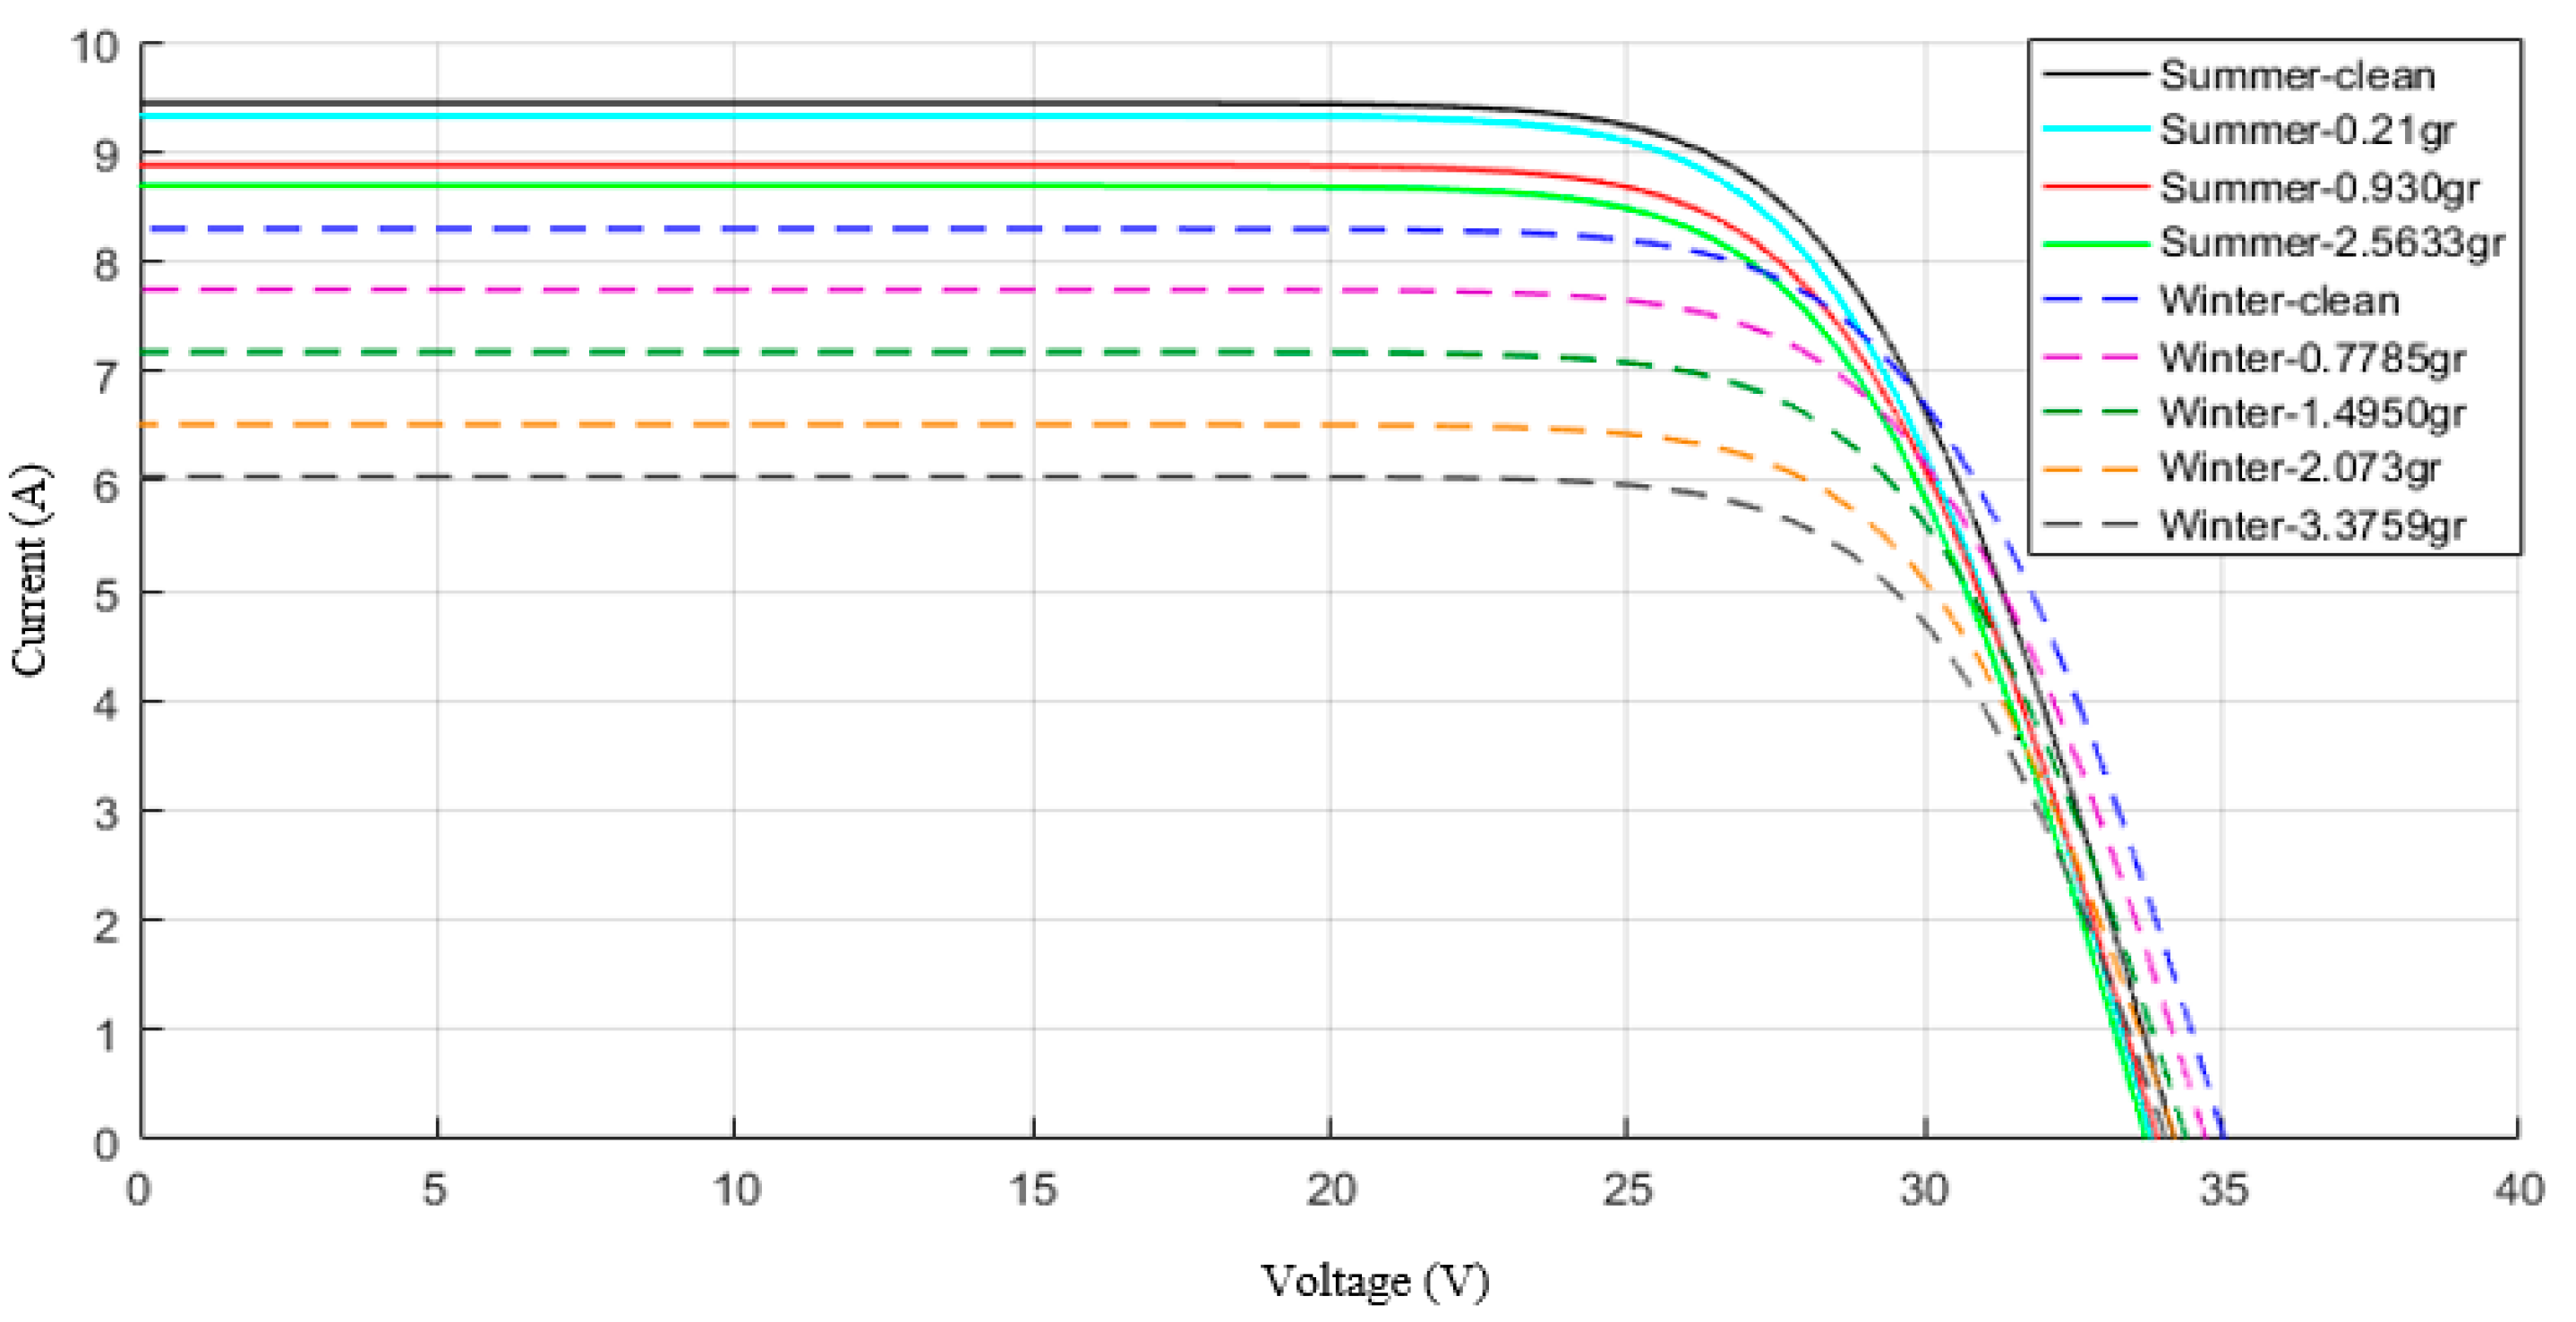
4.3.2. Dust on the Surface of the Panel

For studying the effect of dust for normal condition precisely and comparing dust accumulation on the panel surface, the sampling was done during two months (both for winter and summer). The deposition of dust in panel surfaces is shown in Figure 17.
Figure 18 shows the V O C and I S C changes for the dust deposited on the panel surface with 35° angle. Accumulated dust during one month is 2.5633 g and 3.3759 g for summer and winter, respectively. As shown in Section 4.3, air suspended particles in winter are more than in summer, and this has affected the amount of dust deposited on the panel surface.
It is cleared from Figure 18, that the most important parameter affected by this natural factor is short-circuit current. As the amount of deposited dust increases, the amount of lost current also increases. Because the short-circuit current is due to the generation and accumulation of light carriers, which are actually obtained by photon absorption and the creation of electron-hole pairs. As the accumulation of dust on panel surface prevents light absorption by solar cells that leads to light-generated carries decrement, the short-circuit current decreased.
Similar measurements are made for the horizontal panel. Accumulated dust during one month is 3.1652 g and 10.4955 g for summer and winter, respectively. The notable difference is the variation in the amount of dust deposited on the horizontal panel and 35° angle panel because of gravity impact on the installation angle. This has led to a reduction in the amount of sunlight absorbed by the panel and effect on its voltage-current. Figure 19, shows the variations of these two main parameters for the horizontal panel for the amount of deposited dust.
In Table 3, the variations of the short-circuit for 35° and horizontal panels in summer and winter are shown. It is shown that increasing accumulated dust, decreasing short-circuit current. The short-circuit current is reduced by 8.42% and 27.27% for 35° panel for summer (accumulated dust is 2.5633 g) and winter (accumulated dust is 3.3759 g), as compared with a clean panel, respectively.
The short-circuit current is reduced by 22.72% and 39.52% for horizontal panel for summer (accumulated dust is 3.1652 g) and winter (accumulated dust is 10.4955 g), as compared with a clean panel, respectively.
It is noted that the reduction of short-circuit current strongly affects the efficiency. Further, open-circuit voltage reduces only 3.14% for 35° panel when accumulated dust is 3.3759 g in winter and, it is concluded that open-circuit voltage reduction is small as compared with short-circuit current.
Samples of particles collected from panel surface are shown in Figure 20 using an electronic microscope (SEM) with resolution of approximately 20,000 times greater than imaging and analyzing. As the size of accumulated dusts is decreased, absorbed solar energy is decreased. According to Figure 20, size of particles varies between 2.37 and 3.92 microns. According to Figure 17 and Figure 18, these tiny particles, accumulated in panel surface cause reduction of absorbed solar energy and therefore, short-circuit current, and efficiency are decreased.
In order to determine structural features and recognize types and amounts of elements, X-ray fluorescence (XRF) experiment is used, and the results of which is included in Table 4. According to Table 4, there are seven types of elements forming in analyzed samples, where, SiO2, the most existing element, weighs 56.24%.

4.4. Comparison between the Effects of Air Temperature and Dust

In order to compare the effects of air temperature and dust, the results of two days, 22 June 2019 (Experiment 1) and 29 August 2019 (Experiment 2), respectively are used. Air temperature, dust, V O C , and I S C for each experiment are included in Table 5. Particles settled in experiment 1 (32 °C) and 2 (29 °C) are 0 g and 0.2135 g, respectively. The amount of dust settled in experiment 2 is greater than experiment 1 but the output power of the system has a better condition (Power increasing from 220.79 to 230.04 W). In other words, air temperature affects the output power of the panel greater than the dust settled on its surface.
As noted earlier, solar panel temperature increase results in open-circuit voltage decrease and consequently, efficiency will be decreased. In experiments 1 and 2, panel temperatures are 54.7 °C and 53.2 °C, respectively. The V-I diagram of two experiments is shown in Figure 21.

5. Conclusions

Effects of parameters such as solar radiation, dust, and air temperature for two seasons (winter and summer) in urban climate for two panels with different installation angles were studied separately in this study. The results from four months of sampling (two months in winter and two months in summer) show that solar radiation increasing results in output power increasing. Inversely, air temperature affects the panel performance negatively and causes output power decrement. Therefore, air temperature reduction and wind blow result in improvement of panel performance. This finding complies with having better efficiency in winter in comparison to summer. Shifting of seasons and solar incidence angle demonstrates that the output power of panels in winter decreases by 6.72% and 20.09% for angled and horizontal panels, respectively, in comparison to summer. For the horizontal panel case, the installation angle is also important. It is because that gravitation force results in accumulation of dust that causes reduction of absorbed solar energy. Futhermore, in winter, a decrease of solar altitude angle results in air temperature reduction that affects output power, significantly.
Studying the dust factor suggests that among air pollutants, Al and Fe metals have the most particles for clean days, and Mn and Cd have the most particles in the air for dusty days. Moreover, dusty days of summer have more pollutant percentage in comparison to winter, while the amount of pollutants in clean days of winter is higher than in summer. Therefore, the amount of particles settling on the surface of both panels in this season is higher which leads to a significant decrease of short-circuit current and output power. The power generated in summer is significantly more than in winter because the most amount of dust is settled on panels in winters. A more precise study shows that size of settling particles ranges from 2.37 pm to 3.92 µm. This very small size of particles obstructs solar radiation absorption in panels.
For future works, it is recommended to experimentally investigate other real conditions such as humidity in different cities with different weather. Recently, PV/T panels are used for providing heat and power simultaneously as detailed in [34,35]. Obviously, weather conditions have significant effects on PV/T panels and therefore, it is recommended to investigate the effects of real conditions on the performance of PV/T panels.

Author Contributions

Conceptualization, M.Z.F. and S.S.; methodology, M.Z.F. and M.E.N.; validation, M.E.N., S.S. and M.S.-k.; investigation, M.Z.F., M.E.N., M.S.-k. and S.S.; writing—original draft preparation, M.Z.F.; visualization, M.Z.F.; supervision, S.S.; funding acquisition, M.S.-k. All authors have read and agreed to the published version of the manuscript.

Funding

This research received no external funding.

Informed Consent Statement

Not applicable.

Data Availability Statement

Data sharing is not applicable to this article.

Acknowledgments

The authors would like to acknowledge the Renewable Energy Research Section of Niroo Research Institute (NRI), Tehran, Iran, for providing all the facilities and support required to make this study successful.

Conflicts of Interest

The authors declare no conflict of interest.

References

  1. Chan, D.S.H.; Phang, J.C.H. Analytical methods for the extraction of solar-cell single-and double-diode model parameters from I-V characteristics. IEEE Trans. Electron Devices 1987, 34, 286–293. [Google Scholar] [CrossRef]
  2. Elminir, H.K.; Benda, V.; Tousek, J. Effects of solar irradiation conditions and other factors on the outdoor performance of photovoltaic modules. J. Electr. Eng. Bratisl. 2001, 52, 125–133. [Google Scholar]
  3. Jehad, A.; Alaa, F.; Ahmed, A.-S. Temperature Effect on Performance of Different Solar Cell Technologies. J. Ecol. Eng. 2019, 20, 249–254. [Google Scholar]
  4. Nascimento, L.R.D.; Braga, M.; Campos, R.A.; Naspolini, H.F.; Rüther, R. Performance assessment of solar photovoltaic technologies under different climatic conditions in Brazil. Renew. Energy 2020, 146, 1070–1082. [Google Scholar] [CrossRef]
  5. Hammad, B.; Al-Abed, M.; Al-Ghandoor, A.; Al-Sardeahe, A.; Al-Bashir, A. Modeling and analysis of dust and temperature effects on photovoltaic systems’ performance and optimal cleaning frequency: Jordan case study. Renew. Sustain. Energy Rev. 2018, 82, 2218–2234. [Google Scholar] [CrossRef]
  6. Zitouni, H.; Merrouni, A.A.; Regragui, M.; Bouaichi, A.; Hajjaj, C.; Ghennioui, A.; Ikken, B. Experimental investigation of the soiling effect on the performance of monocrystalline photovoltaic systems. Energy Procedia 2019, 157, 1011–1021. [Google Scholar] [CrossRef]
  7. Chen, Y.; Iu, Y.L.; Tian, Z.; Dong, Y.; Zhou, Y.; Wang, X.; Wang, D. Experimental Study on the Effect of Dust Deposition on Photovoltaic Panels. Energy Procedia 2019, 158, 483–489. [Google Scholar] [CrossRef]
  8. Liu, S.; Yue, Q.; Zhou, K.; Sun, K. Effects of Particle concentration, deposition and accumulation on Photovoltaic device surface. Energy Procedia 2019, 158, 553–558. [Google Scholar] [CrossRef]
  9. Dash, P.K.; Gupta, N.C. Effect of Temperature on Power Output from Different Commercially available Photovoltaic Modules. Int. J. Eng. Res. Appl. 2015, 5 Pt 1, 148–151. [Google Scholar]
  10. Babatunde, A.A.; Abbasoglu, S.; Senol, M. Analysis of the impact of dust, tilt angle and orientation on performance of PV Plants. Renew. Sustain. Energy Rev. 2018, 90, 1017–1026. [Google Scholar] [CrossRef]
  11. Bouraiou, A.; Hamoud, M.; Chaker, A.; Neçaibia, A.; Mostefaoui, M.; Boutasseta, N.; Ziane, A.; Dabou, R.; Sahouane, N.; Lachtar, S. Experimental investigation of observed defects in crystalline silicon PV modules under outdoor hot dry climatic conditions in Algeria. Sol. Energy 2018, 159, 475–487. [Google Scholar] [CrossRef]
  12. Darwish, Z.A.; Kazem, H.A.; Sopian, K.; Alghoul, M.A.; Alawadhi, H. Experimental investigation of dust pollutants and the impact of environmental parameters on PV performance: An experimental study. Environ. Dev. Sustain. 2018, 20, 155–174. [Google Scholar] [CrossRef]
  13. Ramli, M.A.M.; Prasetyono, E.; Wicaksana, R.W.; Windarko, N.A.; Sedraoui, K.; Al-Turki, Y.A. On the investigation of photovoltaic output power reduction due to dust accumulation and weather conditions. Renew. Energy 2016, 99, 836–844. [Google Scholar] [CrossRef]
  14. Gaglia, A.G.; Lykoudis, S.; Argiriou, A.A.; Balaras, C.A.; Dialynas, E. Energy efficiency of PV panels under real outdoor conditions an experimental assessment in Athens, Greece. Renew. Energy 2017, 101, 236–243. [Google Scholar] [CrossRef]
  15. Gholami, A.; Khazaee, I.; Eslami, S.; Zandi, M.; Akrami, E. Experimental investigation of dust deposition effects on photo-voltaic output performance. Sol. Energy 2018, 159, 346–352. [Google Scholar] [CrossRef]
  16. Salari, A.; Hakkaki-Fard, A. A numerical study of dust deposition effects on photovoltaic modules and photovoltaic-thermal systems. Renew. Energy 2019, 135, 437–449. [Google Scholar] [CrossRef]
  17. Mostefaoui, M.; Ziane, A.; Bouraiou, A.; Khelifi, S. Effect of sand dust accumulation on photovoltaic performance in the Saharan environment: Southern Algeria (Adrar). Environ. Sci. Pollut. Res. 2019, 26, 259–268. [Google Scholar] [CrossRef]
  18. Chaichan, M.T.; Abass, K.I.; Kazem, H.A. Dust and Pollution Deposition Impact on a Solar Chimney Performance. Int. Res. J. Adv. Eng. Sci. 2018, 3, 127–132. [Google Scholar]
  19. Khanjari, Y.; Kasaeian, A.B.; Pourfayaz, F. Evaluating the environmental parameters affecting the performance of photovoltaic thermal system using nanofluid. Appl. Therm. Eng. 2017, 115, 178–187. [Google Scholar] [CrossRef]
  20. Nasrin, R.; Hasanuzzaman, M.; Rahim, N.A. Effect of high irradiation on photovoltaic power and energy. Int. J. Energy Res. 2017, 42, 1–17. [Google Scholar] [CrossRef]
  21. Dida, M.; Boughali, S.; Bechki, D.; Bouguettaia, H. Output power loss of crystalline silicon photovoltaic modules due to dust accumulation in Saharan environment. Renew. Sustain. Energy Rev. 2020, 124, 1–13. [Google Scholar] [CrossRef]
  22. Theristis, M.; Fernández, E.F.; Georghiou, G.E.; O’Donovan, T.S. Performance of a concentrating photovoltaic monomodule under real operating conditions: Part II—Power rating. Energy Convers. Manag. 2018, 156, 329–336. [Google Scholar] [CrossRef]
  23. Alnasser, T.M.A.; Mahdy, A.M.J.; Abass, K.I.; Chaichan, M.T.; Kazem, H.A. Impact of dust ingredient on photovoltaic performance: An experimental study. Sol. Energy 2020, 195, 651–659. [Google Scholar] [CrossRef]
  24. Amiry, H.; Benhmida, M.; Bendaoud, R.; Hajjaj, C.; Bounouar, S.; Yadir, S.; Raïs, K.; Sidki, M. Design and implementation of a photovoltaic I-V curve tracer: Solar modules characterization under real operating conditions. Energy Convers. Manag. 2018, 16, 9206–9216. [Google Scholar] [CrossRef]
  25. Pelle, M.; Lucchi, E.; Maturi, L.; Astigarraga, A.; Causone, F. Coloured BIPV Technologies: Methodological and Experimental Assessment for Architecturally Sensitive Areas. Energies 2020, 13, 4506. [Google Scholar] [CrossRef]
  26. Liu, B.Y.H.; Jordan, R.C. The interrelationship and characteristics and distribution of direct, diffuse and total solar radiation. Sol. Energy 1960, 4, 1–19. [Google Scholar] [CrossRef]
  27. Farahmand, M.Z.; Nazari, M.E.; Shamlou, S. Optimal Sizing of an Autonomous Hybrid PV-Wind System Considering Battery and Diesel Generator. In Proceedings of the Iranian Conference of Electrical Engineering (ICEE), Tehran, Iran, 2–4 May 2017; pp. 1048–1053. [Google Scholar]
  28. Calogirou, S.A. Solar Energy Engineering: Processes and Systems; Academic Press: Dordrecht, The Netherlands, 2009. [Google Scholar]
  29. Gray, G.L. The Physics of the Solar Cell, The Physics of the Solar Cell; John Wiley & Sons, Ltd.: London, UK, 2003; pp. 61–112. [Google Scholar]
  30. Wark, K.; Warner, C.; Davis, W. Air Pollution: Its Origin and Control; Addison-Wesley: Reading, MA, USA, 1998. [Google Scholar]
  31. Yaghoobi, Z.S.; Nazari, M.E.; Safdarian, F. Comparison between the Optimal Sizing of a Photovoltaic System in Interconnected and Isolated Modes Using Gravitational Search Algorithm. In Proceedings of the 2018 1st International Conference on Advanced Research in Engineering Sciences (ARES), Dubai, United Arab Emerites, 15 June 2018; pp. 1–6. [Google Scholar]
  32. Safdarian, F.; Nazari, M.E. Optimal Sizing of a Solar-Thermal Collector for Residential Applications Using Gravitational Search Algorithm. Int. J. Mech. Eng. Autom. 2015, 2, 497–505. [Google Scholar]
  33. Safdarian, F.; Nazari, M.E. Optimal tilt angle and orientation for solar collectors in Iran, Diagnostics for Electrical Machines. In Proceedings of the IEEE 10th International Symposium on Diagnostics for Electrical Machines, Power Electronics and Drives (SDEMPED), Guarda, Portugal, 1–4 September 2015; pp. 494–500. [Google Scholar]
  34. Namnabat, M.; Nazari, M.E. The Effects of PV/T Utilization on Short-Term Scheduling of Integrated Distributed CHP System. In Proceedings of the Electrical Power Distribution Conference (PSC), Khorramabad, Iran, 19–20 June 2019; pp. 1–6. [Google Scholar]
  35. Bernusi, F.; Nazari, M.E. Optimal sizing of hybrid PV/T-fuel cell CHP system using a heuristic optimization algorithm. In Proceedings of the International Power System Conference, Tehran, Iran, 9–11 December 2019; Volume 1, p. 7. [Google Scholar]
Figure 1. Installed panels for the experiment at study.
Energies 14 00845 g001
Figure 2. The measuring tools used in the experiments: (a) Solar PV System Tester, (b) HT304N, (c) Mettler AT201, (d) Ambient sampling pump machine.
Energies 14 00845 g002
Figure 3. Flowchart of experiment steps.
Energies 14 00845 g003
Figure 4. Effects of (a) solar radiation in constant 25 °C and (b) air temperature shift in constant 1000 W/m2 radiation on P-V characteristic curve [28].
Energies 14 00845 g004
Figure 5. The hourly solar radiation and corresponding air temperature for summer and winter (Tehran, Iran).
Energies 14 00845 g005
Figure 6. The voltage-current and generated power diagrams expected from the panel in standard and the first day of the experiment.
Energies 14 00845 g006
Figure 7. Power-voltage and current-voltage characteristics for 35°, 260 W panel. (a) Voltage-Current diagram, (b) Power-Voltage diagram.
Energies 14 00845 g007
Figure 8. Relation between efficiency and solar radiation.
Energies 14 00845 g008
Figure 9. Relation between efficiency and air temperature.
Energies 14 00845 g009
Figure 10. Relation between PV (a) voltage-PV temperature and (b) current-PV temperature.
Energies 14 00845 g010
Figure 11. Relation between solar radiation and panel temperature (1 August 2019).
Energies 14 00845 g011
Figure 12. Voltage-current diagram of tilted and horizontal panels. (a) summer, (b) winter.
Energies 14 00845 g012
Figure 13. Power–Voltage diagram of tilted and horizontal PV panels. (a) summer, (b) winter.
Energies 14 00845 g013
Figure 14. Power output and I S C reduction due to summer and winter seasons and solar incidence angle.
Energies 14 00845 g014
Figure 15. The aerosols for clean and polluted days.
Energies 14 00845 g015
Figure 16. Concentration of particles in the summer and winter seasons.
Energies 14 00845 g016
Figure 17. The dust settled on the panel surface.
Energies 14 00845 g017
Figure 18. V-I changes for the dust deposited on the panel surface with 35° angle.
Energies 14 00845 g018
Figure 19. V-I changes for the dust deposited on the horizontal panel surface.
Energies 14 00845 g019
Figure 20. Results of SEM analysis.
Energies 14 00845 g020
Figure 21. Comparison of V–I and generated power diagrams for tilted panel in experiments 1 and 2.
Energies 14 00845 g021
Table 1. Properties of 260 W mono-silicon panel under standard test condition.
Maximum Power (W)Open-Circuit Voltage (V)Maximum Power Point Voltage (V)Short-Circuit
Current (A)
Maximum Power Point Current (A)
26037.931.68.738.24
Efficiency (%)Dimensions (L/W/H)TC Isc (%/K)TC Voc (%/K)TC Pmpp (%/K)
16.25L = 1675/W = 1001/H = 310.004−0.3−0.45
Table 2. Weather conditions for the first day (22 June 2019) of the experiment at morning time.
Parameters Air   Temperature   ( ° C ) Solar   Radiation   ( W / m 2 ) Humidity (%) Wind   Speed   ( m / s ) PM 2.5PM 10CO O 3
Value29953135.868524160
Table 3. Short-circuit current variation in terms of dust deposition.
PanelSeasonSummerWinter
Tilted Paneldeposited dust (g)clean0.210.9302.5633clean0.77851.49502.0733.3759
Isc9.59.48.98.78.257.87.156.56
Isc reduction (%)-1.056.318.42-5.4513.3321.2127.27
Horizontal Paneldeposited dust (g)clean0.87421.6052.43513.1652clean2.0665.66057.7010.4955
Isc8.88.27.77.26.86.786.085.354.84.1
Isc reduction (%)-6.8112.518.1822.72-10.3221.0929.2039.52
Table 4. Elements forming particle samples resulting from XRF analysis.
CombinationMgOK2OAl2O3CaOSiO2La&LuSO3
Weight (%)7.342.6817.331156.24<15.34
Table 5. Conditions and numerical results of the experiments performed to study the effect of air temperature and dust on performance of the panel.
ExperimentPower (W)Air Temperature (°C)Accumulated Dust (g)Solar Radiation (W/m2)Humidity (%)Wind Speed (m/s)PM 2.5PM 10
1220.793201060135.17256
2230.04290.21351062185.15347
Publisher’s Note: MDPI stays neutral with regard to jurisdictional claims in published maps and institutional affiliations.

