Article

The Development of the Temperature Disturbance Zone in the Surrounding of a Salt Cavern Caused by the Leaching Process for Safety Hydrogen Storage

1
Department of Fossil Fuels, Faculty of Geology, Geophysics and Environmental Protection, AGH University of Science and Technology, al. Mickiewicza, 30-059 Kraków, Poland
2
Department of Renewable Energy and Environmental Research, Mineral and Energy Economy Research Institute of the Polish Academy, Wybickiego 7, 31-261 Krakow, Poland
3
Department of Petroleum Engineering, Faculty of Drilling, Oil and Gas, AGH University of Science and Technology, al. Mickiewicza 30, 30-059 Kraków, Poland
*
Authors to whom correspondence should be addressed.
Energies 2021, 14(4), 803; https://doi.org/10.3390/en14040803
Submission received: 10 September 2020 / Revised: 25 January 2021 / Accepted: 28 January 2021 / Published: 3 February 2021
(This article belongs to the Section A5: Hydrogen Energy)

Abstract

:
This article presents an estimation of the temperature decrease in the vicinity of a salt cavern due to its leaching. The one-dimensional radially symmetry models of a salt cavern were considered and described. The initial temperature of rock salt massif was assumed as 50 C and temperature of leaching water varied seasonally from 6 C to 20 C. A significant influence of the season of the leaching process, beginning on the final temperature distribution was found. The model takes into account: convection coefficient changes depending on temperature of brine and rock formation and heat effects caused by salt dissolution. Numerical results are compared with measurements data on the field of cavern volume increasing with time as the function of flow of leaching water and its temperature. The accuracy of the cavern volume increasing versus time was assumed as good—both quantitative and qualitative.

1. Introduction

The phenomenon of temperature decrease in the vicinity of leached cavern is commonly known, but research on its impact on caverns convergence rate has began recently. A number of publications are dedicated to the issues that are related to the potential use of salt domes as thermally anomalous structures for obtaining thermal energy [1], heat production by cooling discharged brines and hydrocarbons stored in salt caverns [2]. The production of thermal energy from highly saturated brine is inherently associated with the precipitation of solids in system components. This problem is actually observed in case of brine with saturation significantly differ from equilibrium saturation. There are many publications dedicated to this phenomenon in the case of solutions that are related to the geothermal energy production [3,4]. The effect of cooling of the rock salt massif in the vicinity of leached caverns is related with the injection of leaching water where the temperature is significantly lower than initial temperature of the rock salt massif and it usually is similar to the temperature of the atmospheric air. Additionally, the rock salt dissolution is an endothermic process.
Cavern operations, like leaching, undergoes changes in its pressure and temperature. These changes can affect cavern integration and lead to hydrogen losses to surrounding rocks. Furthermore, network-base clusters of hydrogen cavern required the sufficient tightness of individual storage unit. Hydrogen invasion can weaken the neighbouring caverns structure caverns structure [5]. Hydrogen migration is driven by the Darcian flow type, according to Liu et al. [6]. In order to provide sufficient cavern hydrogen-tight, permeability in near cavern zone should be less than 10 18 m2. A major key factor is thermal tensile stresses by thermos-mechanical loading [7,8]. All of the potential hazards coming from thermal stresses must be concerned for design criteria, operation, and safety [9]. Temperature variation during cavern operation could trigger the progressive micro cracking of salt structure [10], thus it is important is to establish the proper model of temperature propagation outside the cavern unit. Recently, models available in the literature have focused on thermodynamic process inside the cavern [11]; in our papers we would like to extend the investigation of cavern influence on joined rocks. Many authors aligned with the scope of this work put effort in establishing trustworthy and efficient forecast models of cavern behaviour in terms of the thermodynamic as well as geomechanical point of view. Sedaee et al. deploy a comprehensive model of salt cavern system contain subsystems of individuals elements. Benefit is shown on integration leaching and the operation process of cavern development [12]. Yu et al. proposed a methodology of cavern monitoring under diverse conditions that are capable of predicting a thermal-hydraulic state in uncertainty [13]. Liu et al.’s approach based on commercial software COMSOL established a possible way of gas leakage and roots of roof collapse in gas cavern [14].
The initial temperature of rock salt massif changes linearly with depth. For example, in the salt domes of Central-Poland in the depth range of 1000–1500 m below ground level, what is optimal for location of natural gas storage caverns as well can be utilized for a further hydrogen storage [15,16,17] temperature range between 40 C and 60 C. The temperature of fresh water used for leaching ranges between a few and some twenty degrees, depending on the season.
The article presents the degree of rock salt massif cooling in the vicinity of the cavern, which is leached not only for brine exploitation, but also for hydrocarbons or hydrogen storage. In particular, the second application was the reason for interest in the phenomenon of cooling of the rock mass, which causes the reduction of cavern convergence rate, especially in the first years of operation [18] and it can cause higher stress near the cavern zone, which may lead to increased hydrogen leakage [19]. In the presented paper, a semi-analytical method for predicting the volume and temperature distributions near a cavern zone was established.

2. Material and Methods

2.1. Characteristics of Salt Cavern Leaching Process

From the physical point of view, the assessment of the cooling extent is very complex, because it is associated with a number of following phenomena:
  •   endothermic process of salt dissolving,
  •   heat transfer between the cavern filling brine and rock salt massif,
  •   heat transfer within the cavern filling brine, and
  •   heat transfer in the rock salt massif.
These phenomena occur on a large scale. In the final stage of cavern leaching process, its volume may reach several hundred thousand cubic meters and its shape is often irregular, resulting in an increase in the heat transfer surface. A priority in designing the technologies of leaching storage cavern is to achieve an optimal shape of cavern. The time of leaching is also very important and the brine concentration is less significant. Technologies of salt cavern leaching are presented in detail in publications [20,21]. In practice, leaching is carried out in several zones at different depths. Exploitation and casing pipes are periodically lifted, as shown in Figure 1.
In every stage of leaching, casing pipe was located in the top of leaching zone and fresh water was injected in the bottom part of leaching zone. Formula (1) describes the rate of cavern walls leaching [21]:
ω c b , t b , ψ , h = k ψ , h 1 + β t b t 0 c s a t t b c b c s a t t b 3 2
While assessing the extent of cooling of rock salt massif, the temperature distribution inside the cavern shown in Figure 2 is very important. The presented results are derived from a geophysical study of the cavern leached by the direct circulation method. As a result of the brine mixing, the temperature at the center of the cavern does not change with depth. Differences in the course of the curves are seasonal in nature, i.e., brine temperature during autumn is higher than in spring. The temperature distributions that are presented in Figure 2 indicate that the extent of cooling of the rock salt massif could be analyzed applying one-dimensional models, while assuming that the temperature in the axis of the cavern is constant over the entire height of the cavern and, thus, the temperature of the rock salt massif only varies horizontally along the radius of the model.
In the following analysis, the results obtained with two models were compared. The first model takes the increase of the cavern radius over time into account (full model–full version) and the second model assumes a constant target volume of the cavern (simplified model). In the simplified model, on one hand, the endothermic nature of rock salt dissolution is neglected (which results in an overvaluation of brine temperature) and, on the other hand, constant dimensions of the cavern are assumed, which results in an underestimation of the temperature in the rock salt massif.

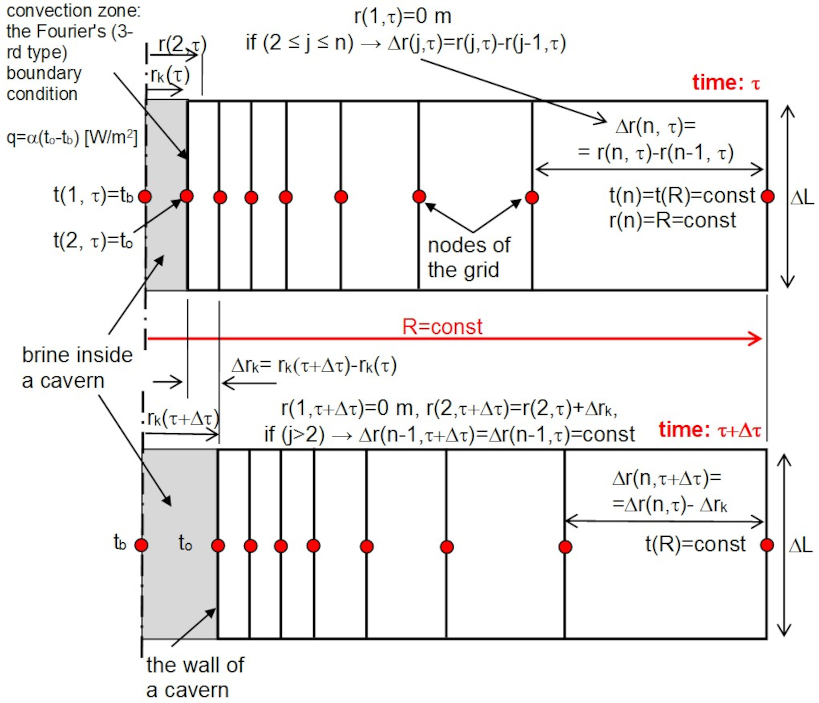
2.2. Numerical Model of the Cavern Leaching Process and Rock Salt Massif Cooling

The article presents the results of three calculation scenarios, further called the variant models. In two models that are referred to as the full ones, an increase in the length of the cavern radius over time and the temperaturevariation of the leaching medium in the range of 6 to 20 C (depending on the season) is assumed. The full models differed in the beginning and completion season of the leaching process (summer, winter). The simplified model assumes a constant (target) radius of the cavern and the constant temperature of the leaching water of 13 C.

2.3. Full Model Description

In the following, a description of the algorithm of the full model formulas used in the study is presented.
  • The cavern radius change over time
The presented numerical model of salt cavern leaching process takes the propagation of temperature changes in the rock salt massif caused by the leaching process into account. The leaching rate was determined while using a mathematical formula describing this parameter as a function of the brine temperature and concentration. Thus, the defined rate of cavern leaching is expressed as an increase in the cavern radius in subsequent time steps by Equation (2):
Δ r c τ + Δ τ = ω c b , t b , ψ , h Δ τ
  • Thermal conduction in the vicinity of the cavern
The modeling of the thermal wave propagation due to cavern leaching process was carried out in radial symmetry at the depth of the target location of cavern center. As the permeability of salt is approx. 10 20 m2, it was assumed that the rock salt occurring around the leached cavern is a non-porous and non-fractured medium. Constant values of thermal conductivity, specific heat, and density (shown in the examples of calculation) are assumed. The heat transfer in transient conditions in the vicinity of the cavern, neglecting convection and regarding above assumptions, has been described by the Fourier equation, which, under the conditions of circular symmetry, takes the following form (3):
t τ = λ c ρ 2 t r 2 + 1 r r r
The equation of heat transfer was solved by the finite difference method while using the explicit scheme.
  • Discretization criteria and boundary conditions in the vicinity of salt cavern
Figure 3 illustrates the space discretization and boundary conditions scheme.
The consideration of dynamic process of leaching required the modification of calculation mesh. It was assumed that calculation mesh was modified in such a way that the radius of the model (R) remained constant (Figure 3). The changes in geometry of the modeled zone that are caused by the dissolution of successive salt layers in the vicinity of salt cavern are expressed by a reduction of the last calculation element dimension and an increase of the first element (representing salt cavern). Size of the remaining calculation elements is constant Figure 3). The way of the boundary conditions setting and the grid geometry modification assumed that the target radius R of the model extended beyond the range of thermal effects of the cavern leaching process.
The calculations which results are presented in the following part of the article were performed in the following grid nodes that were located in the axis of the grid: 0.00, 0.50, 0.75, 1.19, 1.84, 2.83, 4.30, 6.52, 9.84, 14.83, 22.30, 33.51, 50.33, 100.00, and 200.00 m. The coordinates of grid nods are expressed in meters. The distance between the grid nods according to the assumed methodology have not changed during the calculation, except for the first (from the axis of caverns) and last nods. The time step of calculations was constant at 375 s (i.e., 6.25 min). According to Wisniewski and Wisniewski [22], the convergence criterion of applied numerical method describes the relationship (4):
Δ x 2 λ c ρ Δ τ α Δ x λ 2 + 1 + 1 Δ τ Δ x 2 λ c ρ α Δ x λ 2 + 1 + 1
The maximal time step is estimated to be 1585.3 s (i.e., approx. 26.4 min). It is defined on the basis of Equation (4) while taking the values of the above-presented thermophysical properties of rock salt and maximal values of convective heat transfer of 500 W/(m 2 C) [23] and the minimum value of the spatial grid step Δ x = 0.25 m (i.e., 0.75 m–0.50 m) into account. Such a defined value of maximal time step meets the criterion of convergence of the numerical model. In order to solve the heat transfer equation, the first-type boundary condition was defined, which assumed that the temperature of the rock salt at a sufficient distance R from the axis of the cavern is constant. On the surface of the cavern wall, the third-type boundary condition was defined, concerning temperature in the cavern and the value of coefficient of convective heat transfer ( α ) between the cavern wall and brine filling cavern. The value of approx. 200 W/(m 2 C) of the coefficient α was estimated in the article [24] on the basis of characteristic numbers analysis and empirical data from the Underground Gas Storage Facility of Mogilno. In this article, the value of coefficient α is expressed by the following empirical formula that was applied for water and natural convection conditions by Equation (5) [25]:
α = 26.358 t b + 8.382 0.6189 | t b t 0 | 1 / 3
The application of above formula for brine is a simplification of the model. It was assumed that the temperature of the brine throughout the cavern is the same. Thus, the convection heat transfer coefficient typical for discussed process can be estimated at approx. 200 W/(m 2 C), as was estimated by (Kunstman, Urbańczyk 1995). The problem requires further study; however, it can be supposed that the value of coefficient α is at least as much as assumed, i.e., that intensity of heat transfer may be even greater. The temperature of the brine in the cavern was determined at each time step, depending on the temperature difference between the leaching water and the cavern wall, the enthalpy stream of the leaching water, and the amount of salt that has dissolved in the brine filling the cavern. The model assumes that the enthalpy of sodium chloride dissolution in the water was determined as Δ h N a C l = 66.22 kJ/kg (the standard enthalpy of sodium chloride in solid form at 25 C is Δ h N a C l ( s , 25 C ) 0 = 411.15 kJ/mol, the standard enthalpy of sodium ions Na+ in the aqueous phase is Δ h N a + ( a q , 25 C ) 0 = 240.12 kJ/mol, the standard enthalpy of chlorine ions dissolved in water is Δ h C l ( a q , 25 C ) 0 = 167.16 kJ/mol—based on [26]).
The definite temperature of brine filling the cavern in the first time step of calculations t s τ + Δ τ is defined by Formula (6):
t b τ + Δ τ = t s + α F 0 t 0 t b + V l ˙ c l ρ l t l t b Δ τ V b c c b c ρ b c + π Δ L Δ h N a C l ρ N a C l r c + Δ r c 2 r c 2 V b c c b c ρ b c
  • Brine concentration in the cavern
The brine concentration in the individual time steps was determined on the basis of the profit and loss balance of rock salt dissolved in brine, according to the following Formula (7):
c b τ + Δ τ = m b τ + Δ m b c + m b I n τ + Δ τ m b O u t τ + Δ τ V H 2 O τ + Δ τ
The balance of the rock salt was made on the assumption that the whole mineralization of brine and leaching water derived from the dissolved NaCl.
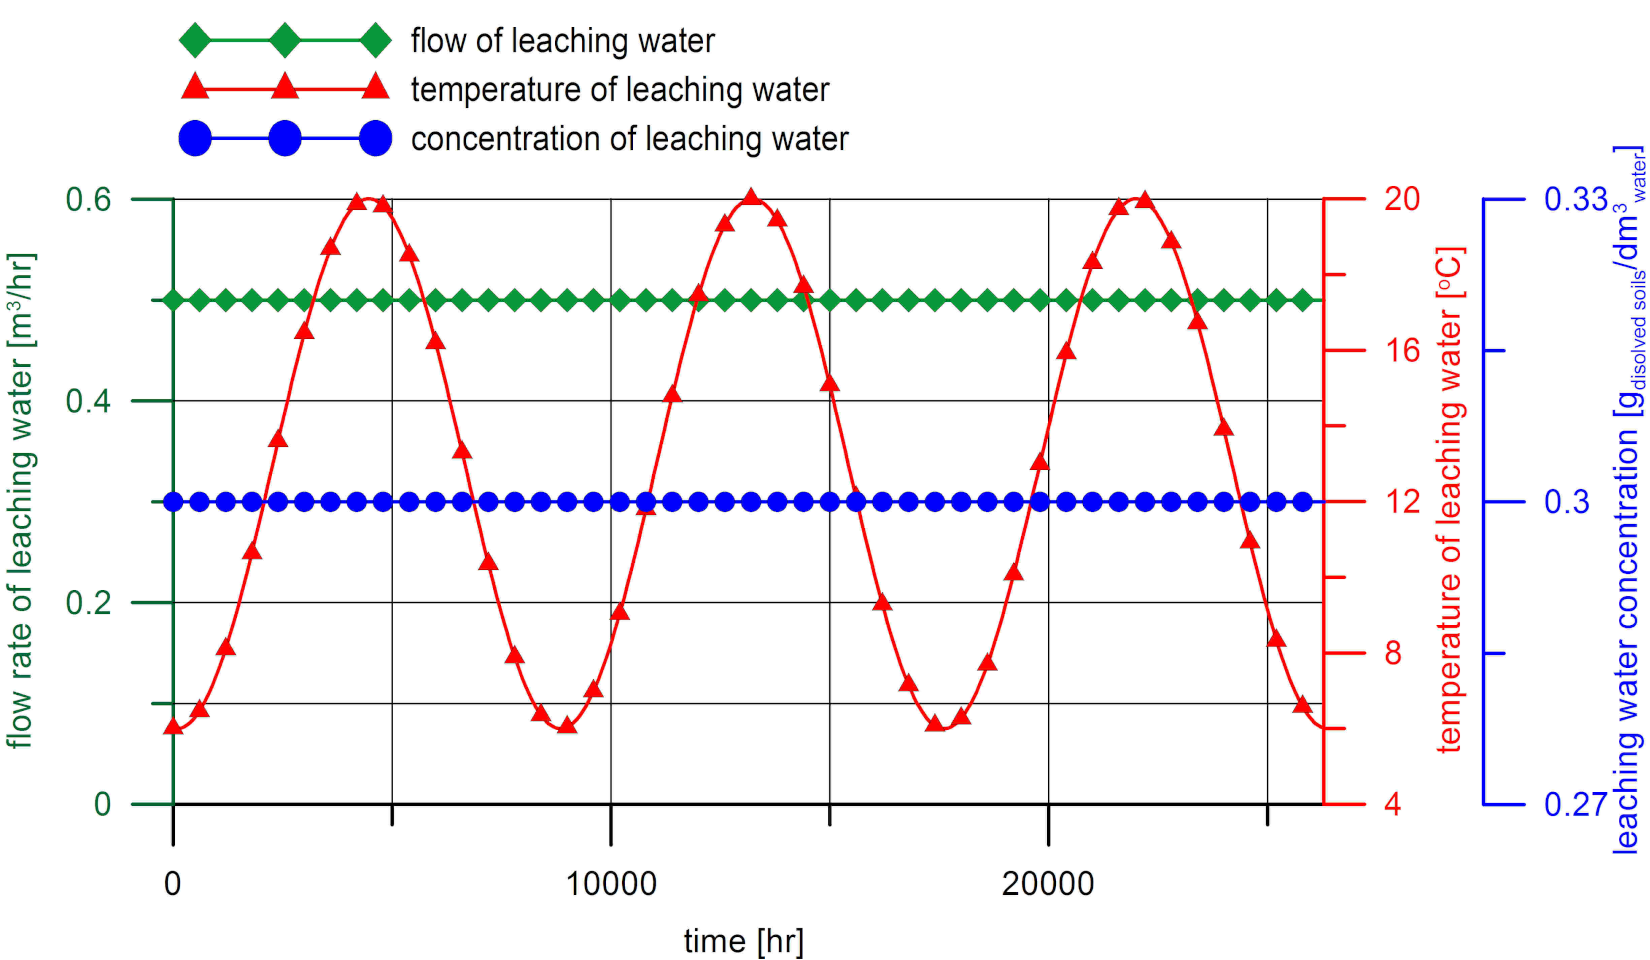
  • Brine and water properties
The discussed model takes the following parameters of brine and leaching water into account:
  • specific heat variability, depending on its concentration and temperature and determined on the basis of equations given by Jamieson et al. [27], and
  • density variability, depending on the concentration of solutes, pressure, and temperature and determined on the basis of equations given by McCain [28]
The model does not include the effect of contraction consisting in the fact that salt and water or brine has a larger volume than the resulting solution after their mixing.

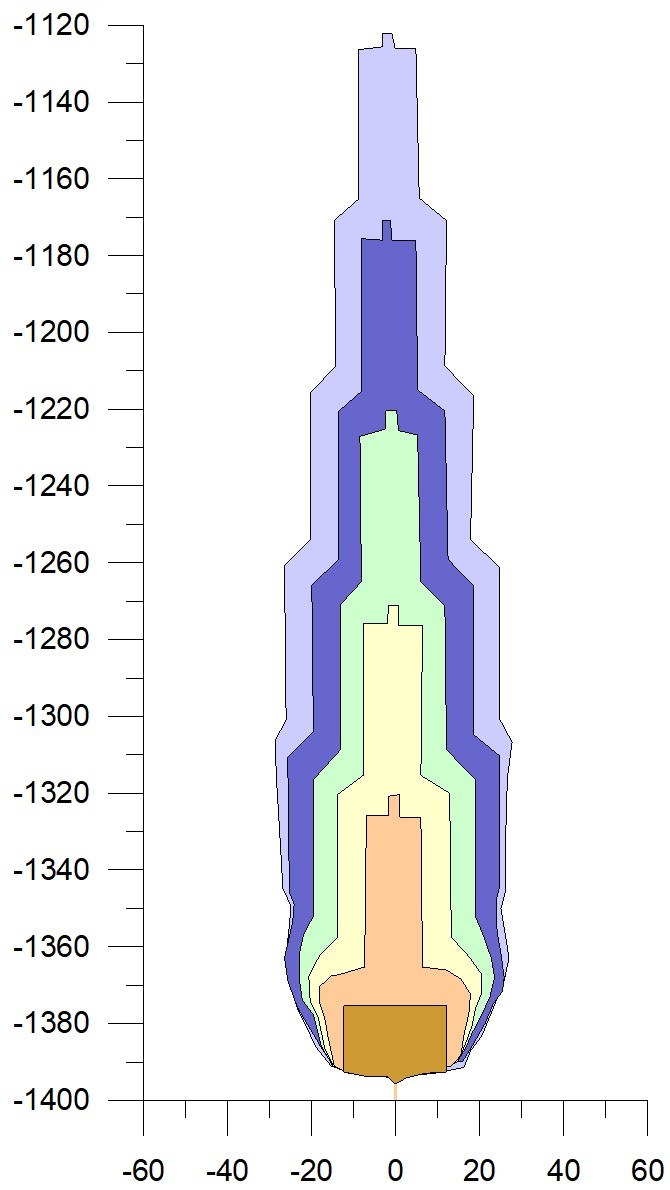
3. Results of Numerical Calculations

In the case of full model, the influence of the beginning of the cavern leaching (summer or winter) on the course of the process was analyzed. The duration of the cavern leaching was assumed for three years. The starting date of leaching the cavern was set on the 1 January and 1 July. It was assumed that the height of the modeled cavern interval is 1 m. The rate of the leaching water flow that is presented below then refers to the 1 m interval of cavern height.
Leaching water parameters distribution over time in the case of full model in which leaching begins in winter is presented in Figure 4. The distribution of temperature over time was a parameter that was different in two full models with different leaching starting dates. The distribution of temperature in the model in which leaching begins in summer was shifted in time 4380 h (which corresponds to half of the year) and the temperature of the leaching water in this time was the highest. The remaining parameters of leaching water (flow rate and saturation) were identical in both of the models.
The simplified model assumed that the temperature of leaching water is 13 C, which corresponds to the annual average temperature of leaching water in full model. The flow rate of leaching water of 0.5 m3/h is also constant and identically as in full models. Similarly to the full model, it was assumed that the height of modeled cavern interval is 1 m. The effect of the constant radius was achieved while assuming the value of initial concentration of brine and leaching water close to maximum saturation. All of the models assume a constant initial temperature of 50 C in the leaching zone along the radius of the modeled area. The initial length of the cavern radius was 0.5 m and initial concentration of brine filling the cavern was c b = 350 kg/m3. The parameters of the rock salt massif, i.e., specific heat −1.5 kJ/(kg C ), heat transfer coefficient −5 W/(m·K), and density −2200 kg/m3, were the same in all of the models. The calculations were performed while assuming side leaching coefficient kh = 11 mm/h. Figure 5 presents the temperature changes of the brine filling the cavern and the change of brine outflow in full model variant in which leaching begins in winter.
The falling discharge of brine despite constant flow rate of leaching water that is presented in Figure 5 was connected with an increasing in volume of the cavern. The contraction of brine was not responsible for this effect, because it was not included in the model. The brine discharge curve is a sine wave. Its local maxima occur in the period of the lowest temperature of leaching water. The decrease of the cavern leaching rate with a constant flow of leaching water and increase in the less saturated brine discharge may be observed at this time. In Figure 6, the temperature distribution over time is presented in three points: on the target cavern wall and within the rock salt massif −5 m and 10 m away from the target cavern wall. Temperature distribution is presented in the case of all three models: the full model in which leaching begins in winter (Figure 6), full model in which leaching begins in summer (Figure 7), and simplified model (Figure 8).
The seasonal temperature changes are observed in full models (Figure 6) after the time in which the measurement point is located in the zone of thermal influences caused by the leaching process. The first effects of the seasonal changes in temperature are observed after approx. 1000 h i.e., approx. 1.5 months after the start of cavern leaching. With time, the effect of seasonal changes of leaching water temperature becomes more evident for these models. The impact of seasonal changes in temperature of leaching water on the temperature distribution within the rock salt massif 10m away from the target cavern wall is practically unnoticeable. However the difference in the course of general trend of temperature changes is observed in relation to the simplified model. The rock salt massif temperature at a given time in the case of full models is generally slightly elevated. This effect is best noticeable during the period of 5000 h (approx. seven months) to 20,000 h (approx. 27 months) after the start of the cavern leaching.

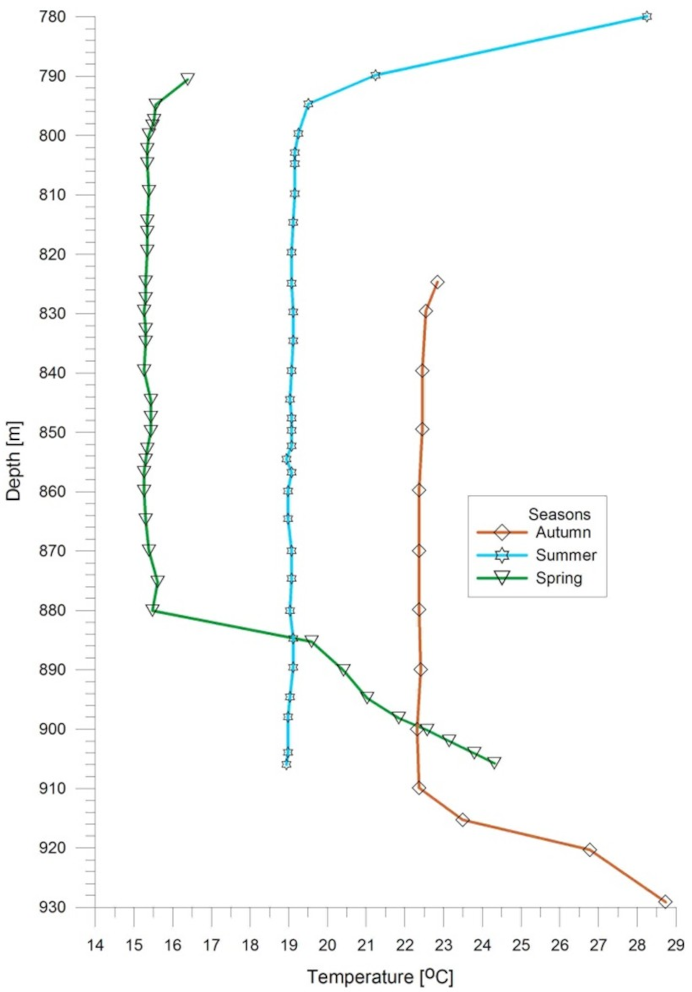
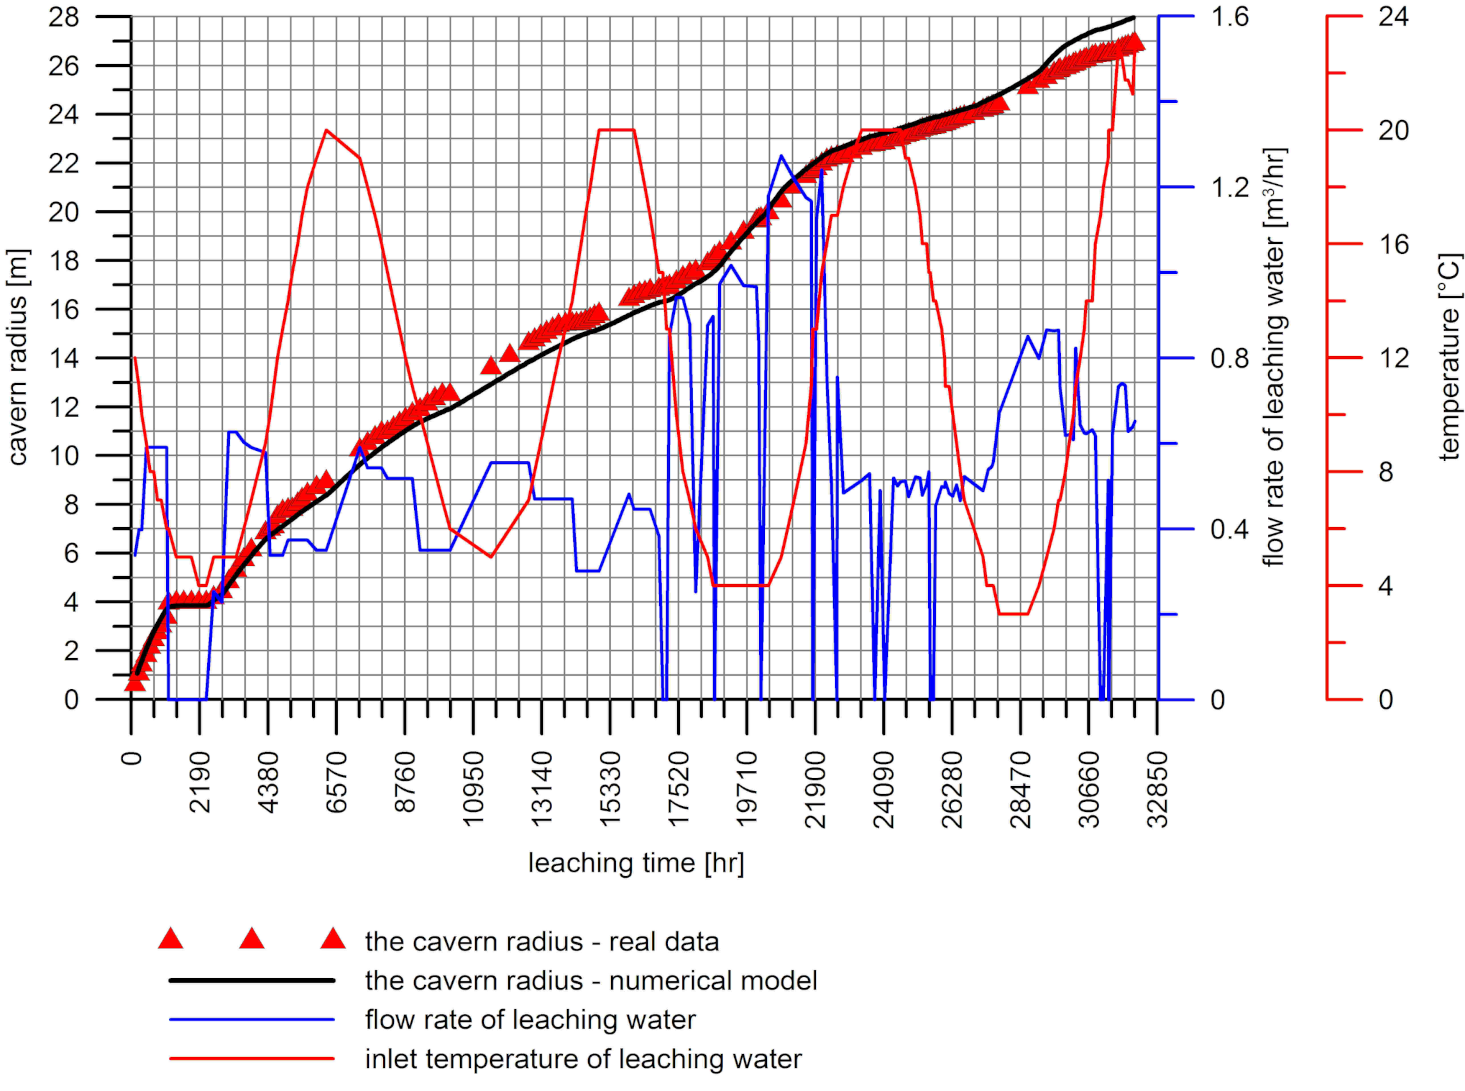
4. Comparison of Calculation Results with Measurement Data

The comparison of the modeling results with measurement data of the leaching process was performed in order to evaluate the qualitative and quantitative correctness of the obtained results. The measurement data concerned the leaching process of L2 cavern from one of the Polish storage sites. The leaching process of this caverns lasted 44 months (i.e., three years and eight months). During this period, the flow rate of leaching water and its temperature fluctuated. The cavern leaching process was carried out using water with a total and constant mineralization of 0.3 g/dm3. Figure 9 presents the data concerning the rate of cavern radius growth. The rate of radius growth was estimated on the basis of the volume growth of the cavern (measured value) while assuming a cylindrical shape of the cavern. The calculations account for the wellhead values of flow rate, temperature, and mineralization of leaching water. Figure 9 presents the changes of the flow rate and temperature of leaching water. When comparing the measured results with the results of numerical modeling, it can be seen that the model accurately reflects the nature of the changes that are caused by variability of flow rate and temperature of the leaching water. The increase in the flow rate of leaching water and its temperature cause the increases of growth rate of the caverns radius. The quantitative comparison of the results also shows good correlation between measurements and computing data. The final radius of leached cavern according to the measurements is approx. 27 m and, according to calculations, its length is approx. 28 m. The difference of 1 m between measured and calculation data while taking into account the long period of the leaching process and considerable variability of leaching water parameters may be considered as a satisfactory result. Therefore, these results confirm the assumption that a one-dimensional model well enough describes the actual process at least in terms of the dynamics of changes of the cavern volume.

5. Conclusions

The calculations indicate tthat he significant cooling of the rock salt massif in the vicinity of the salt cavern after leaching process has been completed. The initial temperature near the cavern wall of 50 C has decreased to the values close to the leaching water temperature range of 3–16 C . In the vicinity of the cavern the influence of the seasonal changes of the leaching water temperature is observed. The temperature decrease of the rock salt massif in immediate vicinity of the cavern wall (6 C in winter) may be explained by the strong endothermic effect connected with dissolving of the rock salt. The remperature distribution values in rock salt massif obtained by simplified model are similar to the values obtained by the full model, in which leaching begins in summer. No significant differences in the temperature of the rock salt massif were noticed between the full and simplified models. The observed changes of temperature of the rock salt massif in this zone are caused by the seasonal changes of the leaching water temperature, and the discrepancies between the models are the result of the different date of the leaching beginning and applied assumptions. A one-dimensional model of the cavern leaching process in a satisfactory way allows for an estimation the rate of cavern volume growth, providing good quality characteristics of the qualitative and quantitative changes.

Author Contributions

Conceptualization, L.P. and L.L.; methodology, L.P. and L.L.; validation, B.T., P.W.; formal analysis, L.P.; resources, B.T.; writing—original draft preparation, L.P. and D.J.; writing—review and editing, D.J.; visualization, L.L.; supervision, B.T., L.P. and L.L. All authors have read and agreed to the published version of the manuscript.

Funding

The paper was performed within the frame of AGH-UST statutory research grant No. 16.16.140.315/05, Faculty of Geology, Geophysics and Environmental Protection, Department of Fossil Fuels and statutory research grant No. 16.16.190.779 Faculty of Drilling, Oil and Gas, Department of Petroleum Engineering.

Institutional Review Board Statement

Not applicable.

Informed Consent Statement

Not applicable.

Data Availability Statement

Not applicable.

Conflicts of Interest

The authors declare no conflict of interest.

Nomenclature

α convective heat transfer coefficient [ W / ( m 2 C ) ]
β leaching coefficient determined in laboratory conditions for 20 C , β = 0.0262 / C
Δ τ time step [s]
Δ h N a C l enthalpy of NaCl dissolution in water [J/kg]
Δ L height of the analyzed zone [m]
Δ m b c τ + Δ τ mass of the NaCl dissolved in individual time step [kg]
Δ r c the cavern radius increase rate over time [m]
V 1 ˙ volumetric stream of leaching water [m3/s]
λ heat transfer coefficient [W/(m2 K)]
ω c b , t b , ψ , h leaching rate of the cavern wall with inclination ψ by the solution with concentration c b and temperature t b and leaching properties at the depth h, [mm/h]
ρ density [kg/m3]
ρ c b density of the brine filling the cavern [kg3/s]
ρ l leaching water density [kg3/s]
ρ N a C l density of NaCl
τ the current time [s]
cspecific heat [J/(kg C )]
c b c specific heat of the brine filling the cavern [J/(kg C )]
c b brine concentration in salt cavern expressed as the solute mass per unit volume of the solution [kg/m3]
c b τ + Δ τ brine concentration in the cavern at the end of the current time step expressed as the mass of dissolved NaCl per volume unit [kg/m3]
c l specific heat of leaching water per unit weight [J/(kg C )]
c s a t brine concentration in temperature t b expressed as the solute mass per unit volume of the solution [kg/m3]
F 0 cavern wall surface [m2]
k ψ , h the rate of leaching by fresh water with temperature t 0 and cavern wall inclination ψ and leaching properties at the depth h. In case of vertical cavern wall the value of function k ( ψ , h ) is equal to side leaching coefficient k h , and in case of the cavern roof it is equal to roof leaching coefficient v v [mm/h]
k h side leaching coefficient, typically 6–20 mm/h—determined in laboratory conditions
k v vertical leaching coefficient, typically 14–30 mm/h—determined in laboratory conditions
m b I n τ + Δ τ mass of the NaCl dissolved in leaching water in individual time step in solution injection to cavern in current time step [kg]
m b O u t τ + Δ τ mass of the NaCl dissolved in the brine withdrawn from the cavern [kg]
m b τ mass of the NaCl dissolved in the brine filling the cavern at the start of the current time step [kg]
rradius [m]
ttemperature [ C ]
t 0 brine temperature [ C ]
t 0 cavern wall temperature [ C ]
t 0 reference temperature in which coefficient β was determined, t 0 = 20 C
t b brine temperature in time τ [ C ]
t b temperature of brine in salt cavern [ C ]
t l leaching water temperature [ C ]
t s cavern wall temperature [ C ]
V b c volume of the brine filling the cavern (cavern volume) [m3]
V H 20 τ + Δ τ volume of the fresh water within the brine filling the cavern in the individual time step m

References

  1. Bujakowski, W.; Tarkowski, R. Termiczna charakterystyka górotworu w rejonie wysadów solnych. Przegląd Górniczy 2001, 57, 15–20. [Google Scholar]
  2. Pająk, L.; Gonet, A.; Śliwa, T.; Knez, D. Analiza możliwości wykorzystania magazynów ciekłego propanu, lokowanych w strefie kawern wysadów solnych, do produkcji energii. Wiert. Naft. Gaz 2010, 27, 657–667. [Google Scholar]
  3. Tomaszewska, B.; Pająk, L. Dynamics of clogging processes in injection wells used to pump highly mineralized thermal waters into the sandstone structures lying under the Polish Lowlands. Arch. Environ. Prot. 2012, 38, 105–117. [Google Scholar] [CrossRef] [Green Version]
  4. Tomaszewska, B. The prognosis of scaling phenomena in geothermal system using the geochemical modeling methods. Gospod. Surowcami Miner. Miner. Resour. Manag. 2008, 24, 399–407. [Google Scholar]
  5. AbuAisha, M.; Rouabhi, A.; Billiotte, J.; Hadj-Hassen, F. Non–isothermal two–phase hydrogen transport in rock salt during cycling in underground caverns. Int. J. Hydrogen Energy 2020, 46, 6632–6647. [Google Scholar] [CrossRef]
  6. Liu, W.; Zhang, Z.; Chen, J.; Jiang, D.; Fei, W.; Fan, J.; Li, Y. Feasibility evaluation of large-scale underground hydrogen storage in bedded salt rocks of China: A case study in Jiangsu province. Energy 2020, 198, 117348. [Google Scholar] [CrossRef]
  7. Sicsic, P.; Bérest, P. Thermal cracking following a blowout in a gas-storage cavern. Int. J. Rock Mech. Min. Sci. 2014, 71, 320–329. [Google Scholar] [CrossRef]
  8. Wang, T.; Ma, H.; Yang, C.; Shi, X.; Daemen, J. Gas seepage around bedded salt cavern gas storage. J. Nat. Gas Sci. Eng. 2015, 26, 61–71. [Google Scholar] [CrossRef]
  9. Labaune, P.; Rouabhi, A. Dilatancy and tensile criteria for salt cavern design in the context of cyclic loading for energy storage. J. Nat. Gas Sci. Eng. 2019, 62, 314–329. [Google Scholar] [CrossRef]
  10. Shkuratnik, V.; Kravchenko, O.; Filimonov, Y.L. Stresses and Temperature Affecting Acoustic Emission and Rheological Characteristics of Rock Salt. J. Min. Sci. 2019, 55, 531–537. [Google Scholar] [CrossRef]
  11. Bérest, P.; Brouard, B.; Djakeun-Djizanne, H.; Hévin, G. Thermomechanical effects of a rapid depressurization in a gas cavern. Acta Geotech. 2014, 9, 181–186. [Google Scholar] [CrossRef]
  12. Sedaee, B.; Mohammadi, M.; Esfahanizadeh, L.; Fathi, Y. Comprehensive modeling and developing a software for salt cavern underground gas storage. J. Energy Storage 2019, 25, 100876. [Google Scholar] [CrossRef]
  13. Yu, W.; Huang, W.; Liu, H.; Wang, K.; Wen, K.; Gong, J.; Zhang, M. A systematic method for assessing the operating reliability of the underground gas storage in multiple salt caverns. J. Energy Storage 2020, 31, 101675. [Google Scholar] [CrossRef]
  14. Liu, W.; Zhang, Z.; Fan, J.; Jiang, D.; Li, Z.; Chen, J. Research on gas leakage and collapse in the cavern roof of underground natural gas storage in thinly bedded salt rocks. J. Energy Storage 2020, 31, 101669. [Google Scholar] [CrossRef]
  15. Cetinkaya, E. Underground, modelling peak-load exploitation of and storage, gas and gazu, modelowanie szczytowej eksploatacji podziemnych magazynów and tureckich, w kawernach solnych dla and warunków, i polskich. Arch. Min. Sci. 2007, 52, 21–47. [Google Scholar]
  16. Ślizowski, J.; Urbańczyk, K.; Serbin, K. Numeryczna analiza konwergencji pola komór magazynowych gazu w wysadzie solnym. Gospod. Surowcami Miner. 2010, 26, 85–93. [Google Scholar]
  17. Bérest, P. Heat transfer in salt caverns. Int. J. Rock Mech. Min. Sci. 2019, 120, 82–95. [Google Scholar] [CrossRef]
  18. Serbin, K.; Ślizowski, J.; Urbańczyk, K.; Nagy, S. The influence of thermodynamic effects on gas storage cavern convergence. Int. J. Rock Mech. Min. Sci. 2015, 100, 166–171. [Google Scholar] [CrossRef]
  19. Ozarslan, A. Large-scale hydrogen energy storage in salt caverns. Int. J. Hydrogen Energy 2012, 37, 14265–14277. [Google Scholar] [CrossRef]
  20. Kunstman, A.; Poborska-Młynarska, K.; Urbańczyk, K. Solution Mining in Salt Deposits: Outline of rEcent Development Trends; AGH Uczelniane Wydawnictwa Naukowo-Dydaktyczne: Krakow, Poland, 2007. [Google Scholar]
  21. Kunstman, A.; Poborska-Młynarska, K.; Urbańczyk, K. Zarys Otworowego ugownictwa Solnego: Aktualne Kierunki Rozwoju; AGH Uczelniane Wydawnictwa Naukowo-Dydaktyczne: Krakow, Poland, 2002. [Google Scholar]
  22. Wiśniewski, S.; Wiśniewski, T.S. Wymiana Ciepła; Wydawnictwo Naukowe PWN, WNT: Warsaw, Poland, 2010. [Google Scholar]
  23. Robertson, E.C. Thermal Properties of Rocks. 1988. Available online: https://pubs.usgs.gov/of/1988/0441/report.pdf (accessed on 1 September 2020).
  24. Kunstman, A.; Urbanczyk, K. Computer Simulation of Temperature Distribution Around Well and Cavern During Leaching. In Proceedings of the SMRI Spring Meeting, New Orleans, LA, USA, 15–16 April 1995. [Google Scholar]
  25. Hobler, T. Ruch Ciepła i Wymienniki; Wydawnictwo Naukowe PWN: Warsaw, Poland, 1979. [Google Scholar]
  26. Weast, R.C. CRC Handbook of Chemistry and Physics; CRC Press: Boca Raton, FL, USA, 1988; Volume 69. [Google Scholar]
  27. Jamieson, D.; Tudhope, J.; Morris, R.; Cartwright, G. Physical properties of sea water solutions: Heat capacity. Desalination 1969, 7, 23–30. [Google Scholar] [CrossRef]
  28. McCain, W., Jr. Reservoir-Fluid Property Correlations-State of the Art (includes associated papers 23583 and 23594). SPE Reserv. Eng. 1991, 6, 266–272. [Google Scholar] [CrossRef]
Figure 1. Six steps of salt cavern development applying roof-side leaching method. Zones that are marked in the same color are simultaneously leached [21].
Energies 14 00803 g001
Figure 2. Brine temperature distribution in the cavern during leaching applying direct circulation method [21].
Energies 14 00803 g002
Figure 3. Space discretization and boundary conditions scheme.
Energies 14 00803 g003
Figure 4. The parameters of leaching water in full model variant in which leaching begins in winter.
Energies 14 00803 g004
Figure 5. The temperature changes of the brine filling the cavern and the change of brine outflow in the model variant in which leaching begins in winter.
Energies 14 00803 g005
Figure 6. Temperature distribution over time on the target cavern wall and within the rock salt massif—the model in which leaching begins in winter.
Energies 14 00803 g006
Figure 7. Temperature distribution over time on the target cavern wall and within the rock salt massif—the model in which leaching begins in summer.
Energies 14 00803 g007
Figure 8. Temperature distribution over time on the target cavern wall and within the rock salt massif—the simplify model.
Energies 14 00803 g008
Figure 9. The comparison of the numerical modeling results with measured data concerning the changes of the Z2 cavern radius during the leaching process.
Energies 14 00803 g009
Publisher’s Note: MDPI stays neutral with regard to jurisdictional claims in published maps and institutional affiliations.

