Utilising Open Geospatial Data to Refine Weather Variables for Building Energy Performance Evaluation—Incident Solar Radiation and Wind-Driven Infiltration Modelling
Abstract
1. Introduction
1.1. Outline
- (1)
- (2)
- Solar irradiance modelling according to EN-ISO 52010:2017, including direct and circumsolar beam façade surface shading from obstacles as outlined in EN-ISO 52016:2017.
1.2. Identifying Suitable Open Geospatial Datasets and Previous Works
2. Methods
- Obtaining reanalysis data from the Copernicus CDS using the ecmwf R package [42]
- Solar radiation from the CAMS-Rad service using the rOpenSci camsRad client [43]
- Self-hosting elevation and land cover data in an Open Topo Data server [44]
- Modules to create horizon profiles from a viewpoint by calling elevation services [45]
- Solar irradiance transposition model according to the ISO 52010 standard [46]
- Wind speed interpolation using key portions of the R-code printed in [47] (p. 45)
- The code implemented in the workflow relies on many additional popular Python and R packages such as rcpp, ncdf4, gdal, pyProj, shapely and netCDF4.
2.1. Environmental Variables
2.1.1. Environmental Variables Derived from Reanalysis Data
2.1.2. Environmental Variables Derived from Remote Sensing
2.2. Downscaling
2.2.1. Local Wind Speed Estimation
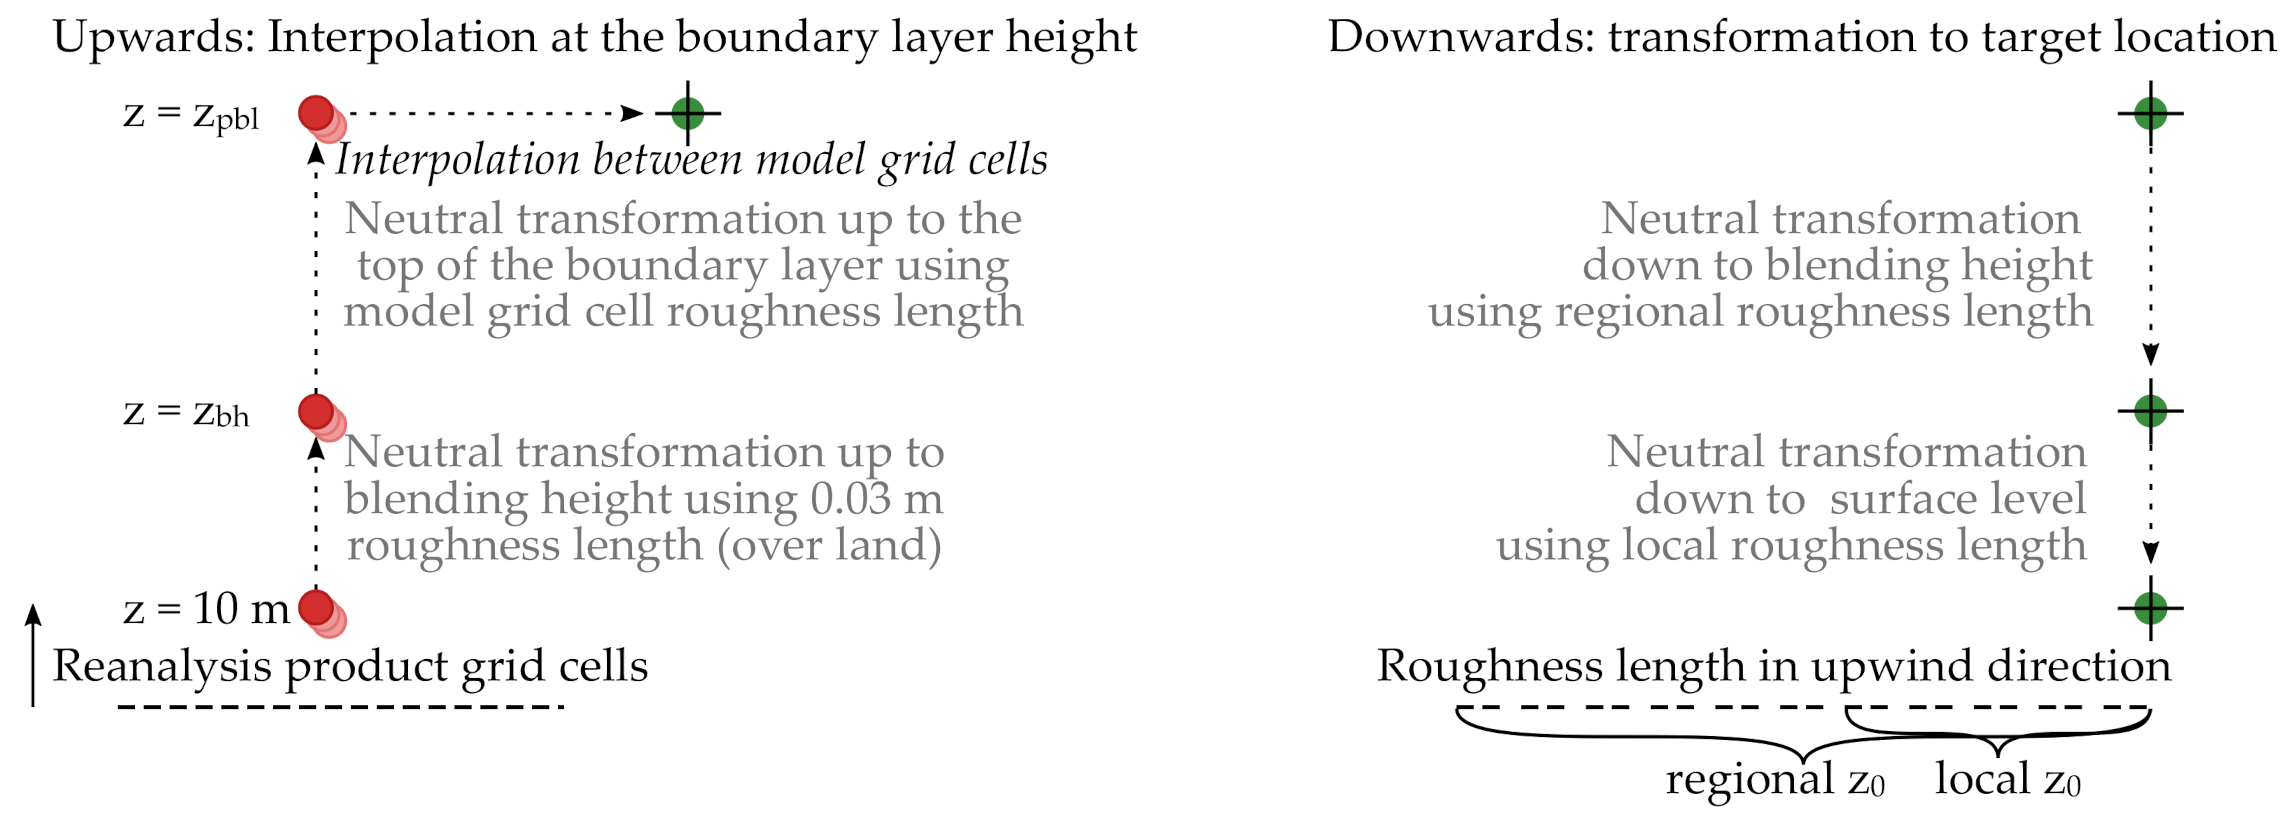
“Care should be taken when comparing this variable with observations because wind observations vary on small space and time scales and are affected by the local terrain, vegetation and buildings that are represented only on average in the ECMWF Integrated Forecasting System.”
2.2.2. Transforming Solar Irradiance Data Using a Satellite DEM
2.3. Transformations to Local Building Boundary Conditions Using Detailed Surface Models
2.3.1. Wind Shadow Sheltering on Facades by Nearby Upwind Obstacles
2.3.2. Approach to Calculate Sheltering from Surface Digital Elevation Models (DEM)
- (1)
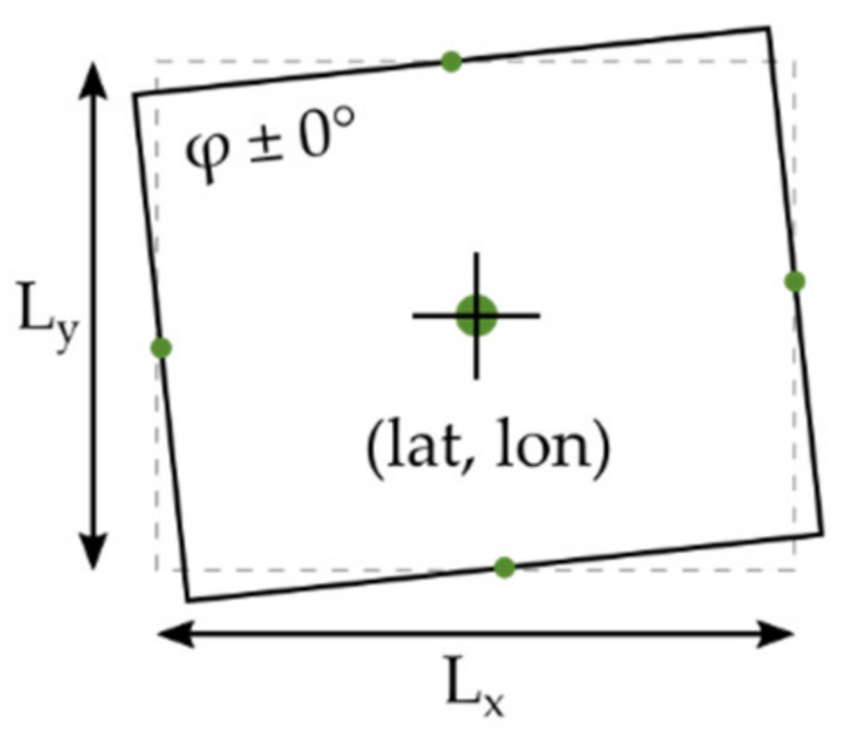
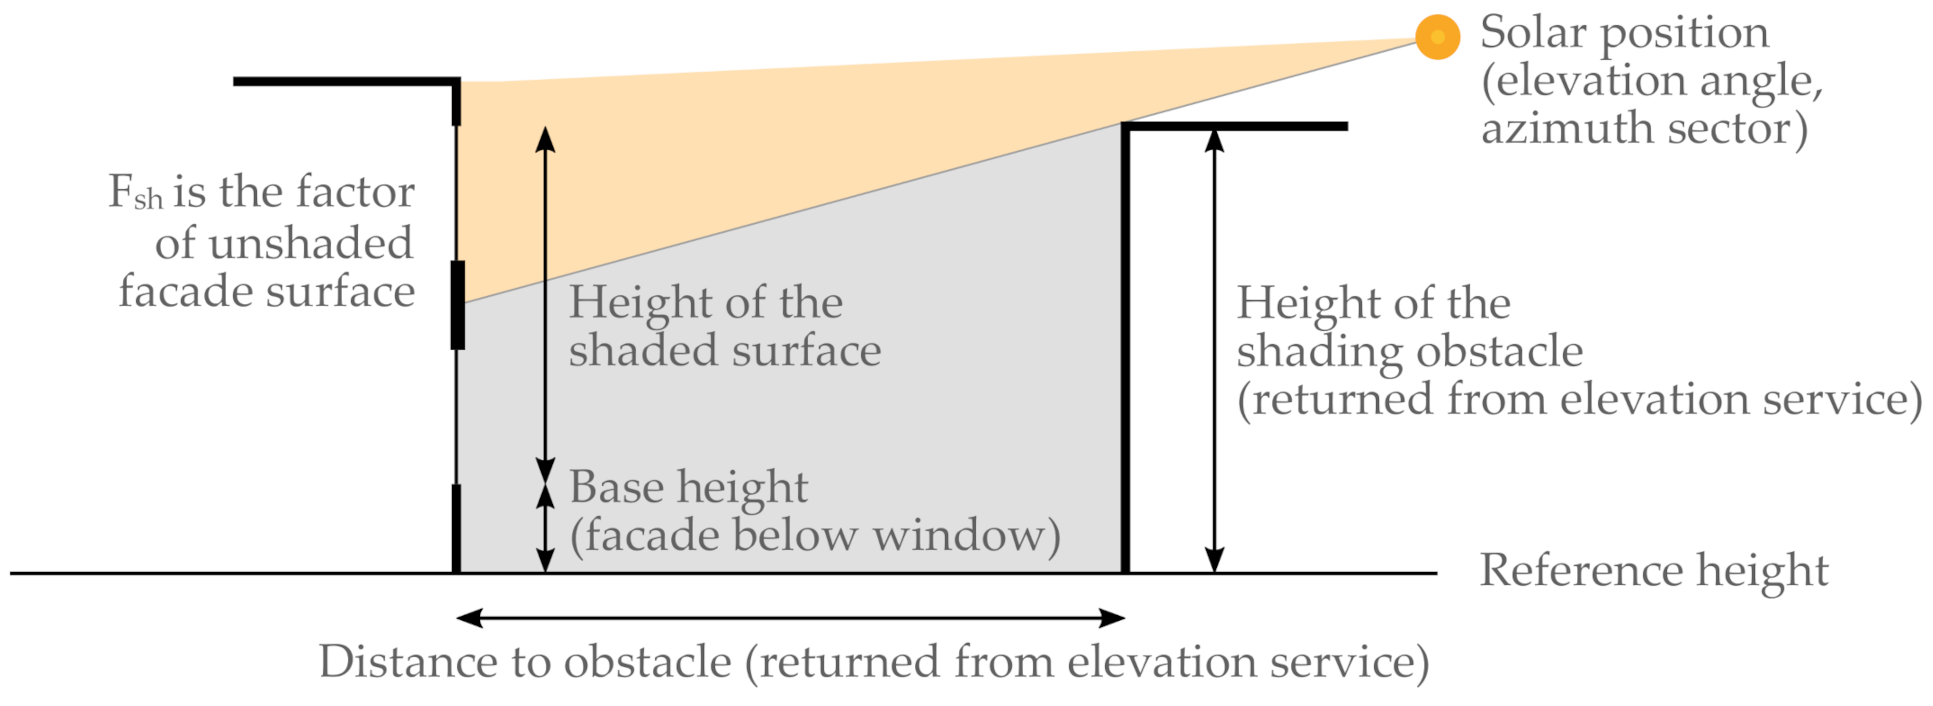
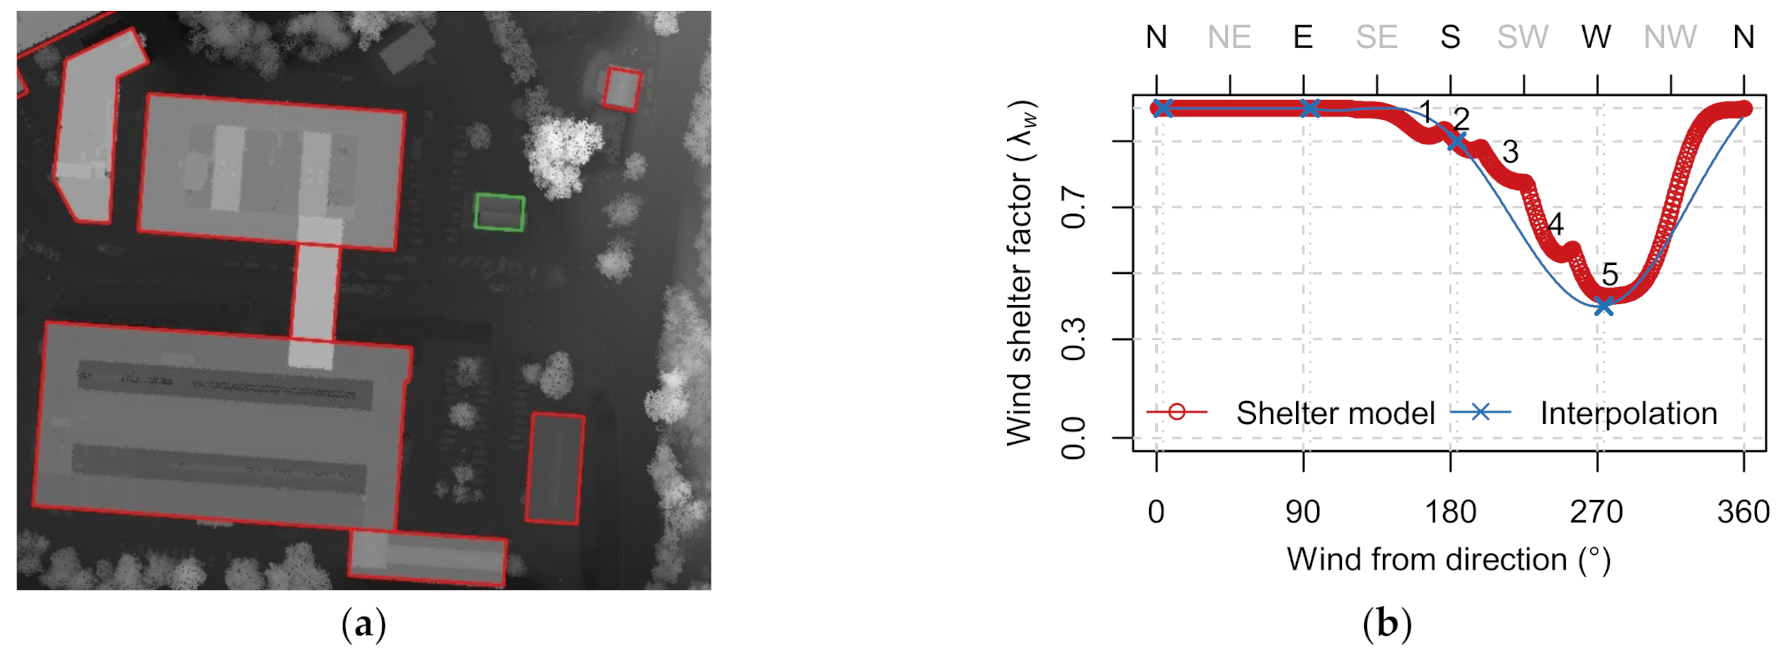
- Surface height and distance were evaluated extending at least e = 100 m outwards in each façade direction, using a spacing n of 1 m and a sector angle s of 2.5 degrees, creating matrices of dimension (e/n) (360/s), see also Figure 2 for illustration.
- (2)
- In the next step, the terrain reference height (above mean sea level) for the building and the façade height was used to calculate each sector’s maximum obstacle angle. We return the height and distance to this obstacle along with the obstacle height angle based on projection lines from mid-façade height, creating three arrays of (360/s) values for each façade. Knowing the façade orientations, the length of these arrays can optionally be reduced by half (to 180/s sectors).
- (3)
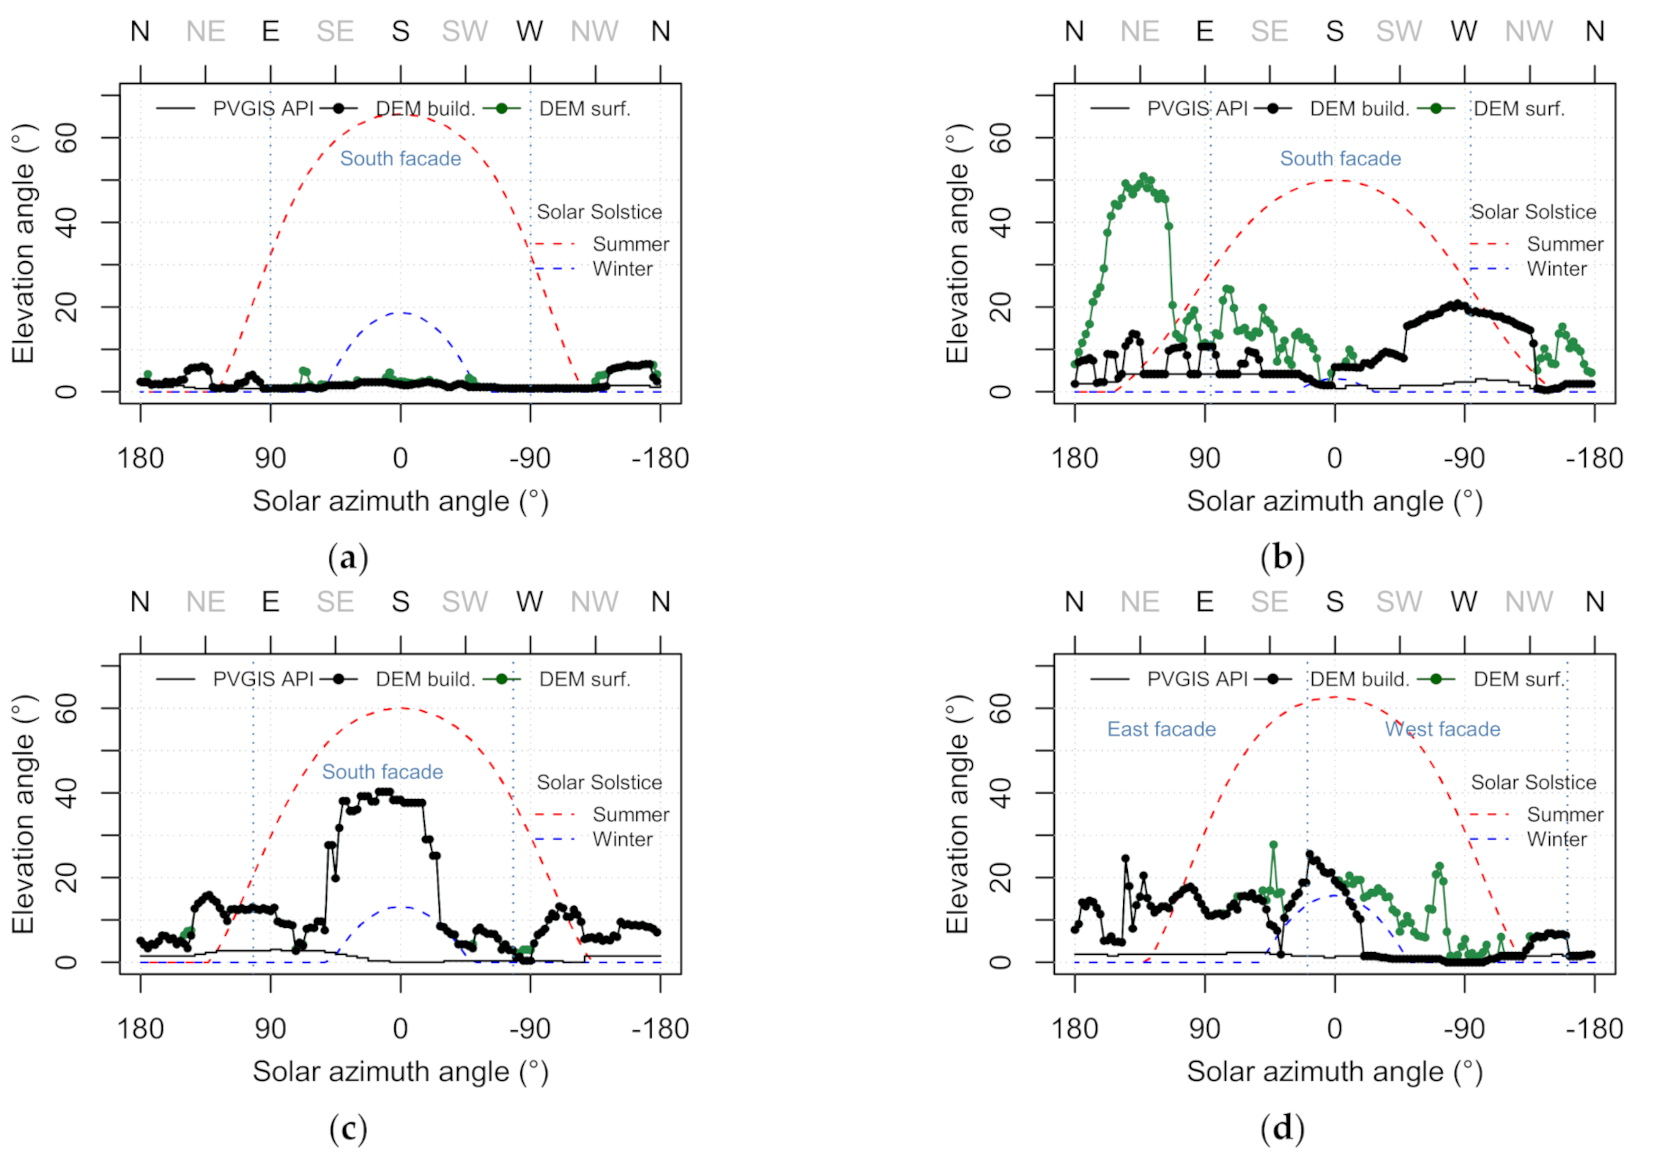
- To account for shading from local hills or mountains, we combined the matrices with the terrain shading angle from the EU-DEM mapping (up to 10 km) and the PVGIS API, selecting the maximum shading angle in each sector. The PVGIS horizon angles were interpolated to match sectors of 2.5°, from the native 7.5° sectors corresponding to half-hour intervals. A distance of 10 km was assumed to calculate PVGIS terrain height.
- (4)
- A fixed sky view factor was calculated for each façade orientation based on the mid-façade height horizon angle. Finally, the variable percentage of façade surface shaded by obstacles was calculated based on the full façade height, solar height and solar azimuth position according to the ISO52010 methodology. The selected 2.5° sectors correspond to 10 min intervals, making it straight forward to apply to 10-min time-series.
2.3.3. Solar Shading by Nearby Objects
2.4. Including Environmental Variables and Local Sheltering Effects
2.4.1. Infiltration Losses
2.4.2. Solar Heat Irradiance on Facades
3. Results and Discussion
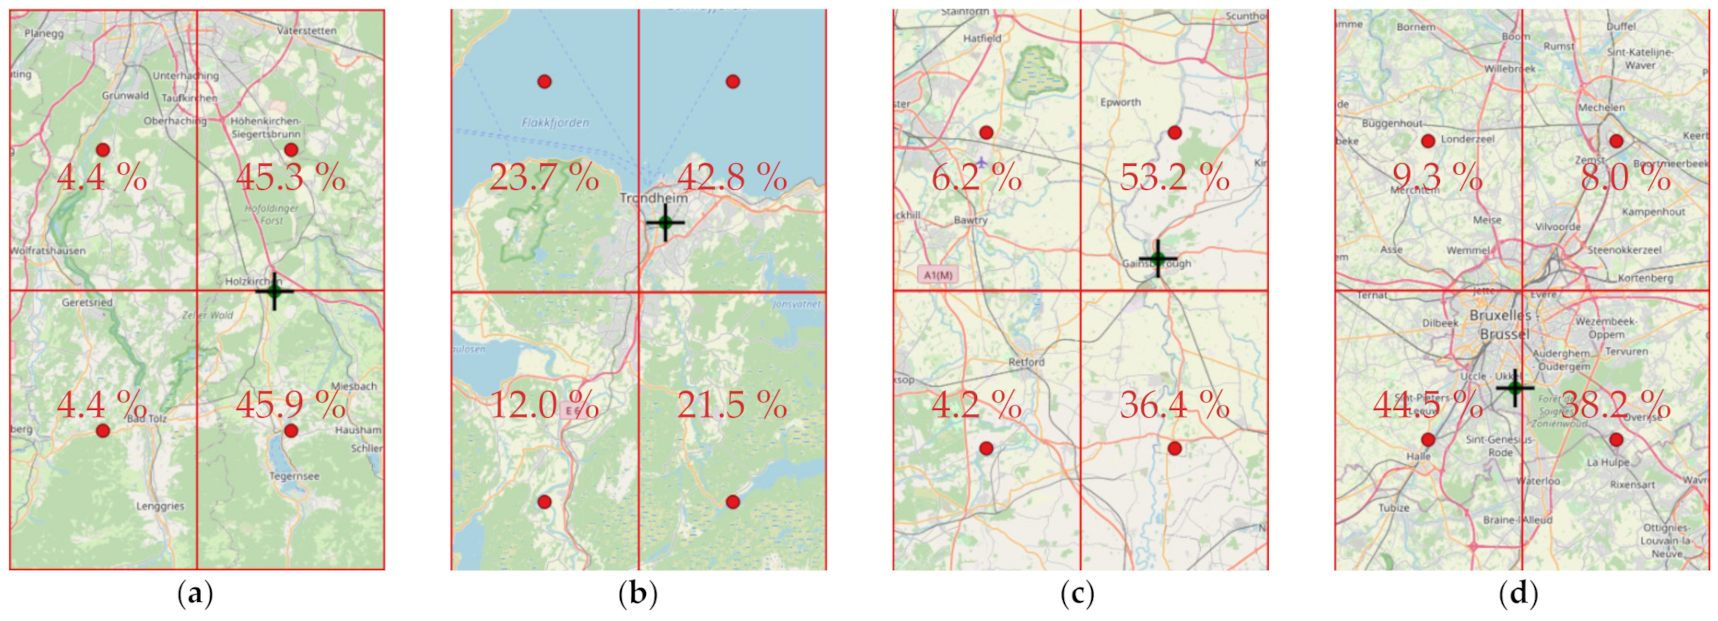
- The TWIN detached house oriented directly towards south at the Fraunhofer IBP test site in Holzkirchen, Germany.
- The ZEBLL Living Lab detached house oriented south with 4° westward tilt on the main campus of NTNU, Trondheim, Norway.
- The GBORO south-facing apartment end-unit oriented 12° eastwards in Gainsborough, UK.
- The UKULE townhouse oriented 71° westwards from the south in a historic part of Brussels, Belgium.
3.1. Comparison of Sourced Weather Data to Observations at the Holzkirchen Site
3.1.1. Air Temperature and Sky Longwave Irradiance
3.1.2. Wind Speed and Direction
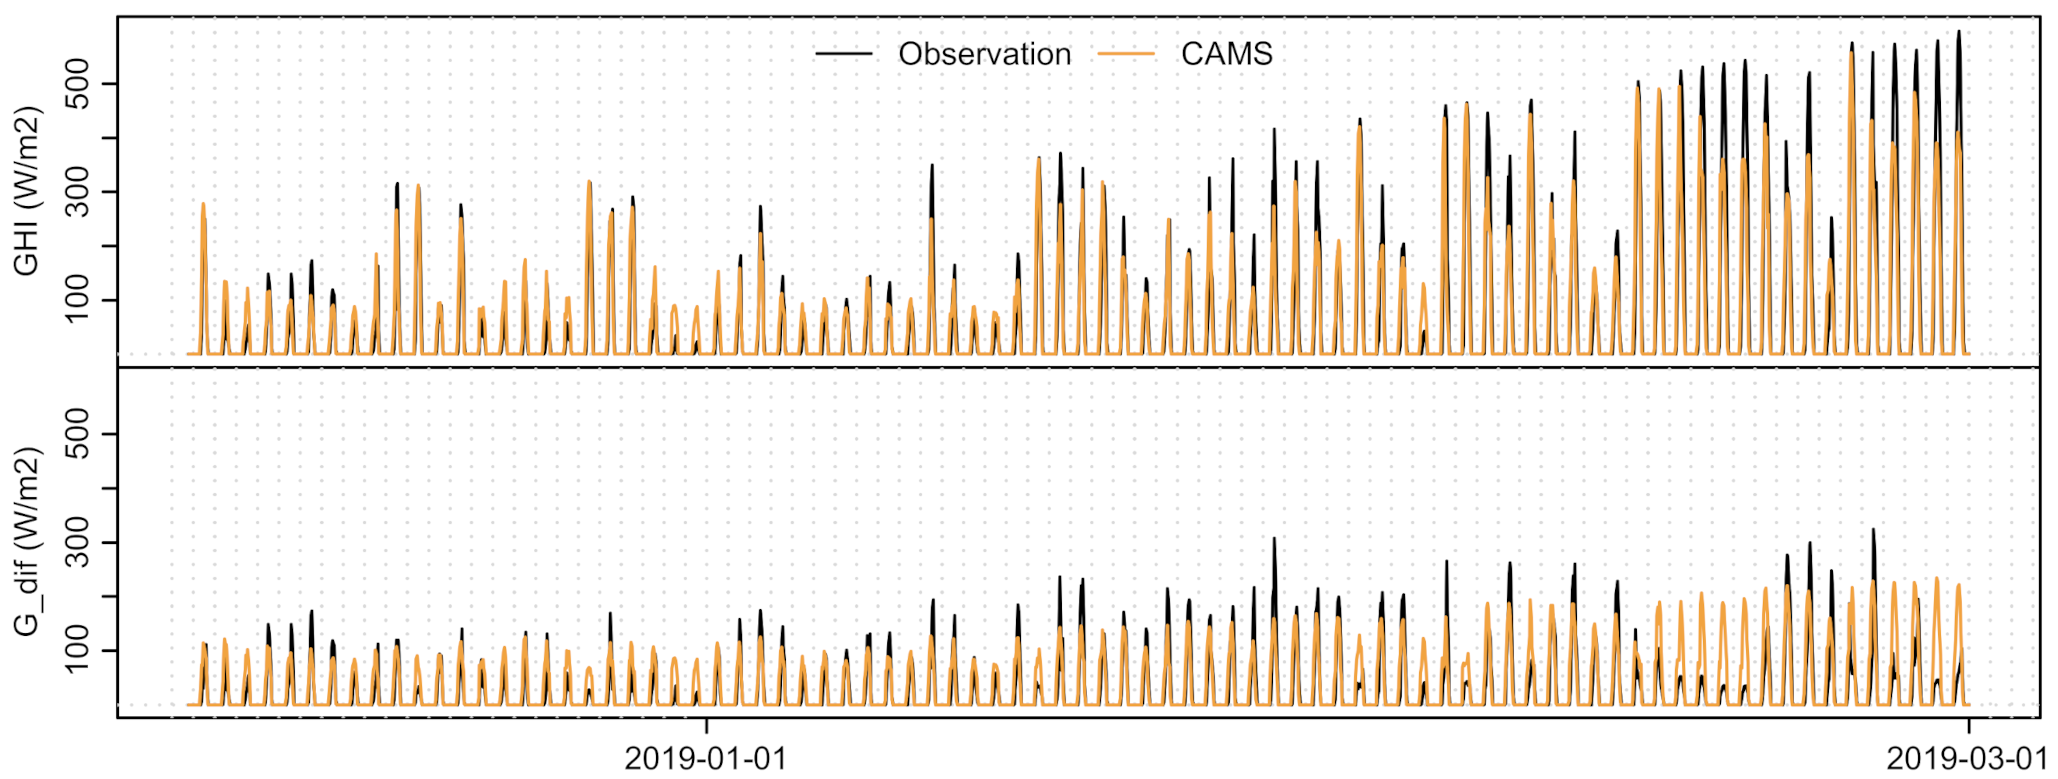
3.1.3. Global Horizontal and Diffuse Irradiance
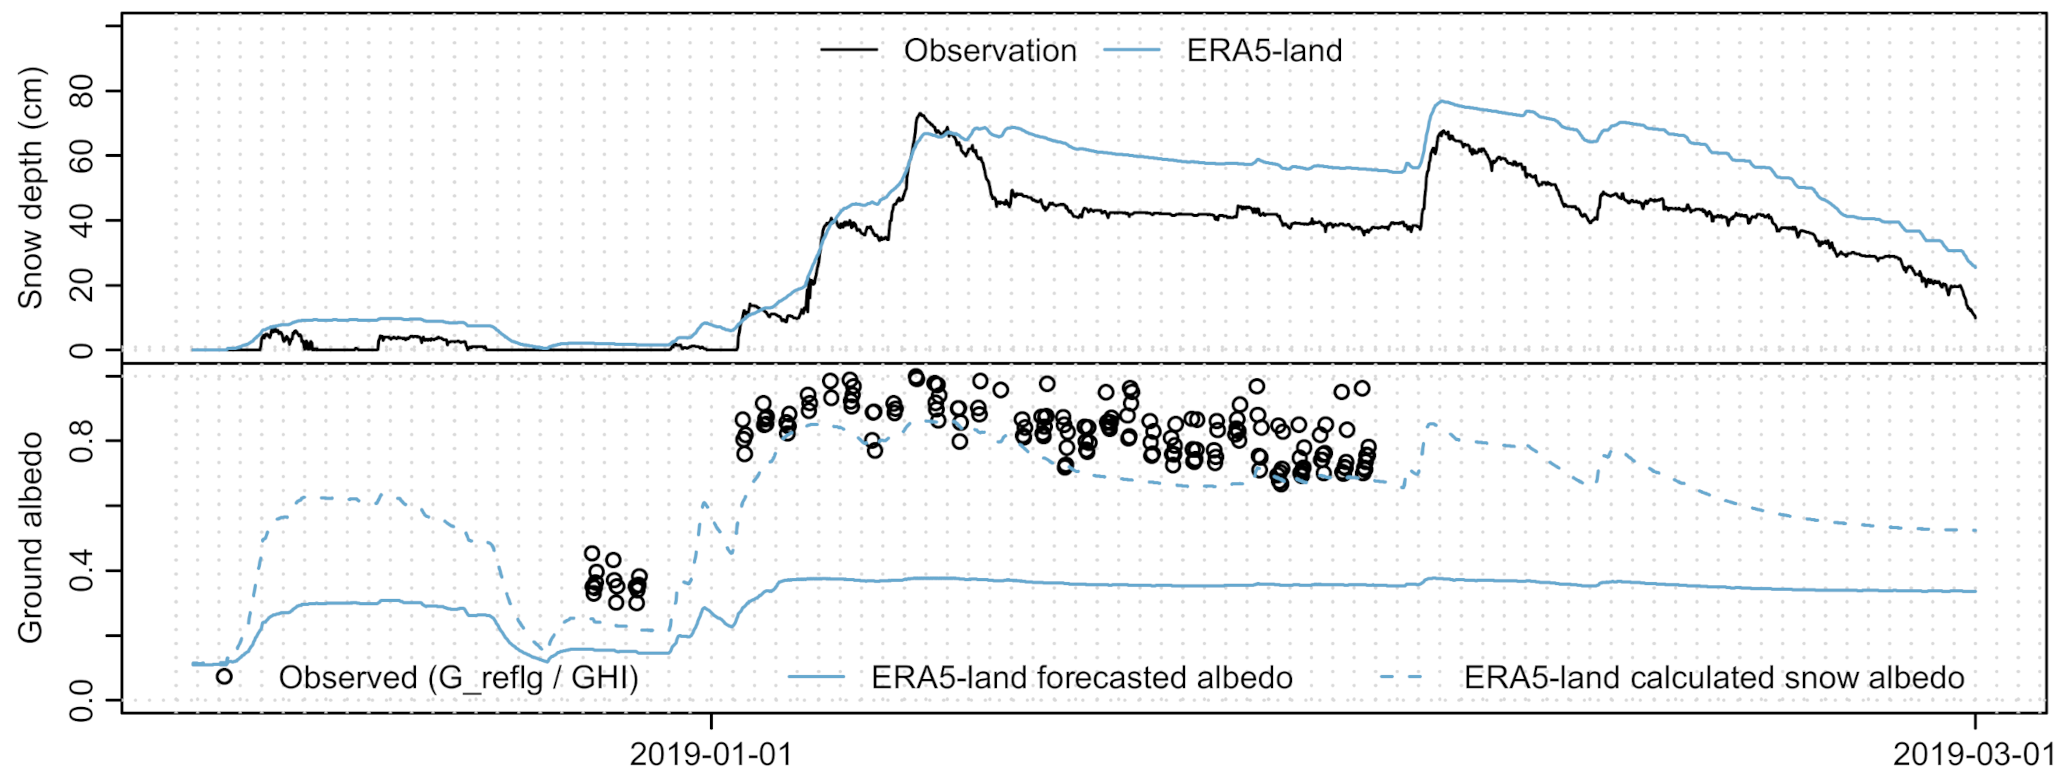
3.1.4. Snow Depth and Ground Surface Albedo
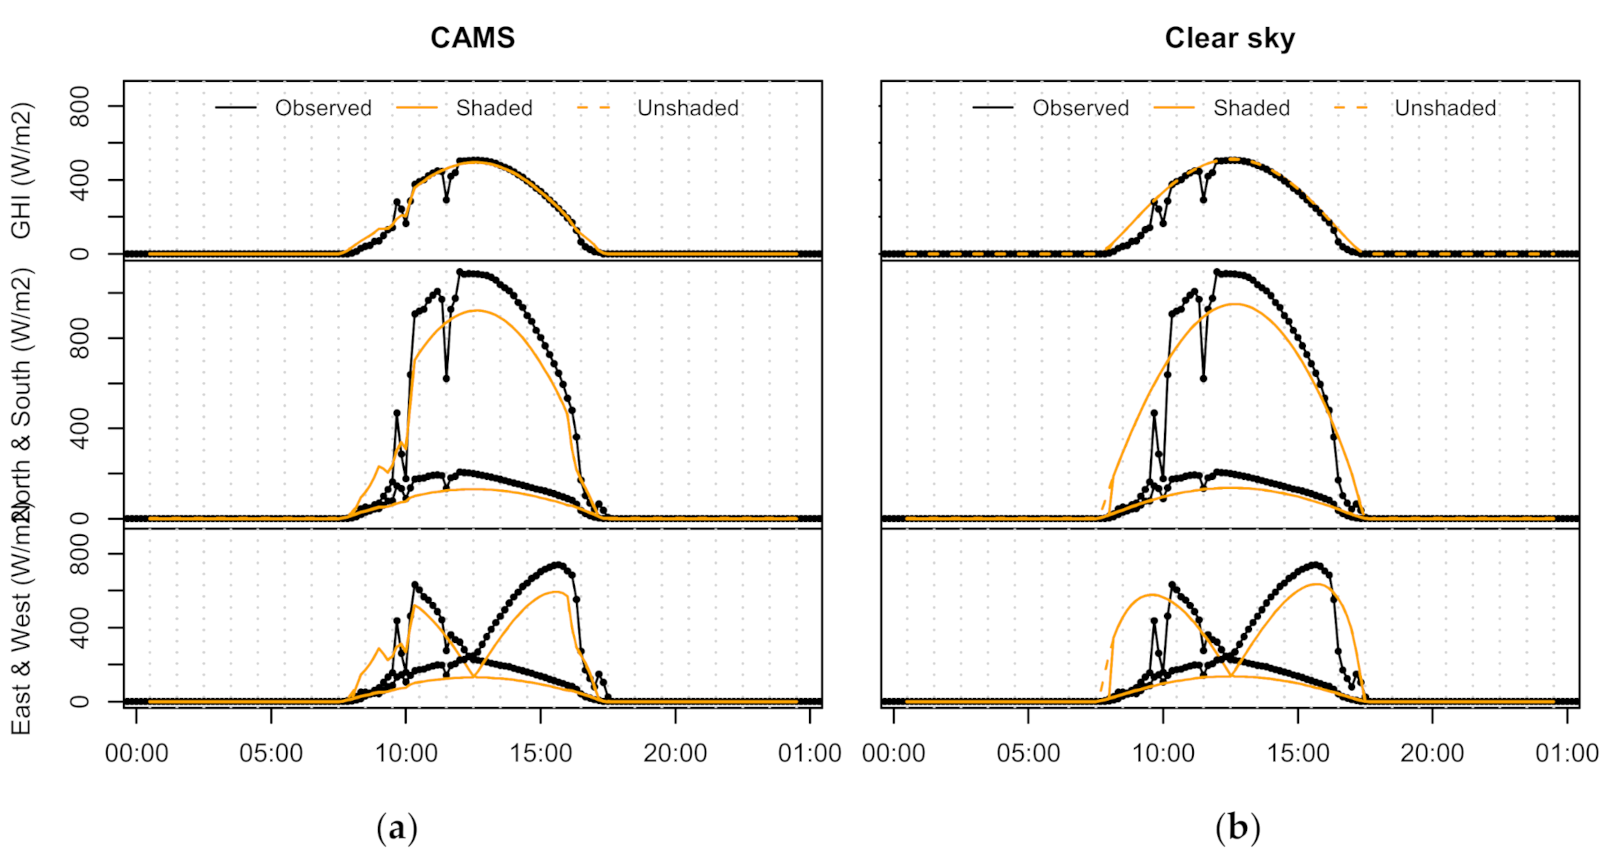
3.1.5. Vertical Solar Irradiance on Facades
3.2. Comparison of Sourced Weather Data to Observations at the NTNU Campus
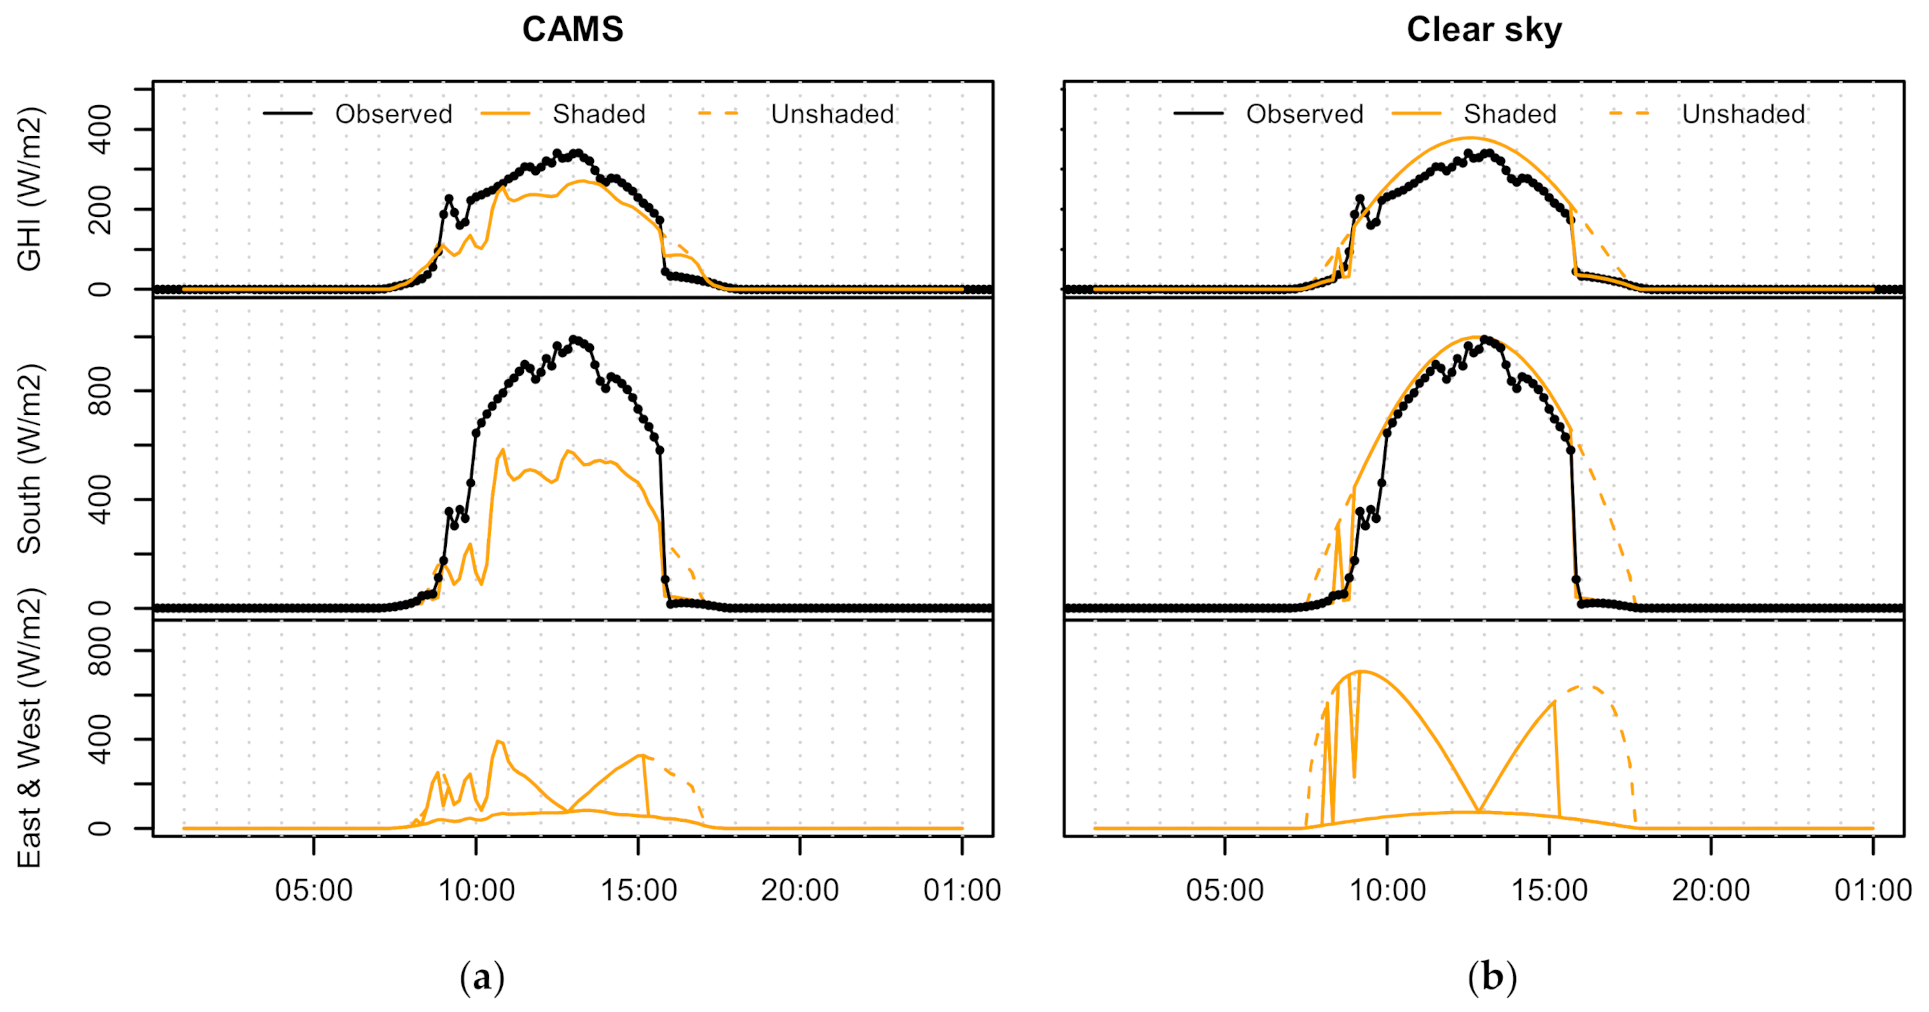
Vertical Solar Irradiance on Facades
3.3. Horizon Angle and Solar Radiation
3.3.1. Horizon Profile Using a Satellite-Derived Pan-European Surface Height Model
3.3.2. Horizon Profile Using Local High-Resolution Surface Height Models
- -
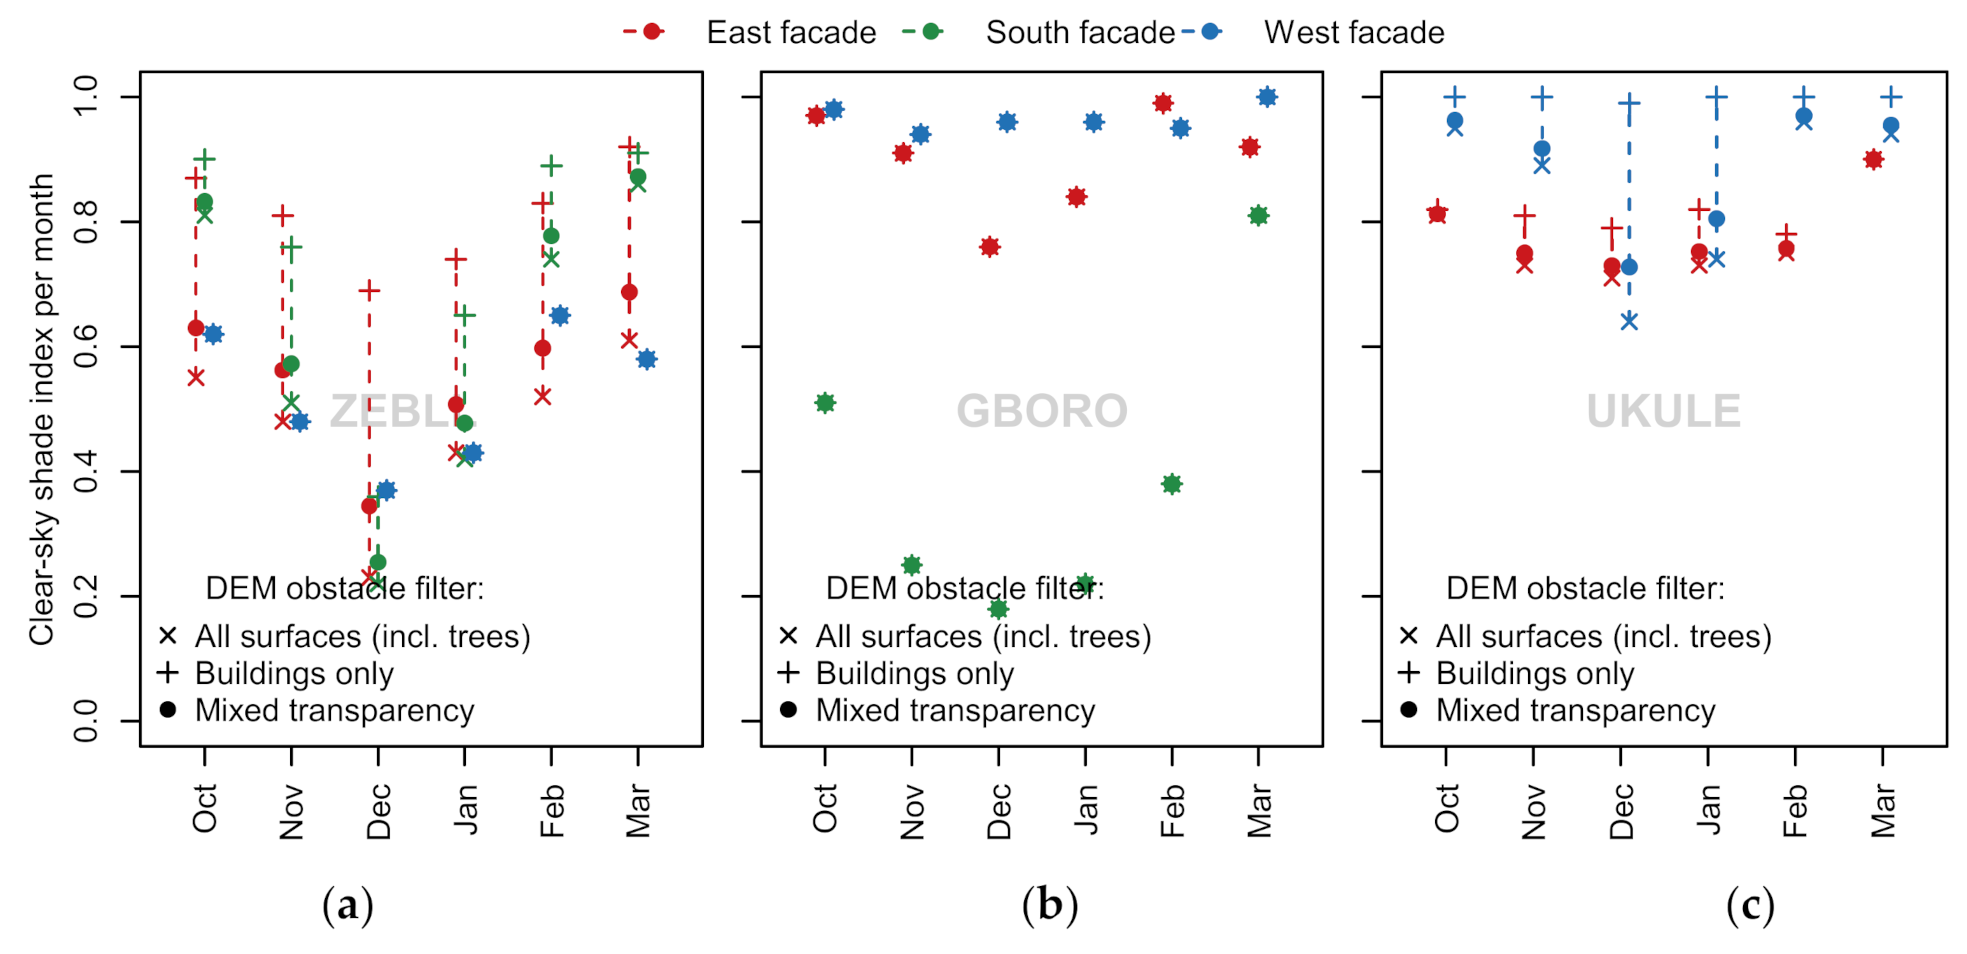
- For ZEBLL, the incoming direct radiation on the south and west façades is reduced substantially (up to 60%) by buildings in winter, and if trees are included, they may block beam insolation from south and east.
- -
- For the GBORO case building, trees have no shading impact, but the south façade is almost entirely in shadow from December to February, rapidly diminishing in March as the mid-day solar angle climbs.
- -
- For UKULE, which on average has moderate shading of vertical beam irradiance (ca. 20% reduction) on the two facades, the west façade is only shaded from vegetation.
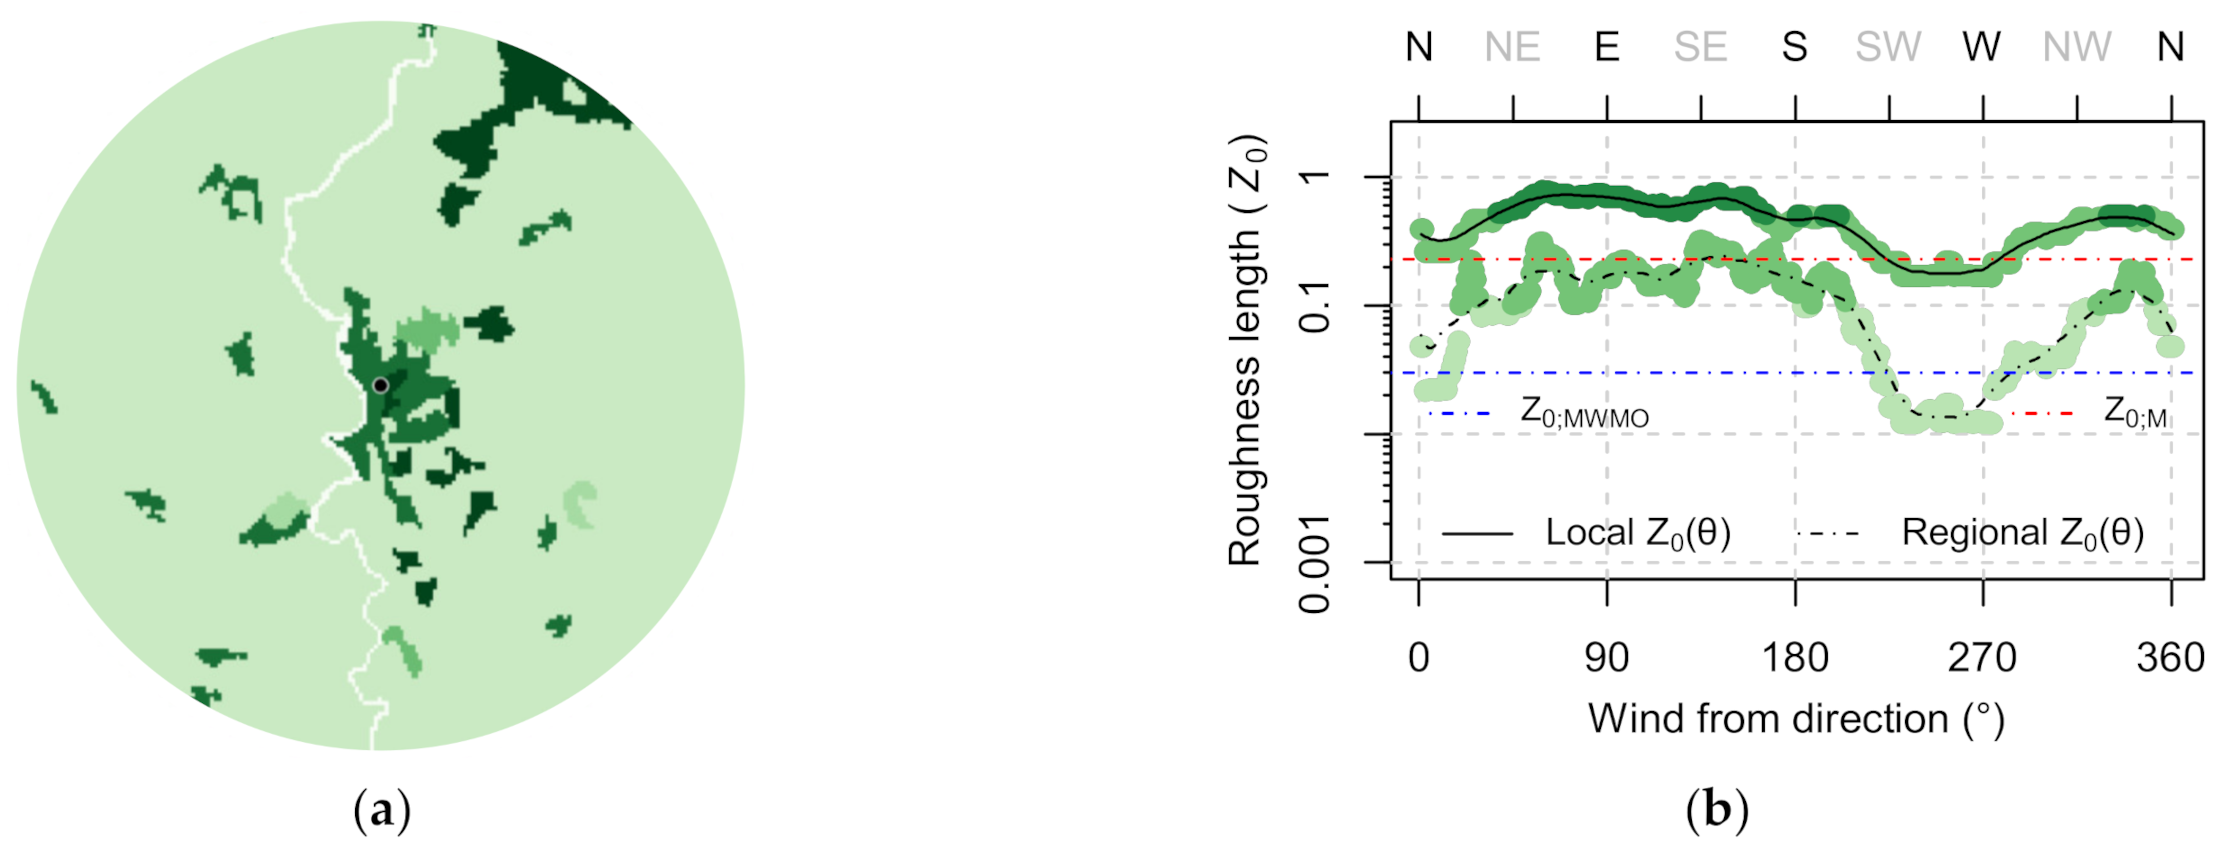
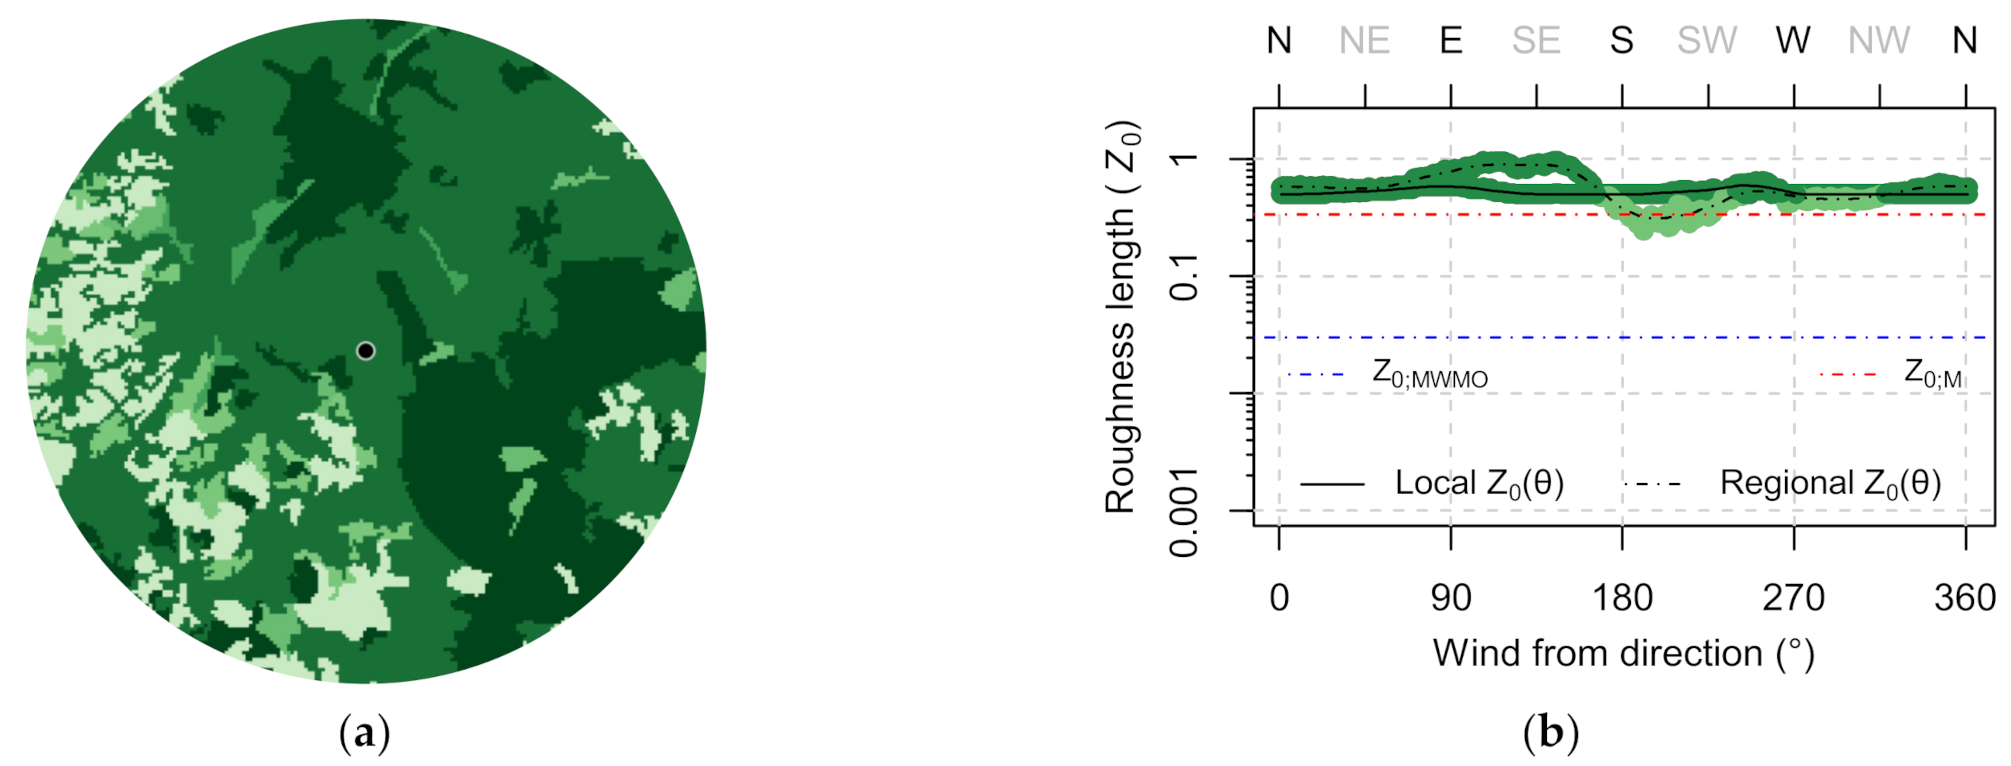
3.4. Surface Roughness and Wind Sheltering
3.4.1. Unobstructed Height Adjusted Wind Speed
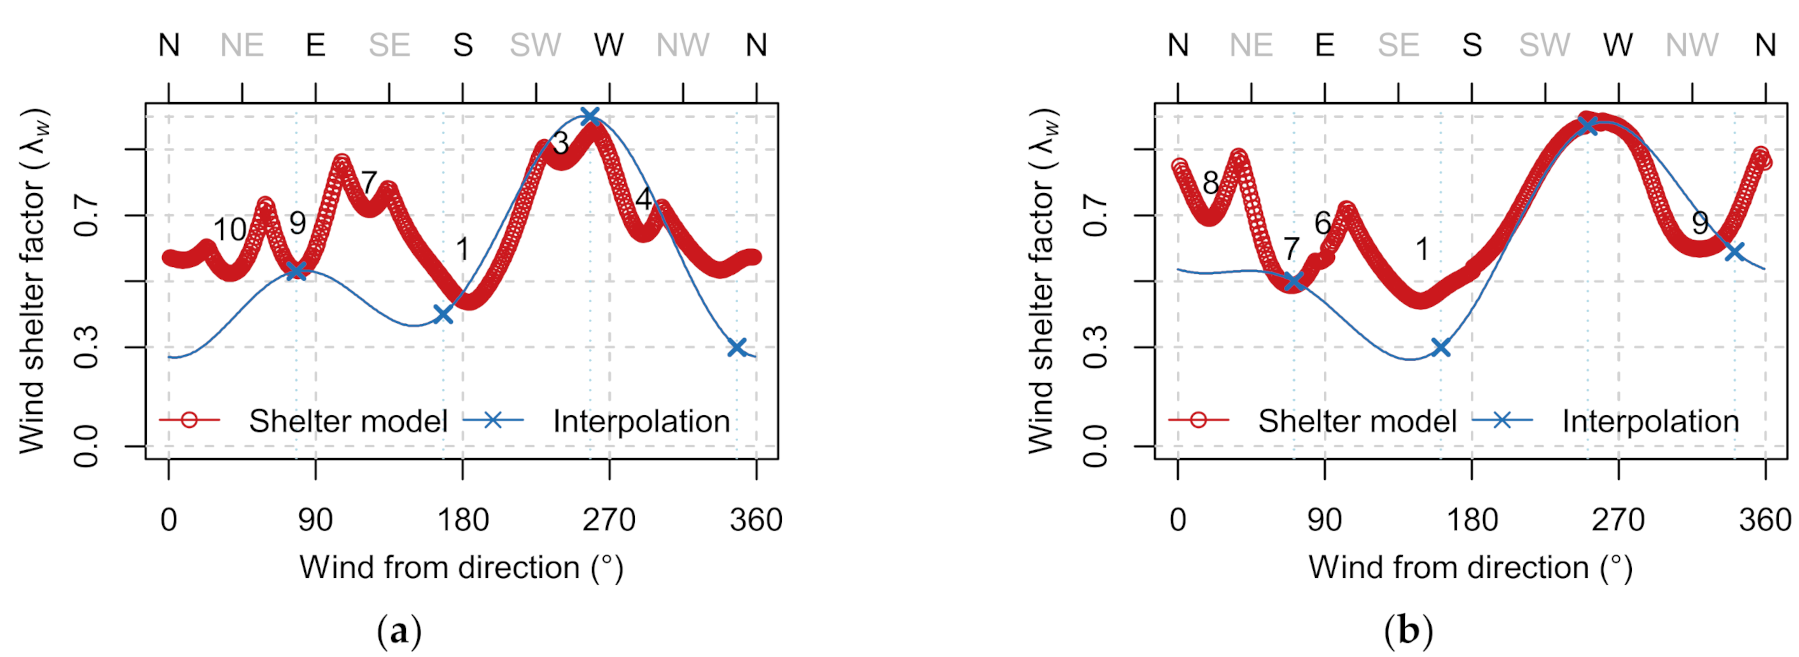
3.4.2. Wind Sheltering of Nearby Obstructions
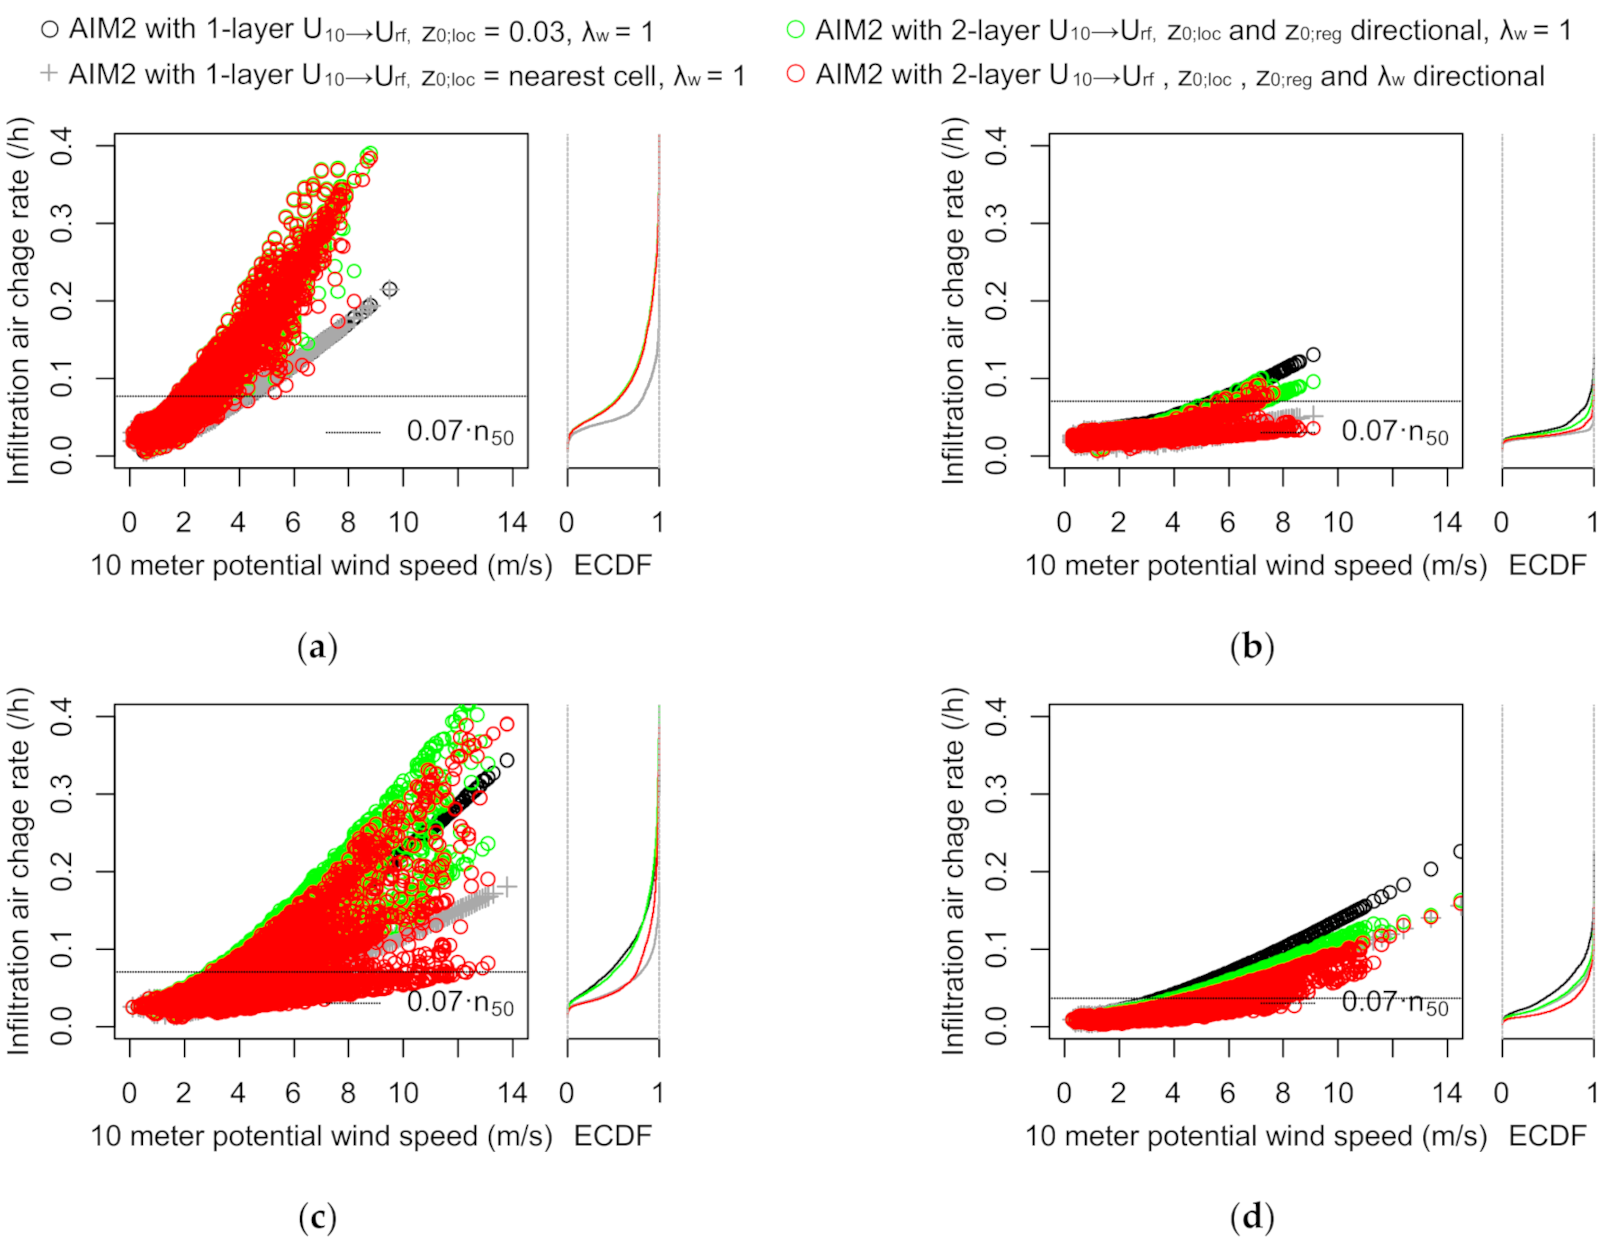
3.4.3. Infiltration Loss
- The black horizontal line is a common conversion of the n50 infiltration rate to 1 atm. pressure, simply multiplying the n50 values by a constant of 0.07, a rule-of-thumb conversion factor representative of a moderately sheltered building with more than one exposed façade.
- The black dots show the infiltration rate with a neutral logarithmic correction to roof height using the same surface roughness value of 0.03 m present in the reanalysis surface wind.
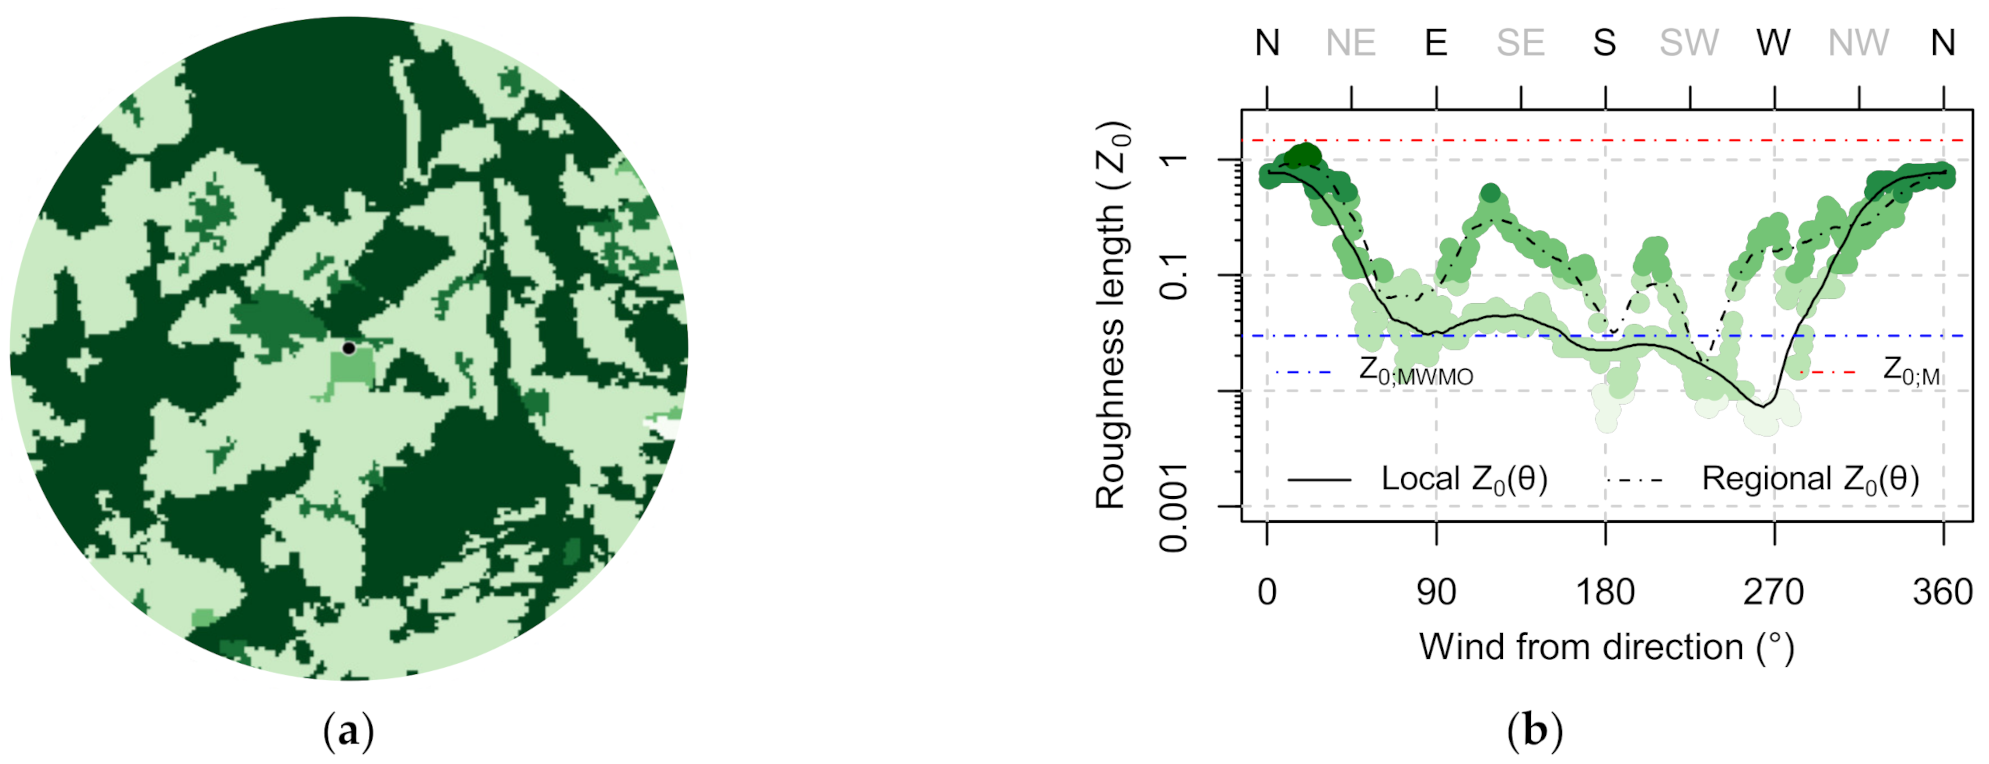
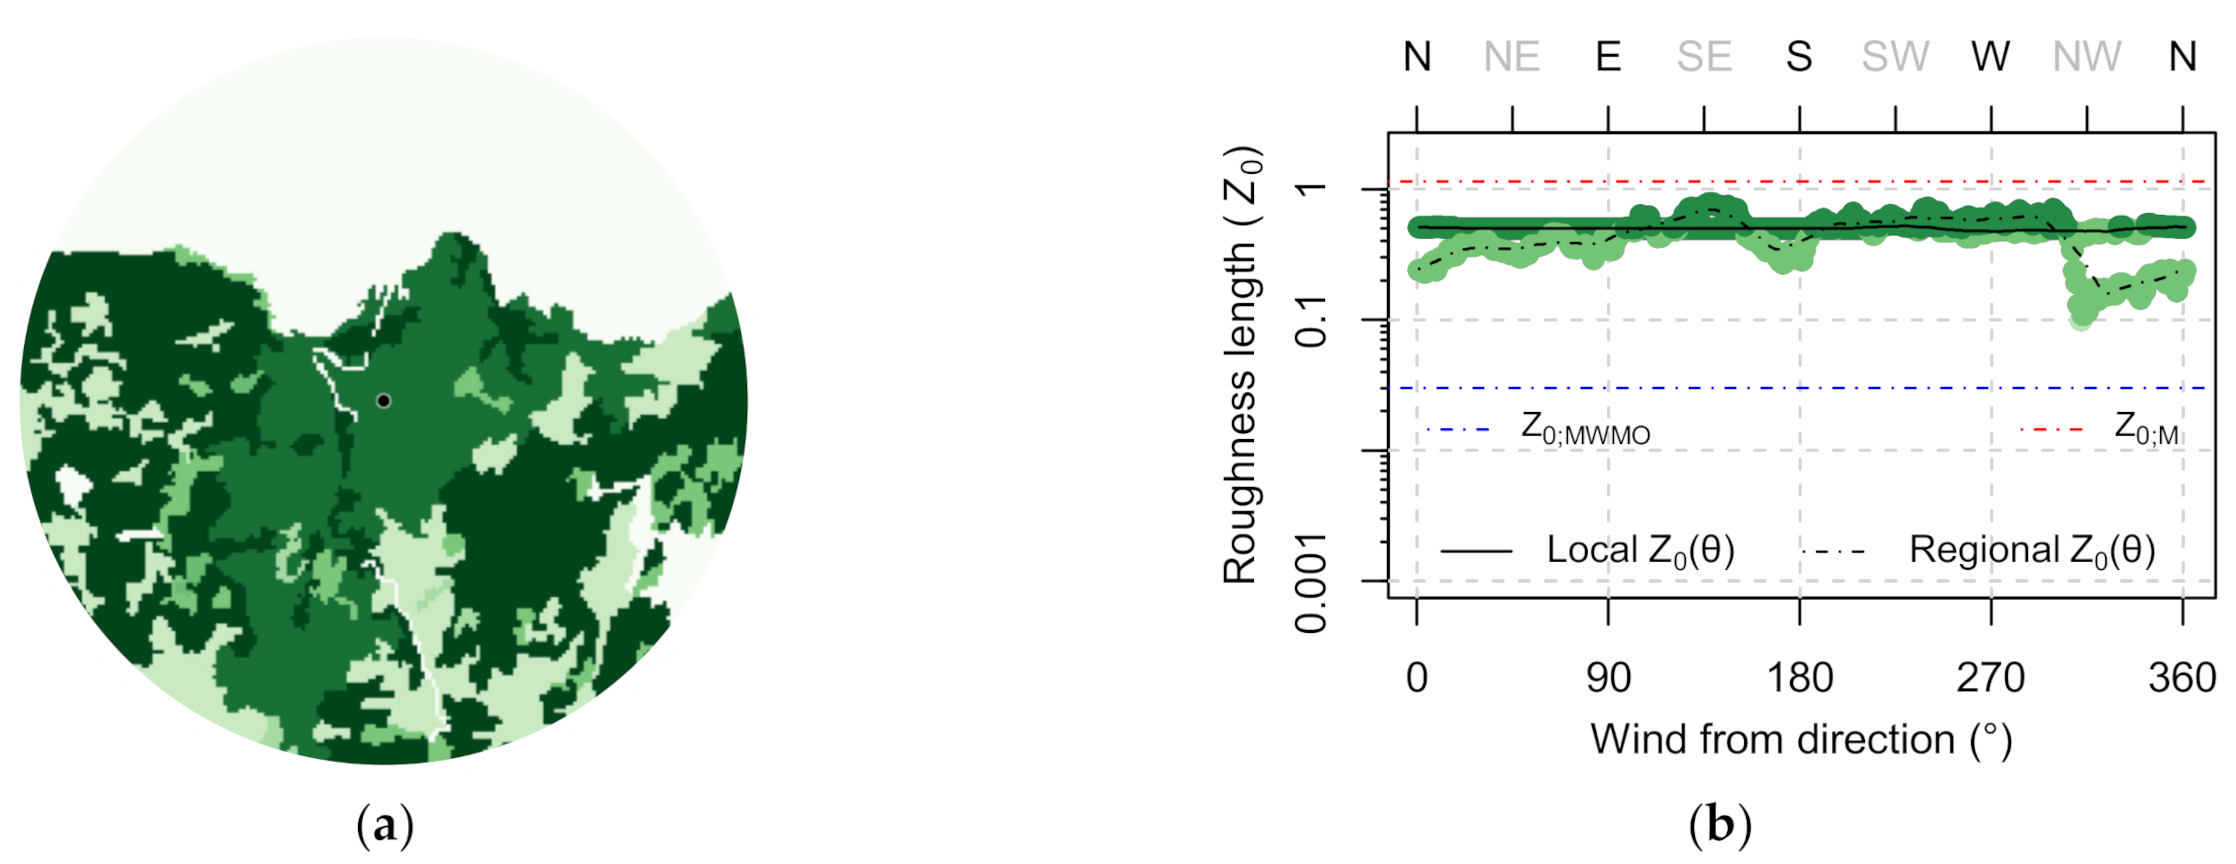
- The grey crosses show the infiltration rate using a transformation from 10-m potential wind to roof height using a local roughness value. The local surface roughness obtained from the CLC-classification is 0.03 m for case (a) TWINS and 1.0 m for the other cases (Table 4).
- The green points show the infiltration rate using the full 2L transformation of reanalysis wind.
- The red points show the infiltration rate using the same 2L transformation with the directional surface sheltering method to account for nearby obstructions.
4. Conclusions
Author Contributions
Funding
Data Availability Statement
Acknowledgments
Conflicts of Interest
Appendix A
| Parameter (N, E, S, W) | TWINS | ZEBLL | GBORO | UKULE |
|---|---|---|---|---|
| Facade height hk | 4 m | 2.8 m | 5.0 m | 6.5 m |
| Aperture above gr. h0;k | 1.2 m | 0.6 m | 0.5 m | 1.7 m |
| Façade azimuth az (°) | (180 90 0 -90) | (176 86 -4 -94) | (-168 112 12 -78) | (-161 109 19 -71) |
| Glazing distribution fgl | (.07 .21 .49 .23) | (.19 .25 .40 .16) | (0 .22 .39 .39) | (0 .41 0 .59) |
| Window area Awi | 23.9 m2 | 39.3 m2 | 14.7 m2 | 40.1 m2 |
| Frame factor Ffr;wi | 0.23 | 0.40 | 0.33 | 0.31 |
| Transmittance ggl;n;wi | 0.67 | 0.5 | 0.67 | 0.67 |
| Parameter | Case 1 | Case 2 | Case 3 | Case 4 |
|---|---|---|---|---|
| Floors Nfl | 2 | 1.5 | 2 | 4 |
| Int. building height hb | 5.2 m | 3.4 m | 5.5 m | 11.3 m |
| Air tightness n50 | 1.0 h−1 | 1.0 h−1 | 1.0 h−1 | 0.5 h−1 |
| Flow coefficient n | 0.67 | 0.67 | 0.67 | 0.67 |
| Indoor temperature | 21 | 21 | 21 | 21 |
Appendix B
B.1. The AIM-2 Infiltration Model
B.2. The Wind Shadow Method
Appendix C
References
- Roth, M. The Use of Reanalysis in ASHRAE Applications. ASHRAE Trans. 2020, 126, 580–592. [Google Scholar]
- Qiu, X.; Roth, M.; Corbett-Hains, H.; Fuquan, Y. Mesoscale Climate Modeling Procedure Development and Performance Evaluation. ASHRAE Trans. 2016, 122, 186–201. [Google Scholar]
- Pelosi, A.; Terribile, F.; D’Urso, G.; Chirico, G.B. Comparison of ERA5-Land and UERRA MESCAN-SURFEX Reanalysis Data with Spatially Interpolated Weather Observations for the Regional Assessment of Reference Evapotranspiration. Water 2020, 12, 1669. [Google Scholar] [CrossRef]
- Krähenmann, S.; Walter, A.; Brienen, S.; Imbery, F.; Matzarakis, A. High-resolution grids of hourly meteorological variables for Germany. Theor. Appl. Climatol. 2018, 131, 899–926. [Google Scholar] [CrossRef]
- MET Norway NWP Wiki; GitHub: San Francisco, CA, USA. 2020. Available online: https://github.com/metno/NWPdocs/wiki/Post-processed-products (accessed on 12 October 2020).
- Dörenkämper, M.; Olsen, B.; Witha, B.; Hahmann, A.; Davis, N.; Barcons, J.; Ezber, Y.; García-Bustamante, E.; González Rouco, J.F.; Navarro, J.; et al. The Making of the New European Wind Atlas—Part. 2: Production and Evaluation. Geosci. Model Dev. 2020, 13, 5079–5102. [Google Scholar] [CrossRef]
- Udina, M.; Montornès, À.; Casso, P.; Kosović, B.; Bech, J. WRF-LES Simulation of the Boundary Layer Turbulent Processes during the BLLAST Campaign. Atmosphere 2020, 11, 1149. [Google Scholar] [CrossRef]
- Resch, B.; Sagl, G.; Törnros, T.; Bachmaier, A.; Eggers, J.-B.; Herkel, S.; Narmsara, S.; Gündra, H. GIS-Based Planning and Modeling for Renewable Energy: Challenges and Future Research Avenues. ISPRS Int. J. Geo Inf. 2014, 3, 662–692. [Google Scholar] [CrossRef]
- Biljecki, F.; Stoter, J.; Ledoux, H.; Zlatanova, S.; Çöltekin, A. Applications of 3D City Models: State of the Art Review. ISPRS Int. J. Geo Inf. 2015, 4, 2842–2889. [Google Scholar] [CrossRef]
- Lindberg, F.; Grimmond, C.S.B.; Gabey, A.; Huang, B.; Kent, C.W.; Sun, T.; Theeuwes, N.E.; Jrvi, L.; Ward, H.C.; Capel-Timms, I.; et al. Urban Multi-scale Environmental Predictor (UMEP). Environ. Model. Softw. 2018, 99, 70–87. [Google Scholar] [CrossRef]
- Altaweel, M. Python and Geospatial Analysis. Available online: https://www.gislounge.com/python-and-geospatial-analysis/ (accessed on 12 January 2021).
- ESRI ArcGIS REST API. Available online: https://developers.arcgis.com/rest/ (accessed on 10 December 2020).
- Biljecki, F.; Ledoux, H.; Stoter, J. Generating 3D city models without elevation data. Comput. Environ. Urban Syst. 2017, 64, 1–18. [Google Scholar] [CrossRef]
- Wendel, J.; Murshed, S.M.; Sriramulu, A.; Nichersu, A. Development of a Web-Browser Based Interface for 3D Data—A Case Study of a Plug-in Free Approach for Visualizing Energy Modelling Results. In Progress in Cartography; Springer: New York, NY, USA, 2016; pp. 185–205. [Google Scholar]
- European Commission. The INSPIRE Geoportal. Available online: https://inspire-geoportal.ec.europa.eu/ (accessed on 12 November 2020).
- Walker, I.S.; Wilson, D. The Alberta Air Infiltration Model: AIM-2; Department of Mechanical Engineering, University of Alberta: Edmonton, AL, Canada, 1990. [Google Scholar]
- Walker, I.S.; Wilson, D.J.; Forest, T.W. Wind Shadow Model for Air Infiltration Sheltering by Upwind Obstacles. HVAC&R Res. 1996, 2, 265–282. [Google Scholar]
- Coetzee, S.; Ivánová, I.; Mitasova, H.; Brovelli, M.A. Open Geospatial Software and Data: A Review of the Current State and A Perspective into the Future. ISPRS Int. J. Geo Inf. 2020, 9, 90. [Google Scholar] [CrossRef]
- Clarke, J.A. Why Tools for Buildings and Cities Performance Simulation Need to Evolve. Available online: https://www.buildingsandcities.org/insights/commentaries/tools-for-buildngs-and-cities-performance.html (accessed on 28 December 2020).
- Clarke, J. IOP Simulation-Based Procedure for the Holistic Resilience Testing of Building Performance. In Conference Series: Earth and Environmental Science; IOP Publishing: Bristol, UK, 2019; p. 12027. [Google Scholar]
- Manfren, M.; Nastasi, B.; Groppi, D.; Astiaso Garcia, D. Open data and energy analytics—An analysis of essential information for energy system planning, design and operation. Energy 2020, 213, 118803. [Google Scholar] [CrossRef]
- Copernicus Land Monitoring Service. CORINE Land Cover. 2018. Available online: https://land.copernicus.eu/pan-european/corine-land-cover/clc2018 (accessed on 15 May 2020).
- Copernicus Land Monitoring Service. EU-DEM v1.1. Available online: https://land.copernicus.eu/imagery-in-situ/eu-dem (accessed on 15 May 2020).
- Tabas, D.; Fang, J.; Porté-Agel, F. Wind Energy Prediction in Highly Complex Terrain by Computational Fluid Dynamics. Energies 2019, 12, 1311. [Google Scholar] [CrossRef]
- Silva, J.; Ribeiro, C.; Guedes, R.; Rua, M.-C.; Ulrich, F. Roughness length classification of Corine Land Cover classes. In Proceedings of the EWEC, Milano, Italy, 7–10 May 2007; Citseer: Princeton, NJ, USA, 2007. [Google Scholar]
- NASA Land Processes Distributed Active Archive Center (LP DAAC). Available online: https://lpdaac.usgs.gov/ (accessed on 12 November 2020).
- Szypuła, B. Quality assessment of DEM derived from topographic maps for geomorphometric purposes. Open Geosci. 2019, 11, 843–865. [Google Scholar] [CrossRef]
- Huld, T. PVMAPS: Software tools and data for the estimation of solar radiation and photovoltaic module performance over large geographical areas. Sol. Energy 2017, 142, 171–181. [Google Scholar] [CrossRef]
- Statens Kartverk Høydedata. Available online: https://hoydedata.no/ (accessed on 10 September 2020).
- Bayerische Vermessungsverwaltung. Gebühren- und Preisliste für Geobasisdaten der Bayerischen Vermessungsverwaltung. 2020. Available online: ldbv.bayern.de/file/pdf/1269/Preisliste_aktuell.pdf (accessed on 15 April 2020).
- Lingfors, D.; Bright, J.M.; Engerer, N.A.; Ahlberg, J.; Killinger, S.; Widén, J. Comparing the capability of low- and high-resolution LiDAR data with application to solar resource assessment, roof type classification and shading analysis. Appl. Energy 2017, 205, 1216–1230. [Google Scholar] [CrossRef]
- Buffat, R.; Grassi, S.; Raubal, M. A scalable method for estimating rooftop solar irradiation potential over large regions. Appl. Energy 2018, 216, 389–401. [Google Scholar] [CrossRef]
- Redweik, P.; Catita, C.; Brito, M. Solar Energy potential on roofs and facades in an urban landscape. Sol. Energy 2013, 97, 332–341. [Google Scholar] [CrossRef]
- Brito, M.C.; Redweik, P.; Catita, C.; Freitas, S.; Santos, M. 3D Solar Potential in the Urban Environment: A Case Study in Lisbon. Energies 2019, 12, 3457. [Google Scholar] [CrossRef]
- Lindberg, F.; Jonsson, P.; Honjo, T.; Wästberg, D. Sol. Energy on building envelopes—3D modelling in a 2D environment. Sol. Energy 2015, 115, 369–378. [Google Scholar] [CrossRef]
- Chen, Z.; Gao, B.; Devereux, B. State-of-the-Art: DTM Generation Using Airborne LIDAR Data. Sensors 2017, 17, 150. [Google Scholar] [CrossRef] [PubMed]
- Nex, F.; Remondino, F. UAV for 3D mapping applications: A review. Appl. Geomat. 2014, 6. [Google Scholar] [CrossRef]
- Puente, I.; Gonzalez, H.; Arias, P.; Armesto, J. Land-Based Mobile Laser Scanning Systems: A review. Int. Arch. Photogramm. Remote Sens. Spat. Inf. Sci. 2011, 38. [Google Scholar] [CrossRef]
- Brovelli, M.A.; Zamboni, G. A new method for the assessment of spatial accuracy and completeness of OpenStreetMap building footprints. ISPRS Int. J. Geo Inf. 2018, 7, 289. [Google Scholar] [CrossRef]
- Fan, H.; Zipf, A.; Fu, Q.; Neis, P. Quality assessment for building footprints data on OpenStreetMap. Int. J. Geo Inf. Sci. 2014, 28, 700–719. [Google Scholar] [CrossRef]
- Hjelseth, E.; Thiis, T. Use of BIM and GIS to enable climatic adaptations of buildings. In Ework and Ebusiness in Architecture, Engineering and Construction; Christodoulou, S., Scherer, R., Eds.; CRC Press Taylor & Francis Group: Boca Raton, FL, USA, 2008; pp. 409–417. [Google Scholar]
- Hufkens, K.; Reto, S.; Campitelli, E. ECMWFR: Programmatic Interface to the Two European Centre for Medium-Range Weather Forecasts API Services; Version 1.2.0; Zenodo: Meyrin, Switzerland, 2019. [Google Scholar]
- Lundström, L. CamSrad: Client for CAMS Radiation Service; Version 0.3. 0; R Package; R Core Team: Vienna, Austria, 2016. [Google Scholar]
- Nisbet, A. Open Topo Data; GitHub: San Francisco, CA, USA, 2020; Available online: https://github.com/ajnisbet/opentopodata/ (accessed on 11 November 2020).
- Peronato, G. getHorizon; Laboratory of Integrated Performance in Design (LIPID), Ecole Polytechnique Fédérale de Lausanne (EPFL): Lausanne, Switzerland, 2017. [Google Scholar]
- Lundström, L. Total Solar Irradiance According to ISO 52010-1:2017; GitHub: San Francisco, CA, USA, 2018; Available online: https://github.com/lukas-rokka/solarCalcISO52010 (accessed on 2 May 2020).
- Stepek, A.; Wijnant, I.L. Interpolating Wind Speed Normals from the Sparse Dutch Network to a High Resolution Grid Using Local Roughness from Land Use Maps; Royal Netherlands Meteorological Institute: De Bilt, The Netherlands, 2011. [Google Scholar]
- Caires, S.; de Waal, H.; Groeneweg, J.; Groen, G.; Wever, N.; Geerse, C.; Bottema, M. Assessing the uncertainties of using land-based wind observations for determining extreme open-water winds. J. Wind Eng. Ind. Aerodyn. 2012, 110, 70–85. [Google Scholar] [CrossRef]
- Hersbach, H.; Bell, B.; Berrisford, P.; Hirahara, S.; Horányi, A.; Muñoz-Sabater, J.; Nicolas, J.; Peubey, C.; Radu, R.; Schepers, D.; et al. The ERA5 global reanalysis. Q. J. R. Meteorol. Soc. 2020, 146. [Google Scholar] [CrossRef]
- Muñoz Sabater, J. First ERA5-Land dataset to be released this spring. ECMWF Newslett. 2019, 159, 8–9. [Google Scholar]
- Hogan, R. Radiation Quantities in the ECMWF Model and MARS. Technical Report ECMWF. 2015. Available online: https://www.ecmwf.int/node/18490 (accessed on 10 April 2020).
- Babar, B.; Graversen, R.; Boström, T. Solar radiation estimation at high latitudes: Assessment of the CMSAF databases, ASR and ERA5. Sol. Energy 2019, 182, 397–411. [Google Scholar] [CrossRef]
- Schroedter-Homscheidt, M.; Hoyer-Klick, C.; Killius, N.; Betcke, J.; Lefèvre, M.; Wald, L.; Wey, E.; Saboret, L. User’s Guide to the CAMS Radiation Service (CRS): Status December 2018; Copernicus Atmosphere Monitoring Service. 2019. Available online: http://www.soda-pro.com/documents/10157/326332/CAMS72_2015SC3_D72.1.3.1_2018_UserGuide_v1_201812.pdf/95ca8325-71f6-49ea-b5a6-8ae4557242bd (accessed on 10 April 2020).
- Qu, Z.; Oumbe, A.; Blanc, P.; Espinar, B.; Gesell, G.; Gschwind, B.; Klüser, L.; Lefèvre, M.; Saboret, L.; Schroedter-Homscheidt, M.; et al. Fast radiative transfer parameterisation for assessing the surface solar irradiance: The Heliosat-4 method. Meteorol. Z. 2017, 26, 33–57. [Google Scholar] [CrossRef]
- Ramon, J.; Lledó, L.; Torralba, V.; Soret, A.; Doblas-Reyes, F.J. What global reanalysis best represents near-surface winds? Q. J. R. Meteorol. Soc. 2019, 145, 3236–3251. [Google Scholar] [CrossRef]
- Olauson, J. ERA5: The new champion of wind power modelling? Renew. Energy 2018, 126, 322–331. [Google Scholar] [CrossRef]
- Vortex. Vortex ERA5 Downscaling: Validation Results; VORTEX FdC S.L.: Barcelona, Spain, 2017; p. 11. [Google Scholar]
- Wang, X.; Tolksdorf, V.; Otto, M.; Scherer, D. WRF-based Dynamical Downscaling of ERA5 Reanalysis Data for High Mountain Asia: Towards a New Version of the High Asia Refined Analysis. Int. J. Climatol. 2020. [Google Scholar] [CrossRef]
- Wieringa, J. Roughness-dependent geographical interpolation of surface wind speed averages. Q. J. R. Meteorol. Soc. 1986, 112, 867–889. [Google Scholar] [CrossRef]
- European Centre for Medium-Range Weather Forecasts. Part IV: Physical Processes. In IFS Documentation CY41R2; ECMWF: Reading, UK, 2016. [Google Scholar]
- De Rooy, W.C.; Kok, K. A combined physical–statistical approach for the downscaling of model wind speed. Weather Forecast. 2004, 19, 485–495. [Google Scholar] [CrossRef]
- Baas, P.; Bosveld, F.; Burgers, G. The impact of atmospheric stability on the near-surface wind over sea in storm conditions. Wind Energy 2015, 19. [Google Scholar] [CrossRef]
- Troen, I.; Petersen, E.L. European Wind Atlas; Office of Scientific and Technical Information, U.S. Department of Energy: Oak Ridge, TN, USA, 1989.
- Barrachina, A.B.; Beek, J.V.; Alzamora, F.M.; Jiménez, P. Using downscaled NCEP/NCAR reanalysis data for wind resource mapping. Int. J. Energy Environ. 2014, 5, 305–316. [Google Scholar]
- Van Ackere, S.; Van Eetvelde, G.; Schillebeeckx, D.; Papa, E.; Van Wyngene, K.; Vandevelde, L. Wind Resource Mapping Using Landscape Roughness and Spatial Interpolation Methods. Energies 2015, 8, 8682–8703. [Google Scholar] [CrossRef]
- Verkaik, J.W. On Wind and Roughness over Land. Ph.D. Thesis, Wageningen Universiteit, Wageningen, The Nederlands, 2006. [Google Scholar]
- Verkaik, J.W.; Jacobs, A.; Tijm, A.; Onvlee, J. Local Wind Speed Estimation by Physical Downscaling of Weather model forecasts. J. Wind Eng. Ind. Aerodyn. 2005, submitted. [Google Scholar]
- Wever, N.; Groen, G. Improving Potential Wind for Extreme Wind Statistics; Koninklijk Nederlands Meteorologisch Institut: De Bilt, The Netherlands, 2009. [Google Scholar]
- Fröhlich, D.; Matzarakis, A. Spatial Estimation of Thermal Indices in Urban Areas—Basics of the SkyHelios Model. Atmosphere 2018, 9, 209. [Google Scholar] [CrossRef]
- Singh, B.; Pardyjak, E.; Brown, M. Testing of a Far-wake Parameterization for a Fast Response Urban Wind Model. In Proceedings of the Sixth Symposium on the Urban Environment/14th Joint Conference on the Applications of Air Pollution Meteorology with the Air and Waste Management Association, Atlanta, GA, USA, 27 January–3 February 2006. [Google Scholar]
- Grimmond, C.; Oke, T.R. Aerodynamic properties of urban areas derived from analysis of surface form. J. Appl. Meteorol. 1999, 38, 1262–1292. [Google Scholar] [CrossRef]
- Sawachi, T.; Maruta, E.; Takahashi, Y.; Ken-ichi, S. Wind Pressure Coefficients for Different Building Configurations with and without an Adjacent Building. Int. J. Vent. 2006, 5, 21–30. [Google Scholar] [CrossRef]
- Brunskill, A.; Lubitz, W. A neural network shelter model for small wind turbine siting near single obstacles. Wind Struct. 2012, 15, 43–64. [Google Scholar] [CrossRef][Green Version]
- Hansen, A.; Peterka, J.A.; Cermak, J.E. Wind-Tunnel Measurements in the Wake of a Simple Structure in a Simulated Atmospheric Flow; Libraries, Colorado State University: Fort Collins, CO, USA, 1975. [Google Scholar]
- Sherman, M.; Grimsrud, D. Measurement of Infiltration Using Fan Pressurization and Weather Data. In Proceedings of the First Air Infiltration Centre Conference, Windsor, UK, 6–8 October 1980; p. 81. [Google Scholar]
- Strachan, P. ESP-r: Summary of Validation Studies; Energy Systems Research Unit, University of Strathclyde: Glasgow, UK, 2002. [Google Scholar]
- American Society of Heating, Refrigerating and Air-Conditioning Engineers. ASHRAE Handbook, Edition SI; American Society of Heating, Refrigerating and Air-Conditioning Engineers: Atlanta, GA, USA, 2017. [Google Scholar]
- Walker, I.S.; Wilson, D.J. Field validation of algebraic equations for stack and wind driven air infiltration calculations. HVAC&R Res. 1998, 4, 119–139. [Google Scholar]
- Madsen, H.; Bacher, P.; Bauwens, G.; Deconinck, A.-H.; Reynders, G.; Roels, S.; Himpe, E.; Lethé, G. Thermal Performance Characterization Using Time Series Data—IEA EBC Annex 58 Guidelines; DTU Compute-Technical Report-2015, 8; Technical University of Denmark: Copenhagen, Denmark, 2015. [Google Scholar]
- Stamp, S.; Altamirano-Medina, H.; Lowe, R. Measuring and accounting for solar gains in steady state whole building heat loss measurements. Energy Build. 2017, 153, 168–178. [Google Scholar] [CrossRef]
- Sandu, I.; Beljaars, A.; Bechtold, P.; Mauritsen, T.; Balsamo, G. Why is it so difficult to represent stably stratified conditions in numerical weather prediction (NWP) models? J. Adv. Model. Earth Syst. 2013, 5, 117–133. [Google Scholar] [CrossRef]
- Over, M. OpenDEM Europe; Universität Bonn Geographie, FOSSGIS: Bonn, Germany, 2018. [Google Scholar]
- Gras, D. EU-DEM Statistical Validation Report; European Environment Agency: Copenhagen, Denmark, 2014. [Google Scholar]
- Wang, W.; Beausoleil-Morrison, I.; Reardon, J. Evaluation of the Alberta air infiltration model using measurements and inter-model comparisons. Build. Environ. 2009, 44, 309–318. [Google Scholar] [CrossRef]
- Hayati, A.; Mattsson, M.; Sandberg, M. Evaluation of the LBL and AIM-2 air infiltration models on large single zones: Three historical churches. Build. Environ. 2014, 81, 365–379. [Google Scholar] [CrossRef]
- Tirfe, A.; Zhang, J. A Novel Approach to Near-Real Time Monitoring of Ventilation Rate and Indoor Air Quality in Residential Houses. In Proceedings of the 7th International Building Physics Conference, Syracuse, NY, USA, 23–26 September 2018; Syracuse University: Syracuse, NY, USA, 2018; pp. 841–846. [Google Scholar]
- Lundström, L.; Akander, J.; Zambrano, J. Development of a Space Heating Model Suitable for the Automated Model Generation of Existing Multifamily Buildings—A Case Study in Nordic Climate. Energies 2019, 12, 485. [Google Scholar] [CrossRef]
- Wills, A.D. On the Modelling and Analysis of Converting Existing Canadian Residential Communities to Net-Zero Energy. Ph.D. Thesis, Carleton University, Ottawa, ON, Canada, April 2018. [Google Scholar]
- Francisco, P.W.; Palmiter, L. Modeled and Measured Infiltration in Ten Single-Family Homes. In Proceedings of the ACEEE Summer Study on Energy Efficiency in Buildings; American Council for an Energy-Efficiency Economy: Washington, DC, USA, 1996. [Google Scholar]
- Tirfe, A. A Novel Approach to Near-Real Time Monitoring of Ventilation Rate and Indoor Air Quality in Residential Houses. Ph.D. Thesis, Syracuse University, Syracuse, NY, USA, August 2018. [Google Scholar]
- Lundström, L.; Akander, J. Bayesian Calibration with Augmented Stochastic State-Space Models of District-Heated Multifamily Buildings. Energies 2020, 13, 76. [Google Scholar] [CrossRef]
- Lew, L. Evaluation of AIM-2; Natural Resources Canada: Ottawa, ON, Canada, 1993. [Google Scholar]
- Röckle, R. Bestimmung der Strömungsverhältnisse im Bereich Komplexer Bebauungsstrukturen. Ph.D. Thesis, Darmstadt Technische Hochschule, Darmstadt, Germany, 1990. [Google Scholar]




| Description | Weather Data Acquisition | Downscaling | Area of Local Study |
|---|---|---|---|
| Scale | Large scale (>10 km) | Medium scale | Small scale (<1 km) |
| User input | Latitude, longitude | Latitude, longitude | Latitude, longitude and building information |
| Datasets | Climate reanalysis, Satellite irradiance | Land cover maps, Satellite DEM | Building footprints, LiDAR DSM/DTM |
| Data resolution | 5 to 30 km | 30 to 100 m | <1 m |
| Data sources | Copernicus Climate & Atmosphere Data Store | Copernicus programme, and the JRC (PVGIS) | National authorities and crowdsourced (OSM) |
| Modelling techniques | Bilinear interpolation, nearest neighbour selection | 2-layer wind model [48], Perez transposition model | Wind shadow method [17], ISO shading method |
| Description | Name | ERA5 | ERA5land | Transformation |
|---|---|---|---|---|
| External air temperature at 2 m | θe | 2t | 2t | Kelvin to centigrade |
| Wind speed at 10 m | U10m | 10u, 10v | 10u, 10v | U10m = |
| Wind from direction at 10 m | D10m | 10u, 10v | 10u, 10v | D10m = |
| Forecasted surface roughness | fsr | |||
| Ground albedo without snow cover | αgr | ssr, ssrd | fal * | αgr = max( fal) |
| Snow cover | fsn | snowc | ||
| Ground albedo with snow cover | αgr;sn | asn | αgr;sn = | |
| Surface thermal radiation downwards | φstrd | strd | Joule to Watt-hours | |
| Sky temperature | θsky | θsky= |
| Mean Horizon | TWINS | ZEBLL | GBORO | UKULE | ||||
|---|---|---|---|---|---|---|---|---|
| Angle from DEM | Build. | Surf. | Build. | Surf. | Build. | Surf. | Build. | Surf. |
| North façade (°) | 3.1 | 3.1 | 8.2 | 28.6 | - | - | - | - |
| East facade (°) | 1.8 | 2.0 | 6.8 | 29.2 | 11.2 | 11.2 | 11.8 | 12.6 |
| South façade (°) | 1.4 | 1.8 | 8.9 | 12.7 | 19.4 | 19.4 | - | - |
| West façade (°) | 2.6 | 2.7 | 13.8 | 15.9 | 8.1 | 8.3 | 5.3 | 10.3 |
| TWINS | ZEBLL | GBORO | UKULE | |
|---|---|---|---|---|
| ERA5 forecasted in the nearest grid cell (31 km) | 1.52 | 1.17 | 0.23 | 0.34 |
| ERA5 open terrain roughness for U10 wind | 0.03 | 0.03 | 0.03 | 0.03 |
| Land cover map grid cell closest to site (100 m) | 0.03 | 1.00 | 1.00 | 1.00 |
| Infiltration Heat Loss | (a) TWINS | (b) ZEBLL | (c) GBORO | (d) UKULE | ||||
|---|---|---|---|---|---|---|---|---|
| Average Per Floor Area | W/m2 K | W/m2 | W/m2 K | W/m2 | W/m2 K | W/m2 | W/m2 K | W/m2 |
| Constant n500.07 | 0.08 | 1.35 | 0.08 | 1.57 | 0.07 | 0.89 | 0.03 | 0.47 |
| AIM2-1L, z0;WMO, λ = 1 | 0.06 | 1.00 | 0.04 | 0.87 | 0.09 | 1.11 | 0.04 | 0.60 |
| AIM2-1L, z0;CLC, λ = 1 | 0.06 | 1.00 | 0.03 | 0.60 | 0.05 | 0.66 | 0.03 | 0.43 |
| AIM2-2L, z0(θ), λ = 1 | 0.10 | 1.68 | 0.04 | 0.76 | 0.09 | 1.10 | 0.03 | 0.46 |
| AIM2-2L, z0(θ), λ(θ) | 0.10 | 1.63 | 0.03 | 0.67 | 0.06 | 0.78 | 0.02 | 0.33 |
Publisher’s Note: MDPI stays neutral with regard to jurisdictional claims in published maps and institutional affiliations. |
© 2021 by the authors. Licensee MDPI, Basel, Switzerland. This article is an open access article distributed under the terms and conditions of the Creative Commons Attribution (CC BY) license (http://creativecommons.org/licenses/by/4.0/).
Share and Cite
Skeie, K.; Gustavsen, A. Utilising Open Geospatial Data to Refine Weather Variables for Building Energy Performance Evaluation—Incident Solar Radiation and Wind-Driven Infiltration Modelling. Energies 2021, 14, 802. https://doi.org/10.3390/en14040802
Skeie K, Gustavsen A. Utilising Open Geospatial Data to Refine Weather Variables for Building Energy Performance Evaluation—Incident Solar Radiation and Wind-Driven Infiltration Modelling. Energies. 2021; 14(4):802. https://doi.org/10.3390/en14040802
Chicago/Turabian StyleSkeie, Kristian, and Arild Gustavsen. 2021. "Utilising Open Geospatial Data to Refine Weather Variables for Building Energy Performance Evaluation—Incident Solar Radiation and Wind-Driven Infiltration Modelling" Energies 14, no. 4: 802. https://doi.org/10.3390/en14040802
APA StyleSkeie, K., & Gustavsen, A. (2021). Utilising Open Geospatial Data to Refine Weather Variables for Building Energy Performance Evaluation—Incident Solar Radiation and Wind-Driven Infiltration Modelling. Energies, 14(4), 802. https://doi.org/10.3390/en14040802


