Article

Operating Hardware Impact on the Heat Transfer Properties of Windows

1
Department of Architecture and Technology, Norwegian University of Science and Technology (NTNU), NO‑7491 Trondheim, Norway
2
Lawrence Berkeley National Laboratory (LBNL), Windows and Daylighting Group, Berkeley, CA 94720, USA
3
Department of Civil and Environmental Engineering, Norwegian University of Science and Technology (NTNU), NO‑7491 Trondheim, Norway
*
Author to whom correspondence should be addressed.
Energies 2021, 14(4), 1145; https://doi.org/10.3390/en14041145
Submission received: 1 February 2021 / Revised: 11 February 2021 / Accepted: 15 February 2021 / Published: 21 February 2021
(This article belongs to the Section G: Energy and Buildings)

Abstract

:
Despite significant advancements in fenestration technology in the last two decades, the thermal transmittance of fenestration products is still significantly higher than that of walls. This corresponds to 60% of the total energy loss of a modern building envelope through the windows. Hence, further development and improvements of fenestration products are necessary. Increasingly stringent codes and standards for fenestration stimulate industry to work on improved solutions. Thus, it is crucial that assessment techniques are able to account for innovations accurately. The thermal effects of non-continuous hardware in window frames are currently ignored by international rating procedures. A preliminary investigation conducted by our team showed significant performance degradation in two of the three out-opening casement profiles caused by the presence of operating hardware. Frames with the structure made of vinyl and fiberglass consist of many air cavities that are penetrated by operating hardware made of highly conductive materials. In these frames, in order to have an accurate assessment, it may be required to employ three-dimensional modeling due to the convective nature of heat transfer within the cavities. However, in this study, we demonstrate that the three-dimensional (3D) effects of non-continuous hardware can be approximated accurately with simpler two-dimensional (2D) simulations. We then develop a simplified model based on weighted average capable of replacing the time- and computation-intensive 3D simulations with 2D simulations and validate it against market available frames and their corresponding hardware. Validation results show that our approximation technique results in discrepancies lower than 0.05 W/(m2K), or 3% of the total thermal transmittance. Thus, we conclude that simplified 2D simulation models may be used for predicting hardware impact in window frames with reasonable accuracy. As windows and glazing structures are becoming ever better thermally insulated, it is becoming even more important to be able to model the impact of the operating hardware on the total thermal performance in order to design the best windows possible and not let the operating hardware ruin an otherwise well-proven design, which is hence addressed in this study.

1. Introduction

Windows represent an inseparable and growing component of the building envelope and have a large impact on the thermal performance, and thus also on the energy efficiency of buildings. The trend of increasing fenestration-to-wall area in modern residential and commercial constructions is seen worldwide. On the one hand, windows contribute to a better living standard by providing a view out, daylight, and beneficial heat gains [1,2]. On the other hand, fenestration may contribute to higher thermal heat losses and non-desirable solar heat gains [3,4]. Currently, the thermal transmittance of fenestration components is still significantly higher than typical for walls. Studies show that up to 60% of the total energy loss through a modern building envelope can be attributed to windows. Therefore, improved fenestration products have considerable potential to provide energy savings [5].
Overall, window thermal performance is defined by the component properties of glazing, frame, and spacer. There have been intense research and development activities in all areas of window technology over the last few decades. Glazing, due to its high share of the assembly area, is the most influential factor determining the thermal performance and also the most heavily researched one. Several studies have investigated insulating glazing units (IGUs) thermal and spectral properties [6,7,8,9], while others proposed alternative contructions to replace traditional IGUs [10,11,12,13,14]. The most advanced IGUs currently on the market have U-values around 0.3–0.5 W/(m2K) and typically employ three glass layers, two or more low-emissivity (low-E) coatings, and an inert gas fill. Spacers separate glass panes in IGUs and typically create a thermal bridge effect at the connection between the IGUs and window frames. Spacer thermal performance has been improved substantially in recent years by the introduction of new designs including less conductive materials [15,16,17].
Window frames typically constitute 20–30% of the total window area. The desire to create frames with thin profiles and high strength often leads to the use of conductive materials such as aluminum and steel that significantly reduce the overall product thermal performance. Over the years, many studies have focused on finding new solutions to improve the frame thermal performance and develop numerical assessment strategies for window frames [18,19,20,21,22,23,24,25,26]. Frames continue to be the weakest thermal insulation part of highly insulating windows, but they are improving, and the most insulating frame profiles now have U-values in the range of 0.6–0.8 W/(m2K).
As frame performance improves, we must ensure that the simulation standards continue to represent their performance accurately. Gustavsen et al. [5] conducted a simulation study showing the importance of continuous window frame elements such as spacers, frame cavities, and solid materials properties. The work defined research targets for window frame components that will result in a better frame thermal performance. While continuous frame hardware is accounted for, none of the common international numerical assessment procedures, such as ISO 10077-1 [27] or NFRC 100 [28], consider non-continuous hardware effects on the thermal performance of windows.
The thermal effects of non-continuous frame hardware are justifiably ignored for the relatively low-performing frames typically produced today, but their impact may become significant for highly insulating windows [29,30]. A preliminary investigation [31] was conducted by our team to determine how typical hardware designs impact frame sill sections. Four different 600 mm long sill geometries were modeled in three-dimensions using computational fluid dynamics (CFD). Geometries incorporating hardware were compared to base frames, and the hardware effects on frame thermal performance were determined. Two of the three out-opening casement profiles examined showed performance degradation greater than 0.05 W/(m2K), which is considered significant with regards to ISO and NFRC rating systems. The research demonstrated that fastener types, hardware location within the frame, and other factors related to the method of hardware implementation might significantly impact the effect of hardware on the frame. Neither the base performance level nor the primary frame material appeared to determine the thermal effect of hardware based on those metrics alone [31]. Since non-continuous operating hardware has been shown to significantly impact frame performance, a more detailed study was needed to develop models that can efficiently predict the thermal and, hence, energy efficiency impact of non-continuous hardware.
Modern and well-insulating windows nowadays are often made of vinyl and fiberglass. These frames consist of many air cavities, which in actual designs are often penetrated with highly thermally conductive operating hardware. Local changes in surface temperatures and perforations between the cavities cause convection and thus play an important role in the heat transfer process. In order to account for air flows in different directions, 3D simulations may be necessary for an accurate thermal assessment. In this study, a model has been developed that replaces the time- and labor-consuming three-dimensional (3D) CFD simulations with two-dimensional (2D) modeling while providing acceptable accuracy.
To achieve the best energy efficiency in buildings, the thermal performance of modern and highly insulating windows is becoming even more crucial, and, hence, it will be important to be able to model the impact of the operating hardware of windows and thereby choose the best window design so that the operating hardware does not spoil an otherwise satisfactory thermally insulating design.

2. Theory and Calculation Methodology

2.1. Theory

The thermal effects of non-continuous operating hardware are currently ignored in window thermal assessment procedures. Since operating hardware designs differ significantly from each other, it is necessary to develop relatively simple methods to account for hardware impacts on frame thermal performance.

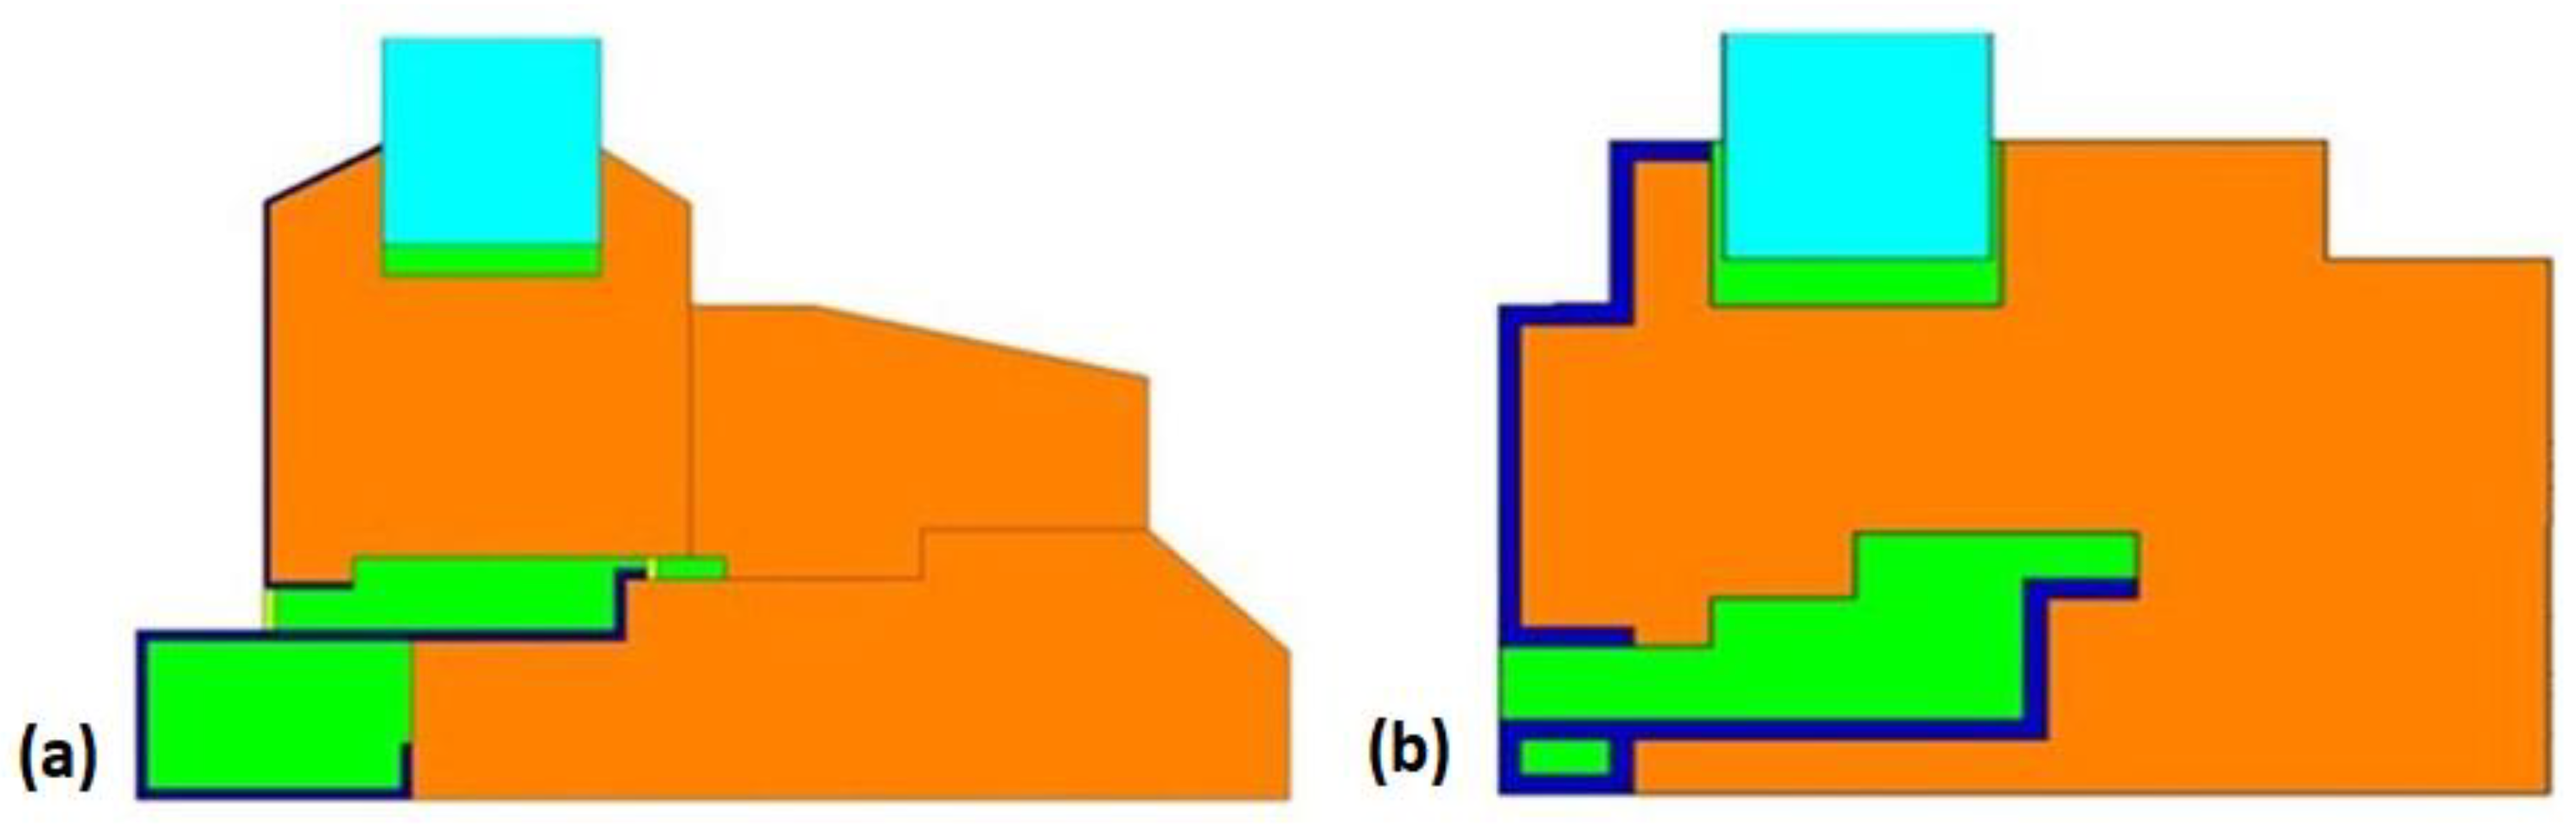
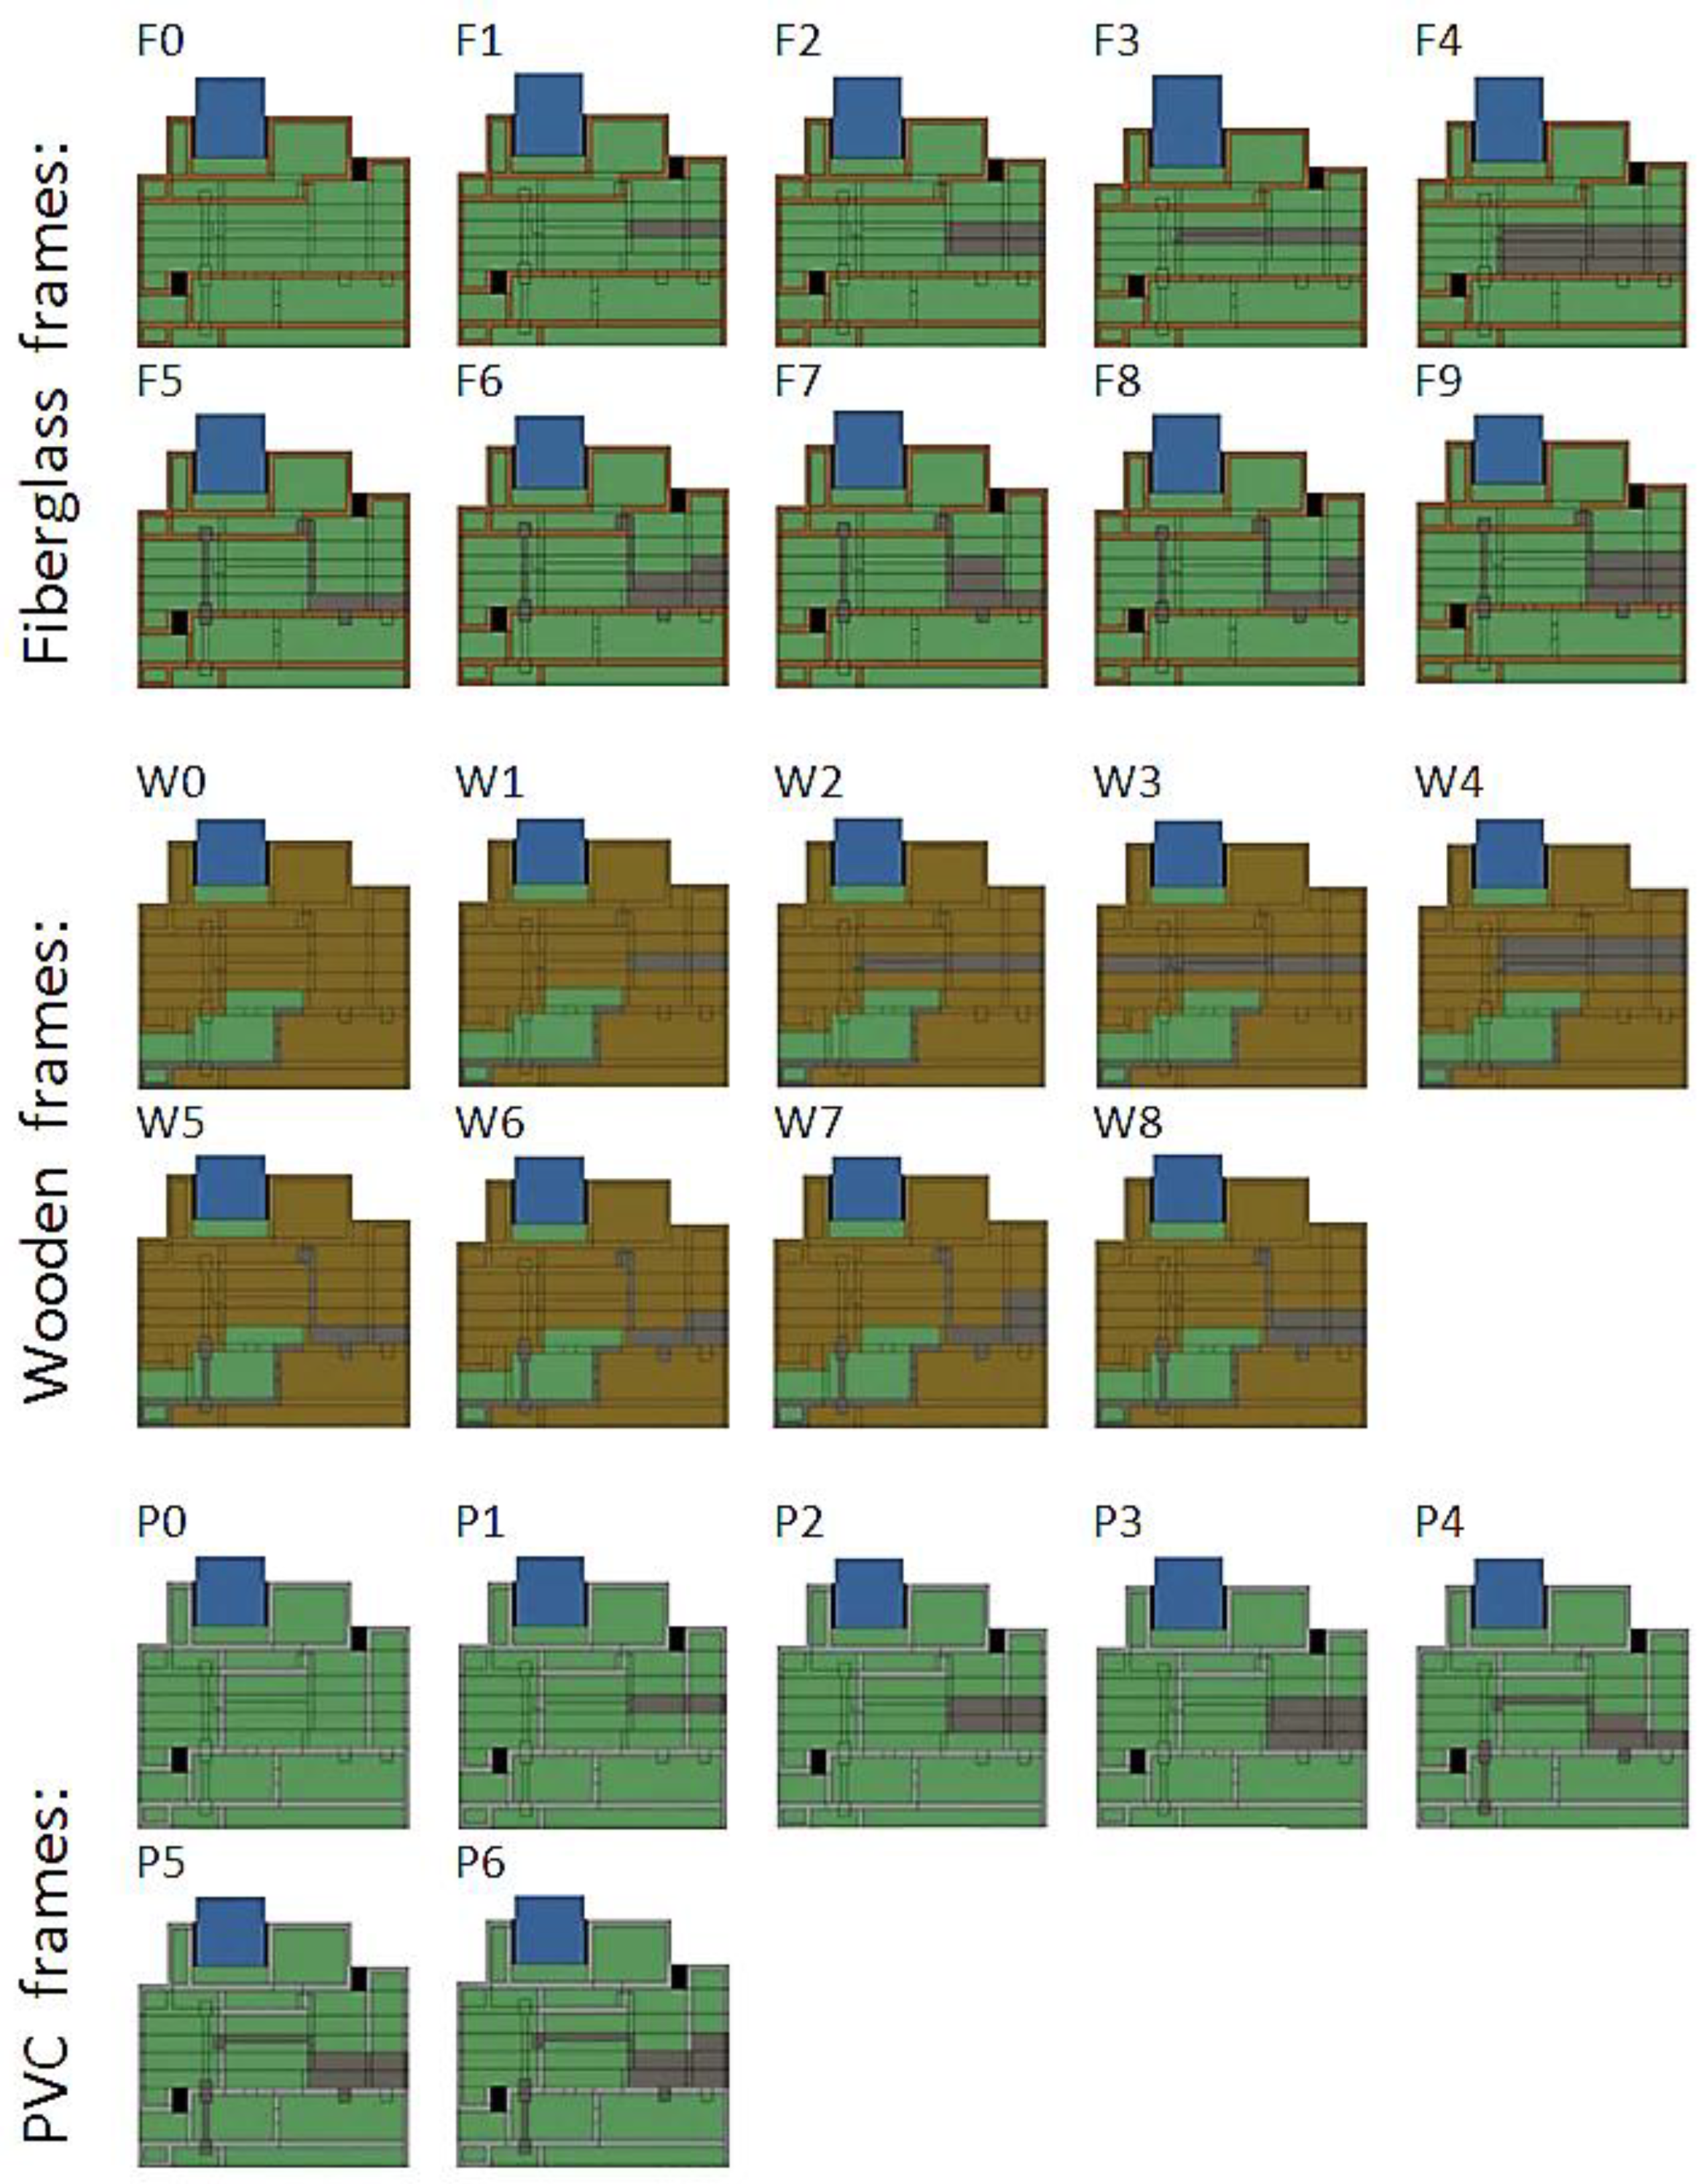
2.2. Frame Geometries

Initial investigations conducted by our team [31] examined hardware designs for fiberglass, wooden, and PVC frames. Actual frame and hardware designs were simplified to minimize simulation time without significant loss of calculation accuracy. Simplified operating hardware geometries investigated in the study are presented in Figure 1.
The current study utilizes geometries investigated in the initial work [31] as inputs for a generic frame (GF) design. GF geometry is created to accommodate the 24 mm glazing panel described in ISO 10077, all frame types presented in Figure 1, and several different hardware designs by a simple change of material properties. Two-dimensional heat transfer calculations performed in THERM software [32], indicate a maximum 3 percent difference in U-value between the original simplified geometries and revised GF-based geometries. Figure 2 illustrates the wooden frame transformation from the simplified version used in the preliminary study (a) to the design based on the generic frame (b). Use of this modeling approach significantly increases the mesh generation and simulation speed of the 3D geometries utilized in the current study.
The 2D generic frames were extruded to 3D to create 600 mm long sill geometries. The geometries were divided into 30 vertical sections along the length of the frame (z-axis in Figure 3). Each resulting cross-section is 20 mm wide and consists of 117 components. These subdivisions allowed for estimation of different hardware designs in several lengths. Figure 3 presents the intersection of GF geometry and 3D assembly of an example sill.

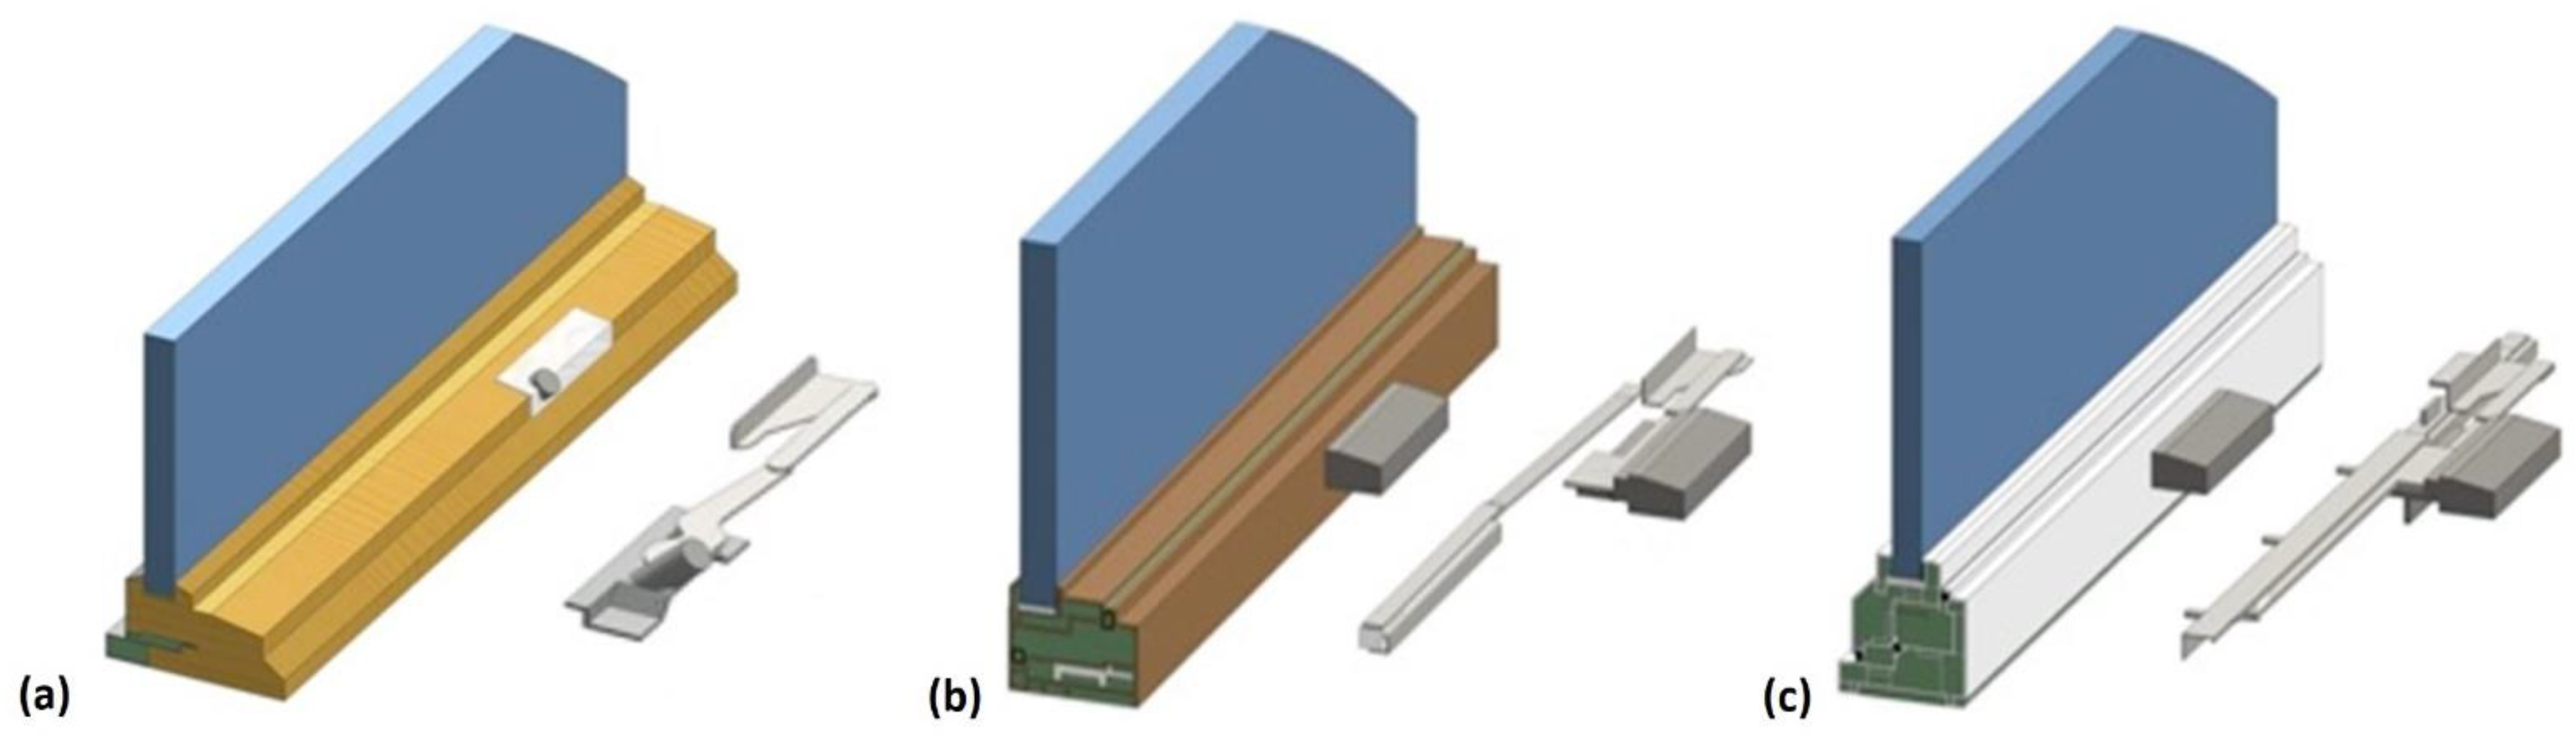
2.3. Hardware Configurations

Altogether, 11 simplified and 12 realistic hardware configurations in the cross-section profiles were investigated. The hardware geometries range from minimal to significant penetration into the frame profiles. The cross-sections of the three base frame types (fiberglass, wood, and PVC) considered in this study, along with the hardware configurations considered for each frame, are presented in Figure 4.

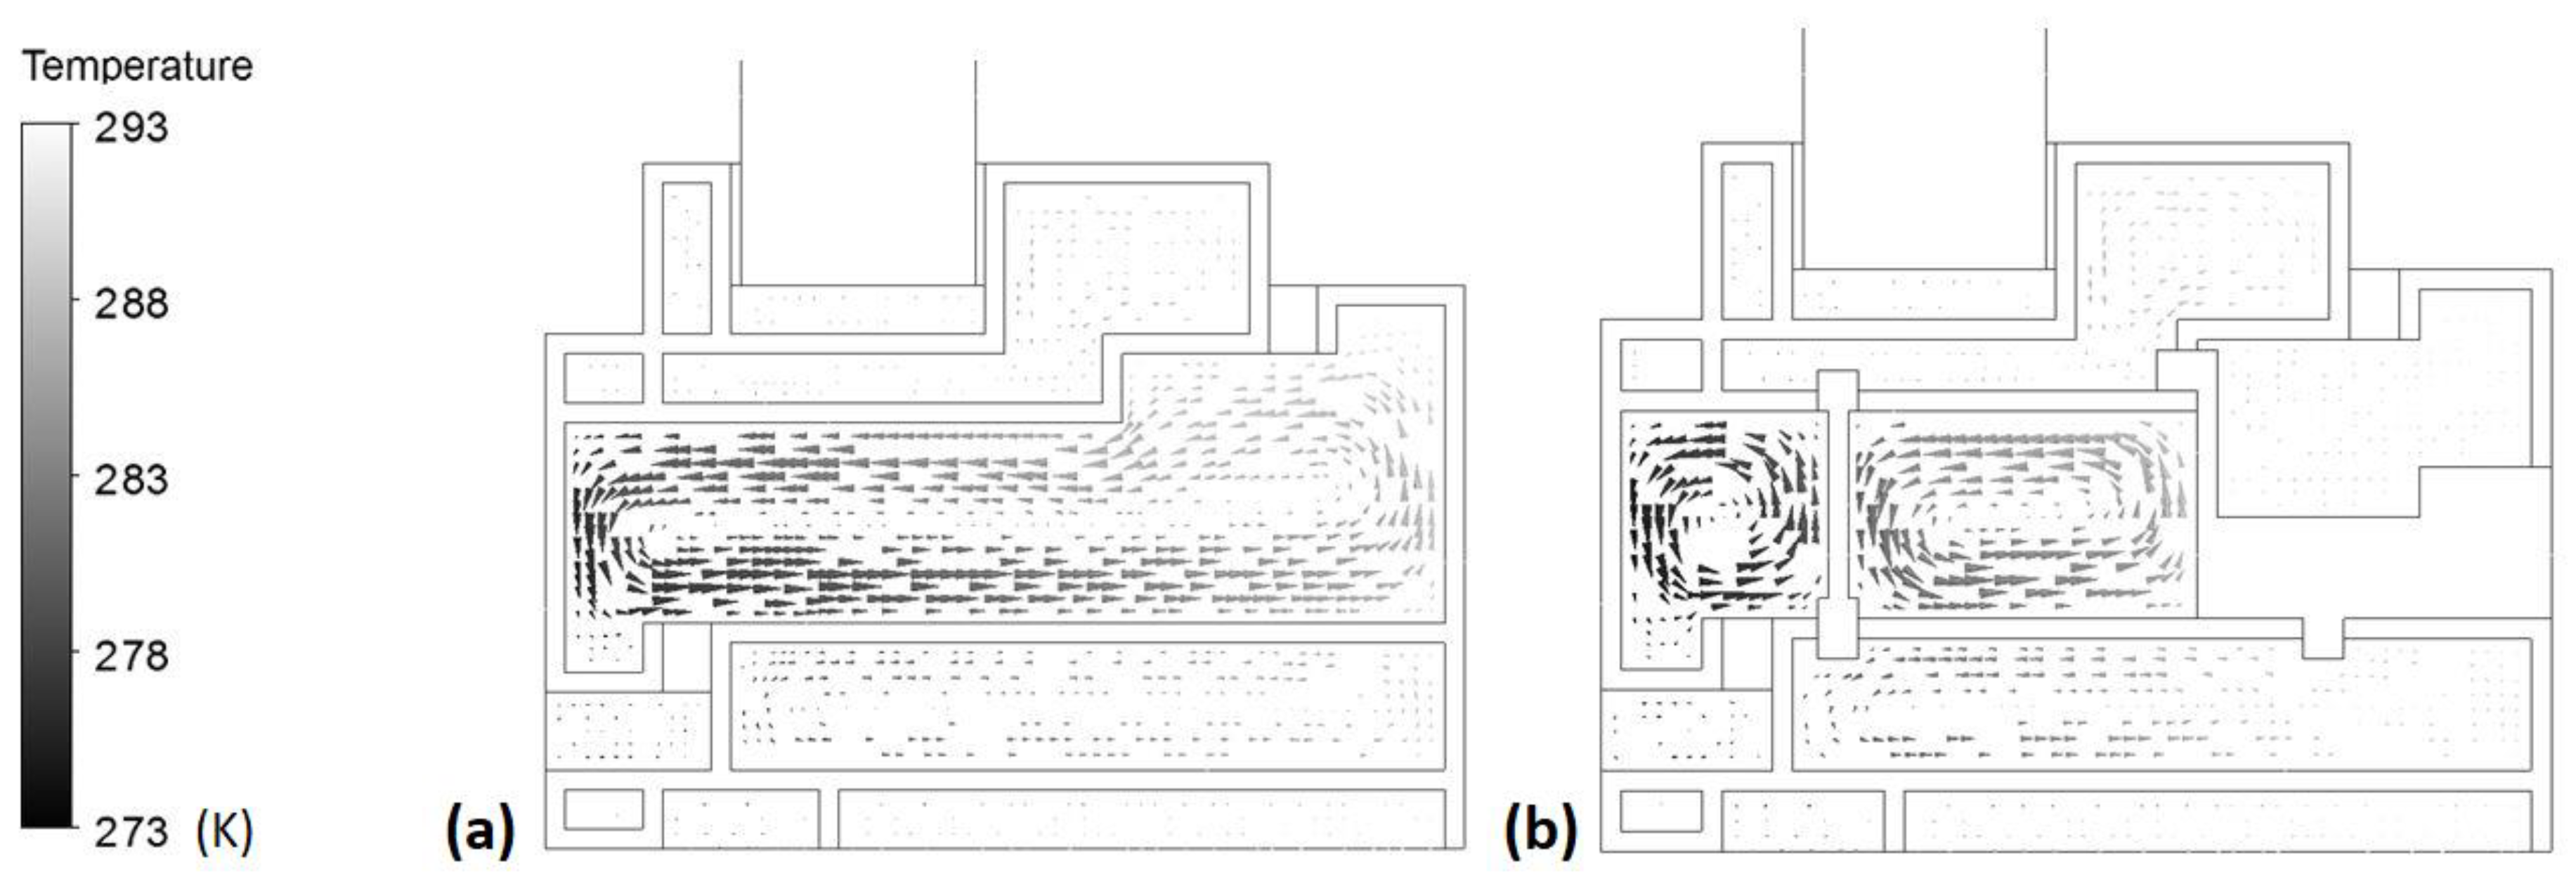
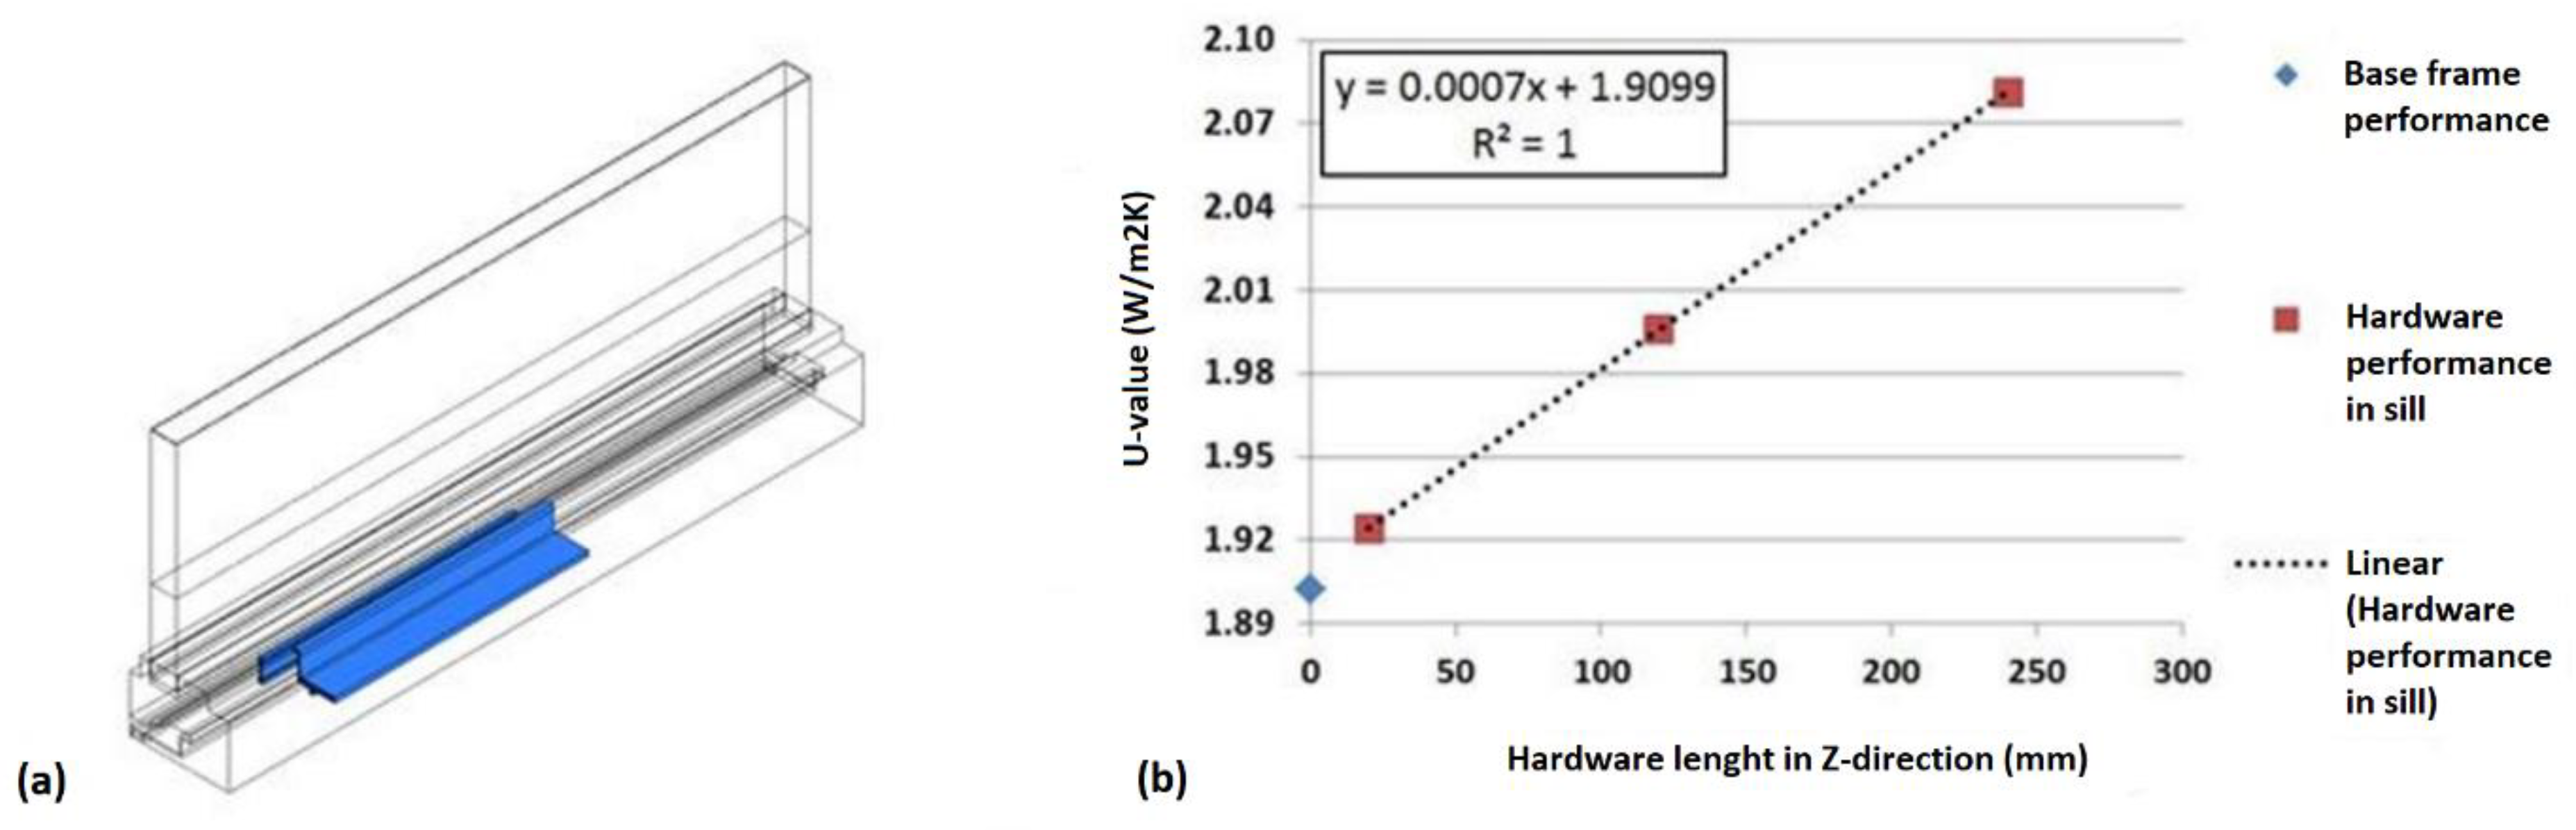
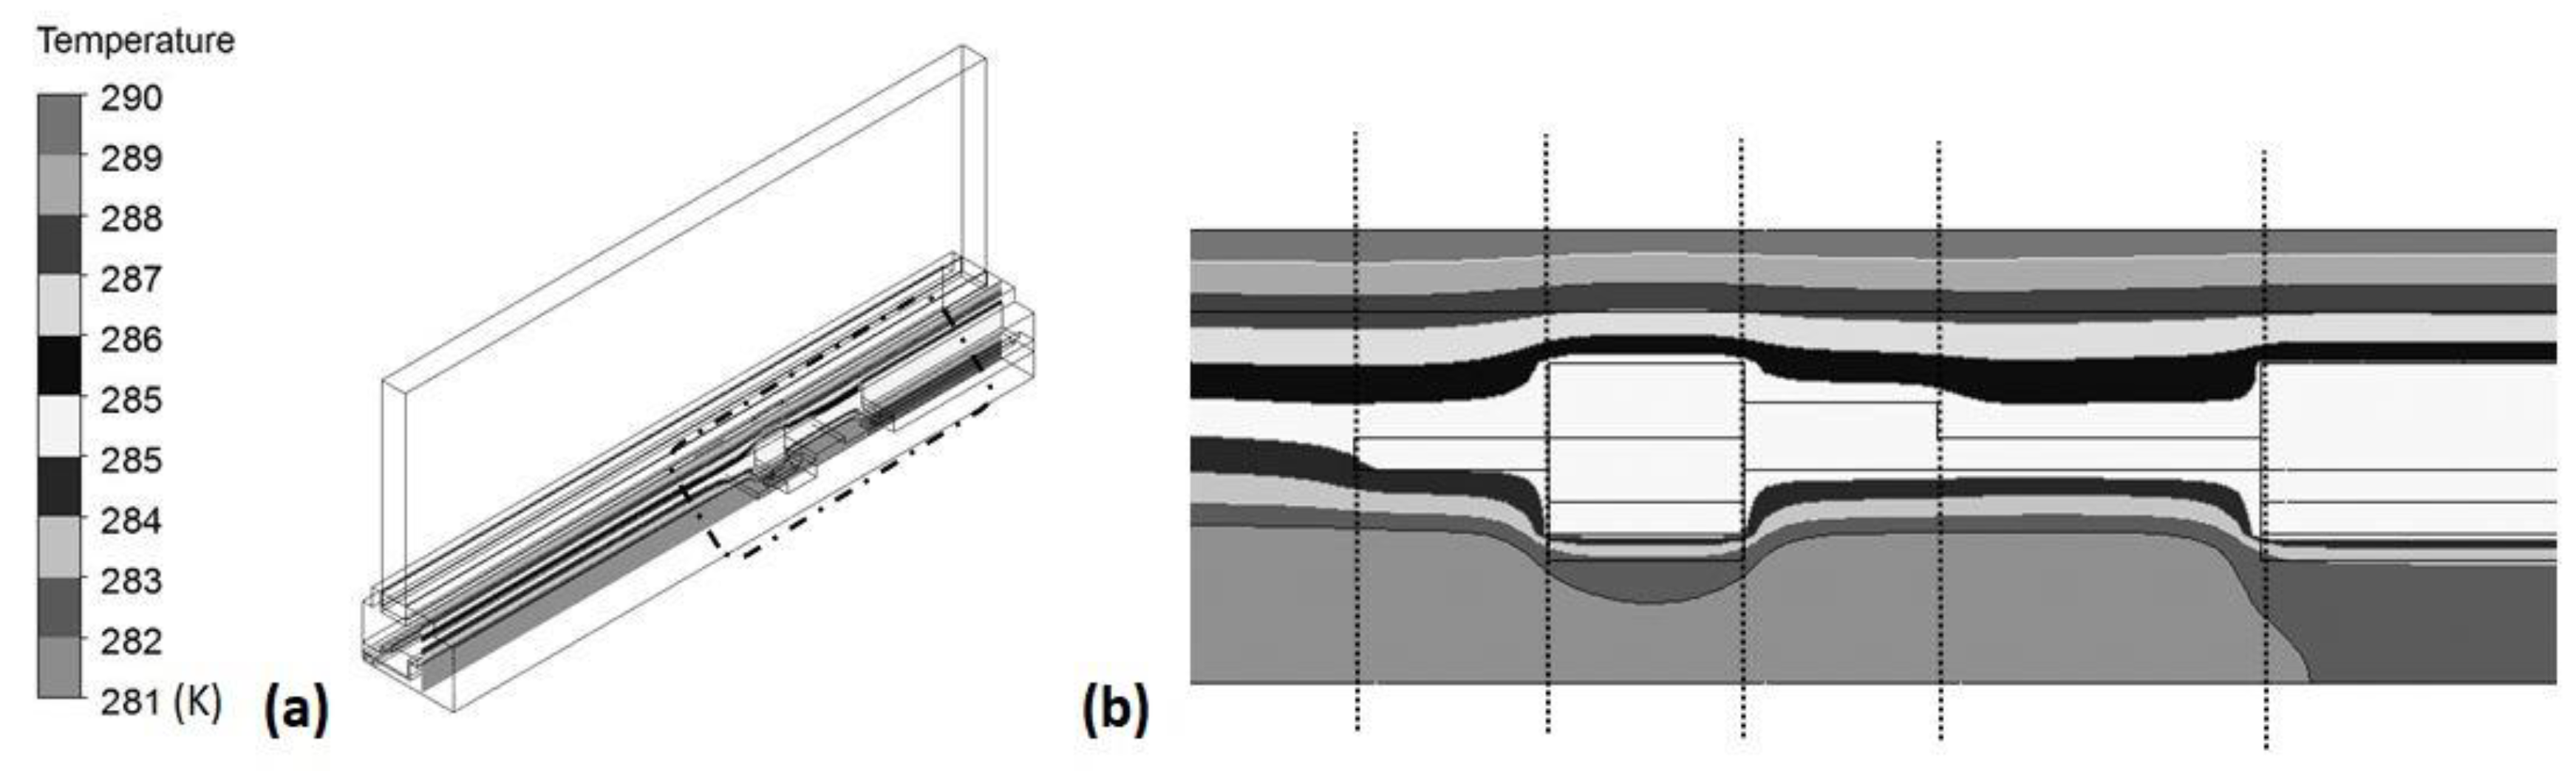
2.4. Numerical Simulations

In the CFD program (ANSYS Fluent Release 13, Ansys, headquarter in Canonsburg, PA, USA), a control-volume method is used to solve the coupled heat and fluid flow equations in three dimensions. Conduction, convection, and radiation are simulated numerically. ANSYS Model Designer and Meshing Tool were used as a pre-processor to create the geometry, mesh, and computational domains.
The sill cross-sections were simulated in three dimensions. Three dimensions are necessary to accurately account for the non-continuous hardware shapes and associated air flow around the hardware within the frame cavities. The maximum Rayleigh number calculated for frame cavities in this study is 1.5 × 10⁴, and the frame cavities have vertical-to-horizontal (Lv/Lh) aspect ratios less than five. For such Rayleigh numbers and aspect ratios, we expect steady laminar flow [33]. Incompressible and steady laminar flow is therefore assumed in this work. Viscous dissipation is not addressed, and all thermophysical properties are assumed to be constant except for the buoyancy term of the y-momentum equation, where the Boussinesq approximation is used. The Semi-Implicit Method for Pressure-Linked Equations Consistent (SIMPLEC) was used to model the coupling between pressure and velocity. The Quadratic Upstream Interpolation for Convective Kinetics scheme (QUICK) was used as a differencing scheme for energy and momentum equations. The CFD program uses central differences to approximate diffusion terms and relies on the PREssure STaggering Option scheme (PRESTO) to find the pressure values at the cell faces. Convergence was determined by checking the residuals for energy and ensuring that they were lower than 1 × 10⁻¹³. Radiation heat transfer is included in the simulations through use of the Surface to Surface (S2S) radiation model, which calculates the energy exchange between surfaces taking into account their size, distance, and orientations using the view factor function. The S2S model ignores absorption, emission, and scattering phenomena occurring in the air between the cavity walls. The internal cavity walls are assumed to be diffuse grey (emissivity and absorptivity values independent of the wavelength), and emissivity values for cavity walls were set according to the frame material wood (0.9), fiberglass (0.9), and PVC (0.9).
Before the final simulations, grid sensitivity tests were performed on base frames. Maximum computation grid element sizes of 0.5, 0.7, 1, 1.5, 2, and 3 mm were tested. The frame U-values only change by 0.42% from the finest to the coarsest orthogonal mesh. Since the difference in grid size appears insignificant within this range, a grid size of 1 mm was selected.

2.5. Materials and Boundary Conditions

Material properties assigned to geometries were obtained from ISO 10077-2 [34]. Air properties for interior frame cavities were calculated using Fluid Properties Calculator (for the average temperature of 283.15 K) [35] and are presented in Table 1.
Simplified Boundary Conditions (BCs) as described in ISO 10077-2 were applied to the CFD simulations. Indoor temperature was set to 293.15 K and the indoor combined convection and radiation coefficient of heat transfer was 7.692 W/(m2K). Outdoor temperature was set to 273.15 K and outdoor combined convection and radiation coefficient of heat transfer was 25.0 W/(m2K).

3. Results and Discussion

Each of the 23 hardware configurations presented in Figure 4 was modeled as a fraction of a 30-section assembly (600 mm total length) in three different lengths: 20 mm (1 section), 120 mm (6 sections), and 240 mm (12 sections). Refer to Figure 5 for example hardware configurations in three lengths. The performance of the three base frames and the frames including operating hardware was determined both by 2D and 3D simulations and is reported in Table 2.
The presented results show how each hardware design influences the base frame performance. Due to the diversity of frame and hardware geometries, it is difficult to draw any general conclusions regarding the hardware impact on the thermal performance of the base frames. However, the presence of hardware lowers thermal performance by up to 37% in the 2D cross-sections (case P0–P6). Unexpectedly, hardware improves frame performance in some cases (e.g., case F6). This is explained by the splitting of frame cavities into smaller and more insulating convection loops. An example of such a situation is shown in Figure 6, where the large convection loop is split into three smaller loops.
Frames made of fiberglass and vinyl have many cavities in their design, as compared with the investigated wooden frame. With multiple large, air-filled cavities, uncertainties are increased in the heat transfer since 3D convection in these frames is not as obvious as 3D conduction in wooden frames, especially when these cavities are penetrated and/or partially filled with hardware. However, the results show that for all hardware configurations and frames, thermal impacts on the sill are linearly proportional to the hardware length. Calculated U-values for each configuration were plotted against the hardware length (in the Z-direction), and a linear trend line was fit to the data. An example of a 240 mm long hardware configuration in a 600 mm long sill and plot showing the linear fit for three lengths of this hardware are presented in Figure 7.
For all of the considered cases, the linear regression trend was higher than 0.98. Due to the highly linear trend of hardware impact with respect to the length, we can conclude that the 3D convection effects are negligible for the configurations examined. Therefore, a simple representative model based on a weighted average was developed. Equation (1) intends to predict hardware influence on frame thermal performance using length-weighted U-values of the base frame and frame with hardware configuration derived from 2D modeling.
Uf sill   Lh   =   ( L L h ) Uf base + L h Uf hrwd L
where
Ufsill Lh = U-value of sill including hardware of Lh length (in the Z-direction) (W/(m2K))
L = length of sill (in the Z-direction) (m)
Lh= length of hardware (in the Z-direction) (m)
Ufbase = U-value of base frame (W/(m2 K))
Ufhrwd = U-value of sill cross-section with hardware (W/(m2 K))
Market available hardware assemblies are irregular along their length, which means convection at perimeters and connections of different hardware shapes may not be accurately estimated using 2D modeling techniques. Thus, it is crucial to validate the presented model against sill geometries consisting of hardware assemblies with variable shapes. To check the model validity for each frame type, 600 mm long sills were created with hardware geometries as similar as possible to the production operating hardware shapes presented in Figure 1. These sill sections were simulated to determine the U-value with both the 3D method and the 2D method with the developed model. Table 3 presents results and detailed descriptions of the investigated configurations.
The presented results show relatively good agreement between the developed 2D weighted model and 3D models representing production hardware geometries. In each of the three cases presented, the U-value percentage difference between the simulation methods is less than 3%, and the actual difference is less than 0.05 W/(m2K). Deviations at this level may not be significant with regard to ISO and NFRC assessment methods.
The primary reason for the model discrepancies is the 3D convection effect in the frame cavities at the perimeters and at connections of different hardware shapes. Isotherms presented in Figure 8 show thermal behavior in the transition between profiles that is neglected by 2D modeling techniques.

4. Conclusions

This study presents the influence of operating hardware on three different window frame types (wood, fiberglass, and PVC), where the operating hardware may have a large impact on the thermal performance of the windows, and hence also on the energy efficiency of the buildings. Several generic and actual hardware geometries were considered, and their thermal performance was determined. The introduction of operating hardware into a frame profile typically lowers thermal performance due to the introduction of highly conductive hardware materials in the frame. Unexpectedly, the study indicates that the presence of operating hardware may improve thermal performance of a frame cross-section. In the case of the fiberglass frame (F6), hardware split the large air cavity into three smaller ones and is what improved thermal performance by breaking the convection loop. However, based on these results and the parameters investigated, no general trend in hardware influence on frame thermal performance could be determined. Thus, it is advisable to consider each particular hardware design with dedicated thermal simulations.
The frames investigated in this study differ in their structures. Fiberglass and vinyl frames include many cavities in their design compared with traditional wooden frames. The multiple large, air-filled cavities introduce more uncertainties into the heat transfer, since 3D convection in these frames is not as predictable as 3D conduction in wood frames, especially when these cavities are penetrated and/or partially filled with hardware. However, the results demonstrate that thermal performance is linearly proportional to hardware length in the sill for all frame types, which means that 3D convection effects are negligible for the configurations examined. Based on that fact, a weighted average model was developed to utilize significantly faster 2D simulations that are more broadly utilized in window ratings and standards than 3D simulations. The proposed model was validated with three common frame designs with typical operating hardware configurations. Validation results show small thermal transmittance percentage discrepancies (below 3%) and actual differences less than 0.05 W/(m2K), which may not be significant with regard to ISO and NFRC assessment methods. We conclude that the developed simplified 2D simulation models may be used for predicting hardware impact in window frames with reasonable accuracy.
The ability to model the impact of the operating window hardware will be crucial in the development of the high-performance windows of tomorrow, as the operating hardware may be detrimental to an otherwise satisfactory thermal design. Thus, an optimized operating window hardware design based on thermal modeling may become an important tool for the design of energy-efficient and zero-energy buildings in the coming years.

Author Contributions

Conceptualization, C.M., R.H., A.G., and B.P.J.; investigation, C.M.; methodology, C.M. and R.H.; supervision, A.G. and B.P.J.; writing—original draft, C.M.; writing—review and editing, R.H. and A.G. and B.P.J. All authors have read and agreed to the published version of the manuscript.

Funding

This work has partly been funded by the Research Council of Norway, Lian Trevarefabrikk and Lawrence Berkeley National Laboratory (LBNL) through the NTNU and SINTEF research project ‘‘Improved Window Technologies for Energy Efficient Buildings’’ (EffWin), and the Assistant Secretary for Energy Efficiency and Renewable Energy, Office of Building Technology, Building Technologies Program of the U.S. Department of Energy under Contract no. DE-AC02-05CH11231.

Conflicts of Interest

The authors declare no conflict of interest.

References

  1. Krarti, M.; Erickson, P.M.; Hillman, T.C. A simplified method to estimate energy savings of artificial lighting use from daylighting. Build. Environ. 2005, 40, 747–754. [Google Scholar] [CrossRef]
  2. Heschong, L. Daylighting and human performance. ASHRAE J. 2002, 44, 65–67. [Google Scholar]
  3. Persson, M.L.; Roos, A.; Wall, M. Influence of window size on the energy balance of low energy houses. Energy Build. 2006, 38, 181–188. [Google Scholar] [CrossRef]
  4. Vanhoutteghem, L.; Skarning, G.C.J.; Hviid, C.A.; Svendsen, S. Impact of façade window design on energy, daylighting and thermal comfort in nearly zero-energy houses. Energy Build. 2015, 102, 149–156. [Google Scholar] [CrossRef] [Green Version]
  5. Gustavsen, A.; Grynninga, S.; Arasteh, D.; Jelle, B.P.; Goudey, H. Key elements of and material performance targets for highly insulating window frames. Energy Build. 2011, 43, 2583–2594. [Google Scholar] [CrossRef]
  6. Roos, A.; Karlsson, B. Optical and thermal characterization of multiple glazed windows with low U-values. Sol. Energy 1994, 52, 315–325. [Google Scholar] [CrossRef]
  7. Chaiyapinunt, S.; Phueakphongsuriya, B.; Mongkornsaksit, K.; Khomporn, N. Performance rating of glass windows and glass windows with films in aspect of thermal comfort and heat transmission. Energy Build. 2005, 37, 725–738. [Google Scholar] [CrossRef]
  8. Arici, M.; Karabay, H.; Kan, M. Flow and heat transfer in double, triple and quadruple pane windows. Energy Build. 2015, 86, 394–402. [Google Scholar] [CrossRef]
  9. Cuce, E.; Riffat, S.B. A state-of-the-art review on innovative glazing technologies. Renew. Sustain. Energy Rev. 2015, 41, 695–714. [Google Scholar] [CrossRef]
  10. Goia, F.; Boccaleri, E. Physical-chemical properties evolution and thermal properties reliability of a paraffin wax under solar radiation exposure in a real-scale PCM window system. Energy Build. 2016, 119, 41–50. [Google Scholar] [CrossRef]
  11. Buratti, C.; Moretti, E. Glazing systems with silica aerogel for energy savings in buildings. Appl. Energy 2012, 98, 396–403. [Google Scholar] [CrossRef]
  12. Li, D.; Wu, Y.; Wang, B.; Liu, C.; Arıcı, M. Optical and thermal performance of glazing units containing PCM in buildings: A review. Constr. Build. Mater. 2020, 233, 117327. [Google Scholar] [CrossRef]
  13. Lechowska, A.A.; Schnotale, J.A. Thermal transmittance of multi-layer glazing with ultrathin internal partitions. In Proceedings of the 14th Conference of International Building Performance Simulation Association (IBPSA), Hyderbad, India, 7–9 December 2015; pp. 2134–2141. [Google Scholar]
  14. Gao, T.; Ihara, T.; Grynning, S.; Jelle, B.P.; Lien, A.G. Perspective of aerogel glazings in energy efficient buildings. Build. Environ. 2016, 95, 405–413. [Google Scholar] [CrossRef]
  15. Elmahdy, A.H. Assessment of spacer bar design and frame material on the thermal performance of windows. ASHRAE Trans. 2006, 112, 30–43. [Google Scholar]
  16. Löffler, M. Foamglass as spacer in multiple-glazing: Detailed study for new design of edge seal in multiple-glazing significantly reduces energy consumption. Build. Res. Inf. 1997, 25, 107–110. [Google Scholar] [CrossRef]
  17. Van Den Bergh, S.; Hart, R.; Jelle, B.P.; Gustavsen, A. Window spacers and edge seals in insulating glass units: A state-of-the-art review and future perspectives. Energy Build. 2013, 58, 263–280. [Google Scholar] [CrossRef]
  18. Noyé, P.A.; Laustsen, J.B.; Svendsen, S. Calculating the heat transfer coefficient of frame profiles with internal cavities. Nord. J. Build. Phys. 2004, 3, 1–7. [Google Scholar]
  19. Gustavsen, A.; Thue, J.V. Numerical simulation of natural convection in three-dimensional cavities with a high vertical aspect ratio and a low horizontal aspect ratio. J. Build. Phys. 2007, 30, 217–240. [Google Scholar] [CrossRef]
  20. Gustavsen, A.; Griffith, B.T.; Arasteh, D. Natural convection effects in three-dimensional window frames witch internal cavities. ASHRAE Trans. 2001, 107 Pt 2, 527–537. [Google Scholar]
  21. Zajas, J.; Heiselberg, P. Analysis of energy saving potential and optimization of thermally broken fiberglass window frames. In Proceedings of the 12th Conference of International Building Performance Simulation Association, Sydney, Australia, 14–16 November 2011; pp. 697–703. [Google Scholar]
  22. Van Den Bossche, N.; Buffel, L.; Janssens, A. Thermal optimization of window frames. Energy Procedia 2015, 78, 2500–2505. [Google Scholar] [CrossRef]
  23. Lechowska, A.A.; Schnotale, J.A.; Baldinelli, G. Window frame thermal transmittance improvements without frame geometry variations: An experimentally validated CFD analysis. Energy Build. 2017, 145, 188–199. [Google Scholar] [CrossRef]
  24. Appelfeld, D.; Hansen, C.S.; Svendsen, S. Development of a slim window frame made of glass fibre reinforced polyester. Energy Build. 2010, 42, 1918–1925. [Google Scholar] [CrossRef]
  25. Granzotto, N.; Bettarello, F.; Ferluga, A.; Marsich, L.; Schmid, C.; Fausti, P.; Caniato, M. Energy and acoustic performances of windows and their correlation. Energy Build. 2017, 136, 189–198. [Google Scholar] [CrossRef]
  26. Baldinelli, G.; Asdrubali, F.; Baldassarri, C.; Bianchi, F.; D’Alessandro, F.; Schiavoni, S.; Basilicata, C. Energy and environmental performance optimization of a wooden window: A holistic approach. Energy Build. 2014, 79, 114–131. [Google Scholar] [CrossRef]
  27. ISO 10077-1: 2006 Thermal Performance of Windows, Doors and Shutters—Calculation of Thermal Transmittance–Part 1, 2nd ed.; ISO: Geneva, Switzerland, 2009; p. 1.
  28. ANSI/NFRC 100-2020. Procedure for Determining Fenestration Product U-Factors; National Fenestration Rating Council: Greenbelt, MD, USA, 2020; p. 24.
  29. Gustavsen, A.; Jelle, B.P.; Arasteh, D.; Kohler, C. State-of-the-Art Highly Insulating Window Frames—Research and Market Review. In SINTEF Building and Infrastructure; SINTEF Building and Infrastructure: Trondheim, Norway, 2007; Volume 2, ISBN 9788253609706. [Google Scholar]
  30. Jelle, B.P.; Hynd, A.; Gustavsen, A.; Arasteh, D.; Goudey, H.; Hart, R. Fenestration of today and tomorrow: A state-of-the-art review and future research opportunities. Sol. Energy Mater. Sol. Cells 2012, 96, 1–28. [Google Scholar] [CrossRef] [Green Version]
  31. Hart, R.; Misiopecki, C.; Gustavsen, A.; Jelle, B.P.; Arasteh, D. Impacts of Operating Hardware on Window Thermal Performance. In Proceedings of the 3rd Building Enclosure Science and Technology Conference (BEST 3), Atlanta, GA, USA, 2–4 April 2012; pp. 1–15. [Google Scholar]
  32. Lawrence Berkeley National Laboratory. NFRC Simulation Manual; Lawrence Berkeley National Laboratory: Berkeley, CA, USA, 2011; p. 370. [Google Scholar]
  33. Zhao, Y.; Curcija, D.; Power, J.P.; Goss, W.P. Improved heat transfer correlations for quantifying laminar natural convection across fenestration glazing cavities. ASHRAE Trans. 1998, 397–403. [Google Scholar]
  34. ISO 10077-2:2017 Thermal Performance of Windows, Doors and Shutters—Calculation of Thermal Transmittance—Part 2: Numerical Method for Frames, 3rd ed.; ISO: Geneva, Switzerland, 2017; p. 70.
  35. University of Waterloo Fluid Properties Calculator. Available online: http://www.mhtl.uwaterloo.ca/old/onlinetools/airprop/airprop.html (accessed on 15 February 2021).
Figure 1. Simplified geometries of wooden (a), fiberglass (b), and PVC (c) frames and the associated operating hardware designs examined in preliminary research [31].
Energies 14 01145 g001
Figure 2. Wooden frame: simplified geometry (a), and geometry based on the generic frame (GF) (b). Finite element simulations in 2D indicate a maximum 3 percent difference in U-factor between the original simplified model and GF.
Energies 14 01145 g002
Figure 3. An individual 117-component generic frame cross-section (a) and 600 mm long sill section assembly (b) constructed from 30 individual cross-sections.
Energies 14 01145 g003
Figure 4. Base frame cross-sections and associated hardware configurations investigated in the study. Dark grey indicates operating hardware, blue is glazing panel, and green is air cavities. All other colors present materials typical for the frame type, dark brown is fiberglass, light brown is wood, and light grey is PVC (refer to the electronic version for colors).
Energies 14 01145 g004
Figure 5. Example hardware configurations (marked with red) placed in a 600 mm long sill (30 sections) in three different lengths: (a)—20 mm (1 section), (b)—120 mm (6 sections), (c)—240 mm (12 sections).
Energies 14 01145 g005
Figure 6. Velocity vectors, colored according to the temperature, showing convection loops for the base fiberglass frame (a) and hardware configuration labeled with F6 (b). The hardware in section F6 breaks up the large convection loop, resulting in a more insulating frame.
Energies 14 01145 g006
Figure 7. An example 240 mm long hardware configuration in full sill geometry (a), and total frame U-value as a function of hardware length (b).
Energies 14 01145 g007
Figure 8. (a) Wooden frame geometry with the marked region of operating hardware, (b) IsoTable 3D effect of convection at the hardware geometry transitions.
Energies 14 01145 g008
Table 1. Air properties for interior frame cavities used in computational fluid dynamics (CFD) simulations.
PropertyValueUnit
Average air temperature283.15K
Thermal conductivity0.02482W/(mK)
Specific heat capacity1005.5J/(kgK)
Dynamic viscosity1.7724 × 10−5kg/(ms)
Density1.2467kg/m3
Thermal expansion coefficient3.5317 × 10−3m3/K
Gravitational acceleration9.81m/s2
Table 2. Thermal performance of base frames and hardware configurations with various lengths in a 600 mm long sill.
Case
Label
2D Cross-Section
Performance
W/(m2k)
3D Performance, Number of SectionsLinear Regression
1 Section
(20 mm)
W/(m2K)
6 Sections
(120 mm)
W/(m2K)
12 Sections
(240 mm)
W/(m2K)
F01.921.921.921.92Base frame
F11.841.921.911.891.00
F21.861.921.911.901.00
F32.031.921.951.971.00
F42.211.931.982.041.00
F51.631.921.871.811.00
F61.661.921.881.821.00
F71.661.911.861.801.00
F81.671.911.871.821.00
F91.691.911.871.821.00
WO1.901.901.901.90Base frame
W12.131.911.952.001.00
W22.641.952.072.221.00
W33.582.002.282.621.00
W42.381.962.122.311.00
W52.381.922.002.080.99
W61.931.932.012.110.99
W72.431.932.022.130.99
W82.381.932.012.110.99
P01.381.381.381.38Base frame
P11.411.381.381.380.98
P21.431.381.391.411.00
P31.511.381.491.420.99
P41.781.411.481.560.99
P51.841.401.461.521.00
P61.891.401.491.590.99
Table 3. Comparison of U-values for frames with variable hardware shapes obtained from 3D simulation and 2D simulation weighted by the developed model.
Frame
Material
Sill Description
Case Label (Width In mm)
3D CFD
U-Value
W/(m2K)
2D Weighted
Model
U-value
W/(m2K)
Percent
Difference
Actual
Difference
W/(m2k)
FiberglassF0(50)-F1(225)-F6(120)-F7(130)-F0(75)1.781.770.66%0.01
WoodW0(315)-W2(30)-W7(30)-W4(30)-W1(50)-W6(145)2.192.162.19%0.04
PVCP1(320)-P6(100)-P4(180)1.641.602.55%0.04
Publisher’s Note: MDPI stays neutral with regard to jurisdictional claims in published maps and institutional affiliations.

