Abstract
The safety of underground roadways is a major issue in mining engineering, with economic impacts and potential threats to the lives of workers. Elucidating the deformation failure mechanisms is necessary to solve these problems. The deformation failure modes and characteristics of roadways buried at various depths were investigated using a detailed field survey in the Jinchuan nickel mine. At greater depths, roadway deformation was more serious, the creep phenomena were more prominent, and support structures were more prone to failure. Numerical simulations were performed on the roadways under various geo-stresses and rock mass structures, which indicated that the roadway deformation mode was mainly controlled by a rock mass structure in a lower stress environment and the control effect was weakened with the gradual increase of ground stress. Six deformation failure types were proposed to examine roadway deformation failure mechanisms. Field representation of each failure type was characterized under natural or induced conditions. The findings provide a reference for stability evaluation and support the design of roadway engineering under similar geological conditions.
1. Introduction
Shallow mineral resources are increasingly being depleted, so deep-well mining has become an important field of international mining production to meet the demand for social and economic development. There are more than 80 metal mines in the world with depths of over 1000 m, the deepest being more than 4000 m at the Mponeng gold mine in South Africa [1]. At greater depths, mining faces more complex engineering geological conditions, such as high geo-stress and fractured rock mass. Because of the poor conditions, the frequency and intensity of deep engineering disasters increase, threatening the safety of life and property [2]. It is important to study the deformation failure mode, failure characteristics, and roadway failure mechanisms at different depths to ensure safe and efficient production in the mining area [3,4].
The deformation failure of roadways has been a hot topic in the literature. By theoretical analysis, Tu et al. presented a mechanical roadway model and explored the stress law [5]. Xu et al. studied the mechanical model of roadway surrounding rock using loosening circle theory and elastic-plastic mechanics calculation [6]. Kang et al. analyzed the failure characteristics of a tunnel in densely faulted zones and designed an improved support method [7]. Yu et al. conducted field surveys of roadway deformation in soft surrounding rocks and proposed a comprehensive support scheme [8]. He et al. put forward a new physical modeling method and analyzed the development of roadway excavation damage zones [9]. Lin et al. studied the deformation failure of deep roadways under high stress [10]. Zhao et al. tracked the whole failure process of a deep buried three-core arch tunnel using the endoscope technique [11]. Lee et al. and Yang et al. examined the failure mechanisms of surrounding rock surfaces [12,13]. Xing et al. used numerical simulation to study the deformation failure zone around the roadway and influences of the rock mass post-failure constitutive parameters using FLAC3D [14]. Yang et al. investigated the deformation laws of deep roadways by UDEC [15]. Wang et al. analyzed mechanical and crack evolution characteristics of coal–rock under different fracture-hole conditions using PFC, and Liu et al. discussed the damage evolution law of a horseshoe-shaped coal mine roadway [16,17].
Unfortunately, disasters caused by roadway instability are still common in deep mining engineering. Meanwhile, the roadway deformation failure mechanisms are unclear [18]. Neither theoretical analyses nor physical model tests have accurately described roadways under complex engineering geological conditions. Moreover, field investigations have only captured the special phenomenon, but statistics and evaluation were lacking. In terms of numerical simulations, the failure of surrounding rock cannot be observed using the finite element method, and few simulations of roadways under fractured rock mass have been performed using the discrete element method.
Thus, a detailed field investigation was performed based on roadways with different depths in the Jinchuan nickel mine in China. Through an analysis of the geological conditions, the roadway failure types and characteristics were summarized. Then, numerical simulations were performed on roadways with various ground stresses and rock mass structures based on Particle Flow Code in 2 Dimensions (PFC2D). Six deformation failure types with corresponding characteristics, mechanisms, induced conditions, and field representation were proposed and used on a comprehensive set of field investigations and numerical simulations.
2. Deformation Characteristics of Roadways with Different Depths
The Jinchuan mine is one of the world’s largest copper-nickel production bases, and is famous for its large-scale, difficult mining, and deep burial. Because of the high geo-stress and fractured rock mass, the roadway in the Jinchuan mining area deforms quickly and lasts for a long time after excavation, which poses a threat to the safety of underground operators. Thus, Jinchuan was selected as the study area for this research, and its geological engineering conditions are introduced in detail in [19,20].
Rock mass engineering at different depths exhibits distinct characteristics; for example deep roadways are prone to large, asymmetric deformation and continuous rheology. Almost all of the roadways in the study zone will produce different degrees of deformation failure and need to be repaired to maintain their normal function. Thus, detailed on-site investigations were carried out on roadways with working surfaces at buried depths of 550 m, 750 m, and 1000 m in the No. 2 mining area [21].
2.1. Field Investigation
A judgment criterion for describing the extent of roadway deformation under support is proposed for a more specific description of roadway deformation and failure. Axial displacement that exceeds the maximum elongation of the support structures, and radial displacement that exceeds the distance of the support structures by two times, are defined as severe deformation [21]. The axial deformation is measured using a leather tape measure and the radial deformation is measured using a long ruler, as shown in Figure 1. Based on the judgment criterion and deformation failure modes, roadways about 5600 m long were investigated and 209 deformation points were recorded, as shown in Figure 2.
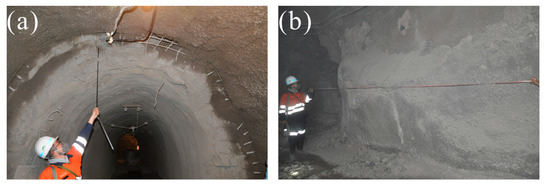
Figure 1.
Field investigation. (a) Axial deformation measurement; (b) Radial deformation measurement.
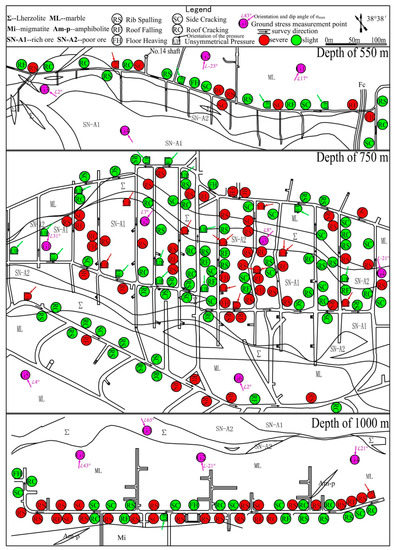
Figure 2.
Field investigation results [21,22].
Table 1 displays the stress parameters of 14 points measured by hollow inclusion gauge in the study area [20,21]. As the depth increases, the maximum principal stress in the three sections of surveyed roadway is 20–30 MPa, 30–40 MPa, and 40–50 MPa. The stress state of various parts of the mining area also change locally as a result of mining activities. There is a large difference between the minimum and maximum principal stresses, which indicates a high shear stress. Moreover, the direction of the maximum principal is mostly vertical to the ore body. All these conditions are unfavorable to the stability of the roadway.

Table 1.
Ground stress parameters.
2.2. Results Analysis
Figure 3 illustrates the time of occurrence and percentage of each mode based on the results of field investigations. Deformation point density and severe point ratio are introduced to intuitively compare the deformation failure of roadways at various depths. Deformation point density refers to the number of deformation failure points per 100 m of roadway, and the severe point ratio indicates the percentage of severe points among the total number of points, as shown in Table 2.
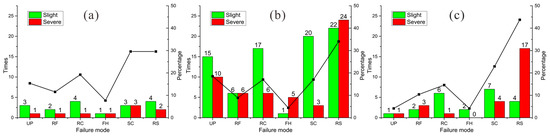
Figure 3.
Times and percentage of various failure modes [21,22]. (a) Depth of 550 m; (b) Depth of 750 m; (c); Depth of 1000 m.
Table 2.
Comparison of roadways with different depths.
Combined with the information captured in the field investigation and statistical results at various depths, the deformation failure of the roadway shows the following characteristics:
- (1)
- Deformation is more serious: Table 2 shows that the density of deformation points and the proportion of serious points in roadways increase with depth from 550 m to 1000 m, indicating that the deformation failure in deep roadways is more severe. Deformation point density for a roadway with a depth of 1000 m is almost twice that of the roadway with a depth of 500 m. Deformation failure mainly occurs on two sides, and the maximum deformation can exceed 1 m.
- (2)
- The creep deformation is more prominent: Under shallow and low geo-stress, the roadway deformation is mainly due to brittle failure of surrounding rock. In-situ stress increases for deep mining, so even hard rock exhibits the characteristics of soft rock. Roadway deformation lasts for a long time, the rheology is remarkable, and some of the roadway cannot be stable after several years of excavation.
- (3)
- Support is more prone to failure: The traditional support structures used in the mining area are unable to resist the huge deformation energy of the deep surrounding rock. In roadways with depths of 1000 m, we observed bolt breaking, metal mesh distortion, and bending of u-shaped steel brackets.
The results of the field investigation indicate that poor engineering geological conditions are most related to roadway deformation and failure, and the cause is the redistribution of surrounding rock stress induced by roadway excavation. Moreover, the main factors include the relationship between the dip direction of the roadway and the maximum principal stress, as well as the structure and type of surrounding rock mass. The stress field in the research area is more complex and volatile at greater depths, where the shear stress is more prominent, and the dip angle of the maximum principal stress also increases substantially.
3. Numerical Simulation
A numerical simulation calculation based on discrete element method (DEM) was carried out to further explore the deformation failure characteristics and factors influencing roadways with different engineering geological conditions. Numerical simulation has been an indispensable research method in the field of geological engineering because of its advantages of convenience, efficiency, and repeatability [23]. Furthermore, it can be an effective complement to the field survey and physical model test.
Different from the finite element method (FEM) that generalizes rock mass into a continuous medium, DEM can fully consider the discontinuity of rock mass. It takes the rock blocks cut by joints as the element, and the nodes can be separated from each other during the movement of the elements. Each element can fall off the surrounding rock, so it is especially suitable for the analysis of nonlinear large displacement and large deformation of jointed rock mass [24]. The numerical model in PFC2D software is built by circular particles, and simulates the movement and interaction of the materials through the particles [25]. Compared with other discrete element software, PFC has the following advantages:
- Characteristics and distribution of fractures in the medium, formed by particles, can be described in detail.
- Macroscopically visible large-scale deformations can be simulated.
- Microcosmic and microscopic parameters in the software are closely related to macroscopic parameters, which can be simulated on a macroscopic scale by obtaining physical and mechanical parameters.
Based on the reasons above, DEM and PFC2D were selected in this study.
3.1. Numerical Simulation Model
A model with a size of 30 × 30 m was constructed according to the roadway’s practical size, as shown in Figure 4. The excavated roadway was a semi-circular arch with a height of 4.5 m and a width of 4.5 m. There were 39,402 particles with a diameter of 6–10 cm created in the model.
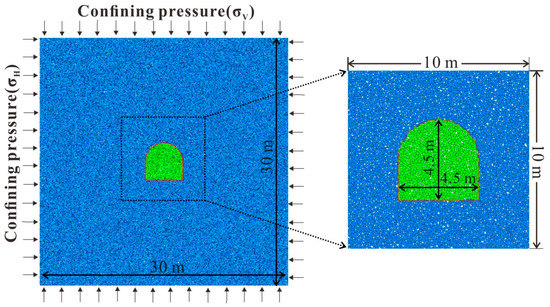
Figure 4.
The simulation model.
Two bonding models are available in PFC2D, including the contact bond model (CBM) and parallel bond model (PBM), as shown in Figure 5. The CBM is contacted by point and cannot transmit torque, while the PBM can not only transmit force, but also the torque, so the PBM is more suitable for the mechanical analysis of rock materials. When the tensile or shear stress exceeds the normal or tangential bonding strength, the bond breaks, and is gradually destroyed [26].
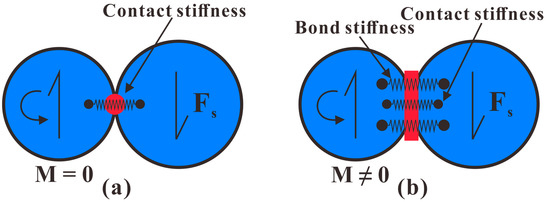
Figure 5.
Bond models in PFC [17]. (a) Contact bond model; (b) Parallel bond model.
According to the field survey results, three rock mass structures were designed in this simulation including homogeneous rock mass, layered rock mass, and rhomboid rock mass. The inclination angle of the structure plane was 45° and the spacing was 1.2 m, as shown in Figure 6.
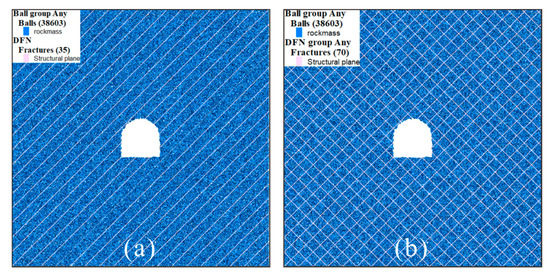
Figure 6.
Rock mass model of different models. (a) Layered rock mass; (b) rhomboid rock mass. DFN (Discrete fracture network).
A calibration model for micromechanical parameters was necessary because we could not directly adopt the macroscopic mechanical parameters of the rock mass in PFC. Rock parameters and structural plane parameters were calibrated in this study. Therefore, uniaxial compression tests were carried out on intact rock specimens and rock specimens with structural planes from the study area. Through repeated simulation calculations, the microscopic parameters shown in Table 3 were obtained, and the experimental comparison is shown in Figure 7.
Table 3.
Microscopic parameters in PFC.
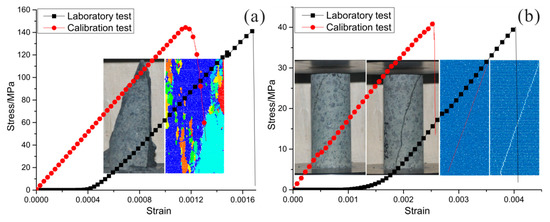
Figure 7.
Calibration results. (a) Intact rock; (b) Rock with structural plane.
The servo stress was applied around the model, and the program was implemented based on FISH in the software. According to the in-situ measurement in the study area, the values of horizontal geo-stress σH and vertical geo-stress σV at different depths of roadway were set as shown in Table 4.
Table 4.
Geo-stress applied in PFC.
Based on the explanations above, nine numerical models were constructed by combining the three kinds of rock structures and three kinds of in-situ stress.
3.2. Results Analysis
During the calculation of the models, the displacements on the roof, floor, and two sides of the roadways were recorded, and the curves obtained are shown in Figure 8.
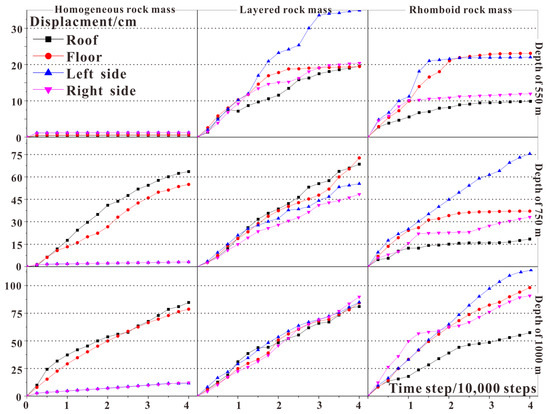
Figure 8.
Displacement–time-step curves on important positions of the roadway.
Through comprehensive comparative analysis of the deformation evolution process of each roadway, the following conclusions were drawn:
- Roadways with different rock mass structures
The deformation modes of roadway with homogeneous surrounding rock are mainly roof subsidence and floor heave, as shown in Figure 9a. Without the influence of the structural plane, the deformation of surrounding rock mainly depends on plastic flow. Roadway deformation starts from points A and B on the foot of the wall because stress concentration is more likely to occur at right angles [27]. With the development of the deformation, a triangular uplift area ACB is formed, and continuously develops at greater depths. At the same time, a wedge deformation zone DEF is formed on the roof and gradually squeezes into the goaf. Then, the deformation zone at the roof continues to extend upward to the surrounding rock, and the two sides also continue to expand, eventually forming an arch-shaped deformation zone.
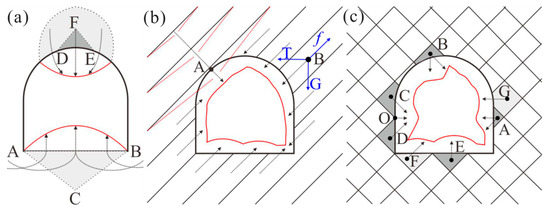
Figure 9.
Schematic diagram of deformation modes. (a) Homogeneous surrounding rock; (b) Layered rock mass; (c) Rhomboid rock mass.
Roadway deformation failure with layered rock mass is mainly controlled by the structural plane, and the modes are various. In addition to the roof subsidence and floor heave, there are also special deformation failure modes such as side-wall extrusion, collapse, asymmetrical deformation, pointed roof, and irregular floor heave, as shown in Figure 9b. The starting point is usually located at the arch shoulder on the upper plate of the layer, shown as point A in the figure, where the surrounding rock is often bent and broken perpendicular to the layer, and then slides down to the goaf along the fracture, resulting in asymmetric deformation. With the continuous action of the stress, other positions of the roadway are deformed one after another. The stress of point B on the side includes gravity G in the vertical direction, extrusion pressure T from the deep surrounding rock, and friction f between the structural planes. When the resultant forces G and T along the structural plane are greater than f, the surrounding rock gradually slips toward the goaf. The deformation on the floor is also manifested by sliding along the structural plane, and the surrounding rock is cut into several sliding blocks by the structural plane. During the process of floor uplifting, multiple or partial floor heave usually occurs.
Figure 9c shows the deformation modes of this kind of roadway. The shaded blocks in the figure are several cases of potential deformation blocks around the roadway. Among them, blocks A–E have larger deformation amounts and velocity than blocks F and G. Block A is located at the side of the roadway and cut into a small wedge, which is extremely unstable. The block will break away from the deep surrounding rock as soon as the free surface appears as a result of the excavation. If the local stress is low, the block will slide towards the goaf along the structure planes. Instead, the block is thrown horizontally toward the goaf, which is the rock burst. Block B is located at the top of the roadway and cut into a quadrangle with an arcuate side by the structural plane. Delamination failure will occur in this kind of block soon after the roadway excavation. If the geo-stress is low, the block will slide towards the goaf along the structure planes. Instead, the block collapses vertically, whereas blocks C and D are combined into a joint deformation zone. The surrounding rock is squeezed into the goaf from point O, and blocks C and D are dumped into the goaf in counterclockwise and clockwise directions, respectively, with the deformation increasing. Blocks E and F are located on the floor of the roadway, and are cut into large wedges, which are easy to uplift under the action of in-situ stress. Because the deformation of block F is inhibited by the left side, block E has a larger uplift, which leads to multiple or partial floor heave. Block G is located on the right side, cut by the structural planes into a pentagon with an arcuate side. This type of block is usually stable because the deformation path toward the air surface is restrained by other blocks and consolidation with the deep structural plane.
- 2.
- Roadways with different depths
The roadway with homogeneous rock mass hardly deforms, and remains stable under the in-situ stress condition with the buried depth of 550 m. Deformation of roadways with layered rock mass is the largest and shows obvious asymmetry, while side squeezing and floor heave are the deformation modes of roadways with rhomboid rock mass. The horizontal comparison in a lower-stress environment indicates that the roadway deformation mode is mainly controlled by rock mass structure.
Under the in-situ stress condition with the buried depth of 750 m, the roadway deformation of the homogeneous rock mass is mainly manifested as roof subsidence and floor heave, with a deformation of about 60 cm. The amount of deformation on each position of the roadway with layered rock mass increases, and the asymmetrical pressure gradually weakens. Roadway deformation of rhomboid rock mass is still dominated by deformation on the left side. The horizontal comparison shows that an increase of ground stress has an impact on the roadway’s deformation mode and severity.
Under the in-situ stress condition with a buried depth of 1000 m, the deformation mode of the roadway with homogeneous rock mass remains unchanged, but the two sides begin to deform. There is little difference in the deformation curves on each position of the roadway with a layered rock mass, but the deformation increases. The total deformation gap between different positions of the roadway with rhomboid rock mass gradually narrows. A horizontal comparison shows an increase of ground stress, while the control effect of the rock mass structure on roadway deformation is gradually weakened, and the roadway with the complex rock mass structure shows more randomness in deformation.
4. Discussion
Based on the field investigations and numerical simulations mentioned above, it can be concluded that the ground stress and rock mass structure jointly determine the deformation failure characteristics of roadways. When a roadway is buried relatively shallow and the ground stress is low, the surrounding rock structure has the most control of the deformation failure; when the roadway is at a great depth, the structural effect of the surrounding rock is dramatically reduced because of the high geo-stress environment. The crushing yield and shear slippage of the surrounding rock produce tension fractures and plastic deformation, which then leads to a serious convergence of the roadway.
The deformation failure of a roadway is mainly divided into the following types.
4.1. Pressing Roof Failure
Characteristic: The vault of the roadway sink is compressed into a nearly flat shape (Figure 10a);
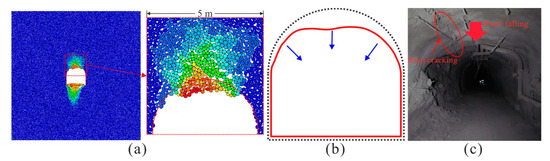
Figure 10.
Schematic diagram of pressing roof failure. (a) Numerical simulation result; (b) Failure mechanism; (c) Field representation.
Mechanism: Plastic flow of surrounding rock on the roof is under high in-situ stress (Figure 10b);
Condition: Intact rock mass, high geo-stress environment;
Field representation: Roof cracking, roof falling (Figure 10c).
4.2. Asymmetrical Pressure Failure
Characteristic: One side of the arch shoulder is squeezed and the whole roadway is oblique (Figure 11a);
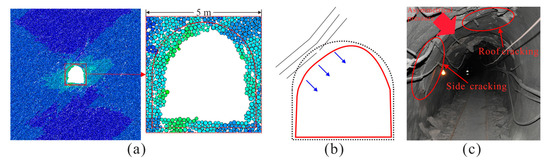
Figure 11.
Schematic diagram of asymmetrical pressure failure. (a) Numerical simulation result; (b) Failure mechanism; (c) Field representation.
Mechanism: Rock strata on the upper plate of structure planes bend and fail under the compression of in-situ stress (Figure 11b);
Condition: Inclined stratiform surrounding rock;
Field representation: Asymmetrical pressure, roof cracking, side cracking (Figure 11c).
4.3. Pointed Roof Failure
Characteristic: The arch shoulder is severely deformed, the vault rises, and the part above the spring line is triangular (Figure 12a). Peach-shaped failure will occur when the pointed roof is under asymmetrical pressure (Figure 13a);
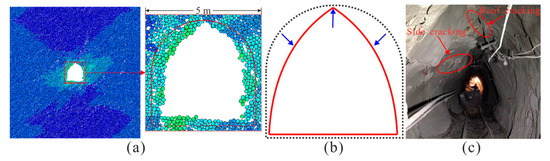
Figure 12.
Schematic diagram of pointed roof failure. (a) Numerical simulation result; (b) Failure mechanism; (c) Field representation.
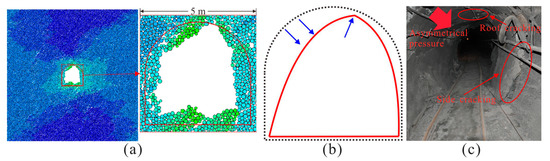
Figure 13.
Schematic diagram of peach-shaped failure. (a) Numerical simulation result; (b) Failure mechanism; (c) Field representation.
Mechanism: Shear compression failure of surrounding rock on the roof under the compression of high horizontal geo-stress (Figure 12b, Figure 13b);
Condition: Jointed rock mass, high horizontal geo-stress;
4.4. Collapse Failure
Characteristic: Surrounding rock on the roof or two sides collapse and slump, and rock burst appears if the geo-stress is high (Figure 14a);
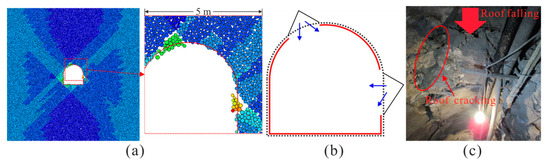
Figure 14.
Schematic diagram of collapse failure. (a) Numerical simulation result; (b) Failure mechanism; (c) Field representation.
Mechanism: Shear failure of the cataclastic rock mass along the joint plane under the action of gravity and tectonic stress (Figure 14b);
Condition: Jointed rock mass;
Field representation: Roof cracking, roof falling, side cracking, rib spalling. (Figure 14c)
4.5. Extrusion Failure
Characteristic: Horizontal cracks appear on the side walls and surrounding rock extrude toward the air surface (Figure 15a);
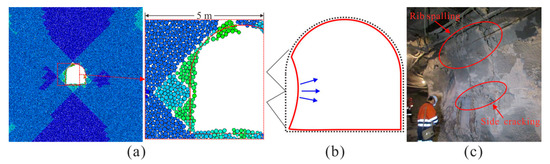
Figure 15.
Schematic diagram of extrusion failure. (a) Numerical simulation result; (b) Failure mechanism; (c) Field representation.
Mechanism: Tension failure of the surrounding rock on the two sides under high geo-stress (Figure 15b);
Condition: Jointed rock mass, high geo-stress environment;
Field representation: Side cracking, rib spalling (Figure 15c).
4.6. Heaving Floor Failure
Characteristic: The floor is uplifted, and longitudinal cracks appear (Figure 16a). Sometimes it manifests as multiple or partial floor heave (Figure 17a);
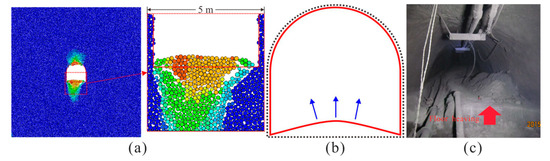
Figure 16.
Schematic diagram of heaving floor failure. (a) Numerical simulation result; (b) Failure mechanism; (c) Field representation.
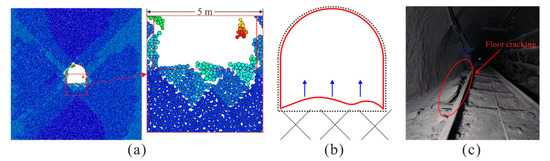
Figure 17.
Schematic diagram of partial floor heave. (a) Numerical simulation result; (b) Failure mechanism; (c) Field representation.
Mechanism: Tension failure on the upper edge of the floor because of plastic flow or deformation along the structural planes of the surrounding rock (Figure 16b, Figure 17b);
Condition: High geo-stress environment;
5. Conclusions
The main conclusions of the research are as follows:
- Combined with the information captured in the field investigation and statistical results, roadway deformation is more severe, the creep phenomena are more prominent, and support structures are more prone to failure at greater depths. When roadway excavation is conducted in deep rock mass, the ground stress near the construction site should be investigated in detail, and targeted support measures should be adopted to ensure safe production and reduce the cost of repairs.
- The deformation process and failure modes of the roadways with three kinds of rock mass structures were analyzed based on the simulation results. In a lower-stress environment, roadway deformation mode is mainly controlled by the rock mass structure. However, the increase of ground stress it has an impact on the deformation mode and severity of roadway deformation. Moreover, the control effect of the rock mass structure on roadway deformation is gradually weakened, and the roadway with the complex rock mass structure shows more randomness in deformation.
- A comprehensive discussion based on field investigation and numerical simulation proposes six deformation failure types, including pressing roof failure, asymmetrical pressure failure, pointed roof failure, collapse failure, extrusion failure, and heaving floor failure. Furthermore, characteristic, mechanism, induced conditions, and field representation were given to each failure type.
Author Contributions
Data curation, G.L.; formal analysis, G.L., H.Z. and F.M.; methodology, G.L., and F.M.; software, G.L. and J.G.; writing—original draft, G.L. and J.G.; writing—review and editing, G.L. and F.M.; visualization, G.L. All authors have read and agreed to the published version of the manuscript.
Funding
This research was funded by the National Natural Science Foundation of China, grant number 42072305, 41831293, 41877274, and 41772341.
Acknowledgments
The authors would like to express their sincere gratitude to Jinchuan mine for their data supports. In addition, the authors are grateful to assigned editor and anonymous reviewers for their enthusiastic help and valuable comments which have greatly improved this paper.
Conflicts of Interest
The authors declare no conflict of interest.
References
- Tang, B.; Cheng, H.; Tang, Y.; Zheng, T.; Yao, Z.; Wang, C.; Rong, C. Supporting Design Optimization of Tunnel Boring Machines-Excavated Coal Mine Roadways: A Case Study in Zhangji, China. Processes 2020, 8, 46. [Google Scholar] [CrossRef]
- Li, P.; Lai, X.; Gong, P.; Su, C.; Suo, Y. Mechanisms and Applications of Pressure Relief by Roof Cutting of a Deep-Buried Roadway near Goafs. Energies 2020, 13, 5732. [Google Scholar] [CrossRef]
- Srivastava, L.P.; Singh, M. Empirical estimation of strength of jointed rocks traversed by rock bolts based on experimental observation. Eng. Geol. 2015, 197, 103–111. [Google Scholar] [CrossRef]
- Shi, X.; Jing, H.; Zhao, Z.; Gao, Y.; Zhang, Y.; Bu, R. Physical Experiment and Numerical Modeling on the Failure Mechanism of Gob-Side Entry Driven in Thick Coal Seam. Energies 2020, 13, 5425. [Google Scholar] [CrossRef]
- Tu, H.S.; Tu, S.H.; Wang, C.; Hao, D.-Y.; Zhu, D.-F. Mechanical analysis of a vertical-wall, semicircular-arch roadway and a repair technique using double-shell support. Environ. Earth Sci. 2018, 77, 509. [Google Scholar]
- Xu, Q.; Li, Y.; Lu, J.; Zhang, L. The use of surrounding rock loosening circle theory combined with elastic-plastic mechanics calculation method and depth learning in roadway support. PLoS ONE 2020, 15, e0234071. [Google Scholar] [CrossRef] [PubMed]
- Kang, Y.S.; Liu, Q.S.; Xi, H.L.; Gong, G.Q. Improved compound support system for coal mine tunnels in densely faulted zones: A case study of China’s Huainan coal field. Eng. Geol. 2018, 240, 10–20. [Google Scholar] [CrossRef]
- Yu, W.; Wang, W.; Chen, X.; Du, S. Field investigations of high stress soft surrounding rocks and deformation control. J. Rock Mech. Geotech. Eng. 2015, 421, e433. [Google Scholar] [CrossRef]
- He, M.C. Physical modeling of an underground roadway excavation in geologically 45° inclined rock using infrared thermography. Eng. Geol. 2011, 121, 165–176. [Google Scholar] [CrossRef]
- Lin, P.; Liu, H.Y.; Zhou, W.Y. Experimental study on failure behavior of deep tunnels under high in-situ stresses. Tunn. Undergr. Space Technol. 2015, 46, 28–45. [Google Scholar] [CrossRef]
- Zhao, Y.; Zhang, Z.G. Mechanical response features and failure process of soft surrounding rock around deeply buried three-centered arch tunnel. J. Cent. South Univ. 2015, 22, 4064–4073. [Google Scholar] [CrossRef]
- Lee, Y.Z.; Schubert, W. Determination of the length for tunnel excavation in weak rock. Tunn. Undergr. Space Technol. 2008, 23, 221–231. [Google Scholar] [CrossRef]
- Yang, X.X.; Kulatilake, P.H.S.W.; Jing, H.W.; Yang, S. Numerical simulation of a jointed rock block mechanical behavior adjacent to an underground excavation and comparison with physical model test results. Tunn. Undergr. Space Technol. 2015, 53, 109–119. [Google Scholar] [CrossRef]
- Xing, Y.; Kukatilake, P.H.S.W.; Sandbak, L.A. Effect of rock mass and discontinuity mechanical properties and delayed rock supporting on tunnel stability in an underground mine. Eng. Geol. 2018, 238, 62–75. [Google Scholar] [CrossRef]
- Yang, S.Q.; Chen, M.; Jing, H.W.; Chen, K.F.; Meng, B. A case study on large deformation failure mechanism of deep soft rock roadway in Xin’An coal mine, China. Eng. Geol. 2017, 217, 89–101. [Google Scholar] [CrossRef]
- Wang, X.; Tian, L. Mechanical and crack evolution characteristics of coal–rock under different fracture-hole con-ditions: A numerical study based on particle flow code. Environ. Earth Sci. 2018, 77, 297. [Google Scholar] [CrossRef]
- Liu, W.; Wang, X.; Li, C. Numerical Study of Damage Evolution Law of Coal Mine Roadway by Particle Flow Code (PFC) Model. Geotech. Geol. Eng. 2019, 37, 2883–2891. [Google Scholar] [CrossRef]
- Chen, S.; Wu, A.; Wang, Y.; Chen, X.; Yan, R.; Ma, H. Study on repair control technology of soft surrounding rock roadway and its application. Eng. Fail. Anal. 2018, 92, 443–455. [Google Scholar] [CrossRef]
- Li, G.; Ma, F.; Liu, G.; Zhao, H.; Guo, J. A Strain-Softening Constitutive Model of Heterogeneous Rock Mass Considering Statistical Damage and Its Application in Numerical Modeling of Deep Roadways. Sustainability 2019, 11, 2399. [Google Scholar] [CrossRef]
- Wu, M.L.; Ma, Y.; Liao, C.T. Study of recent state of stress in depth 1 000 m of Jinchuan mine. Chin. J. Rock Mech. Eng. 2008, 27 (Suppl. 2), 3785–3790. [Google Scholar]
- Li, G.; Ma, F.; Guo, J.; Zhao, H.; Liu, G. Study on deformation failure mechanism and support technology of deep soft rock roadway. Eng. Geol. 2020, 264, 105262. [Google Scholar] [CrossRef]
- Li, G.; Ma, F.; Guo, J.; Zhao, H. Deformation Characteristics and Control Method of Kilometer-Depth Roadways in a Nickel Mine: A Case Study. Appl. Sci. 2020, 10, 3937. [Google Scholar] [CrossRef]
- Jing, L.R. A review of techniques, advances and outstanding issues in numerical modeling for rock mechanics and rock engineering. Int. J. Rock Mech. Min. Sci. 2003, 40, 283–353. [Google Scholar] [CrossRef]
- Cundall, P.A.; Strack, O.D.L. A discrete numerical model for granular assemblies. Geotechnique 1979, 29, 331–336. [Google Scholar] [CrossRef]
- Potyondy, D.O.; Cundall, P.A. A bonded-particle model for rock. Int. J. Rock Mech. Min. Sci. 2004, 41, 1329–1364. [Google Scholar] [CrossRef]
- Itasca Consulting Group. PFC2D (Particle Flow Code in 2dimensions) Users Guide; Itasca: Minneapolis, MN, USA, 2008. [Google Scholar]
- Yang, J.P.; Chen, W.Z.; Tan, X.J.; Yang, D. Analytical estimation of stress distribution in interbedded layers and its implication to rockburst in strong layer. Tunn. Undergr. Space Technol. 2018, 81, 289–295. [Google Scholar] [CrossRef]
Publisher’s Note: MDPI stays neutral with regard to jurisdictional claims in published maps and institutional affiliations. |
© 2021 by the authors. Licensee MDPI, Basel, Switzerland. This article is an open access article distributed under the terms and conditions of the Creative Commons Attribution (CC BY) license (http://creativecommons.org/licenses/by/4.0/).