Article

Robust Digital Control Strategy Based on Fuzzy Logic for a Solar Charger of VRLA Batteries

by
Julio López Seguel
1,* and
Seleme I. Seleme, Jr.
2
1
Faculty of Engineering and Architecture, Arturo Prat University, Iquique 1100000, Chile
2
Graduate Program in Electrical Engineering, Universidade Federal de Minas Gerais, Av. Antônio Carlos 6627, Belo Horizonte 31270-901, MG, Brazil
*
Author to whom correspondence should be addressed.
Energies 2021, 14(4), 1001; https://doi.org/10.3390/en14041001
Submission received: 11 January 2021 / Revised: 4 February 2021 / Accepted: 6 February 2021 / Published: 14 February 2021
(This article belongs to the Special Issue Assessment of Photovoltaic-Battery Systems)

Abstract

:
This paper presents the design and implementation of a digital control strategy for a Buck converter, used as a solar charger of valve-regulated lead acid (VRLA) batteries. The control system consists of two fuzzy logic controllers (FLCs), which adjust the appropriate increment of the converter duty cycle based on battery state of charge according to a three-stage charging scheme. One FLC works as a maximum power point tracker (FLC-MPPT), while the other regulates the battery voltage (FLC-VR). This approach of using two different set of membership functions overcomes the limitations of the battery chargers with a single control function, where the voltage supplied to the battery is either not constant due to the operation of the MPPT algorithm (possibly damaging the battery) or is constant due to the operation of the voltage control (hence, MPP cannot be achieved). In this way, the proposed control approach has the advantage of extracting the maximum energy of the PV panel, preventing battery damage caused by variable MPPT voltage, thereby extending the battery’s lifetime. Moreover, it allows overcoming of the drawbacks of the conventional solar chargers, which become slow or inaccurate during abrupt changes in weather conditions. The strategy is developed to be implemented in a low-cost AT91SAM3X8E Arduino Due microcontroller. Simulations by MATLAB/Simulink and experimental results from hardware implementation are provided and discussed, which validate the reliability and robustness of the control strategy.

1. Introduction

In photovoltaic (PV) generation systems, the energy produced is limited by the efficiency of solar panels, which is generally between 18 and 23% [1]. The low conversion efficiency of a PV panel is due to the physical characteristic of PV conversion, and the dependence of its maximum power point (MPP) with atmospheric conditions [2]. Thus, the use of a maximum power point tracking (MPPT) technique to optimize the energy produced becomes essential [3,4]. The implementation of an MPPT algorithm needs a DC–DC power converter, which acts as an impedance adapter between the PV panel and the load, adapting the apparent impedance of the PV module to make it match the impedance in the MPP [5].
Over the years, many MPPT techniques have been developed [6,7,8,9,10]. Among the most popular conventional MPPT methods are: Fractional open circuit voltage (FOCV), Fractional short circuit current (FSCC), Hill Climbing (HC), Perturb and observe (P&O), and Incremental conductance (IncCond). FOCV and FSCC are the simplest and cheapest ones to implement, although they achieve less accurate results [11,12]. HC and P&O are widely used techniques due to their simplicity and ease of implementation [13,14,15]. Both algorithms present the problem of oscillations around the MPP, and fail under rapid atmospheric changes [16,17]. IncCond theoretically overcomes the problem of oscillations; however, in practice, this rarely happens due to the resolution of the digital implementation and noise in the measurements [18,19]. IncCond is more complex to implement than P&O and HC, due to the need to perform divisions in its algorithm.
Due to the non-linear features of PV systems, non-linear MPPT controllers have attracted considerable attention [3]. Among non-linear MPPT techniques, sliding mode control (SMC) has received much attention because of its benefits of a quick response, robustness to operate under uncertainty conditions [20], and in many cases, easy implementation (depending on the sliding surface) [21]. This technique is attractive since it simplifies the design task and endows the controller with robustness properties. [22] A typical SMC has two modes of operation. One is called the approaching mode, where the system state converges to a predefined manifold named sliding function in finite time. The other mode is called the sliding mode, where the system state is confined on the sliding surface and is driven to the origin [23]. Although the convergence rate of a standard SMC may be arbitrarily fast, it only provides an asymptotic stability and infinite time convergence [14].
In the last few decades, artificial intelligence (AI) techniques have been introduced, proving to be more efficient and with better dynamic response [24]. They have the characteristic of not needing an exact mathematical model of the system [25,26,27], and handle the typical non-linearities of PV systems very well; although, they are more complex methods to implement, needing higher performance controllers [28,29]. Artificial neural networks (ANN) and Fuzzy logic controller (FLC) are the most common AI techniques. The main disadvantage of an ANN controller is the need for rigorous and periodic training to achieve an optimal relationship between input and output variables [30,31]. The main drawback of an FLC is the absence of a systematic method for formulating the membership functions. They are usually based on the designers’ experience and knowledge about the system [32,33,34]. FLC and ANN have similar performances; however, the computational calculation time, hardware memory requirement, development time, and implementation complexity of an FLC controller in general can be reduced, when compared to an ANN [26,35,36].
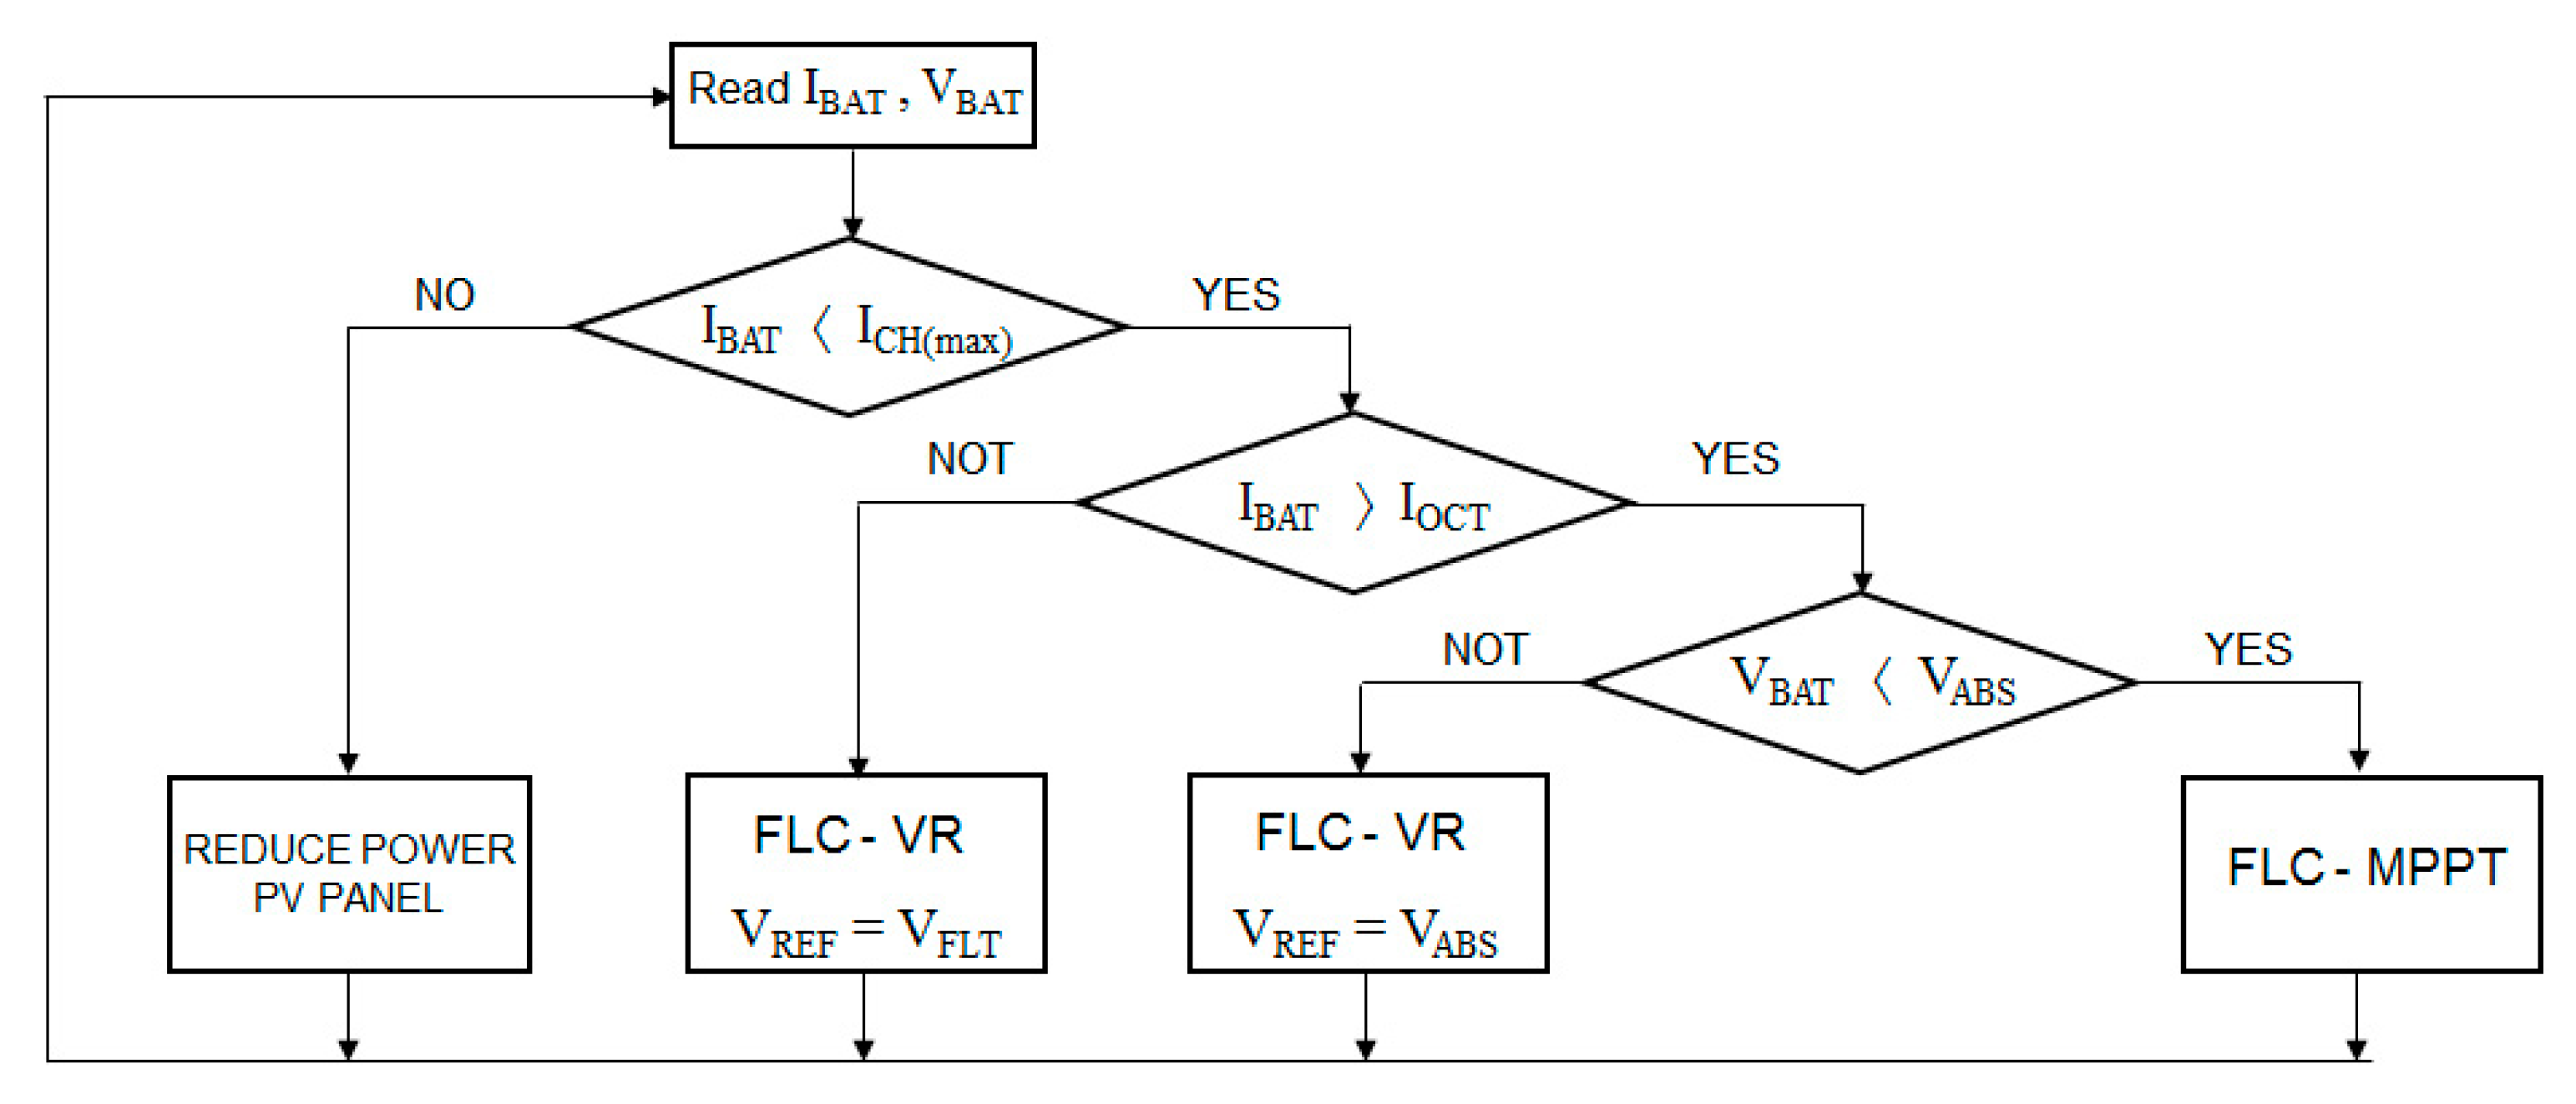
In autonomous PV systems, batteries represent the main weakness, considering that their lifetime depends on an efficient management of their charging and discharging processes [37]. Valve-regulated lead acid (VRLA) batteries are the most used in off-grid PV systems due to their availability in the market, low cost, and being maintenance-free [38,39,40,41]. Over the years, various control strategies for solar battery chargers have been proposed, most of them being based on conventional techniques. They generally use a classical MPPT algorithm, a linear closed-loop control, or a combination of both, as shown in [40,42,43,44,45,46,47,48,49,50]. Conventional MPPT techniques fail under rapid atmospheric changes, which affect its performance. Moreover, linear control techniques suffer from the non-linearity of the components of a standalone PV system, and therefore, they may not provide a desired response for all weather and load conditions. To overcome these disadvantages, recent works propose to incorporate algorithms based on soft computing; nevertheless, most research focused on improving the performance of the MPPT technique, as presented in [51,52,53,54].
Taking into account the above, this paper presents a new control strategy for a Buck converter used as a PV charger of VRLA batteries. The control system proposed here consists of two FLC. One FLC works as an MPP tracker (FLC-MPPT), while the other regulates the battery voltage (FLC-VR). A smart algorithm based on battery state of charge (SoC), according to a three-phase charging scheme, manages the operation of the FLCs. This control approach allows maximizing of the power supplied by the PV panel, avoiding overcharging caused by the operation of the MPPT algorithm, thus increasing the life cycle of the battery. Furthermore, it reduces the drawbacks and limitations of the conventional solar chargers.
Fuzzy logic is a robust AI method, which can handle the high non-linearities of the PV standalone systems very well, where accurate mathematical models and parameters of the system are not required for design. Moreover, it is simpler to implement compared to other AI controllers. All these attributes have motivated its choice for the development of the proposed control strategy.
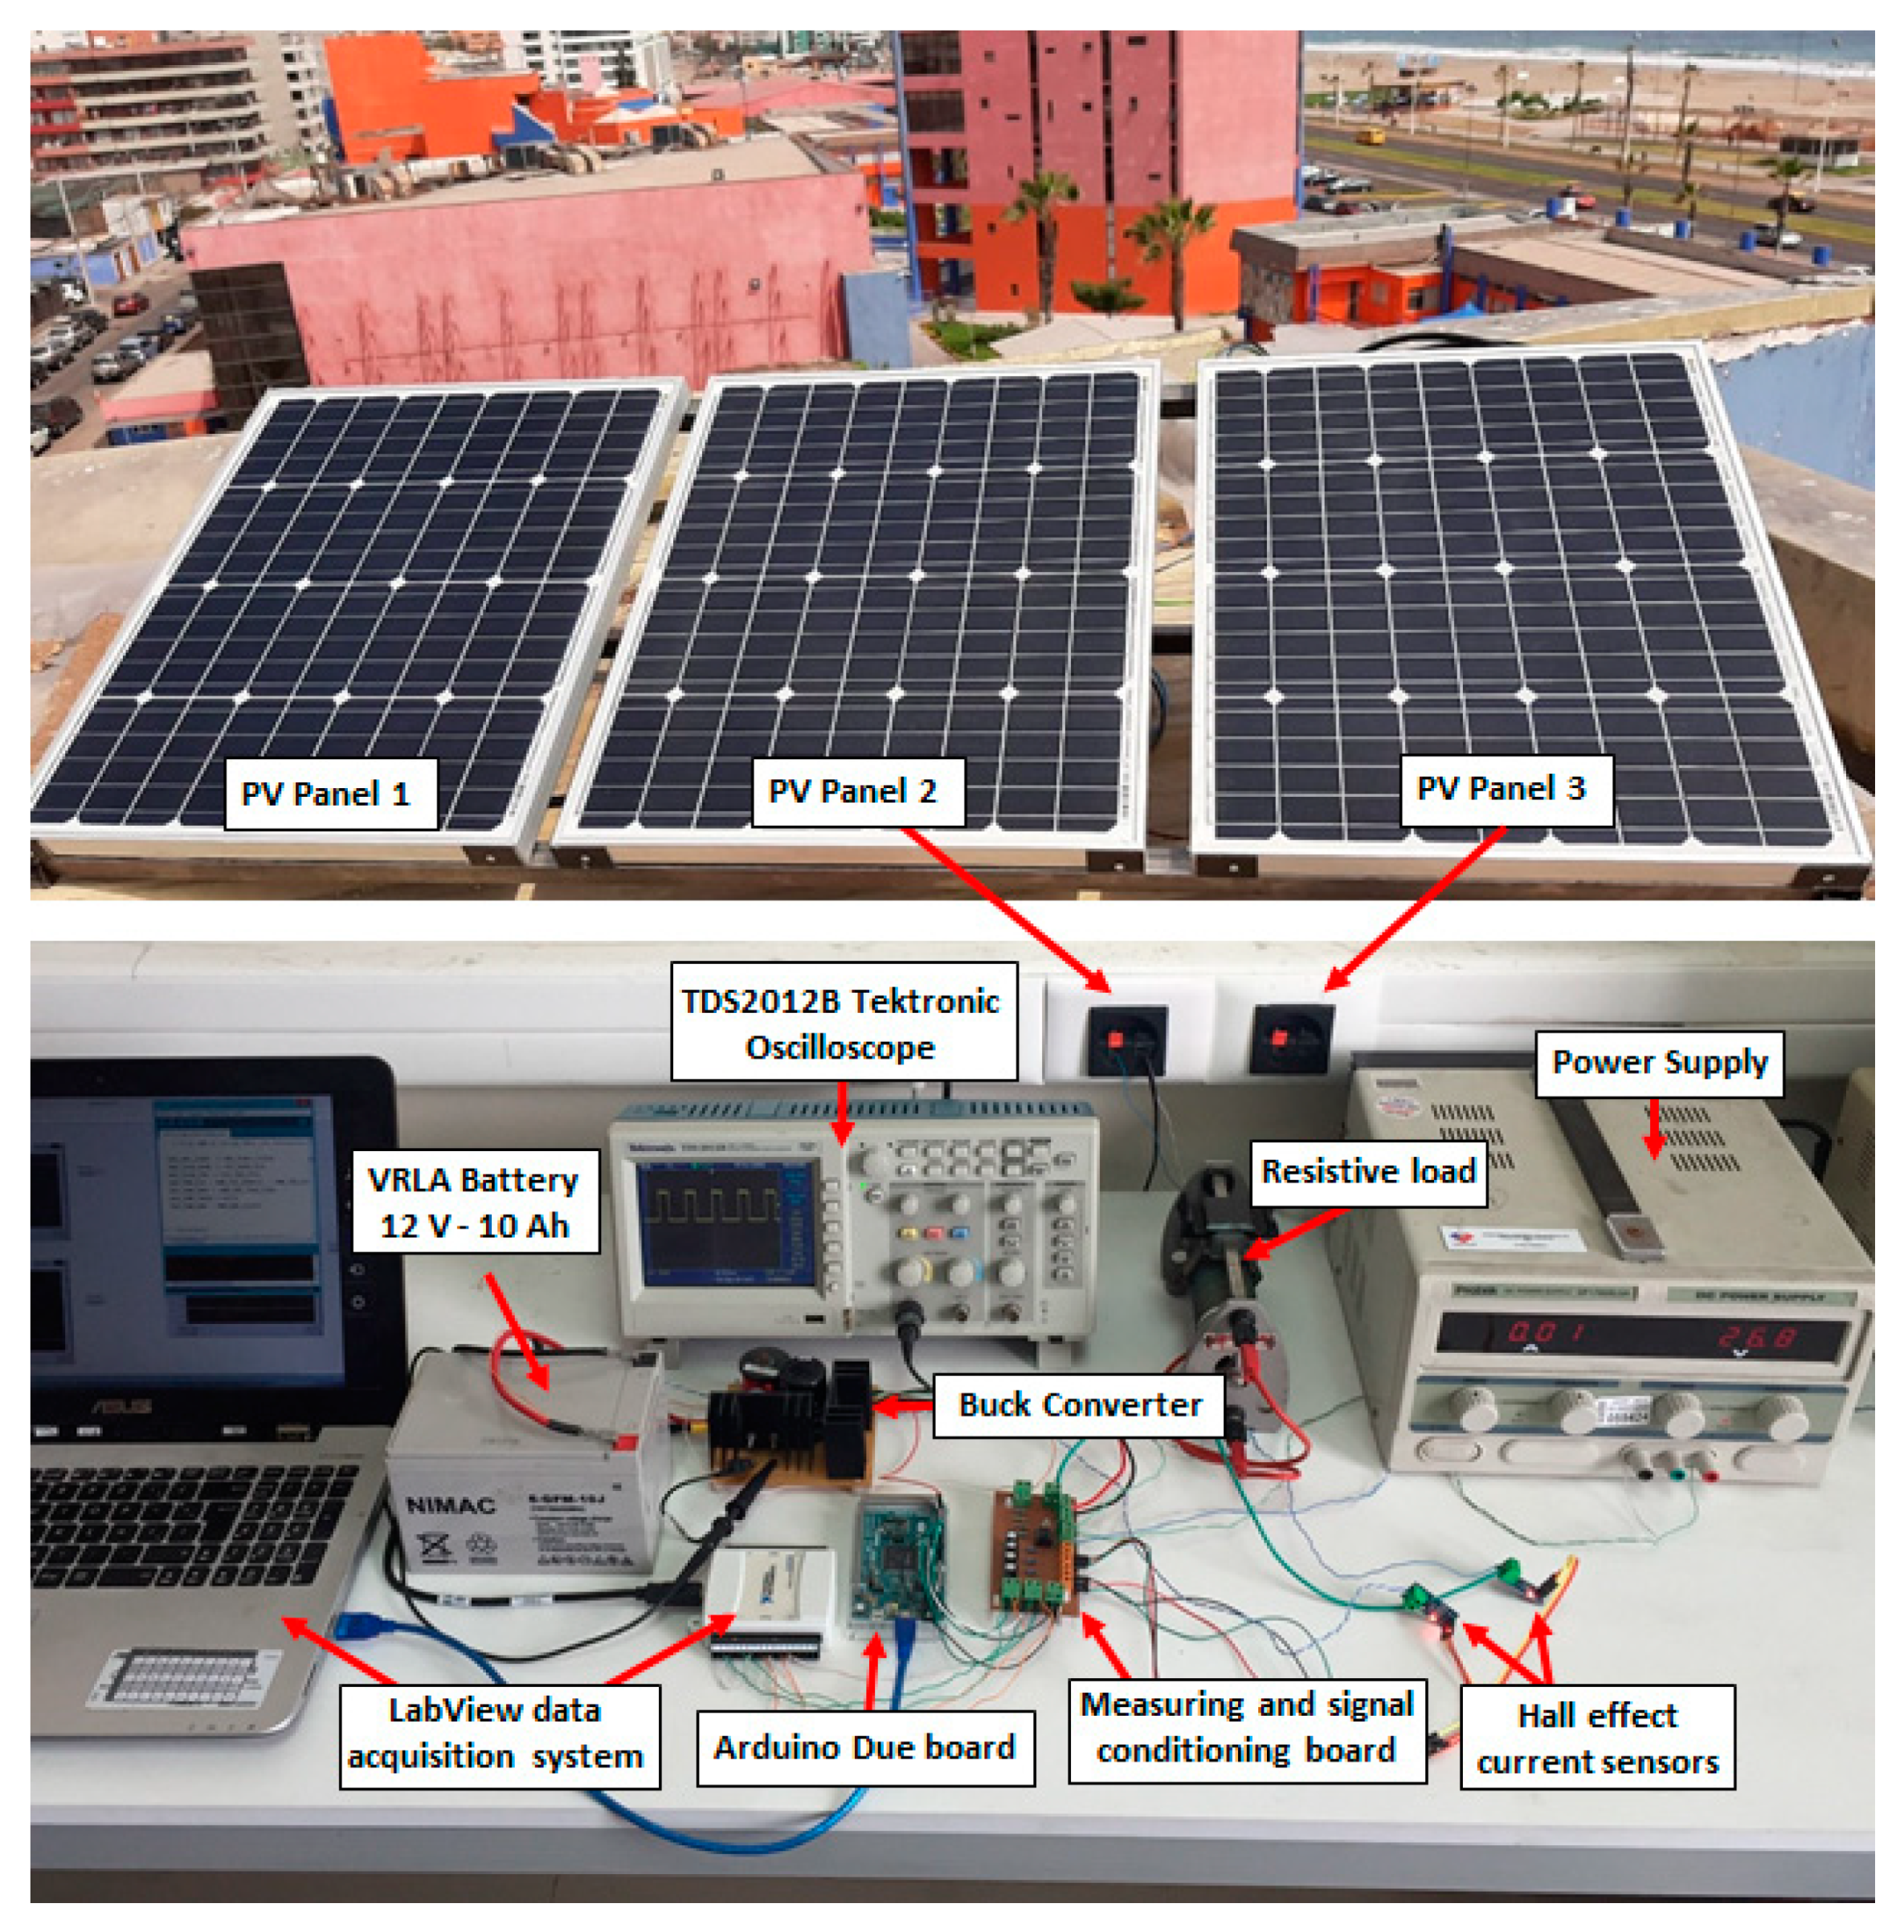
The FLCs are developed to be programmed in an Arduino Due board. To evaluate the control system under different weather and load conditions, simulations via MATLAB/Simulink are performed. The performance of the designed FLCs is compared with conventional methods commonly used and reported in the literature: P&O, IncCond, and the Proportional-Integral-Derivative (PID) controller. In addition, a prototype hardware setup is implemented. Experimental and simulated results are discussed to prove the reliability and validity of the proposed control strategy.
The paper is organized as follows: Section 2 presents the description of the battery charger system, including the modeling of the PV module, the dc–dc power converter, and the charging strategy. Section 3 provides a detailed explanation of the design methodology used for each FLC. Section 4 discusses the simulated results. Section 5 provides the experimental results and verifies the effectiveness of the proposed control strategy, while Section 6 summarizes the conclusions of the paper.

2. Description of the Battery Charger System

A schematic diagram of the solar battery charger is shown in Figure 1. A PV panel is used as a power source, which feeds a VRLA battery. To determine the power of the PV panel and the SoC of the battery, the current (IPV) and the voltage (VPV) of the panel and the current (IBAT) and the voltage (VBAT) of the battery are measured. With this information, the control algorithm determines the appropriate charging mode.

2.1. Modeling of PV Module

A PV cell can be modeled by an equivalent electrical circuit composed of a current source in parallel with a diode and a resistor network, as shown in Figure 2 [55], where Iph represents the current generated by the incident radiation and Id the current at the PN junction according to the Shockley equation. The parallel RP resistance represents the loss where a small leakage current flows through the parallel path and RS represents the losses, which are loss of metal grid, contacts, and current collecting bus.
I PV = I ph I r [ e q ( V PV + I PV · R S ) β · k · T 1 ] V PV + I PV · R S R P
I r = I rr ( T T r ) 3 e [ q · E G β · K · ( 1 T r 1 T ) ]
I ph = [ I SC + α ( T T r ) ] P sun 1000
Equations (1)–(3) [56] describe the PV cell model, where: Ir is the reverse saturation current, T is the reference cell operating temperature, β the ideality factor at the junction, q is the charge of the electron (1.602176 × 10⁻²¹ C), ISC is the short circuit current of the cell, K is the Boltzmann constant (1.38065 × 10⁻³ J/°K), α is the temperature coefficient of the short circuit current of the cell, Tr is the temperature in standard test conditions, Irr is the reverse saturation current at Tr temperature, EG is the energy of the Silicon band-gap (1.1 eV), and Psun is the incident radiation. Parameters α and ISC are usually given by the manufacturer of the solar cell. Parameters β, Irr, RS, and RP can be estimated.
In order to obtain more realistic conditions for the simulations to be made in Section 4, a model for the commercial module used has been developed. The parameters which are not provided by the manufacturer have been estimated using the procedure described in [56]. Table 1 presents a summary of the parameters adjusted for the commercial module. Figure 3 shows the curves obtained for the PV panel at different levels of radiation and temperature.

2.2. Power Converter

A Buck power converter has been chosen as the interface between the PV generator and the battery. In a Buck converter, the input voltage is greater than the output voltage. The topology of a Buck converter is shown in Figure 4. The control of the power flow from the PV module to the battery is performed by adjusting the duty cycle of the electronic switch of the converter, using a PWM (Pulse Width Modulation) technique. The Buck converter was chosen in this work for its low cost, simplicity, and high efficiency in PV applications [58]. In addition, the load control operation remains uninterrupted even when the PV panel provides a low output current in low radiation conditions. In this case, the Buck converter is able to increase the required charging current level [59]. As the Buck converter can provide a low voltage level from a higher voltage PV array and can operate efficiently at any radiation level, the use of this type of converter in PV applications that contain low voltage batteries is highly recommended [60]. The average output voltage is given by Equation (4) [61].
V o = t on T s · V i = D · V i
where TS is the switching period, ton is the conduction time of the switch, and D is the duty cycle.

2.3. Battery Charging Strategy

Most VRLA battery manufacturers recommend dividing the charging process into three phases, namely: bulk, absorption, and float [62], as shown in Figure 5. When the battery is used in photovoltaic systems, its charging system requires an elaborate control strategy, in which the battery should be charged within its allowed current and voltage limits, as quickly as possible, given that the daily energy generation period is limited and dependent on weather conditions. In order to reach these goals, a control strategy has been designed. The flowchart of the proposed control strategy is shown in Figure 6. In the condition of a discharged battery, an efficient FLC-MPPT must act to extract the highest power from the panels in order to speed up the charging process. In this bulk phase, IBAT is limited to the maximum allowed charging current (ICH(max)) to avoid excessive heating and premature battery wear. At this phase, the battery capacity is usually recovered between 80 and 90% [49]. When VBAT reaches the absorption voltage (VABS), an accurate voltage controller FLC-VR must act in order to continue the charging process at constant voltage, thus avoiding overvoltage. In this absorption phase, the charging voltage is fixed in VABS. This set point is maintained until IBAT drops to the full charge value (IOCT). At this point, the voltage regulator updates the set point to the float voltage (VFLT). In this float phase, a very small charging current is generated, responsible for compensating for self-discharge and ensuring full charge.

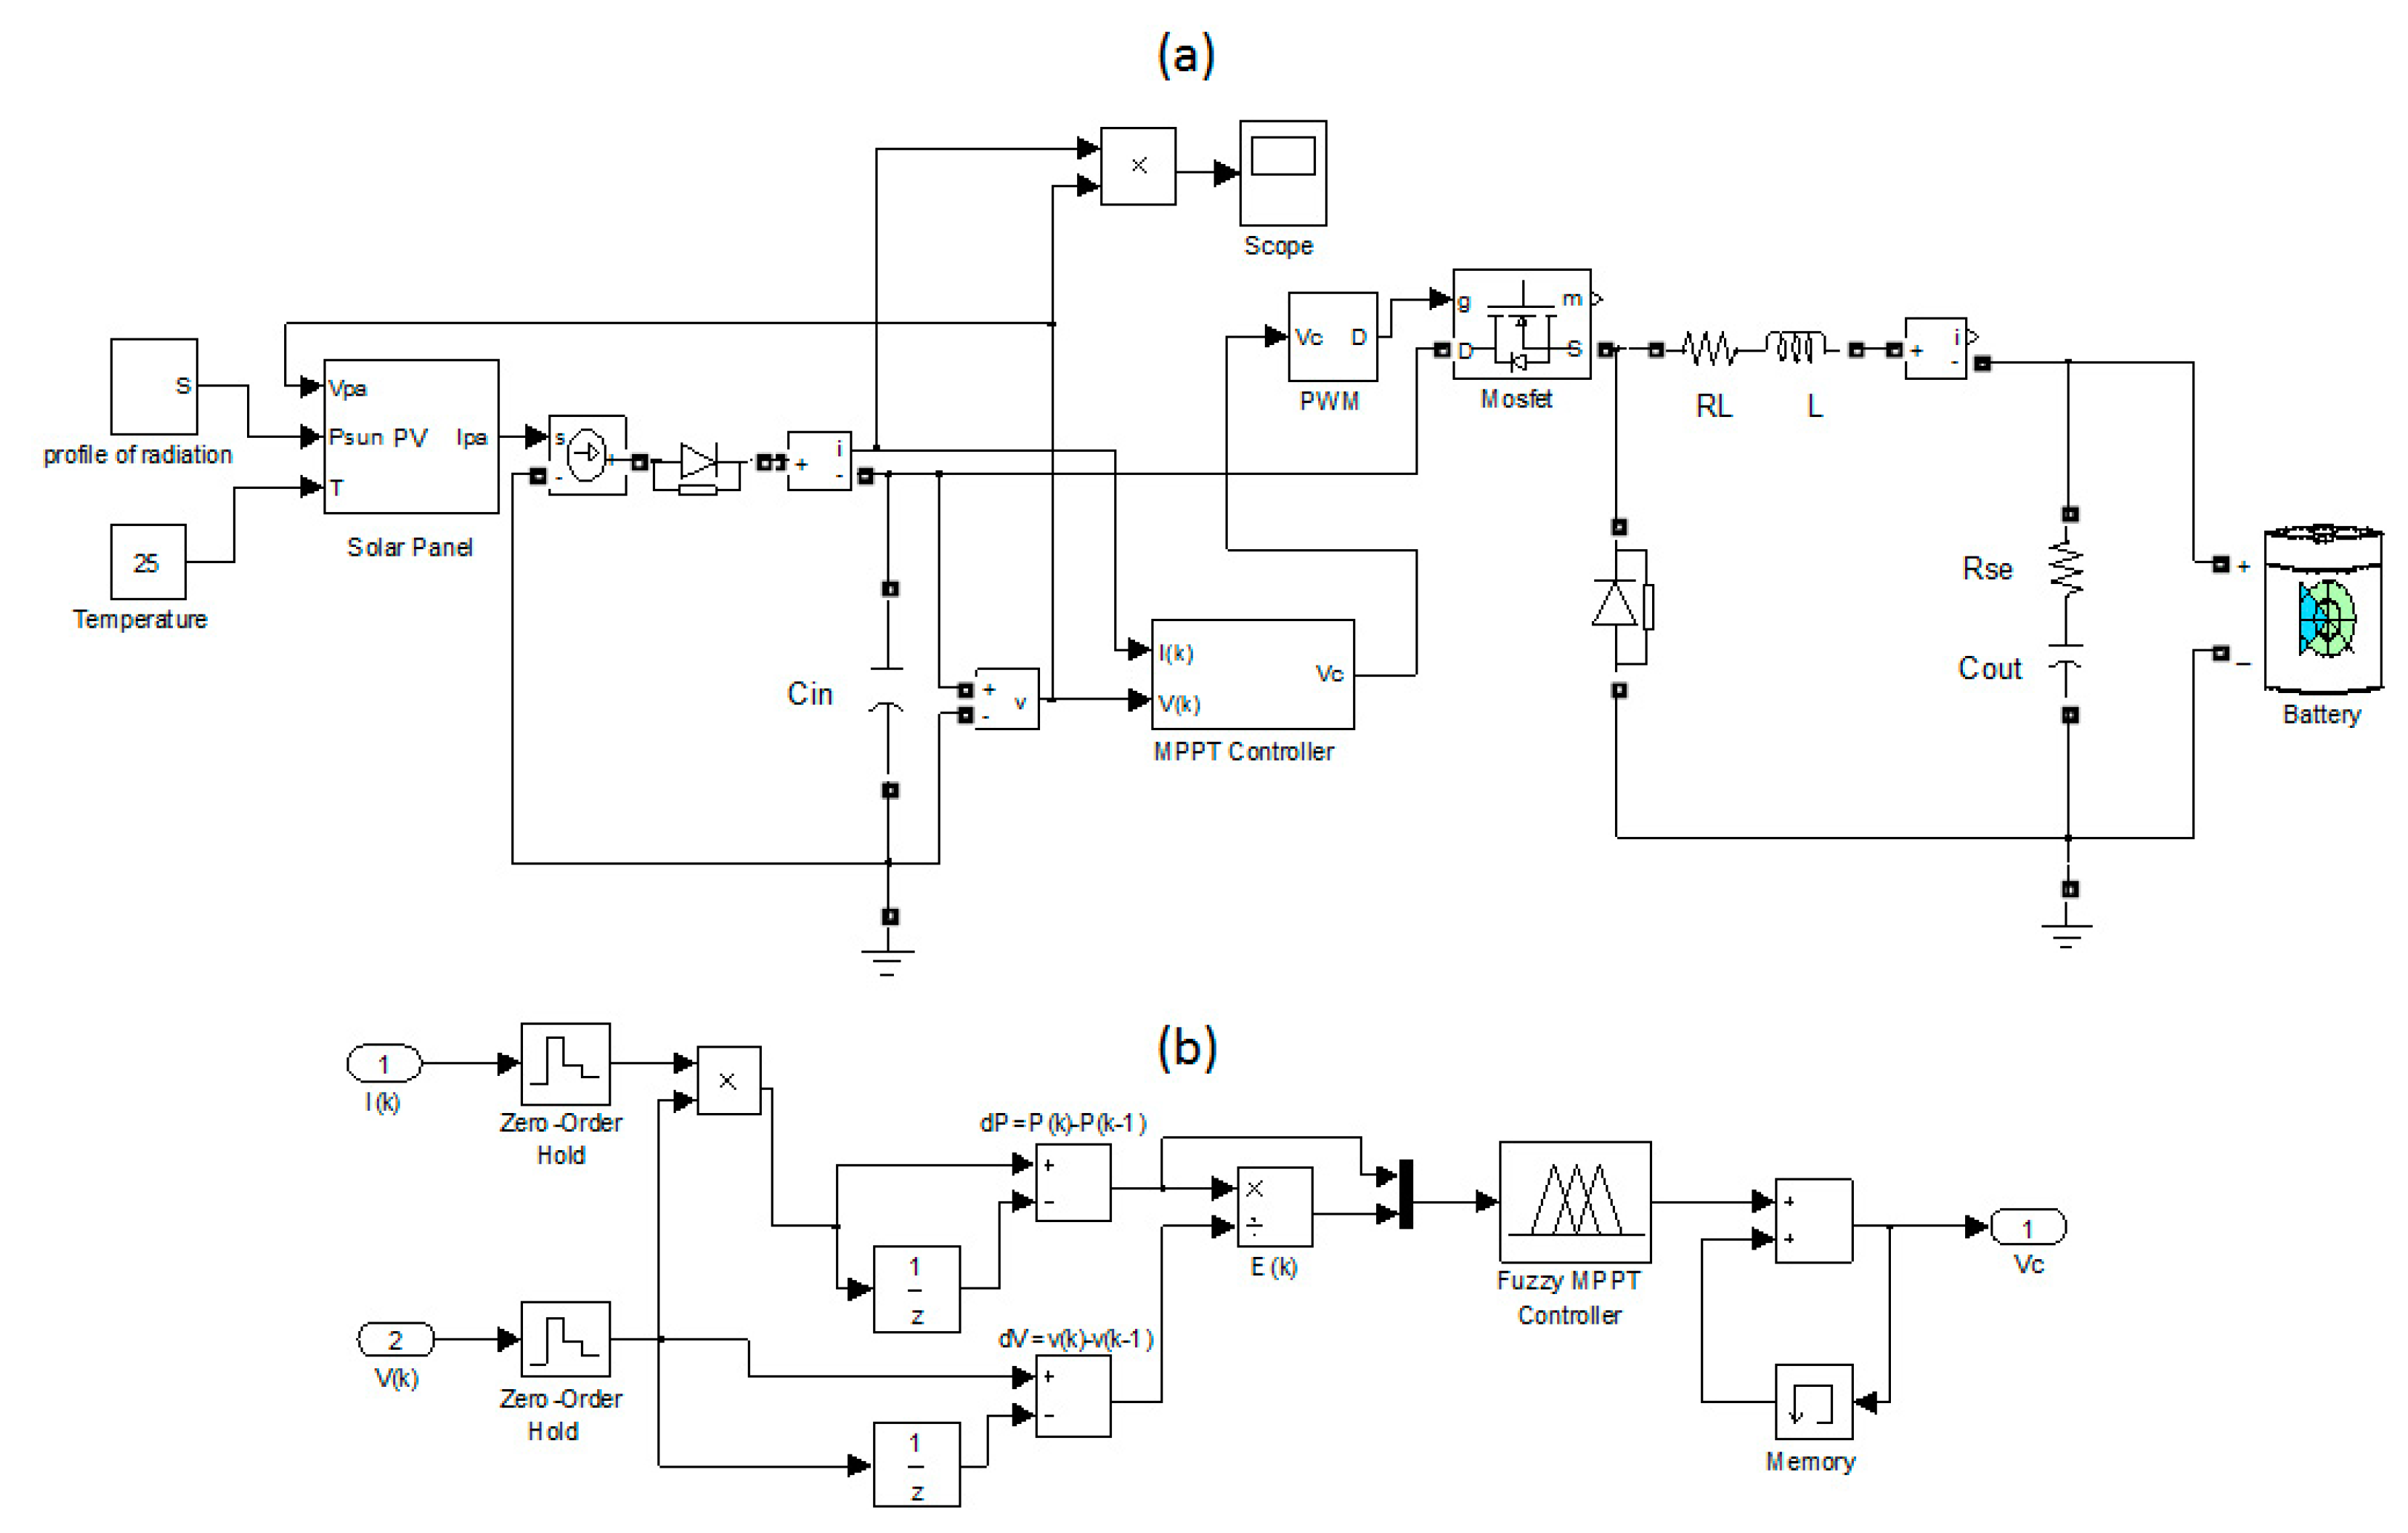
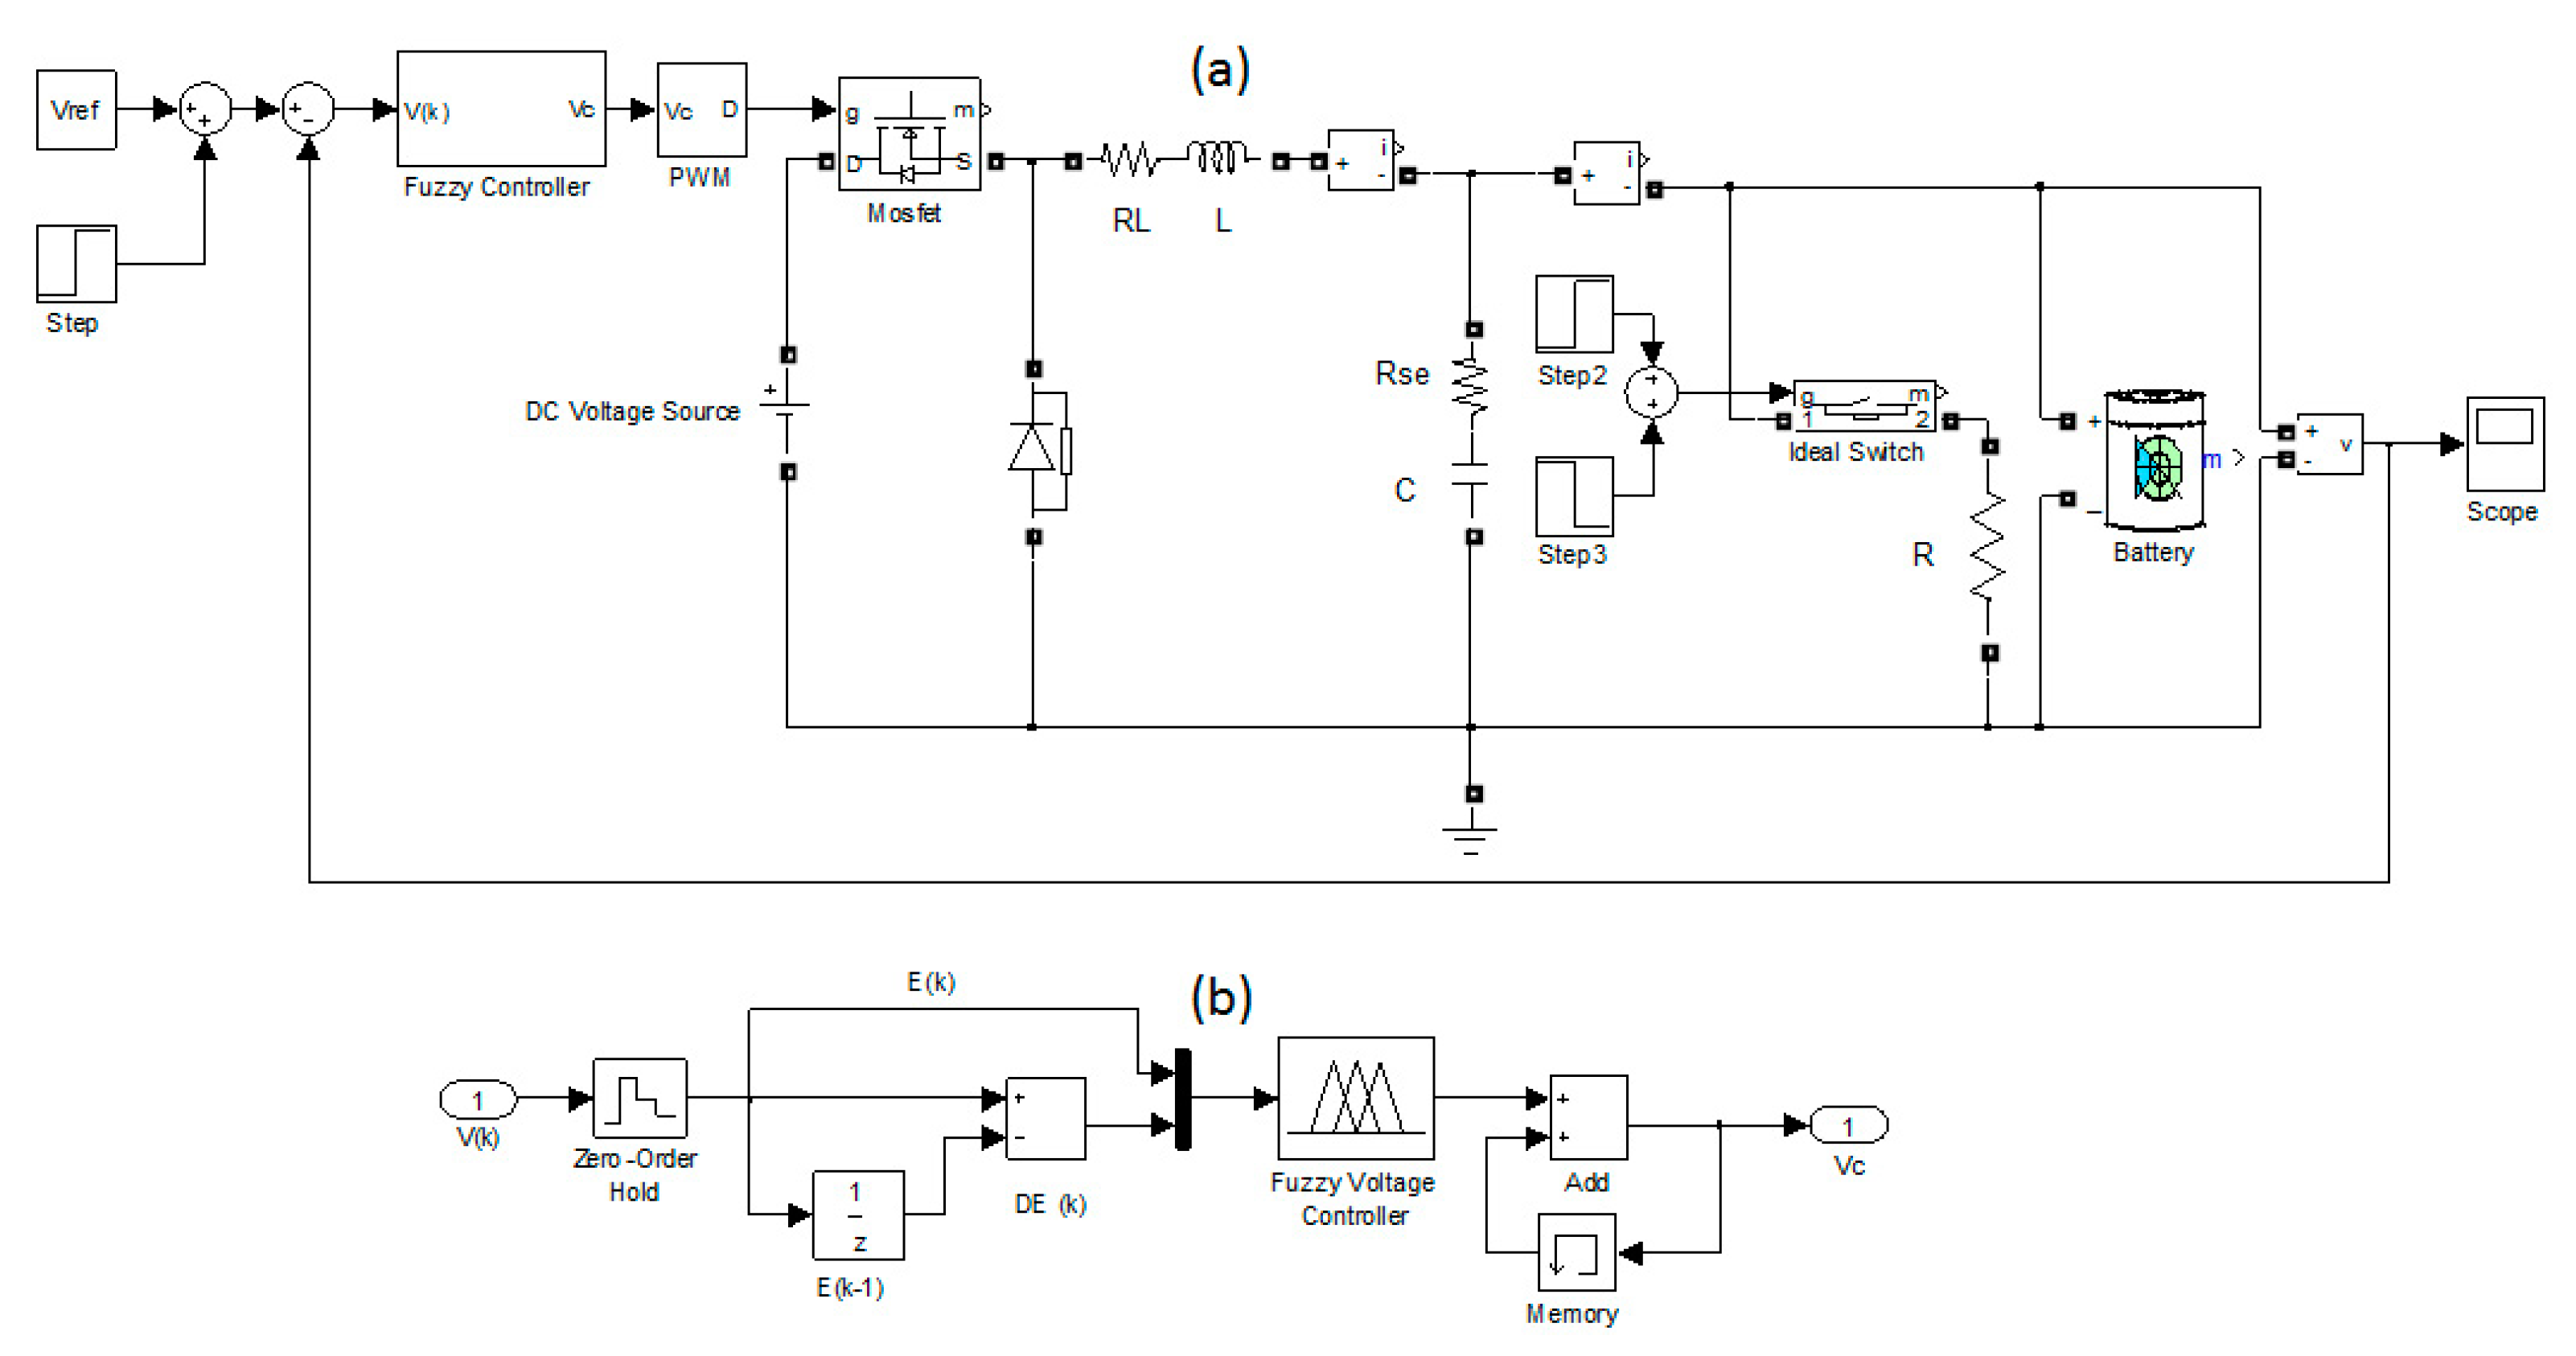
3. Design of the Fuzzy Logic Controllers

FLC is one of the AI techniques that provides a convenient method for the design of non-linear controllers based on heuristic information [63]. This method does not require an accurate mathematical model of the system to determine the parameters of the controller. The information needed is obtained by the knowledge of an expert on the system. FLC provides a simple methodology to represent and implement the human experience, allowing reasoning, not in numerical variables, but in linguistic variables, which are qualitative [64]. As shown in Figure 7, an FLC includes three steps: fuzzification, the fuzzy inference engine, and defuzzification. In the fuzzification, the numerical input variables are converted into linguistic variables, based on input membership functions. The inference engine is responsible for making control decisions considering the knowledge base (rule base) using a linguistic description in terms of If–Then rules. The most commonly used inference methods are Mandami and Takagi–Sugeno. In the defuzzification, the linguistic based data are converted back to numeric data. Center of gravity (CoG) and Mean of Maxima (MoM) are two methods normally used for defuzzification.
For the design of the FLCs, the following definitions have been adopted. The control of the power converter is carried out by adjusting the duty cycle value of the electronic switch in each switching period. For any pair of discrete input data [x1(n), x2(n)], a set of triangular membership functions, defined specifically for each FLC, transforms the numeric data into a fuzzy dataset for each input µ1[x1(n)] and µ2[x2(n)], assigning a certain degree of belonging to each linguistic variable. Triangular membership functions have been chosen because they are simple to implement and can reduce the computational cost, being more suitable for low-cost microcontrollers. Using the Mandami method of fuzzy minima implication, the inference engine applies the control rules to the fuzzified inputs, generating a single set of fuzzy outputs (µΔD) for each rule. Finally, the numerical value of the output variable, which corresponds to the size of the duty cycle variations (ΔD), is obtained using the CoG defuzzification method, shown in Equation (5).
Δ D ( n ) = i = 1 k Δ D i · w i i = 1 k w i
where n is the time at which values are sampled, wi = min {μ1[x1(n)],u2[x2(n)]} is the weight factor, and ΔDi is the value which corresponds to the membership function of ΔD(n). The output of the FLC is converted to the duty cycle according to Equation (6).
D ( n ) = D ( n 1 ) + Δ D ( n )

3.1. Design of FLC-MPPT

3.1.1. Fuzzy Inputs

Design considerations and the effectiveness of a fuzzy MPPT algorithm depends on the proper selection of the system’s input variables. According to the characteristics of a PV cell, several types of input variables could be used. In this work, the slope (S) of the P–V curve and the power variation (ΔPPV) have been chosen, as shown in Figure 8. This approach has the advantage of easily determining whether the operating point (OP) is on the right or left of the MPP, facilitating the increase or decrease in the converter’s duty cycle. In addition, for low radiation levels, ΔPPV can be used to detect changes in radiation and facilitate the tracking speed [65]. ΔPPV and S can be described by Equations (7) and (8), respectively.
S ( n ) = Δ P PV ( n ) Δ V PV ( n ) = I PV ( n ) · V PV ( n ) I PV ( n 1 ) · V PV ( n 1 ) V PV ( n ) V PV ( n 1 )
Δ P PV ( n ) = P PV ( n ) P PV ( n 1 )

3.1.2. Asymmetrical Membership Functions

In order to optimize the efficiency of the MPPT, asymmetrical triangular membership functions were used. FLC-MPPT algorithms based on asymmetrical functions have shown to have better behavior to extract maximum power than those based on conventional symmetric functions [25,30]. For both inputs and outputs, the membership functions were defined in terms of the following linguistic variables: negative big (NB), negative small (NS), zero (ZO), positive big (PB), and positive small (PS). The ranges for S, ΔPPV, and ΔD were adjusted to (−55 to 10), (−1 to 1), and (−0.02 to 0.02), respectively. Since there is no definite systematic method to select gains for an FLC, the membership values have been determined by trial and error by using the MATLAB Fuzzy Inference System. Figure 9 shows the membership functions for the inputs and output of the controller.

3.1.3. Fuzzy Rules

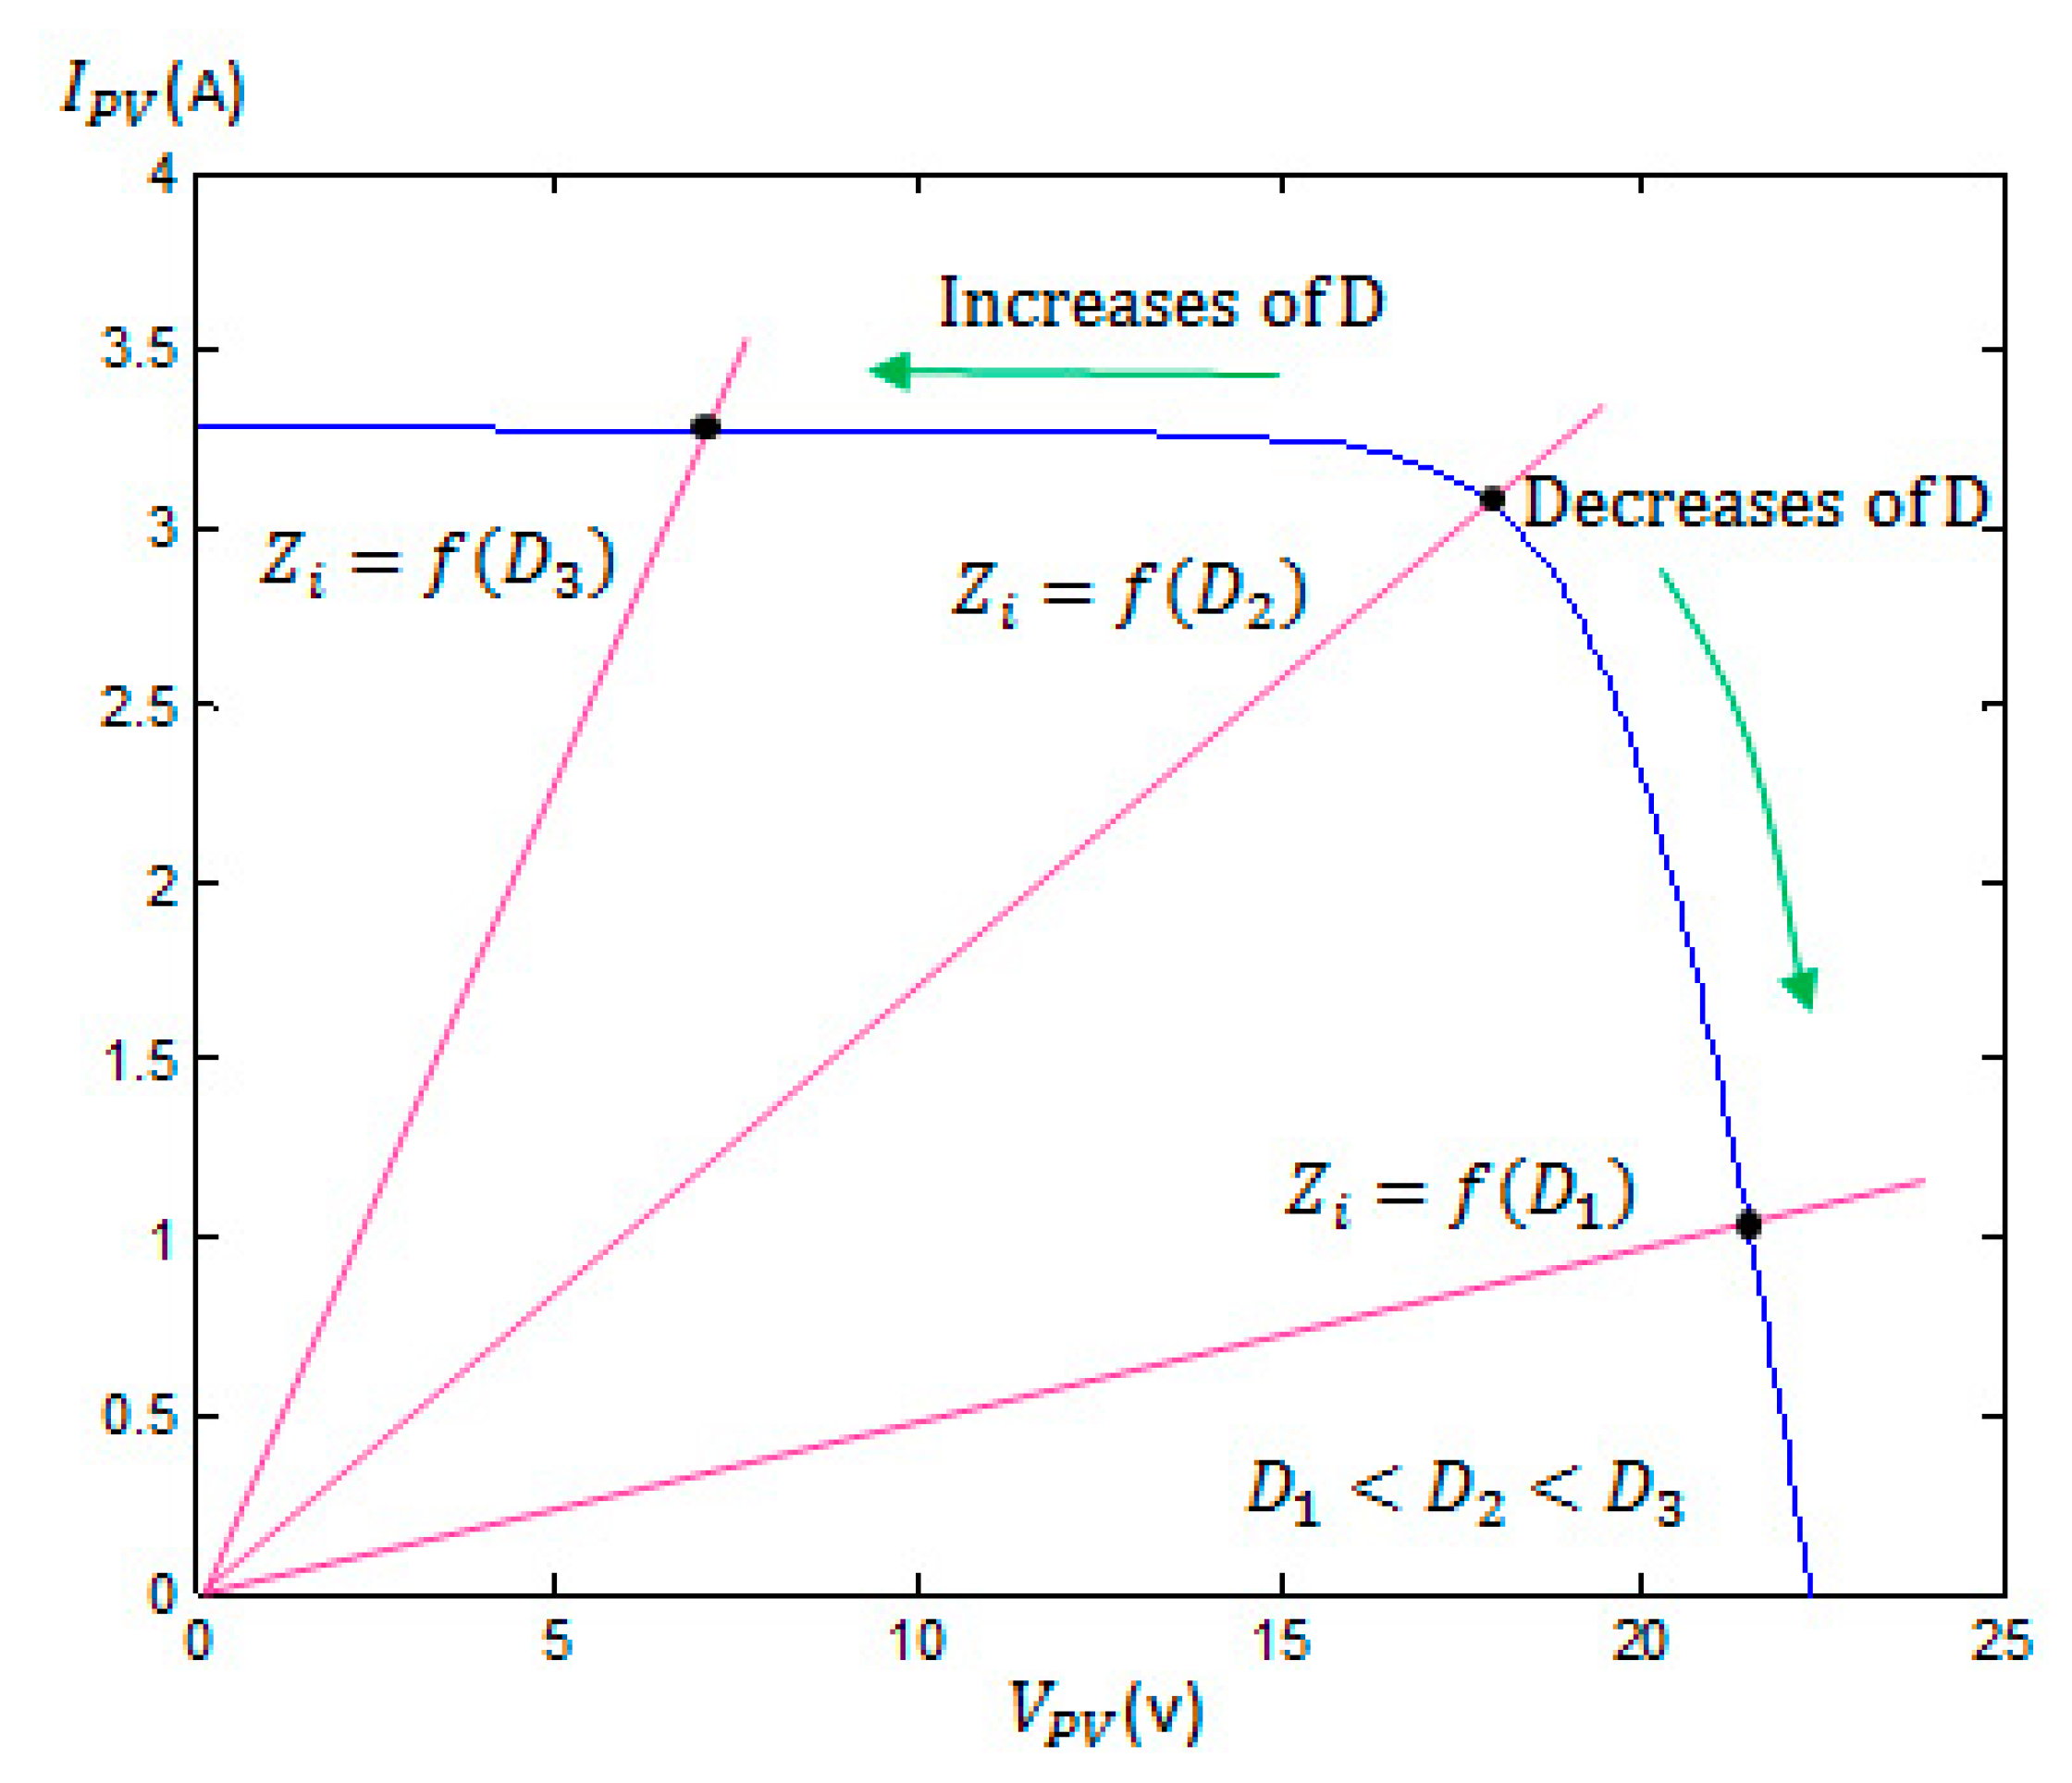
A DC–DC converter has the characteristic of reflecting in its input the impedance of the connected load (ZL). This impedance is reflected as a function of the duty cycle of the converter. Thus, by varying the duty cycle, it is possible to adjust the current and voltage in the PV panel, i.e., its OP. In the case of the Buck converter, the reflected input impedance (Zi) is given by Equation (9) [66]. If the duty cycle of the Buck converter increases, the input impedance decreases, producing an increase in the current in the PV panel and displacing the OP of the panel to the left. In the case where the duty cycle decreases, the opposite effect is produced and the OP of the panel is moved to the right, as shown in Figure 10.
Z i = Z L D 2
Fuzzy rules have been developed according to the relationship between the chosen input variables and their behavior in the PV panel’s P–V characteristic (Figure 8). Six operating criteria have been addressed:
(1)
If S is positive and ΔPPV is positive, it means that the OP is on the left side of the MPP and approaching it; then, ΔD must be negative to continue in the same direction.
(2)
If S is positive and ΔPPV is negative, it means that the OP is on the left side of the MPP and the OP is moving away from it; then, ΔD must be negative to change direction.
(3)
If S is negative and ΔPPV is positive, it means that the OP is on the right side of the MPP and approaching it; then, ΔD must be positive to continue in the same direction.
(4)
If S is negative and ΔPPV is negative, it means that the OP is on the right side of the MPP and moving away from it; then, ΔD must be positive to change direction.
(5)
If ΔPPV is zero, it means that the OP could be very close to the MPP. Here, two situations could happen: In the case of S being negative, it means that the OP is on the right side of the MPP; then, ΔD must be positive to move the OP to the left. In the case of S being positive, it means that the OP is on the left side of the MPP; then, ΔD must be negative to move the OP to the right.
(6)
If S is zero, it means that the MPP has been reached; then, ΔD must be zero.
Table 2 shows the summary of the proposed rules for the FLC-MPPT. The control surface is shown in Figure 11.

3.2. Design of FLC-VR

3.2.1. Fuzzy Inputs

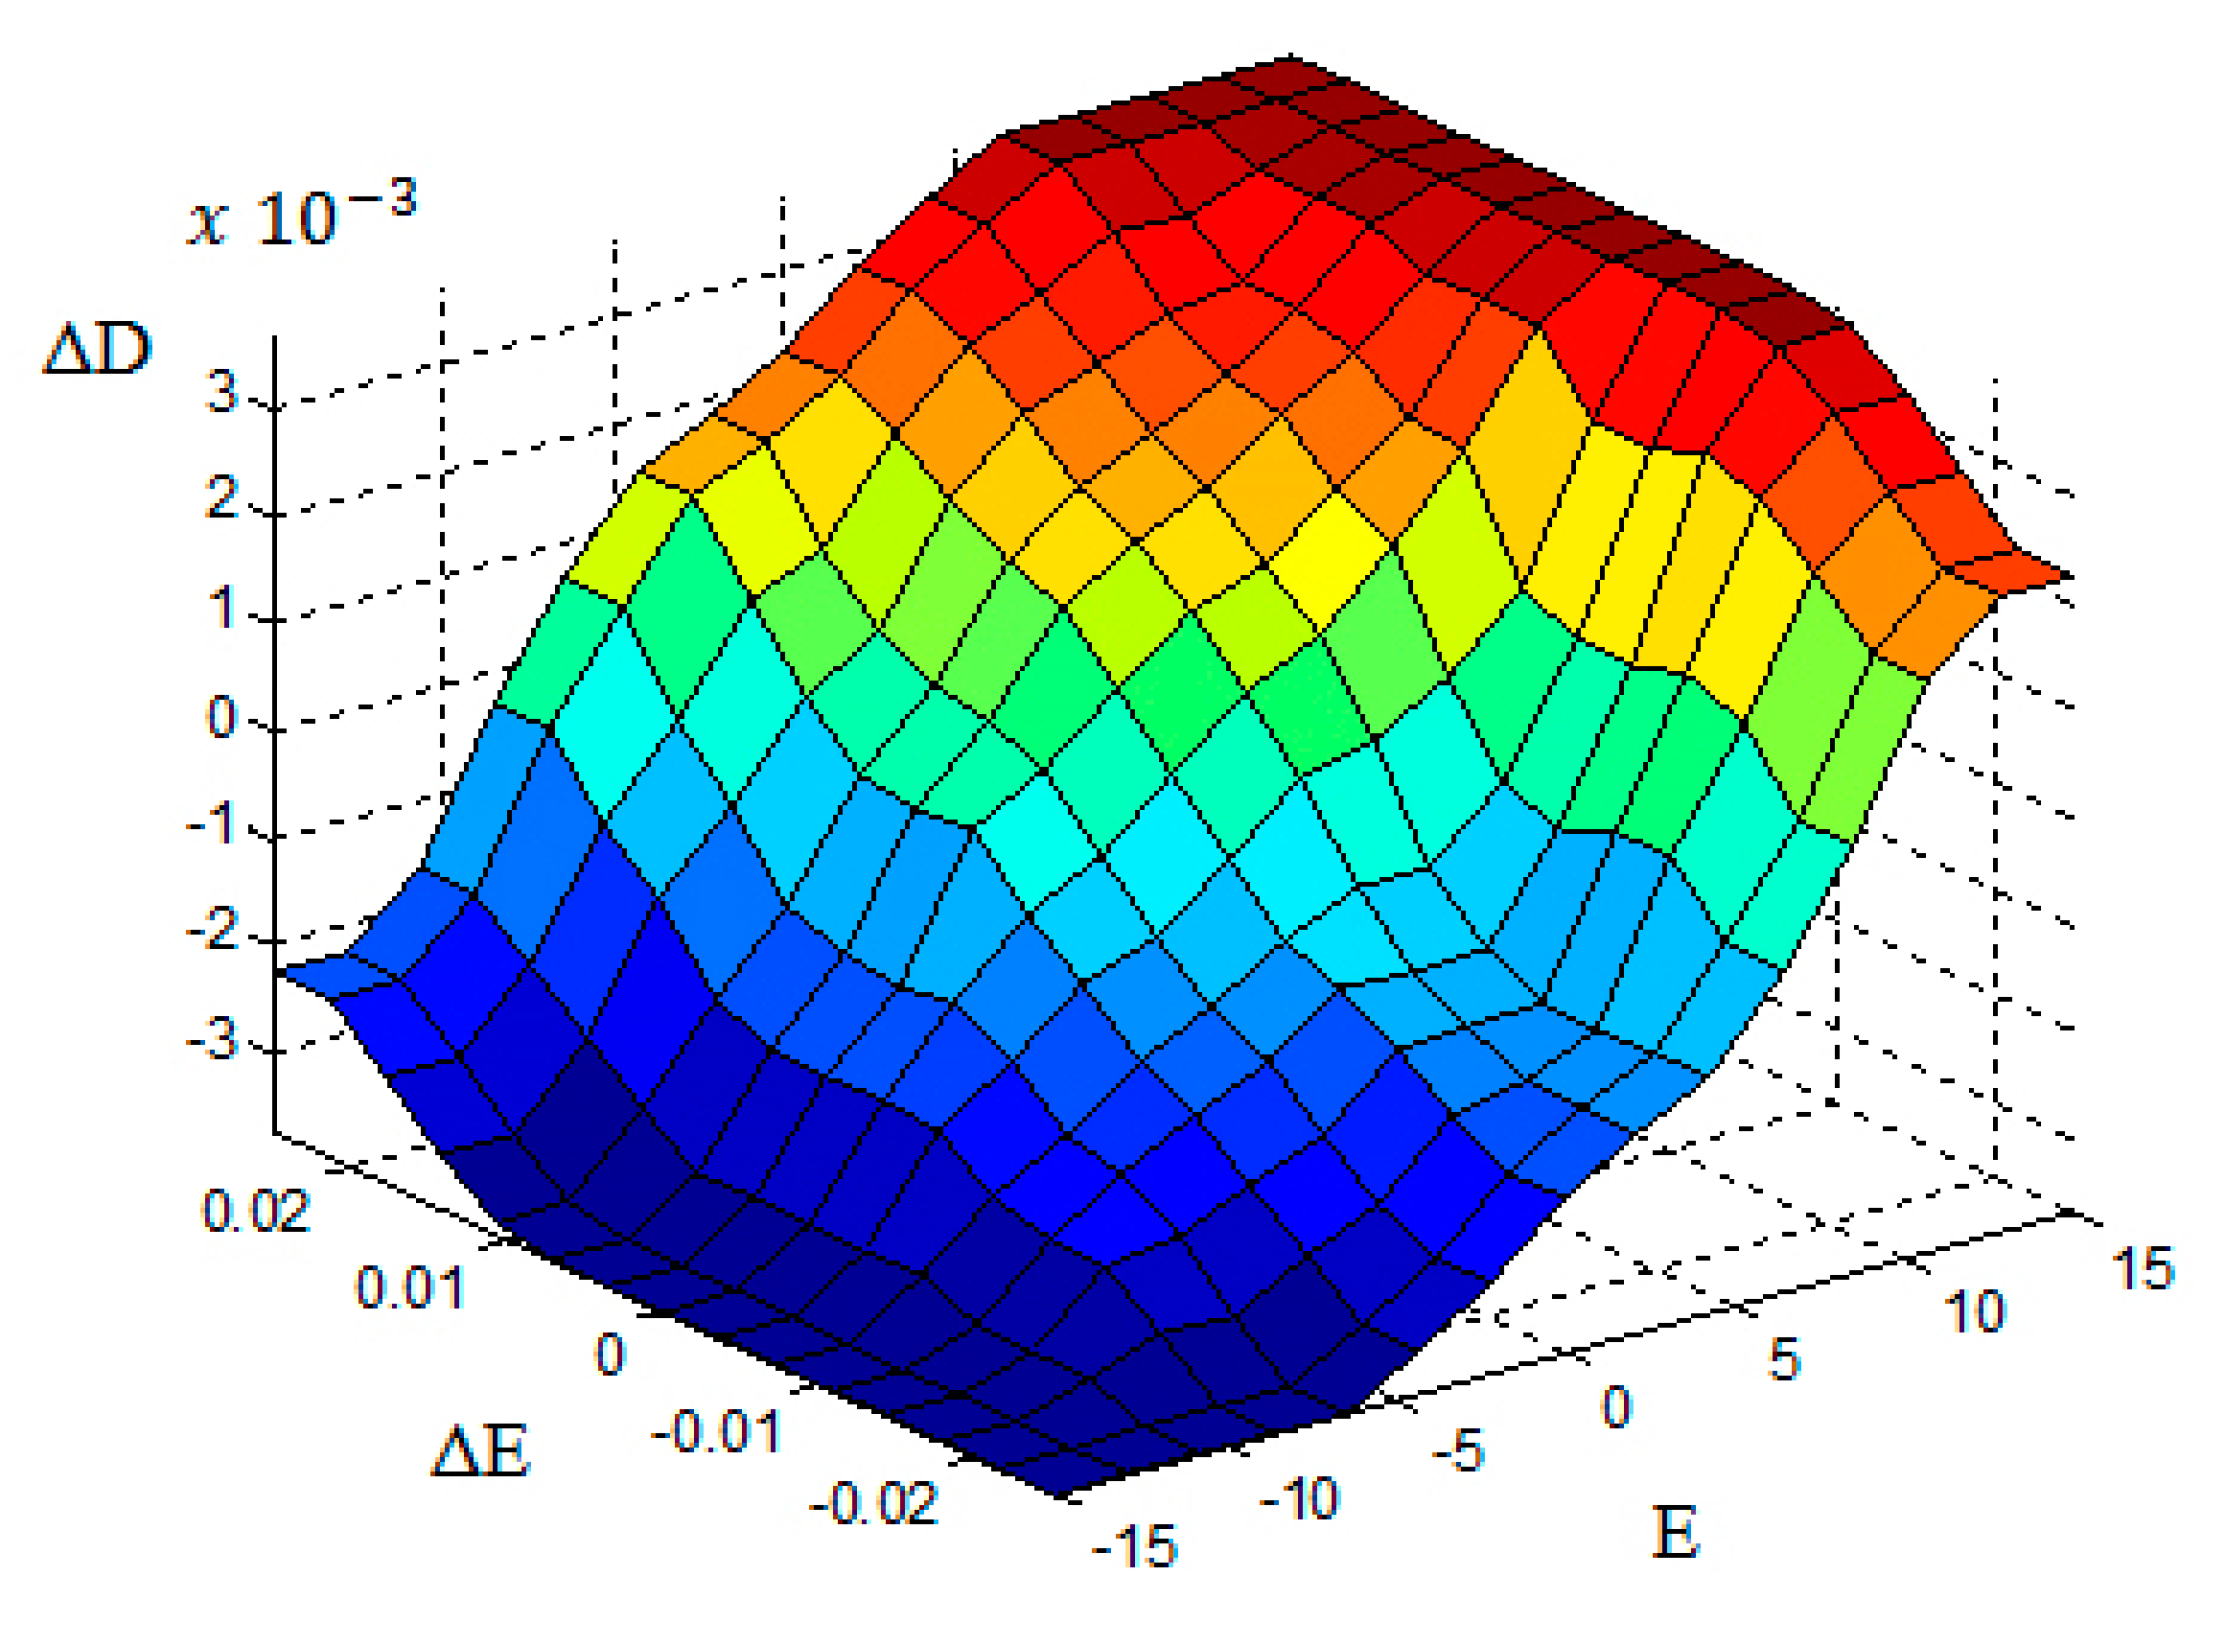
To design the voltage controller, two input variables have been chosen: the error (E) and the error change (ΔE); the sampled values of these variables are described in Equations (10) and (11), respectively.
E ( n ) = V REF V BAT ( n )
Δ E ( n ) = E ( n ) E ( n 1 )
where VREF corresponds to the desired charging voltage.

3.2.2. Symmetrical Membership Functions

For the fuzzification process, symmetric triangular membership functions were used. For the entries, the following linguistic variables were defined: negative big (NB), negative mean (NM), zero (ZO), positive big (PB), and positive mean (PM). The range for E and ΔE were adjusted to (−15 to 15) and (−0.025 to 0.025), respectively. In order to improve the accuracy of the controller, two more linguistic variables for the ΔD output function can be added: positive small (PS) and negative small (NS) [67]. The range of ΔD was adjusted to (−0.05 to 0.05). Figure 12 shows the membership functions for the inputs and output of the controller.

3.2.3. Fuzzy Rules

The derivation of the control rules has been based on six criteria [68]:
(1)
If E is large (positive or negative), then ΔD change must be large in order to bring VBAT quickly to VREF.
(2)
If E is decreasing, then a small change in ΔD is necessary.
(3)
If E is zero and ΔE is not zero (VBAT keeps changing), then a small change in ΔD is necessary to prevent the VBAT from moving away from VREF.
(4)
If E is zero and ΔE is zero, then ΔD must remain unchanged.
(5)
If E is positive, then the sign of the ΔD change must be negative.
(6)
If E is negative, then the sign of the ΔD must be positive.
Table 3 shows the summary of the proposed control rules. Figure 13 shows the control surface of the FLC-VR.

4. Simulations

In this section, the results of the simulations assembled in Simulink are presented. The fuzzy algorithms were implemented using the Toolbox Fuzzy Logic Designer. The model developed for the commercial module presented in Section 2.1 is represented by the Solar Panel function block. The battery behavior has been represented by the generic model for lead-acid batteries available on Power System Toolbox. The values for the power converter are those used in the experimental prototype.

4.1. FLC-MPPT

Figure 14 shows the scheme implemented to analyze the performance of the FLC-MPPT algorithm. A radiation profile with abrupt changes and constant temperature was applied as the input of the PV panel, as shown in Figure 15. The transient behavior and the steady-state tracking efficiency of the MPPT were determined, and their results compared with two popular conventional MPPT techniques: P&O and IncCond. Details of these techniques can be found in [6]. The calculation of efficiency (η) in Equation (12) and the convergence time (τ), determined as the time in which the system reaches 95% of the MPP, as recommended in [69], were calculated. Figure 16 shows the behavior of the MPPT algorithms for each radiation level; the results for the obtained efficiencies are summarized in Table 4. It can be observed that, compared to P&O and IncCond, the FLC-MPPT presented the highest average efficiency and the smallest steady-state ripple of power, for all radiation levels tested. Table 5 shows the convergence times for each MPPT method, where the FLC-MPPT presented the fastest transient response.
η = 0 t P PV 0 t P MPP × 100 i = 1 n P PV i = 1 n P MPP × 100

4.2. FLC-VR

To evaluate the performance of the FLC-VR, the scheme of Figure 17 was implemented. Two typical tests to analyze the functioning of a feedback control were carried out. The results obtained for the FLC-VR have been compared with the behavior of a classic PID controller, which has been tuned by the Ziegler–Nichols method [70]. The adjusted parameters of the PID controller are shown in Table 6. First, a step in the reference voltage from 13.5 to 14.4 V was applied at t = 0.02 s. Then, a step in the load current from 4 to 6.7 A was applied at t = 0.04 s. Figure 18 shows the system response for each controller. The performance parameters—settling time and overshoot—were summarized in Table 7. It can be seen that the FLC-VR presented a better behavior than the PID controller, with a shorter settling time to reach the new set point and correct the battery voltage in the event of load disturbances, in addition to the considerable decrease in overshoot.

5. Experimental Results and Discussion

5.1. Implemented System Description

Figure 19 shows the experimental setup implemented to validate the performance of the control strategy. The system consists of monocrystalline WANT-M55W PV panels, a NIMAC VRLA 12 V/10 Ah battery, and the prototype of the charge controller, which contains three main circuits: the Buck converter, a signal measurement and conditioning board, and the Arduino Due board where the developed C code was implemented. The high performance, low power, flexibility, the simplicity of its hardware and software, and low cost of the Arduino Due microcontroller has motivated its use in this work. Data collection was performed using the DAQ USB 6009 system from National Instruments and the Tektronic TDS2012B digital oscilloscope. Table 8 presents the main components used to build the Buck converter. Table 9 presents the main technical data of the Arduino Due microcontroller. All experimental tests have been carried out on the premises of Arturo Prat University in Iquique, Chile.

5.2. MPPT-FLC Performance

To analyze the dynamic response of the FLC-MPPT, a test was conceived. With the control operating in the Bulk region, and under approximately constant conditions of radiation and temperature, a situation that can be verified during a time interval of a few seconds on a clear day. A step in the charging current of the battery of 10% was applied. This was performed connecting a resistor in parallel to the battery. Figure 20 shows that the power on the PV panel initially has a reduction of 18% (46 to 38 W) due to the current change. Then, the control algorithm quickly acts to reduce the voltage of the PV module in order to compensate for the current increase and takes the operating point around the MPP again, reaching a convergence time of 1.93 s. On the same day, aiming to determine the average steady-state efficiency of the FLC-MPPT, three other tests were carried out. They were performed at different times in order to achieve very different radiation levels. The FLC-MPPT presented an excellent performance, reaching efficiencies greater than 97.87% in all cases analyzed, as shown in Figure 21. The results obtained are summarized in Table 10.
In order to test the behavior of the FLC-MPPT in complete cycles of daily radiation, four tests were performed. In all of them, the battery was replaced by a resistor. The value of the resistive load has been carefully chosen. If the maximum power voltage (VMPP) and maximum power current (IMPP) values of the commercial PV panel are considered for an incident radiation of 1000 W/m2 and temperature of 25 °C, weather conditions known as standard test conditions (STC) (Table 1), then the theoretical value of the resistor that guarantees MPP in this climatic condition can be determined as RMPP = VMPP/IMPP = 18.21 V/3.02 A = 6 Ω. On the other hand, according to Equation (9), note that the Buck converter has an inability to reflect impedances less than the load on its input. Therefore, the impedance connected to the output of the power converter must be less than RMPP. In order to achieve the widest possible range for adjusting the duty cycle, a load resistor RL = 1 Ω was chosen. Therefore, for example, for the STC, the duty cycle according to (9) should be D = (1/RMPP)(1/2) = 0.4, which is almost at the center of the allowable range for D (0 to 1).
In each test, power data on the panel with 10-second intervals were collected, starting from 8:00 a.m. to 8:00 p.m., local time. As a comparison, the power data of another PV panel with identical characteristics operating without the MPPT algorithm and with different RL values were also collected simultaneously. Figure 22 shows how the daily energy production of the PV panel was effectively maximized by FLC-MPPT. Table 11 summarizes the obtained results. Figure 23 shows the duty cycle in PWM form, generated at certain times during the test on January 31, and obtained directly from the drain source voltage in the Buck converter’s Mosfet.

5.3. FLC-VR Performance

To analyze the performance of the voltage control, a test was carried out, consisting of adjusting the controller set point to 14.4 V, using a resistor as a load. With the control in progress, steps in the load current were applied, alternating the load resistor between 15 and 7.5 Ω. When the disturbances were applied, both the current in the load and the power supplied by the PV panel reached new levels, while the controller quickly adjusted the duty cycle of the converter to bring the output voltage to the reference. In the case of current increase, the voltage stabilization time was 1.24 s and in the case of current reduction, the voltage stabilization time was 0.93 s, as shown in Figure 24. The results obtained demonstrate the robustness of the FLC-VR to regulate the load voltage in the presence of abrupt current variations, which normally occurs in situations of abrupt changes in incident radiation.

5.4. Performance of the Three-Stage Charging Process

In order to validate the battery charger control’s global strategy, a final test was carried out. Experimental data were collected every 10 seconds between 12:00 and 19:45 h. The control flowchart parameters of Figure 5 were fixed as: VABS = 14.4 V, VFLT = 13.5 V, ICH(max) = 3A, and IOCT = 0.3 A, agreeing with the parameters suggested by the manufacturer of the commercial battery [71]. When starting the test, the battery was sufficiently discharged with a voltage of 13.1 V. Figure 25 shows the results obtained for the charging process. It is observed that between 12:00 h and 13:27 h, in the condition of discharged battery, the FLC-MPPT acts to maximize the power provided by the PV panel. The power increases while the available radiation grows as time advances. In this Bulk charging phase, the current in the battery remains constant around IBAT = 2.6 A and VBAT increases gradually until reaching the absorption value VABS = 14.4 V. At this threshold, the FLC-MPPT is switched off and the FLC-VR starts to adjust the absorption voltage. At this stage, IBAT begins to decrease, and consequently, also the current and power on the panel; the charger operates in this absorption phase between 13:24 h and 18:14 h. When IBAT reaches the full charge value IOCT = 0.3 A, the FLC-VR changes its reference, and the charge continues at the float voltage VFLT = 13.5 V, until the end of the test. In this final charging phase, only a small current is generated to avoid self-discharge and ensure 100% charge.

6. Conclusions

This work has presented and tested the design of a new digital control strategy implemented in the Arduino Due microcontroller for a Buck power converter used as a solar charger of VRLA batteries. The strategy combines both MPPT and output voltage regulation by using two precise fuzzy logic controllers (FLC-MPPT and FLC-VR), which operate adjusting the optimal increment of the converter duty cycle according to a smart three-stage charging algorithm. To evaluate the performance of the designed FLCs, simulations by MATLAB/Simulink were carried out. The results have shown that the FLC-MPPT operating under abrupt changes in incident radiation achieves higher MPPT efficiency, smaller steady-state ripple, and shorter convergence time compared to conventional MPPT techniques commonly reported in the literature: P&O and IncCond (Table 4 and Table 5). Furthermore, the FLC-VR presents smaller transitory voltage overshoot and faster transient response compared to a standard PID controller (
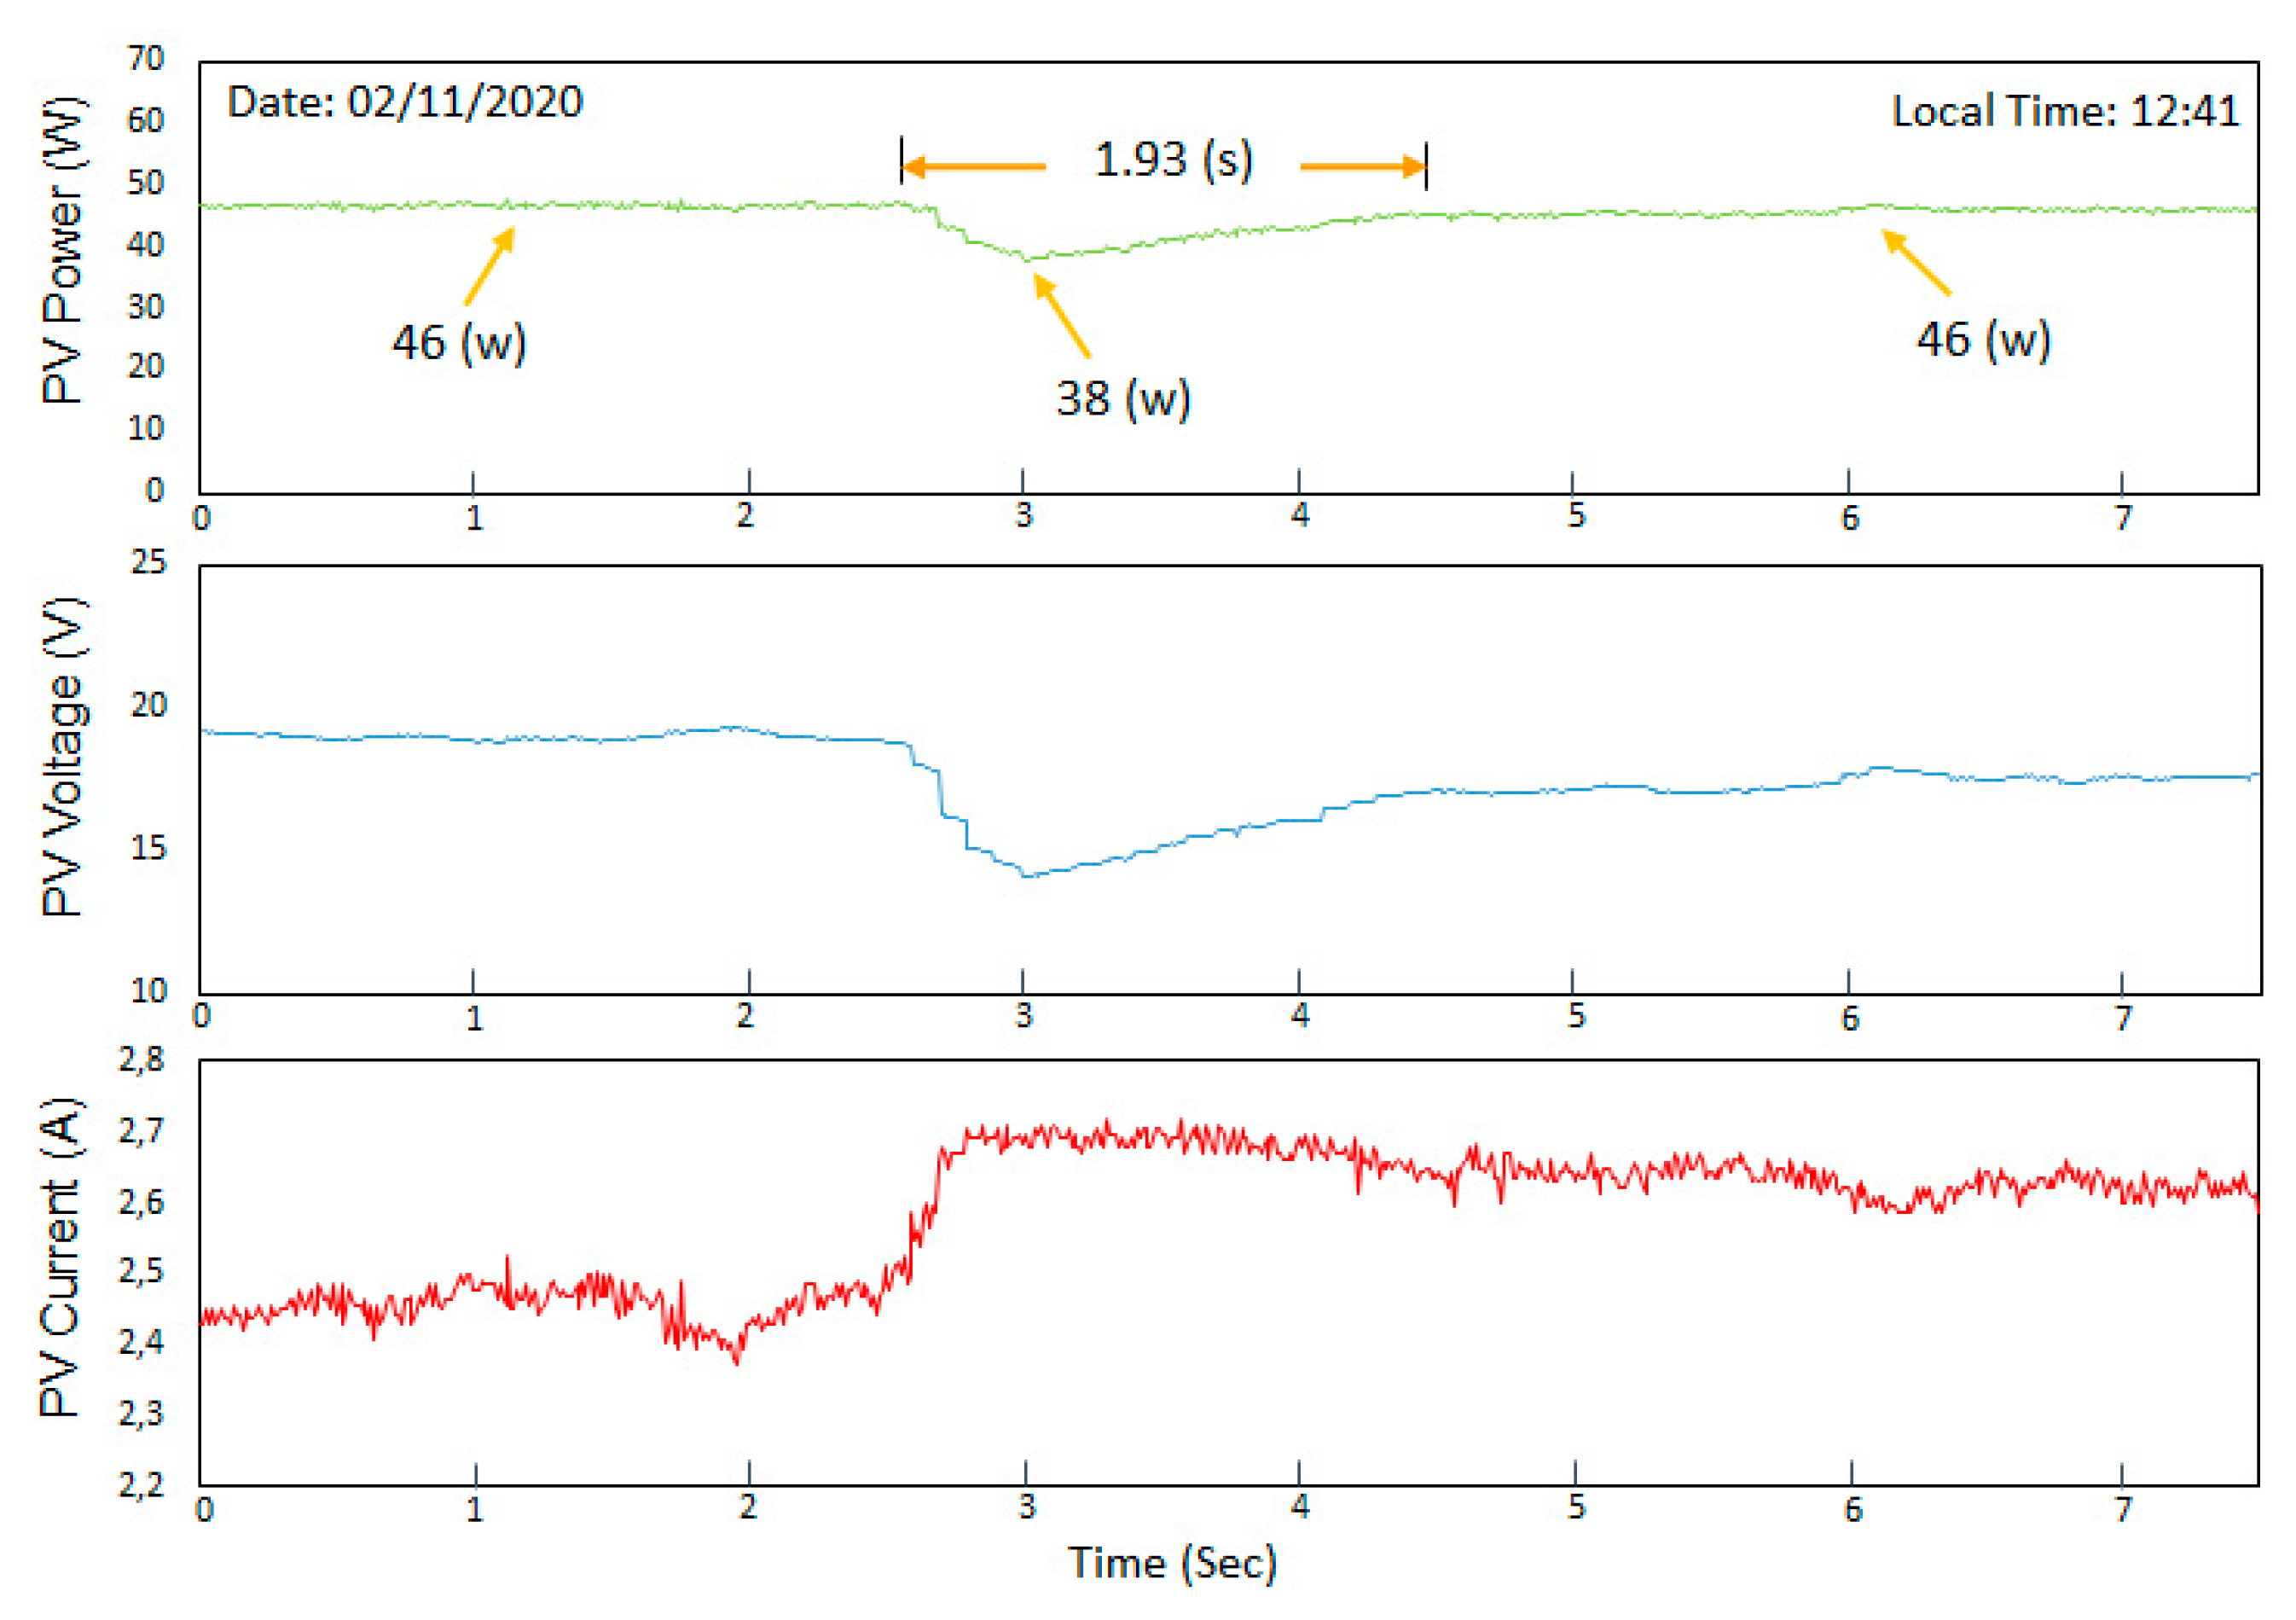
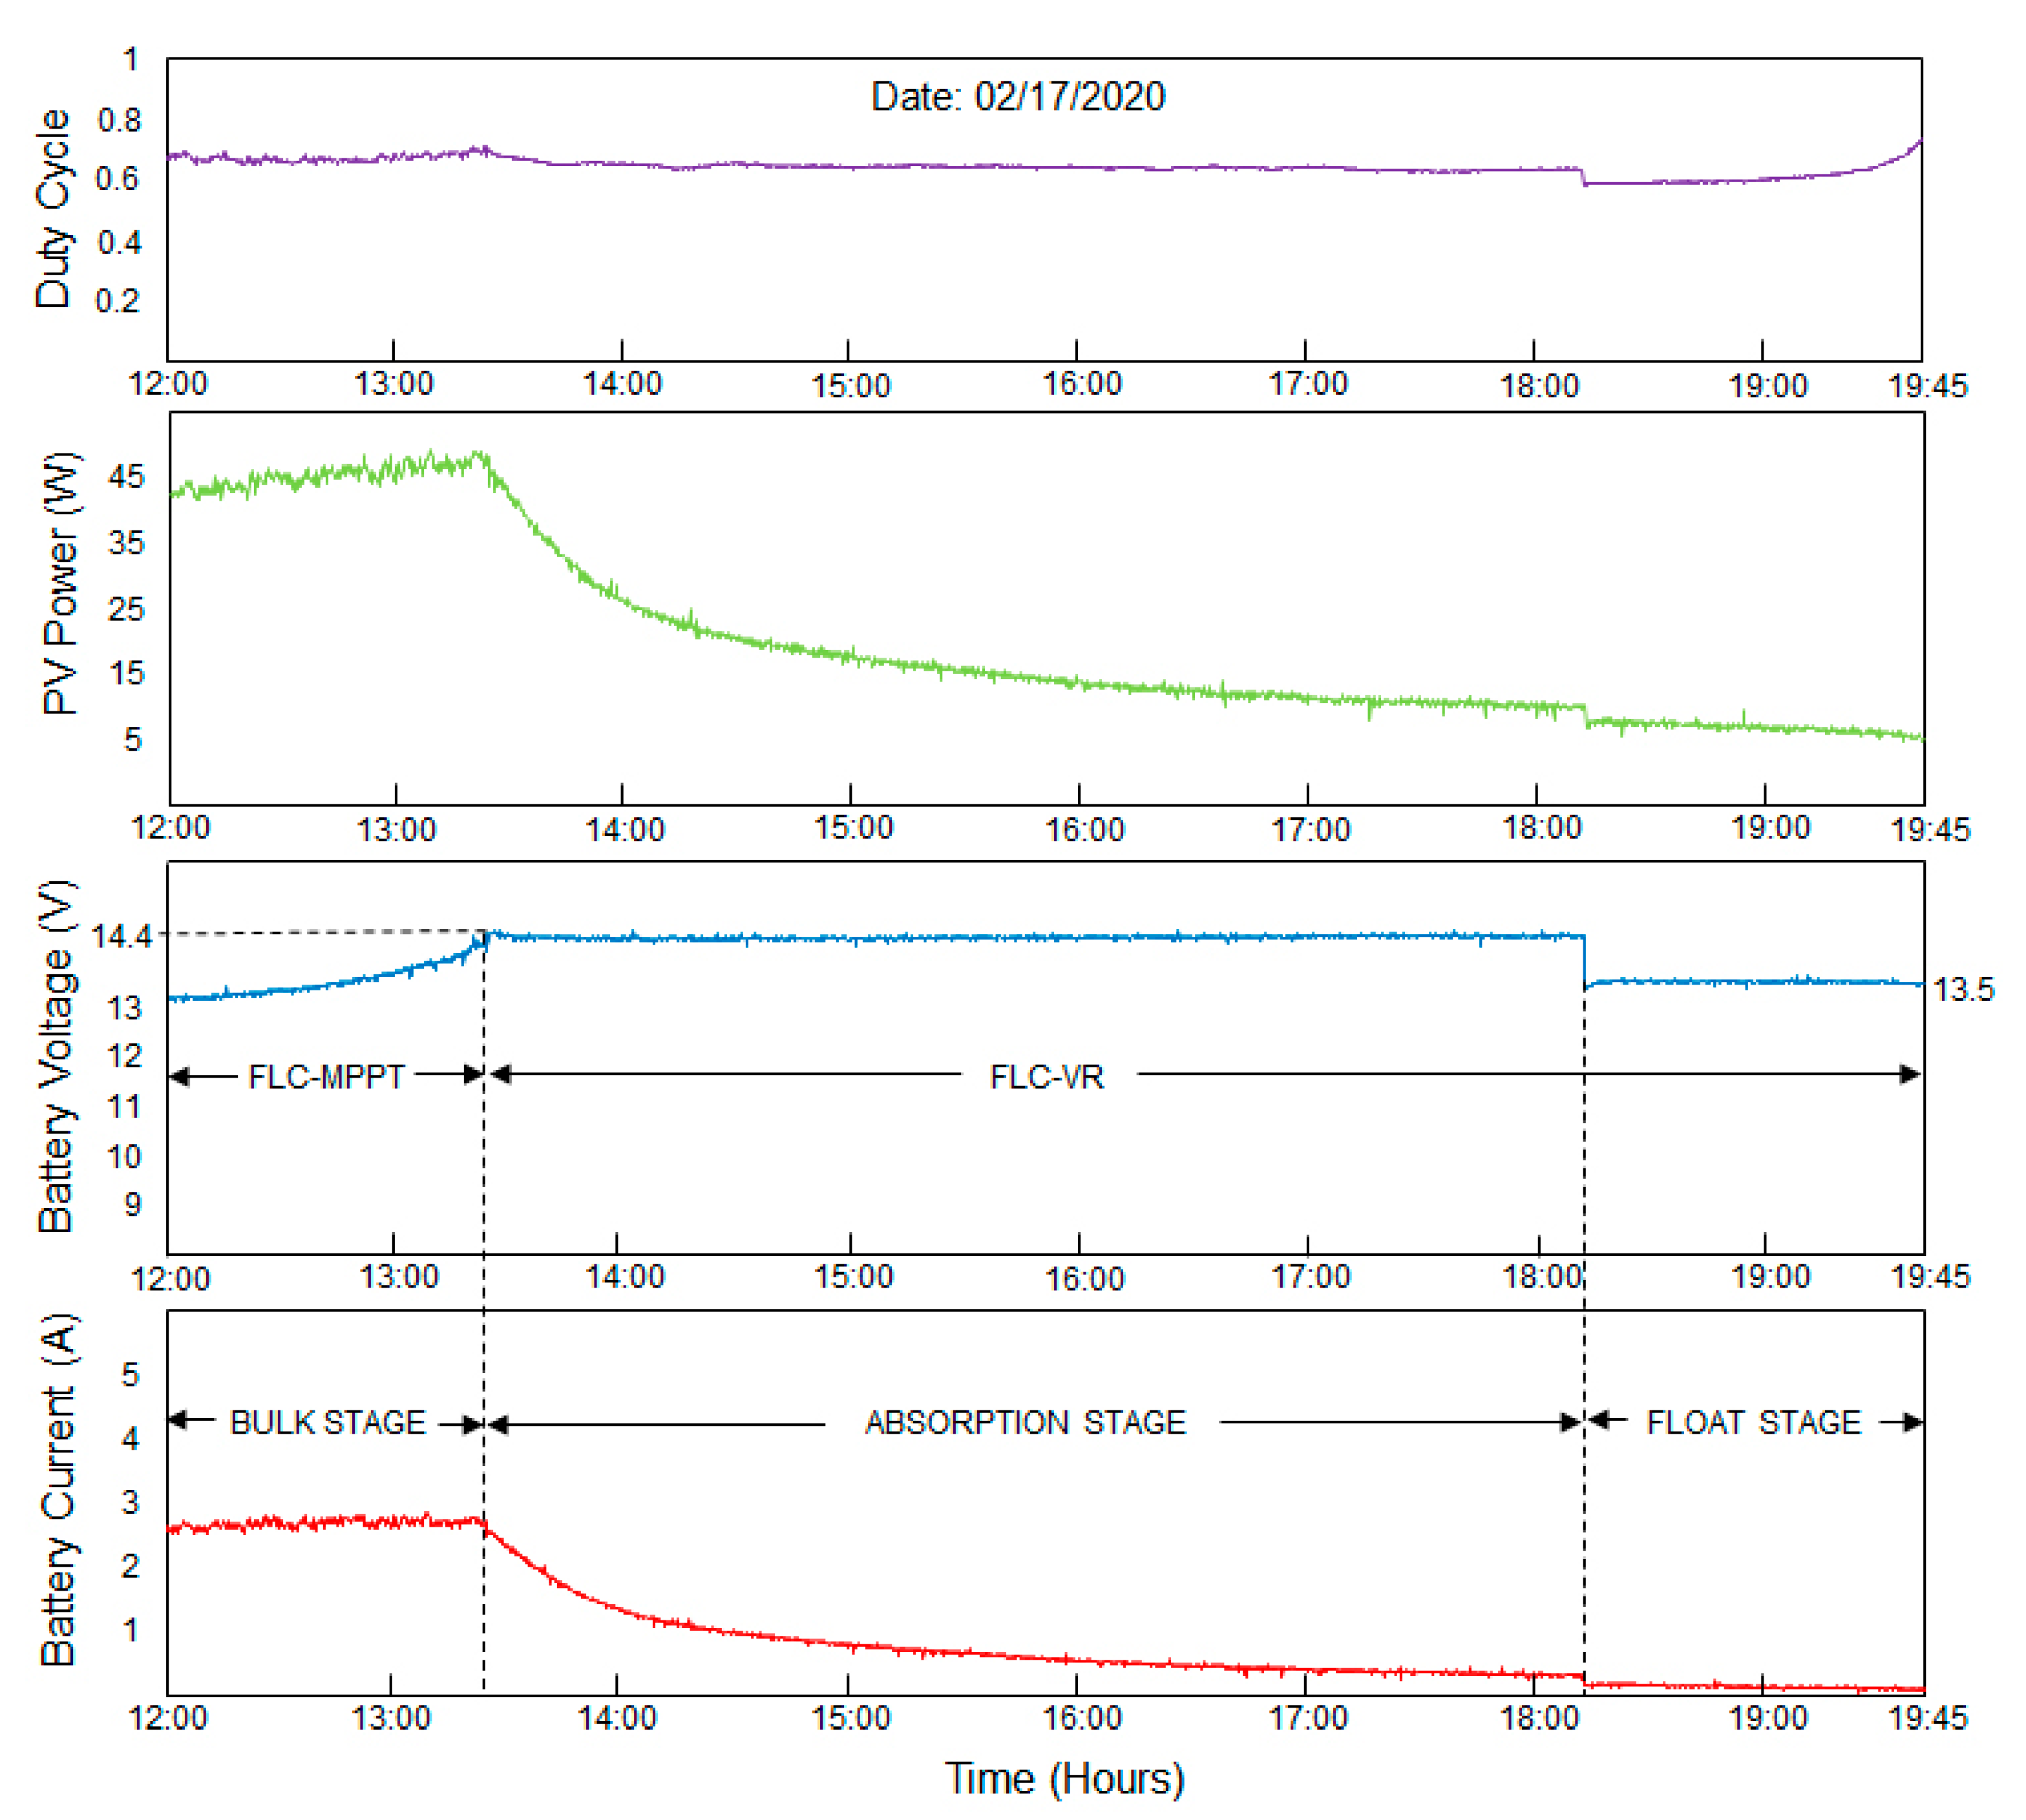
Table 6). In addition, a prototype hardware setup was implemented. The experimental tests have proved that in the Bulk charging region, the energy produced by the PV panel is maximized in different weather conditions, with efficiency of the FLC-MPPT being between 97.87 and 98.22% with a convergence time of 1.93 s. Moreover, in the absorption and float charging regions, the FLC-VR is able to stabilize the voltage against abrupt variations in the charging current, with setting times between 0.93 and 1.24 s.
The simulated and experimental results validate the robustness and reliability of the control strategy. The charging system delivers maximum power from the PV source to the battery and avoids overcharging, thereby ensuring an efficient, fast, and safe charging process. Moreover, it overcomes the drawbacks of the conventional PV charges, is feasible to implement in low-cost microcontrollers, and does not require any mathematical model.

Author Contributions

Conceptualization, J.L.S.; methodology, J.L.S.; software, J.L.S.; writing—original draft preparation, J.L.S.; visualization, J.L.S.; investigation, J.L.S.; writing—reviewing and editing, S.I.S.J. All authors have read and agreed to the published version of the manuscript.

Funding

This work has been supported by Arturo Prat University.

Conflicts of Interest

The authors declare no conflict of interest.

Nomenclature

Abbreviations
VRLAValve-Regulated Lead Acid
FLCFuzzy logic controller
FLC-MPPTFuzzy logic controller-maximum power point tracking
FLC-VRFuzzy logic controller-voltage regulator
PVPhotovoltaic
MPPMaximum power point
MPPTMaximum power point tracking
FOCVFractional open circuit voltage
FSCCFractional short circuit current
HCHill Climbing
P&OPerturb and observe
IncCondIncremental conductance
AIArtificial intelligence
ANNArtificial neural networks
PIDProportional–Integral–Derivative
SoCState of charge
PWMPulse width modulation
CoGCenter of gravity method
MoMMean of maxima method
OPOperating point of the PV panel
NBNegative big
NSNegative small
ZOZero
PBPositive big
PSPositive small
NMNegative mean
PMPositive mean
STCStandard test conditions
SMCSliding mode control
Symbols
VPVPanel PV voltage (V)
VBATBattery voltage (V)
IPVPanel PV current (A)
IBATCurrent battery (A)
IphCell PV current (A)
ViInput voltage of the power converter (V)
VoOutput voltage of the power converter (V)
RSSeries resistance of the PV cell (Ω)
RPParallel resistance of the PV cell (Ω)
IdCurrent at the PN junction of the PV cell (A)
IrReverse saturation current of the PV cell (A)
TReference cell operating temperature (°K)
βIdeality factor at the PV cell junction
qCharge of the electron (1.602176 × 10⁻²¹ C)
ISCShort circuit current of the PV panel (A)
kBoltzmann constant (1.38065 × 10⁻³ J/°K)
αTemperature coefficient of the PV cell (%/°C)
TrTemperature in standard test conditions (°K)
IrrReverse saturation current at Tr temperature (A)
EGEnergy of the Silicon band-gap (1.1 eV)
VnNominal voltage of the PV panel (V)
IMPPMaximum power current of the PV panel (A)
PMPPMaximum power of the PV panel (W)
VocOpen circuit voltage of the PV panel (V)
DDuty cycle of the power converter
TSSwitching period of the power converter (s)
tonConduction time of the switch (s)
VABSAbsorption voltage of the battery (V)
ICH(max)Maximum charging current of the battery (A)
IOCTFull charge current value of the battery (A)
VFLTFloat voltage of the battery (V)
µΔDSet of fuzzy outputs
ΔDSize of the duty cycle variations
Xi(n)The Ith discrete input data
µiFuzzy data set for the Ith discrete input data
WiWeight factor for CoG defuzzification method
nSample n
n-1Sample n-1
SSlope of the P-V curve
ΔPPVPower variation of the PV panel (W)
ΔVPVVoltage variation of the PV panel (V)
ZLImpedance of the connected load (Ω)
ZiReflected input impedance (Ω)
EError (V)
VREFSet point of the charging voltage (V)
ηEfficiency (%)
τConvergence time (s)
RMPPMaximum power point apparent resistor (Ω)
VMPPMaximum power voltage of the PV panel (V)
PsunIncident radiation (W/m2)

References

  1. Rajesh, R.; Mabel, C. A comprehensive review of photovoltaic systems. Renew. Sustain. Energy Rev. 2015, 51, 231–248. [Google Scholar] [CrossRef]
  2. Lokesh, M.; Pavan, P.; Manik, S.; Sudhakar, T.; Rajasekar, N. Comparative study on charge controller techniques for solar PV system. Energy Procedia 2017, 117, 1070–1077. [Google Scholar]
  3. Mojallizadeh, M.; Badamchizadeh, M.; Khanmohammadi, S.; Sabahi, M. Designing a new robust sliding mode controller for maximum power point tracking of photovoltaic cells. Sol. Energy 2016, 132, 538–546. [Google Scholar] [CrossRef]
  4. Subudhi, B.; Pradhan, R. A comparative study on maximum power point tracking techniques for photovoltaic power systems. IEEE Trans. Sustain. Energy 2013, 4, 89–98. [Google Scholar] [CrossRef]
  5. Ba, A.; Ehssein, C.; Mouhamed, M.; Hamdoun, O.; Elhassen, A. Comparative Study of Different DC/DC Power Converter for Optimal PV System Using MPPT (P&O) Method. Appl. Sol. Energy 2018, 54, 235–245. [Google Scholar]
  6. Karami, N.; Moubayed, N.; Outbib, R. General review and classification of different MPPT Techniques. Renew. Sustain. Energy Rev. 2017, 68, 1–18. [Google Scholar] [CrossRef]
  7. Reisi, A.; Moradi, M.; Jamasb, S. Classification and comparison of maximum power point tracking techniques for photovoltaic system: A review. Renew. Sustain. Energy Rev. 2013, 19, 433–443. [Google Scholar] [CrossRef]
  8. Messalti, S.; Harrag, A.; Loukriz, A. A new variable step size neural networks MPPT controller: Review, simulation and hardware implementation. Renew. Sustain. Energy Rev. 2017, 68, 221–233. [Google Scholar] [CrossRef]
  9. Chekired, F.; Larbes, C.; Rekioua, D.; Haddad, F. Implementation of a MPPT fuzzy controller for photovoltaic systems on FPGA circuit. Energy Procedia 2011, 6, 541–549. [Google Scholar] [CrossRef] [Green Version]
  10. Robles, C.; Liñán, R.; Ospino, A. Implementation of a cost-effective fuzzy MPPT controller on the Arduino board. Int. J. Smart Sens. Intell. Syst. 2018, 11, 1–10. [Google Scholar]
  11. Faranda, R.; Leva, S. Energy comparison of mppt techniques for pv systems. WSEAS Trans. Power Syst. 2008, 3, 446–455. [Google Scholar]
  12. Hussaian, C.H.; Rani, C. Different Conventional and Soft Computing MPPT Techniques for Solar PV Systems with High Step-Up Boost Converters: A Comprehensive Analysis. Energies 2020, 13, 371. [Google Scholar]
  13. Rezk, H.; Eltamaly, A. A comprehensive comparison of different MPPT techniques for photovoltaic systems. Sol. Energy 2015, 112, 1–11. [Google Scholar] [CrossRef]
  14. Kchaou, A.; Naamane, A.; Koubaa, Y.; Sirdi, N. Comparative Study of Different MPPT techniques for a Stand-alone PV System. In Proceedings of the 17th International Conference on Sciences and Techniques of Automatic Control & Computer Engineering (STA), Sousse, Tunisia, 19–21 December 2016; pp. 629–634. [Google Scholar]
  15. Verma, D.; Nema, S.; Shandilya, A.; Dash, S. Maximum power point tracking (MPPT) techniques: Recapitulation in solar photovoltaic systems. Renew. Sustain. Energy Rev. 2016, 54, 1018–1034. [Google Scholar] [CrossRef]
  16. Esram, T.; Chapman, P. Comparison of photovoltaic array maximum power point tracking techniques. IEEE Trans. Energy Convers. 2007, 22, 439–449. [Google Scholar] [CrossRef] [Green Version]
  17. Allah, A.; Saied, M.; Mostafa, M.; Abdel, T. A survey of maximum PPT techniques of PV systems. In Proceedings of the IEEE Energytech, Cleveland, OH, USA, 29–31 May 2012. [Google Scholar]
  18. Femia, N.; Petrone, G.; Spagnuolo, G.; Vitelli, M. Optimization of perturb and observe maximum power point tracking method. IEEE Trans. Power Electron. 2005, 20, 963–973. [Google Scholar] [CrossRef]
  19. Liu, F.; Duan, S.; Liu, B.; Kang, Y. A variable step size INC MPPT method for pv systems. IEEE Trans. Ind. Electron. 2008, 55, 2622–2628. [Google Scholar]
  20. Gohar, H.; Vilanova, R.; Herrera, J.; Tobón, A.; Peláez, J. Non-Linear Sliding Mode Controller for Photovoltaic Panels with Maximum Power Point Tracking. Processes 2020, 8, 108. [Google Scholar] [CrossRef] [Green Version]
  21. Levron, Y.; Shmilovitz, D. Maximum Power Point Tracking Employing Sliding Mode Control. IEEE Trans. Circuits Syst. 2013, 60, 724–732. [Google Scholar] [CrossRef]
  22. Valenciaga, F.; Puleston, P.; Battaiotto, P. Power control of a photovoltaic array in a hybrid electric generation system using sliding mode techniques. IEEE Proc. Control Theory Appl. 2001, 6, 448–455. [Google Scholar] [CrossRef]
  23. Chen-Chi, C.; Chieh-Li, C. Robust maximum power point tracking method for photovoltaic cells: A sliding mode control approach. Solar Energy 2009, 83, 1370–1378. [Google Scholar] [CrossRef]
  24. Guenounou, O.; Dahhou, B.; Chabour, F. Adaptive fuzzy controller based MPPT for photovoltaic systems. Energy Convers. Manag. 2014, 78, 843–850. [Google Scholar] [CrossRef]
  25. Cheng, P.; Peng, B.; Liu, Y.; Cheng, Y.; Huang, J. Optimization of a Fuzzy-Logic-Control-Based MPPT Algorithm Using the Particle Swarm Optimization Technique. Energies 2015, 8, 5338–5360. [Google Scholar] [CrossRef] [Green Version]
  26. Bendib, B.; Belmili, H.; Krim, F. A survey of the most used MPPT methods: Conventional and advanced algorithms applied for photovoltaic systems. Renew. Sustain. Energy Rev. 2015, 45, 637–648. [Google Scholar] [CrossRef]
  27. Viswambaran, V.; Bati, A.; Zhou, E. Review of AI based maximum power point tracking techniques & performance evaluation of artificial neural network based MPPT controller for photovoltaic systems. Int. J. Adv. Sci. Technol. 2020, 29, 8159–8171. [Google Scholar]
  28. Mohammed, S.; Devaraj, D.; Imthias, T. A novel hybrid Maximum Power Point Tracking Technique using Perturb & Observe algorithm and Learning Automata for solar PV system. Energy 2016, 112, 1096–1106. [Google Scholar]
  29. El-Khatib, M.; Shaaban, S.; Abu, M. A proposed advanced maximum power point tracking control for a photovoltaic-solar pump system. Sol. Energy 2017, 158, 321–331. [Google Scholar] [CrossRef]
  30. Farajdadian, S.; Hassan, S. Design of an optimal fuzzy controller to obtain maximum power in solar power generation system. Sol. Energy 2019, 182, 161–178. [Google Scholar] [CrossRef]
  31. Ezinwanne, O.; Zhongwen, F.; Zhijun, L. Energy Performance and Cost Comparison of MPPT Techniques for Photovoltaics and other Applications. Energy Procedia 2017, 107, 297–303. [Google Scholar] [CrossRef]
  32. Messai, A.; Mellit, A.; Guessoum, A.; Kalogirou, S. Maximum power point tracking using a GA optimized fuzzy logic controller and its FPGA implementation. Sol. Energy 2011, 85, 265–277. [Google Scholar] [CrossRef]
  33. Subiyanto, S.; Mohamed, A.; Hannan, M. Intelligent maximum power point tracking for PV system using Hopfield neural network optimized fuzzy logic controller. Energy Build. 2012, 51, 29–38. [Google Scholar] [CrossRef]
  34. Motahhir, S.; El Hammoumi, A.; El Ghzizal, A. The most used MPPT algorithms: Review and the suitable low-cost embedded board for each algorithm. J. Clean. Prod. 2020, 246, 118983. [Google Scholar] [CrossRef]
  35. Mao, M.; Cui, L.; Zhang, Q.; Guo, K.; Zhou, L.; Huang, H. Classification and summarization of solar photovoltaic MPPT techniques: A review based on traditional and intelligent control strategies. Energy Rep. 2020, 6, 1312–1327. [Google Scholar] [CrossRef]
  36. Prasanth, J.; Sudhakar, T.; Rajasekar, N. A comprehensive review on solar PV maximum power point tracking techniques. Renew. Sustain. Energy Rev. 2017, 67, 826–847. [Google Scholar]
  37. Hakim, M.; Latif, F.; Khan, M.; Basir, A. Design and implementation of three-stage battery charger for lead-acid battery. In Proceedings of the 3rd International Conference on Electrical Engineering and Information Communication Technology (ICEEICT), Dhaka, Bangladesh, 22–24 September 2016. [Google Scholar]
  38. Hua, S.; Zhou, Q.; Kong, D.; Ma, J. Application of valve-regulated lead-acid batteries for storage of solar electricity in stand-alone photovoltaic systems in the northwest areas of China. J. Power Sources 2006, 158, 1178–1185. [Google Scholar] [CrossRef]
  39. Mohammedi, A.; Rekioua, D.; Rekioua, T.; Bacha, S. Valve Regulated Lead Acid battery behavior in a renewable energy system under an ideal Mediterranean climate. Int. J. Hydrog. Energy 2016, 41, 20928–20938. [Google Scholar] [CrossRef]
  40. El-Khateb, A.; Rahim, N.; Selvaraj, J. Cascaded DC-DC Converters as a Battery Charger and Maximum Power Point Tracker for PV Systems. In Proceedings of the International Renewable and Sustainable Energy Conference (IRSEC), Ouarzazate, Morocco, 7–9 March 2013. [Google Scholar]
  41. Freitas, I.; Perez, Y.; Suomalainen, E. Coupling small batteries and PV generation: A review. Renew. Sustain. Energy Rev. 2020, 126, 109835. [Google Scholar] [CrossRef]
  42. López, J.; Seleme, I.; Donoso, P.; Morais, L.; Cortizo, P.; Severo, M. Digital control strategy for a buck converter operating as a battery charger for stand-alone photovoltaic systems. Sol. Energy 2016, 140, 171–187. [Google Scholar] [CrossRef]
  43. Tesfahunegn, S.; Ulleberg, O.; Undeland, T.; Vie, P. A simplified battery charge controller for safety and increased utilization in standalone PV applications. In Proceedings of the International Conference on Clean Electrical Power (ICCEP), Ischia, Italy, 14–16 June 2011. [Google Scholar]
  44. Osman, S.; Rahim, N.; Selvaraj, J. Microcontroller based solar battery charging system with MPPT features at low irradiance condition. In Proceedings of the IEEE Conference on Clean Energy and Technology (CEAT), Lankgkawi, Malaysia, 18–20 November 2013. [Google Scholar]
  45. Jana, J.; Samanta, H.; Das Bhattacharya, K.; Saha, H. A four stage battery charge controller working on a novel maximum power point tracking based algorithm for solar PV system. In Proceedings of the 21st Century Energy Needs—Materials, Systems and Applications (ICTFCEN), Kharagpur, India, 17–19 November 2016. [Google Scholar]
  46. Munshi, A.; Sayeed, K.; Mishu, M. Intelligent 3-stage MPPT lead acid battery auto charger. In Proceedings of the International Conference on Renewable Energy Research and Applications (ICRERA), Madrid, Spain, 20–23 October 2013. [Google Scholar]
  47. Hua, C.; Ku, P. Implementation of a Stand-Alone Photovoltaic Lighting System with MPPT, Battery Charger and High Brightness LEDs. In Proceedings of the International Conference on Power Electronics and Drives Systems, Kuala Lumpur, Malaysia, 28 November–1 December 2005. [Google Scholar]
  48. Koutroulis, E.; Kalaitzakis, K. Novel battery charging regulation system for photovoltaic applications. IEEE Proc. Electr. Power Appl. 2004, 151, 191–197. [Google Scholar] [CrossRef] [Green Version]
  49. Hirech, K.; Melhaoui, M.; Yaden, F.; Baghaz, E.; Kassmi, K. Design and realization of an autonomous system equipped with a charge/discharge regulator and digital MPPT command. Energy Procedia 2013, 42, 503–512. [Google Scholar] [CrossRef] [Green Version]
  50. Lin, C.; Chiu, H.; Lo, Y.; Lee, T.; Chen, Q.; Yu, W.; Lee, J.; Wang, J.; Shih, F. A battery charger with maximum power point tracking function for low-power photovoltaic system applications. In Proceedings of the International Conference on Power Electronics and Drive Systems (PEDS), Taipei, Taiwan, 2–5 November 2009. [Google Scholar]
  51. Lalouni, S.; Rekioua, D.; Rekioua, T.; Matagne, E. Fuzzy logic control of stand-alone photovoltaic system with battery storage. J. Power Sources 2009, 193, 899–907. [Google Scholar] [CrossRef]
  52. Yilmaz, U.; Kircay, A.; Borekci, S. PV system fuzzy logic MPPT method and PI control as a charge controller. Renew. Sustain. Energy Rev. 2018, 81, 994–1001. [Google Scholar] [CrossRef]
  53. Kumar, P.; Kumar, A. Design of battery charging circuit through intelligent MPPT using SPV system. Sol. Energy 2019, 178, 79–89. [Google Scholar]
  54. Abu, Y.; Saad, N.; Zekry, A. Enhancing the design of battery charging controllers for photovoltaic systems. Renew. Sustain. Energy Rev. 2016, 58, 646–655. [Google Scholar]
  55. Siddique, H.; Xu, P.; De Doncker, R. Parameter extraction algorithm for one-diode model of PV panels based on datasheet values. In Proceedings of the International Conference on Clean Electrical Power (ICCEP), Alghero, Italy, 11–13 June 2013. [Google Scholar]
  56. Mendes, M.; Cruz, D. Photovoltaic array model aimed to analyses in power electronics through simulation. Braz. J. Power Electron. 2008, 13, 141–146. [Google Scholar] [CrossRef]
  57. WANT Energia. Available online: https://wantenergia.cl/wp-content/uploads/2020/05/P55W.pdf (accessed on 14 June 2020).
  58. Syafaruddin; Karatepe, E.; Hiyama, T. Artificial neural network-polar coordinated fuzzy controller based maximum power point tracking control under partially shaded conditions. IET Renew. Power Gener. 2009, 3, 239–253. [Google Scholar] [CrossRef]
  59. Bhattacharjee, A. Design and Comparative Study of Three Photovoltaic Battery Charge Control Algorithms in MATLAB/SIMULINK Environment. Int. J. Adv. Comput. Res. 2012, 2, 129–135. [Google Scholar]
  60. El-Shafy, A. An Effective and Safe Charging Algorithm for Lead-Acid Batteries in PV Systems. World Eng. Appl. Sci. J. 2010, 1, 9–17. [Google Scholar]
  61. Hart, D. Power Electronics, 1st ed.; McGraw Hill: Valparaíso, IN, USA, 2011; pp. 196–264. [Google Scholar]
  62. Wong, Y.; Hurley, W.; Wölfle, W. Charge regimes for valve-regulated lead-acid batteries: Performance overview inclusive of temperature compensation. J. Power Sources 2008, 183, 783–791. [Google Scholar] [CrossRef]
  63. Sharma, K.; Kumar, D. Robust controller design for DC-DC converters using fuzzy logic. In Proceedings of the 4th International Conference on Signal Processing, Computing and Control (ISPCC), Solan, India, 21–23 September 2017. [Google Scholar]
  64. Boutouba, M.; El Ougli, A.; Miqoi, S.; Tidhaf, B. Design and Experimentation of a Control System Implemented on Raspberry Pi 3 Board for Photovoltaic Systems Using SEPIC Converter. J. Electr. Syst. 2017, 13, 661–677. [Google Scholar]
  65. Shiau, J.; Wei, Y.; Chen, B. Study on the Fuzzy-Logic-Based Solar Power MPPT Algorithms Using Different Fuzzy Input Variables. Algorithms 2015, 8, 100–127. [Google Scholar] [CrossRef] [Green Version]
  66. Taghvaee, M.; Radzi, M.; Moosavain, S.; Hashim, H.; Hamiruce, M. A current and future study on non-isolated dc–dc converters for photovoltaic applications. Renew. Sustain. Energy Rev. 2013, 17, 216–227. [Google Scholar] [CrossRef]
  67. Fudoli, H.; Vechia, D.; Bonaldo, J.; Bertogna, E. Design, simulation and comparative evaluation of both a classic and a fuzzy logic PI controller applied to a DC-DC converter. Prz. Elektrotechniczny 2018, 94, 27–31. [Google Scholar] [CrossRef] [Green Version]
  68. So, W.; Tse, C.; Lee, Y. Development of a fuzzy logic controller for DC/DC converters: Design, computer simulation, and experimental evaluation. IEEE Trans. Power Electron. 1996, 11, 24–32. [Google Scholar]
  69. Jain, S.; Agarwal, V. Comparison of the performance of maximum power point tracking schemes applied to single-stage grid-connected photovoltaic systems. IET Electr. Power Appl. 2007, 1, 753–762. [Google Scholar] [CrossRef]
  70. Ogata, K. Modern Control Engineering, 5th ed.; Prentice Hall: New Jersey, NJ, USA, 2010; pp. 568–571. [Google Scholar]
  71. Solartek. Available online: https://www.solartex.cl/tienda/wp-content/uploads/2019/07/6GFM-10J.pdf (accessed on 13 July 2020).
Figure 1. Control scheme proposed for the battery charger.
Energies 14 01001 g001
Figure 2. PV cell model.
Energies 14 01001 g002
Figure 3. The P–V characteristic curves obtained for the WANT-M55W panel. (a) Variable radiation and constant temperature level of 25 °C; (b) Variable temperature and constant radiation level of 1000 W/m2.
Energies 14 01001 g003
Figure 4. Topology of a Buck converter.
Energies 14 01001 g004
Figure 5. Battery charging characteristic.
Energies 14 01001 g005
Figure 6. Flowchart of control strategy proposed for the battery charger.
Energies 14 01001 g006
Figure 7. Structure of fuzzy logic controller maximum power point tracker (FLC-MPPT) proposed.
Energies 14 01001 g007
Figure 8. Inputs S and ΔPPV on the P–V curve of a PV panel.
Energies 14 01001 g008
Figure 9. Membership functions of FLC-MPPT. (a) Input S; (b) Input ΔPPV; (c) Output ΔD.
Energies 14 01001 g009
Figure 10. Typical I–V curve of a PV panel.
Energies 14 01001 g010
Figure 11. Control Surface for the FLC-MPPT.
Energies 14 01001 g011
Figure 12. Membership functions of fuzzy logic controller battery voltage (FLC-VR). (a) Input E; (b) Input ΔE; (c) Output ΔD.
Energies 14 01001 g012
Figure 13. Control Surface for the FLC-VR.
Energies 14 01001 g013
Figure 14. Simulation scheme. (a) PV system; (b) Internal block diagram of the FLC-MPPT.
Energies 14 01001 g014
Figure 15. Irradiance profile.
Energies 14 01001 g015
Figure 16. Performance comparison of the MPPT methods for variable radiation.
Energies 14 01001 g016
Figure 17. Simulation scheme. (a) PV system; (b) Internal block diagram of the FLC-VR.
Energies 14 01001 g017
Figure 18. Performance comparison of the voltage controllers.
Energies 14 01001 g018
Figure 19. The experimental hardware setup.
Energies 14 01001 g019
Figure 20. Dynamic response of the FLC-MPPT to load perturbation.
Energies 14 01001 g020
Figure 21. Average efficiency of the FLC-MPPT for different levels of radiation. (a) Medium level; (b) High level; (c) Low level.
Energies 14 01001 g021
Figure 22. Curves of daily power generated by the PV panel with and without the FLC-MPPT. (a) 02/02/2020; (b) 02/03/2020; (c) 01/31/2020; (d) 02/05/2020.
Energies 14 01001 g022
Figure 23. Duty cycle determined from the drain source voltage in the Buck converter’s Mosfet, for the test on the 31 January 2020. (a) 08:31 h; (b) 12:02 h; (c) 17:50 h; (d) 19:18 h.
Energies 14 01001 g023
Figure 24. Dynamic response of the FLC-VR to load perturbation.
Energies 14 01001 g024
Figure 25. Results obtained in the test for charging the battery.
Energies 14 01001 g025
Table 1. Electrical characteristics of the commercial PV panel [57].
ParametersValues
Nominal voltage (Vn)12 V
Maximum power current (IMPP)3.02 A
Maximum power voltage (VMPP)18.21 V
Maximum power (PMPP)55 W
Short circuit current (Isc)3.28 A
Open circuit voltage (Voc)22.34 V
Short circuit temperature coefficient (α)+0.04/%/°C
Diode ideality factor (β)1.2
Serie resistance (RS)11.6 mΩ
Parallel resistance (RP)30 Ω
Reverse saturation current (Irr)5.9594 × 10⁻⁹ (A)
Table 2. Rules for the FLC-MPPT.
S
ΔPPV
NBNSZOPSPB
NBPBPSZONSNB
NSPBPSZONSNB
ZOPSPSZONSNS
PSPB PSZONSNB
PBPBPSZONSNB
Table 3. Rules for the FLC-VR.
E
ΔE
NBNMZOPMPB
NBNBNBNMNSPM
NMNBNMNSNSPB
ZONBNSZOPSPB
PMNB NSPSPMPB
PBNMPSPMPBPB
Table 4. Efficiency comparison of the MPPT methods for variable radiation.
S = 500 W/m2
P M P P = 27.16   W
S = 750 W/m2
P M P P = 41.18   W
S = 1000 W/m2
P M P P = 55   W
IncCondP&OFLC MPPTIncCondP&OFLC MPPTIncCondP&OFLC MPPT
η (%) 99.9299.7999.9399.9099.8499.9699.9299.8999.99
Ripple of power (mW)7080312019051502002
Table 5. Convergence time of the MPPT methods.
IncCondP&OFLC-MPPT
τ (ms) 240216212
Table 6. Performance parameters of the voltage controllers.
Reference ChangeLoad Change
FLC-VRPIDFLC-VRPID
Convergence time (ms)3.54.546
Overshoot (mV)029020190
Table 7. PID parameters.
KPKIKD
6001,200,0000.3
Table 8. Buck converter components.
ComponentValues
MosfetIRF540Z (100 V/36 A)
DiodeMBR20100CT (80 V/20 A)
CapacitorEpcos B41856 (220 μF/50 V)
InductorCoilcraft PCV-2-564-08L (560 mH/7 A)
DriverTCA 4432
Frequency20 kHz
Table 9. Main technical specifications of the Arduino Due board.
CharacteristicValues
Clock speed 84 Mhz
Operating Voltage3.3 V
Architecture ARM 32bit
ADC/DAC resolution 12 bits
MicrocontrollerAT91SAM3X8E
Table 10. Average efficiency of the FLC-MPPT.
Low RadiationMedium RadiationHigh Radiation
η (%)97.8798.0298.22
Average power (w)11.9927.3250.47
Maximum power ripple (w)0.471.051.31
Table 11. Daily energy produced by FLC-MPPT on different clear sky days.
01/31/202002/02/202002/03/202002/05/2020
FLC-MPPT RL = 1 ΩWithout MPPT RL = 7.5 ΩFLC-MPPT RL = 1 ΩWithout MPPT RL = 4 ΩFLC-MPPT RL = 1 ΩWithout MPPT RL = 11.5 ΩFLC-MPPT RL = 1 ΩWithout MPPT RL = 2 Ω
Energy produced (Wh)330.2284.9326.2158.2341.5258.4346.569.2
Publisher’s Note: MDPI stays neutral with regard to jurisdictional claims in published maps and institutional affiliations.

