Article

Key Factors of Development of Electromobility AMONG Microentrepreneurs: A Case Study from Poland

by
Anna Skowrońska-Szmer
and
Anna Kowalska-Pyzalska
*
Department of Operations Research and Business Intelligence, Wroclaw University of Science and Technology, 50-370 Wrocław, Poland
*
Author to whom correspondence should be addressed.
Energies 2021, 14(3), 764; https://doi.org/10.3390/en14030764
Submission received: 6 January 2021 / Revised: 25 January 2021 / Accepted: 26 January 2021 / Published: 1 February 2021
(This article belongs to the Special Issue The Future Development of Automobile Energy)

Abstract

:
Microentrepreneurs contribute to the growth of electromobility, and hence to sustainable transport, by the purchase of alternative fuel vehicles (AFV). This article attempts to identify key factors that may affect the growth of interest in AFV among microentrepreneurs. To find the key factors, data from 181 Polish microenterprises was collected and analyzed by means of the factor analysis. The results showed that in contrary to the popular opinion, it is not the price of the car that is crucial for its purchase, but the information that leads to knowledge about technical and utility values, and to legal and economic predictability.

1. Introduction

Currently, there are almost 1.3 billion passenger and commercial vehicles on the world’s roads. More than 80% of these cars are classified as light passenger vehicles. The vast majority of them (almost 95%) use a conventional petrol or diesel fueled combustion engine. However, there are also other drive systems, so-called non-conventional or alternative (AFV) ones. Among them we can distinguish:
  • battery electric vehicles (BEVs), powered exclusively by an electric battery
  • plug-in hybrid electric vehicles (PHEVs) that can be charged from the power grid but also have a combustion engine
  • hybrid electric vehicles (HEVs) that combine an internal combustion engine with an electric drive to increase efficiency and performance.
According to the data of the Polish Alternative Fuels Association (PSPA), at the end of July 2020, 13,057 electric passenger cars were registered in Poland. 55% of them (7231 cars) were fully electric vehicles (BEV) and the rest (5826 cars) belonged to plug-in hybrids (PHEV). There has been some progress in increasing the share of electric cars in the total number of cars. In the first seven months of 2020, 4061 cars were added, which is 78% more than in the corresponding period of 2019. Despite this noticeable growth, electromobility in Poland is still in the initial stage of development mainly due to high price of BEVs, limited number of charging stations and very unstable and unclear legal regulations [1].
Polish economy, similarly to other economies of the European Union (EU), is dominated by microenterprises. According to the Entrepreneurs’ Law [2] microentrepreneur is an entrepreneur “who, in at least one year of the last two financial years, met the following conditions jointly: employed an average of less than 10 employees and achieved an annual net turnover from the sale of goods, products and services and financial operations not exceeding the PLN equivalent of 2 million EUR, or the total assets of its balance sheet prepared at the end of one of these years, did not exceed the PLN equivalent of EUR 2 million”.
In Poland, microentrepreneurs constitute as much as 96.7% of all enterprises active on the market, and their number is systematically growing from year to year. It is necessary to emphasize the role of micro, small and medium enterprises (SMEs) in the labor markets and their importance in the development of entrepreneurship and innovation in the EU, which translates into an increase in the competitiveness of the economy [3]. In the EU, microenterprises constitute as much as 93.0% of all enterprises, creating jobs for 29.7% of employees [4]. In Poland they have the largest share in the creation of GDP—even 30.3% in 2017 among all enterprise groups, and generate 40.8% of jobs in the entire sector [3].
It is emphasized that entrepreneurial individuals can discover, create and use opportunities for sustainable development thanks to social and technological innovations leading to institutional and market transformations [5]. It is also argued that, for example, in family businesses, the non-financial aspects that meet the emotional needs of the family play a key role in making decisions about strategic choices for these businesses. They are aimed at achieving often uneconomical goals and are oriented towards accepting the choice made by the family. There is often no economic justification for making such decisions [6]. In a similar way, social entrepreneurship is created, which can be defined as “seeking opportunities to create social value and catalyse social change”, which also often runs beyond the economic utility of business, rather focusing on the willingness to support the local community [7]. Finally, we can also talk about environmental entrepreneurship, which consists in solving problems related to the excessive exploitation of natural resources and in effective functioning in accordance with environmental resources. In particular, it refers to activities aimed at achieving sustainable development by limiting the consumption of natural resources or introducing the principles of environmental protection [8]. Any microenterprise can implement such measures. Each, even the smallest pro-ecological change in the global effect will bring invaluable positive effects.
Simultaneously, an analysis of the AFV literature and the automotive market shows that entrepreneurs can play a significant role in the development of the transportation sector. That is why in this paper the authors have focused on the issue of responsibility for environmental protection by declaring a willingness to purchase a company car with an alternative drive. Therefore, the main research question refers to the analysis of factors that may affect the development of electromobility in microenterprises and the identification of the key factors in this issue. In particular, the research identifies the key factors that are responsible for the passive attitude of microentrepreneurs in the field of purchasing a car with an alternative drive (electric, hybrid or plug-in hybrid) for the needs of their company.
The analysis of the key factors was based on microentrepreneurs’ attitudes to many functional, technical and economic features related to the possible purchase of an AFV. The data was collected through a telephone interview (CATI) in January 2020 on a population of 181 Polish microentrepreneurs. The second part of the survey was conducted on-line (CAWI) in March and April 2020. In this part of the survey among others the impact of COVID-19 pandemic on purchase of a car was checked.
The issue raised in the article is important and fundamental for several reasons. Firstly, it concerns two aspects that are important today: The development of electromobility in Poland and the involvement of a significant economic and social force in this process, such as microenterprises. Secondly, the importance of the issue is confirmed by the data on the rising use of AFV in passenger transport, in the numerous studies and reports [1,9,10,11]. Thirdly, it touches the right idea of the functioning of the world on the basis of sustainable development, which postulates stricter standards for air pollution caused by cars in the field of environmental protection. Fourthly, the conducted research indicates important and key factors that may affect the decision to purchase a car with an alternative drive, other than an internal combustion engine. This can make a difference and can be used by governments and policymakers when designing campaigns to encourage consumers to buy environmentally friendly cars.
The remainder of the paper is as follows: Section 2 contains an overview of the most important literature on both electromobility and the application of the principle of sustainable development in microenterprises. It is also a review of significant research on the identification of factors that may influence the decision-making by consumers to buy a AFV. Section 3 describes the research data and justifies the selection of the statistical method. Section 4 presents the results. Finally, Section 5 is devoted to discussion of the results and conclusions obtained. It provides also an incentive for further research and discussion of the key factors that may affect decisions about purchasing an electric, hybrid or plug-in hybrid car for the company’s needs.

2. Literature Review

2.1. Environment and Sustainable Transportation

Poland is one of the countries where, despite legislative changes and infrastructure development the AFV sector is one of the smallest in Europe [1]. In Poland there are only 0.2% of all charging points in Europe [12]. The average growth rate of the charging point network in 2020 was 2% on a month-to-month basis. At the end of the first half of 2020, 1194 (2258 points) public electric vehicle charging stations existed in Poland [12,13]. At the same time the legislation framework has changed several times leading to confusion and lack of trust among potentical buyers [3].
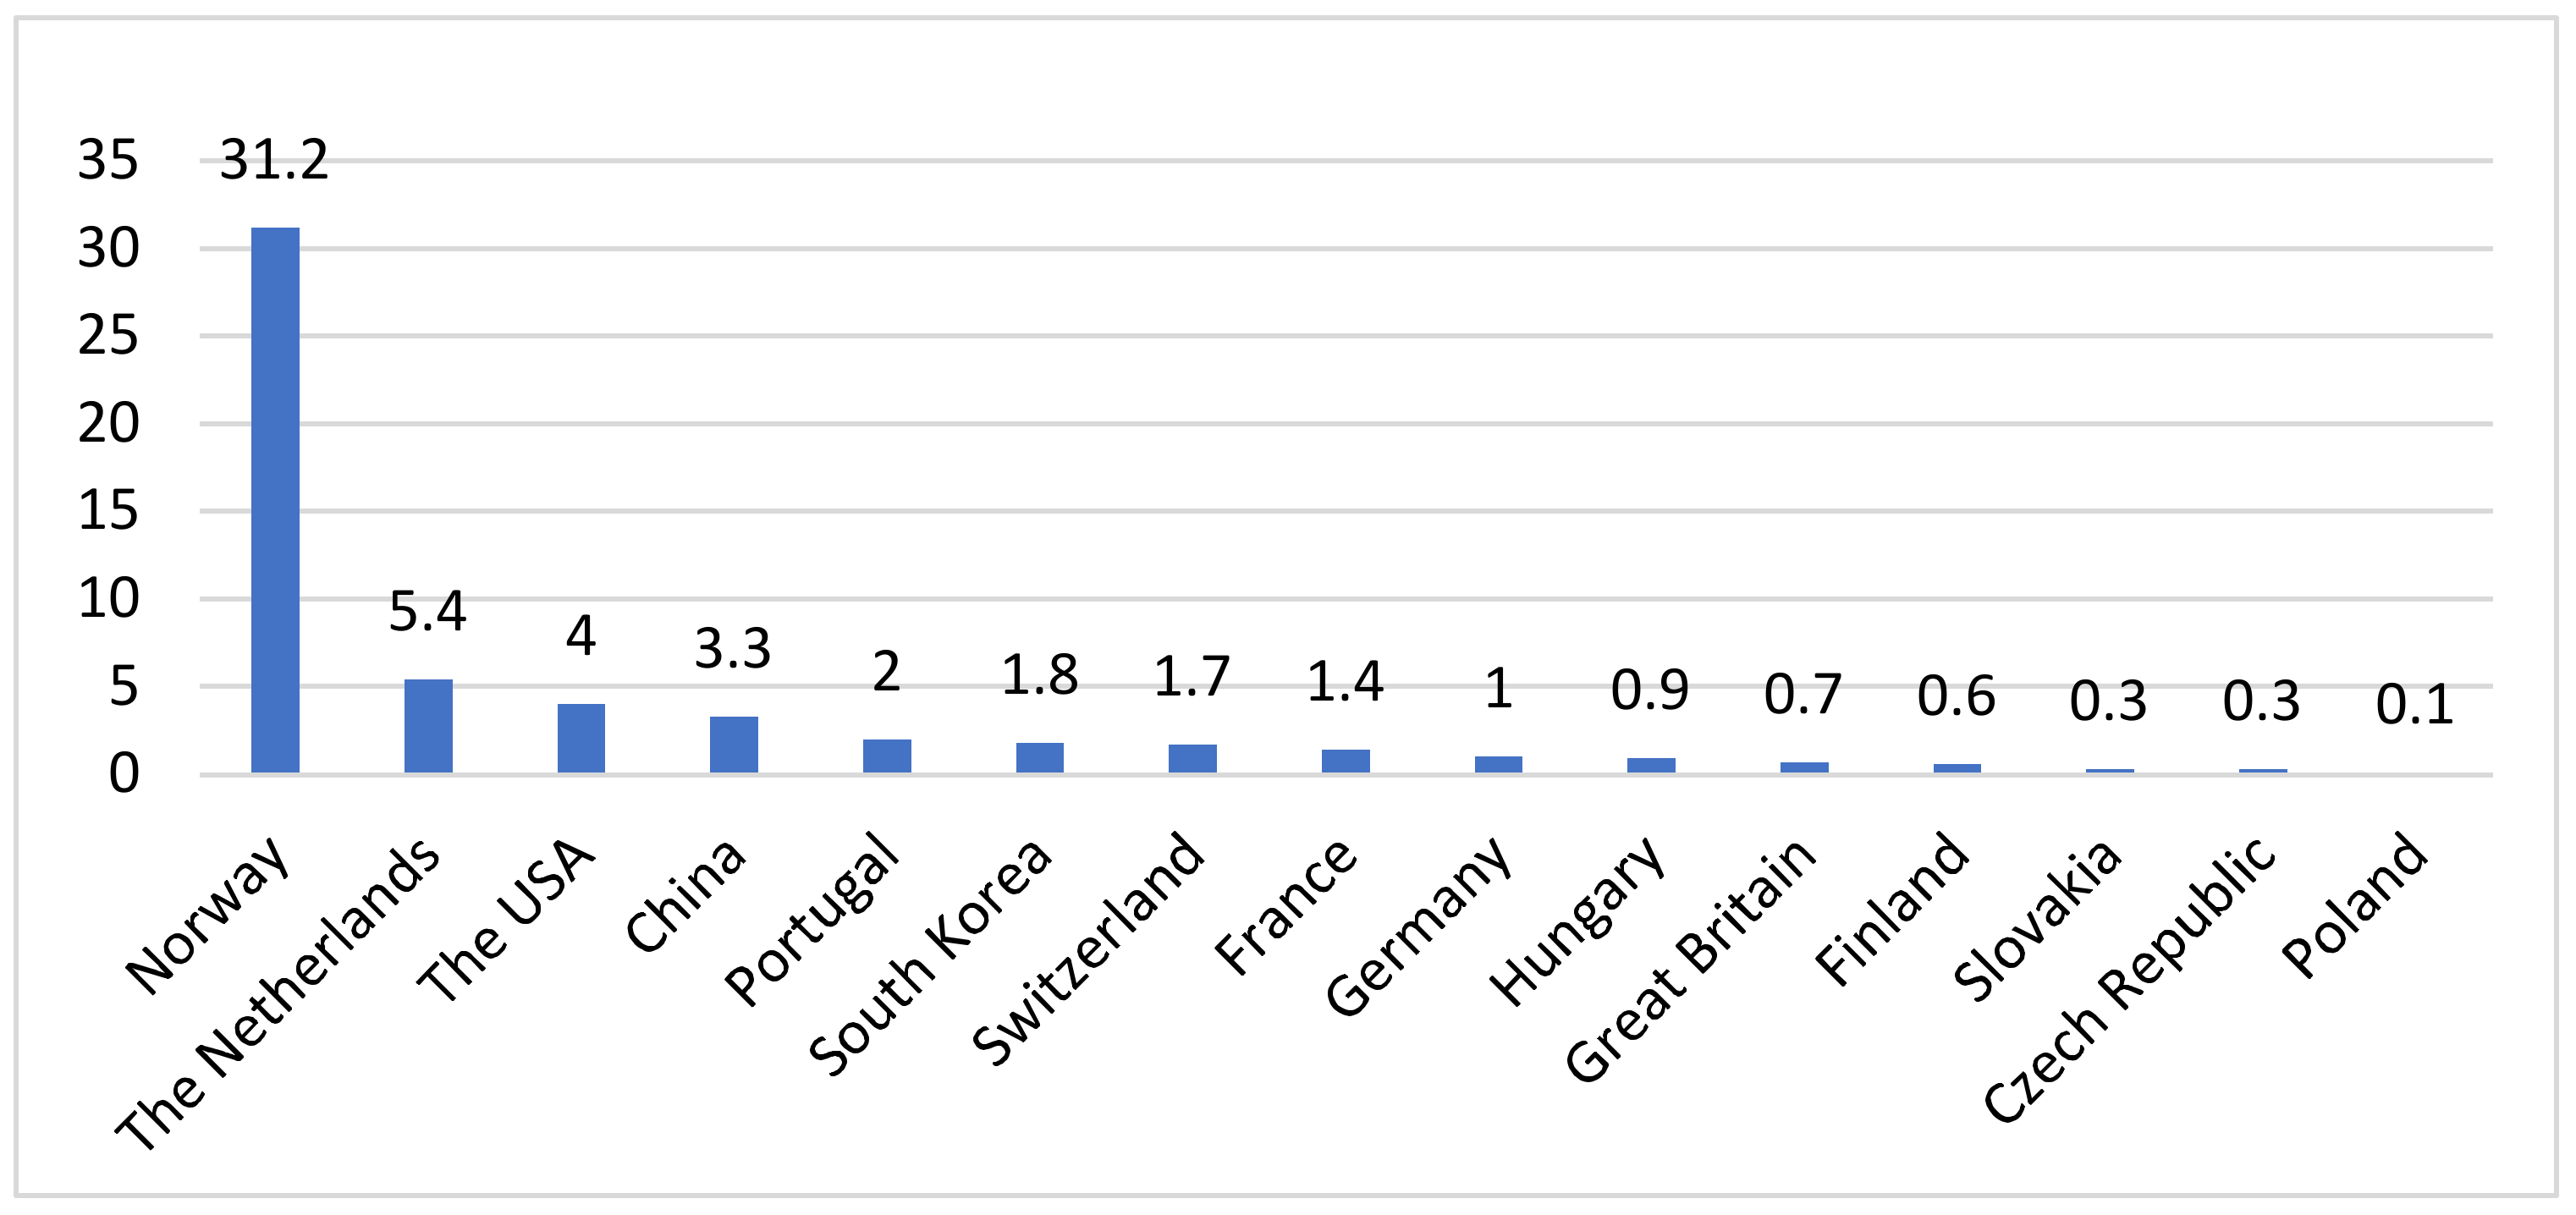
Figure 1 indicates that in many countries there is a much higher percentage of electric cars in the total number of vehicles than in Poland. However, further development of electromobility in Poland is necessary for many reasons. Firstly, the most important one includes a chance to reduce the impact of fluctuations on the crude oil market by decreasing consumption of crude oil for transport purposes, which has positive consequences for people and the environment. Secondly the reduction of air pollution mainly in urban areas due to zero direct emission of electric cars can be very beneficial for the health and quality of life [9].
One of the recent reports of the Supreme Audit Office (NIK) shows that Poland so far cannot cope with reducing pollution generated by transport [14]. Eurostat data reveal that although the emissions of carbon dioxide (CO2) to the atmosphere, generated by passenger transport, are systematically decreasing, this change is slow and does not meet expectations [15]. In countries like the UK and the US, the transport sector is now responsible for emitting more greenhouse gases than any other, including electricity production and agriculture. Globally, transport accounts for around a quarter of CO2 emissions.
Meanwhile, according to the World Health Organization air pollution from transport is harmful to human health [16]. Road traffic is considered to be the most important source of some pollutants (for example nitrogen oxides, benzene and carbon monoxide), which are of great concern with regard to the impact on human health and life. In the last decades emissions caused by the ever-increasing number of cars have been reduced thanks the improvement of the engines, usage of new materials that can also be used in catalysts and are capable of absorbing and products polluting photodegradation [17], but the problem still exists. Hence protecting the air from pollution is an important element of European environmental policy.
The discussed issue is a part of the real problem of the development of the world economy in accordance with the general principles of sustainable development. These principles were adopted by the UN General Assembly in 2015. They established a new global policy framework that sets itself three main tasks to be carried out: (1) eradiating all forms of poverty, (2) fighting inequalities in every aspect of life, (3) combating climate change (UN, 2017). These aims have been divided into 17 intermediate sustainable development goals, including among others point 13. Climate Action, which talks about climate change caused by human activity, in particular greenhouse gas emissions to the atmosphere caused by broadly understood transport. The strategic long-term vision of the Commission—Clean Planet for All [18], as well as The European Green Deal [19] where the importance of sustainable mobility is particularly emphasized, create a roadmap for the further sustainable development. As of today, the EU plans to reduce greenhouse gases in transport by 30% by 2030 compared to 2005. The Commission also reaffirms the key role transport plays in reaching a climate neutral Europe by 2050.
Due to the already mentioned role of micro and medium-sized enterprises in the development of the European economy, it should be assumed that without their involvement and interest in AFV, the wide development of this sector will not be possible. The decisions of microenterprises made by small business owners regarding the purchase of a conventional car or AFV are in line with the broadly understood theory of sustainable development, in particular climate action. Often, the owners of microenterprises in their business activities comply with the principles of sustainable development without knowing it and without defining such a behavior [20].

2.2. Factors in Making Decisions by Consumers on the AFV Market

The broadly understood market of products and services related to electromobility is a very rapidly growing segment of the economy on a local and global scale. The potential of this market is noticeable and verifiable by the publication of numerous forecasts concerning its development both in Poland [3,21,22,23,24,25] and in the other countries [26,27,28,29,30,31]. It is estimated that around 500 million BEVs will be driving on the roads of the world in 2040. Forecasts therefore indicate that every fourth car will be powered by this technology, and the expected sales of such cars are in the order of 40 million in 2040 [26].
Although there are studies examining the attitudes and preferences towards AFV among fleet managers in big enterprises [32,33,34,35,36,37], no similar research among microenterprises has been found. As microenterprises are usually family businesses, the decision-making process is closer to the one faced by the households rather than large companies. A number of studies have been proposed in the literature on the factors that may affect the purchasing decisions of consumers regarding cars with an alternative drive [10,38,39,40]. For instance, studies regarding Spanish consumers indicate that emotional issues, product price, vehicle acceleration and low engine noise have a significant impact on consumer attitudes, which in turn has a positive effect on EV purchasing intentions [41]. The same study found that quality and social value did not have a positive effect on consumer attitudes. The Polish Economic Institute in its report indicates several aspects that may be important when deciding to purchase an alternative fuel vehicle [9]. These are both financial, technical and structural factors. These include, among others, government funding for the purchase of an alternative drive car, infrastructure for charging cars while traveling, and operating costs. Importantly, this report also shows a high level of fear of new technology, which is caused by ignorance, lack of information and uncertainty about the economic future.
It seems that despite the existence of incentives to support electromobility, and governments working on such solutions in many others, competition with conventionally powered vehicles is difficult. Consequently, it is expected that the diffusion of cars with an alternative drive other than internal combustion engine will largely depend on subsidies for their purchase or other forms of financial gratification, such as tax reduction [42] or exemption from parking fees in zero-emissivity zones [43]. Adler et al. [44] examined the purchasing preferences for natural gas and hybrid vehicles (NEVs) in California, CA, USA. It was found that the factors that may have an impact on the purchase of such a car are, among others, tax cuts when purchasing vehicles and non-financial benefits facilitating, for example, driving around urban zones.
Although there are studies which indicate that government subsidies may to some extent stimulate the willingness of consumers to buy electric vehicles, the effect is relatively weak [45]. It also entails the need to introduce stricter CO2 regulations, which entails costs for the consumer [46] and technical improvements and public investments in infrastructure [47,48,49]. Ito et al. [50] in their research even states that in the Japanese market consumers are very eager to pay for infrastructure that allows them to freely charge an electric car anywhere. Vehicle charging is an important problem for many consumers, as revealed for example by some studies conducted in China [51].
The energy saving and environmental protection belong to the consumers’ motivations to purchase electric vehicles, but at the same time their exact impact on the willingness to pay is ambiguous [52]. Some authors claim that environmental protection and energy savings belong to the main motivation for purchasing electric vehicles [51]. Others indicate that environmental awareness is an important aspect in the decision-making process of purchasing a car by consumers, as much as for example the proposed technological solutions for an electric vehicle or access to the charging stations [13,53,54]. On the other hand, however, there are studies that say that environmental protection matters less to consumers than price and performance [55].
Taking into account the factors influencing the choice of a conventional car [56,57], one could risk a statement that the technical aspects of the car [58,59], and above all its price, will be of key importance for a microentrepreneur wishing to purchase a car with a drive other than an internal combustion engine. Of course, that would be a big simplification. It turns out that the electric car buyer today is a different consumer than the conventional car buyer. The decision of the private consumer is influenced, among others, by such aspects as monthly income, the number of cars already owned by the family, the comfort of the vehicle, but also care for the natural environment. Information and knowledge about electric vehicles also have a significant impact on the purchasing behavior of consumers [60,61]. Consumers seem to prefer to be convinced by objective information, expert opinions, and government policy support, rather than by the feelings of friends and acquaintances—“consumers believe in objective information” [53,62]. Although some experts are convinced that the operation of an electric vehicle can be completely emission-free and climate-neutral [43], close attention should be paid to studies that question whether these green technologies proposed in the automotive industry can actually bring about significant reductions in CO2 emissions to effectively combat climate change [63,64]. On the other hand, Ajanovic and Haas [11,65], conducting research in nine cities in different countries on the factors influencing greater public interest in electromobility, proves that all benefits, both financial and prestigious, should depend on the form of electricity production that is beneficial for the environment.
To sum up, there are many factors indicated by scientists and researchers from all over the world and in numerous reports that may have an impact on the increased interest in AFV also in Poland. The most frequently mentioned can be combined into three main issues:
  • financial incentives—such as, for example, tax advantages, subsidies to buy a car, free parking in urban areas, free charging of the car on the road;
  • infrastructure improvement—first of all, investments in the expansion of the network of free car charging places;
  • access to information—in particular, attention should be paid to providing the consumer with expert knowledge on alternative drive cars, as well as information providing legal, price and economic predictability to entrepreneurs.
The current literature findings formed the basis for the development of the questionnaire for this study. It contained a number of questions regarding both the technical and functional characteristics of the car, the method of financing, the amount allocated to the purchase of the car or the way of life related to the broadly understood environmental protection.

3. Materials and Methods

The main goal of this article was an attempt to identify factors that may affect the purchase by a microenterprise of a car with a drive other than an internal combustion engine and to isolate the key factor. The main question referred to the hypothetical purchase of a car, where the entrepreneur could choose between a car with an electric, hybrid or plug-in hybrid engine. It should be emphasized that only people interested in buying a car (conventional or AFV) in the next 12 months or those who bought a car in the last six months participated in the study. The questions asked in the telephone interview concerned, among other things, the advantages, benefits and importance of the features that an AFV should stand out. On the basis of the obtained answers, an attempt was made to identify the key factor that may affect the growth of interest in non-diesel cars among micro-entrepreneurs.
The survey questions were developed based on the analysis of previously published research on factors that could affect purchasing decisions regarding cars. They concerned both the preferences of the respondents as to the technical and utility values of the car and personal attitudes towards the broadly understood environmental protection. The studied phenomenon is obviously multidimensional, therefore the statistical research method used for the analysis of data collected was chosen from the methods of statistical multivariate analysis.
For the purposes of this study, exploratory factor analysis with the principal components method was used. The main purpose of using this method was to isolate the most important factors from the set of primary variables. It allowed to reduce a large number of variables (37 elements) to a smaller set (6 factors) that represent the variability of the same factors, i.e., that the random variables in a given group are to some extent dependent on each other.
As a result of its operation, factor analysis determines the matrix of factor loadings a i j   for   i     1 ,   ,   p , j     1 ,   ,   m . We interpret these charges in such a way that the weight of the factor is the correlation coefficient between the variable and the factor (1), that is:
r X i =   a i j   f o r   i 1 ,   ,   p ,   j   1 ,   ,   m
where:
  • m < p,
  • a i j for i   1 ,   ,   p —factor loadings describe the contribution of a given variable to individual factors.
The variables with the highest (in absolute values) value of factor loadings for given factors are selected for interpretation. These loads describe the contribution of a given variable to individual factors. Each factor explains some percentage of the variance. The part of the total variance explained by the j-th factor is calculated from Equation (2):
h j = λ j λ 1 + + λ m × 100 %
where:
λ j j this eigenvalue of the correlation matrix for   j   1 ,   ,   m
The percentage of total variation explained by the first k factors is calculated as follows:
H k =   j = 1 m h j

4. Results

4.1. Definition and Analysis of Variables

Exactly 181 microentrepreneurs took part in the telephone survey (CATI) conducted in January 2020, of which 164 were qualified for further research using factor analysis. These were the respondents who declared the choice of the type of engine for the hypothetical car from the AFV group that they would like to buy if they had such an opportunity. Figure 2 shows the division of the respondents according to the type of engine of the future car they want to buy (left panel) and the hypothetical purchase of the car with AFV type of engine (right panel).
The questionnaire adopted a 5-point Likert scale, with a choice of answers from 1 (strongly disagree) to 5 (strongly agree). The surveyed microenterprises represent a wide variety of industries and all Polish voivodeships. The exact demographic data of the companies participating in the survey is presented in Table 1.
The vast majority of the owner of the examined microenterprise is a man (72.9%) aged 30 to 50 (61.8%), definitely with higher education (39.8%) or secondary technical education (20.4%). The company’s seat is registered throughout Poland, most often in the Lower Silesia (14.9%), Masovian (14.4%) and Greater Poland (11.6%) provinces. Most of them are companies from the S sector of the economy that declare that they conduct other service activities (29.3%) and other service sectors, such as the K sector—financial and insurance activities (8.8%), health care and social assistance (Sector Q—6.6%), but also there is a group of entrepreneurs from sector G—wholesale and retail trade (11.6%). A detailed breakdown of the surveyed micro-enterprises by type of business activity is presented Figure 3.
A large part of micro-entrepreneurs intend to buy a car in the form of leasing (46.4%), only 7.7% declared long-term rental, and almost 44.2% intend to buy a car in cash or with a loan (Figure 4).
The lease installment for the purchase of a car ranges from PLN 500 to PLN 6000 (1 PLN = c.a. 0.22 Euro (using the exchange rate on 30 October 2020). Most people want to allocate from 1000 to 2000 for this purpose (51.1%), one fourth of them less than PLN 1000, and only 23.8% more than PLN 2000. The declared amounts that micro-entrepreneurs are willing to spend on the purchase of AFV are very different. Among those who buy for cash, it will cover 71.3% the cost of the car entirely from its own funds, and the rest will support this purchase with a bank loan.

4.2. Initial Selection of Input Variables—Statistical Selection of Variables for Factor Analysis

IBM SPSS Statistics 25 for Windows (PS IMAGAO PRO; Copyright: Predictive Solutions Sp. Z o.o. 2013–2020; IBM Corporation 2000–2019) was used to perform the factor analysis. 37 variables and 164 observations were used in the study. In the first stage, tests were carried out to decide whether the collected data is suitable for the factor analysis. To this end, the following steps were performed: (a) checking the size of the research sample; (b) calculating basic statistics for variables; (c) checking the adequacy of the sample selection; (d) deciding on the number of factors, and (e) substantive and statistical interpretation of the identified factors.
The analyzed variables are of different nature, they are very diverse and constitute a large group consisting of 37 items (Table 2). In order to reject variables with a low differentiating position, the initial procedure of the statistical analysis of variables consisted in calculating basic statistics such as the arithmetic mean and standard deviation and the coefficient of variation for each item of the research tool.
It was assumed that the position elimination threshold will be determined by the standard deviation value lower than 0.7. In most cases, the standard deviation value was greater than or close to 1. The obtained values also showed the fulfillment of the critical value recommended in the statistics for the coefficient of variation (greater than 0.1 or 0.15) for all the studied variables. Before applying the factor analysis procedure, all variables were standardized. In the next step, the Kaiser-Meyer-Olkin test (KMO) was calculated, which expresses the ratio of the correlation of variables to their partial correlations and is an indicator of the adequacy of the sample selection. The value of this statistic is 0.658 and it is satisfactory in the context of further analysis. The last stage was the Bartlett’s Test of Sphericity, which also proved to be statistically significant (Table 3).
The obtained results confirm the belief that the data collected during the study enable factor analysis to be carried out. The strength of the factor loadings for individual tool items was checked, and items with a factor load of less than 0.3 (one item—X113 Price) were removed from further analysis. There are 36 items left in the research tool. Then a decision had to be made on the number of factors that could be distinguished. It should be remembered that the successive factors identified explain less and less variability. In order to determine the factor structure of the studied phenomenon, the Kaiser criterion was used, which determines the number of factors based on eigenvalues exceeding 1. In the analysis, it turned out that the eigenvalue was greater than one for 11 components, which together accounted for 69.157% of the total variance. As the number of factors distinguished according to the Kaiser criterion was too large in relation to the number of items (11 to 36), the Cattel criterion was used to determine the number of factors. Based on the Scree plot (Figure 5) it was found that six factors should be distinguished. The six-factor solution causes that a total of 52.596% of the total variation is explained and, after analysis, it is characterized by the greatest logical consistency.

4.3. Identification of Factors

In order to identify the variables constituting individual factors, factor rotations were used. It involves rotating the coordinate system containing the data in such a way that the factors are easier to interpret. The factor rotation procedure maximizes the matching of individual questions of the identified factors. The Promax method was used for the rotation of factors, as it is a diagonal rotation and allows the correlation of factors. Table 4 shows the Promax rotation factor loadings for all 36 items. These are the correlation coefficients between a given statement and the factor that is represented by that statement.
As a result of the applied procedures, six empirical factors were distinguished along with the variables that define them (Table 5). In the vast majority of cases, each variable is highly correlated with only one factor. An exception may be the variable X120, which is highly correlated with the third and fifth factors. Its affiliation with the third factor has been established on the basis of substantive premises due to the information it contains.
There are seven items within the first factor. They all constitute a compact logical structure, named the source of information. This factor contains a set of sources from which respondents most often obtain information about electric cars. Their factor loadings have very high values (from 0.954 to 0.849), which proves their very good correlation. Therefore, one may be tempted to say that the key factor that may affect the process of purchasing an alternative drive car by a microentrepreneur is the information he has obtained on this subject and his knowledge in this field. The collected data show that the vast majority of respondents (76.8%) obtain information from social media, from their own observations in the street or from people who own such cars (67.7%), and to a much lesser extent because they have driven such a car and have experience (30.5%). Unfortunately, only 2.4% of them own an electric car and therefore have knowledge and experience in this field (Figure 6).
The second factor originally contained 8 variables, finally one variable (X114—The brand) was transferred to the sixth factor because its content more closely corresponded to the substantive content of this factor (the factor load also allowed it, because for the sixth factor for this variable it was 0.329 and for the second factor 0.346, the level of correlation was similar). The second factor was called the expected benefits as it entirely includes a set of benefits expected by a potential buyer of an alternative drive car. Financial benefits are of great importance, including subsidies granted by the government for the purchase of an electric car (82.9%), tax reduction (75.6%), free repair of possible damage to the car (longer warranty—64%) or free use of parking spaces—50% (Figure 7).
The third factor reflects well the advantages of having a car with an electric drive (variable: X145—low noise level, X146—less service needed, X147—social prestige and X148—zero-emission). This trend is perfectly matched by the financial benefits of saving water (X151—Do you turn off the light?) and electricity (X153—Do you lower usage of water?) in the daily operation of the company. The relationship between these two variables is presented in the cross table (Table 6). It shows that people who save water also always turn off the light when it is not needed (often—14%, always—39%). The whole thing consists of seven variables that form one substantively coherent factor, which can be called the advantages.
The next fourth factor, was defined by six variables. When analyzing the items included in its composition, it can be assumed that the dimension undoubtedly distinguished on the basis of the results of factor analysis determines the broadly understood activities for environmental protection. This factor can undoubtedly be called the attitudes towards environmental protection. It should be noted that respondents are willing to pay more taxes in return for caring for the environment (X155 and X154). They also believe that everyone can do something good to protect the environment, such as segregating rubbish or using reusable bags. The fifth factor consists of four items expressing concerns related to possible technical problems that may arise from owning an electric or hybrid car. These are the variables that clearly suggest the respondents’ interest in the technical aspect closely related to the use of alternative drive cars, i.e., the use of batteries (X122, X123), the related need for servicing (X116) and access to charging stations (X117). The factor was named the weaknesses of BEVs. The last, sixth factor originally consisted of four variables (X115, X118, X119, and X121), but finally the variable X114 was added to it, which corresponds very well with the other variables. The factor indicates the importance for the respondent of the technical and utility values of the potentially purchased car. These primarily include the entire segment and make of the car (X118 and X114), its functional values (X119) and the range of the vehicle with alternative drive (X115) and of course the associated engine type (X121). The factor was named the importance of the usage value of the car.
The study examined the preferences of the respondents as to the brand of an alternative drive car, which they would like to have the most and the least (Figure 8). The most popular brands are Tesla (53.8%—I would love to have, 16.1%—I would like to have), Lexus (47.3% and 28.0%) and Volvo (44.1% and 32.3%). The respondents were least interested in brands such as Renault (2.2%—I would love to have, 8.6%—I would like to have and 36.6%—I would not like at all, 28.0%—I would not like), Peugeot (4.3%, 21.5% and 33.3%, 24.7%) and Kia (2.2%, 18.3% and 30.1%, 21.5%, respectively).

4.4. Statistical Interpretation of the Factors

In order to determine the level of reliability of each distinguished group of variables, which, by definition, were to answer the same issue, the Cronbach’s Alpha statistic was calculated. This allowed to find out whether the variables reliably measure what was intended by a given group. A high value of the reliability coefficient (close to 1) means a very high consistency of items included in a given group of questions.
The obtained results (Table 7) clearly indicate a very high reliability for the first factor (α = 0.964) and the second factor (α = 0.823). The high level of internal consistency of the dimension is also indicated by the Alpha value for the third, fifth and fourth factors (α = 0.668, 0.623 and 0.595, respectively). This means that the answers are very similar. The sixth factor (α = 0.570) indicates a good, sufficient level of internal consistency of the dimension. The factor correlation matrix (Table 8) indicates no correlation between the identified factors. Only the relationship between the second and third factors is characterized by a higher correlation coefficient (0.336). However, it is so low that there is no correlation between them. The decision to use Promax rotation was correct. The remaining coefficients are very low, which suggests no correlation between the factors.
Factors are theoretical variables that are represented by a certain number of items in the survey questionnaire. In order to measure them, it is not possible to rely on a single observation, nor can individual test items of the survey be analyzed separately. Indicators averaging the responses of all respondents for items representing a given factor for their normalized values were used (Table 9), which facilitates the interpretation and comparison of factors among themselves.
The calculated characteristics for the averaged Factor 1: The source of information indicated that its values are in the range from −2.17 to 1.17 (range 3.35), and the value of the skewness coefficient is −1.39, therefore the distribution is left-skewed, which results in a greater concentration of results within high values and their deficiency within low values. A positive, but low value of the kurtosis index indicates a slightly slender distribution in relation to the normal distribution. The Kolmogorov-Smirnov test (K-S, Table 10) used also confirms that there is a statistically significant deviation from normality (statistic K-S = 0.250, p = 0.000).
The values for Factor 2: the benefits, behave similarly. The values of the variable range from −5.79 to 1.32, which indicates a large left-skewed, which is confirmed by a large skewness coefficient (−2.46). At the same time, the variable creates a very slender graph (kurtosis = 10.25). The result is a very high concentration of results within the high values and their large dispersion within the low values. The K-S test confirms the lack of a normal distribution for this variable (statistic K-S = 0.119, p = 0.000). The p-factors for the K-S test of the next two factors (Factor 3: the advantages and Factor 4: the attitudes towards environmental protection) do not indicate statistical significance for the deviation from the normal distribution (for Factor 3 = 0.062 and for Factor 4 = 0.2). Both factors are left-skewed with an accumulation of large values and a deficiency of small values. A small, positive factor kurtosis of Factor 4 suggests its slight slimming in relation to the normal distribution. The values of the factor variable Factor 4 are the most symmetrically distributed of all factors. For Factor 6, the range of variability is the highest (range = 7.51), it also has a fairly large kurtosis (3.59), which proves its slimming in relation to the normal distribution and with a skewness of −0.96, the accumulation of higher values (likewise/similarly Factor 5).

4.5. The Impact of the COVID-19 Pandemic on the Purchasing Decisions of the Surveyed Microentrepreneurs

In April 2020, the surveyed entrepreneurs were asked again about the choice of the engine with which they would buy the hypothetical alternatively powered car after the outbreak of the SARS-CoV-2 coronavirus pandemic. At the same time, they were asked if, and if so how, this situation influenced the decision to purchase the car for the company’s needs. The answer was received from 92 micro-entrepreneurs who took part in the telephone survey before the pandemic. Before answering the survey questions, the respondents were asked to read the technical information prepared for them about cars with alternative fueling (BEV, HEV, PHEV) engines. This was to broaden their knowledge on the subject.
Figure 9 presents the percentage of people who declared the hypothetical willingness to buy an AFV (BEV, HEV or PHEV) after the pandemic outbreak. In particular, in the case of BEVs the percentage of interested consumers reduced from 14.4% before the pandemic to 13% during a pandemic, and after reading the prepared technical information. In case of HEVs the percentage of people who declared their willingness to buy a hybrid car decreased from 45.3% before the pandemic to 39.1% during the pandemic. In the case of PHEVs the number of people who would be willing to buy increased significantly from 30.9% before the pandemic to 47.8% during the pandemic and after reading the technical information. In this case the impact of information might have led to the increase of respondents’ interest.
The outbreak of the pandemic influenced the purchasing decisions of microenterprises. Over 50% of them declared that it influenced their decision to purchase the car (27.2%—definitely disagree, 25%—I don’t agree). More than 50% of the respondents did not give up the purchase of a new car (26.1%—definitely disagree, 26.1%—don’t agree). Interestingly, as many as 27% of them did not have an opinion on this matter, perhaps it was caused by the early stage of the pandemic and little information about its possible course. Almost 55% of the respondents declared that they withhold the purchase of a car for some time (54.4%), but every third of them did not postpone such a decision (32.6%) (Figure 10).
At the same time, the pandemic did not cause a reduction in the amounts allocated by entrepreneurs for the purchase of this car (54.3%—did not change the allocated amount), only 6.5% of them declared that they would definitely buy a cheaper car (Figure 10). The respondents emphasized the uncertainty related to the lack of knowledge and information about how the pandemic would develop and what would later affect their business.

5. Discussion and Conclusions

The issues of environmental entrepreneurship and sustainable development contribute to the formation of a strengthened pro-ecological attitudes at the level of enterprises. In many companies, sustainable development is seen as a source of new entrepreneurial opportunities to solve social and environmental problems. Entrepreneurs promote changes in the economic and business environment through innovation and thus are ahead of the old ways of operating.
Road transport has a negative impact on the cleanliness of the natural environment, and thus on human health and life. Electromobility is one of the solutions that fit in with the logic of sustainable development. Its purpose is to reduce the nuisance of transport. It assumes the reduction of pollution through the implementation of zero-emission vehicles. Such a solution can improve the quality of life of people, especially in highly urbanized areas, where the demand for services related to the transport of people and goods is particularly large and the related car traffic is increased. However, it should be remembered that environmental pollution caused by the development of the automotive industry is not only influenced by exhaust emissions. The problem is much more complex, and the entire process of environmental pollution begins with the production of energy in the power plant. Electric vehicles can be environmentally friendly, provided that sustainable and renewable energy sources and ecological methods of producing energy in power plants are used [66]. Then we can assume that the operation of an electric vehicle can be completely emission-free and climate-neutral. However, as long as energy production continues from non-renewable sources, electric cars will not be fully pro-environmental solution.
The disposal of used car batteries is another huge problem. In fact, so far there are no convenient methods to recycle the main component of batteries (lithium), and the recycling cost is higher than the extraction cost. As a result, lithium usually remains in landfills. Secondly, the battery components such as lithium, cobalt, manganese are extracted in developing countries where the conditions of the work do not often meet the ethical and socially acceptable principles.
Identification of the key factors that may affect the consumer’s decisions regarding the purchase of an electric vehicle is a necessary link in the electromobility process. It is not only applicable to popularizing electric cars and finding a way to increase their sales. It also serves as the theoretical basis and reference point for the design and development of the vehicles themselves and the space in which we live, so that it better suits our needs. Therefore, both governmental decision makers and relevant manufacturers, in order to develop the economy in accordance with the principles of sustainable development, must consider intensifying information campaigns on alternative fuel vehicles. Achieving the goal of sustainable development regarding climate action must be supported by microenterprises, as they constitute the majority of the economy of both Poland and the European Union.

5.1. Contribution/Main Findings

This paper combines two essential and interrelated aspects: Sustainable development of transportation by the increase of usage of alternative fuel vehicles (AFVs) and the role of microenterprises in the further increase of the AFV market share. Poland is a country where the market share of AFVs is still very small, but keeps increasing. According to the market analysis and reports, the further attempts to raise the AFV presence on the market, needs engagement of the companies, both large, medium and small. In our survey we limit ourselves to the analysis of the points of view of the smallest firms, usually run as family businesses. Their process of decision making is similar to the one done by the households, but still not identical.
Hence, the novelty of the paper refers to analysis of the AFV market from the point of view of microenterprises, which is not common. Most of the studies examine preferences and attitudes towards AFVs of either households or large companies and fleet managers. Moreover the empirical data presented in this paper come from Central European country, representing the market that differs a lot from Western European or American markets which are usually being explored in the empirical analysis. This market differs mainly due to the lower purchasing power of the potential buyers, lower deployment of the system of charging stations and limited experience and exposure to AFVs of the citizenry.
The conducted study was aimed at identifying and analyzing factors that may affect the decision made by a microentrepreneur to purchase an electric or a hybrid car. The study showed that the most important factor is the information itself about the alternatives that the client has and the substantive knowledge about them. The benefits of having such a car and advantages such as safety, quiet driving and fewer service visits are key advantages and are also important factors. The statistical result and the substantive research confirmed that it is acceptable to use the obtained results of the analysis on the key factors of the decision-making process that were identified in this study. The respondents were looking for knowledge and information as they want to know both the strengths and weaknesses of each solution. Most of respondents are aware of the dangers of air pollution. They are quite committed to environmental protection through their everyday behavior (such as waste segregation or the use of reusable bags). They would like to enjoy both the financial advantages of having an electric car (subsidies, lower taxes) and non-financial advantages (e.g., free parking). At the same time, they are aware of the shortcomings of such a solution in the form of, for example, poor charging infrastructure.
It is a mistake to assume that every consumer is fully aware of the alternatives and can make a rational choice. Even more far-reaching research shows that people should not only be informed about the available alternatives, but should even be guided through the entire decision-making process so that they make the choice that is most appropriate for them. As emphasized by King [56] the information should be passed on to the client, rather than assuming he can find it himself. It seems that access to information and, consequently, an increase in knowledge and awareness of microentrepreneurs about an alternative to an internal combustion engine, will be a key factor in increasing interest in electric or hybrid cars. In a comprehensive review of research on transport and climate change, Schwanen et al. write: “There is a strong emphasis on mitigation through technology, economic instruments and infrastructure, and less on reconfiguring travellers’ psyche through information campaigns and social marketing. It should be considered whether the lack of knowledge and scant information provided to consumers about the effects of the development of electromobility mean that drivers who buy a new car pay limited attention to environmental problems” [67]. The implementation of ecological technologies only in the very centre of the automotive industry raises reasonable doubts whether the principles of sustainable development will be met in this way. Without dialogue with the consumer, will it be possible to significantly reduce CO2 emissions, needed to counteract climate change?

5.2. Limitations of the Study

As with all studies, these also have their limitations and imperfections. First, the research could be repeated on a larger sample of microenterprises. Although looking at the demographic cross-section presented by the sample in this study, it reflects well the population on which we draw conclusions, and therefore it can represent it sufficiently. Secondly, the research can of course be extended to appropriate target groups, e.g., due to the industry or the way the car is used dependent on its the function and profession. Theoretically, it can be assumed that the needs and expectations will be different for example for the sales representative, hairdresser or company president.

5.3. Future Research

Research on the same subject, but on the other side of the process, i.e., car manufacturers, may turn out to be a very interesting research topic, which has already been planned for the coming months. Do they also perceive the key factors that could be followed by micro-entrepreneurs when choosing a car with a drive other than internal combustion in the same way? In this context, the opinions of representatives of car manufacturers on the adaptation of their offer of alternative fuel vehicles to micro-entrepreneurs may also be interesting. On the other hand, it is also worth asking microentrepreneurs about the context of environmental protection in accordance with the principles of sustainable development in a broader aspect, not only in the automotive industry, from the point of view of the conducted activity. It would also be worth asking about the advantages and disadvantages of having an AFV to those microentrepreneurs who already use such a car.

Author Contributions

Conceptualization, A.K.-P. and A.S.-S.; methodology, A.S.-S. and A.K.-P.; formal analysis, A.S.-S.; investigation, A.K.-P.; data curation, A.S.-S.; writing—original draft preparation, A.S.-S.; writing—review and editing, A.K.-P. and A.S.-S.; visualization, A.S.-S. and A.K.-P.; supervision, A.K.-P.; project administration, A.K.-P.; funding acquisition, A.K.-P. All authors have read and agreed to the published version of the manuscript.

Funding

This research was funded by NATIONAL SCIENCE CENTRE (NSC), POLAND, grant number 2018/29/B/HS4/00069. The APC was funded by NSC.

Institutional Review Board Statement

Not applicable.

Informed Consent Statement

Informed consent was obtained from all subjects involved in the study.

Data Availability Statement

Not applicable.

Acknowledgments

The survey has been supported by the National Science Centre, Poland, grant No. 2018/29/B/HS4/00069.

Conflicts of Interest

The authors declare no conflict of interest. The funders had no role in the design of the study; in the collection, analyses, or interpretation of data; in the writing of the manuscript, or in the decision to publish the results.

Abbreviations

SMEsmall and medium enterprises
AFValternative fuel vehicles
BEVbattery electric vehicles
PHEVplug-in hybrid vehicles
HEVhybrid electric vehicles

References

  1. Kowalska-Pyzalska, A.; Kott, J.; Kott, M. Why Polish market of alternative fuel vehicles (AFVs) is the smallest in Europe? SWOT analysis of opportunities and threats. Renew. Sustain. Energy Rev. 2020, 133, 110076. [Google Scholar] [CrossRef]
  2. Entrepreneurs’ Act of March. 2018. Available online: https://orka.sejm.gov.pl/proc8.nsf/ustawy/2051_u.htm (accessed on 16 June 2020).
  3. Polish Agency for Enterprise Development. Report on the Condition of the Small and Medium-Sized Enterprise Sector in Poland 2020, Warsaw. 2020. Available online: http://www.parp.gov.pl (accessed on 1 October 2020).
  4. European Union. Annual Report on European SMEs 2018/2019; Research & Development and Innovation by SMEs; European Commission: Brussels, Belgium, 2019. [Google Scholar]
  5. Johnson, M.P.; Schaltegger, S. Entrepreneurship for Sustainable Development: A Review and Multilevel Causal Mechanism Framework. Entrep. Theory Pract. 2020, 44, 1141–1173. [Google Scholar] [CrossRef]
  6. Muñoz-Bullón, F.; Sanchez-Bueno, M.J.; de Massis, A. Combining Internal and External R&D: The Effects on Innovation Performance in Family and Nonfamily Firms. Entrep. Theory Pract. 2008, 44, 996–1031. [Google Scholar] [CrossRef]
  7. Hu, X.; Marlow, S.; Zimmermann, A. Understanding Opportunities in Social Entrepreneurship: A Critical Realist Abstraction. Entrep. Theory Pract. 2019, 44, 1032–1056. [Google Scholar] [CrossRef]
  8. Wigger, K.A.; Shepherd, D.A. We’re All in the Same Boat: A Collective Model of Preserving and Accessing Nature-Based Opportunities. Entrep. Theory Pract. 2019, 44, 587–617. [Google Scholar] [CrossRef]
  9. Polish Economic Institute. How to Support Electromobility? Polish Economic Institute: Warsaw, Poland, 2019. [Google Scholar]
  10. Mounce, R.; Nelson, J.D. On the potential for one-way electric vehicle car-sharing in future mobility systems. Transp. Res. Part A: Policy Pract. 2019, 120, 17–30. [Google Scholar] [CrossRef]
  11. Ajanovic, A.; Haas, R. Dissemination of electric vehicles in urban areas: Major factors for success. Energy 2016, 115, 1451–1458. [Google Scholar] [CrossRef]
  12. ACEA, European Automobile Manufacturers’ Association. Pocket Guide 2019–2020. Available online: www.acea.be/publications (accessed on 15 November 2020).
  13. Kowalska-Pyzalska, A.; Kott, M.; Joanna, K. How Much Consumers Know about Alternative Fuel Vehicles in Poland? Impact of Knowledge on the Willingness to Buy; WORking papers in Management Science (WORMS) WORMS/20/14; Department of Operations Research and Business Intelligence, Wroclaw University of Science and Technology: Wrocław, Poland, 2020. [Google Scholar]
  14. Supreme Audit Office. Air Protection against Pollution; Summary of the most important findings, Warsaw, NIK’s audit No. P/17/078; Supreme Audit Office: Wrocław, Poland, 2014.
  15. Eurostat. 13. Climate Action, CO₂ Emissions from New Passenger Cars in Poland. Available online: https://ec.europa.eu/eurostat/cache/digpub/sdgs/index.html?country=PL&goal=SDG13&ind=2&chart=line (accessed on 28 August 2020).
  16. Krzyżanowski, M.; Kuna-Dibbert, B.; Schneide, J. (Eds.) Health Effects of Transport-Related Air Pollution; World Health Organization: Brussels, Denmark, 2005; ISBN 92-890-1373-7. [Google Scholar]
  17. Mazza, S.; Aiello, D.; Macario, A.; de Luca, P. Vehicular Emission: Estimate of Air Pollutants to Guide Local Political Choices. A Case Study. Environments 2020, 7, 37. [Google Scholar] [CrossRef]
  18. European Commission. A Clean Planet for All, A European Strategic Long Term Vision for a Prosperous, Modern, Competitive and Climate Neutral Economy by 2050 r. com(2018) 773; European Commission: Brussel, Belgium, 2018. [Google Scholar]
  19. European Commission. The European Green Deal, COM(2019) 640; European Commission: Brussel, Belgium, 2019. [Google Scholar]
  20. Vargas, C.M. Community development and micro-enterprises: Fostering sustainable development. Sustain. Dev. 2000, 8, 11–26. [Google Scholar] [CrossRef]
  21. Kłos, M.; Marchel, P.; Paska, J.; Bielas, R.; Błędzińska, M.; Michalski, Ł.; Wróblewski, K.; Zagrajek, K. Forecast and impact of electromobility development on the Polish Electric Power System. E3S Web Conf. 2019, 84, 01005. [Google Scholar] [CrossRef] [Green Version]
  22. Tucki, K.; Orynycz, O.; Świć, A.; Mitoraj-Wojtanek, M. The Development of Electromobility in Poland and EU States as a Tool for Management of CO2 Emissions. Energies 2019, 12, 294. [Google Scholar] [CrossRef] [Green Version]
  23. Drozdz, W. The development of electromobility in Poland. Virtual Econ. 2019, 2, 61–69. [Google Scholar] [CrossRef]
  24. Miczyńska-Kowalska, M. Polish Electric Vehicle Market Development Prospects. Eur. Res. Stud. 2020, 23, 508–523. [Google Scholar]
  25. Rackiewicz, I. (Ed.) Analysis of the State of Development and Current Development Trends in the Field of Electromobility in Poland; Atmoterm S.A.: Warsaw, Poland, 2019. [Google Scholar]
  26. Figenbaum, E.; Kolbenstvedt, M. Electromobility in Norway: Experiences and Opportunities with Electric Vehicles; Transportøkonomisk institutt: Oslo, Norway, 2013. [Google Scholar]
  27. Damousis, I.G.; Naberezhnykh, D. Electromobility: A Market Readiness Study. In Proceedings of the IEEE IEVC′14, Florence, Italy, 17–19 December 2014. [Google Scholar]
  28. Kihm, A.; Trommer, S. The New Car Market for Electric Vehicles and the Potential for Fuel Substitution. Energy Policy 2014, 73, 147–157. [Google Scholar] [CrossRef]
  29. Bitonto, S.; Rico, T. Electromobility in Germany: Vision 2020 and Beyond; Germany Trade & Invest: Berlin, Germany, 2015. [Google Scholar]
  30. Knapcikova, L. Elektromobility in the Slovak Republic: A Green Approach. Acta Logist. 2019, 6, 29–33. [Google Scholar] [CrossRef]
  31. Zhao, Q. Electromobility research in Germany and China: Structural differences. Scientometrics 2018, 117, 473–493. [Google Scholar] [CrossRef]
  32. MacDonald, J. Electric Vehicles to Be 35% of Global New Car Sales by 2040. Bloomberg New Energy Finance (BNEF). 2016. Available online: https://about.bnef.com/blog/electricvehicles-to-be-35-of-global-new-car-sales-by-2040/ (accessed on 27 October 2016).
  33. Figenbaum, E. Can battery electric light commercial vehicles work for craftsmen and service enterprises? Energy Policy 2018, 128, 58–72. [Google Scholar] [CrossRef]
  34. Fieltsch, P.; Flämig, H.; Rosenberger, K. Analysis of charging behavior when using battery electric vehicles in commercial transport. Transp. Res. Procedia 2020, 46, 181–188. [Google Scholar] [CrossRef]
  35. Globisch, J.; Dütschke, E.; Schleich, J. Acceptance of electric passenger cars in commercial fleets. Transp. Res. Part A Policy Pract. 2018, 116, 122–129. [Google Scholar] [CrossRef]
  36. Klauenberg, J.; Rudolph, C.; Zajicek, J. Potential Users of Electric Mobility in Commercial Transport–Identification and Recommendations. Transp. Res. Procedia 2016, 16, 202–216. [Google Scholar] [CrossRef] [Green Version]
  37. Sierzchula, W. Factors influencing fleet manager adoption of electric vehicles. Transp. Res. Part D Transp. Environ. 2014, 31, 126–134. [Google Scholar] [CrossRef]
  38. Bunsen, T.; Cazzola, P.; Gorner, M.; Paoli, L.; Scheffer, S.; Schuitmaker, R.; Tattini, J.; Teter, J. Global EV Outlook 2018: Towards Cross-Modal Electrification, International Energy Agency. 2018. Available online: https://www.connaissancedesenergies.org/sites/default/files/pdfactualites/globalevoutlook2018.pdf (accessed on 15 July 2020).
  39. Dijk, M.; Orsato, R.J.; Kemp, R. The emergence of an electric mobility trajectory. Energy Policy 2013, 52, 135–145. [Google Scholar] [CrossRef]
  40. Schmöller, S.; Bogenberger, K. Analyzing External Factors on the Spatial and Temporal Demand of Car Sharing Systems. Procedia Soc. Behav. Sci. 2014, 111, 8–17. [Google Scholar] [CrossRef] [Green Version]
  41. Higueras-Castillo, E.; Molinillo, S.; Coca-Stefaniak, J.A.; Liébana-Cabanillas, F. Perceived Value and Customer Adoption of Electric and Hybrid Vehicles. Sustainability 2019, 11, 4956. [Google Scholar] [CrossRef] [Green Version]
  42. Jenn, A.; Lee, J.H.; Hardman, S.; Tal, G. An in-depth examination of electric vehicle incentives: Consumer heterogeneity and changing response over time. Transp. Res. Part A Policy Pract. 2020, 132, 97–109. [Google Scholar] [CrossRef]
  43. Auvinen, H.; Järvi, T.; Kloetzke, M.; Kugler, U.; Bühne, J.-A.; Heinl, F.; Kurte, J.; Esser, K. Electromobility Scenarios: Research Findings to Inform Policy. Transp. Res. Procedia 2016, 14, 2564–2573. [Google Scholar] [CrossRef] [Green Version]
  44. Adler, T.; Wargelin, L.; Kostyniuk, L.P.; Kavalec, C.; Occhiuzzo, G. Incentives for alternative fuel vehicles: A large-scale stated preference experiment. In Proceedings of the 10th International Conference on Travel Behaviour Research, Lucerne, Switzerland, 10–15 August 2003; pp. 10–15. [Google Scholar]
  45. Sun, X.; Xu, S. The impact of government subsidies on consumer preferences for alternative fuel vehicles. J. Dalian Univ. Technol. (Soc. Sci.) 2018, 3, 8–16. [Google Scholar]
  46. Thiel, C.; Perujo, A.; Mercier, A. Cost and CO2 aspects of future vehicle options in Europe under new energy policy scenarios. Energy Policy 2010, 38, 7142–7151. [Google Scholar] [CrossRef]
  47. Geels, F.W. A socio-technical analysis of low-carbon transitions: Introducing the multi-level perspective into transport studies. J. Transp. Geogr. 2012, 24, 471–482. [Google Scholar] [CrossRef]
  48. Biondi, E.; Boldrini, C.; Bruno, R. Optimal charging of electric vehicle fleets for a car sharing system with power sharing. In Proceedings of the Energy Conference (ENERGYCON), 2016 IEEE International, Leuven, Belgium, 4–8 April 2016. [Google Scholar] [CrossRef] [Green Version]
  49. Santos, G.; Davies, H. Incentives for quick penetration of electric vehicles in five European countries: Perceptions from experts and stakeholders. Transp. Res. Part A Policy Pract. 2020, 137, 326–342. [Google Scholar] [CrossRef]
  50. Ito, N.; Takeuchi, K.; Managi, S. Willingness-to-pay for infrastructure investments for alternative fuel vehicles. Transp. Res. Part D Transp. Environ. 2013, 18, 1–8. [Google Scholar] [CrossRef] [Green Version]
  51. Song, Z. International experience and enlightenment of the development of electric automobile industry alliance. China Dev. Obs. 2012, 3, 54–56. [Google Scholar]
  52. Bugden, D.; Stedman, R. A synthetic view of acceptance and engagement with smart meters in the United Sates. Energy Res. Soc. Sci. 2019, 47, 137–145. [Google Scholar] [CrossRef]
  53. Tu, J.-C.; Yang, C. Key Factors Influencing Consumers’ Purchase of Electric Vehicles. Sustainability 2019, 11, 3863. [Google Scholar] [CrossRef] [Green Version]
  54. Chlebišová, E.; Kyzeková, J. The information sources for the company decision making process by buying new company vehicles with regard to electric vehicles. Acta Acad. Karviniensia 2012, 12, 43–52. [Google Scholar] [CrossRef]
  55. Steg, L. Promoting household energy conservation. Energy Policy 2008, 36, 4449–4453. [Google Scholar] [CrossRef]
  56. King, J. The King Review of Low-Carbon Cars; H.M. Treasury: Westminster, UK, 2007. Available online: www.hm-treasury.gov.uk/king (accessed on 1 October 2020).
  57. Lane, B. Low CVP Car Buyer Research Report, Final Report Low Carbon Vehicle Partnership, Ecolane Transport Consultancy on Behalf of the Low Carbon Vehicle Partnership. 2005. Available online: www.lowcvp.org.uk (accessed on 1 October 2020).
  58. Chéron, E.; Zins, M. Electric vehicle purchasing intentions: The concern over battery charge duration. Transp. Res. Part A 1997, 31, 235–243. [Google Scholar] [CrossRef]
  59. Dagsvik, J.K.; Wennemo, T.; Wetterwald, D.G.; Aaberge, R. Potential demand for alternative fuel vehicles. Transp. Res. Part B 2002, 36, 361–384. [Google Scholar] [CrossRef] [Green Version]
  60. Hao, Y.; Dong, X.Y.; Deng, Y.X.; Li, L.X.; Ma, Y. What influences personal purchases of new energy vehicles in China? An empirical study based on a survey of Chinese citizens. J. Renew. Sustain. Energy 2016, 8, 065904. [Google Scholar] [CrossRef]
  61. Brög, W.; Erl, E.; Mense, N. Individualised Marketing: Changing Travel Behaviour for a Better Environment. In OECD Communicating Environmentally Sustainable Transport: The Role of Soft Measures; OECD: Paris, France, 2004; pp. 83–97. [Google Scholar]
  62. Schwanen, T.; Dijst, M.; Dieleman, F.M. Policies for urban form and their impact on travel: The Netherlands experience. Urban Stud. 2004, 41, 579–603. [Google Scholar] [CrossRef] [Green Version]
  63. Banister, D. The sustainable mobility paradigm. Transp. Policy 2008, 15, 73–80. [Google Scholar] [CrossRef]
  64. Chapman, L. Transport and climate change: A review. J. Transp. Geogr. 2007, 15, 354–367. [Google Scholar] [CrossRef]
  65. Ajanovic, A.; Haas, R. On the environmental benignity of electric vehicles. J. Sustain. Dev. EnergyWater Environ. Syst. 2019, 7, 416–431. [Google Scholar] [CrossRef]
  66. Ruggieri, R.; Ruggeri, M.; Vinci, G.; Poponi, S. Electric Mobility in a Smart City: European Overview. Energies 2021, 14, 315. [Google Scholar] [CrossRef]
  67. Schwanen, T.; Banister, D.; Anable, J. Scientific research about climate change mitigation in transport: A critical review. Transp. Res. Part A 2011, 45, 993–1006. [Google Scholar] [CrossRef] [Green Version]
Figure 1. Percentage of registered electric cars among passenger cars in Poland and selected countries (2018, %) (reproduced from [9], p. 24, Polski Instytut Ekonomiczny).
Energies 14 00764 g001
Figure 2. Engine type of the future car (left panel); Engine type of the hypothetical purchase of AFV (right panel), N = 181.
Energies 14 00764 g002
Figure 3. Enterprises due to the business sector (N = 181, %).
Energies 14 00764 g003
Figure 4. Sources and forms of financing the purchase of a car by microenterprises and the amount for the purchase or leasing of a car (%, PLN).
Energies 14 00764 g004
Figure 5. Factors distinguished on the basis of the Scree plot.
Energies 14 00764 g005
Figure 6. Sources of information about electric cars by the respondents (N = 164).
Energies 14 00764 g006
Figure 7. Importance of the benefits associated with an electric drive for microentrepreneur (N = 164).
Energies 14 00764 g007
Figure 8. Assessment of the importance of the respondents’ preferences as to the brand of potentially purchased AFV (N = 164).
Energies 14 00764 g008
Figure 9. Declaration of individual respondents regarding the purchase of an alternative drive the hypothetical car and its financing during the COVID-19 pandemic (N = 92).
Energies 14 00764 g009
Figure 10. The impact of the COVID-19 pandemic on the decisions of micro-entrepreneurs to buy a car (N = 92).
Energies 14 00764 g010
Table 1. Demographic and economic variables microenterprises that took part in the study (N = 181).
VariableFrequency (%)
GenderMale:132 (72.9%)
Female:49 (27.1%)
Age FemaleMale
20–30 years old:7 (14.9%)31 (23.7%)
31–40 years old:24 (51.1%)48 (36.6%)
41–50 years old:14 (29.8%)33 (25.2%)
51–65 years old:2 (4.3%)19 (14.5%)
No answer:3 (1.7%)
Education Female:Male:
Primary School:0 (0.0%)1 (0.6%)
Basic Vocational School:0 (0.0%)7 (3.9%)
Technical College:2 (1.1%)37 (20.4%)
Secondary School:2 (1.1%)13 (7.2%)
Post-secondary school:0 (0.0%)2 (1.1%)
Masters Completed:44 (24.3%)71 (39.2%)
PhD Completed:1 (0.6%)1 (0.6%)
Technical educationTechnical education:9 (5.5%)83 (50.3%)
No answer:16 (8.8%)
Place of livingLess than 5000 inhabitants:48 (26.5%)
5000–30,000 inh.:36 (19.9%)
30,000–100,000 inh.:31 (17.1%)
100,000–500,000 inh.:24 (13.3%)
More than 500,000 inh.:42 (23.2%)
Employees number0 employees:65 (35.9%)
1 employees:76 (42.0%)
2 employees:20 (11.0%)
3 employees:5 (2.8%)
4 employees:4 (2.2%)
5 employees:3 (1.7%)
6 employees:3 (1.7%)
7 employees:2 (1.1%)
8 employees:1 (0.6%)
9 employees:2 (1.1%)
Business years1–5 years old:76 (42.7%)
6–10 years old:51 (28.7%)
11–20 years old:39 (21.9%)
21–37 years old:12 (6.7%)
No answer:3 (1.7%)
Table 2. Description and basic statistics of variables.
CodeVariableMeanStd. DeviationCoefficient of Variation
X46The source of information about BEV: Mass media0.880.7670.872
X47The source of information about BEV: Observations from the daily life (e.g., in the street)0.960.7690.801
X48The source of information about BEV: Conversation with BEV owner1.400.7720.551
X49The source of information about BEV: Conversation with BEV dealer1.500.7790.519
X50The source of information about BEV: Driving a BEV 1.340.7630.569
X51The source of information about BEV: Looking for information about BEV1.520.7870.518
X52Being a BEV owner1.620.7700.475
X113The price of the car4.221.0280.244
X114The brand of the car3.551.2540.353
X115The range of a car4.490.8980.200
X116Access to the service4.251.0590.249
X117Access to the charging stations4.540.9040.199
X118The car segment4.081.0670.262
X119The functional values4.200.9510.227
X120The safety4.520.7640.169
X121The type of fuel3.881.1770.303
X122Reusage of batteries3.671.3210.360
X123The impact of weather on batteries4.061.1360.280
X138Free parking space3.961.3120.332
X139Usage of bus lanes3.931.3120.334
X140Usage of zero-emissions lanes4.011.2200.304
X141Tax release4.630.8170.177
X142The subsidy4.710.7780.165
X143Development of charging stations4.470.8130.182
X144The longer guarantee4.480.8470.189
X145Low noise level3.991.2340.309
X146Less service needed4.011.1150.278
X147Social prestige2.401.2370.515
X148Zero-emission of a car4.151.1850.286
X149Environmental behavior: Waste segregation 4.640.7450.161
X150Environmental behavior: Using multiple-usage bags4.321.1090.257
X151Environmental behavior: Turning off the light4.420.9610.217
X152Environmental behavior: Financial support of environmental protection organizations1.651.2100.735
X153Environmental behavior: Lowering usage of water4.061.0890.269
X154Environmental attitude: Being glad if climate plays role in politics3.811.3700.359
X155Environmental attitude: Being ready to pay higher taxes2.991.4320.478
X156Environmental attitude: Believing that everybody has an impact on environment protection4.690.7710.165
Table 3. Kaiser-Meyer-Olkin and Bartlett’s Test.
Kaiser-Meyer-Olkin Measure of Sampling Adequacy.0.780
Bartlett’s Test of SphericityApprox. Chi-Square2746.914
df630
Significance0.000
Table 4. Rotated Structure Matrix after Promax.
VariableComponents
123456
X520.954
X490.923
X510.914
X480.908
X500.905
X460.886
X470.849
X142 0.7130.389
X143 0.6960.362 0.386
X141 0.6920.305
X140 0.672
X144 0.6680.426
X139 0.654
X138 0.636
X114 0.346 0.329
X153 0.593
X120 0.591 0.538
X151 0.563
X148 0.3740.5620.423
X145 0.3730.537
X147 0.4150.518
X146 0.3680.447 −0.311
X155 0.751
X154 0.3280.649
X149 0.570
X152 0.471
X150 0.378
X156 0.344
X123 0.757
X122 0.709
X116 0.375 0.624
X117 0.317 0.490
X119 0.697
X115 0.3690.548
X118 0.519
X121 0.491
6 components extracted. Rotation converged in 11 iterations.
Table 5. Factors and variables included in the factors.
Variable CodeFactors and VariablesFactor Loading
Factor 1. The source of information
X52Being a BEV owner0.954
X49The source of information about BEV: Conversation with BEV dealer0.923
X51The source of information about BEV: Looking for information about BEV0.914
X48The source of information about BEV: Conversation with BEV owner0.908
X50The source of information about BEV: Driving a BEV0.905
X46The source of information about BEV: Mass media0.886
X47The source of information about BEV: Observations from the daily life (e.g., in the street)0.849
Factor 2. The expected benefits
X142The subsidy0.713
X143Development of the charging stations0.696
X141Tax release0.692
X140Usage of zero-emissions lanes0.672
X144The longer guarantee0.668
X139Usage of bus lanes0.654
X138Free parking space0.636
Factor 3. The advantages
X153Environmental behavior: Lowering usage of water0.593
X120The safety0.591
X151Environmental behavior: Turning off the light0.563
X148Zero-emission of a car0.562
X145Low noise level0.537
X147Social prestige0.518
X146Less service needed0.447
Factor 4. Attitudes towards environmental protection
X155Environmental attitude: Being ready to pay higher taxes0.751
X154Environmental attitude: Being glad if climate plays role in politics0.649
X149Environmental behavior: Waste segregation0.570
X152Environmental behavior: Financial support of environmental protection organizations0.471
X150Environmental behavior: Using multiple-usage bags0.378
X156Environmental attitude: Believing that everybody has an impact on environment protection0.344
Factor 5. Weaknesses of BEV
X123The impact of weather on batteries0.757
X122Reusage of batteries0.709
X116Access to the service0.624
X117Access to the charging stations0.490
Factor 6. The importance of the usage value
X119The functional values0.697
X115The range0.548
X118The car segment0.519
X121The type of fuel0.491
X114The brand of a car0.329
Table 6. Relationship between light off (X151) and turning off water (X153) (N = 164, %).
X151 * X153 Crosstabulation
X153—Do You Lower Usage of Water?Total
1—Never2—Rarely3—Occasionally4—Often5—Always
X151—Do you turning off the light?1—never00.61.2001.8
2—rarely0.61.20.62.404.9
3—occasionally0.61.233.71.29.8
4—often0.61.26.17.9318.9
5—always1.22.47.9143964.6
Total36.718.92843.3100
Table 7. Cronbach’s alpha coefficient for individual factors.
Factor123456
Cronbach’s alpha coefficient964823668595623570
Table 8. Factor correlation matrix.
Component Correlation Matrix
Component123456
11.000−0.070−0.059−0.050−0.0650.011
2−0.0701.0000.3360.0530.249−0.020
3−0.0590.3361.0000.0780.279−0.019
4−0.0500.0530.0781.000−0.002−0.082
5−0.0650.2490.279−0.0021.0000.021
60.011−0.020−0.019−0.0820.0211.000
Table 9. Descriptive statistics for all six factors (standardized variables, N = 164).
Descriptive StatisticsFactors
Factor 1Factor 2Factor 3Factor 4Factor 5Factor 6
Minimum−2.17−5.79−3.88−3.56−3.71−4.83
Maximum1.171.321.852.141.622.68
Range3.357.115.735.705.347.51
Mean0.00.00.00.00.00.0
Std. Deviation1.01.01.01.01.01.0
Variance1.01.01.01.01.01.0
Skewness−1.39−2.46−1.04−0.36−1.12−0.96
Kurtosis0.4110.251.830.671.483.59
Table 10. Tests of Normality Kolmogorov-Smirnov for all factors.
Factor 1Factor 2Factor 3Factor 4Factor 5Factor 6
Statistic0.2500.1190.0680.0570.1110.094
Significance p0.0000.0000.0620.2000.0000.001
Publisher’s Note: MDPI stays neutral with regard to jurisdictional claims in published maps and institutional affiliations.

