Article

A Novel Comprehensive Benefit Evaluation of IEGES Based on the TOPSIS Optimized by MEE Method

School of Economics and Management, North China Electric Power University, Beijing 102206, China
*
Author to whom correspondence should be addressed.
Energies 2021, 14(3), 763; https://doi.org/10.3390/en14030763
Submission received: 28 December 2020 / Revised: 22 January 2021 / Accepted: 29 January 2021 / Published: 1 February 2021

Abstract

:
The integrated electricity–gas energy system (IEGES) coordinates the power system and natural gas system through P2G equipment, gas turbines and other coupling components. The IEGES can realize wide-range and long-distance transmission of electricity, heat and natural gas, and truly realize large-scale cross-regional energy supply in space. At present, the theoretical system applicable to the comprehensive benefit evaluation of the IEGES has not been established, and the economic, environmental and social benefits of the system are still at a preliminary study stage. Therefore, the comprehensive benefit evaluation model of the IEGES is constructed, and the integrated benefit evaluation indicator system of the IEGES is designed along the investment and planning, energy supply, equipment operation, power distribution and terminal user. Through the combination of subjective and objective indicator weighting methods, the weights of each indicator are clarified and the matter-element extension theory (MEE) is used to improve the technique for order preference by similarity to ideal solution (TOPSIS), and the comprehensive benefit evaluation model of the IEGES is established. Finally, taking Beijing Yanqing IEGES, Tianjin Eco-city No. 2 Energy Station and Hebei IEGES III as an example, the practicability and effectiveness of the evaluation indicator system and model are verified.

1. Introduction

In different energy center models, there will be a variety of different energy sources coupled to achieve flexible conversion in different systems. The conversion equipment of the integrated electricity–gas energy system (IEGES) includes power to gas (P2G), gas turbines and gas boilers, which can establish redundant connections between input and output ports.
In the IEGES, the power system and natural gas system rely on P2G equipment and gas turbines and other energy conversion equipment to couple in the energy center. The role of the gas-fired unit is to quickly convert natural gas into electricity, and make up for the difference in the power load curve [1]. When the power generation output in the power system exceeds the power load demand, especially during the night, P2G equipment can convert electrical energy into artificial natural gas through electrolysis methanation reaction and inject natural gas storage in pipelines or tanks. In addition, in the power system, P2G equipment has a load point function to achieve peak shaving of participating units and reduces power system congestion [2]. P2G equipment promotes the backup of the gas and electricity system, which greatly improves the flexibility and safety of the operation of the IEGES.

1.1. Literature Review

As an important physical carrier of the Energy Internet, the integrated energy system (IES) requires the conversion and coordination of multiple energy sources to achieve high-efficiency utilization during its utilization process [3,4]. At present, many scholars have studied power to gas, and power to heat from different angles. With the development of P2G technology, the multienergy system composed of electric power system and natural gas system has gradually developed and become an important part of IES [5]. Jiang, Y.B. et al. [6] studied the partial renewable power fluctuation on the power network, which is transferred to the gas system and cooling or heating system by the coordinated operation. N. Gholizadeh et al. [7] analyzed the two technologies of P2G equipment: electric-to-hydrogen and electric-to-methane. The experimental results showed that the conversion efficiency of electric-to-hydrogen is higher than that of electric-to-methane, but electric-to-methane has higher economical value; Boreum Lee et al. [8] verified that P2G technology provides new solutions for the consumption of renewable energy. Wang, J et al. [9] proposed a cooperative and complementary operation scheme for distributed cooling, heating and power supply systems in multiple regions by analyzing the disadvantages of the distributed combined heat and power system. Jiang Z.X. et al. [10] considered the IES of photovoltaic, wind, natural gas and power coupling and complementarity. Gao, Y. et al. [11] studied the integrated modeling of power system, thermodynamic system and natural gas system coupling, and proposed the control strategy of collaborative optimization. Guan, T.T. et al. [12] studied the partial renewable power fluctuation on power network, which was transferred to the gas system and cooling or heating system.
At present, many scholars pay attention to the comprehensive evaluation of IES, including security, reliability, economy and environmental friendliness. For example, from the perspective of system reliability, Juanwei, C et al. [13] constructed some reliability indices of natural gas system while considering reliability of the power distribution system. Wang et al. [14] applied some technical indicators including the failure rate, the repair rate, the availability and the mean time to failure to evaluate the reliability of the building cooling, heating and power system. From the perspective of economy performance, Nisan et al. [15] conducted a sensitivity study on the cost of desalination under combined heat and power through different indicators including fossil fuel prices, interest rates and discount rates and electricity costs. Rozakis et al. [16] evaluated a combined renewable energy system from the perspective of economic feasibility, agricultural income, impact on local development, renewable energy consumption, etc. El-Emam et al. [17] proposed an integrated energy system driven by solar power, and conducted sensitivity analysis of several economic indicators to evaluate economic benefit. Meng et al. [18] made the economic evaluation on levelized cost of electricity. Wan et al. [19] presented a technoeconomic analysis to examine the feasibility of sago biomass-based combined heat and power system. From the perspective of environmental performance, Xu et al. [20] set the CO2 capture compression indicator to achieve effective evaluation of energy efficiency of coal-fired power plants. Dicorato et al. [21] proposed a linear programming optimization procedure based on energy flow optimization model to evaluate the contribution of distributed-generation production and energy-efficiency. In the evaluation process, indicators such as operating costs and environmental pollutant emissions were mainly used. Kim et al. [22] established an environmental indicator system for a photovoltaic responsive dimming system using LED lighting. Dai et al. [23] applied annual energetic and economic performance indicator system to made evaluation of IES. Mancarella et al. [24] used the air quality standard to evaluate the emission reduction capacity of distributed cogeneration system, and quantified the contribution to cogeneration system emissions. Müller et al. [25] proposed a methodical approach for the multimodal energy system and conducted a technology impact evaluation. From the perspective of energy demand, Wang et al. [26] analyzed the energetic, economic and environmental performances of disruption of the building cooling, heating and power system, and constructed a reliability and availability evaluation model. Möllersten et al. [27] used the two criteria of potential CO2 reduction and cost of CO2 reduction to evaluate technical energy measures in Swedish. CO2 capture and reliable CO2 sequestration technologies were important potential contributors to Swedish compliance with Kyoto Protocol targets. Lv et al. [28] constructed the reliability evaluation of the integrated energy system from the perspective of dynamic behavior of loads and operation strategy, and then proposed a novel reliability evaluation method with the comprehensive consideration of the dynamic behavior. However, the current research has not yet defined the comprehensive benefits of IEGES. In addition, scholars have not sorted out the entire operation of the IEGES, which has led to an incomplete comprehensive benefit evaluation indicator system. Therefore, the in-depth study on the standard comprehensive benefit evaluation indicator system of IEGES is very critical.
In addition, in recent years, more and more scholars have focused on the evaluation of other aspects of benefits or comprehensive performance of the integrated energy system. Ren et al. [29] developed the mixed integer linear programming model for integration planning and evaluation for distributed energy resources (DER). The evaluation indicators including energy load, climate data, utility rate structure and DER technical information. Yong et al. [30] constructed a wide range of technical, environmental and economic indicators to evaluate Malaysia photovoltaic systems. Abbasi et al. [31] constructed energy and economic indicators of a combined cooling, heating and power (CCHP) system in Iran, and presented appropriate condition of its operation. Finally, the design scheme with the highest comprehensive evaluation benefit was selected. Cho et al. [32] established optimization evaluation model for combined cooling, heating and power (CCHP) systems through operational cost, primary energy consumption (PEC), and carbon dioxide emissions (CDE). Yang et al. [33] considered the aspects of technology, economy, environment and society to evaluated the planning schemes of distributed energy supply systems. Wang et al. [34] applied heating capacity and energy consumption, heating seasonal performance to conduct a systematic assessment of CO2 heat pump system integrated with thermal energy storage (TES) systems.
In terms of evaluation methods, most current scholars use simple sensitivity analysis methods to evaluate benefits based on their optimized models. Some scholars have put forward a universal comprehensive evaluation indicator system. Tan et al. [35] put forward the universal steps of fuzzy evaluation measure in order to assess the mitigation responsibilities in China. Li et al. [36] presented mixed integer and non-linear programming (MINLP) to assess a distributed combined heating, cooling and power generation system in Beijing. Hammond et al. [37] applied a life-cycle assessment (LCA) to study the performance of a domestic building integrated photovoltaic (BIPV) system. Gejirifu et al. [38] utilized the characteristics of the intuitionistic fuzzy set theory and proposed universal steps of a comprehensive evaluation indicator system. However, existing studies have considered only a single decision subject matter, and the significance of using bilevel programming theory is only in capturing key decision variables. However, the current comprehensive evaluation model are still relatively rough, and most of them use fuzzy evaluation methods, which easily lead to the same evaluation rank results, which cannot meet the accuracy required by scientific evaluation. Therefore, this paper uses MEE to optimize the TOPSIS model to overcome the current shortcomings.
The main content and structure of this paper are as follows: Section 1 reviews and summarizes the research trends of the IEGES, and puts forward the literature research and innovation; 
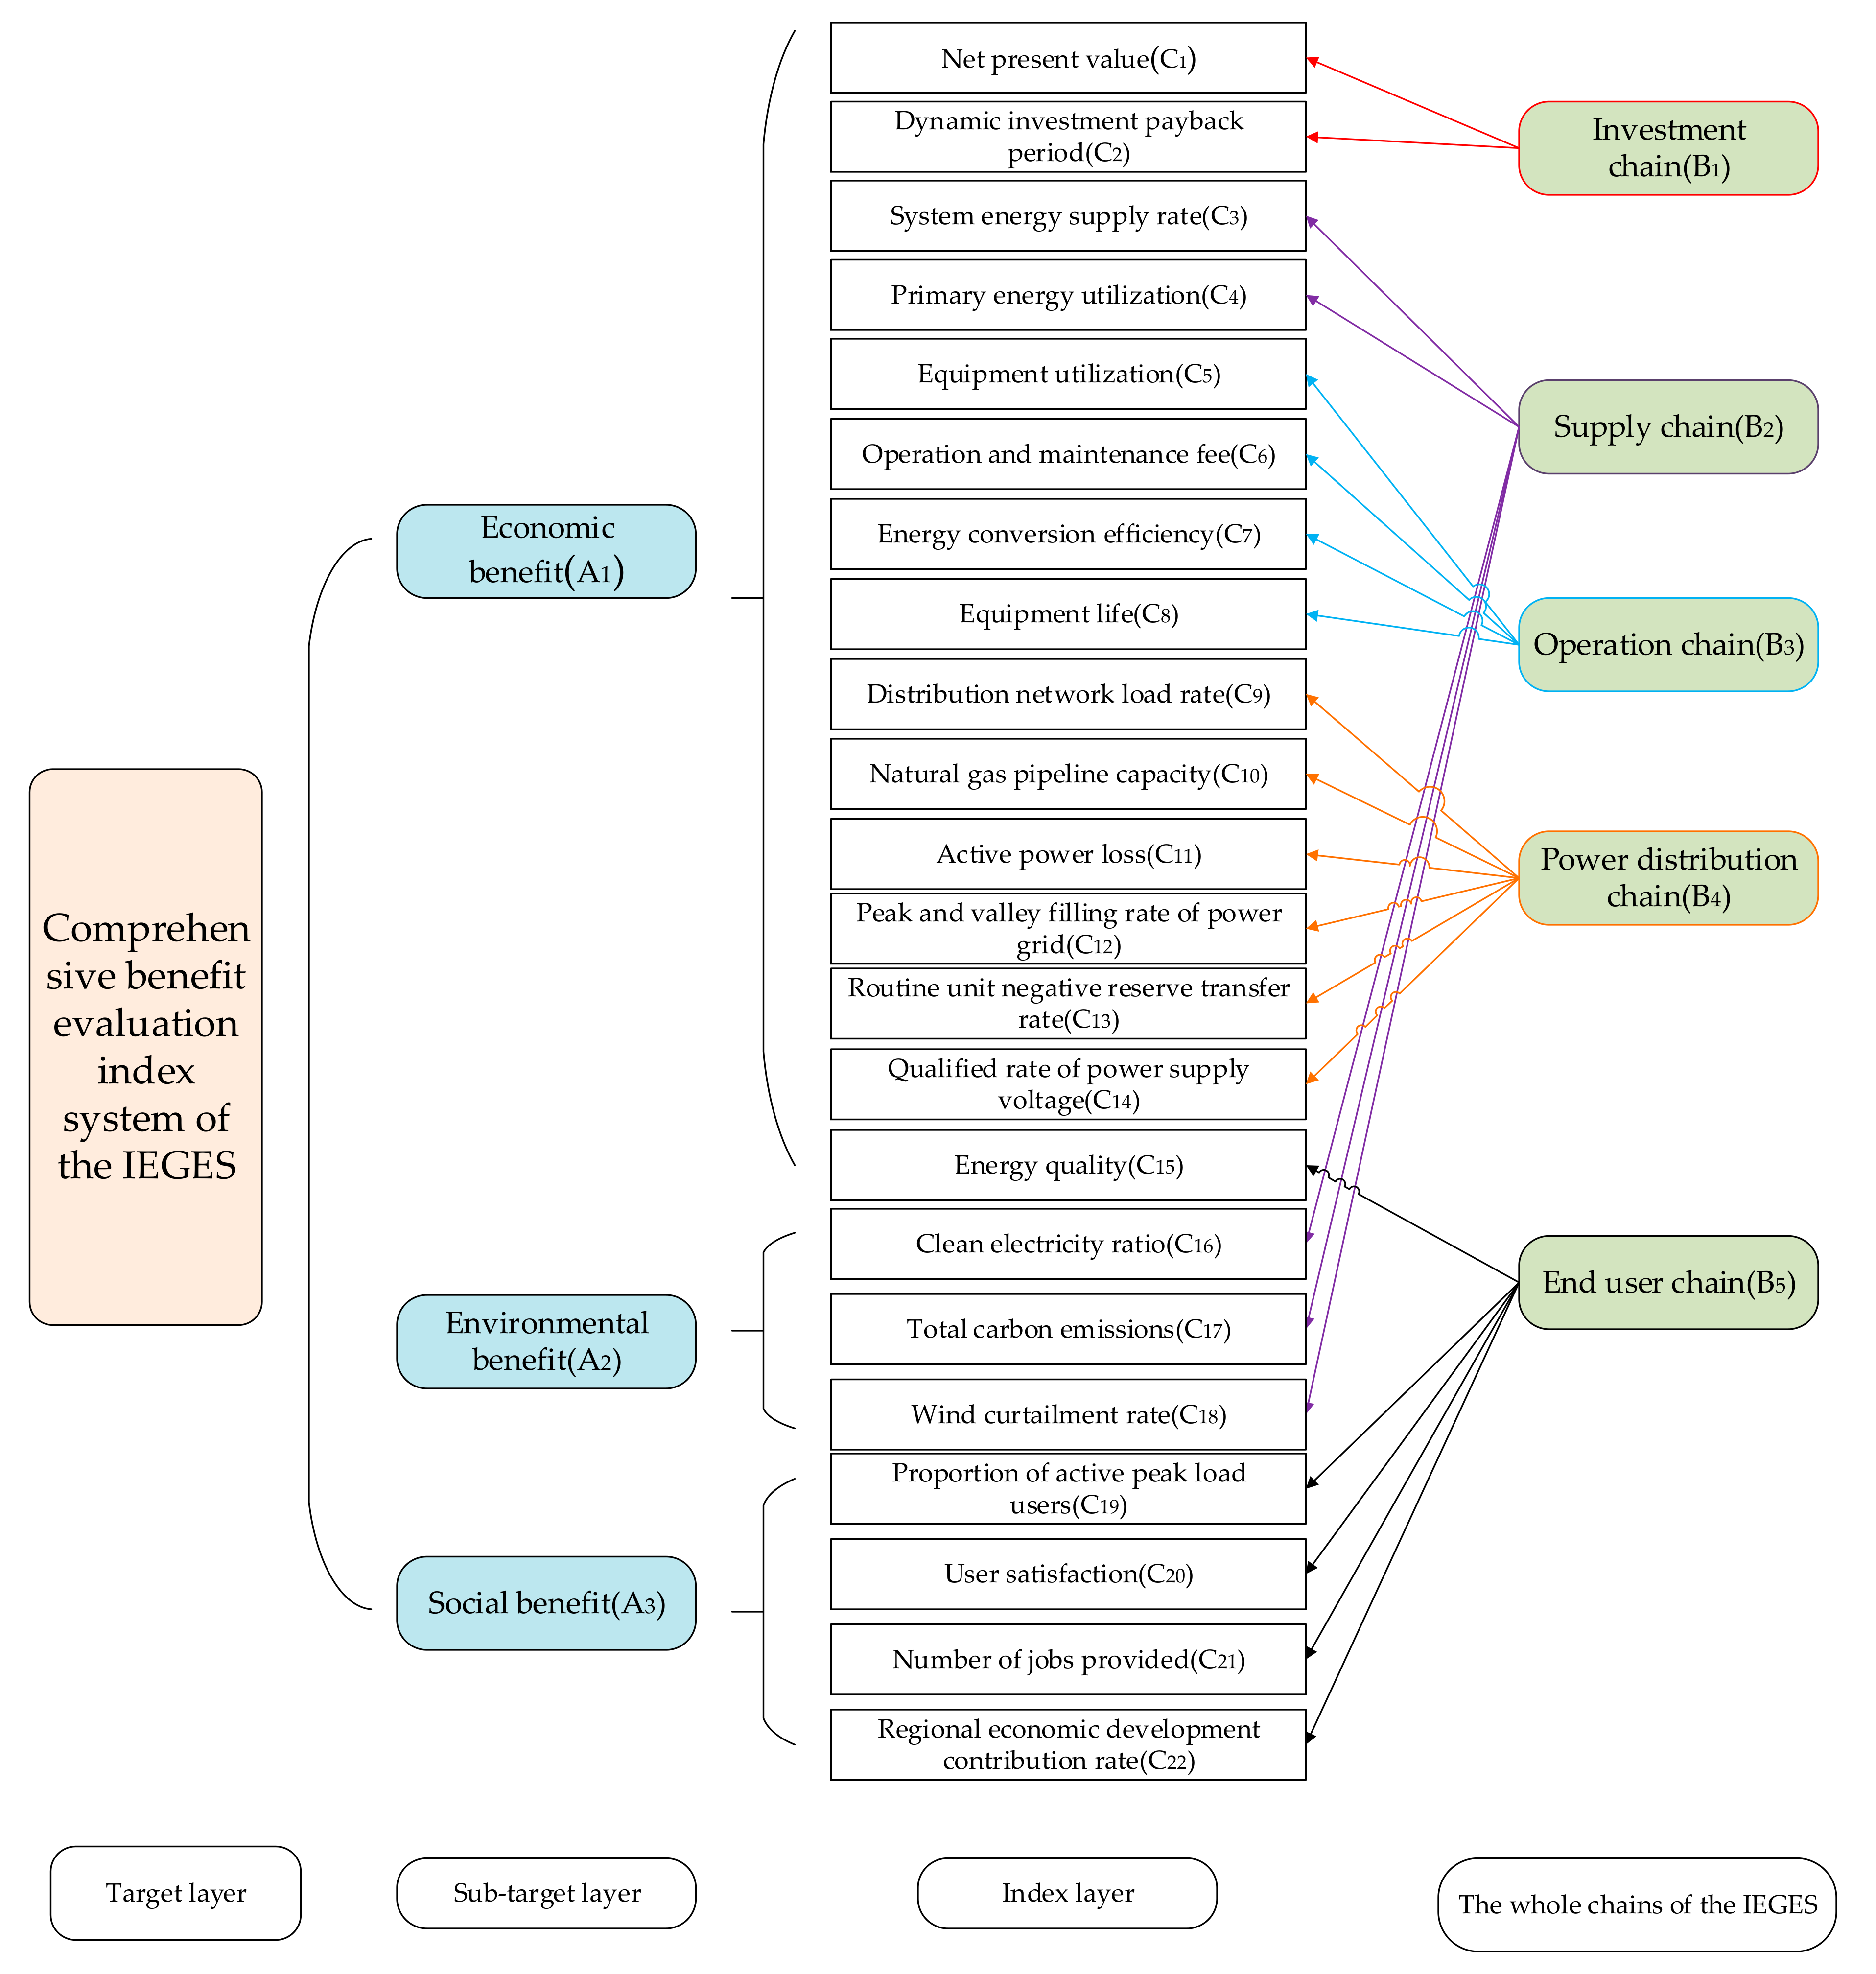
Section 2 constructs the comprehensive benefit evaluation indicator system of the IEGES based on its operation chains, and then analyzes economic, environmental and social benefits; 
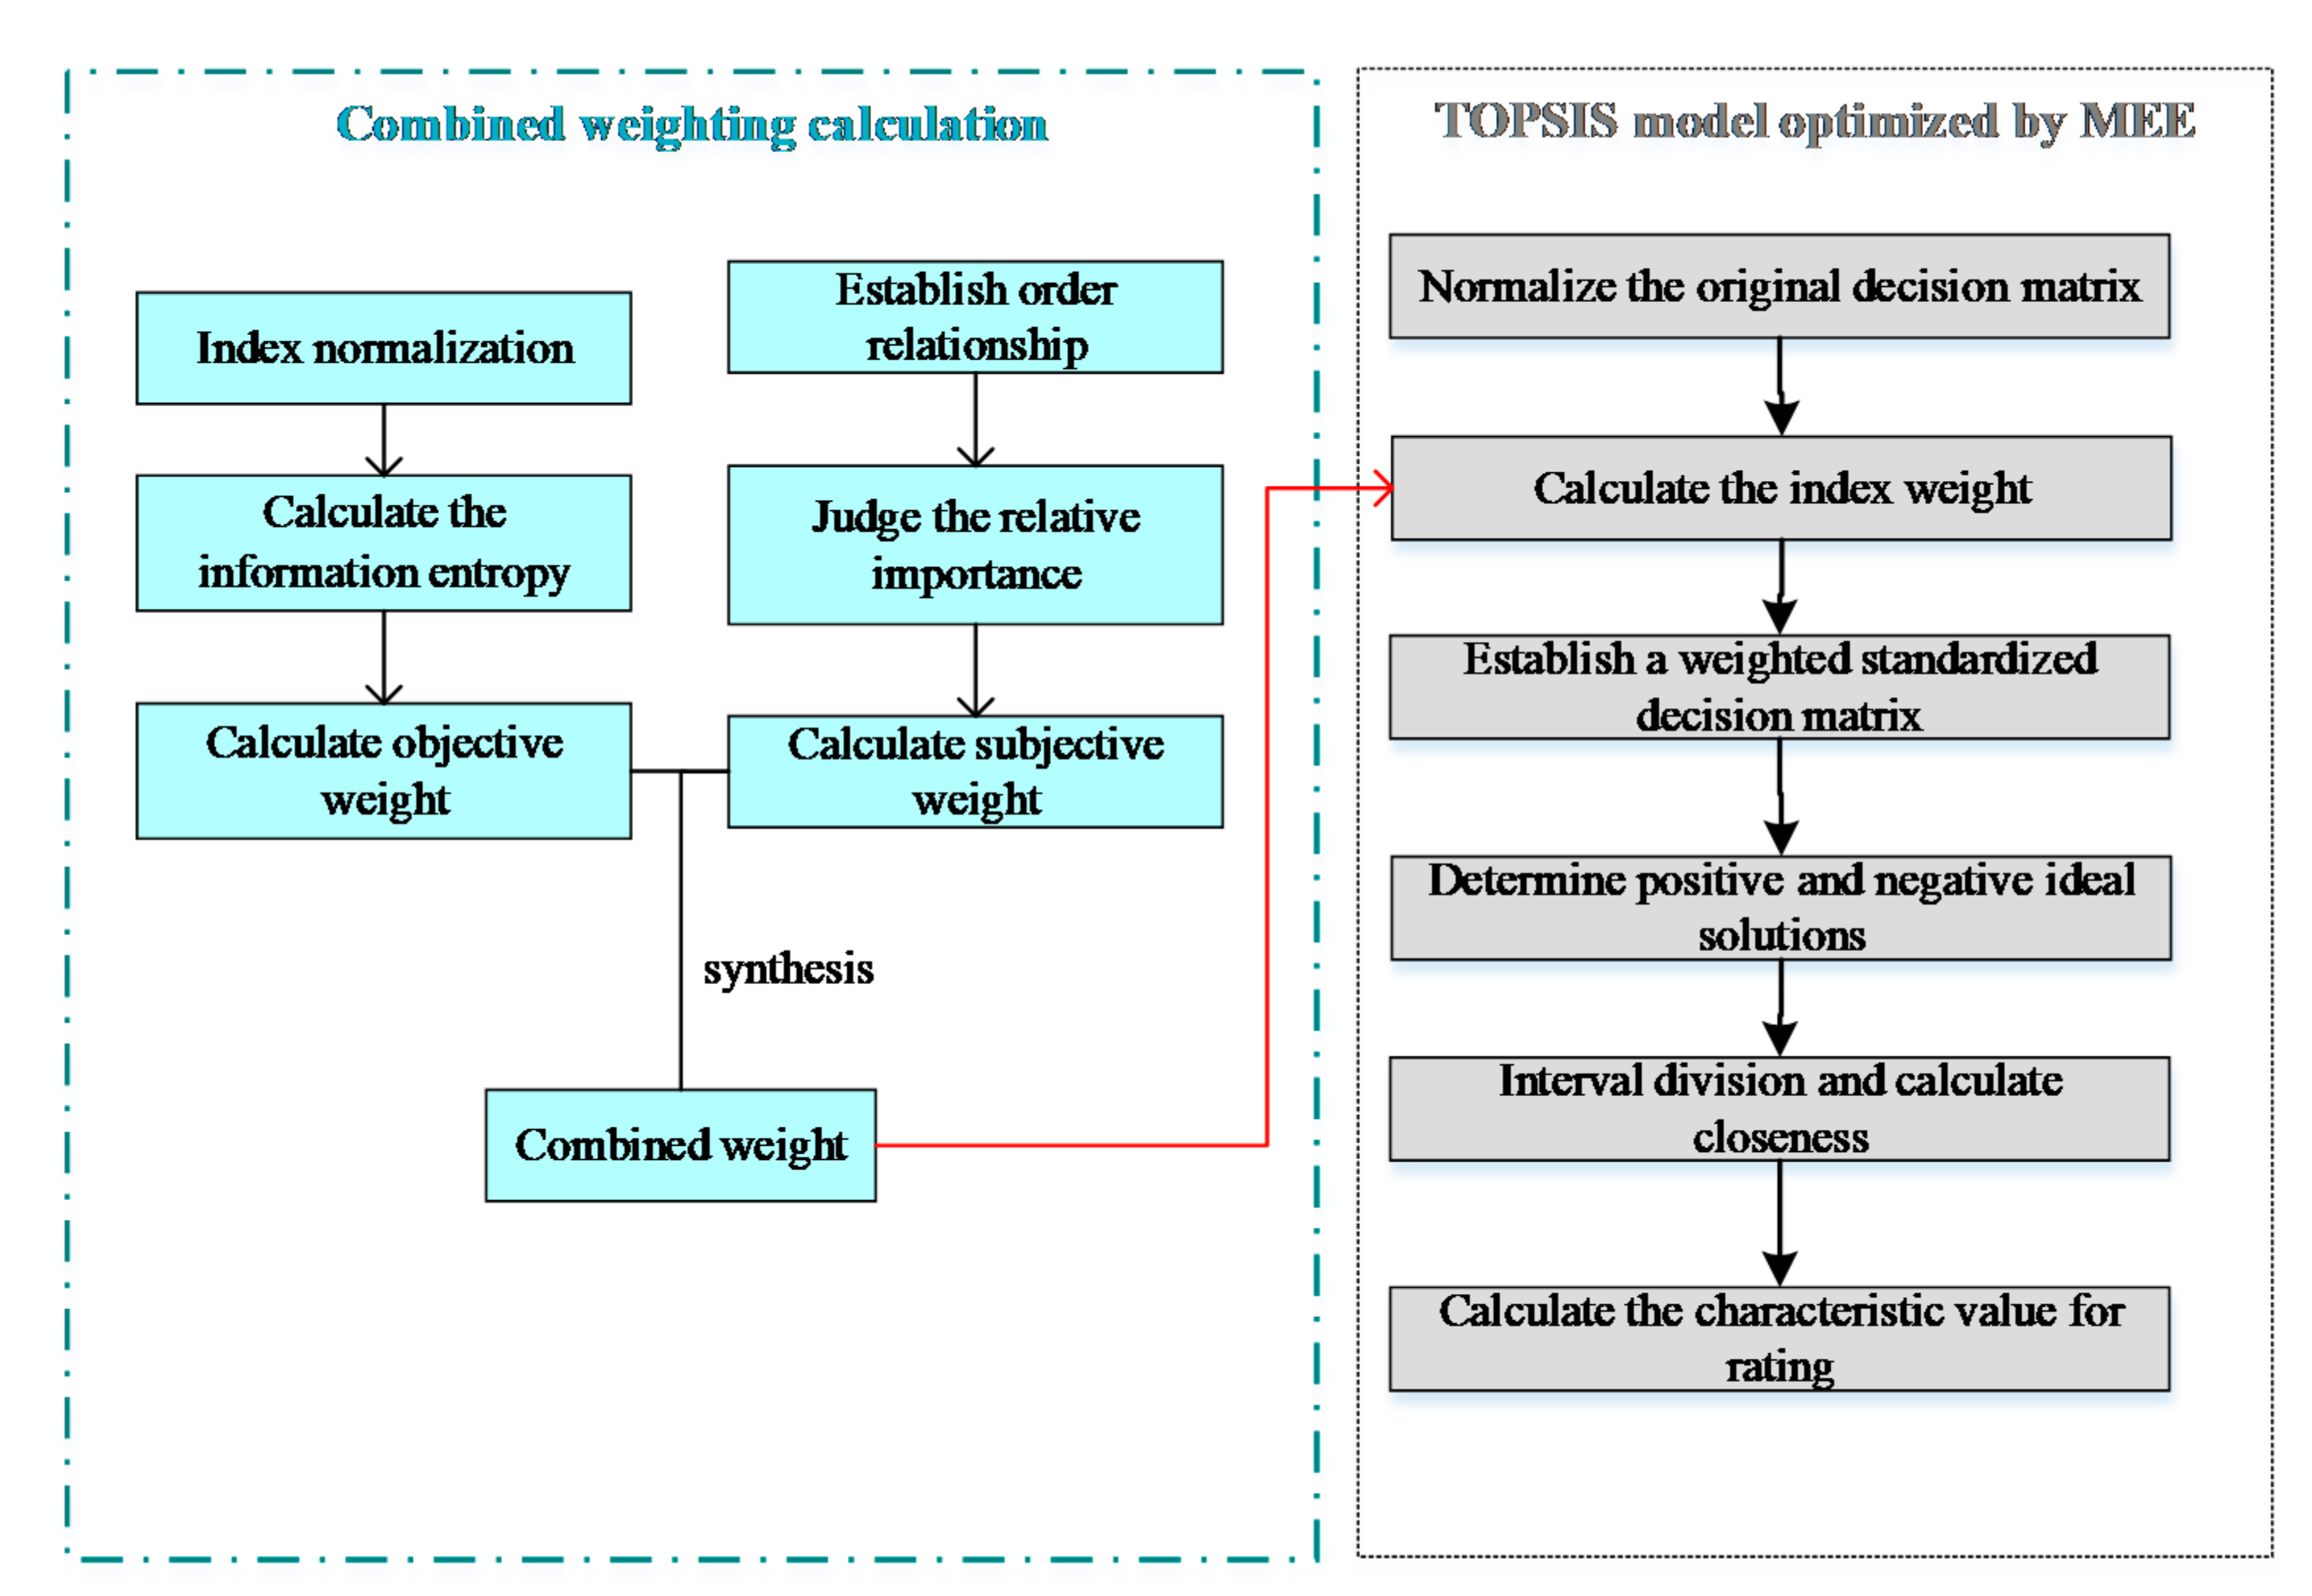
Section 3 builds the indicator weight calculation model based on the entropy weight method and order relation method; Section 4 designs the specific calculation process of the technique for order preference by similarity to ideal solution (TOPSIS) optimized by the matter-element extension (MEE); 
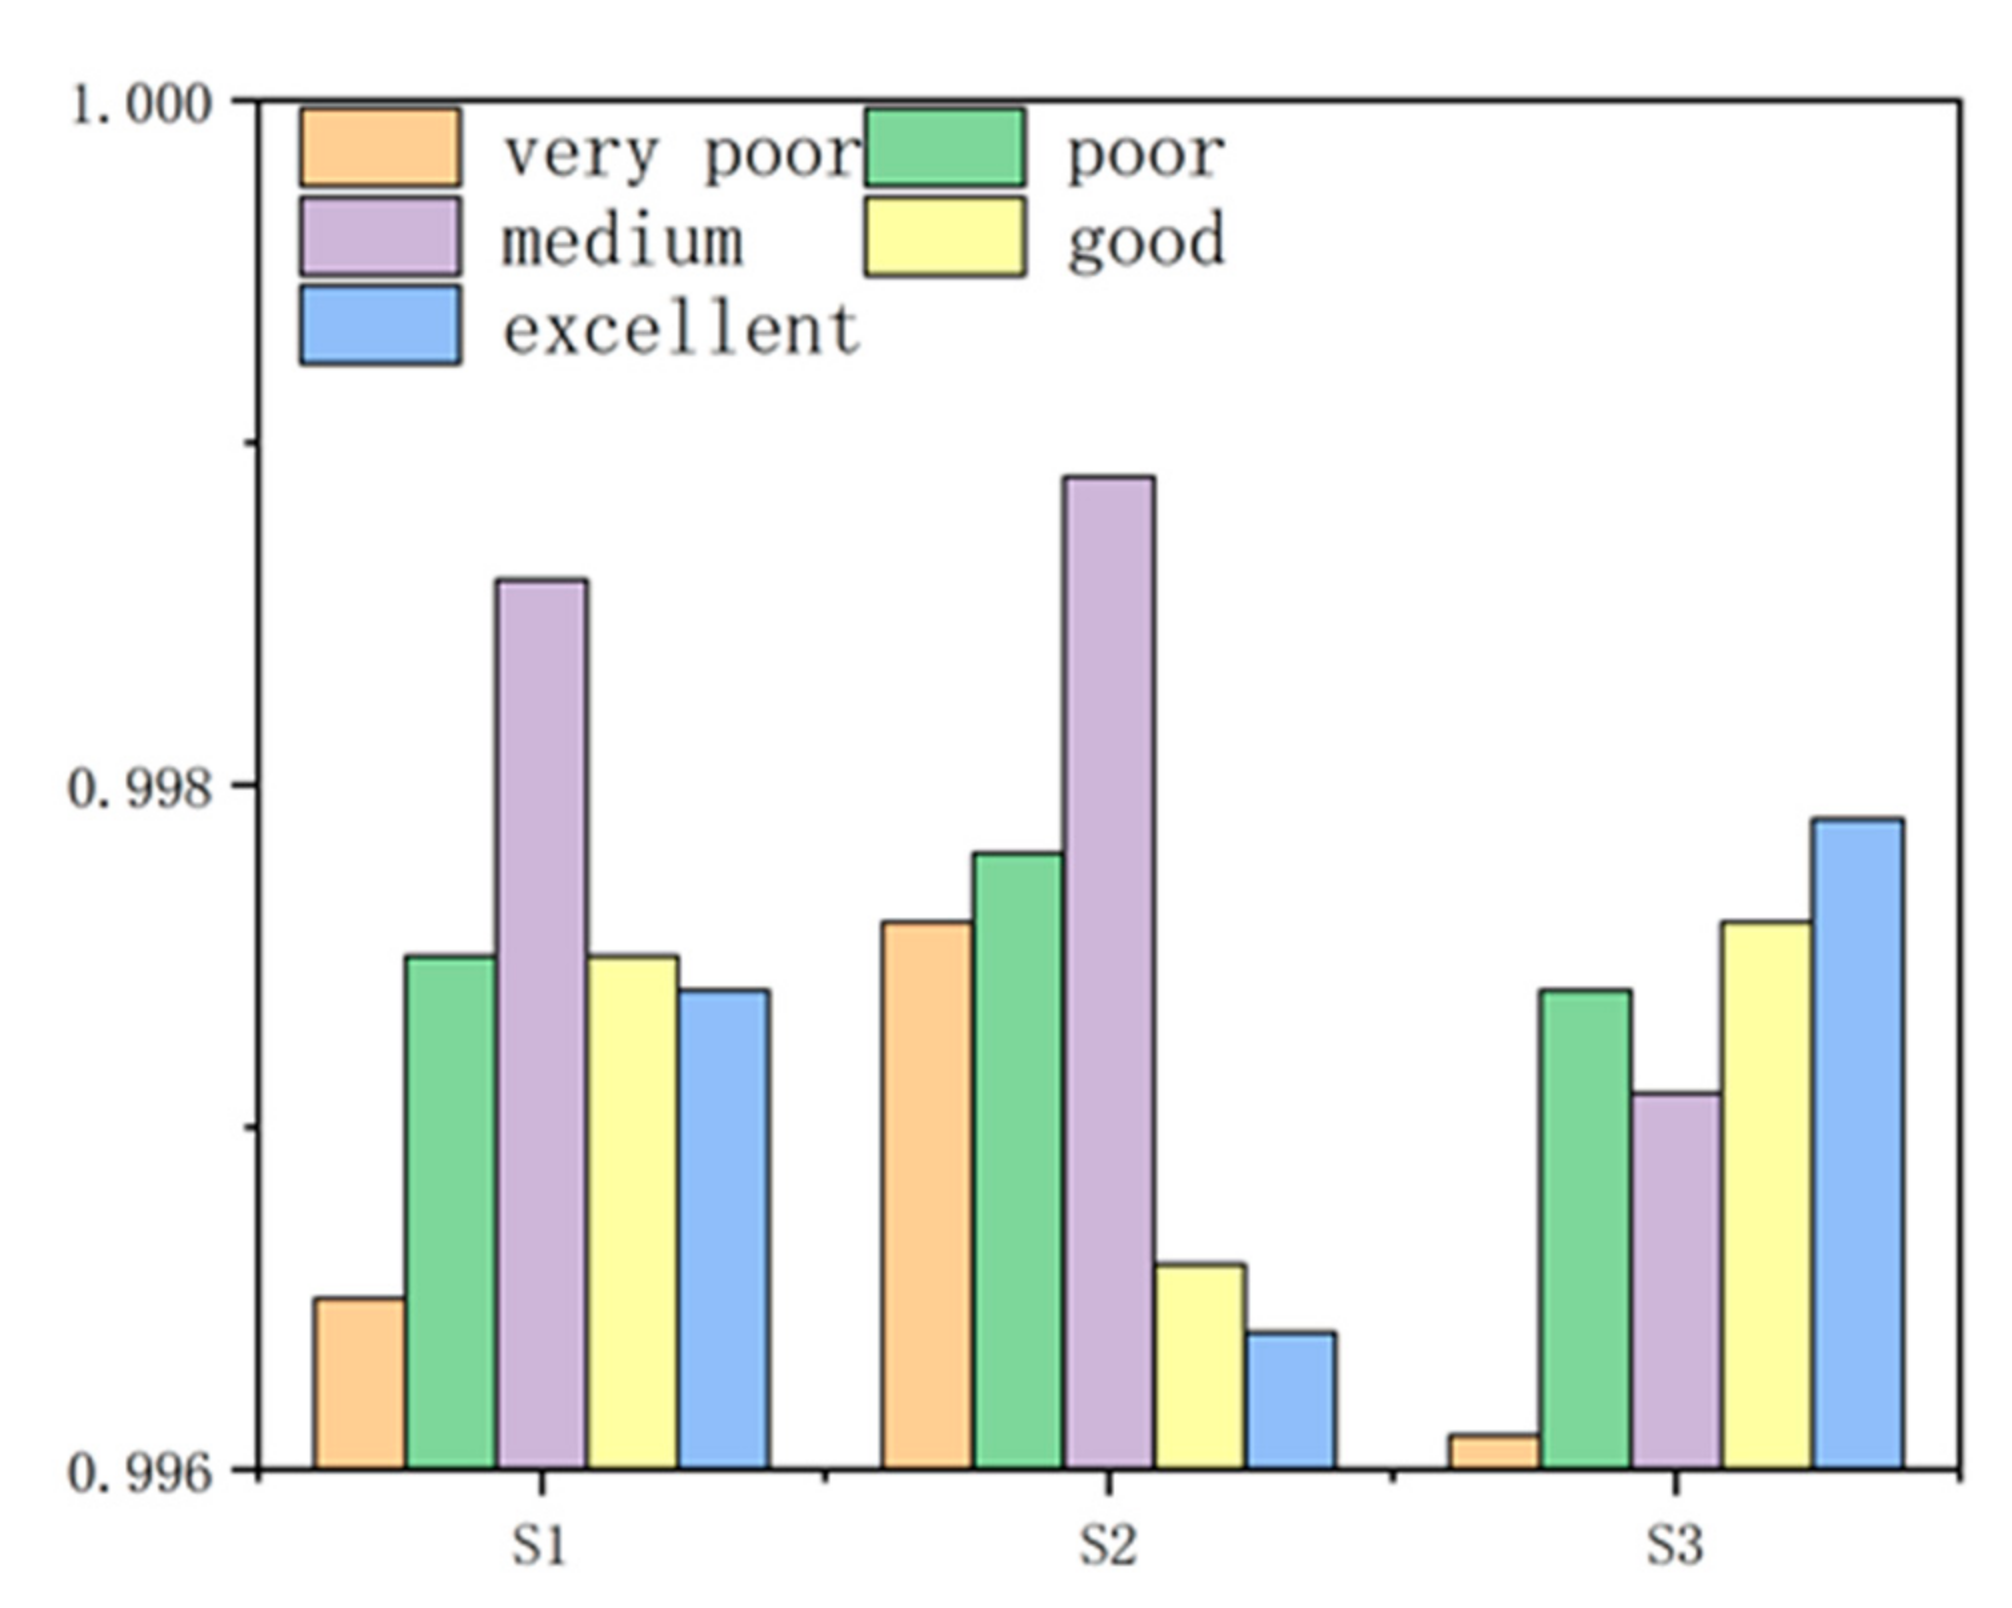
Section 5 conducts an empirical analysis and makes comparative results discussion and Appendix A summarizes the research results of this paper.

1.2. Innovation

The main innovations include three aspects.
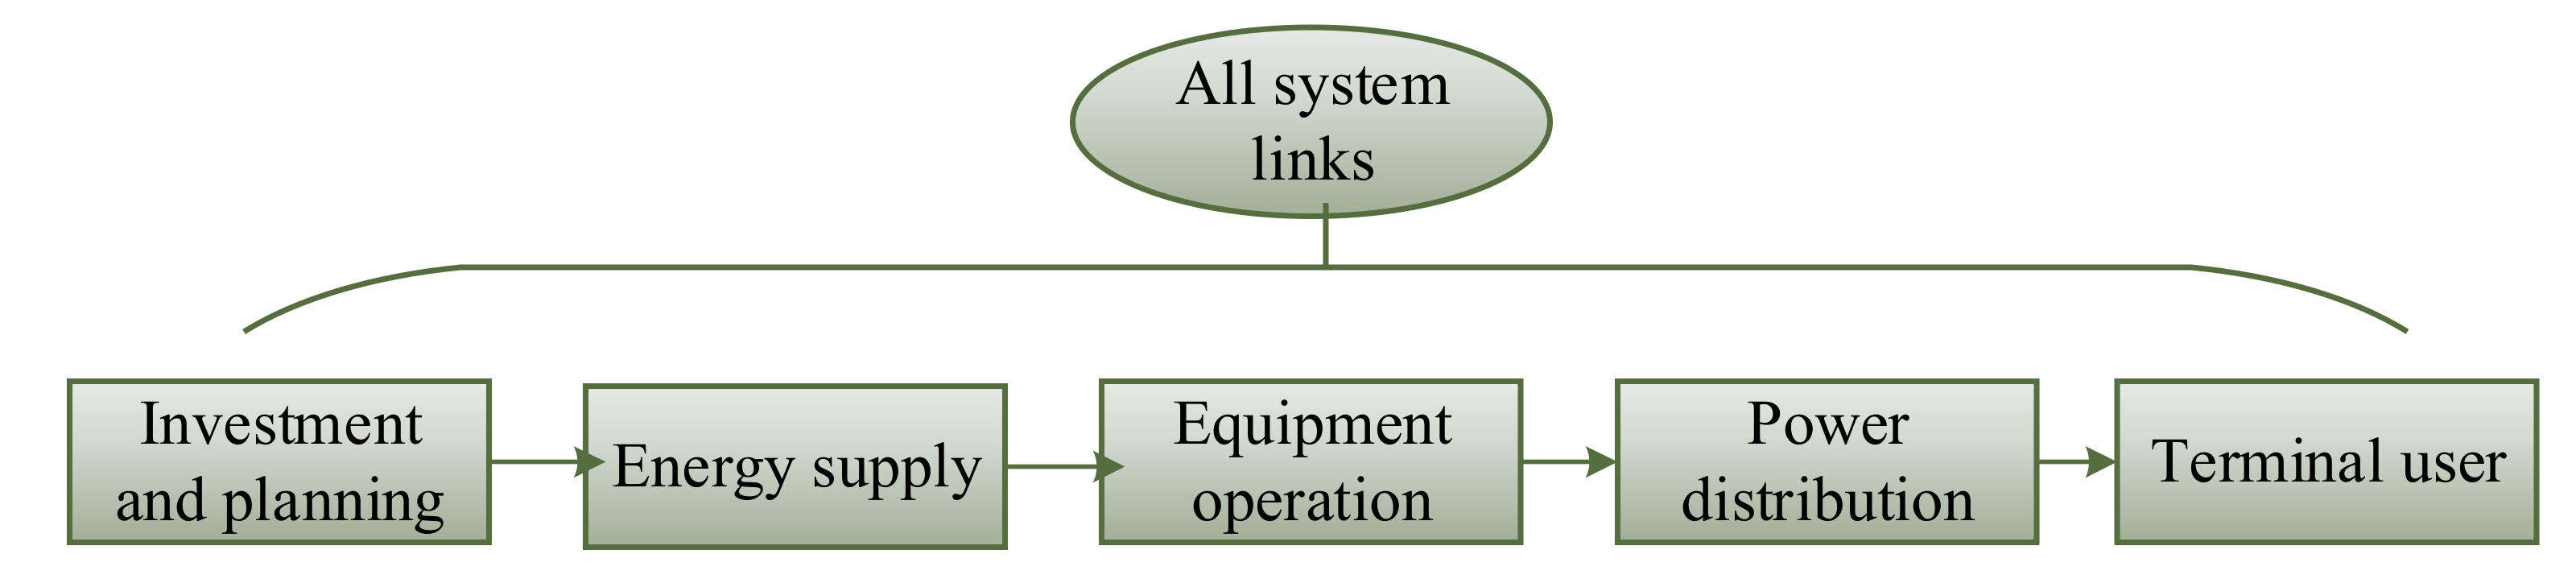
(1) Designing a standard comprehensive benefit indicator system for IEGES. This paper proposes all operational chains including planning investment, supply, operation, power distribution and terminal users to refine indicators. Then, constructing an indicator system of economic, environmental and social benefits of IEGES.
(2) Establishing a variable weighting model based on the order relation method and entropy weight method. Since the comprehensive evaluation indicator system for IEGES is still in the preliminary research stage, a comprehensive weight determination method combining objective and supervisor must be adopted. In addition, this paper uses the order relation method to solve the problem of inaccuracy caused by cross-meaning and mutual influence between indicators.
(3) Constructing IEGES comprehensive benefit evaluation model. The TOPSIS model can only sort the evaluation results. It can not directly reflect comprehensive benefit accuracy. Based on the proximity of each indicator to each grade interval, this paper applies the matter-element extension method to achieve refined evaluation of comprehensive benefits.

2. Establish the Standard Comprehensive Benefit Evaluation Indicator System of IEGES

2.1. Construction of the Standard Comprehensive Benefit Indicator System

Throughout the entire chains of the IEGES, including investment and planning, energy supply, equipment operation, power distribution and terminal user, which is helpful to improve the comprehensive benefit level of the IEGES. The full operation of the IEGES is shown in Figure 1.
This paper forms a comprehensive benefit evaluation indicator system, as shown in Figure 2, the definition and description of all indicators are shown in Table A1 in Appendix A.

2.2. Construction of the Indicator Weight Combination Model

2.2.1. Indicator Preprocessing

In this paper, according to the least square method, each indicator in Figure 2 is tested. Highly correlated indicators are eliminated to reduce duplication. Suppose there are several evaluation indicators ( I 1 , I 2 , I n ). According to the indicator classification, each subtarget layer contains several indicators. Perform correlation test on each subtarget layer according to the least square method to construct a correlation test matrix R:
R = r 11 r 12 r 1 k r 21 r 21 r 2 k r k 1 r k 2 r k k
where, r α β ( α , β = 1 , 2 k ) is the correlation coefficient, the specific calculation is shown in Formula (2):
r α β = ( I α I α ) ( I β I β ) ( I α I α ) 2 ( I β I β ) 2
where, α = β , r α β = 1 , r α β = r β α . Assuming that the principle of correlation judgment satisfied the content of Table 1, if the correlation coefficient of the two indicators was less than 0.3, the data of the two indicators were considered independent; if the correlation coefficient of the data of the two indicators was greater than 0.8, then remove the indicator. Finally, we could get the indicators that meet the relevance requirements.
It can be seen from the indicator system in Table 2 that the indicator included extremely large indicators and extremely small indicators. Before the evaluation, the dimensionless treatment was carried out, namely:
y i j = x i j m j M j m j y i j = M j x i j M j m j
where, x i j ( i = 1 , 2 , 3 j = 1 , 2 , , 22 ) is the value of indicator. M j is the upper limit of all actual data, namely, M j = max i { x i j } , and m j Is the lower limit of all actual data, namely, m j = min i { x i j } .

2.2.2. Combined Weight Preprocessing

In this paper, the combination weighting method was used to weight all indicators. Based on entropy weight method and order relation method, the final weight of each evaluation indicator in Figure 2 was determined.
The calculation process of the combined weighting method of the comprehensive benefit evaluation indicator of the IEGES is as follows:
Step 1: Collect data and construct an evaluation matrix.
Construct a comprehensive benefit evaluation matrix for the IEGES, namely:
R = x 11 x 12 x 1 j x 21 x 22 x 2 j x i 1 x i 2 x i j
where, x i j ( i = 1 , 2 ... , m j = 1 , 2 ... , n ) is the value of indicator.
Step 2: Indicator preprocessing.
Step 3: Calculate the information entropy of the indicator i , namely:
E i = j = 1 n x i j ln x i j ln n
when x i j = 0 , x i j ln x i j = 0 .
Step 4: Use the entropy weight method to calculate the objective weight ω o , i of each indicator, namely:
ω o , i = 1 E i m i = 1 m E i i = 1 , 2 , , m
Step 5: Establish an order relationship.
Sort the indicators according to subjective opinions of experts. x 1 * is the most important indicator, finally, the remaining indicators are marked as x m * . If the ranking relationship is x 1 * > x 2 * > > x m * , it can be judged that a unique sequence relationship is established among the indicators.
Step 6: Determine the relative importance of adjacent indicators.
The relative importance p i is the ratio of the importance, namely:
w i 1 w i = p i ( i = 1 , 2 ... , m )
where, w i is the ranking weight and p i is determined according to the principles that is shown in Table 2.
Step 7: Calculate the weight coefficient ω s , i , namely,
ω s , i = 1 + i = 2 m m r i 1 ;   ω s , i 1 = r i ω s , i ( i = 1 , 2 ... , m )
Step 8: In order to synthesize the subjective weight ω s , which is calculated by the order relation method and the objective weight ω o , which is calculated by the entropy weight method. The combined weight ω c is ensured, namely:
w c = λ ω s + ( 1 λ ) ω o
where, the proportion of subjective weight λ is determined by experts.

3. Comprehensive Evaluation Model Based on TOPSIS Optimized by MEE

3.1. Technique for Order Preference by Similarity to Ideal Solution (TOPSIS)

TOPSIS can calculate the distance between each group of programs and the best and worst programs, and use the relative closeness of ideal points as the basis for comprehensive evaluation. The comprehensive benefit of the IEGES must be different. The comprehensive benefit shows a certain degree of uncertainty, which is suitable for the TOPSIS model. The specific calculation steps of TOPSIS model are as follows:
Step 1: Form the original decision matrix ( X i j ) m × n .
Step 2: Calculate the combined weight ω c .
Step 3: Weight the original decision matrix ( X i j ) m × n and the combined weight ω c to obtain a normalized matrix V , namely:
V = ( x i j ) m × n = ω 1 X 11 ω 1 X 21 ω 1 X m 1 ω 2 X 12 ω 2 X 22 ω 2 X m 2         ω n X 1 n ω n X 2 n ω n X m n
Step 4: Calculate positive ideal point x j * + and negative ideal point x j * , namely:
x j * + = max ( x i j ) j J 1 min ( x i j ) j J 2 x j * = min ( x i j ) j J 1 max ( x i j ) j J 2
where, J 1 is a set of extremely large indicators and J 2 is a set of extremely small indicators.
Step 5: Calculate positive ideal distance Z i + and the negative ideal distance Z i , namely:
Z i + = j = 1 n ( x i j x j * + ) 2 Z i = j = 1 n ( x i j x j * ) 2
Step 6: Calculate the relative closeness.
Calculate the relative closeness of the TOPSIS model and sort each scheme according to this evaluation value, namely:
D i = Z i Z i + + Z i

3.2. Matter-Element Extension (MEE)

The matter-element extension model (MEE) can classify each indicator, determine the upper and lower limits of each level to establish a section domain and a classic domain respectively. The calculation steps of the matter-element extension model are as follows:
Step 1: Determine the node-item matrix.
The matter element is composed of three elements: things U , features C and the magnitude M , which is written as R = ( U , C , M ) . In the model of comprehensive benefit evaluation of IEGES, the comprehensive benefit value is the matter element.
U B is the standard matter element. C i is characteristics and x p i = a p i , b p i is the standard value range, which are extended to form a range of matter elements. Suppose c u , ( u = 1 , 2 , ...... ) is the indicator for evaluating the comprehensive benefit of IEGES. The corresponding value range of the indicator for the comprehensive benefit of IEGES is x j = a u , b u .
R L = U c 1 [ a 1 , b 1 ] c 2 [ a 2 , b 2 ] c u [ a u , b u ]
where, x B i x p i ( i = 1 , 2 , , n ) .
Step 2: Calculate the correlation function K j ( s , i ) and correlation degree K j ( s ) of each indicator.
The correlation function represents the value range of the matter element, which can quantitatively and objectively express the process of the quantity change of the matter element.
K ( x ) = ρ ( x , x 0 ) x 0 , x x 0 ρ ( x , x 0 ) ρ ( x , x n ) ρ ( x , x 0 ) , x x 0 , ρ ( x , x n ) ρ ( x , x 0 ) ρ ( x , x 0 ) , x x 0 , ρ ( x , x n ) = ρ ( x , x 0 )
where, j is the sample point, s is the comprehensive benefit level, i represents the indicator and x 0 = b a , x 0 is a module of bounded intervals, x 0 = a , b .
ρ ( x , x 0 ) and ρ ( x , x n ) are the distance from any point x on the real axis to the interval x 0 and x n , namely:
ρ ( x , x 0 ) = x 1 2 ( a + b ) 1 2 ( b a ) ρ ( x , x n ) = x 1 2 ( c + d ) 1 2 ( d c )
The degree of relevance K j ( s ) is the degree of membership of a comprehensive benefit level s for the sample point j , namely:
K j ( s ) = i = 1 n ω c , i K i ( j , s )
where, ω c , i is the weight of indicator x i and K i ( j , s ) is the value of the correlation function.
Step 3: Sort comprehensive relevance.
Sort the comprehensive correlation degree K j ( s ) , and the level corresponding to the maximum value is the comprehensive benefit of the IEGES. For example, if K j = max K j ( s ) , the comprehensive benefit level of the IEGES should belong to the comprehensive benefit level s .

3.3. Overall Steps of the Comprehensive Evaluation Model

This paper used the MEE to improve the TOPSIS model. The comprehensive benefit evaluation model of the IEGES was constructed. The implementation process is as follows:
Step 1: Use the weight combination method to obtain the final weight ω c .
Step 2: According to the TOPSIS model, positive ideal distance Z i + and the negative ideal distance Z i are obtained, and the relative closeness D i of each scheme is calculated.
Step 3: Divide the extreme value by positive ideal distance Z i + and the negative ideal distance Z i into different layers, and the interval range of each layer is U j t = u j t 1 , u j t 2 , j = 1 , 2 , , n ; t = 1 , 2 , , N .
Step 4: Calculate the closeness D ( N i ) and weighted closeness K j ( N i ) of each element and each interval.
D ( N i ) = z i j u j t 1 + u j t 2 2 u j t 2 u j t 1 2 K j ( N i ) = 1 j = 1 n w j D ( N i )
Step 5: Calculate the eigenvalues.
In order to achieve accurate evaluation of comprehensive benefits, calculate eigenvalues i of weighted closeness K j ( N i ) to avoid multiple schemes belong to the same level.
K ¯ j ( N i ) = K j ( N i ) min K ( N i ) max K ( N i ) min K ( N i )
i = j = 1 m s K ¯ j ( N i ) j = 1 m K ¯ j ( N i )
In summary, the specific evaluation process of the comprehensive benefit evaluation model of the IEGES constructed in this paper is shown in Figure 3.

4. Empirical Analysis

4.1. Project Introduction

In order to verify the practicability and effectiveness of the established IEGES comprehensive benefit evaluation model, this paper intended to select three IEGES as the object system to carry out analysis of examples. In order to study comprehensive energy operation and development of IEGES in China, the research examples were concentrated in the Beijing–Tianjin–Hebei region. Considering data acquisition and other objective factors, Beijing Yanqing IEGES, Tianjin Eco-city No. 2 Energy Station and Hebei IEGES III were selected. Each IEGES was used as a case for comprehensive evaluation. The brief introduction and basic data of each IEGES are as follows.
(1) Beijing Yanqing IEGES
Beijing Yanqing IEGES is the only government-funded construction project in Beijing. The Beijing Yanqing IEGES project is located in the new energy industrial base of the Badaling Economic Development Zone in Beijing. The photovoltaic power generation was 1.8 MW, wind power generation was 60 kW and various energy storage systems were 2.5 MW.
(2) Tianjin Eco-city No. 2 Energy Station
Tianjin Eco-city No. 2 Energy Station uses the latest technologies such as the smart grid, Internet, big data and smart city to carry out multilevel energy comprehensive coordination projects, including photovoltaic power generation, gas power generation and energy storage system, which achieved an on-site photovoltaic consumption rate of 100%.
(3) Hebei IEGES III
Hebei IEGES III is the first IEGES demonstration project in China. Photovoltaic power generation was 190 kW, wind power generation was 250 kW and super capacitor energy storage was 100 kW. Compared with traditional air conditioners, it saved 620,000 kWh of electricity annually. Based on the calculation of 0.38 kg/kWh of carbon dioxide emissions from thermal power plants, it was estimated that the entire system could save 300 tons of standard coal annually and reduced carbon dioxide emissions by approximately 710 tons.
The initial data collection and data preprocessing of the three IEGES projects are shown in Table A2 and Table A3 in Appendix A.

4.2. Evaluation Implementation Process

This paper first used the order relation method to determine the weight of each layer of indicators, and then calculated the level of each indicator, and finally combined them in a hierarchical structure to get the weight of each indicator on the overall goal.
Firstly, the order relationship of the three types of target-level evaluation elements was: A 1 > A 2 > A 3 , recorded as A 1 > A 2 > A 3 . The assignment of p k was p 2 = w 1 * / w 2 * = 1.58 ,   p 3 = w 2 * / w 3 * = 1.64 . Calculate weight coefficient w k , namely:
w 1 = 0.496 , w 2 = 0.313 , w 3 = 0.191
In addition, after the order relationship of the target layer was determined, the order relationship of the indicator layer was judged.
The weight analysis of comprehensive benefits and the assignment of p k were as shown in Table 3.
Finally, the ranking weights of each evaluation indicator were synthesized in a hierarchical structure, and the calculation results are shown in Table 4.
According to the calculation steps of the entropy weight method, the objective weight of each comprehensive benefit evaluation indicator could be obtained. After expert discussion, set λ = 0.5 . Final weight distribution of the comprehensive benefit indicator system of the IEGES is shown in Table 5.

4.3. Comprehensive Evaluation Results

Weight the original decision matrix ( X i j ) m × n and the combined weight ω c to obtain a normalized matrix V . Based on the weight of the comprehensive benefit indicator of the IEGES in Table 6, a weighted standardized decision matrix V can be obtained, namely:
V = 0.010 0.003 0.002 0.001 0.011 0.004 0.002 0.002 0.009 0.004 0.002 0.002
Using the maximum and minimum values of each component element in the weighted standardized decision matrix V , positive ideal distance Z + and negative ideal distance Z can be obtained, namely:
Z + = ( 0.0108 , 0.0041 , 0.0024 , 0.0246 , 0.0104 , 0.0002 , 0.0182 , 0.0192 , 0.0009 , 0.0085 , 0.2839 , 0.0016 , 0.0036 , 0.0017 , 0.0014 , 0.0044 , 0.0015 , 0.1682 , 0.0870 , 0.0018 ) Z = ( 0.0088 , 0.0034 , 0.0016 , 0.0168 , 0.0099 , 0.0001 , 0.0175 , 0.0180 , 0.0008 , 0.0075 , 0.2607 , 0.0011 , 0.0029 , 0.0015 , 0.0012 , 0.0038 , 0.0012 , 0.1484 , 0.0707 , 0.0012 )
Take indicator C1 as an example, set N = 5 . The interval composed of positive and negative ideal distance was divided into five levels, namely: very poor, poor, medium, good, and excellent. The positive and negative ideal values were z + = 0.0108 and z = 0.0088 . The interval was divided into:
S 11 = 0.0088 , 0.0092 S 12 = 0.0092 , 0.0096 S 13 = 0.0096 , 0.0100 S 14 = 0.0100 , 0.0104 S 15 = 0.0104 , 0.0108
Other indicators were also divided into equal distances, and the closeness between the matrix V and the five levels was calculated. The results were as follows:
D ( N 1 = 0.0008 0.0001 0.0001 0.0001 0.0018 0.0004 0.0007 0.0004 0.0002 0.0006 0.0005 0.0005 D ( N 2 = 0.0004 0.0002 0.0002 0.0002 0.0014 0.0002 0.0006 0.0003 0.0006 0.0005 0.0004 0.0004 D ( N 3 = 0.0000 0.0004 0.0004 0.0003 0.0010 0.0001 0.0004 0.0001 0.0010 0.0004 0.0002 0.0003 D ( N 4 = 0.0004 0.0005 0.0006 0.0004 0.0006 0.0000 0.0002 0.0000 0.0014 0.0002 0.0001 0.0002 D ( N 5 = 0.0008 0.0006 0.0007 0.0005 0.0002 0.0002 0.0001 0.0001 0.0018 0.0001 0.0001 0.0001
Based on the closeness of each indicator, the weighted closeness of the comprehensive benefits of the three IEGES ( S 1 , S 2 , S 3 ) relative to the five evaluation levels were calculated respectively, namely:
K ( S 1 ) = [ 0.9965 , 0.9975 , 0.9986 , 0.9975 , 0.9974 ] K ( S 2 ) = [ 0.9976 , 0.9978 , 0.9989 , 0.9966 , 0.9964 ] K ( S 3 ) = [ 0.9961 , 0.9974 , 0.9971 , 0.9976 , 0.9979 ]
The weighted closeness of each project can be intuitively shown in Figure 4, namely:
.
Taking S3 as an example of normalization, and calculate the eigenvalues of S3.
K ¯ j ( S 3 ) = [ 0.3054 , 0.6527 , 1.0000 , 0.5635 , 0.0000 ] s 3 = 3.8166
In summary, the eigenvalues of all items and the final evaluation results are shown in Table 6.
As we can see in Figure 4, the comprehensive benefit levels of the three IEGES were medium, medium, and excellent. Since the comprehensive evaluation levels of S1 and S2 were both medium based on the TOPSIS model, it was necessary to further calculate the eigenvalues to achieve accurate division of the evaluation levels. Therefore, the original TPOSIS model could not effectively applied to the comprehensive benefit evaluation of IEGES, and the accuracy of original TPOSIS model was insufficient. Therefore, the evaluation results could not achieve the accuracy of scientific evaluation.
It can be seen from Table 6 that the final ranking of the comprehensive benefit level of the IEGES was S 3 > S 2 > S 1 . Based on the TOPSIS model, the comprehensive benefit levels of S1 and S2 were the same and could not be further divided. The eigenvalue of the MEE method was applied to the original TOPSIS model. The eigenvalue of S2 was greater than that of S1, so the comprehensive benefit of S2 was higher than that of S1. Compared with the original TOPSIS model, the TOPSIS model optimized by MEE could better realize the scientific processing of data, which was difficult to quantify, and the comprehensive evaluation results would be more reliable and effective.

5. Conclusions

Based on the study of the benefit evaluation system of the integrated energy system, this paper constructed a comprehensive benefit evaluation indicator system and proposed a novel evaluation model of IEGES.

5.1. Our Contributions

The research contributions are as follows:
(1) Through comprehensive analysis of the entire chain of the IEGES, the economic benefit, environmental benefit and social benefit indicators were extracted and the comprehensive benefit evaluation indicator system including net present value (C1), distribution network load rate (C9), clean electricity ratio (C16), etc., was established.
(2) A combination method of the order relation method and entropy weight method was used to calculate the comprehensive weight of the indicator. Final weight distribution of the comprehensive benefit indicator system was obtained in the paper. Additionally, we proved that the combination method could avoid the disadvantage of single weighting methods.
(3) We applied the eigenvalues of MEE model into the original TOPSIS model. Beijing Yanqing IEGES, Tianjin Eco-city No. 2 Energy Station and Hebei IEGES III were selected as the empirical projects. Based on the closeness of each indicator, the weighted closeness of the comprehensive benefits of S 1 was K ( S 1 ) = [ 0.9965 , 0.9975 , 0.9986 , 0.9975 , 0.9974 ] , S 2 was K ( S 2 ) = [ 0.9976 , 0.9978 , 0.9989 , 0.9966 , 0.9964 ] and S 3 was K ( S 3 ) = [ 0.9961 , 0.9974 , 0.9971 , 0.9976 , 0.9979 ] respectively, which means the evaluation result of S1 and S2 outputted by TOPSIS were both medium. Finally, the eigenvalues outputted by MEE were 3.1224, 3.2436, and 3.8166 separately, which showed that the comprehensive benefit of Hebei IEGES III was the best, and Tianjin Eco-city No. 2 Energy Station performed worse than Hebei IEGES III while Beijing Yanqing IEGES was the worst. Therefore, the investment and operation mode of Hebei IEGES III should be studied and promoted in the further.

5.2. Limitations of the Study

Compared with the single weight method and single evaluation model, the evaluation model proposed in this paper creatively combined expert evaluation information with IEGES objective information to make the comprehensive evaluation results more credible and effective. However, our calculation process was very complicated, and detailed errors were prone to occur. In the following research, the intelligent algorithm will be combined with the traditional comprehensive evaluation model, which will simplify the expert scoring and calculation process, help to quickly evaluate a variety of similar projects and the evaluation accuracy will also be greatly improved. This is the next research direction of this paper.

Author Contributions

In this research activity, data collection and preprocessing phase, H.C.; model constructing, empirical research and manuscript preparation, P.J.; results analysis and discussion M.Z. All authors have read and agreed to the published version of the manuscript.

Funding

This research was funded by (Beijing Municipal Social Science Foundation) grant number (18JDGLB037).

Institutional Review Board Statement

Not applicable.

Informed Consent Statement

Not applicable.

Data Availability Statement

Data sharing is not applicable. No new data were created or analyzed in this study.

Conflicts of Interest

The authors declare no conflict of interest.

Appendix A

Table A1. Explanation of comprehensive benefit evaluation indicator system of the IEGES.
IndicatorCalculation FormulaExplanation
Net present value (C1) NPV = ( C i C 0 ) ( 1 + i ) t C i is the expected cash flow in each period and C 0 is the initial investment expenditure.
Dynamic investment payback period (C2) P t = ( Y 1 ) + i = 1 t 1 A i A i Y is the number of years in which the present value of the cumula-tive net cash flow has a positive value, i = 1 t 1 A i is the present value of the cumulative net cash flow in the previous year, and A i
System energy supply rate (C3) S p = 1 t = 1 T P S ( t ) P L ( t ) P S ( t ) is the load shortage; P L ( t ) is the total load.
Primary energy utilization (C4) ψ = Q outpt Q Q outpt is energy output; Q is primary energy consumption.
Equipment utilization (C5) σ = 1 N T 0 n = 1 N T n T 0 is the planned working time for the unit, T n is the actual working time of the nth device in unit time.
Operation and maintenance fee (C6) C rc = C O + M + C fuel C O + M is the annual operating cost of the main equipment and C fuel is the annual fuel cost.
Energy conversion efficiency (C7) I = Q H λ H + E λ e i ( W λ i ) Q H E is the output power of the gas CHP unit. λ H and λ e are the corresponding energy quality coefficients [25], and W is the total amount of the first energy consumed by heat and electric energy. λ i is energy quality coefficient of an energy source.
Equipment life (C8)//
Distribution network load rate (C9) ε e = P real e P n e P real e is the actual capacity in the distribution network circuit and P n e is the rated capacity of the power system.
Natural gas pipeline capacity (C10) ε g = P real g P n g P real g is the actual capacity in the natural gas pipeline and P n g is the rated capacity of the natural gas system.
Active power loss (C11) Δ P = Δ P L + Δ P V + Δ Q 3.6 × 10 3 Δ P is the total active power loss, Δ P L is the active power loss of the transmission line, Δ P V is the active power loss of the transformer and other equipment, and Δ Q is the heat loss during the transmission of heat energy.
Peak and valley filling rate of power grid (C12) S ep = t = 1 T P 1 max ( t ) P 2 max ( t ) P 1 max ( t ) P 1 max ( t ) is the system load when P2G equipment is not in use, and P 2 max ( t ) is the system load after P2G equipment is in use.
Routine unit negative reserve transfer rate (C13) ζ gen = P gen , 1 P gen , 2 P gen , 1 P gen , 1 is the total amount of negative backup provided by conventional units when P2G equipment does not provide backup services. P gen , 2 is the total amount of negative backup provided by conventional units when providing backup services for P2G equipment.
Qualified rate of power supply voltage (C14) ϕ = T p T T p is the time when the voltage is within the qualified range, and T is the total operating time of the system
Energy quality (C15)/
Clean electricity ratio (C16) p re = Q t Q coal Q t Q t is the total output of the unit, Q coal is the coal power unit
Total carbon emissions (C17) E C = i = 1 n c C , i f E + i = 1 n c T , i f E c C , i and c T , i are respectively the coal consumption or natural gas consumption of the i-th generating unit in the dispatching cycle, and f E is the carbon emissions from the complete combustion of standard coal or natural gas per unit
Wind curtailment rate (C18) δ = P w , total t = 1 T k Ω w P P 2 G P w , total P w , total is the total output of the wind turbine, P P 2 G is P2G active power, and Ω w is the set of wind turbine
Proportion of active peak load users (C19) π = H i w H i H i w is users who actively participate in peak load reduction, H i is the amount of system users.
User satisfaction (C20)//
Number of jobs provided (C21) Ψ = A + κ GDP % Β A is the number of direct jobs and   Β is the number of indirect jobs.   κ / GDP % is the employment elasticity coefficient,   κ is the growth rate of the number of employees, and   GDP % is the GDP growth rate.
Regional economic development contribution rate (C22) χ = Y GDP Y is the total operating income of the IEGES,   GDP is the regional GDP level.
The initial assignment results of the comprehensive benefit evaluation indicator system for the gas–electricity interconnection are shown in Table A2. Based on Section 4.1, all indicator initial value of Beijing Yanqing IEGES, Tianjin Eco-city No. 2 Energy Station and Hebei IEGES III are shown as follows.
Table A2. Indicator initial value.
IndicatorUnitS1S3S3
C1Ten thousand yuan3165.0558130.0659000.041
C2Year25.00022.00021.000
C3%48.09148.07249.054
C4%86.24097.82189.465
C5%72.32593.42990.268
C6Ten thousand yuan7658.0236660.0931526.078
C7%55.05957.96461.453
C8Year9.45010.41012.940
C9%78.02586.08685.062
C10%4.1084.3345.616
C11KW91.05389.33787.364
C12%4.2302.3782.563
C13%0.0001.4042.492
C14%96.34498.60998.218
C15Mark97.71697.53998.303
C16%76.34292.55895.673
C17Ton10.50387.56491.637
C18KW2.1330.1560.126
C19%9.0228.56813.639
C20Mark67.71790.28892.650
C21Ten thousand31.76333.28445.273
C22%4.7608.4529.812
According to the indicator preprocessing method in the paper, the basic data was standardized, and the evaluation indicator results after the dimensionless quantization were obtained. The specific results are shown in Table A3.
Table A3. Dimensionless data.
IndicatorS1S2S3
C10.3530.5740.971
C20.2360.6380.448
C30.2110.8510.881
C40.3420.3751.000
C50.9040.6250.532
C60.8530.7330.667
C70.4920.4750.421
C80.4690.3420.537
C90. 4150.9850. 263
C100.8920.9200.943
C110.8920.9200.911
C120.7280.5910. 490
C130.000 0.4490.430
C140.4900.5810.594
C150.4140.6830.694
C160.9830.9750.981
C170.2120.1230.244
C180.3240. 5050.113
C190.4400.6710.103
C200.0480. 0730.013
C210.2970. 5430.561
C220.0010.0190.063

References

  1. Li, P.; Xu, W.N.; Zhou, Z.Y.; Li, R. Optimal Operation of Microgrid Based on Improved Gravitational Search Algorithm. Proc. CSEE 2014, 34, 3073–3078. [Google Scholar]
  2. Guandalini, G.; Campanari, S.; Romano, M.C. Power-to-gas plants and gas turbines for improved wind energy dispatchability: Energy and economic assessment. Appl. Energy 2015, 147, 117–130. [Google Scholar] [CrossRef]
  3. Ghosh, S.; Kamalasadan, S. An Energy Function-Based Optimal Control Strategy for Output Stabilization of Integrated DFIG-Flywheel Energy Storage System. IEEE Trans. Smart Grid 2017, 8, 1922–1931. [Google Scholar] [CrossRef]
  4. Telukunta, V.; Pradhan, J.; Agrawal, A.; Singh, M.; Srivani, S.G. Protection challenges under bulk penetration of renewable energy resources in power systems: A review. CSEE J. Power Energy Syst. 2017, 3, 365–379. [Google Scholar] [CrossRef]
  5. Saldarriaga, C.A.; Hincapie, R.A.; Salazar, H. A holistic approach for planning natural gas andelectricity distribution networks. IEEE Trans. Power Syst. 2013, 28, 4052–4063. [Google Scholar] [CrossRef]
  6. Jiang, Y.; Xu, J.; Sun, Y.; Wei, C.; Wang, J.; Liao, S.; Ke, D.; Li, X.; Yang, J.; Peng, X. Coordinated operation of gas-electricity integrated distribution system with multi-CCHP and distributed renewable energy sources. Appl. Energy 2018, 211, 237–248. [Google Scholar] [CrossRef]
  7. Gholizadeh, N.; ahid-Pakdel, M.J.V.; Mohammadiivatloo, B. Enhancement of demand supply’s security using power to gas technology in networked energy hubs. Int. J. Electr. Power Energy Syst. 2019, 109, 83–94. [Google Scholar] [CrossRef]
  8. Boreum, L.; Hyunjun, L.; Sanggyu, K.; Hankwon, L. Stochastic techno-economic analysis of power-to-gas technology for synthetic natural gas production based on renewable H2 cost and CO2 tax credit. J. Energy Storage 2019, 24, 100791. [Google Scholar]
  9. Wang, J.; Li, X.R.; Yang, H.M.; Chen, G. An integration scheme for DES/CCHP Coordinated with power system. Autom. Electr. Power Syst. 2014, 38, 16–21. [Google Scholar]
  10. Jing, Z.; Jiang, X.; Wu, Q.; Tang, W.; Hua, B. Modelling and optimal operation of a small-scale integrated energy based district heating and cooling system. Energy 2014, 73, 399–415. [Google Scholar] [CrossRef]
  11. Gao, Y.; Ai, Q.; Yousif, M.; Wang, X. Source-load-storage consistency collaborative optimization control of flexible DC distribution network considering multi-energy complementarity. Int. J. Electr. Power Energy Syst. 2019, 107, 273–281. [Google Scholar] [CrossRef]
  12. Guan, T.T.; Lin, H.Y.; Sun, Q.; Wennersten, R. Optimal Configuration and operation of multi-energy complementary distributed energy systems. Energy Procedia 2018, 152, 77–82. [Google Scholar] [CrossRef]
  13. Juanwei, C.; Yu, T.; Yue, X.; Xiaohua, C.; Bo, Y.; Baomin, Z. Fast analytical method for reliability evaluation of electricity-gas integrated energy system considering dispatch strategies. Appl. Energy 2019, 242, 260–272. [Google Scholar] [CrossRef]
  14. Wang, J.; Fu, C.; Yang, K.; Zhang, X.-T.; Shi, G.-H.; Zhai, J. Reliability and availability analysis of redundant BCHP (building cooling, heating and power) system. Energy 2013, 61, 531–540. [Google Scholar] [CrossRef]
  15. Nisan, S.; Benzarti, N. A comprehensive economic evaluation of integrated desalination systems using fossil fuelled and nuclear energies and including their environmental costs. Desalination 2008, 229, 125–146. [Google Scholar] [CrossRef]
  16. Rozakis, S.; Soldatos, P.G.; Papadakis, G.; Kyritsis, S.; Papantonis, D. Evaluation of an integrated renewable energy system for electricity generation in rural areas. Energy Policy 1997, 25, 337–347. [Google Scholar] [CrossRef]
  17. El-Emam, R.S.; Dincer, I. Investigation and assessment of a novel solar-driven integrated energy system. Energy Convers. Manag. 2018, 158, 246–255. [Google Scholar] [CrossRef]
  18. Meng, H.; Wang, M.; Aneke, M.C.; Luo, X.; Olumayegun, O.; Liu, X. Technical performance analysis and economic evaluation of a compressed air energy storage system integrated with an organic Rankine cycle. Fuel 2018, 211, 318–330. [Google Scholar] [CrossRef]
  19. Wan, Y.K.; Sadhukhan, J.; Ng, D.K. Techno-economic evaluations for feasibility of sago-based biorefinery, Part 2: Integrated bioethanol production and energy systems. Chem. Eng. Res. Des. 2016, 107, 102–116. [Google Scholar] [CrossRef]
  20. Xu, C.; Gao, Y.; Xu, G.; Li, X.; Zhao, S.; Yang, Y. A thermodynamic analysis and economic evaluation of an integrated cold-end energy utilization system in a de-carbonization coal-fired power plant. Energy Convers. Manag. 2019, 180, 218–230. [Google Scholar] [CrossRef]
  21. Dicorato, M.; Forte, G.; Trovato, M. Environmental-constrained energy planning using energy-efficiency and distributed-generation facilities. Renew. Energy 2008, 33, 1297–1313. [Google Scholar] [CrossRef]
  22. Kim, S.-H.; Kim, I.-T.; Choi, A.-S.; Sung, M. Evaluation of optimized PV power generation and electrical lighting energy savings from the PV blind-integrated daylight responsive dimming system using LED lighting. Sol. Energy 2014, 107, 746–757. [Google Scholar] [CrossRef]
  23. Song, M.; Qi, H.; Liu, S.; Ma, M.; Zhong, Z.; Li, H.; Song, M.; Li, H. Evaluation of transcritical CO2 heat pump system integrated with mechanical subcooling by utilizing energy, exergy and economic methodologies for residential heating. Energy Convers. Manag. 2019, 192, 202–220. [Google Scholar] [CrossRef]
  24. Mancarella, P.; Chicco, G. Global and local emission impact assessment of distributed cogeneration systems with partial-load models. Appl. Energy 2009, 86, 2096–2106. [Google Scholar] [CrossRef]
  25. Müller, C.; Falke, T.; Hoffrichter, A.; Wyrwoll, L.; Schmitt, C.; Trageser, M.; Schnettler, A.; Metzger, M.; Huber, M.; Küppers, M.; et al. Integrated Planning and Evaluation of Multi-Modal Energy Systems for Decarbonization of Germany. Energy Procedia 2019, 158, 3482–3487. [Google Scholar] [CrossRef]
  26. Wang, Z.; Zheng, Y.; Wang, F.; Song, M.; Ma, Z. Study on performance evaluation of CO2 heat pump system integrated with thermal energy storage for space heating. Energy Procedia 2019, 158, 1380–1387. [Google Scholar] [CrossRef]
  27. Möllersten, K.; Yan, J.; Westermark, M. Potential and cost-effectiveness of CO2 reductions through energy measures in Swedish pulp and paper mills. Energy 2003, 28, 691–710. [Google Scholar] [CrossRef]
  28. Lv, J.; Zhang, S.; Cheng, H.; Wang, D. Reliability evaluation of integrated energy system considering the dynamic behaviour of loads and operation strategy. Energy Procedia 2019, 158, 6508–6514. [Google Scholar] [CrossRef]
  29. Ren, H.; Gao, W. A MILP model for integrated plan and evaluation of distributed energy systems. Appl. Energy 2010, 87, 1001–1014. [Google Scholar] [CrossRef]
  30. Zhou, Y.; Liu, Y.; Wang, D.; De, G.; Li, Y.; Liu, X.; Wang, Y. A novel combined multi-task learning and Gaussian process regression model for the prediction of multi-timescale and multi-component of solar radiation. J. Clean. Prod. 2021, 284, 124710. [Google Scholar] [CrossRef]
  31. Abbasi, M.; Chahartaghi, M.; Hashemian, S.M. Energy, exergy, and economic evaluations of a CCHP system by using the internal combustion engines and gas turbine as prime movers. Energy Convers. Manag. 2018, 173, 359–374. [Google Scholar] [CrossRef]
  32. Cho, H.; Mago, P.; Luck, R.; Chamra, L.M. Evaluation of CCHP systems performance based on operational cost, primary energy consumption, and carbon dioxide emission by utilizing an optimal operation scheme. Appl. Energy 2009, 86, 2540–2549. [Google Scholar] [CrossRef]
  33. Yang, K.; Ding, Y.; Zhu, N.; Yang, F.; Wang, Q. Multi-criteria integrated evaluation of distributed energy system for community energy planning based on improved grey incidence approach: A case study in Tianjin. Appl. Energy 2018, 229, 352–363. [Google Scholar] [CrossRef]
  34. Wang, J.; Xu, Z.; Fu, C.; Yang, K.; Zhou, Z. Multi-criteria Performance Analysis of BCHP System Taking Reliability and Availability into Consideration. Energy Procedia 2014, 61, 2580–2583. [Google Scholar] [CrossRef] [Green Version]
  35. Tan, Z.; De, G.; Li, M.; Lin, H.; Yang, S.; Huang, L.; Tan, Q. Combined electricity-heat-cooling-gas load forecasting model for integrated energy system based on multi-task learning and least square support vector machine. J. Clean. Prod. 2019, 248, 119252. [Google Scholar] [CrossRef]
  36. Li, M.; Wang, W.; De, G.; Ji, X.; Tan, Z. Forecasting Carbon Emissions Related to Energy Consumption in Beijing-Tianjin-Hebei Region Based on Grey Prediction Theory and Extreme Learning Machine Optimized by Support Vector Machine Algorithm. Energies 2018, 11, 2475. [Google Scholar] [CrossRef] [Green Version]
  37. Hammond, G.P.; Harajli, H.A.; Jones, C.I.; Winnett, A.B. Whole systems appraisal of a UK Building Integrated Photovoltaic (BIPV) system: Energy, environmental, and economic evaluations. Energy Policy 2012, 40, 219–230. [Google Scholar] [CrossRef]
  38. De, G.; Tan, Z.; Li, M.; Huang, L.; Wang, Q.; Li, H. A credit risk evaluation based on intuitionistic fuzzy set theory for the sustainable development of electricity retailing companies in China. Energy Sci. Eng. 2019, 7, 2825–2841. [Google Scholar] [CrossRef]
Figure 1. The whole chains of the integrated electricity–gas energy system (IEGES).
Energies 14 00763 g001
Figure 2. The comprehensive benefit evaluation indicator system of the IEGES.
Energies 14 00763 g002
Figure 3. The process of comprehensive benefit evaluation model of the IEGES.
Energies 14 00763 g003
Figure 4. The weighted closeness of the three IEGES ( S 1 , S 2 , S 3 )
Energies 14 00763 g004
Table 1. Relevance judgment principles.
Correlation Coefficient NameCorrelation
0.3 < r < 0.5Low
0.5 < r < 0.8Significant
0.8 < r < 1Highly
r = 1Totally
Table 2. Principles of p i .
RangeExplanation
(0, 1.0] x i 1 is as important as x i
(1, 1.2] x i 1 is slightly important than x i
(1.2, 1.4] x i 1 is obviously important than x i
(1.4, 1.6] x i 1 is strongly important than x i
(1.6, 1.8] x i 1 is extremely important than x i
Table 3. Weight analysis and assignment of p k .
Weight AnalysisThe Assignment of p k w k *
Economic benefit C 6 > C 5 > C 7 > C 8 > C 4 C 4 > C 15 > C 13 > C 14 C 14 > C 1 > C 12 C 12 > C 2 C 2 > C 3 > C 9 > C * 10 > C * 11 p 2 = w 1 * / w 2 * = 1.07 p 3 = w 2 * / w 3 * = 1.08 p 4 = w 3 * / w 4 * = 0.69 p 5 = w 4 * / w 5 * = 0.76 p 6 = w 5 * / w 6 * = 0.24 p 7 = w 6 * / w 7 * = 3.22 p 8 = w 7 * / w 8 * = 0.56 p 9 = w 8 * / w 9 * = 2.25 p 10 = w 9 * / w 10 * = 1.2 p 11 = w 10 * / w 11 * = 1.05 p 12 = w 11 * / w 12 * = 0.475 p 13 = w 12 * / w 13 * = 0.85 p 14 = w 13 * / w 14 * = 0.78 p 15 = w 14 * / w 15 * = 1.22 w 1 = 0.042 w 2 = 0.039 w 3 = 0.036 w 4 = 0.052 w 5 = 0.068 w 6 = 0.281 w 7 = 0.087 w 8 = 0.154 w 9 = 0.024 w 10 = 0.020 w 11 = 0.019 w 12 = 0.040 w 13 = 0.047 w 14 = 0.060 w 15 = 0.049
Environmental benefits C 16 > C 17 > C 18 p 2 = w 1 * / w 2 * = 1.108 p 3 = w 2 * / w 3 * = 2.43 w 1 = 0.440 w 2 = 0.397 w 3 = 0.163
Social benefit C 21 > C 20 > C 19 > C 22 p 2 = w 1 * / w 2 * = 0.498 p 3 = w 2 * / w 3 * = 0.648 p 4 = w 3 * / w 4 * = 2.96 w 1 = 0.140 w 2 = 0.281 w 3 = 0.433 w 4 = 0.146
Table 4. Order relation method weight.
Sub-Target LayerRanking WeightIndicator Layer w k * Weight
Economic benefit0.496C10.0420.041
C20.0390.053
C30.0360.018
C40.0680.034
C50.2810.139
C60.0870.043
C70.1540.076
C80.0240.012
C90.020.010
C100.0190.009
C110.040.020
C120.0470.023
C130.060.030
C140.0490.024
C150.0340.017
Environmental benefits0.313C160.4400.138
C170.3970.124
C180.1630.051
Social benefit0.191C190.1400.019
C200.2810.039
C210.4330.060
C220.1460.020
Table 5. Comprehensive weight distribution.
Third-Level IndicatorsEntropy WeightOrder Relation Method WeightCombined Weight
C10.0480.0410.045
C20.0720.0530.063
C30.0550.0180.037
C40.1820.0340.108
C50.0330.1390.086
C60.0100.0430.027
C70.0520.0760.064
C80.0030.0120.008
C90.0060.0100.008
C100.0060.0090.008
C110.0160.0200.018
C120.0640.0230.044
C130.1310.0300.081
C140.0120.0240.018
C150.0370.0170.027
C160.0700.1380.104
C170.0870.1240.106
C180.0410.0510.046
C190.0410.0190.030
C200.0210.0390.030
C210.0090.0600.035
C220.0040.0200.012
Table 6. Comprehensive benefit evaluation results.
IEGESEigenvaluesBenefit LevelSort
S13.1224medium3
S23.2436medium2
S33.8166excellent1
Publisher’s Note: MDPI stays neutral with regard to jurisdictional claims in published maps and institutional affiliations.

