1. Introduction
Transport emissions account for around 25% of the European Commission (EU) total greenhouse gas emissions and have increased recently. One of the EU goals is to be the first climate-neutral continent by 2050, which requires ambitious changes in the transport sector. According to the EU, a clear path is, therefore, needed to achieve a 90% reduction in transport-related greenhouse gas emissions by 2050. The EU has adopted a series of proposals to transform climate, energy, transport and taxation policies [
1], with the ambition to reduce net greenhouse gas emissions by at least 55% by 2030 compared to 1990 levels.
The EU proposes more ambitious targets for reducing the CO
2 emissions of new cars and vans: 55% reduction of emissions from cars by 2030, 50% reduction of emissions from vans by 2030 and zero emissions from new cars by 2035 [
2].
In recent years, the scientific literature has produced several publications on hybrid traction systems. The issues most addressed are those concerning the analysis and optimization of energy flow management in hybrid systems [
3,
4,
5,
6,
7,
8,
9,
10], the analysis of the performance of components in the hybrid drive system [
11,
12,
13,
14,
15,
16,
17], sizing optimal components of the hybrid drive system [
18] and the analysis of consumption and greenhouse gas emissions [
19,
20,
21,
22,
23,
24,
25,
26,
27,
28,
29,
30,
31,
32,
33]. Furthermore, specific models have been developed for the simulation of hybrid drive systems [
34], simulation of greenhouse gas emissions [
35] and well to wheel (WTW) analysis [
36], and other studies analyse how the reliability and reduction of environmental pollution positively influence users in the choice of electrified vehicle [
37].
This work aims to analyse the energy behaviour of the Toyota Yaris Hybrid Model Year 2020 vehicle by evaluating the ZEV indicator. Such an indicator is the percentage distribution of the total energy at the transmission between the electric motor (EM) and the internal combustion engine (ICE) with a particular interest in distance travelled with the ICE turned off (zero exhaust emissions).
The COVID-19 pandemic characterised the testing campaign, requiring a new mode to conduct the tests, innovative at the international level.
The driving tests, according to the protocol RDTT—Real Drive Truth Test [
32,
37], developed by the research group and validated—must be carried out with the co-presence on board of a driver and a researcher (responsible for supervising the test from the point of view of adherence to the planned route and correct driving style).
In the case of the 2020 tests, the co-presence on board–deemed unsafe in the usual ways given the ongoing pandemic—was achieved through precise and sophisticated remote control.
An on-board diagnostic computer, video transmission and recording equipment guarantee the virtual co-presence of a technical control room and a driver. Thus, several engineers can follow and monitor each vehicle via a 4G modem (installed in each vehicle), analysing data, route and driver behaviour in real-time, so even in the presence of a single occupant in the car under test.
The utmost attention has also been paid to adopting anti-COVID behaviours and safety standards: limited personal interactions, reduced co-presence in shared rooms (especially in the control room), vehicle sanitising between different drivers, computers technicians and video technicians worked once a time.
This paper is structured as follows:
Section 2 describes the RDTT protocol;
Section 3 describes the parameters, the data acquisition, the energy analysis and the operation in ZEV mode of the vehicles studied;
Section 4 concerns the results of the analysis and comparisons, and
Section 5 reports the conclusions and future developments of the work.
2. Real Drive Truth Test—RDTT Protocol
The Real Drive Truth Test protocol allows the standardisation of test methods and the acquisition of significant parameters in analysing and studying the energy behaviour in real conditions of hybrid vehicles used on the road [
37].
These activities analyse, in particular, the operation in ZEV mode (zero-emission vehicle, i.e., with the internal combustion engine turned off) and the energy flows of the hybrid drive system.
The analysis of the operation in ZEV mode identifies the following parameters:
ZEVt: percentage in the running time in ZEV:
- o
ZEVtv=0: percentage of running time in ZEV with a zero speed of the vehicle;
- o
ZEVtPT=0: percentage of running time in ZEV with zero or negative mechanical power from the electric motor to the wheels;
- o
ZEVtEV: percentage of running time in ZEV with mechanical power required for motion provided only by the electric motor.
ZEVS: percentage of the distance travelled in ZEV:
- o
ZEVSPT=0: percentage of distance travelled in ZEV with zero or negative mechanical power from the electric motor to the wheels;
- o
ZEVSEV: percentage of the distance travelled in ZEV with mechanical power required for motion provided only by the electric motor.
EVt: time percentage of the electric-only powered motion phases;
EVS: space percentage of the electric-only powered motion phases.
The analysis of the energy flows of the hybrid traction system identifies:
Mileage [g/km];
Equivalent mileage [g/km]
Overall efficiency of the traction system [%];
Change in state of charge of traction batteries [SOC];
Referenced detail of the energy flows to transmission [kJ]:
- o
From Braking Energy Recovery;
- o
From ICE;
- ▪
direct;
- ▪
via Generator and Electric Motor;
- ▪
via Generator, Batteries and Electric Motor;
The RDTT protocol [
37] defines the following phases for the analysis and study of hybrid vehicles energy behaviour:
In phase I, the protocol defines the test methods: number and characteristics of the drivers, the total number of tests and path characteristics (length, location, etc.). This definition aims to have scientifically correct and comparable, and, as far as possible, generalisable, results.
Phase II foresees a preliminary analysis of the available data from on-board diagnostics and the definition of the data needed for the study.
The third phase concerns the data validation, then a division of acquisitions by tests, drivers, road section, etc. Each division allows evaluating the parameters relating to zero-emission (ZEV), energy analysis, kinematics and driving style indicators; therefore, the evaluation of previous parameters can highlight potential correlations between a few parameters.
The report phase (IV) describes the results obtained, highlighting the most relevant aspects of the analysis regarding the vehicle ZEV, the electrical running and the energy behavior.
2.1. Test Definition
2.1.1. Test and Driver Number and Clusters
According to the RDTT protocol, they were carried out by clustered drivers: males/females, more or less 35 years, each driver follows the same route three times, in the same time slots (traffic bands).
The three test bands are:
Morning band (10:00–12:00);
Lunch band (13:00–15:00);
Afternoon band (15:00–17:00).
The acquisition campaign with:
To make the tests carried out comparable, specific characterisations of the vehicles used and the driving methods of the same have been imposed: eco mode, air conditioning off, respect for speed limits, windows closed (except for July tests, in which it was left to the driver the possibility of a partial opening only in the strictly urban part of the test).
2.1.2. Length, Characteristics and Journey Time
The planned route is the same as in previous tests [
37]; it is in line with the average daily distances travelled per capita in Italy indicated by the latest ISFORT reports on mobility in Italy [
38].
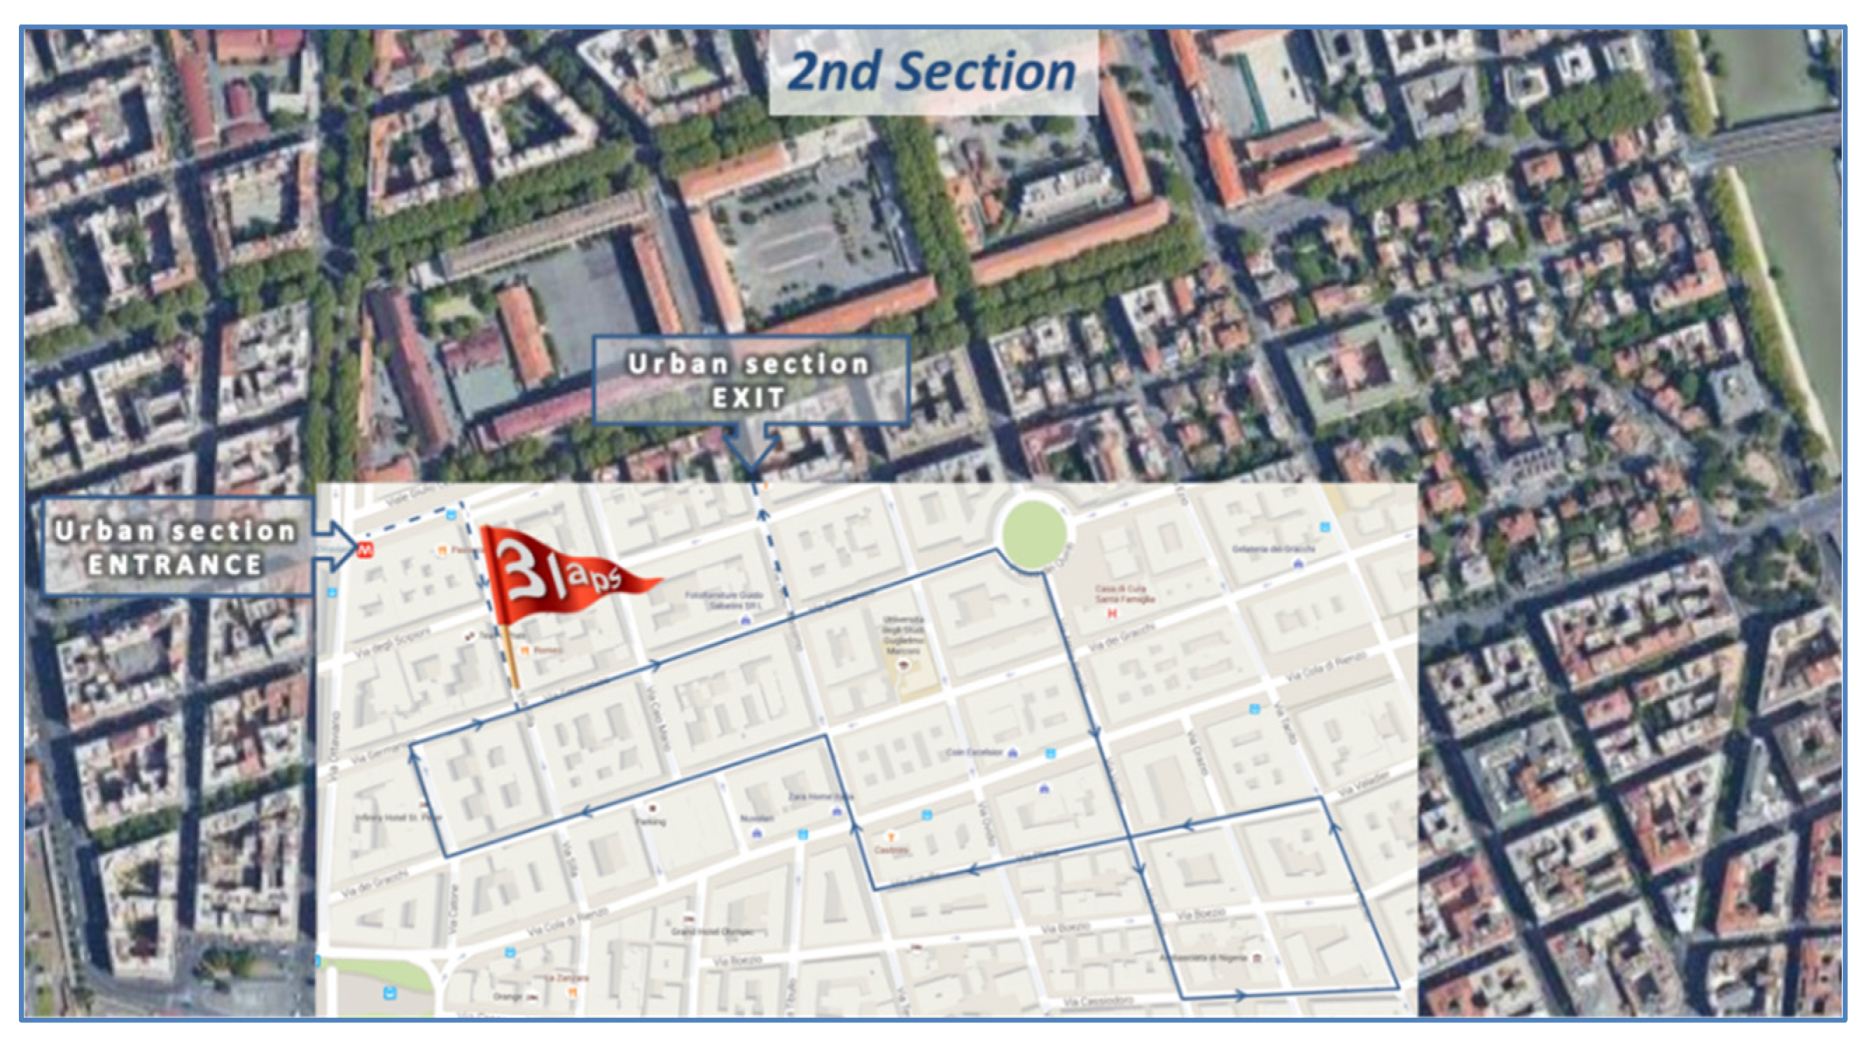
The route consists of a high-flow suburban and urban stretch and an urban stretch, as displayed in the overall view in
Figure 1, also contextualised to the environmental protection strips of Rome.
1st Section—Outward: high-speed suburban and urban route (Toyota Motor Italia Headquarters—Via Generale Amedeo Mecozzi, Via Colonnello Tommaso Masala, Complanare GRA, GRA, Via Aurelia, Via Baldo degli Ubaldi, Via Angelo Emo, Via Candia, Viale Giulio Cesare):
- o
Length: 14.7 km
- ▪
13.1 (89%) km outside the railway ring (
Figure 2);
Figure 2.
Outward: extra-urban and high-flow urban route.
Figure 2.
Outward: extra-urban and high-flow urban route.
2nd Section—Urban: urban route that develops over three laps of itinerary designed ad hoc (Entrance to the urban circuit-corner V.le Giulio Cesare–Via Silla, Viale Germanico, Piazza dei Quiriti, Via Attilio Regolo, Via Virgilio, Via Cassiodoro, Via Tacito, Via Plinio, Via Catullus, Via Terenzio, Via dei Gracchi, Via Catone, Viale Germanico):
- o
Length: 6 km
- ▪
Everything inside the railway ring (
Figure 3);
Figure 3.
Urban: route that develops over three laps.
Figure 3.
Urban: route that develops over three laps.
3rd Section—Return: high-speed and extra-urban route (Urban circuit exit—corner V.le Germanico–Via Fabio Massimo, Viale delle Milizie, Via Andra Doria, Via Ruggiero di Lauria, Via Francesco Caracciolo, Via Vittor Pisani, Via Angelo Emo, Via Baldo degli Ubaldi, Via Aurelia, GRA complanare, GRA, GRA Complanare, Via Generale Amedeo Mecozzi, Via Colonnello Tommaso Masala):
- o
Length: 17.3 km
- ▪
14.3 (88%) km outside the railway ring (
Figure 4);
Figure 4.
Return: high-speed urban and extra-urban route.
Figure 4.
Return: high-speed urban and extra-urban route.
As described in
Figure 5, the altimetric profile of the path highlights a symmetric measuring between the First Section-Outward and the Third Section-Return; the Second Urban Section has no gradients. The maximum elevation difference is 31 m, from the First section to the Second and from the Second to the Third.
2.2. Criteria for the Scenarios Evaluations
The parameters necessary for the energy analysis are: the energy flow from and to the hybrid powertrain, distance travelled, speed and acceleration. A few parameters have to be calculated, e.g., the acceleration is the derivative of vehicle speed, the kinetic energy, the mechanical power of the motors.
An on-board diagnostic system stores the data; it consists of an embedded PC that reads information through the car’s on-board diagnostic (OBD) socket using the TechStream software.
Like the majority of the electric and hybrid vehicles, this vehicle has two dedicated CAN networks and two relative Electronic Control Units (ECU). The first ECU, called “Hybrid Control System”, provides data from the safety sensors, vehicle kinematics, electric powertrain; the second ECU, called “Engine”, uses the second CAN line. Both have two data lists with many parameters that can be monitored in real-time and stored on the PC.
The Hybrid Control System provides 22 selected parameters and the Engine 7 has more:
3. Parameters Calculation
3.1. Yaris Hybrid System
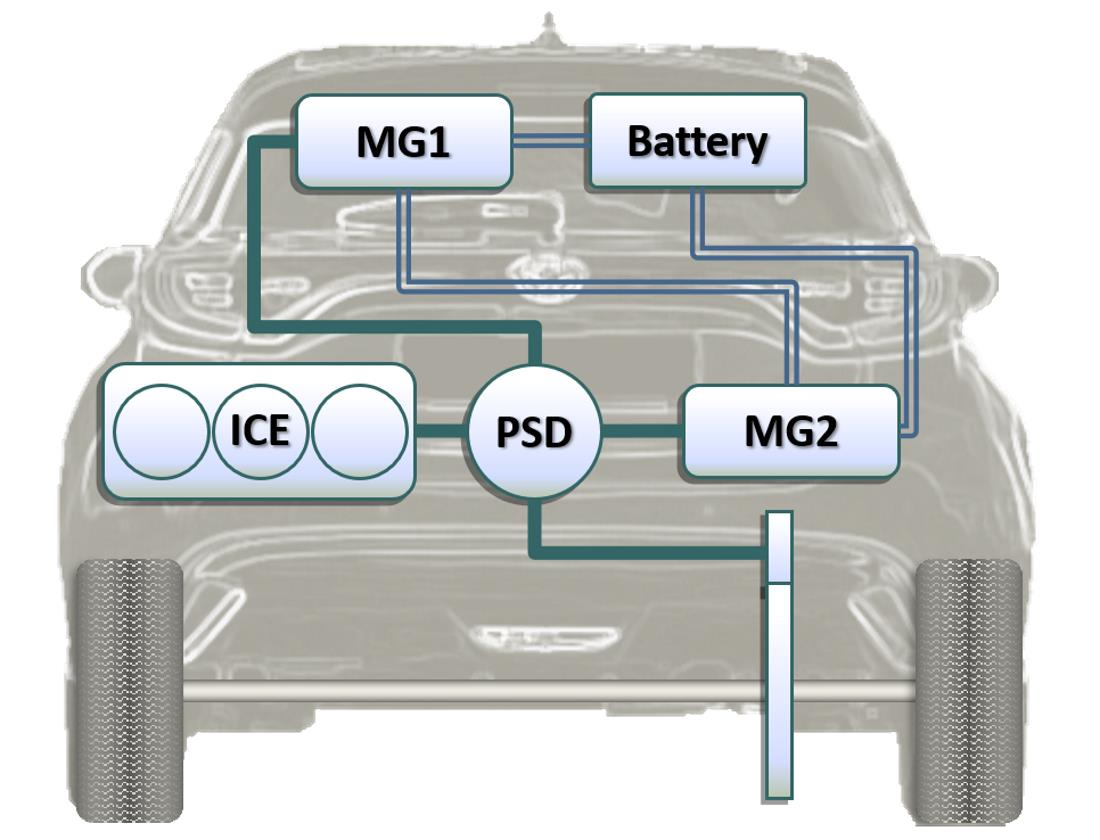
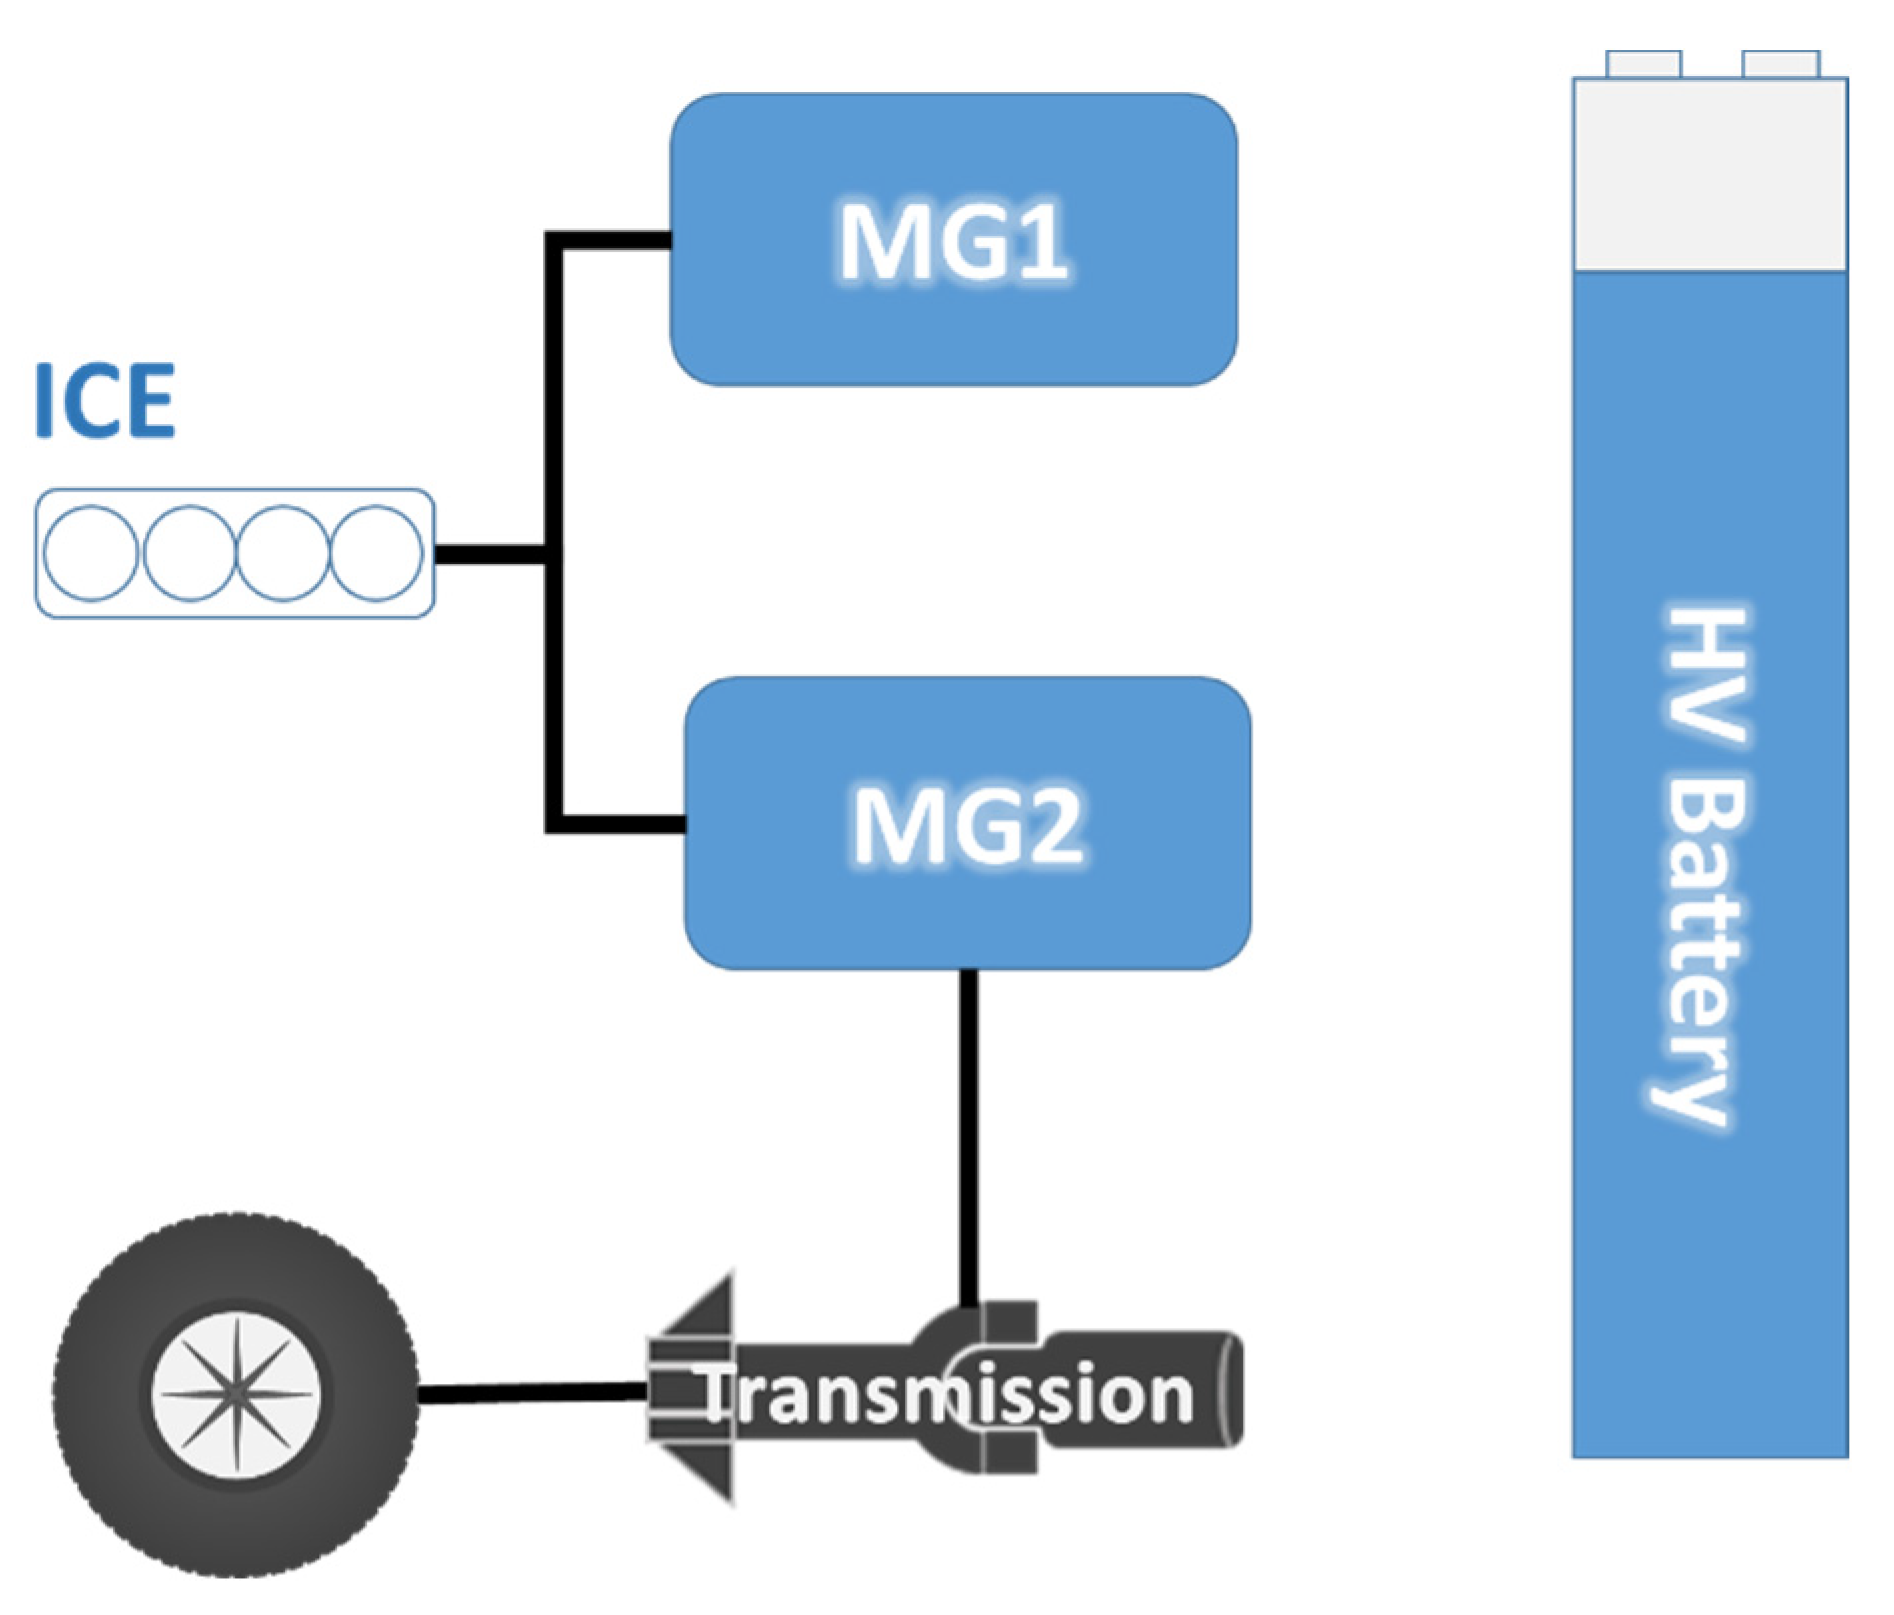
The traction system of the Toyota Yaris object of this study (
Figure 6) is a full hybrid consisting of a petrol-powered ICE, Atkinson cycle, two reversible electric machines MG (Motor/Generator) of the brushless type in alternating current and batteries of traction type nickel-metal hydride (Yaris 2017) or lithium-ion (Yaris 2020). The power divider is of the double planetary type.
The two motor/generators MG1 and MG2 can work as motor or generator; their working conditions depend on the kinematic constraint of the Power Split Device (PSD).
The Toyota hybrid powertrain has two separate functions:
- -
MG1 is coupled through the PSD (not shown for simplicity in
Figure 6) to the ICE and not to the transmission;
- -
MG1 works as a motor exclusively for starting the ICE by absorbing electricity from the batteries;
- -
In a typical operation, the ICE turns the MG1, which works as a generator. It can recharge the batteries (or directly power MG2 in engine operation);
- -
MG2 is connected to the PSD and not to the ICE, so, in normal driving conditions, it works as a motor and provide mechanical power to the wheels; or, it works as a generator to charge the traction batteries (energy recovery) in case of batteries in a low state of charge.
3.2. Parameters Related to the Analysis of Zero-Emission Vehicle (ZEV) Mode
The percentage indices (in time and space) both of zero-emission operation and in electric vehicle mode [
9,
32,
37], have been defined as follows:
From the definition of these indices given by Equations (1)–(7):
EV value is equal to 0 for conventional ICE vehicles (also with stop and start system) and 1 for a battery electric vehicle (BEV), between 0 and 1 for full-hybrid vehicles.
3.3. Parameters Related to the Energy and Consumption Analysis
From the data acquired on fuel consumption (C
fuel), the mechanical energy delivered by ICE (
E_ICE_OUT) and the mechanical energy to the transmission (
E_T_IN), and from the value of the
LHVfuel, it is possible to calculate the average efficiency of the ICE (
ηICE) and the hybrid system (
ηHS) as follows:
The equivalent fuel consumption considers the change in SOC (∆SOC positive or negative) in each section analysed.
In this way, fuel consumption counts the amount of electricity delivered (or stored) by the batteries. In the calculation of the equivalent consumption, the regeneration coefficient (REG) is considered, defined as follows:
When ∆SOC is positive, the battery is charged between starting and stopping; otherwise, it discharges. The equivalent consumption is expressed as:
where
CB is the traction battery capacity,
REG is the regeneration coefficient,
ηICE and
ηG are the average efficiency of ICE and generator respectively, and the value of
LHVfuel.
The average efficiency of the generator (
ηG) is calculated from the data acquired (mechanical energy absorbed by MG1 in generator operation
EM_MG1_IN and electricity supplied by MG1 in generator operation
EE_MG1_OUT) as follows:
Mileage
M and equivalent mileage Meq [g/km] are calculated as follows:
4. Results Analysis and Comparison between Yaris Hybrid 2020 and Yaris Hybrid 2017
Table 1 shows the main characteristics of the two Toyota Hybrid Yaris vehicles, 2017 and 2020.
The 2020 version has a three-cylinder in-line engine, a compression ratio of 14 and 64 kW (at 5500 rpm) of the maximum power. It has an increase of 18.5% in engine power (compared to the 2017 version).
Moreover, the 2020 version adopts a lithium-ion traction battery instead of the nickel-metal hydride battery; such a choice allows increasing the power of the electric motors up to 59 kW (an increase of 31.1% compared to the 45 kW of the 2017 version).
The vehicle’s maximum power for the 2020 version is 85 kW compared to 74 kW of the 2017 version (an increase of 14.8%).
Figure 7 illustrates a driving cycle (diagram v-t) of the test path used, described in
Section 2.1.2; the distinction between the central urban section and the mixed outward and return sections is evident from the speed trend.
4.1. ZEV Mode Operation Analysis and Comparison between Yaris Hybrid 2020 and Yaris Hybrid 2017
Below are the results of the analysis of the operating parameters in ZEV mode.
The main results of the tests carried out are shown in
Table 2. For all parameters (
ZEVt,
ZEVS,
EVt and
EVS), for the two sections (urban and suburban) and the entire test, the values found for the Yaris 2020 are significantly higher than those for the Yaris 2017. The highest values of the parameters analysed occur in the suburban section; it is due to the greater power of the electric motor, which allows electric operation even for higher speeds and power requirements: +19.2% ZEVt, +83.3% ZEVS, +71.6% EVt and +195.9% ZEVS.
These increases are also significant in the entire test (+15.3% ZEVt, +64.3% ZEVS, +64.8% EVt and +137.6% ZEVS), while in the urban section (low average speeds and low power) the increases are lower: +9.5% ZEVt, +16.5% ZEVS, +48.6% EVt and +16.0% ZEVS.
The statistical distribution of the values of the analysed parameters (
Table 3) is very consistent with variations in the standard deviation normalised around 10%. In both cases, the parameters showing the smallest dispersions are the percentages over time (
ZEVt, lower value, and
EVt), while the percentages in the distance (
ZEVS and
EVS higher value) show higher dispersions.
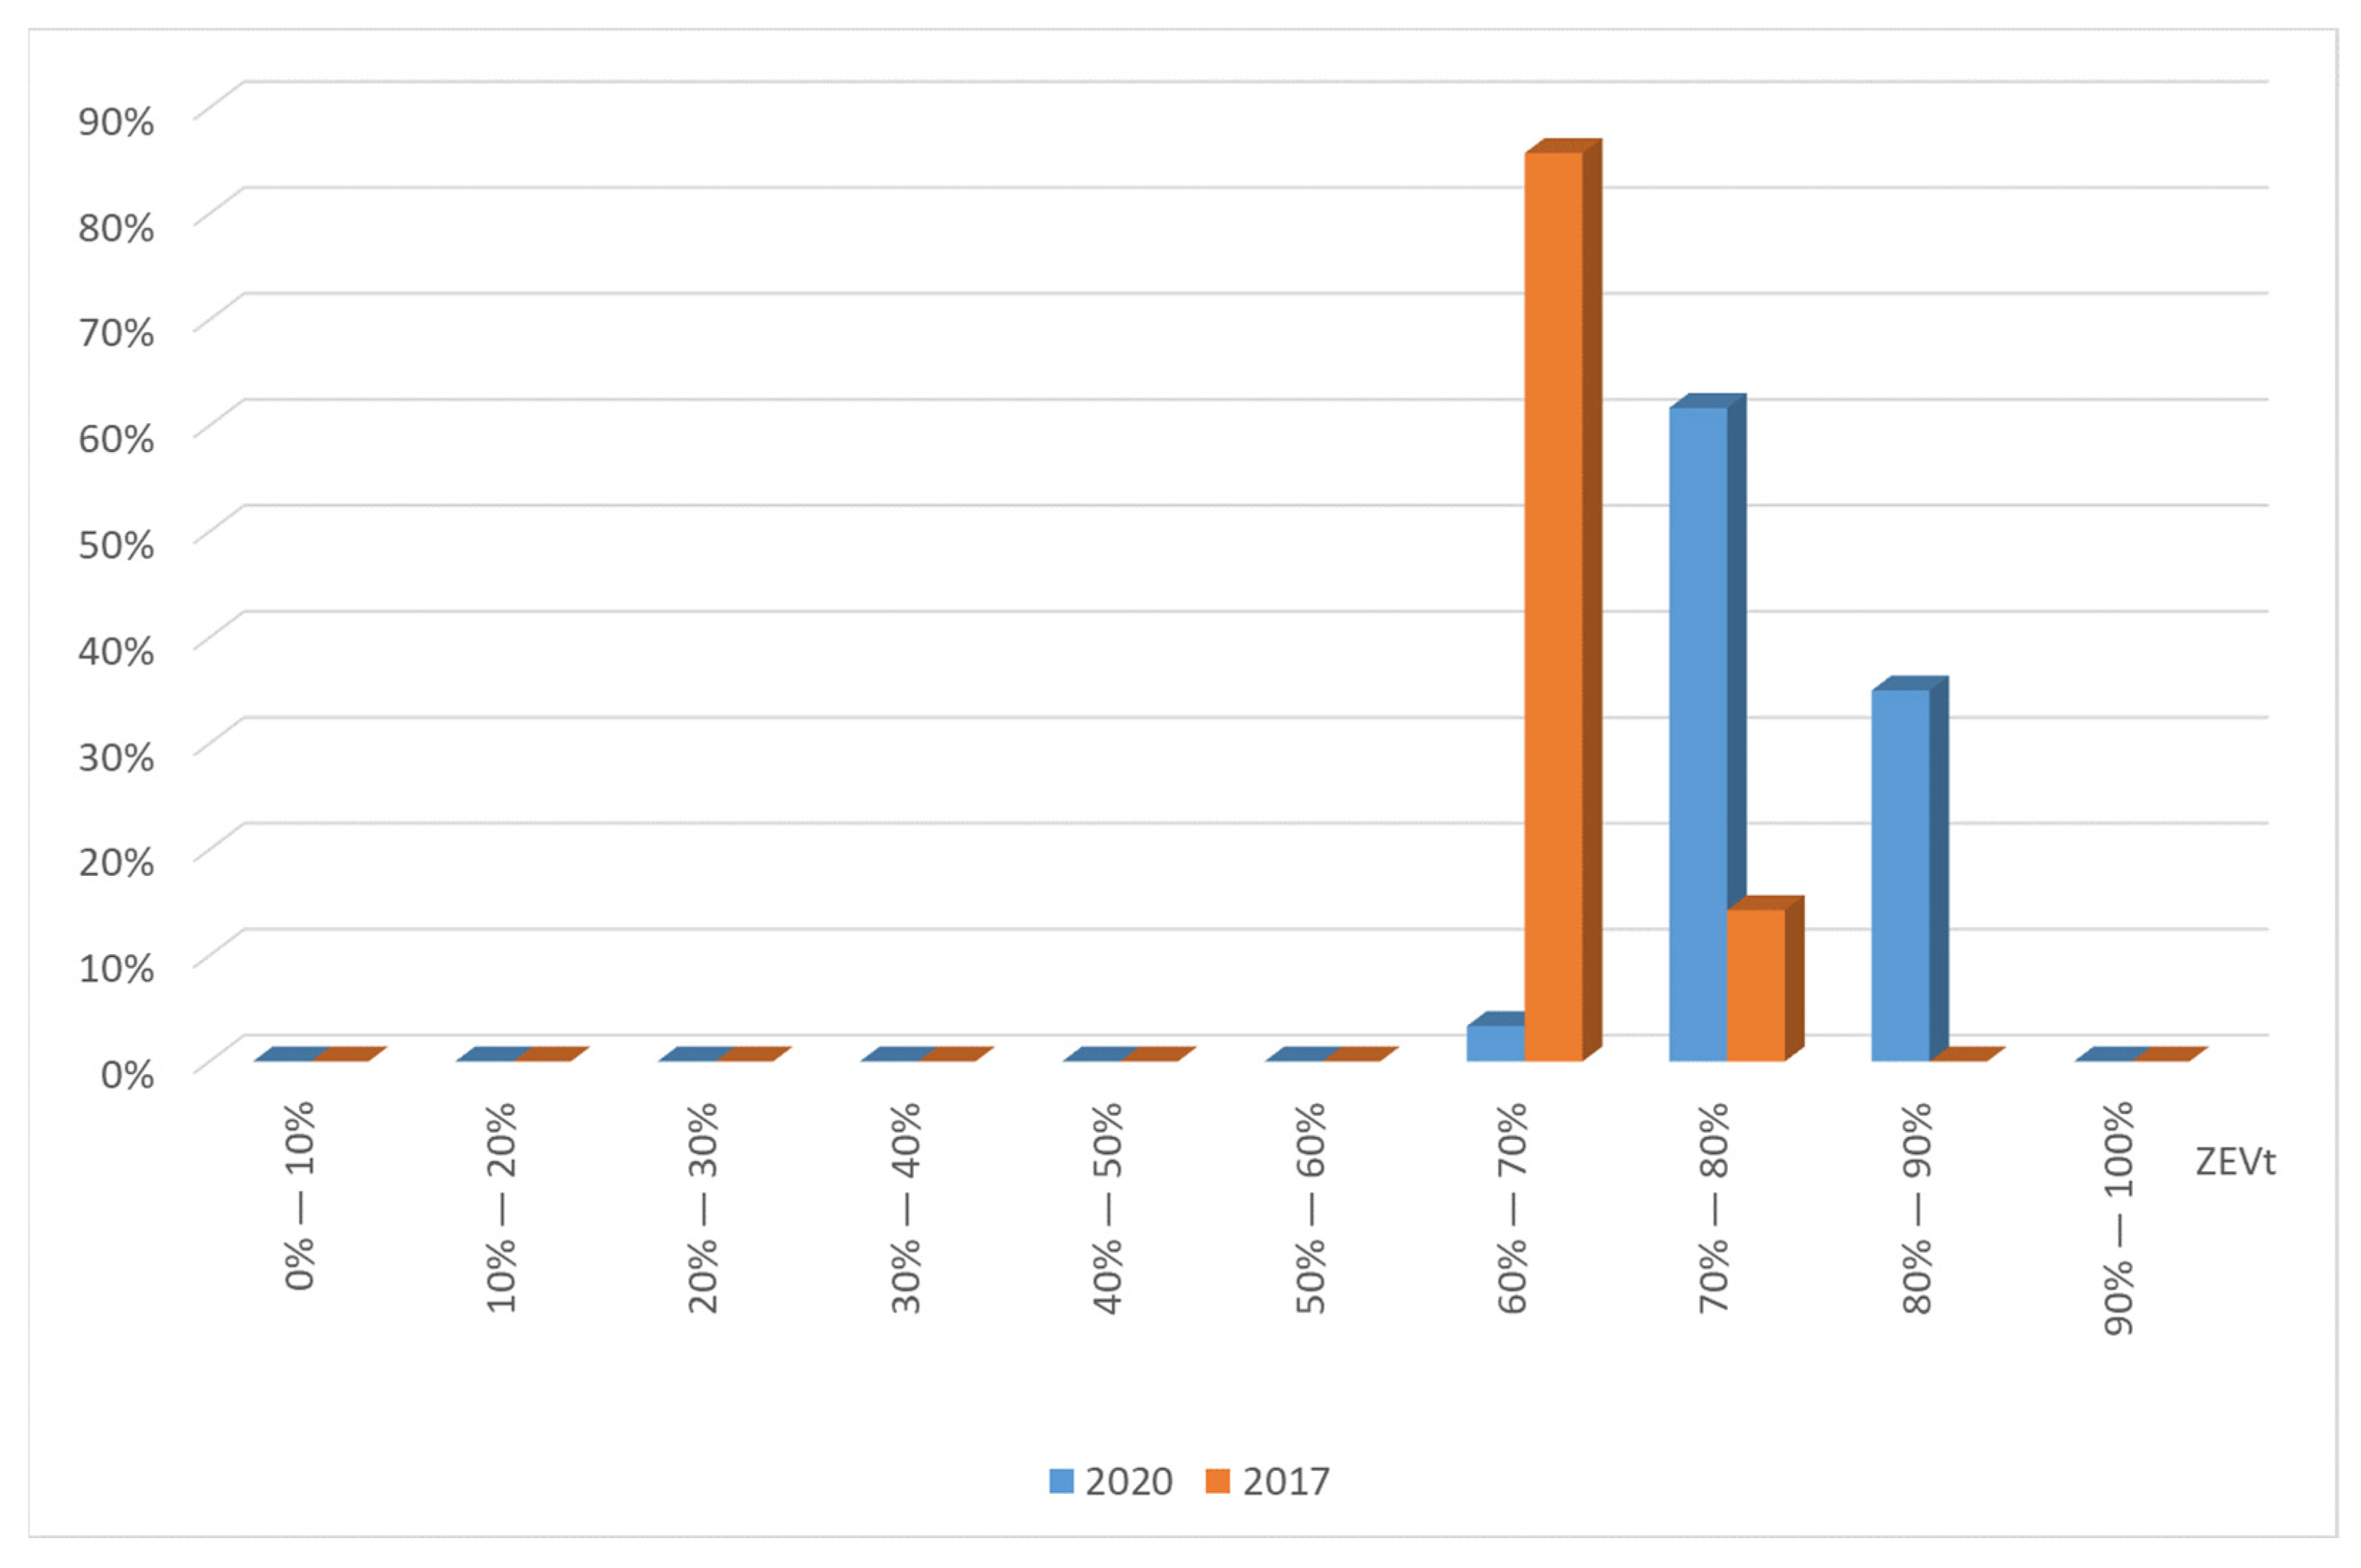
Figure 8 shows the frequency distribution of the
ZEVt values in the tests of the Toyota Yaris 2017 and 2020.
The
ZEVt values were less dispersed in 2017 tests than in 2020 (
Table 3); 86% of the tests had a
ZEVt between 60% and 70%, and 14% of tests between 70% and 80%.
In 2020, the ZEVt values were higher with a greater dispersion; 62% of the tests had the ZEVt between 70% and 80%, 35% between 80% and 90%, and only 3% of tests between 60% and 70%.
The frequency distribution of the
ZEVS (
Figure 9) is similar to the
ZEVt but with a greater dispersion. In the 2017 tests, 45% had a
ZEVS between 40% and 50%, 50% between 30% and 40% and 45% between 40% and 50%, and only 5% between 50% and 60%.
In 2020, 40% of the tests had a ZEVS between 60% and 80%, 45% between 60% and 70% and 45% between 70% and 80%, 13% were between 50% and 60%, and only 3% between 40% and 50%.
Similar considerations apply to the frequency distribution of the
EVt and
EVS values (
Figure 10 and
Figure 11). In both test campaigns (2017 and 2020), the
EVS values show a greater dispersion and the 2020 values are significantly higher than those of 2017.
4.2. Energy Analysis and Comparison between Yaris Hybrid 2020 and Yaris Hybrid 2017
4.2.1. Mileage and Efficiency Analysis and Comparison
Table 4 shows the average values of the parameters calculated for the vehicle energy analysis. The difference between mileage and equivalent mileage is negligible (about 1%). Therefore, only the equivalent mileage will be considered. In 2020, it showed a reduction of 35.2%, compared to 2017, with an increase in the overall hybrid system efficiency of 8.2% (the ICE average efficiency remains steady).
The equivalent mileage decrease is due to better overall average efficiency of the hybrid system and partly to the different traffic conditions that bring to a greater energy demand from the transmission in 2017 (see
Section 4.2.2.). The July 2020 tests were affected by the government-imposed travel restrictions in the COVID-19 pandemic.
Table 5 shows the maximum and minimum values and normalised standard deviation of the parameters for the energy analysis of the vehicle. Driving style and traffic conditions affect the equivalent mileage, which has a higher dispersion concerning the average value [
19,
39,
40,
41,
42]; indeed, they have a lower impact on the hybrid system efficiency.
The driving style essentially affects the energy requirements of the wheels (and therefore, with the same efficiency, on consumption) and much less on the efficiency of the hybrid drive system. The traffic conditions and driving style affect also the amount of energy recoverable under braking.
The values of the average efficiency of the ICE have the lowest dispersion and are constant between the two test campaigns; it is due to the presence of the electric motor in the hybrid drive system, which allows the ICE to always work in the best conditions of efficiency.
Figure 12 shows the frequency distribution of the equivalent mileage values. These values present a quite relevant dispersion to the average value (
Table 5); in fact, the normalised standard deviation is equal to 0.1469 (2020) and 0.0917 (2017) as they are greatly influenced by both driving style and traffic conditions. There is a similar trend, but the 2020 version has lower mileage than 2017. The maximum frequency distribution of the equivalent mileage for the 2020 version is 55% and refers to the range 20–25 g/km compared to 48% referring to 30–35 g/km for the 2017 version.
Figure 13 shows how the frequency distribution of the ICE efficiency values does not present significant deviation values between the 2020 version and the 2017 version, either in the statistical distribution or in the average values (see
Table 5).
Figure 14 shows how the frequency distribution of the hybrid system efficiency values present similar trends between the two versions but with higher efficiency values for the 2020 version (see
Table 5).
4.2.2. Energy Flows Analysis and Comparison
Figure 15 shows the diagram of energy flows of the Yaris 2020 and 2017 estimated on the average value.
For Yaris 2020, the electric motor (MG2) provides about 60%, (about 271 kJ/km). For Yaris 2017, the MG2 provides only 32% (just over half) of the transmission energy with about 225 kJ/km of electric consumption.
The braking system recovers about 138 kJ/km of electricity (about 45% of the total produced) for Yaris 2020 and about 156 kJ/km (about 60% of the total produced) for Yaris 2017. Thanks to energy recovery, the ICE produces about 94% for the energy transmission (2017 Yaris), while in the 2020 Yaris, the percentage drops to 85% thanks to the system’s improved efficiency.
Figure 16 illustrates that 27% of the energy used by Yaris 2020 derives from regenerative braking, a further 32% from electricity produced by ICE and 41% directly from ICE. For Yaris 2017, 18% of the energy derives from regenerative braking, 14% from electricity produced by ICE and 68% from ICE.
From the foregoing, it is evident that the operating modes of the traction system are strongly linked to the possibility of recovering energy during braking.
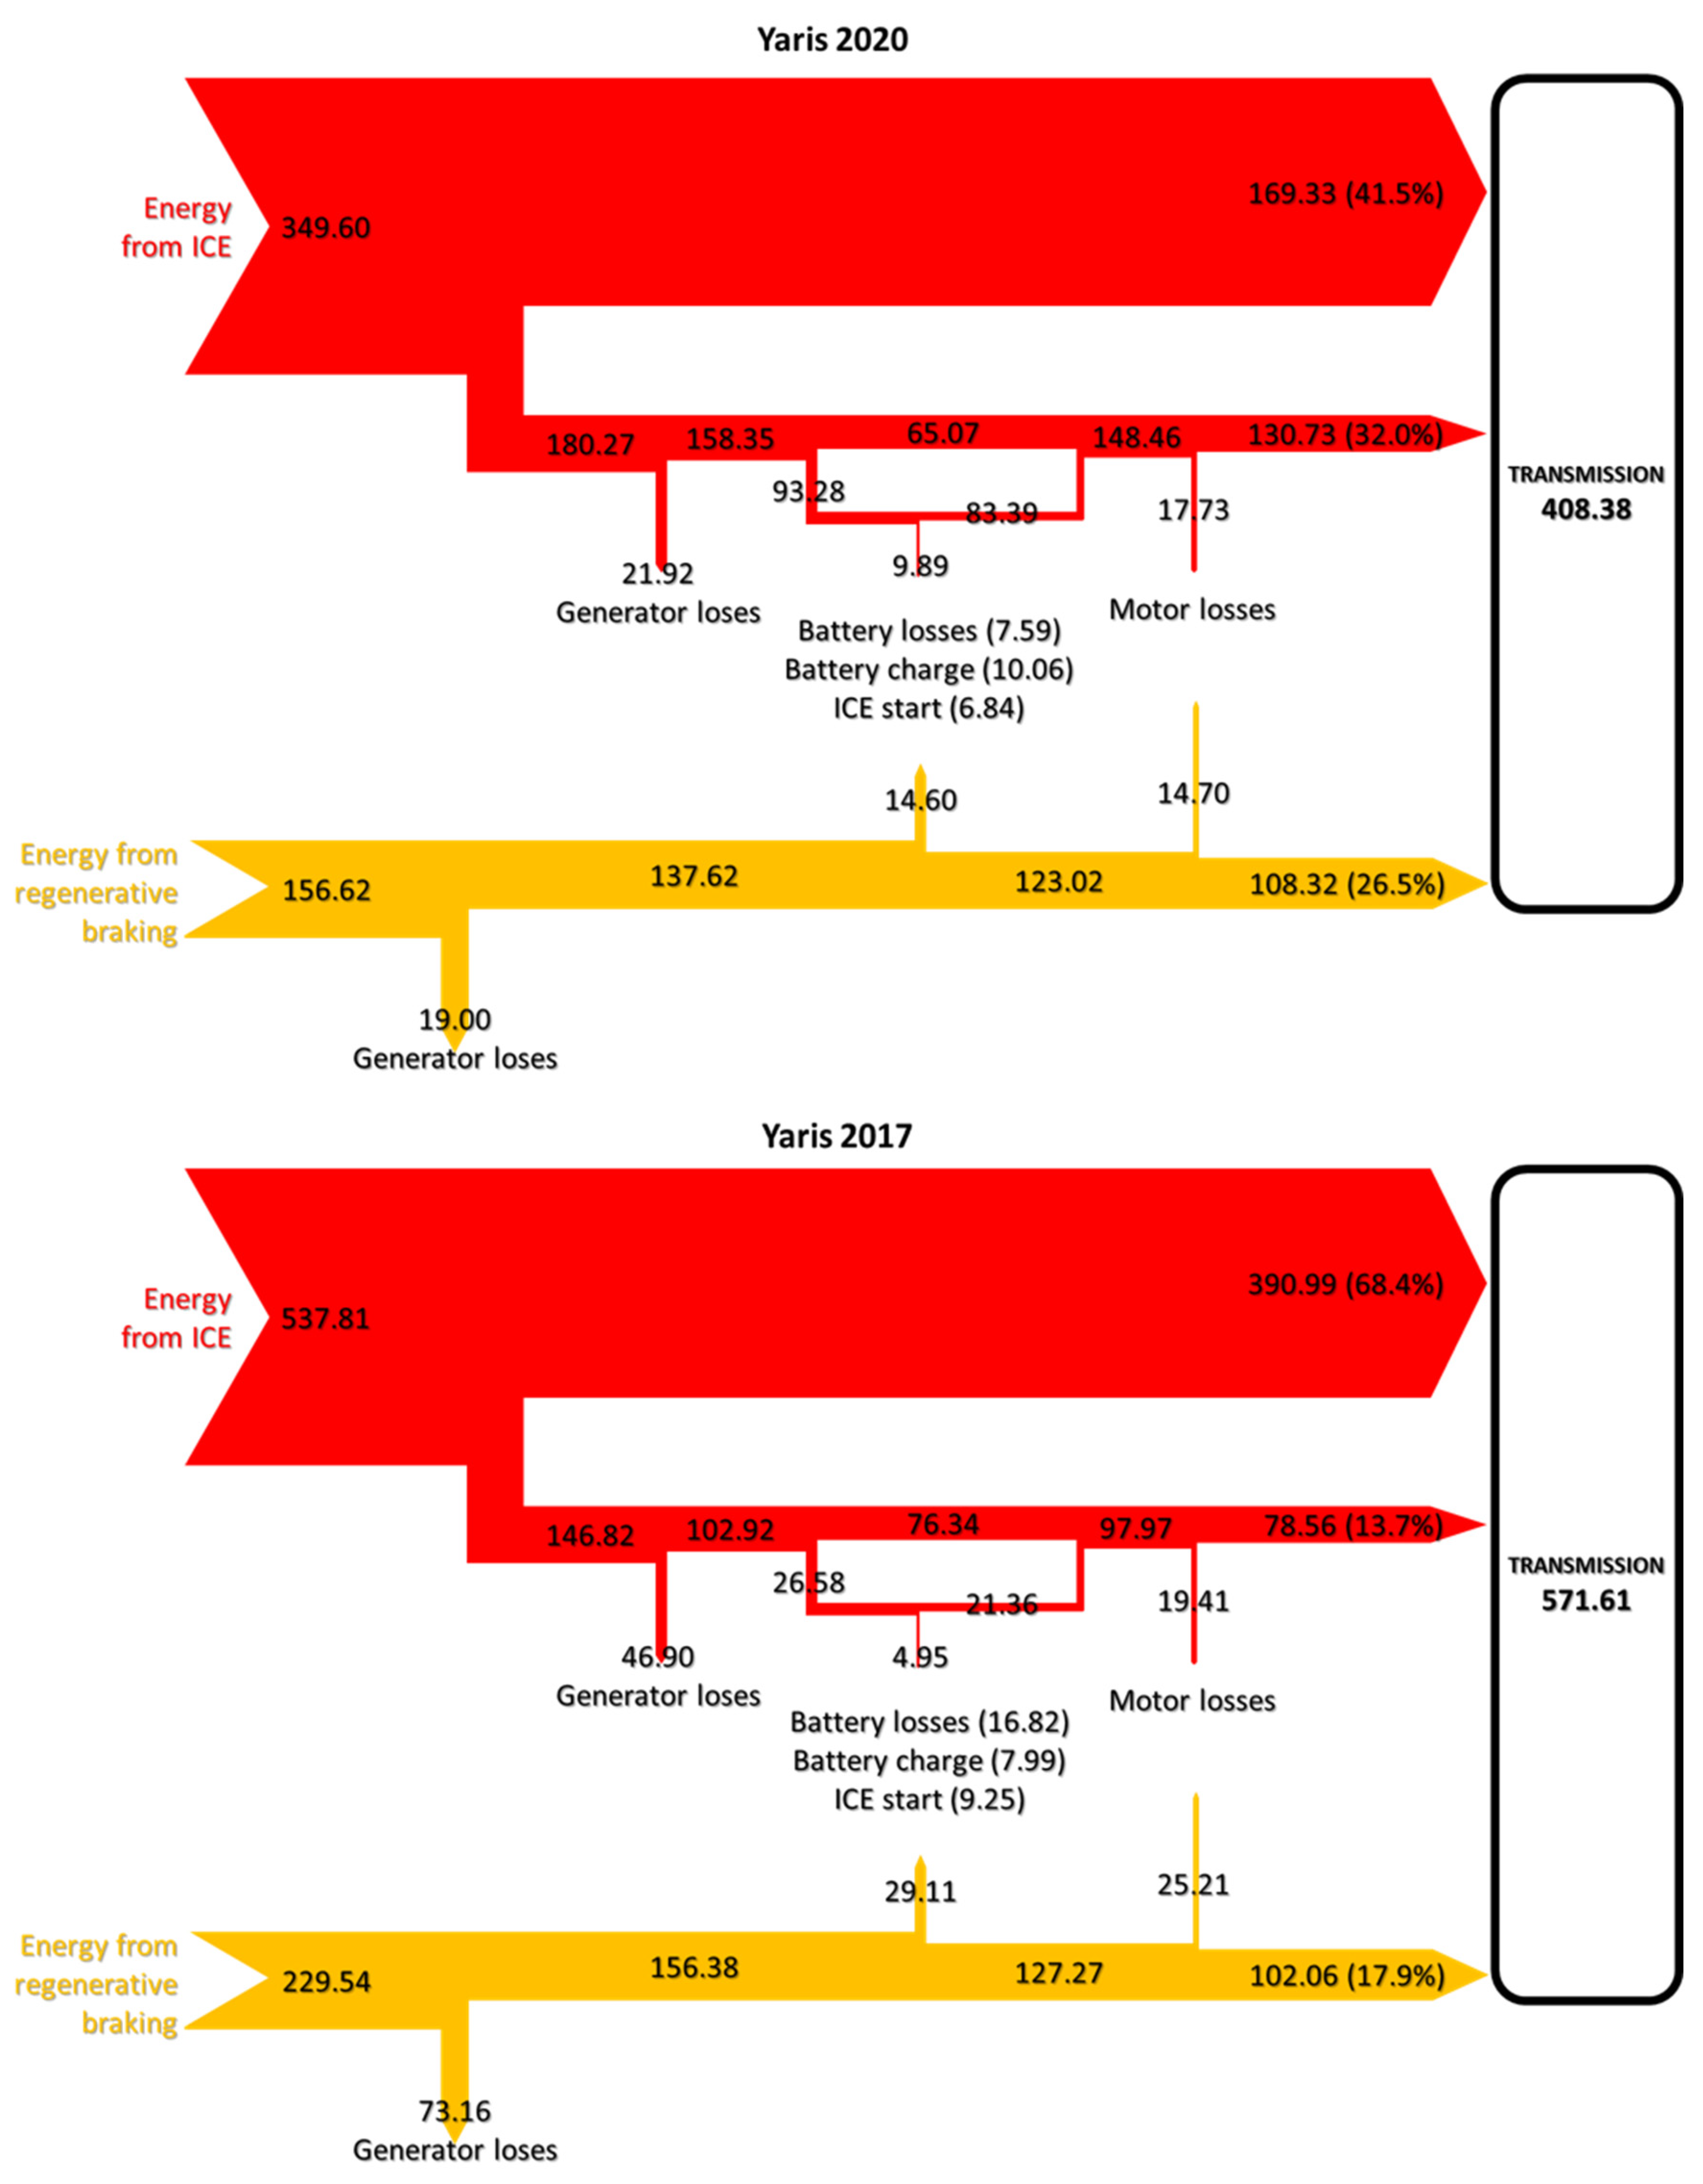
Figure 17 shows the energy flow diagrams; it is evident that the improvements in 2020 Yaris come from the contribution of the hybrid system. The 2020 Yaris engine produces 349.60 kJ/km; 51.5% (180.27 kJ/km) goes to the electrical part (through MG1), and 48.5% (169.33 kJ/km) goes directly to the transmission. The 2017 Yaris ICE produces 537.81 kJ/km; only 27.3% (146.82 kJ/km) goes to the electric part, and 72.7% (390.99 kJ/km) goes directly to the transmission.
The hybrid system of the 2017 Yaris produces 767.35 kJ/km of total power, 29.9% (229.54 kJ/km) are provided by energy recovery, and the same percentage can be measured in Yaris 2020 (total power of 506.22 kJ/km, with 30.9% from regenerative braking equal to 156.22 kJ/km).
Such a difference in energy needs is probably due to the different traffic conditions influenced by the restrictions due to the COVID 2019 pandemic in the tests of the Yaris 2020: 571.61 kJ/km for the 2017 Yaris and 408.38 kJ/km (−28.6%) for the 2020 Yaris.
4.2.3. Comparison of Test Conditions
As already mentioned, the traffic conditions during the tests of the Yaris 2020 were conditioned by the travel restrictions imposed occurring during the COVID-19 pandemic.
Table 6 shows some data relating to the 2017 and 2020 tests. The difference between the test conditions is evident: in 2017, the average duration of the tests was about 30% higher, the stopping time was about 22%; in contrast, the average speed and the average speed with the vehicle in motion were approximately 23% and 20% lower. As mentioned, the energy requirement at the wheels in 2020 was 30% lower compared with 2017.
The influence of different traffic conditions can be considered with statistical analysis; a methodology is developed and applied to estimate the variation of a few energy parameters obtained. This statistical analysis is detailed in the paper under publication by the same authors that compare results of different on-road vehicle performance testing in this Toyota Yaris hybrid case study [
43]. It compares some energy indicators of 2020 (influenced by the travel restrictions of the pandemic) with the same indicators calculated in acquisition campaigns of 2017 (where there are typical traffic conditions).
The main results show that the different traffic conditions involve an increase of about 1% of the
ZEVt and
ZEVS and about 0.05% of mileage and hybrid system efficiency in the Yaris 2020 campaign. Therefore, the performance improvements of Yaris 2020 compared to Yaris 2017 (
Table 2 and
Table 4) are substantially confirmed even in the face of different traffic conditions.
5. Conclusions
The above research shows a significant performance improvement, both in terms of ZEV operation and consumption and efficiency. These improvements came from optimising the system: the technologies, apart from the traction batteries (nickel-metal hydride version 2017 and lithium-ion in the 2020 version). Despite the same efficiency levels, the average motor/generator power (MG2, see
Figure 6) increases; it allows better management of the hybrid drive system and a better ability to recover energy during braking (
Figure 16).
The application of the RDTT protocol shows a decrease in consumption of more than 35%; the Yaris 2017 achieved 35.1 g/km while Yaris 2020 achieved 22.8 g/km (
Table 4).
The mileage saving based on the homologation data (using the NEDC cycle because, in the Yaris 2017, the latest WLTP is not available) is just over 10%. The hybrid powertrain overall efficiency increases by 8.2%, with practically unchanged ICE efficiency (
Table 4).
As for the operation in ZEV (
Table 2),
ZEVt increases by 15.3% (67.7% for Yaris 2017, 78.0% for Yaris 2020),
ZEVS by 64.3% (40.5% for Yaris 2017, 66.6% for Yaris 2020),
EVt by 64.8% (40.1% for Yaris 2017, 66.2% for Yaris 2020) and
EVS by 137.6% (23.0% for Yaris 2017, 54.7% for Yaris 2020).
The values of the energy parameters obtained in a less congested traffic condition (typical of the 2020 campaign) are influenced by the travel restrictions in the COVID-19 era. These indicators are compared with those measured in 2017, where the traffic conditions are normal.
The deviation of
ZEVt and
ZEVS are both about 1%, while the mileage and hybrid system efficiency are quasi-steady (0.05%). Such results, reconfirmed by statistical analyses [
43] which show deviations of about 1% for
ZEVt and
ZEVS and 0.05% for mileage and hybrid system efficiency.
Author Contributions
Conceptualization: F.O. (Fabio Orecchini), A.S., F.Z., A.A., F.C. and F.O. (Fernando Ortenzi); Methodology: Fabio Orecchini, A.S., F.Z., A.A., F.C. and F.O. (Fernando Ortenzi); Validation: F.O. (Fabio Orecchini), A.S., F.Z., A.A., F.C. and F.O. (Fernando Ortenzi); Data curation: F.O. (Fabio Orecchini), A.S., F.Z., A.A., F.C. and F.O. (Fernando Ortenzi); Writing—original draft preparation: F.O. (Fabio Orecchini), A.S., F.Z., A.A., F.C. and F.O. (Fernando Ortenzi); Writing—review and editing: F.O. (Fabio Orecchini), A.S., F.Z., A.A., F.C. and F.O. (Fernando Ortenzi). All authors have read and agreed to the published version of the manuscript.
Funding
This research received no external funding.
Institutional Review Board Statement
Not applicable.
Informed Consent Statement
Not applicable.
Data Availability Statement
The available data are those published in this paper.
Acknowledgments
The authors would like to thank TMI (Toyota Motor Italia) and TME (Toyota Motor Europe). They have collaborated in the realisation of the study underlying this work by providing Full Hybrid Yaris vehicles for the tests, software, and hardware for data acquisition.
Conflicts of Interest
The authors declare no conflict of interest.
Nomenclature
| ICE | Internal Combustion Engine |
| MG | Electric motor/generator |
| REG | Regeneration coefficient |
| SOC | State of charge of the traction battery pack |
| CB | Traction battery pack capacity [J] |
| ZEVt | Percentage of operating time in ZEV mode related to the total time |
| tZEV | Operating time in ZEV mode [s] |
| tTOT | Total time [s] |
| ZEVS | Percentage of distance travelled in ZEV mode relative to the total distance |
| SZEV | Distance travelled in ZEV mode [m] |
| STOT | Total distance travelled [m] |
| ZEVtv=0 | Percentage of operating time in ZEV mode with the stationary vehicle in relation to the total operating time in ZEV |
| ZEVtPT>0 | Percentage of in ZEV mode operation time with advancement with power delivery to the transmission only by the electric motor relative to the total operating time in ZEV |
| ZEVtPT>0 | Percentage of in ZEV mode operation time with advancement without power delivery to the transmission relative to the total operating time in ZEV |
| tZEVv=0 | Operating time in ZEV mode with stationary vehicle [s] |
| tZEVPT=0 | Operating time in ZEV mode with vehicle advancement without power supply to transmission [s] |
| tZEVPT>0 | Operating time in ZEV mode with vehicle propulsion with power output to the transmission only by the electric motor [s] |
| ZEVSPT=0 | Percentage of the distance travelled in ZEV mode with feed without power delivery to the transmission in relation to the total distance travelled in ZEV |
| ZEVtPT>0 | Percentage of the path space in ZEV mode with feed with power delivery to the transmission only by the electric motor relative to the total distance travelled in ZEV |
| SZEVPT=0 | Space travel in ZEV mode with vehicle advancement without power to the transmission [s] |
| SZEVPT>0 | Space travel in ZEV mode with vehicle advancement without power to the transmission [m] |
| EVt | Percentage of time with the power delivery to the wheels only by the electric motor relative to the time of power delivery to the transmission |
| EVS | Percentage of space covered with power delivery to the transmission only by the electric motor relative to the distance travelled with the power delivery to the wheels |
| tTOTPT>0 | Travel time with power output to the transmission [s] |
| STOTPT>0 | Space travel with power to the transmission [m] |
| E_B_IN | Electricity input hybrid battery (J) |
| EE_MG1_OUT | Electricity supplied by MG1 in generator operation [J] |
| EM_MG1_IN | Mechanical energy absorbed by MG1 in generator operation [J] |
| EE_MG2_OUT | Electricity supplied by MG2 in generator operation (J) |
| E_ICE_OUT | Mechanical energy delivered by ICE (J) |
| E_T_IN | Mechanical energy to the transmission (J) |
| ηG | Average efficiency of MG1 and MG2 in generator operation |
| ηICE | Average efficiency of ICE |
| CEQfuel | Equivalent fuel consumption [kg] |
| Cfuel | Fuel consumption [kg] |
| LHVfuel | Lower heating value of fuel [kJ/kg] |
| ηHS | Average hybrid powertrain efficiency |
| M | Mileage [g/km]: fuel consumption in kilometers |
| Meq | Equivalent mileage [g/km]: equivalent fuel consumption in kilometers |
References
- European Commission Transport and the Green Deal: Providing Efficient, Safe and Environmentally Friendly Transport. Available online: https://ec.europa.eu/info/strategy/priorities-2019-2024/european-green-deal/transport-and-green-deal_en (accessed on 29 October 2021).
- European Commission Delivering the European Green Deal: Making Transport Sustainable for All. Available online: https://ec.europa.eu/info/strategy/priorities-2019-2024/european-green-deal/delivering-european-green-deal_en (accessed on 29 October 2021).
- Maamria, D.; Gillet, K.; Colin, G.; Chamaillard, Y.; Nouillant, C. Computation of eco-driving cycles for Hybrid Electric Vehicles: Comparative analysis. Control Eng. Pract. 2018, 71, 44–52. [Google Scholar] [CrossRef]
- Park, J.; Murphey, Y.L.; Masrur, M.A. Intelligent Energy Management and Optimization in a Hybridized All-Terrain Vehicle with Simple On–Off Control of the Internal Combustion Engine. IEEE Trans. Veh. Technol. 2016, 65, 4584–4596. [Google Scholar] [CrossRef]
- Xiang, C.; Ding, F.; Wang, W.; He, W. Energy management of a dual-mode power-split hybrid electric vehicle based on velocity prediction and nonlinear model predictive control. Appl. Energy 2017, 189, 640–653. [Google Scholar] [CrossRef]
- Martinez, C.M.; Hu, X.; Cao, D.; Velenis, E.; Gao, B.; Wellers, M. Energy Management in Plug-in Hybrid Electric Vehicles: Recent Progress and a Connected Vehicles Perspective. IEEE Trans. Veh. Technol. 2017, 66, 4534–4549. [Google Scholar] [CrossRef]
- Liu, T.; Hu, X.; Li, S.E.; Cao, D. Reinforcement Learning Optimized Look-Ahead Energy Management of a Parallel Hybrid Electric Vehicle. IEEE/ASME Trans. Mechatron. 2017, 22, 1497–1507. [Google Scholar] [CrossRef]
- Xie, S.; Hu, X.; Xin, Z.; Li, L. Time-Efficient Stochastic Model Predictive Energy Management for a Plug-In Hybrid Electric Bus with an Adaptive Reference State-of-Charge Advisory. IEEE Trans. Veh. Technol. 2018, 67, 5671–5682. [Google Scholar] [CrossRef]
- Orecchini, F.; Santiangeli, A. “Automakers” powertrain options for hybrid and electric vehicles. In Electric and Hybrid Vehicles-Power Sources, Models, Sustainability, Infrastructure and the Market; Pistoia, G., Ed.; Elsevier: Amsterdam, The Netherlands, 2010; pp. 579–636. [Google Scholar]
- Fabio, O.; Adriano, Z.F.S. Technological analysis of solutions and development strategies proposed by the major automakers. In Electrical and Hybrid Propulsion Systems: From Source on Board to Mechanical Engineering; Brusaglino, G., Pede, G., Vitale, E., Eds.; ENEA: Rome, Italy, 2009; ISBN 978-88-8286-205-3. [Google Scholar]
- Capasso, C.; Veneri, O. Experimental analysis on the performance of lithium based batteries for road full electric and hybrid vehicles. Appl. Energy 2014, 136, 921–930. [Google Scholar] [CrossRef]
- Ahmed, Q.; Cai, H.; Rizzoni, G.; Xu, L. Modeling and Control of a Novel Power Split Hybrid Electric Vehicle. ASME 2014 Dyn. Syst. Control Conf. 2014, 46193, V002T34A001. [Google Scholar] [CrossRef]
- Zhang, Z.W. Study on Hybrid Vehicle Regenerative Braking Control Parameters Affecting to Vehicle Performance Analysis and Simulation. Key Eng. Mater. 2014, 579–580, 745–748. [Google Scholar] [CrossRef]
- Oliveira, A.; Bertoti, E.; Eckert, J.; Yamashita, R.; Costa, E.; Silva, L.; Dedini, F. Evaluation of Energy Recovery Potential through Regenerative Braking for a Hybrid Electric Vehicle in a Real Urban Drive Scenario. SAE Tech. Pap. 2016, 214, 012013. [Google Scholar] [CrossRef]
- Orecchini, F.; Santiangeli, A.; Dell’Era, A. EVs and HEVs Using Lithium-Ion Batteries. Lithium-Ion Batter. Adv. Appl. 2014, 205–248. [Google Scholar] [CrossRef]
- Tran, M.-K.; Akinsanya, M.; Panchal, S.; Fraser, R.; Fowler, M. Design of a Hybrid Electric Vehicle Powertrain for Performance Optimization Considering Various Powertrain Components and Configurations. Vehicles 2021, 3, 2. [Google Scholar] [CrossRef]
- Tran, M.-K.; Bhatti, A.; Vrolyk, R.; Wong, D.; Panchal, S.; Fowler, M.; Fraser, R. A Review of Range Extenders in Battery Electric Vehicles: Current Progress and Future Perspectives. World Electr. Veh. J. 2021, 12, 54. [Google Scholar] [CrossRef]
- Eren, Y.; Gorgun, H. An applied methodology for multi-objective optimum sizing of hybrid electric vehicle components. Int. J. Hydrogen Energy 2015, 40, 2312–2319. [Google Scholar] [CrossRef]
- Adriano, S.; Chiara, F.; Fabrizio, Z.; Alessandro, D.; Fabio, O.; Annalisa, D. Experimental Analysis of the Auxiliaries Consumption in the Energy Balance of a Pre-series Plug-in Hybrid-electric Vehicle. Energy Procedia 2014, 45, 779–788. [Google Scholar] [CrossRef]
- Zhu, D.; Pritchard, E.; Dadam, S.R.; Kumar, V.; Xu, Y. Optimization of rule-based energy management strategies for hybrid vehicles using dynamic programming. Combust. Engines 2021, 184, 3–10. [Google Scholar] [CrossRef]
- Benajes, J.; García, A.; Monsalve-Serrano, J.; Martínez-Boggio, S. Optimization of the parallel and mild hybrid vehicle platforms operating under conventional and advanced combustion modes. Energy Convers. Manag. 2019, 190, 73–90. [Google Scholar] [CrossRef]
- O’Driscoll, R.; Stettler, M.E.J.; Molden, N.; Oxley, T.; ApSimon, H.M. Real world CO2 and NOx emissions from 149 Euro 5 and 6 diesel, gasoline and hybrid passenger cars. Sci. Total Environ. 2018, 621, 282–290. [Google Scholar] [CrossRef]
- Cubito, C.; Millo, F.; Boccardo, G.; Di Pierro, G.; Ciuffo, B.; Fontaras, G.; Serra, S.; Otura Garcia, M.; Trentadue, G. Impact of Different Driving Cycles and Operating Conditions on CO2 Emissions and Energy Management Strategies of a Euro-6 Hybrid Electric Vehicle. Energies 2017, 10, 1590. [Google Scholar] [CrossRef]
- Huang, Y.; Surawski, N.C.; Organ, B.; Zhou, J.L.; Tang, O.H.H.; Chan, E.F.C. Fuel consumption and emissions performance under real driving: Comparison between hybrid and conventional vehicles. Sci. Total Environ. 2019, 659, 275–282. [Google Scholar] [CrossRef] [PubMed]
- Luján, J.M.; García, A.; Monsalve-Serrano, J.; Martínez-Boggio, S. Effectiveness of hybrid powertrains to reduce the fuel consumption and NOx emissions of a Euro 6d-temp diesel engine under real-life driving conditions. Energy Convers. Manag. 2019, 199, 111987. [Google Scholar] [CrossRef]
- Zuccari, F.; Orecchini, F.; Santiangeli, A.; Nardone, L.; Spazzafumo, G.; Ortenzi, F.; Genovese, A.; Singh, K.V.; Bansal, H.O.; Singh, D. Energy consumption of a last generation full hybrid vehicle compared with a conventional vehicle in real drive conditions. Energy Procedia 2019, 148, 77–107. [Google Scholar] [CrossRef]
- Benajes, J.; García, A.; Monsalve-Serrano, J.; Sari, R. Potential of RCCI Series Hybrid Vehicle Architecture to Meet the Future CO2 Targets with Low Engine-Out Emissions. Appl. Sci. 2018, 8, 1472. [Google Scholar] [CrossRef]
- Helmers, E.; Leitão, J.; Tietge, U.; Butler, T. CO2-equivalent emissions from European passenger vehicles in the years 1995–2015 based on real-world use: Assessing the climate benefit of the European “diesel boom”. Atmos. Environ. 2019, 198, 122–132. [Google Scholar] [CrossRef]
- Singh, K.V.; Bansal, H.O.; Singh, D. A comprehensive review on hybrid electric vehicles: Architectures and components. J. Mod. Transp. 2019, 27, 77–107. [Google Scholar] [CrossRef]
- Correa, G.; Muñoz, P.M.; Rodriguez, C.R. A comparative energy and environmental analysis of a diesel, hybrid, hydrogen and electric urban bus. Energy 2019, 187, 115906. [Google Scholar] [CrossRef]
- Szałek, A.; Pielecha, I. The Influence of Engine Downsizing in Hybrid Powertrains on the Energy Flow Indicators under Actual Traffic Conditions. Energies 2021, 14, 2872. [Google Scholar] [CrossRef]
- Orecchini, F.; Santiangeli, A.; Zuccari, F. Real Drive Well-to-Wheel Energy Analysis of Conventional and Electrified Car Powertrains. Energies 2020, 13, 4788. [Google Scholar] [CrossRef]
- Alessandrini, A.; Cignini, F.; Ortenzi, F.; Pede, G.; Stam, D. Advantages of retrofitting old electric buses and minibuses. Energy Procedia 2017, 126, 995–1002. [Google Scholar] [CrossRef]
- Orecchini, F.; Santiangeli, A.; Pistoia, G. Chapter 22—Electric and Hybrid Vehicle-Power Sources, Models, Sustainability, Infrastructure and the Market; Elsevier: Amsterdam, The Netherlands, 2010; ISBN 978-0-444-53565-8. [Google Scholar]
- Meinrenken, C.J.; Lackner, K.S. Fleet view of electrified transportation reveals smaller potential to reduce GHG emissions. Appl. Energy 2015, 138, 393–403. [Google Scholar] [CrossRef]
- Yazdanie, M.; Noembrini, F.; Heinen, S.; Espinel, A.; Boulouchos, K. Well-to-wheel costs, primary energy demand, and greenhouse gas emissions for the production and operation of conventional and alternative vehicles. Transp. Res. Part D Transp. Environ. 2016, 48, 63–84. [Google Scholar] [CrossRef]
- Orecchini, F.; Santiangeli, A.; Zuccari, F. Hybrid-electric system truth test: Energy analysis of Toyota Prius IV in real urban drive conditions. Sustain. Energy Technol. Assess. 2020, 37, 100573. [Google Scholar] [CrossRef]
- ISFORT. 17th Mobility Report in Italy. 2020. Available online: https://www.isfort.it/wp-content/uploads/2020/12/RapportoMobilita2020.pdf (accessed on 10 November 2021).
- Alessandrini, A.; Filippi, F.; Orecchini, F.; Ortenzi, F. A New Method for Collecting Vehicle Behavior in Daily Use for Energy and Environmental Analysis. J. Automob. Eng.-ImechE 2006, 220, 1527. [Google Scholar] [CrossRef]
- Alessandrini, A.; Orecchini, F. A driving cycle for electrically-driven vehicles in Rome. Proc. Inst. Mech. Eng. Part D J. Automob. Eng. 2003, 217, 781–789. [Google Scholar] [CrossRef]
- Alessandrini, A.; Orecchini, F.; Ortenzi, F.; Campbell, F. Drive-style emission testing on conventional and hybrid vehicles to measure real road transport emissions. Eur. Transp. Res. Rev. 2009, 1, 57–66. [Google Scholar] [CrossRef][Green Version]
- Alessandrini, A.; Filippi, F.; Ortenzi, F. Consumption calculation of vehicles using OBD data. In Proceedings of the 20th International Emission Inventory Conference—Emission Inventories-Meeting the Challenges Posed by Emerging Global, National, and Regional and Local Air Quality Issues, Tampa, FL, USA, 13–16 August 2012. [Google Scholar]
- Orecchini, F.; Santiangeli, A.; Zuccari, F.; Alessandrini, A.; Cignini, F.; Ortenzi, F. A statistical analysis to compare results of different on-road vehicle performance testing: The Toyota Yaris hybrid case study. 2021, in press. [Google Scholar]
Figure 1.
Trial route (dark line) referring to the environmental protection strips of Rome.
Figure 1.
Trial route (dark line) referring to the environmental protection strips of Rome.
Figure 5.
Altimetric profile of the test-path.
Figure 5.
Altimetric profile of the test-path.
Figure 6.
Simplified mechanical diagram of the Toyota Yaris hybrid drive system.
Figure 6.
Simplified mechanical diagram of the Toyota Yaris hybrid drive system.
Figure 7.
Driving cycle of the test route used in the Toyota Yaris 2020 test drives.
Figure 7.
Driving cycle of the test route used in the Toyota Yaris 2020 test drives.
Figure 8.
Frequency distribution of the ZEVt values.
Figure 8.
Frequency distribution of the ZEVt values.
Figure 9.
Frequency distribution of the ZEVS values.
Figure 9.
Frequency distribution of the ZEVS values.
Figure 10.
Frequency distribution of the EVt values.
Figure 10.
Frequency distribution of the EVt values.
Figure 11.
Frequency distribution of the EVS values.
Figure 11.
Frequency distribution of the EVS values.
Figure 12.
Frequency distribution of the equivalent mileage values.
Figure 12.
Frequency distribution of the equivalent mileage values.
Figure 13.
Frequency distribution of the ICE efficiency values.
Figure 13.
Frequency distribution of the ICE efficiency values.
Figure 14.
Frequency distribution of the hybrid system efficiency values.
Figure 14.
Frequency distribution of the hybrid system efficiency values.
Figure 15.
Energy flows of the traction system [kJ/km].
Figure 15.
Energy flows of the traction system [kJ/km].
Figure 16.
Distribution of energy flows to transmission.
Figure 16.
Distribution of energy flows to transmission.
Figure 17.
The energy flow of hybrid system Yaris 2020 and 2017.
Figure 17.
The energy flow of hybrid system Yaris 2020 and 2017.
Table 1.
Main features of the two Toyota hybrid Yaris vehicles.
Table 1.
Main features of the two Toyota hybrid Yaris vehicles.
| Characteristic | YARIS Hybrid 2017 | YARIS Hybrid 2020 |
|---|
| Mass |
| Empty mass [kg] | 1090 | 1165 |
| Total mass [kg] | 1565 | 1615 |
| Engine |
| Displacement [cm3] | 1497 | 1490 |
| Number of cylinders | 4 in line | 3 in line |
| Compression ratio | 13.4 | 14.0 |
| Maximum power [kW] | 54 (6000 rpm) | 64 (5500 rpm) |
| Maximum torque [Nm] | 111 | 120 |
| Electric motor |
| Type | Permanent magnet synchronous |
| Maximum power [kW] | 45 | 59 |
| Maximum torque [Nm] | 169 | 141 |
| Battery HV |
| Type | Nickel-Metal Hydride | Lithium ion |
| Nominal voltage [V] | 144 | 177.6 |
| Capacity [Ah] | 6.5 | 4.3 |
| Energy capacity [Wh] | 936 | 736 |
| Powertrain |
| Maximum power [kW] | 74 | 85 |
Table 2.
Summary of average percentage values ZEV mode parameters of Yaris Hybrid 2017 and 2020.
Table 2.
Summary of average percentage values ZEV mode parameters of Yaris Hybrid 2017 and 2020.
| Parameter | YARIS 2020 | YARIS 2017 | Percentage Change |
|---|
| Urban | Suburban | Test | Urban | Suburban | Test | Urban | Suburban | Test |
|---|
| ZEVt | 82.5% | 75.8% | 78.0% | 75.4% | 63.6% | 67.7% | 9.5% | 19.2% | 15.3% |
| ZEVt stationary vehicle | 15.5% | 19.2% | 17.9% | 15.3% | 27.6% | 22.8% | 1.5% | −30.3% | −21.4% |
| ZEVt glide | 32.6% | 33.2% | 33.0% | 59.4% | 43.1% | 49.4% | −45.1% | −23.1% | −33.3% |
| ZEVt electric-only traction | 51.8% | 47.6% | 49.1% | 25.3% | 29.3% | 27.7% | 105.2% | 62.6% | 77.0% |
| ZEVS | 76.1% | 64.8% | 66.6% | 65.3% | 35.4% | 40.5% | 16.5% | 83.3% | 64.3% |
| ZEVS glide | 43.0% | 40.4% | 40.9% | 47.0% | 58.1% | 55.0% | −8.5% | −30.4% | −25.6% |
| ZEVS electric-only traction | 57.0% | 59.6% | 59.1% | 53.0% | 41.9% | 45.0% | 7.5% | 42.1% | 31.3% |
| EVt | 73.9% | 62.4% | 66.2% | 49.7% | 36.3% | 40.1% | 48.6% | 71.6% | 64.8% |
| EVS | 65.7% | 52.9% | 54.7% | 56.7% | 17.9% | 23.0% | 16.0% | 195.9% | 137.6% |
Table 3.
Maximum values, minimum values and normalised standard deviation of the parameter values for the analysis of vehicle operation in zero-emission vehicle (ZEV) mode.
Table 3.
Maximum values, minimum values and normalised standard deviation of the parameter values for the analysis of vehicle operation in zero-emission vehicle (ZEV) mode.
| Parameter | ZEVt | ZEVS | EVt | EVS |
|---|
| 2020 | 2017 | 2020 | 2017 | 2020 | 2017 | 2020 | 2017 |
|---|
| Maximum | 83.2% | 72.0% | 74.9% | 36.1% | 73.9% | 46.3% | 66.8% | 36.1% |
| Minimum | 65.2% | 60.9% | 47.7% | 16.1% | 48.2% | 32.7% | 32.9% | 16.1% |
| Normalized standard deviation | 0.0459 | 0.0401 | 0.0943 | 0.1345 | 0.0870 | 0.0832 | 0.1614 | 0.1345 |
Table 4.
Summary energy analysis parameters value of Yaris Hybrid 2017 and 2020.
Table 4.
Summary energy analysis parameters value of Yaris Hybrid 2017 and 2020.
| Parameter | YARIS 2020 | YARIS 2017 | Percentage Change |
|---|
| Urban | Suburban | Test | Urban | Suburban | Test | Urban | Suburban | Test |
|---|
| Mileage [g/km] | 28.3 | 21.7 | 22.8 | 39.1 | 34.2 | 35.1 | −27.7% | −36.5% | −35.1% |
| Equivalent mileage [g/km] | 28.1 | 21.5 | 22.5 | 39.1 | 33.8 | 34.7 | −28.1% | −36.5% | −35.2% |
| ICE efficiency | 31.4% | 36.2% | 35.3% | 32.7% | 35.3% | 34.8% | −3.9% | 2.5% | 1.3% |
| Hybrid system efficiency | 33.9% | 43.0% | 41.2% | 31.3% | 39.8% | 38.1% | 8.5% | 8.1% | 8.2% |
Table 5.
Maximum values, minimum values and normalized standard deviation of the parameter values for the energy analysis of the vehicle.
Table 5.
Maximum values, minimum values and normalized standard deviation of the parameter values for the energy analysis of the vehicle.
| Parameter | Equivalent Mileage [g/km] | ICE Efficiency | Hybrid System Efficiency |
|---|
| 2020 | 2017 | 2020 | 2017 | 2020 | 2017 |
|---|
| Maximum | 31.97 | 42.37 | 37.2% | 37.7% | 45.8% | 41.1% |
| Minimum | 17.82 | 27.81 | 25.0% | 29.5% | 30.4% | 31.3% |
| Normalized standard deviation | 0.1469 | 0.0917 | 0.0463 | 0.0342 | 0.0513 | 0.0489 |
Table 6.
Comparison between parameters of the 2017–2020 tests.
Table 6.
Comparison between parameters of the 2017–2020 tests.
| | July 2020 | October 2017 | Variation |
|---|
| Urban | Suburban | Test | Urban | Suburban | Test | Urban | Suburban | Test |
|---|
| Time [s] | 1577 | 3202 | 4779 | 2164 | 4070 | 6233 | 37.2% | 27.1% | 30.4% |
| Stationary time [%] | 13.3% | 14.7% | 14.2% | 13.4% | 19.5% | 17.3% | 0.6% | 32.4% | 21.8% |
| Average speed [m/s] | 3.8 | 10.0 | 8.0 | 3.0 | 7.8 | 6.1 | −19.9% | −22.1% | −22.8% |
| Average speed with v > 0 | 4.4 | 11.7 | 9.3 | 3.5 | 9.7 | 7.4 | −19.8% | −17.6% | −19.9% |
| Publisher’s Note: MDPI stays neutral with regard to jurisdictional claims in published maps and institutional affiliations. |
© 2021 by the authors. Licensee MDPI, Basel, Switzerland. This article is an open access article distributed under the terms and conditions of the Creative Commons Attribution (CC BY) license (https://creativecommons.org/licenses/by/4.0/).


 ,
, 


