
Optimization of Powertrain in EV


Department of Power Electronics and Energy Control Systems, AGH University of Science and Technology, 30-059 Krakow, Poland
Energies 2021, 14(3), 725; https://doi.org/10.3390/en14030725
Submission received: 20 December 2020
/
Revised: 21 January 2021
/
Accepted: 27 January 2021
/
Published: 30 January 2021
(This article belongs to the Special Issue Selected Papers from The 12th International Conference on Electrical Power Quality and Utilization (EPQU2020))
Abstract
The method for preliminary powertrain design is presented in the paper. Performance of the EV is realized by motor torque–speed curve and gear ratio optimization. The typical two-zone mechanical characteristic of a PMSM traction motor is included in the optimization program. The longitudinal vehicle model is considered in the paper. Some examples try to show the calculation possibilities in application to existing vehicles: Tesla Model S and Mini Cooper SE.
1. Introduction
The conversion of electrical energy into mechanical is very important for the drive in an Electric Vehicle (EV) and optimization of the car performance is discussed in the article. The path from battery to a traction force on the car wheels is called powertrain [1,2].
The presented optimization problem can be used to design preliminary powertrain in a EV. The torque–speed curve (mechanical characteristics) [3] of PMSM (Permanent Magnet Synchronous Motor) is introduced. This type of motor is the most popular in car manufacturers (Toyota, Nissan, BMW, Renault), but Tesla induction motor characteristics are also considered. The EV mathematical model is presented more precisely than in [4]. Two design examples are included in the paper: gear ratio optimization in Tesla Model S, traction motor, and gear ratio optimization in the Mini Cooper SE.
The optimization is considered as a Nonlinear Programming Problem because the objective function (performance index) is nonlinear, and a longitudinal model of motion is also nonlinear. The value of the objective function is calculated after car race simulation. Hence, the objective function is not explicit and the Simplex Method (Nelder–Mead Method or Downhill Simplex Method) [5] is very useful because derivatives of the objective function are unknown. In the Matlab environment, fminsearch is a Simplex Method without constraints.
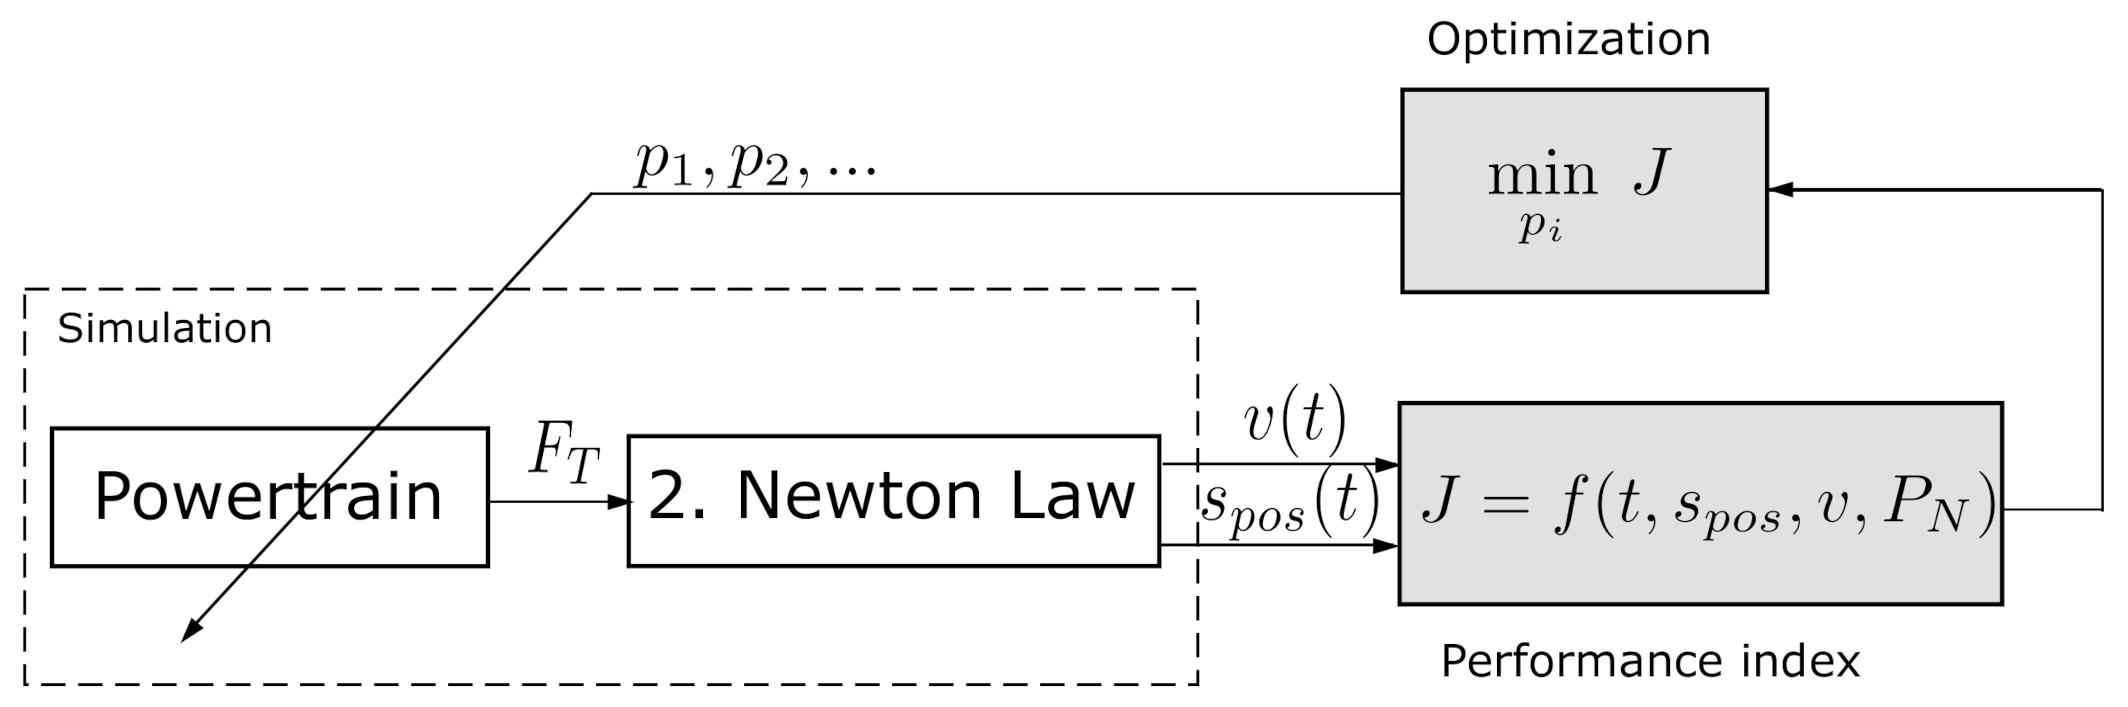
The method of the powertrain optimization shows Figure 1.
The powertrain parameters that are optimized are , performance index can be function of time t, position , speed v or power of the traction motor . The traction force on wheels is the output of the powertrain.
The powertrain optimization is often considered in publications, and there are some examples for EV and Hybrid Electric Vehicle (HEVs). The three ratios of planetary gear in HEV are presented in the paper [6], the optimization objectives include the 0–100 kmh acceleration time, CO emissions, HC compound emissions and NOx emissions under NEDC (New European Driving Cycle) conditions. However, the traction motor is not considered and the obtained results for one objective function are shown, but the optimization method is unknown. The more precise optimization of planetary gear ratios is presented in [7], where Particle Swarm Optimization is used.
The powertrain optimizations for PMSM and induction motors in the electric bus are shown in [8].
The optimization problem where the goal is to minimize the cumulative fuel consumption (for HEV) is considered in the article [9].
Parameters optimization of two-speed powertrain of electric vehicle based on genetic algorithm (GA) is considered in [10]. The different GA for a gearbox optimization (internal combustion engines) is used in the paper [11].
The parameter optimization for the CVT (continuously variable transmission) in 4-wheel drive HEV is considered in [12], where evolutionary based non-dominated sorting genetic algorithms-II (NSGA-II) is used.
The motor (wound rotor synchronous motor and PMSM) efficiency and battery optimization are considered in [13].
This paper shows another objective function (performance indexes) in optimization than previously cited and the deterministic minimization method (Nelder–Mead Method) instead of stochastic optimization. Additionally, three energy storages are included in the vehicle motion mathematical model, not one as in most publications, so the results of the optimization are more real. Some of the presented examples are also multi-objective optimization.
The paper presents: PMSM characteristics, EV model, the Nelder–Mead optimization method, two examples of powertrain optimization (Tesla S Model and Mini Cooper SE) for assumed performance indexes. The EV acceleration to 100 kmh, 1/4 mile and top speed are the indexes considered in the article.
2. PMSM Traction Motors
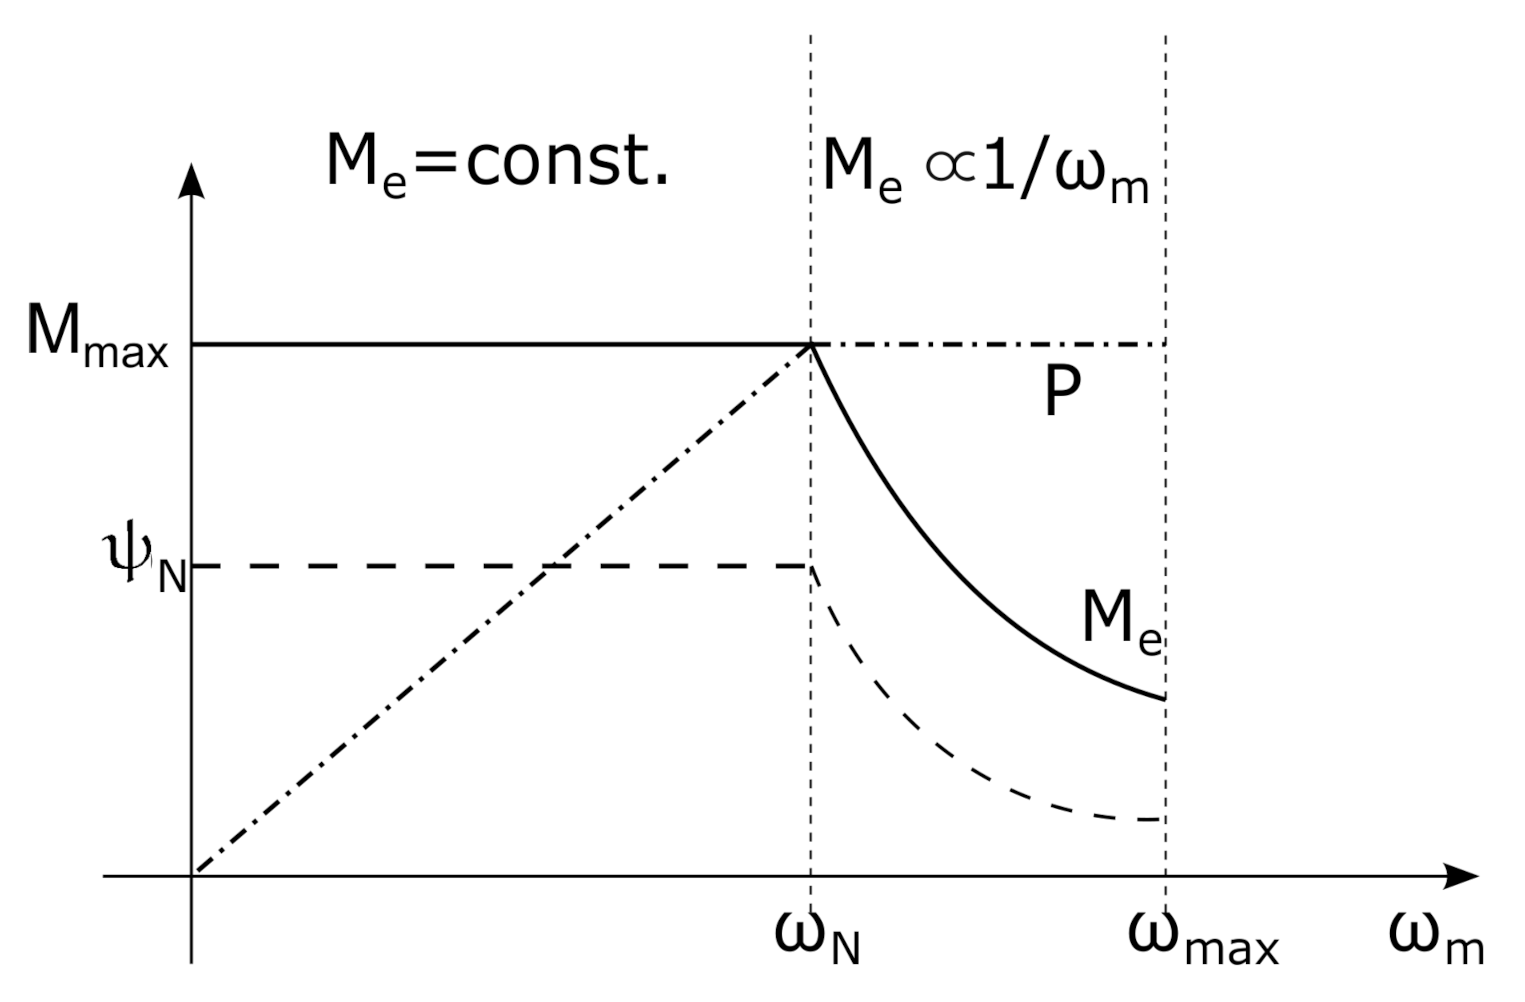
The work [14] (in 1977) discusses, for the first time, the three-zone angular velocity control of induction motors, which was generalised for other drives [1,2,3]. Figure 2 shows general characteristics , and flux linkage for PMSM traction motors.
The control zones shown in Figure 2 represent different types of electric motor operation:
- Zone 1:
- means working for constant torque and then the active power transferred to the working machine increases linearly as the angular speed increases (). This zone means also working with limited current and constant flux value in the air gap.
- Zone 2:
- means operating at constant active motor power , where the motor’s electromagnetic torque changes inversely proportionally to the motor’s angular velocity (). In this zone, the supply voltage equals the rated voltage and is the voltage limit. At the same time, the current in the stator winding is rated, and the flux in the air gap is reduced.
The curve from Figure 2 will be used in EV model, which will be optimized.
3. Longitudinal EV Model
The mathematical model for simulation of a EV is described more precisely than in [4].
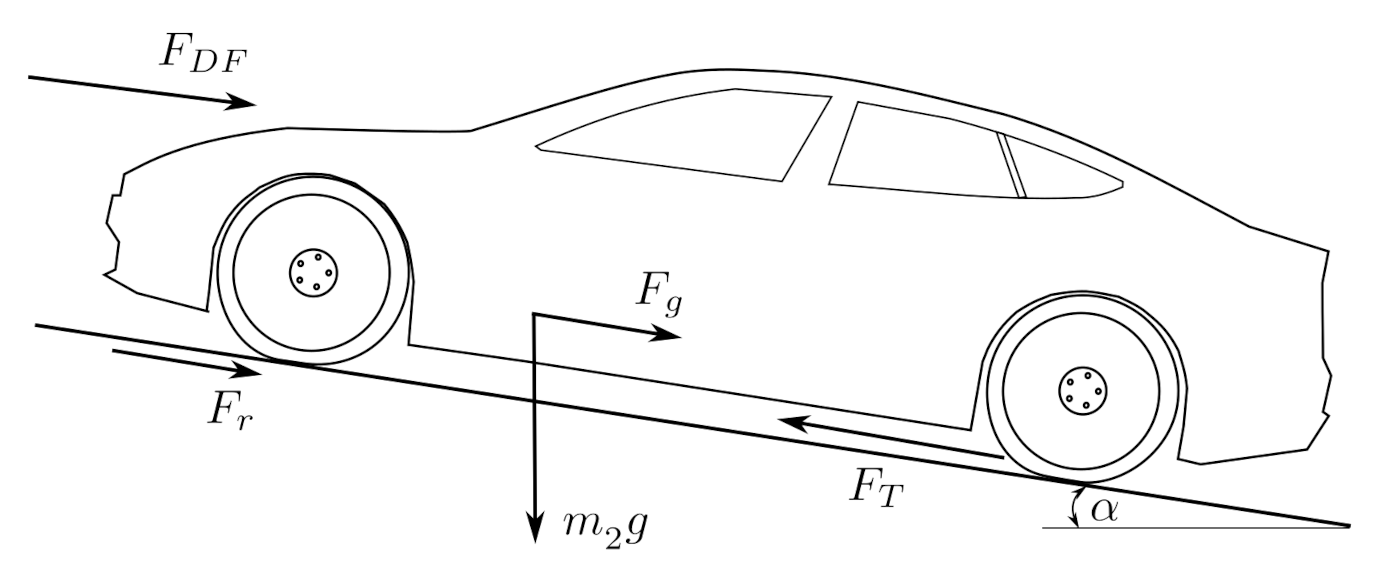
3.1. Forces
Tractive force is function of motor speed and is described by:
where i is gear ratio, is wheel diameter, and is motor torque.
Total rolling resistance is the sum of the resistances from all wheels [15] ( is neglected because, for a 10% road grade, it is ):
where v is EV speed in kmh and the rolling coefficient is = 0.01 ÷ 0.02 for a concrete surface.
Aerodynamic drag force:
where kg/m is air density, A is the cross sectional area (frontal area) of EV, is drag coefficient, and the speed of wind is .
Grade resistance is described as:
Newton’s second law for longitudinal motion of EV is in the following form:
The and are nonlinear functions, so the ordinary differential Equation (5) is nonlinear too. Thus, the numerical solution of this equation will be used in the optimization of the powertrain in EV.
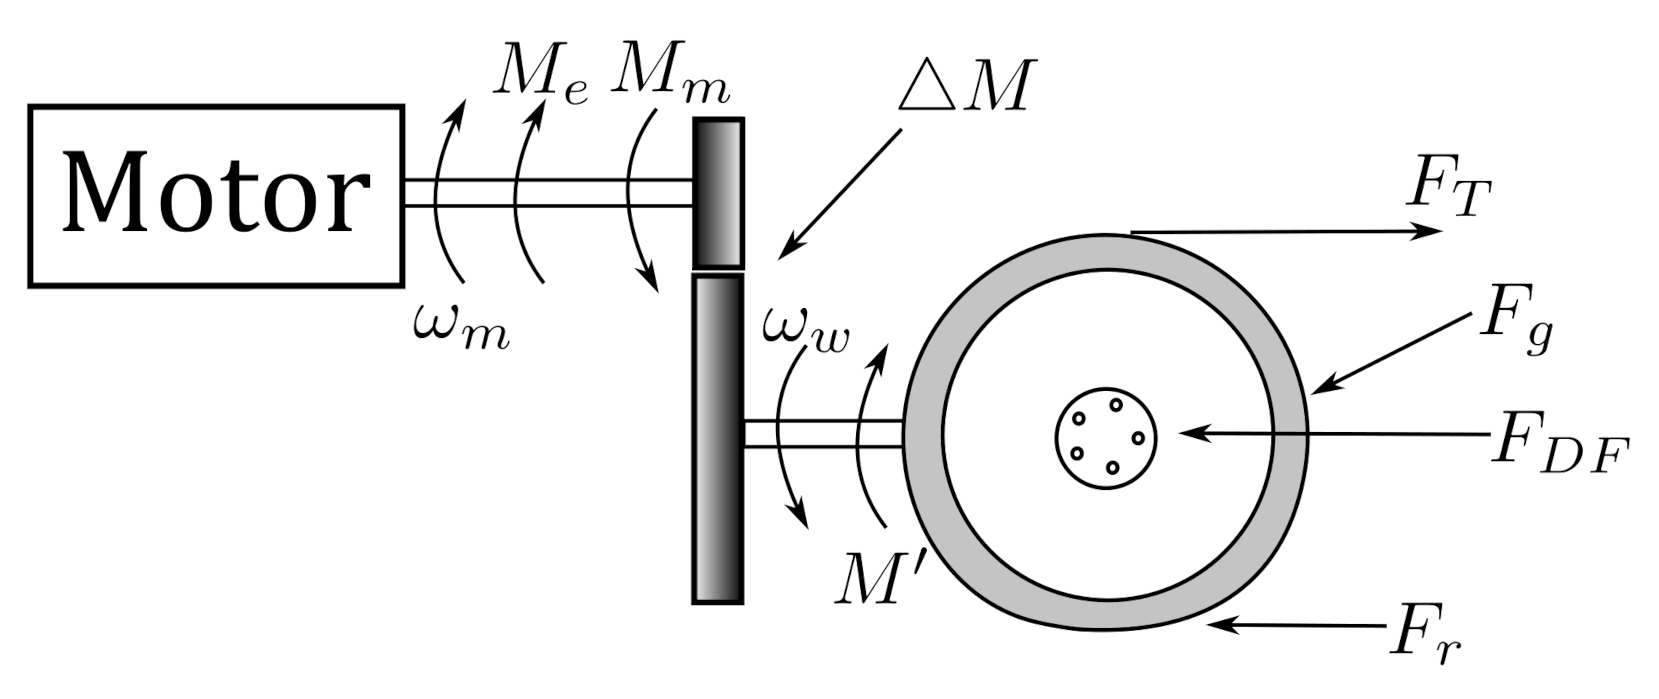
3.2. Torques, Mass, and Moments of Inertia
The conversion of the road loads to torques on the motor shaft by gear is described as:
where Coulomb friction can be calculated as load torque [17]:
Three kinetic energy storages are found in every EV. The first two storages are: rotor moment of inertia and a vehicle mass (); the equivalent mass or moment of inertia are:
the values are much smaller than .
The next energy storages are the remaining rotating elements: wheels (rims and tires), brake discs, shafts, etc. Considering any rotating mass of radius , it is possible to determine its moment of inertia or to specify an equivalent mass (for horizontal motion) of the same kinetic energy:
is each rotating element in power transmission. Hence, the principle of the energy conservation results in the formula:
where is the equivalent of mass calculated on the vehicle body. If v is car speed and radius of wheels is , then Equation (10) leads to:
For example, four wheels, each weighing 20 kg, should be added to the vehicle’s weight as 80 kg, while four brake discs, each weighing 3 kg and their diameter being half the size of the wheel, should be reduced four times, i.e., 3 kg should be added to the vehicle body.
Thus, small diameter and small mass rotating elements can be omitted from the mathematical model. In summary, the total moment of inertia that is reduced to the motor shaft and the total mass reduced to the EV body are:
Hence, the Newton’s second law is in the following form:
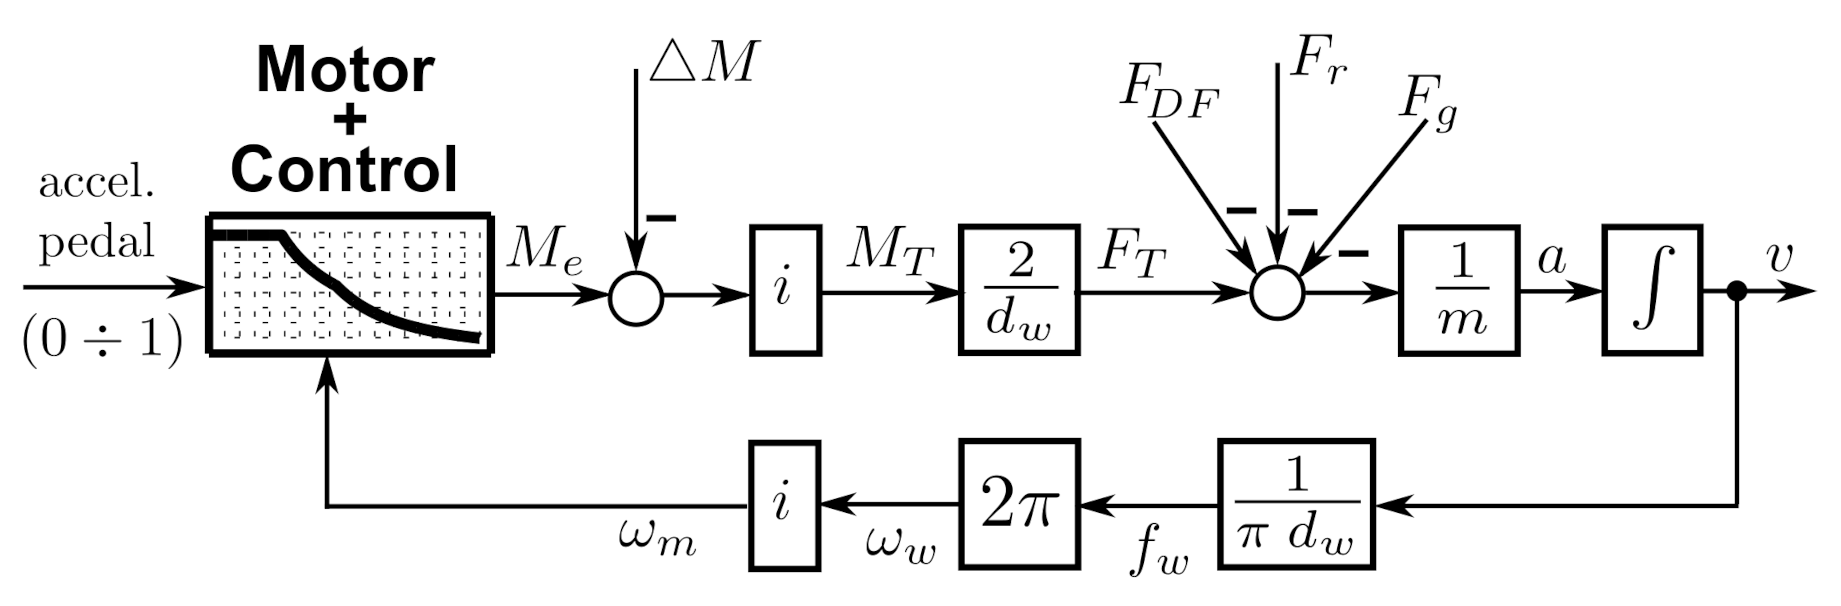
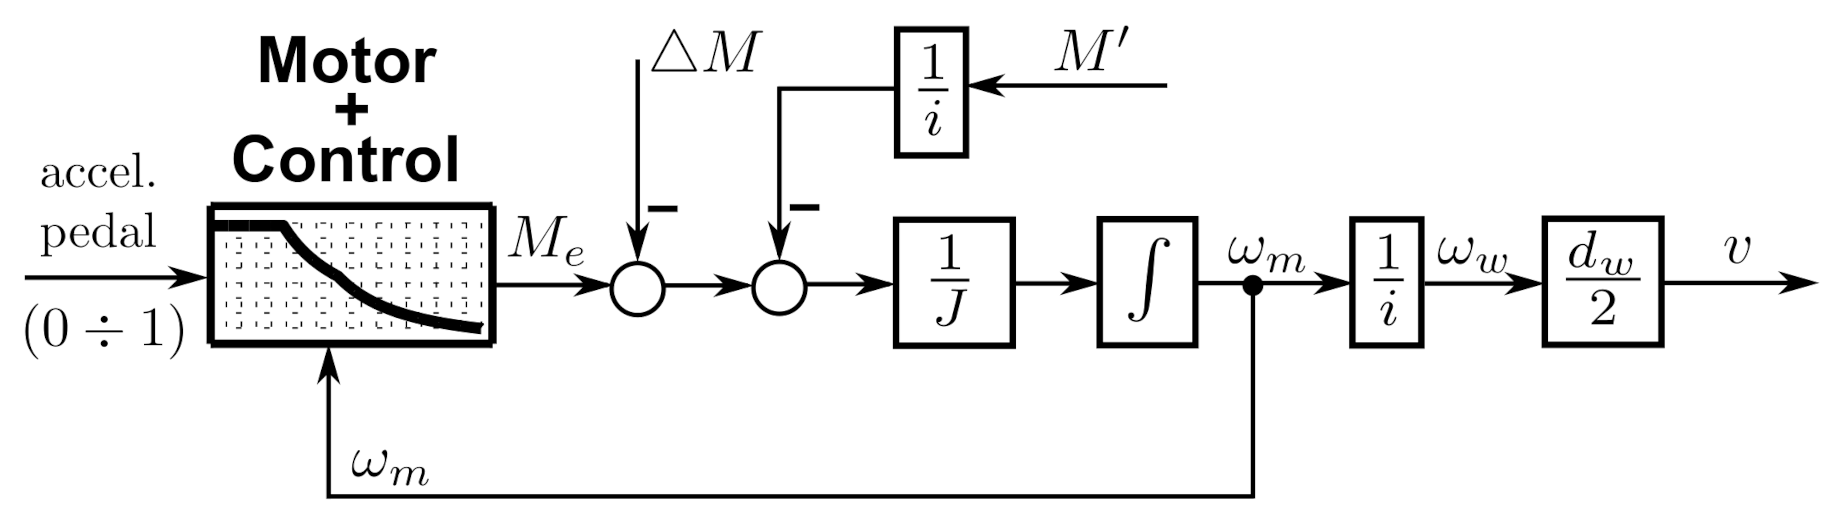
3.3. Model
Equations (5) and (13) lead to the block diagram in Figure 5 and Figure 6. The block Motor + Control is the torque–speed curve of a traction motor drive system that is presented for PMSM in Figure 2. The Coulomb friction is included in both models. In the block diagrams, three energy storages are considered that are given by Formula (12). The diameter of the wheels is , which changes rotational motion to longitudinal, and is found in every scheme because the torque also depends on (6).
The proposed model is not complicated like in, e.g., a Powertrain Blockset toolbox, which is the Matlab-Simulink environment, but should be sufficient for the preliminary design of the drive.
4. Optimization of Powertrain
The Nelder–Mead method [5] is used to optimize the gear ratio and the torque–speed motor curve in the powertrain of EV. The names Simplex method or amoeba method are used here.
A simplex is considered to be a convex figure in n-dimensional space that has vertices. This means that, for , it is a segment, for a triangle, and, for , a tetrahedron. To determine the minimum of the objective function, the following operations are performed on the simplex: sort, reflect extend, contract, shrink. Hence, for two dimensions, the search for the minimum of a function is similar to a moving amoeba.
Optimization of powertrain is realized by (as in Figure 1):
- Initial conditions: gear ratio i and torque–speed curve (block Motor + Control in Figure 5).
- EV model simulation (Figure 5).
- Calculating of performance index (objective function) .
- Minimization, which leads to new values of the gear ratio i and the torque–speed curve.
- Checking the stop condition: max iterations and errors, which leads to points 2 or 6.
- Stop.
The next two sections present a lot of powertrain optimization examples.
5. Gear Ratio Optimization in Tesla Model S P85
The Tesla Model S powertrain is one of the best known, and has been chosen as an example of the gear ratio selection for different tasks (performance).
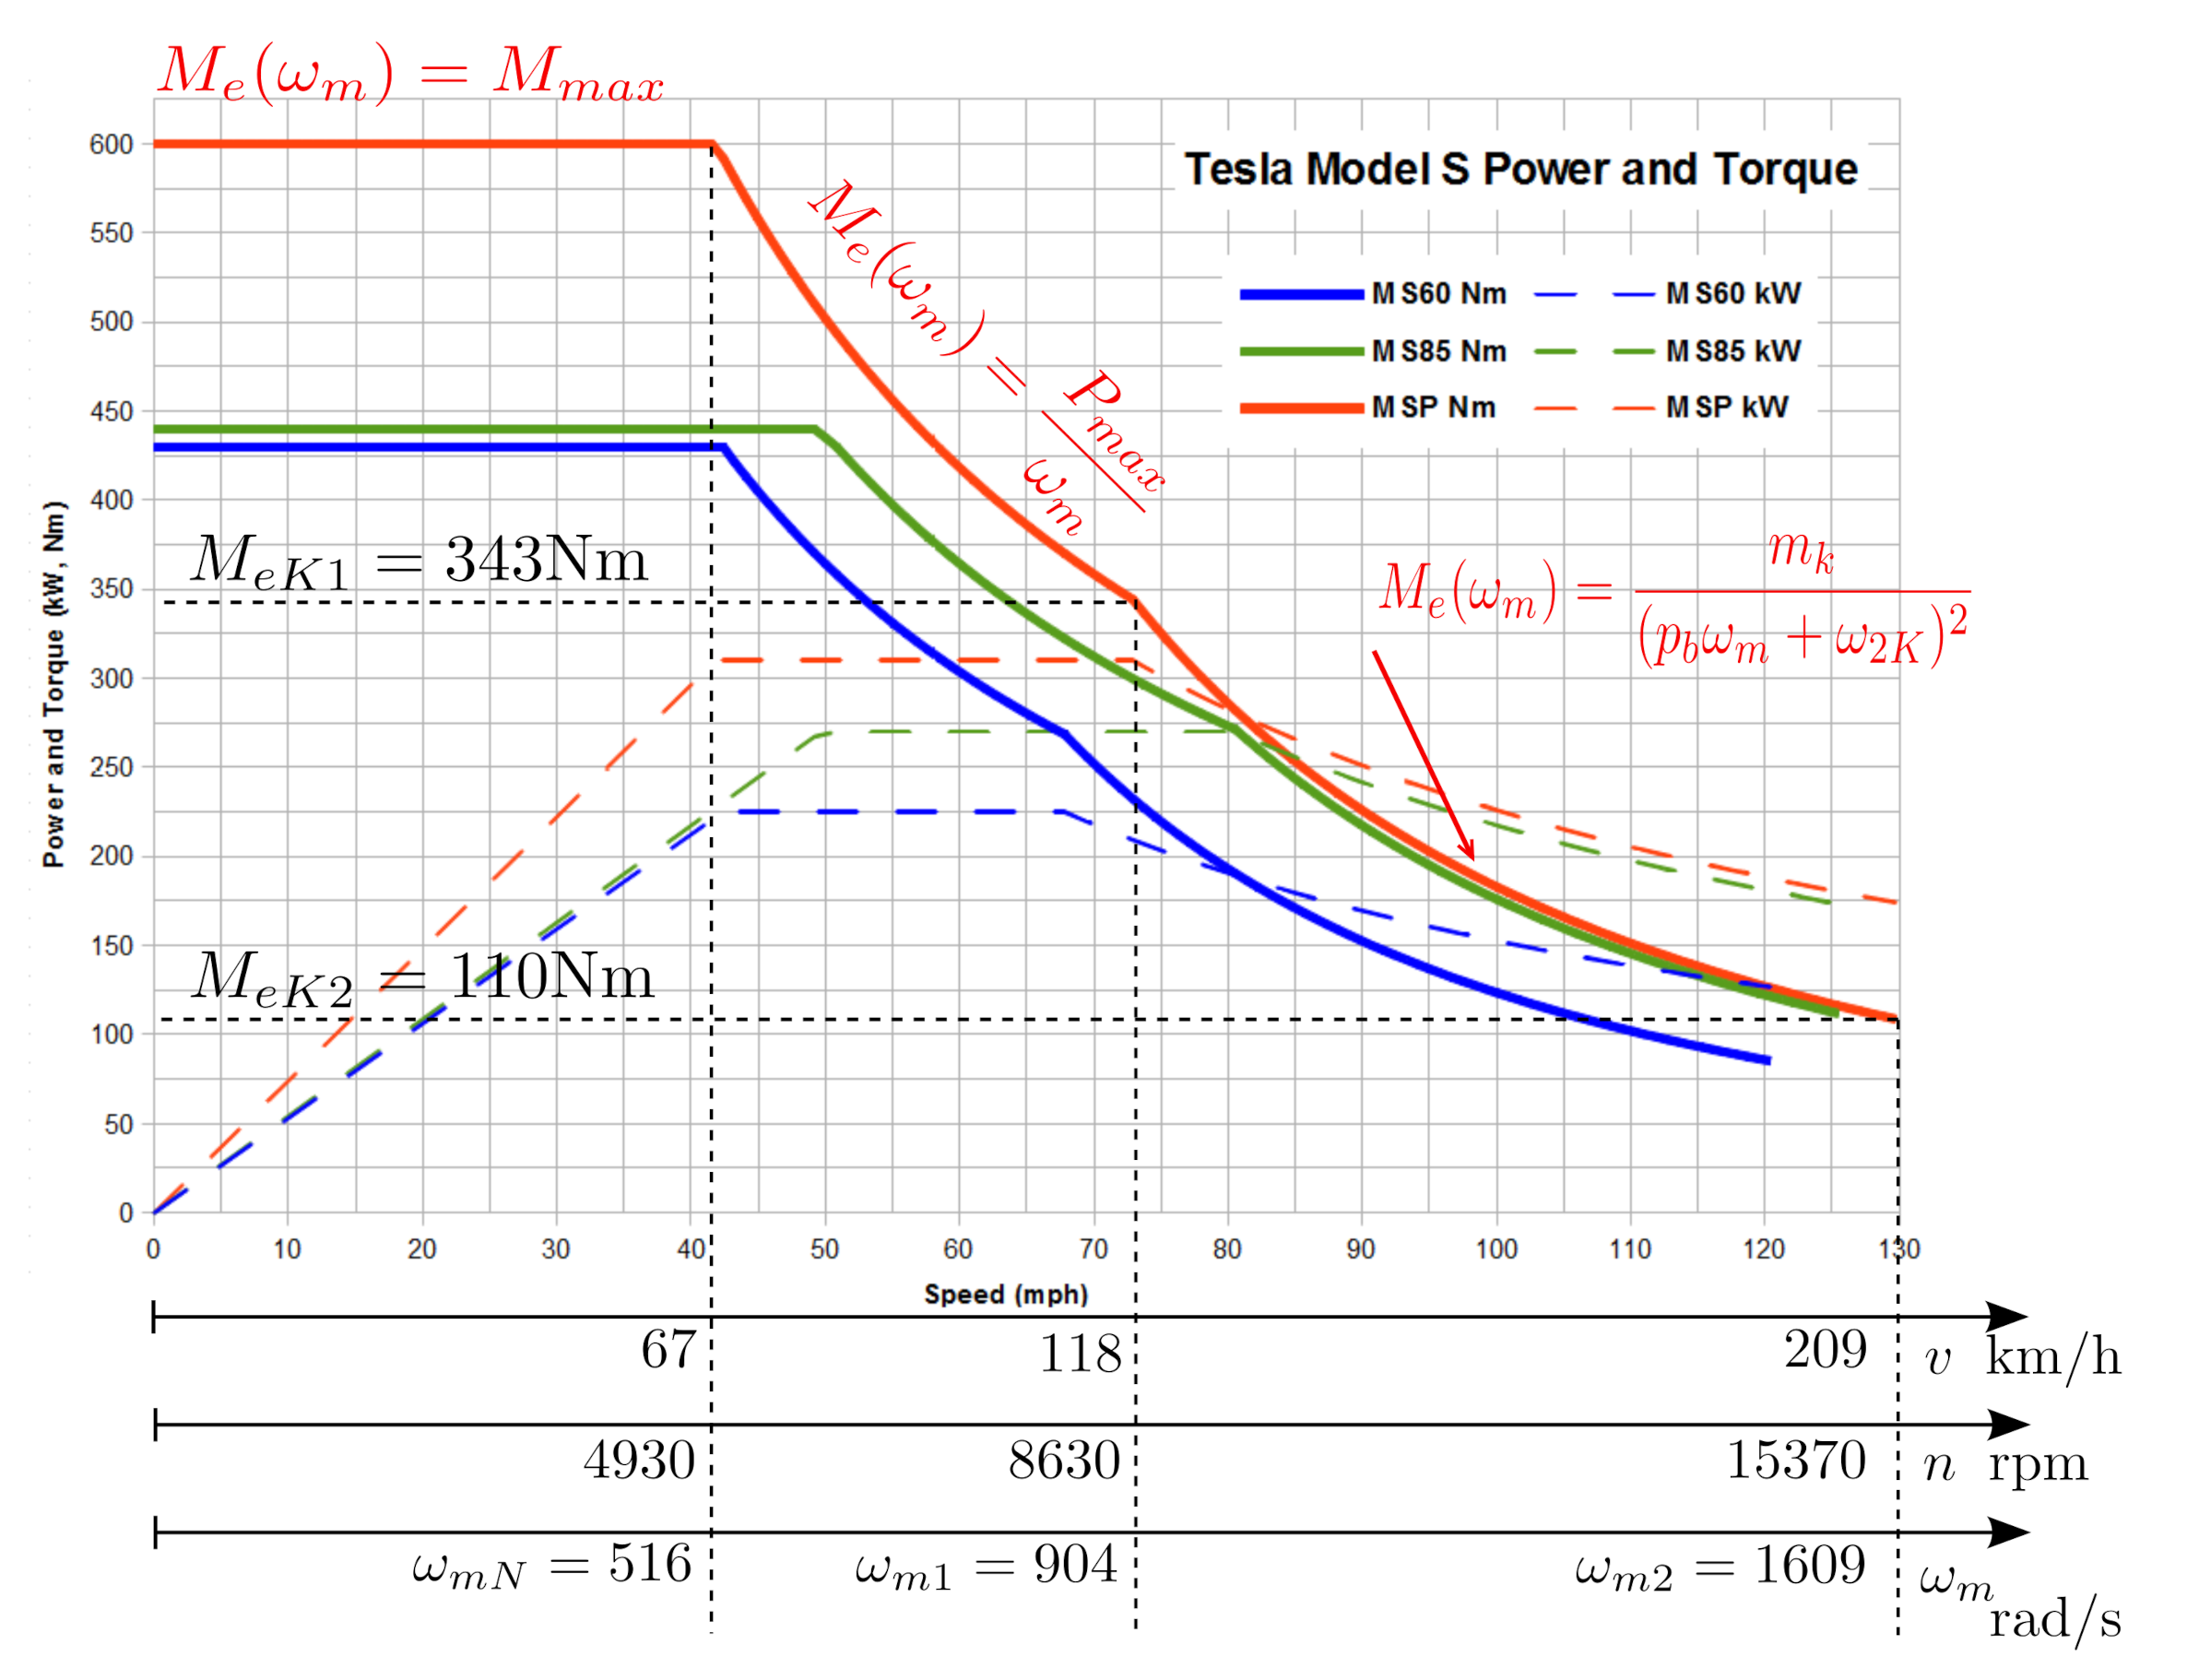
Figure 7 presents torque–speed and power–speed curves of the traction motor in the considered EV (red color).
Figure 7 shows 3 modes (zones) of operation for the induction motor:
The parameters of the previous model for Tesla Model S P85 are included from [4], and they are assumed as:
- kg,
- 0.06 kgm,
- , frontal area of the vehicle 2.4 m,
- 9.73, (assumed in [18]), which lead to .
- m.
Tesla Model S P85 (2012) [19]. This vehicle has the following performance:
- 0–60 mph (0–96.6 km/h): 4.6 s,
- 1/4-mile (402.5 m): 13.3 s and speed: 104 mph (167.5 km/h),
- top speed: 134 mph (215.7 km/h), which leads to 59.9 m/s.
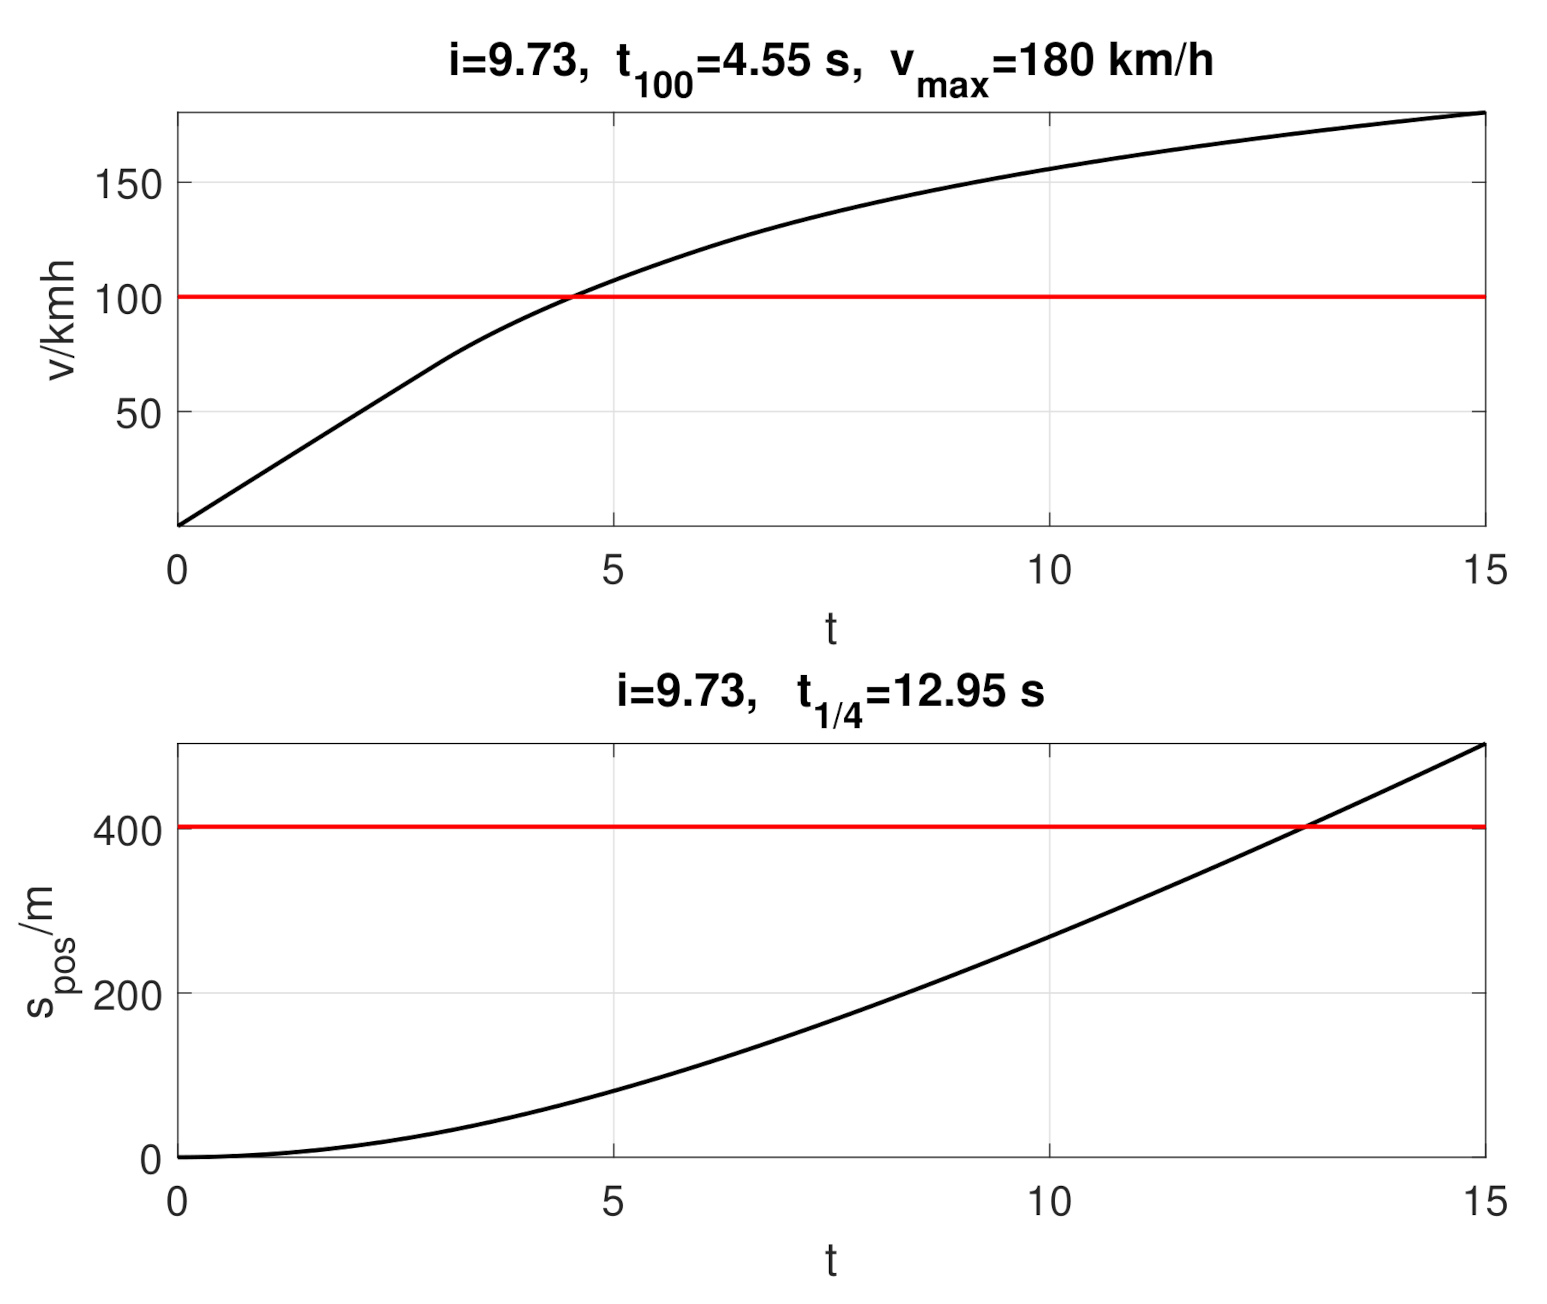
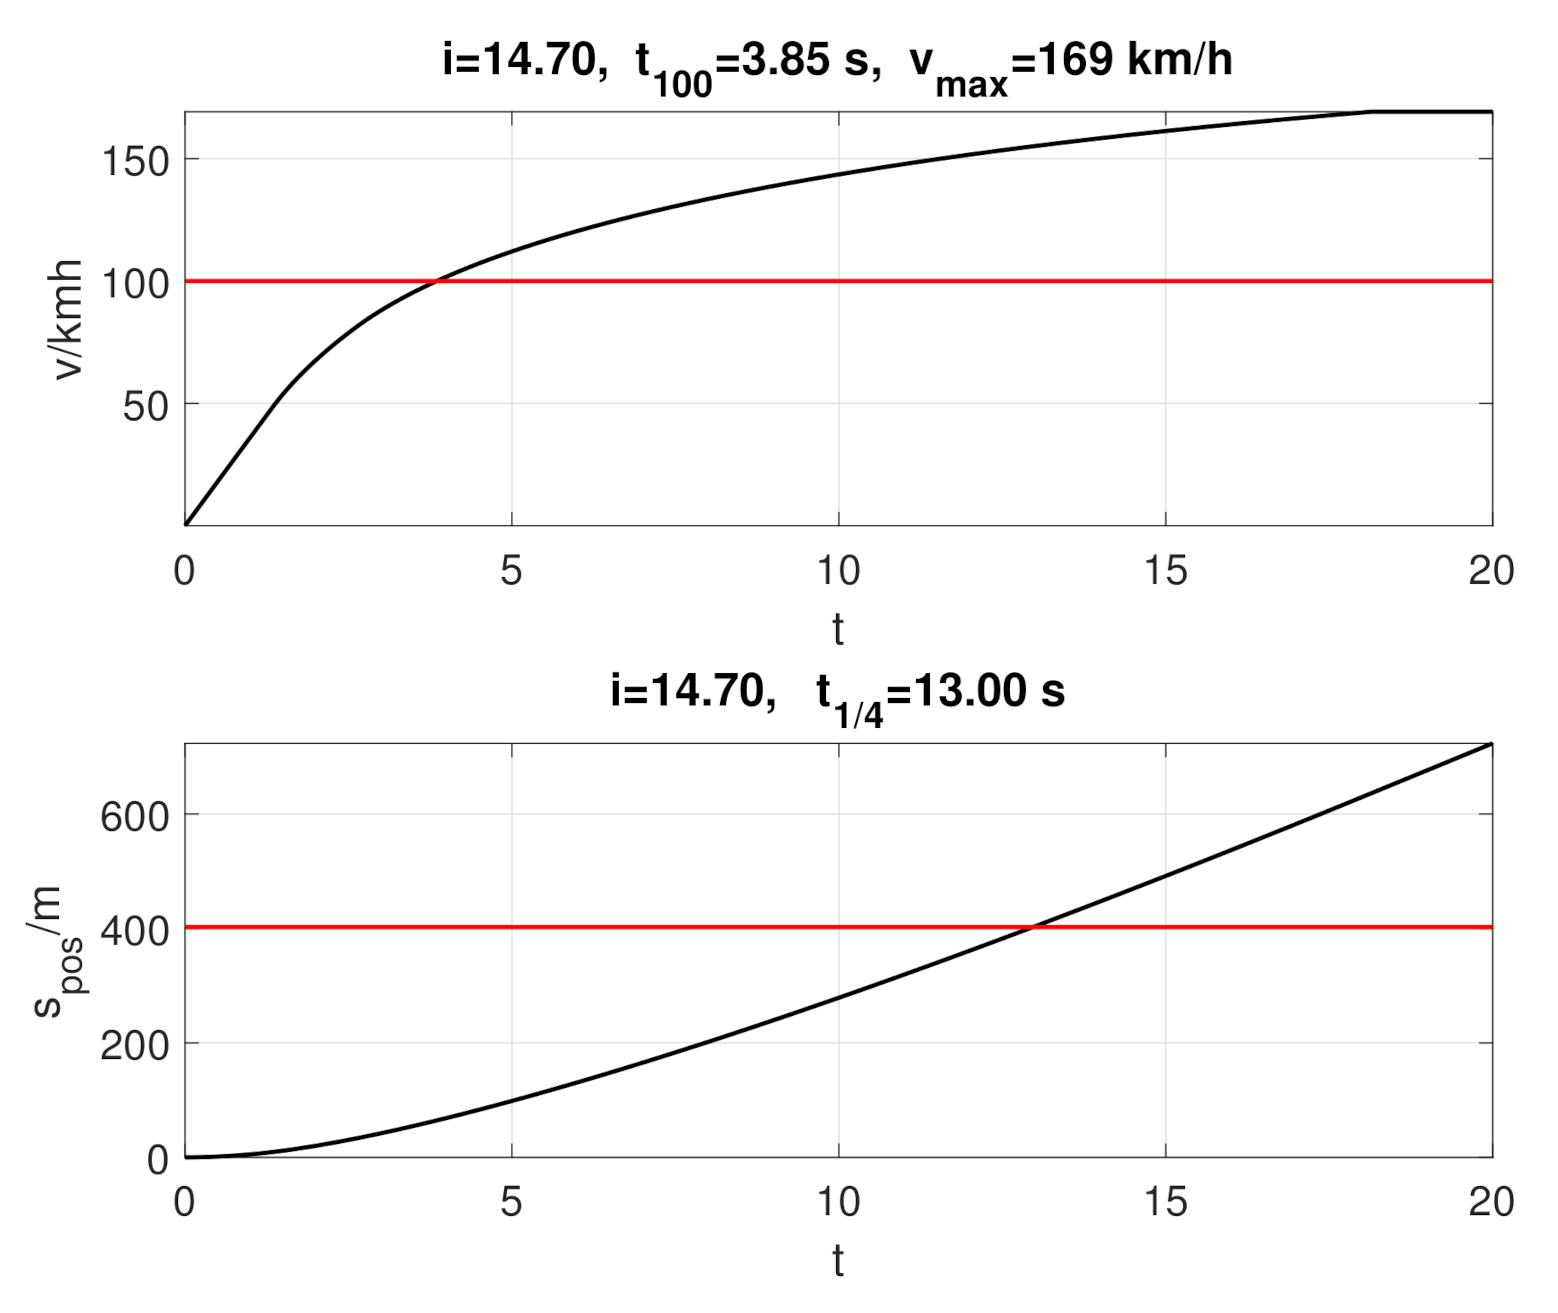
Simulation results for original gear ratio are presented in Figure 8, where is acceleration time to 100 kmh, is time for 1/4 mile. The obtained results are similar to the vehicle catalog data. Simulations are realized as numerical integration (Euler method, with step s) nonlinear differential equation in Figure 5 where “Motor + Control” is the torque–speed curve in Figure 7.
Now, the car performances can be improved, so the optimization problem is considered in the following form:
where is objective function (performance index) and can be equal , or . The result of optimization is gear ratio i. The Simplex method (Figure 1 and description in Section 4) is used for minimization. The results of optimization for performance index are shown in Figure 9.
Obtained results are displayed in figures with simulation. The next optimization problem can be minimization of the time , then 11.45 and race time is 12.85 s, so the simulation results are similar to what is presented in Figure 9, and they are omitted.
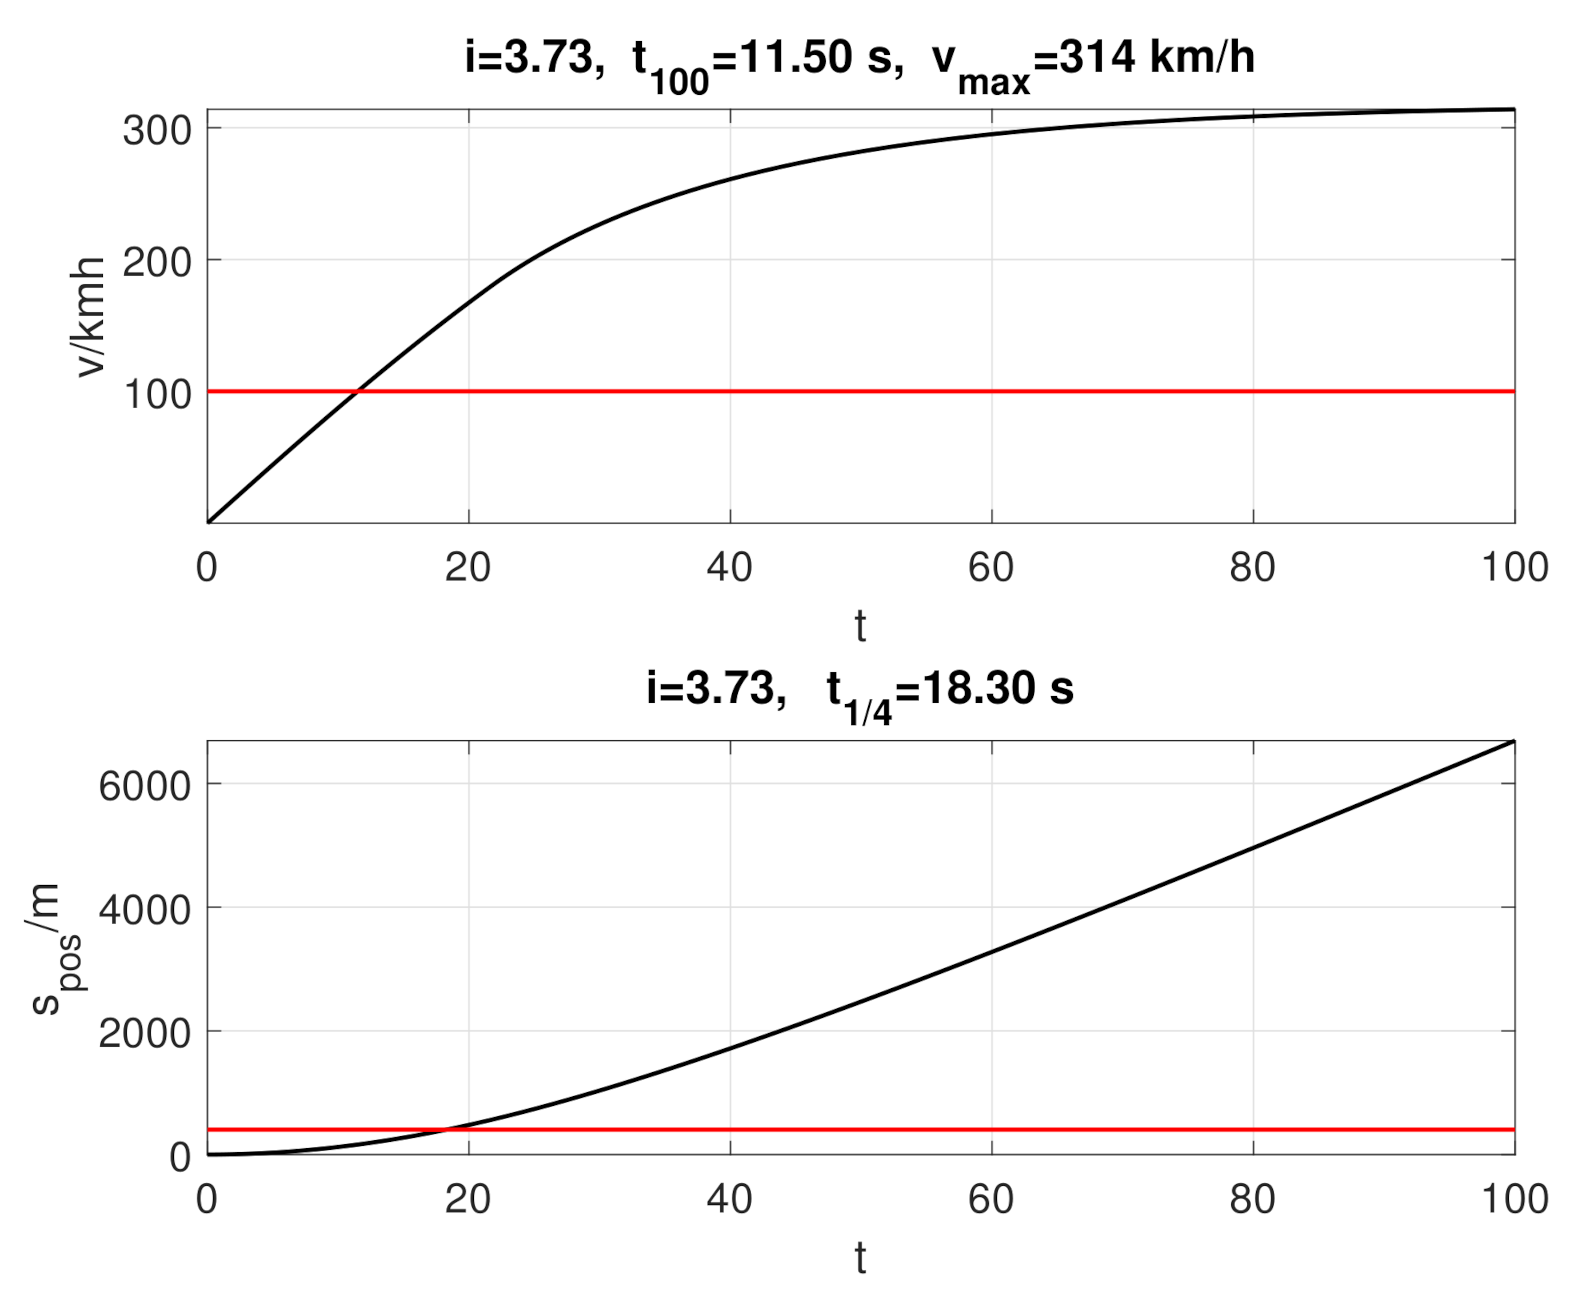
Ref. [19] reads: “With taller gearing, a P85 Model S might reach 200 mph. Clearly, this is the aerodynamic electric car that merits intense scrutiny by the world’s carmakers”. Hence, if (maximization speed can be written as minimization, thus sign `−’) and simulation time is longer, e.g., 100 s, then optimization can find the i. Figure 10 presents obtained results, so, for gear ratio 3.73, maximum speed is near 200 mph.
Summing up the main points, an obvious qualitative conclusion can be given, which is supported by quantitative data: different gear ratios should be used for different tasks. Thus, the optimization of torque–speed curve and gear ratio will be presented in the next section.
6. Powertrain Optimization for Mini Cooper SE
A modern car like Mini Cooper SE was chosen as an example of EV. The maximum torque of the traction motor and mechanical gear will be optimized. The characteristics are adopted in a two-zone form as for PMSM motors, and the ratio of ranges is 1:2, so in Figure 2 :
- constant torque region: ,
- constant power region: .
The basic parameters of the considered car from the manufacturer’s website or https://www.carfolio.com are:
- car and driver mass kg,
- drag coefficient , frontal area 2.1 m,
- gear ratio 8.96,
- tires: P205/45R17, which leads to wheel diameter = (17× 25.4 + 2 × 205 × 0.45)/1000 = 0.616 m, thus the circumference of the wheel is 1.935 m,
- maximum speed kmh, acceleration 0–100 km/h equals 7.3 s.
- PMSM 135 kW (from 7000 obr/min), maximum torque Nm (0–1000 obr/min). Knowing the maximum speed of the vehicle, the transmission and the wheel circumference can calculate the maximum speed of the electric motor:
The original motor will be neglected in the remainder of this paper, but a new torque–speed curve of the motor and gear ratio will be calculated by optimization for the performance requirements that will be written in the objective function .
The design takes into account the influence of PMSM motor power on the moment of inertia and vehicle mass.
In the optimization, changes are assumed in the traction motor moment of inertia , considering the factor: . This value for PMSM is higher than for the squirrel cage motor in [4] and can be recalculated to car body mass by Formula (8).
The second mass of will also vary with the traction motor power (mass of motor, power electronics and electrical equipment), and it includes the 135 kW of Cooper SE motor (the factor is ), which leads to: , where m is car and driver mass.
The next mass is constant (11) and is assumed as 80 kg. Hence, in the EV simulation, the total mass described by the Formula (12) is used.
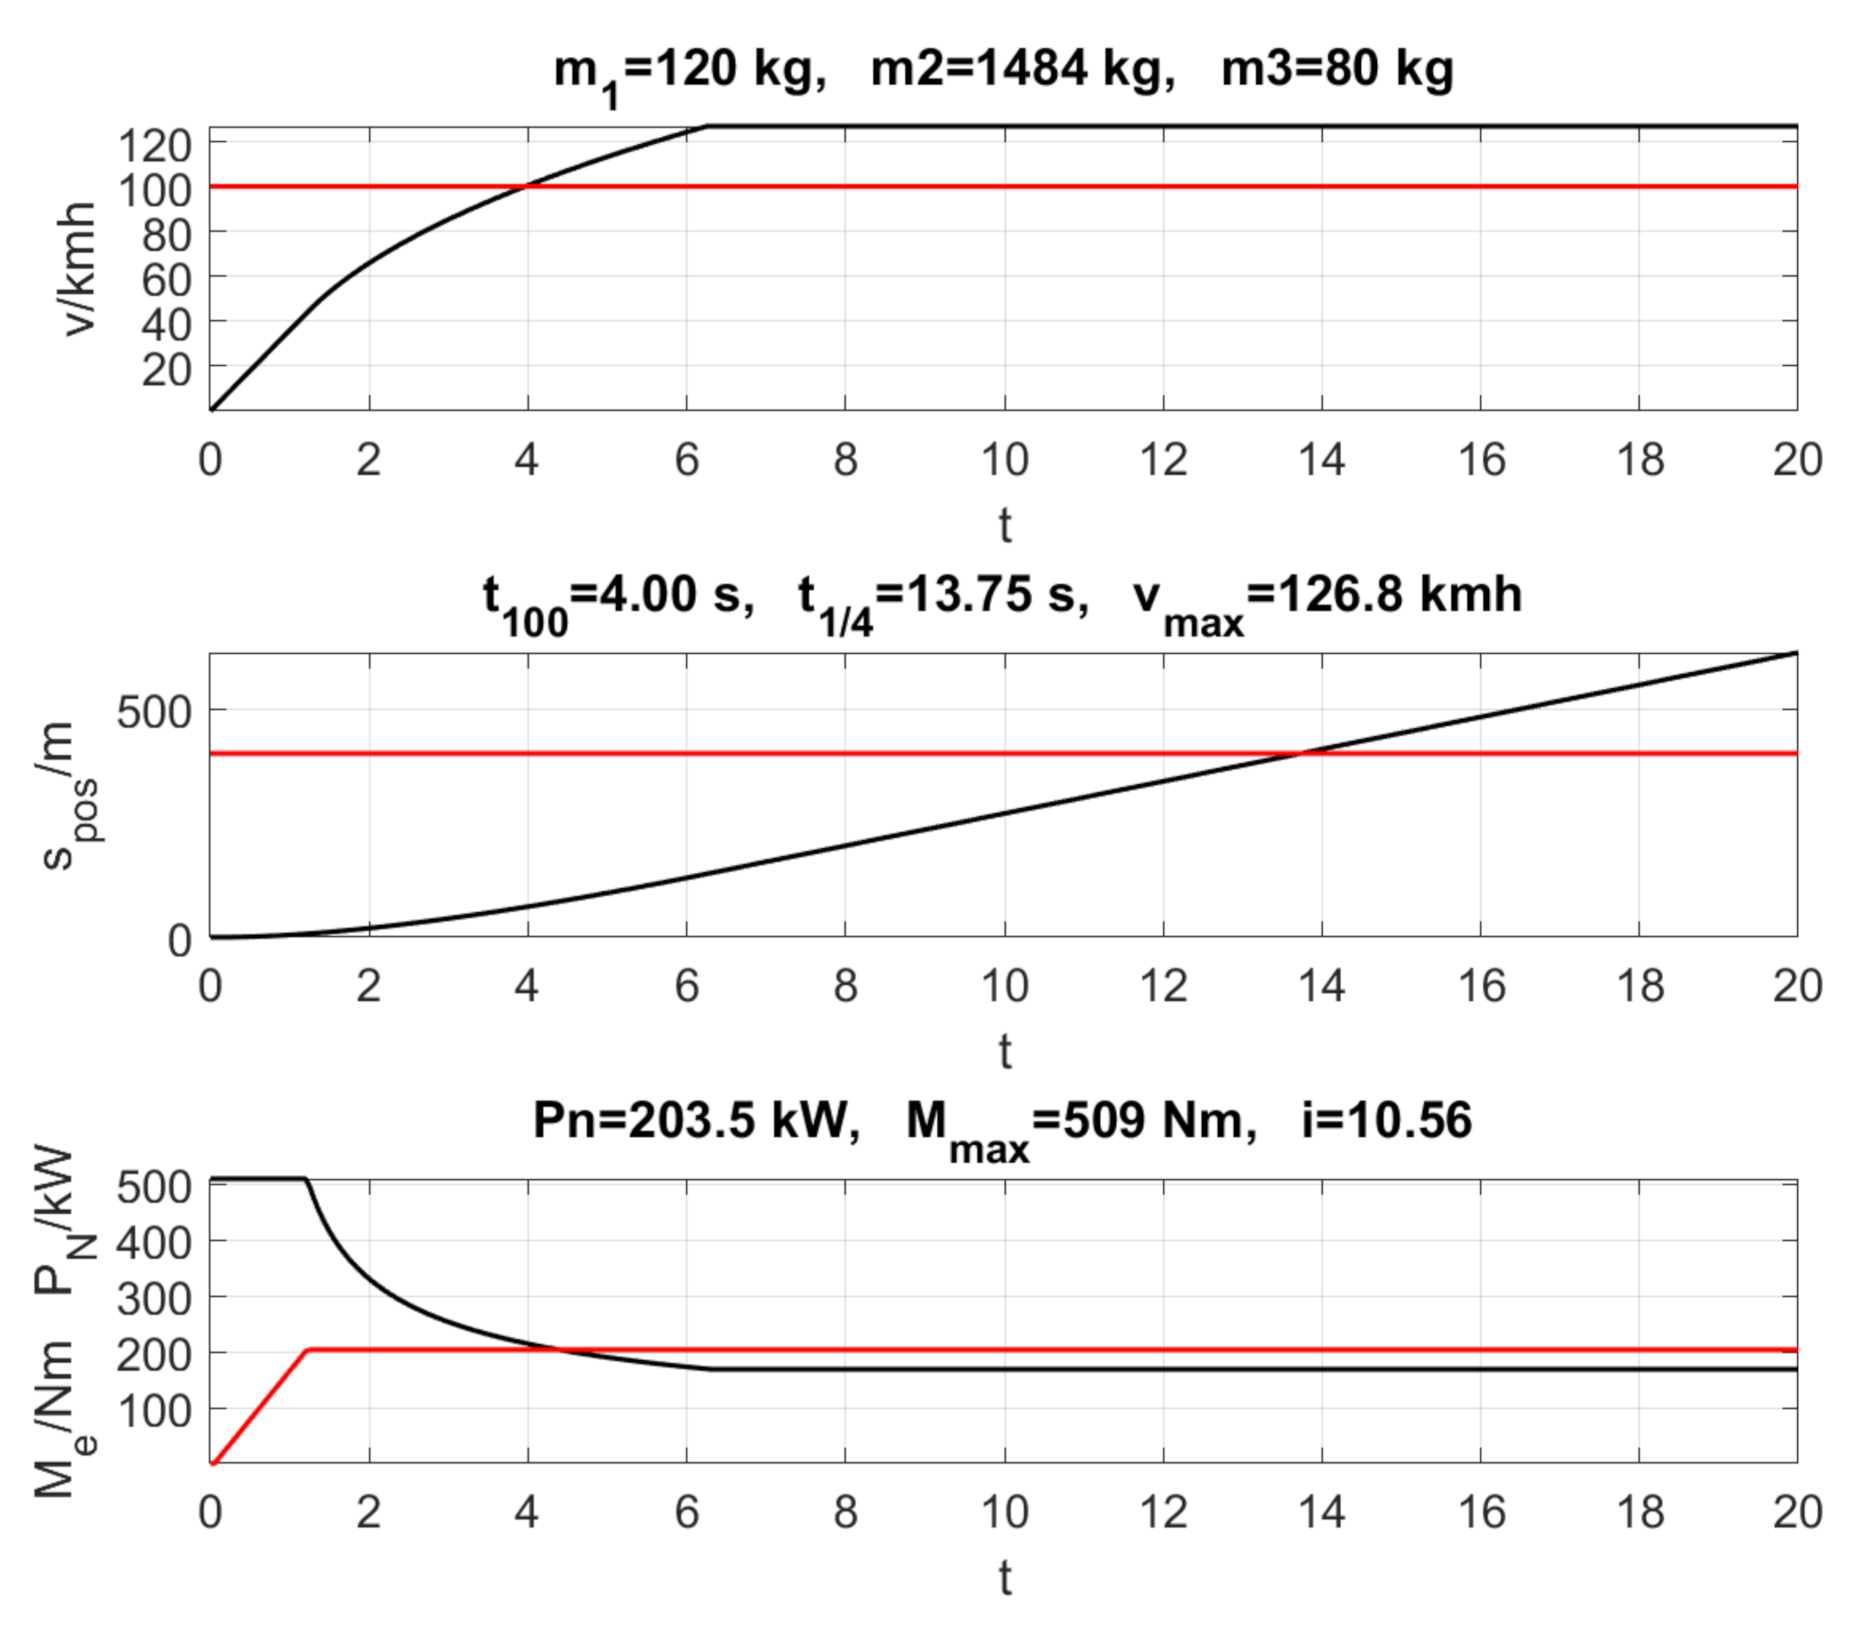
The performance index for the acceleration time can be described as:
where is desired time to 100 kmh. An example of optimization ( s) is in Figure 11, where the initial conditions were Nm and .
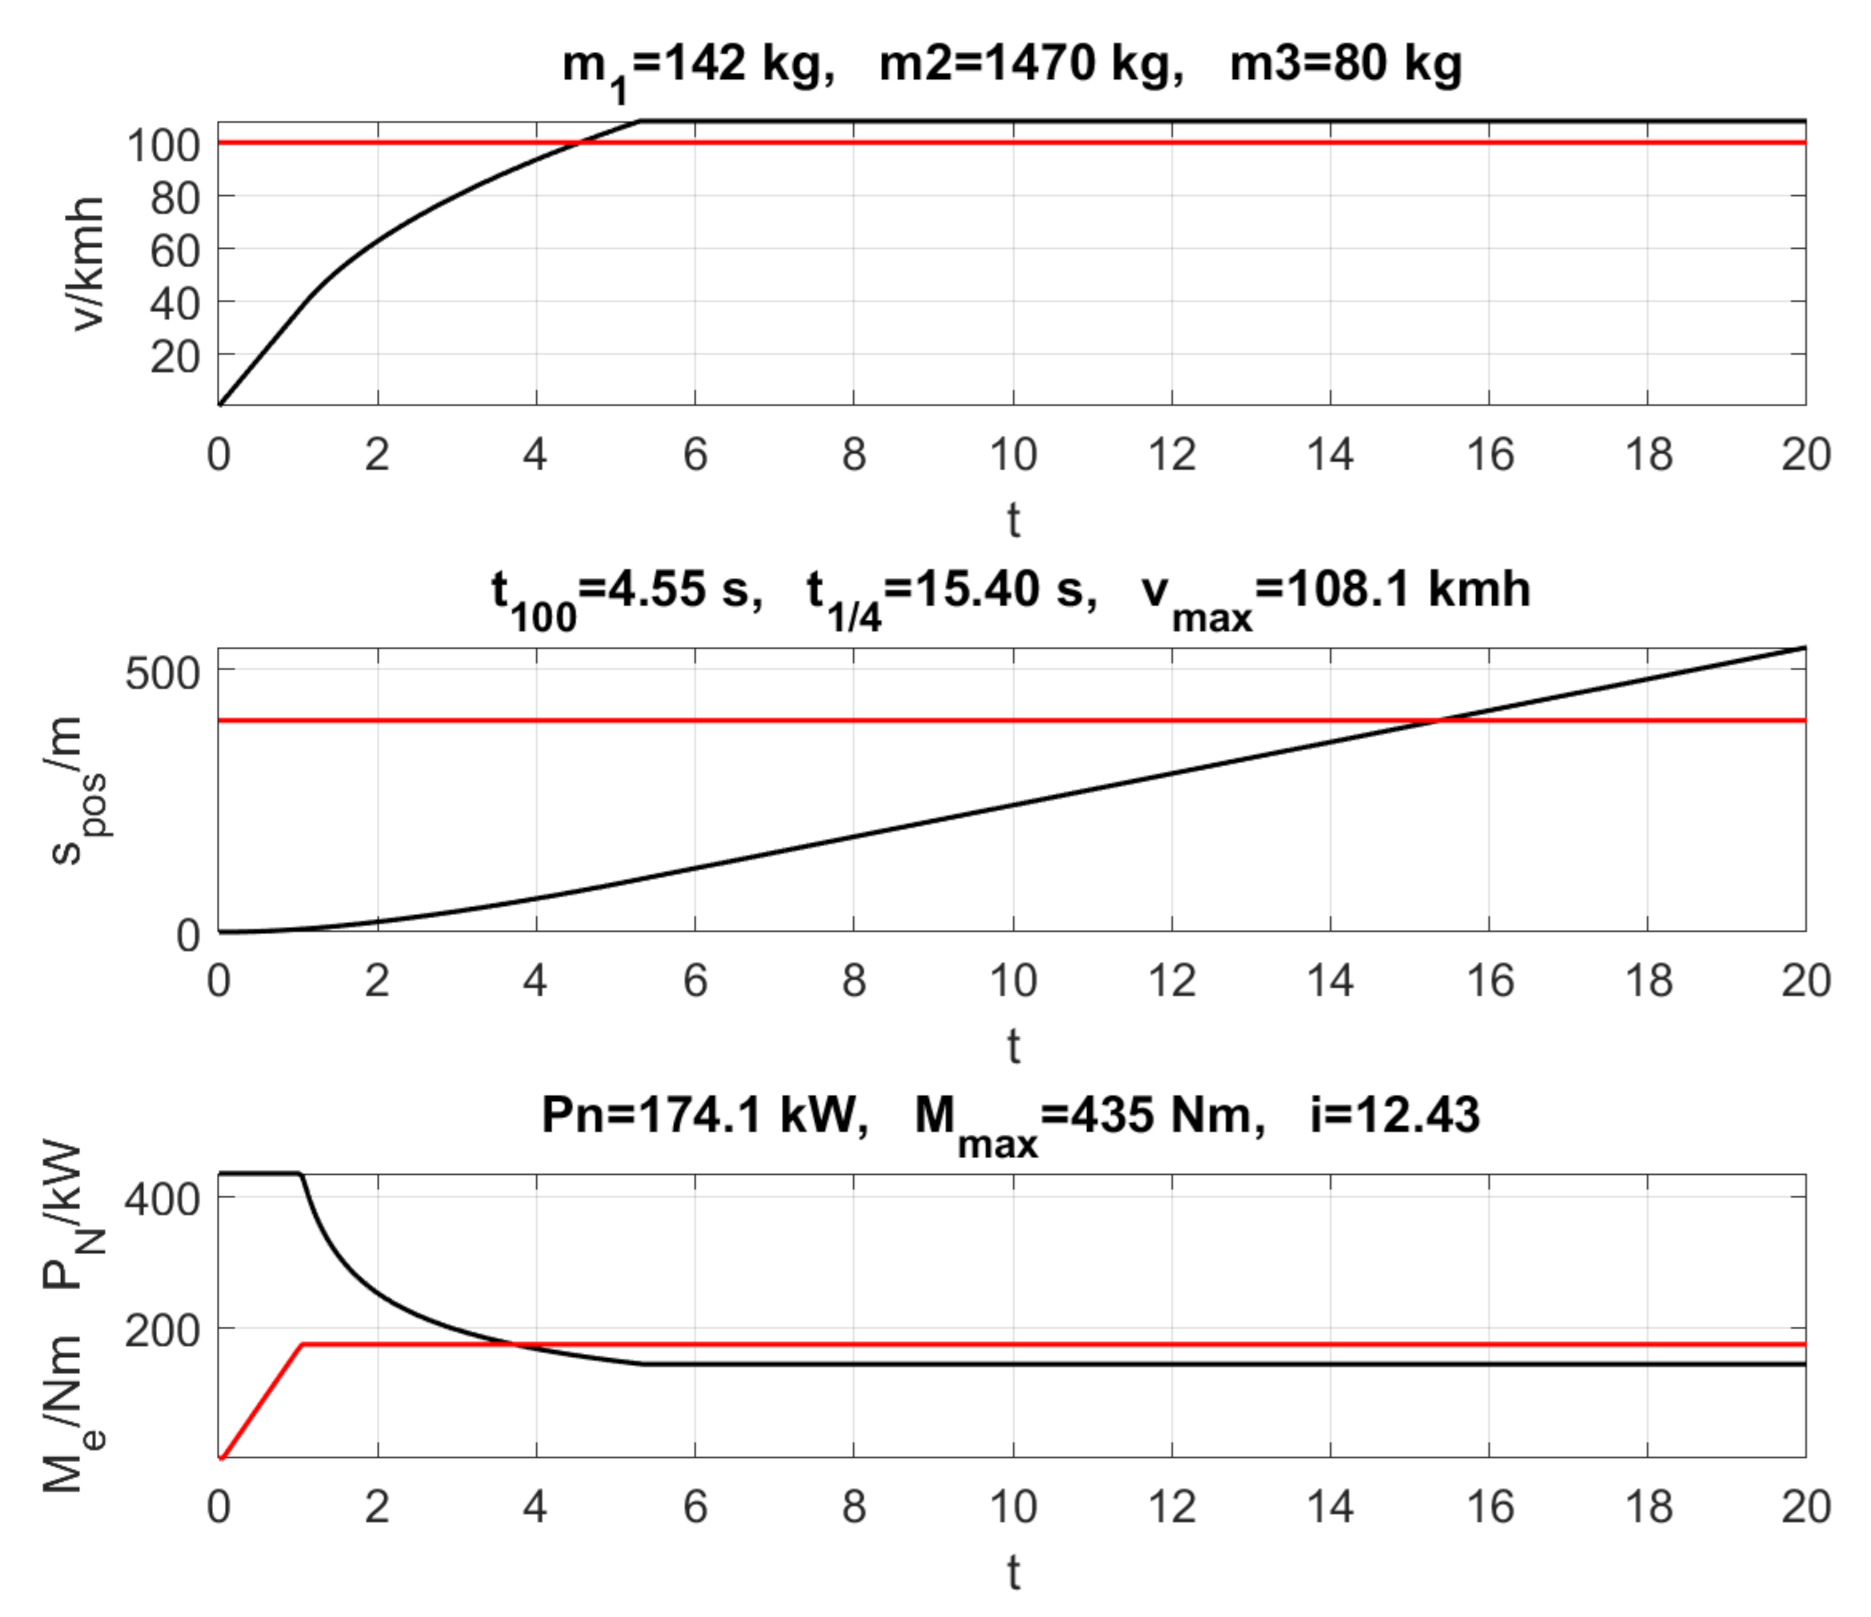
For different initial conditions, different results are obtained and the motor power increases up to 271 kW, so it is necessary to modify the objective function (15), e.g., the motor power is taken into account, and this leads to (multi-objective optimization):
where is the weighting factor which brings down to a similar numerical level. For example, , and optimization results are shown in Figure 12 (initial conditions do not matter for the optimization result).
Modification of the index by power causes the assumed time not to be reached, so you can take a smaller value or reduce . For 3.35 s, the time s is reached, and powertrain is characterized by: kW, Nm and 12.67. Hence, it is a better result than optimization with performance index (15) with different initial conditions. Moreover, has the role as a penalty function, so we can talk about optimization with constraints here.
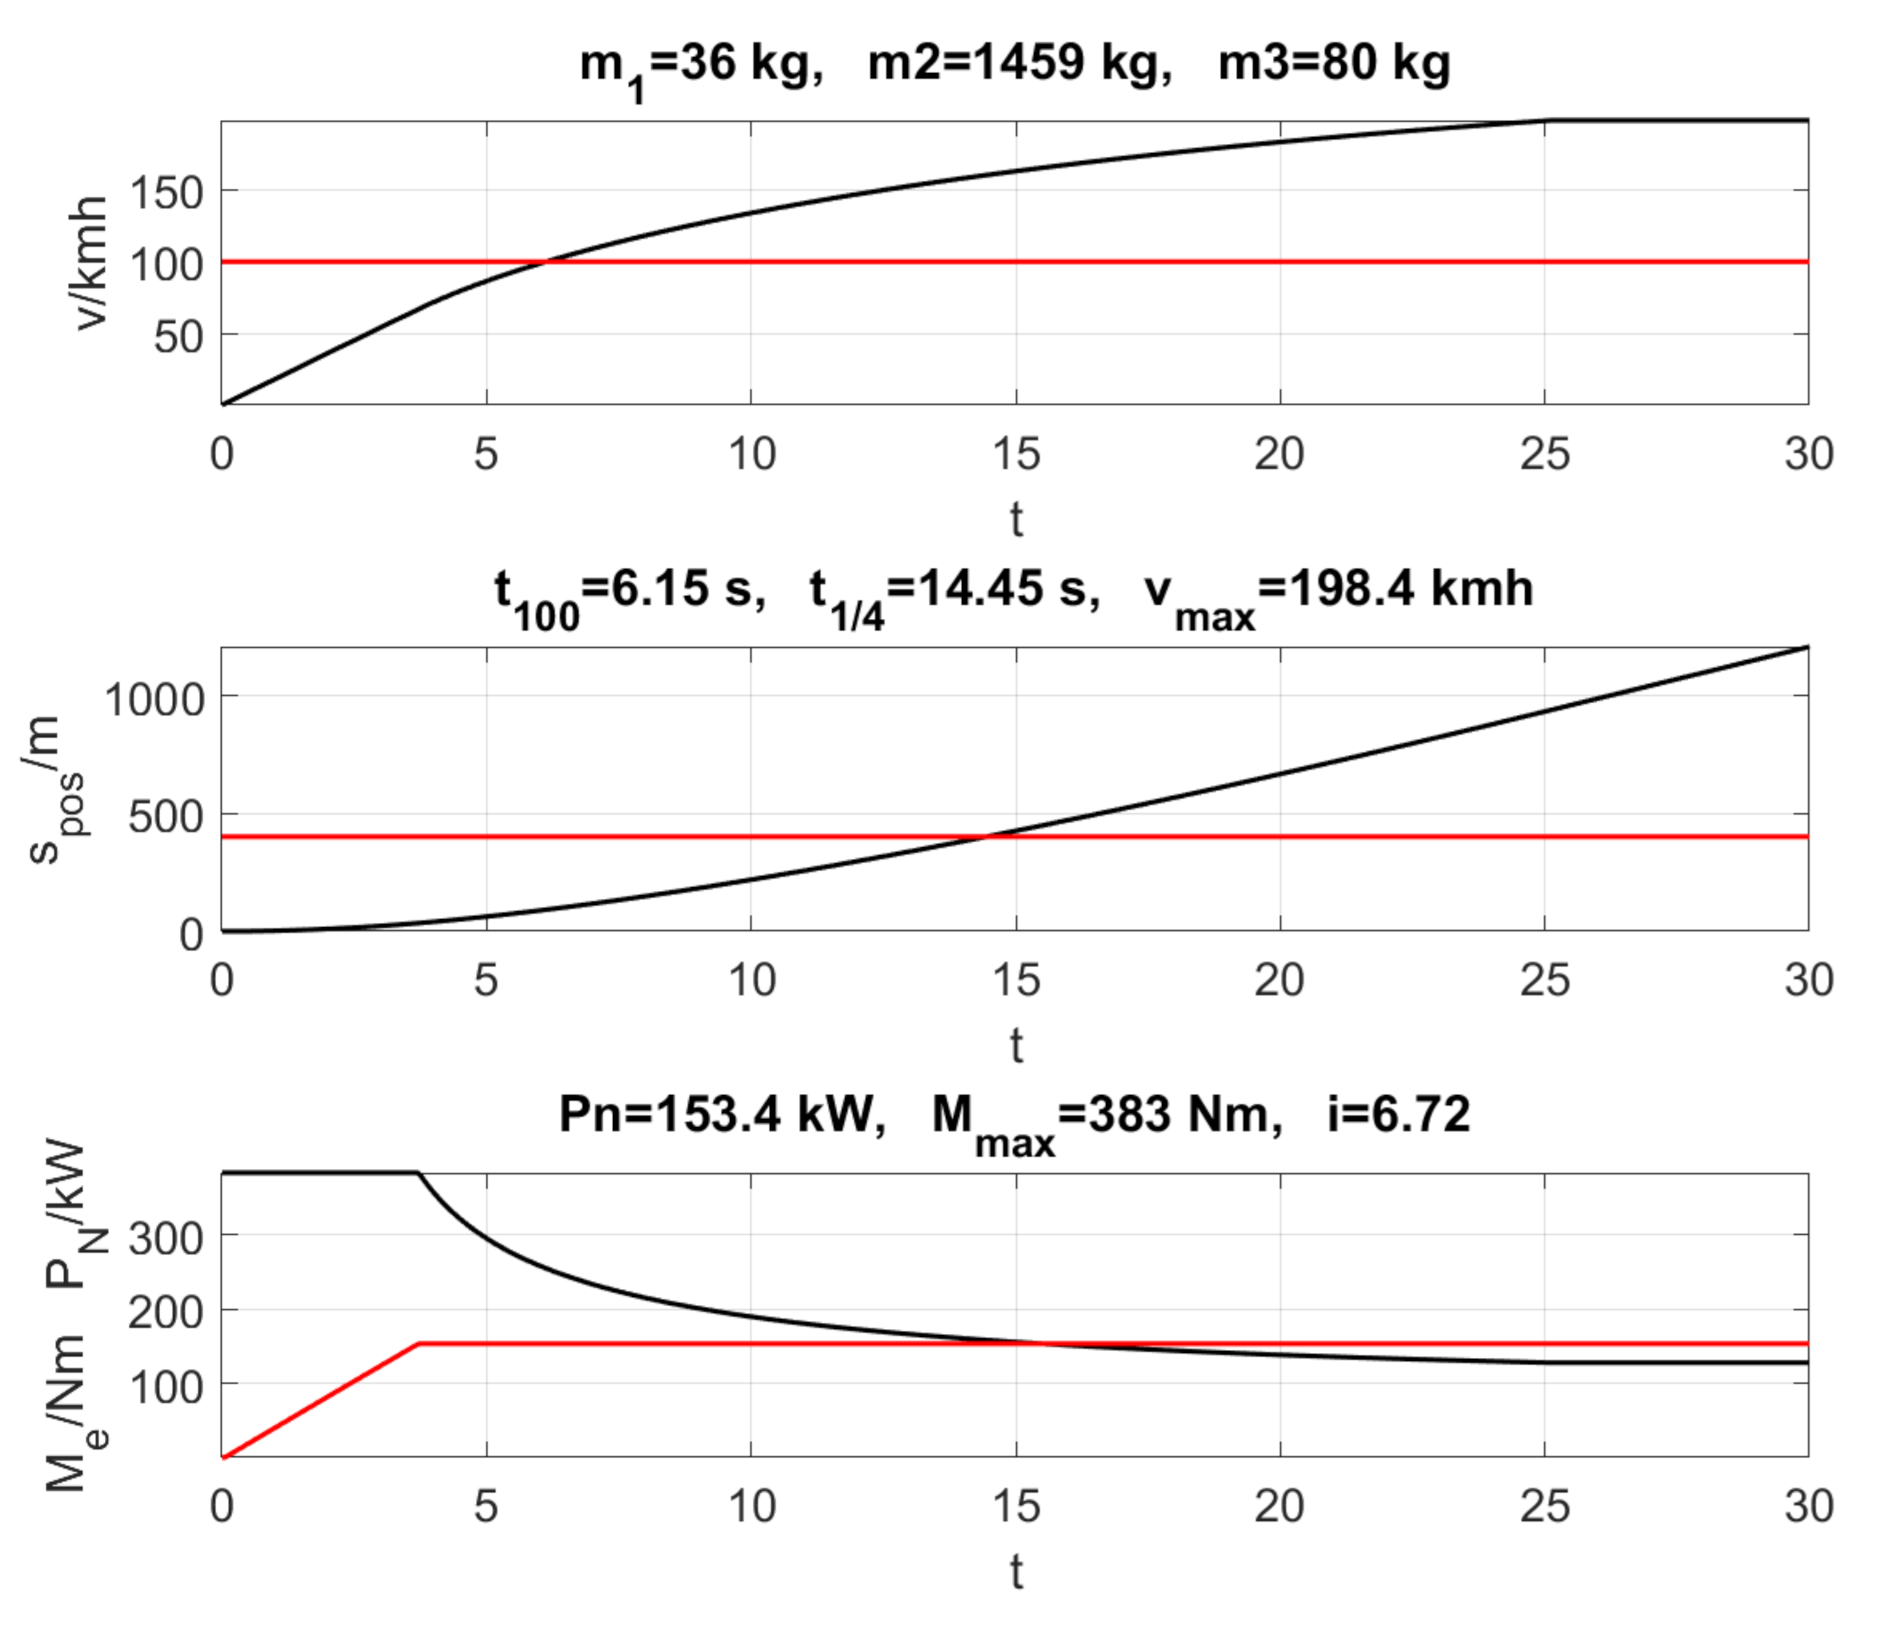
The last example will be about using a multi-task objective function in the following form:
where and are desired values of the car performance and are the weights of the respective objective function components. Optimization of the drive for dynamic but not sporty EV is shown in Figure 13, where it is assumed: s, s, kmh and weights = 0.33, = 0.05.
The obtained results are similar to the reference values, the motor power is not so high, and the powertrain parameters are similar to cars with internal combustion engines. Thus, performance index (17) can be used for preliminary drive design.
Table 1 collects the results from this chapter, where three performance indexes are considered.
The first performance index is only set to accelerate to 100 kmh in 4 s and, as a result of optimization, this assumption is obtained. In the second case, appears in the performance index, and it leads to a motor power reduction, but the acceleration time is longer s. Thus, is similar to the penalty function—optimization with constraints. If is higher, the power will be lower. The third case is the most reasonable because it takes into account all vehicle performances while limiting motor power. The last case is multi-objective optimization.
7. Conclusions
The methods for preliminary powertrain design are presented in the paper. In contrast to the often used genetic algorithms in this field, the Nelder–Mead (Simplex) method has been used. This method is much simpler than genetic algorithms and, after the results, it seems sufficient for this stage of EV powertrain design.
Three energy storages (motor moment of inertia; total car mass; wheels and brake discs and halfshaft moments of inertia) are included in the EV mathematical model, which is also rare in another papers. Appropriate formulas are given to convert masses or moments of inertia to the electric motor or the vehicle body side.
The optimization results are presented for Tesla Model S P85 and Mini Cooper SE. In the first car, the motor torque–speed characteristics were maintained, and the optimum gear ratio was found for the various performance targets. For Cooper, the mechanical gearbox and maximum of electromagnetic torque (the shape of the torque–speed characteristics was assumed) were optimized. Moreover, the motor power influences the motor moment of inertia and the mass of the vehicle . Hence, additionally changes Newton’s 2nd law in Figure 1.
Solved nonlinear programming problems look promising and can be extended, e.g., by vehicle range (battery weight will increase) and more precise motor characteristics (as for Tesla), etc. In addition, constraints for the cost function can be introduced as constraints on component cost (motor, batteries), weight. In this optimization problem, the penalty function is most preferred.
The presented solution should be used for preliminary vehicle powertrain design, while e.g., the Powertrain Blockset toolbox (Matlab-Simulink environment) can be used for precise modeling.
Funding
This research received no external funding.
Institutional Review Board Statement
Not applicable.
Informed Consent Statement
Not applicable.
Conflicts of Interest
The author declares no conflict of interest.
Abbreviations
The following abbreviations are used in this manuscript:
| EV | Electric Vehicle |
| PMSM | Permanent Magnet Synchronous Motor |
References
- Nam, K. AC Motor Control and Electrical Vehicle Applications; CRC Press: Boca Raton, FL, USA, 2010. [Google Scholar]
- Karki, A.; Phuyal, S.; Tuladhar, D.; Basnet, S.; Shrestha, B. Status of Pure Electric Vehicle Power Train Technology and Future Prospects. Appl. Syst. Innov. 2020, 3, 35. [Google Scholar] [CrossRef]
- Hindmarsh, J.; Renfrew, A. Electrical Machines and Drives; Newnes: Oxford, UK, 1996. [Google Scholar]
- Sieklucki, G. An investigation into the induction motor of Tesla Model S vehicle. In Proceedings of the 2018 International Symposium on Electrical Machines: LIV Sympozjum Maszyn Elektrycznych, Andrychow, Poland, 10–13 June 2018; pp. 1–6. Available online: https://ieeexplore-1ieee-1org-1000047cx01c2.wbg2.bg.agh.edu.pl/stamp/stamp.jsp?tp=&arnumber=8442648 (accessed on 30 January 2021).
- Nelder, J.A.; Mead, R. A simplex method for function minimization. Comput. J. 1965, 7, 308–313. [Google Scholar] [CrossRef]
- Dong, E.; Zhang, L.; Shi, H. Multi-objective Optimization of Hybrid Electric Vehicle Powertrain. In Proceedings of the 2019 IEEE 3rd Information Technology, Networking, Electronic and Automation Control Conference (ITNEC), Chengdu, China, 15–17 March 2019; pp. 1429–1432. [Google Scholar] [CrossRef]
- Ma, C.; Jin, S.; Yang, K.; Tan, D.; Gao, J.; Yan, D. Particle Swarm Optimization and Real-Road/Driving-Cycle Analysis Based Powertrain System Design for Dual Motor Coupling Electric Vehicle. World Electr. Veh. J. 2020, 11, 69. [Google Scholar] [CrossRef]
- Koch, A.; Teichert, O.; Kalt, S.; Ongel, A.; Lienkamp, M. Powertrain Optimization for Electric Buses under Optimal Energy-Efficient Driving. Energies 2020, 13, 6451. [Google Scholar] [CrossRef]
- Zulkefli, M.A.M.; Sun, Z. Fast Numerical Powertrain Optimization Strategy for Connected Hybrid Electric Vehicles. IEEE Trans. Veh. Technol. 2019, 68, 8629–8641. [Google Scholar] [CrossRef]
- Li, Y.; Zhu, B.; Zhang, N.; Peng, H.; Chen, Y. Parameters optimization of two-speed powertrain of electric vehicle based on genetic algorithm. Adv. Mech. Eng. 2020, 1–16. [Google Scholar] [CrossRef]
- Eckert, J.; Corrêa, F.; Bertoti, E.; Yamashita, R.; Silva, L.; Dedini, F. Powertrain Optimization to Improve Vehicle Performance and Fuel Consumption. In Multibody Mechatronic Systems; Springer International Publishing: Berlin/Heidelberg, Germany, 2018; pp. 517–527. [Google Scholar]
- Wang, Z.; Cai, Y.; Zeng, Y.; Yu, J. Multi-Objective Optimization for Plug-In 4WD Hybrid Electric Vehicle Powertrain. Appl. Sci. 2019, 9, 4068. [Google Scholar] [CrossRef]
- Janiaud, N.; Vallet, F.; Petit, M.; Sandou, G. Electric vehicle powertrain simulation to optimize battery and vehicle performances. In Proceedings of the 2010 IEEE Vehicle Power and Propulsion Conference, Lille, France, 1–3 September 2010; pp. 1–5. [Google Scholar]
- Plunkett, A.; Plette, D. Inverter-Induction Motor Drive for Transit Cars. IEEE Trans. Ind. Appl. 1977, 13, 26–37. [Google Scholar] [CrossRef]
- Gillespie, T. Fundamentals of Vehicle Dynamics; Society of Automotive Engineers: Warrendale, PA, USA, 1992. [Google Scholar]
- Gromba, J.; Sobieraj, S.; Sykulski, R. Designing of Road Loads Simulator for EV. In Proceedings of the 2018 International Symposium on Electrical Machines (SME), Andrychow, Poland, 10–13 June 2018; pp. 1–5. Available online: https://ieeexplore-1ieee-1org-1000047kn016a.wbg2.bg.agh.edu.pl/document/8442898 (accessed on 30 January 2021).
- Leonhard, W. Control of Electrical Drives; Springer: Berlin, Germany, 2001. [Google Scholar]
- Hayes, J.G.; de Oliveira, R.P.R.; Vaughan, S.; Egan, M.G. Simplified electric vehicle power train models and range estimation. In Proceedings of the 2011 IEEE Vehicle Power and Propulsion Conference, Chicago, IL, USA, 6–9 September 2011; pp. 1–5. [Google Scholar]
- Sherman, D. Drag Queens. Five Slippery Cars Enter a Wind Tunnel; One Slinks out a Winner. 2012. Available online: https://www.tesla.com/sites/default/files/blog_attachments/the-slipperiest-car-on-the-road.pdf (accessed on 30 January 2021).
Figure 1.
Method of powertrain optimization.

Figure 2.
Theoretical two-zone angle velocity control of PMSM.

Figure 3.
Forces acting on a EV.

Figure 4.
Simplified powertrain.

Figure 5.
Powertrain model ver. 1.

Figure 6.
Powertrain model ver. 2.

Figure 7.
torque–speed and power-speed curves of the EV.

Figure 8.
Performance of EV for nominal gear ratio.

Figure 9.
Optimized gear ratio i of EV for .

Figure 10.
Optimized gear ratio i of EV for .

Figure 11.
Optimized powertrain for 4 s acceleration to 100 kmh.

Figure 12.
Optimized powertrain for 4 s acceleration to 100 kmh and motor power minimization.

Figure 13.
Optimized powertrain.


Table 1.
Powertrain optimization for different performance indexes.
[kg] | [kg] | [s] | [s] | [kW] | [Nm] | i | |
|---|---|---|---|---|---|---|---|
| 120 | 1484 | 4.00 | 17.75 | 204 | 509 | 10.56 | |
| 142 | 1470 | 4.55 | 15.4 | 174 | 435 | 12.43 | |
| 36 | 1459 | 6.15 | 14.45 | 153 | 383 | 6.72 |
Publisher’s Note: MDPI stays neutral with regard to jurisdictional claims in published maps and institutional affiliations. |
© 2021 by the author. Licensee MDPI, Basel, Switzerland. This article is an open access article distributed under the terms and conditions of the Creative Commons Attribution (CC BY) license (http://creativecommons.org/licenses/by/4.0/).
Share and Cite
MDPI and ACS Style
Sieklucki, G. Optimization of Powertrain in EV. Energies 2021, 14, 725. https://doi.org/10.3390/en14030725
AMA Style
Sieklucki G. Optimization of Powertrain in EV. Energies. 2021; 14(3):725. https://doi.org/10.3390/en14030725
Chicago/Turabian StyleSieklucki, Grzegorz. 2021. "Optimization of Powertrain in EV" Energies 14, no. 3: 725. https://doi.org/10.3390/en14030725
APA StyleSieklucki, G. (2021). Optimization of Powertrain in EV. Energies, 14(3), 725. https://doi.org/10.3390/en14030725
Note that from the first issue of 2016, this journal uses article numbers instead of page numbers. See further details here.