Abstract
In recent decades, the Chilean margin has been extensively investigated to better characterize the complex geological setting through the geophysical data. The analysis of seismic lines allowed us to identify the occurrence of gas hydrates and free gas in many places along the margin and the change of the pore fluid due to the potential hydrate dissociation. The porosity reduction due to the hydrate presence is linked to the slope to identify the area more sensitive in case of natural phenomena or induced by human activities that could determine gas hydrate dissociations and/or leakage of the free gas trapped below the gas-hydrate stability zone. Clearly, the gas hydrate reservoir could be a strategic energy reserve for Chile. The steady-state modelling pointed out that the climate change could determine gas hydrate dissociation, triggering slope failure. This hypothesis is supported by the presence of high concentrations of gas hydrate in correspondence of important seafloor slope. The dissociation of gas hydrate could change the petrophysical characteristics of the subsoil triggering slopes, which already occurred in the past. Consequently, it is required to improve knowledge about the behavior of the gas hydrate system in a function of complex natural phenomena before the exploitation of this important resource.
1. Introduction
In recent decades, the Chilean margin has been extensively investigated to better characterize the complex geological setting through the acquisition of geophysical data and, in particular, seismic lines. The analysis of seismic lines allowed us to identify the occurrence of gas hydrates in many places along the Chilean margin [1,2,3,4,5,6,7,8,9,10,11,12,13,14,15,16,17]. Moreover, the gas hydrate presence has been confirmed by the presence of cold seeps emitting methane at the seafloor in both active and passive margins [18,19,20,21,22,23,24].
Along this margin, the gas hydrate reservoir was perforated for the first time with the ODP Leg 141, located near the Chile triple junction [1,2]. These measurements estimated an average concentration of gas hydrate and free gas equal to 18% and 1% of the volume, respectively [1,2]. The seismic data analysis acquired along the margin has allowed us to estimate a similar concentration [9,12,14,16]. In fact, a high-amplitude reflector, called a bottom simulating reflector (BSR) representing the base of the gas hydrate reservoir, was identified on the seismic sections. This reflector corresponds to the transition from gas hydrate-bearing sediments characterized by high seismic velocity to sediments containing free gas with low seismic velocity. In some cases, it is possible to recognize the base of the free gas, known as the Base of the free Gas Reflector (BGR). The seismic velocity extracted from seismic data analysis is translated in terms of gas hydrate and free concentrations by using the method proposed by References [25,26].
Clearly, the gas hydrate reservoir could be seen in one hand as a strategic energy reserve for Chile, since hydrates have been identified through its entire continental margin from Valparaiso to Patagonia region (~4000 km length, e.g., [27]), while also including the methane hydrate concentration zone (MHCZ) located off the coast of the Patagonia region with a very thick hydrate layer of 290 m and an estimated methane budget of ~3 × 10¹³ m3 under normal pressure and temperature conditions [16], but, on the other hand, the dissociated gas hydrate due to climate change could be an issue to face. Moreover, this region is characterized by large and mega-scale earthquakes [28] that may contribute to gas hydrate dissociation and consequent submarine slides triggering. In fact, the geological and tectonic environment of this margin is very complex and is driven by the interaction between three main plates (Antarctic, Nazca, and South American) that converge at a specific point called the Chile Triple Junction (CTJ) ([29], Figure 1). Moreover, moving to the south, it is possible to identify the interaction between the Antarctic, South American, and Scotia plates, named Fuegian Triple Junction (FTJ) ([7], Figure 1).
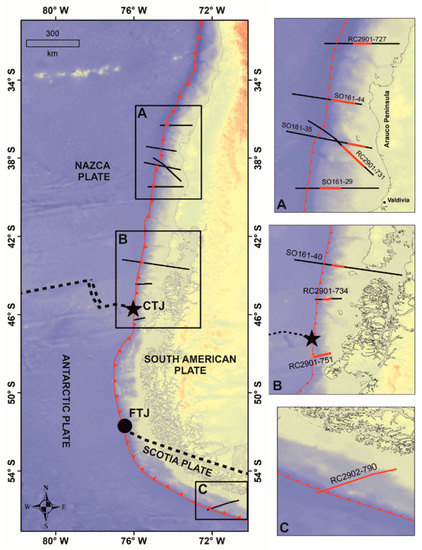
Figure 1.
Map of the investigated area. Black lines: analyzed seismic lines. Black rectangles: the location of the A, B and C panels. Black star: CTJ. Black Dot: FTJ. Dashed Lines: division between plates. Red Line: Outer deformation front. In the panels A, B and C, the red lines indicate the portion of the seismic lines that were analyzed.
In this context, it is important to characterize the gas hydrate reservoir and underlying free gas layer in order to identify the strategic zone for gas-phase distribution from the energy point of view and zone more sensitive from a hazard point of view. In addition, the integration of the available information allows us to understand the parameters, such as geothermal gradients and geological features, which affect the gas stability and distribution. This objective is possible by integrating all available information extracted from the analysis of the seismic line.
2. Materials and Methods
Seismic lines presented in this work (Figure 1) were acquired in the frame of the following research projects (for details, see Reference [11]): (1) SO161 profiles collected during the RV SONNE cruise performed in 2001, (2) RC2901 and RC2902 profiles collected during the RV CONRAD cruise in 1988.
The streamer adopted for the acquisition of the SO161 profiles was a long 3000 m with 132 channels. The inter-trace of the first 24 channels was equal to 12.5 m, becoming 25 m for the remaining channels. The seismic source was composed by an array of 20 air guns characterized by a total volume of 54.1 l. The spacing between shots was 50 m.
A digital streamer with 240 channels spaced 12.5 m with offsets up to 3300 m was adopted for the acquisition of the RC2901 and RC2902 seismic profiles. The seismic source was composed of an array of 10 air guns with a total volume of 61.3 l. The distance between shots was 50 m.
All profiles were processed with the following procedure in order to evaluate the concentration of hydrate and free gas, as already explained in other studies (i.e., [9], Figure 2):
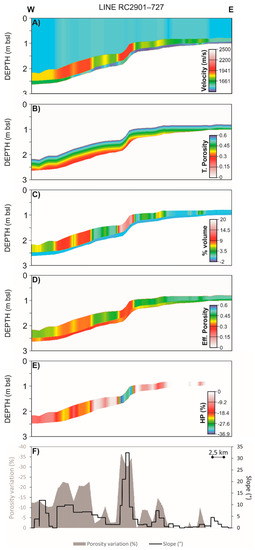
Figure 2.
(A) Seismic model of inverted layers on line RC2901–727. (B) Theoretical porosity used for estimating the velocity distribution in the absence of gas-phase and to calculate the HP. (C) Gas hydrate (positive values) and free gas (negative values) concentration model on line RC2901–727. (D) Reduced porosity because of the hydrate presence on line RC2901–727. (E) HP section. (F) HP variations due to the gas hydrate presence (grey area) and slope variation (black line) on line RC2901–727.
- Identification of BSR: Processing of the seismic profiles to identify the BSR and BGR, if possible, and selection of the portion of seismic lines showing the presence of them.
- Detection of gas hydrate and free gas: a depth seismic section and a reliable velocity model obtained applying the Kirchhoff pre-stack depth migration in an iterative approach. An example of the obtained velocity model is shown in Figure 2A. For details, see Reference [9].
- Estimate of the concentrations of gas hydrate and free gas: the difference between velocity distribution, obtained by the application of the pre-stack depth migration, and theoretical velocities in the absence of gas-phase allows estimating gas-phase concentrations. The gas hydrate presence is characterized by positive anomalies of seismic velocity, while the free gas presence is indicated by negative anomalies. The theoretical velocity is estimated by using the method proposed by References [25,26]. It is important to mention that the gas-phase estimate is affected by error due to some assumptions about sediment property because of what direct measurements lack. In Figure 2B, it is reported that the theoretical porosity was adopted to evaluate the theoretical velocity. An example of the obtained concentration section is shown in Figure 2C.
The seafloor and BSR depth extracted from the depth seismic section is adopted to evaluate the regional geothermal gradient (GG), as described in Reference [10]. The accuracy of the velocity models was verified through sensitive tests, estimating an error equal to about 5% [10]. It also evaluated the propagation of the error in depth, which was evaluated to be equal to 2%. Finally, the average percentage error of the gas hydrate and free gas concentrations was estimated to be equal to 1 and 2.5%, respectively, as described by Reference [10].
The change in the porosity due to the gas hydrate presence was evaluated to link the gas hydrate amount with the petrophysical properties changes in marine sediments. To reach this goal, we estimated the hydrate porosity (HP), as defined by Reference [30], obtained from the gas hydrate concentrations. HP represents the difference between the porosity of the sediments without a gas hydrate (adopted to evaluate the theoretical velocity of water-bearing sediments, Figure 2B) and the reduced porosity because of the hydrate presence estimated comparing the velocity obtained from the seismic analysis and the theoretical velocity of gas hydrate-bearing sediments (Figure 2D). Clearly, HP is directly related to fluids content. In Figure 2E, an example of the HP section is reported, showing the lateral and vertical variation of HP along the line. The HP is averaged within the hydrate layer for all cells in the same column to obtain a single value for each point, as reported in Figure 2E,F. In case of hydrate dissociation, this value represents the change of the fluid and the solid parts, which could affect the slope stability. Hence, it is linked with the slope of the seafloor, as shown in Figure 2F.
We modelled the theoretical methane hydrate stability zone (HSZ) with a steady state approach to identify the zone where the conditions exist for its stability from Valparaiso to Taitao Peninsula, which is more promising from the energy point of view (Figure 3). The input data were collected in literature, as described in detail in Reference [31]. GGs were estimated as the ratio between heat flow and thermal conductivity considering data published by Reference [15]. Seafloor temperature and the salinity water column were available in the National Oceanographic Data Center website, while water depth was available from the GMRT website. The gas composition was considered as pure methane on the basis of ODP Legs 141 and 202 [32,33]. The base of methane HSZ at the present condition was estimated as the intersection of the methane HSZ and the temperature curve and shown in Figure 3A. To evaluate the effects of climate change on the methane hydrate, we considered future possible scenarios changing the seafloor temperature and water column thickness, as discussed in the next section, on the basis of Intergovernmental Panel on Climate Change (IPCC) and National Aeronautics and Space Administration (NASA) forecasts for the next 50 and 100 years. In Figure 3B, the colored lines represents the intersection between the base of methane HSZ and the seafloor to highlight the areas affected by climate change.
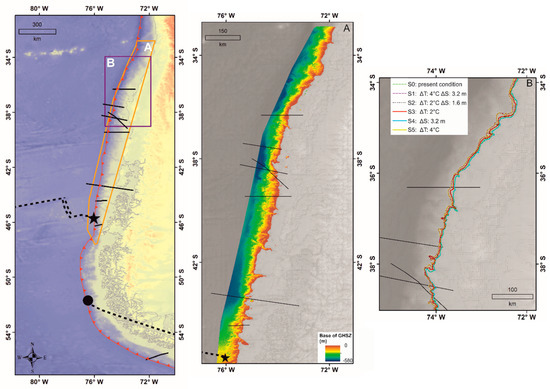
Figure 3.
The left panel reports the area where modelling was performed by Reference [31]. Panel A shows the base of methane HSZ at the present conditions. In Panel B, the solid-colored lines represent the intersections between the base of the methane HSZ and the seafloor for scenarios reported in the legend and described in Reference [31].
3. Results
The presence of the gas hydrate, free gas, and features related to them was recognized along the entire Chilean margin. For simplicity, the Chilean margin is divided in three parts: the northern part from 36° S to 40° S, the center part from 40° S to 45° S, and the southern part south of 45° S.
One of the most representative parts of the northern part of the Chilean margin is the seismic line (RC2901-727), located at about 36° S, that shows a strong and continuous BSR [13]. Below it, it is possible to recognize a layer characterized by low seismic velocity (1380–1450 m/s) associated with free gas, showing the lowest velocities values in correspondence of the uplift section where a high concentration of free gas equal to 0.6% of total volume was estimated. The distribution of gas hydrate changes along the line reaching the high concentration in the western part (about 17% of total volume). In addition, the distribution of gas hydrate and free gas concentrations seems to have an opposite trend. In correspondence of high concentration of gas hydrate, it is present at a low free gas concentration and vice versa. Along this line, the GG, extracted from BSR depth, is about 87 °C/km, and it decreases to 32 °C/km in the western part. This variable GG is related to the variable BSR depth (400 to 200 mbsf).
The seismic velocity of the layer containing gas hydrates was translated in terms of porosity variations caused by the hydrate presence, as shown in Figure 2, reporting the seafloor slope extracted from the seismic data. This line shows high porosity variations (about −35%), corresponding to the highest gas hydrate concentration, in correspondence of a higher seafloor slope (about 30°).
Another characteristic of the northern part is the presence of strong velocity variation above the BSR, as clearly detected offshore Arauco along the seismic line SO161-44, while low velocity is recorded (about 1550 m/s) below the BSR and associated to free gas [10]. A discontinuous BSR is recognizable at about 500 mbsf, and the concentration of gas hydrate reaches values equal to about 15% of the total volume. On the contrary of the previous seismic line, the GG is quite constant, showing an average value of about 30 °C/km.
North to Mocha Island, located at about 38.3° S, two marine campaigns have been performed with the scope of acquiring bathymetric data, seawater samples, and marine sediments [34]. The analysis of the acquired data allowed us to discover a positive relief, composed by five aligned mud cones. The authors hypothesized that these features are located in proximity of the intersection between the theoretical HSZ and the seafloor where hydrates are not stable, favouring flow escapes. The analysis of two seismic lines located south to the Mocha Island supports this hypothesis because of their location in proximity of important features associated with past hydrate dissociations [14]. The line SO161-35, at about 12 km south to the Mocha Island, shows a strong and continuous BSR with a variable depth and a maximum thickness of about 200 mbsf in the western portion, while along the line RC2901-731, at about 60 km south to this island, it is possible to recognize a discontinuous and locally strong BSR. It is important to notice that the BSR reaches the seafloor in the eastern part of the line SO161-35. Hence, the hydrate is present in the shallow sediments and, consequently, sensitive to a temperature change of the sea-bottom water. In both seismic lines, it is possible to recognize a BGR with an average thickness of about 70 m, supported by a drop in seismic velocity below the BSR. The concentration of free gas ranges from 0.1% to 1.1% of the total volume and from 0.1% to 0.3% of the total volume for SO161-35 and RC2901-731 profiles, respectively. A relative high concentration of gas hydrate, that ranges from 12% to 20% of total volume, is associate with a high velocity (ranging from 1700 to 1900 m/s) detected above BSR. In correspondence of the portion characterized by low velocity, in both sections, it is possible to recognize that the seafloor is affected by faults and fractures characterised by small slips. An opposite trend in distribution of gas hydrate and free gas concentration was recognized for both sections. Even if the GG has a variable trend along the seismic profiles, the SO161-35 section shows a higher GG (from 60 to 110 °C/km) than the GG estimated in the RC2901-731 section (from 35 to 65 °C/km). In Figure 4, the porosity variations due to the gas hydrate presence and the seafloor slope for the SO161-35 and RC2901-731 profile are reported. Regarding the SO161-35 profile, higher seafloor slope values (up to 30°) are near the coastline, where porosity variations are negligible because of a gas hydrate absence. On the other hand, note that, in the correspondence of the zone where the BSR and the hydrate presence is shallow, the slope reaches the highest values, indicated by a red arrow in Figure 4A.
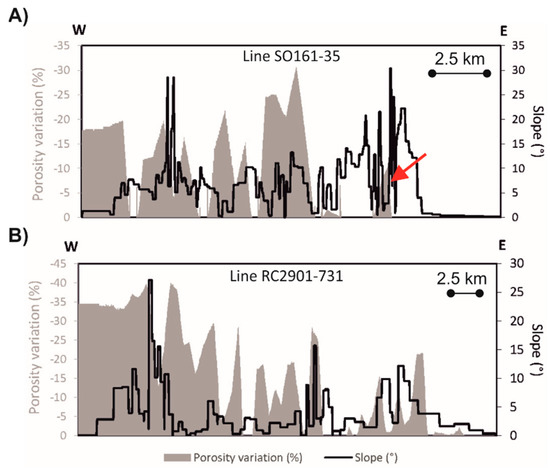
Figure 4.
(A) Porosity variations due to a gas hydrate presence (grey area) and slope variation (black line) along the line SO161-35. Red arrow indicates the zone characterized by a high seafloor slope and a shallow depth of bottom simulating reflector (BSR). (B) Porosity variations due to a gas hydrate presence (grey area) and slope variation (black line) along the line RC2901-731.
The RC2901-731 line generally shows low seafloor slope (less than 10°) along the whole profiles, while the porosity decrease is evident in the western part of the profile. The high free gas concentration along the SO161-35 profile in the proximity of Mocha Island could be linked to the dissociation of hydrate caused by past slides, as stated by Reference [35], or by stored free gas below an impermeable hydrate layer [14]. Meanwhile, the lowest concentration of the free gas along the RC2901-731 seismic profile could be explained by a high fluid escape through faults and fractures, preventing free gas storing, associated with a limited fluid supply from deep zones.
Moving south, the SO161-29 seismic profile located offshore Valdivia shows the presence of many faults and fractures that affect the shallower sediments, confirming a high tectonic activity of this area [13]. This high tectonic activity could be the explanation for a weak and discontinuous BSR with a depth of about 550 mbsf recognized along this line, allowing estimating a GG equal to 35 °C/km. A high concentration of hydrate ranging from 10% to 17% of total volume are recognized along the line. Figure 5 shows a strong decrease in porosity due to the hydrate presence with an absolute maximum value of 70% in correspondence of a seafloor slope showing values less than 10°. Free gas below the BSR is not recognized and this absence could be related to the presence of faults and fractures.
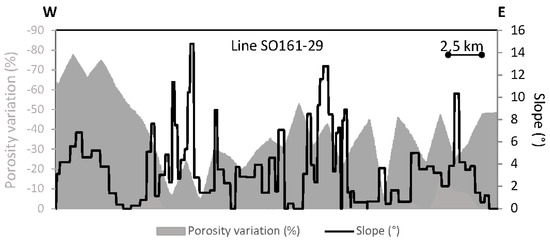
Figure 5.
Porosity variations due to the gas hydrate presence (grey area) and slope variation (black line) along the line SO161-29.
In the central part of the Chilean margin, the BSR becomes strong and continuous as well as the BGR, as detected by the SO161-40 seismic line located south of Chiloe Island [12]. Along this profile, the maximum depth of the BSR (about 600 mbsf) is identified in proximity where the estimated GG is about 25 °C/km. Moving toward the east, the BSR depth decreases when it is associated with an increase of GG reaching the value of 45 °C/km. The maximum value of hydrate and free gas concentrations is about 9.5% and 0.5% of total volume, respectively, even if their concentrations are quite variable along the seismic line.
We focalized our attention to the RC2901-734 seismic line, located offshore Coyhaique (44° S), that could be considered characteristic of the central part of the Chilean margin. This line shows a strong BSR in the eastern and western portions [9,10]. The BSR depth is variable reaching a maximum depth in the eastern portion (330 m) and in the western one (250 m), while the minimum depth (130 m) is in the central part where the water column thickness is smaller. The BSR is not present when there are intensive deformations with faults and fractures. Below the BSR, a free gas layer is recognized with an average thickness of 70 m, as detected by the presence of a BGR. The estimated GG, ranging from 35 to 95 °C/km, is explained by the variable BSR depth along the line. In fact, the maximum GG is in proximity of the central part where the BSR depth is minimal. The western part of the line is characterized by the highest concentration of hydrate (about 23% of total volume), which becomes negligible moving toward the east, while it varies from 4% to 9% in the eastern part. In Figure 6, it is reported that the decrease in porosity (about 40%) is caused by the hydrate presence in correspondence of a seafloor slope of 40°.
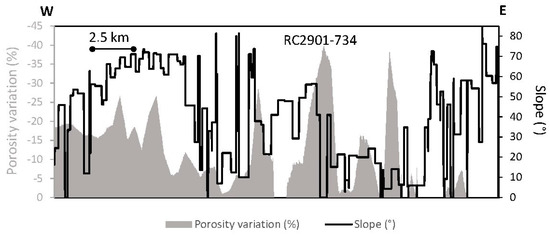
Figure 6.
Porosity variations due to a gas hydrate presence (grey area) and slope variation (black line) along the line RC2901-734.
In the central part of the seismic line, there is no porosity variations because the concentration of gas hydrate is limited, while, moving toward the west, the porosity decreases until about −20% because of a higher gas hydrate concentration. The porosity decrease is accompanied by a constant slope equal to about 70°. Therefore, this area is quite critical from a hazard point of view. As already highlighted for other lines, the distribution of free gas concentration shows the opposite trend compared to the gas hydrate distribution. Furthermore, the higher values (3% of total volume) are recorded in correspondence of the central part and decrease toward the eastern and western parts (1% of total volume). The anticlinal located in the central part constitutes a trap for the accumulation of fluid.
South of CTJ, the RC2901-751 profile shows an anomalous estimated geothermal gradient, ranging between 35 to 190 °C/km, related to the proximity of the CTJ. High concentrations of gas hydrate are in the western part of the line, reaching values ranging between 7% and 10% of the total volume, while the highest concentrations of free gas (up to 0.8% of total volume) are present in the eastern part. Clearly, the distribution of the gas hydrate and free gas concentrations seem to have the opposite trend.
Moving south from the FTJ, only one seismic line (RC2902-790) was analysed to perform the first estimation of the phase-gas in Patagonia [16]. High velocity was recognised to be above the BSR due to the presence of a gas hydrate, whereas the seismic velocity (1600–1700 m/s) below it is too high to justify a free gas presence, but too low to justify water-bearing sediments [36]. Moreover, the base of free gas is not recognised, so we can hypothesise that the resolution of the data is not adequate to detect the base of free gas or that there is a patchy distribution of the free gas in the pore space [26]. The average concentration of the hydrate is about 3.4% of the total volume with a maximum value of 10% of the total volume where the BSR is the strongest. In this area, the presence of BSR was already supposed by other authors [4,7,8]. In fact, the line IT95-171, located in proximity of the line RC2902-790, shows the presence of a continuous and high-amplitude BSR. Moving toward the north, BSR disappears and is not recognised along other seismic lines located in proximity of the FTJ. Clearly, BSR absence does not exclude the presence of gas hydrates, even if the high heat flow, related to the interaction of the plates, could inhibit the hydrate presence. Moving beyond this Triple Junction a few kilometres away, the BSR is recognised at 500 mbsf in a limited portion of old seismic lines. In Figure 7, the porosity variation along the line RC2902-790 is reported. The western portion of the line shows a very small decrease in porosity (around 6%) with a seafloor slope around 40°. Therefore, in this part of the Chilean margin, the effect on slope instability due to potential hydrate dissociation is marginal.
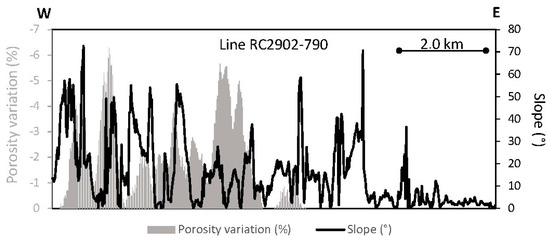
Figure 7.
Porosity variations due to the gas hydrate presence (grey area) and slope variation (black line) along the line RC2902-790.
The steady-stated modelling allowed us to verify where a gas hydrate could be interesting by the energy point of view, but also define the areas where gas hydrate are sensitive to a climate change in the northern part of the Chilean margin where the gas hydrate concentration is more promising (see Figure 3). The exploitation of a gas hydrate reservoir cannot prescind to understand the effects of climate change on the gas hydrate reservoir because, at the moment, it is not clear whether the trend of the temperature and sea level varies. Therefore, the different future scenarios based on the IPCC and NASA forecasts were developed by considering an increase in the temperature equal to +2 °C and +4 °C and an increase in the sea level equal to +1.6 m and +3.2 m. These scenarios represent the forecast of the next 50 and 100 years, respectively. The modelling of present-day conditions pointed out that, at the present day, the base of methane HSZ could be at 580 mbsf (Figure 3A). In addition, climate change could strongly affect gas hydrate stability and, in particular, the increase in temperature would determine the gas hydrate dissociation along the upper slope, as shown in Figure 3B. The colored lines represent the intersection between the base of the methane HSZ and the seafloor for the considered scenarios. As shown in Figure 3, the climate change could determine the shift of the intersection between the base of the methane HSZ and the seafloor toward the east with a consequent dissociation of hydrate.
4. Discussion
The Chilean margin shows a strong variability in the distribution of the hydrate and free gas concentrations, which is very interesting from the energy point of view, but, on the other hand, also sensitive to different geo-hazards, affecting this region. The interaction between regional and local factors seems to be the cause driving the variability in the distribution of hydrate and free gas. For example, the high GG in proximity of the FTJ factors could explain the absence of a gas hydrate, as pointed out by different authors [16]. Clearly, the exploitation of the gas hydrate reservoir has to be accompanied by identifying possible hazards, which could affect logistical operations during the exploitation phases.
Moving from north to the CTJ, the gas hydrate concentration decreases from a maximum value equal to 20% of the total volume to about 10% of the total volume in proximity of CTJ. The GG is variable along the margin, but, moving toward the south, it increases up to 200 °C/km. As already mentioned, high GG is in accordance with the absence of gas hydrate in proximity of FTJ. Southern to the FTJ, the porosity variations are limited when compared to the norther part, even if the slope reaches values higher than 60°. Based on available data, this portion of the margin does not seem interesting for hydrate exploitation, as better explained in the following. On the other hand, the zone northern to the FTJ shows a higher concentration of hydrate and free gas, but it could be more sensitive to gas hydrate dissociation because porosity decreases in correspondence of higher seafloor slope values, and, clearly, the gas hydrate dissociation could change the petrophysical characteristics of subsoil, triggering seafloor instabilities.
The analysis of seismic lines highlights that, in some cases, free gas is absent or present in a small concentration and it seems to be related to faults and fractures, allowing the fluids to escape. On the other hand, in the northern and central sector, the absence of BGR can be associated with basal accretion processes, as reported by Reference [11].
From the exploitation point of view, the northern part of the Chilean margin is more promising because of the high hydrate concentrations (for example ~20% of the total volume along the profiles SO161-35 and RC2901-731 offshore Mocha Island). The hydrate reservoir located close to the coast (e.g., less than 10 km offshore Valparaíso and Arauco, [31]) requires easier logistic conditions for future mining expeditions and reduced seafloor slope when compared to the South (Figure 2, Figure 4, and Figure 5). However, in this area, sediments seem to consist primarily of homogeneous dark olive-grey to dark grey silty clay and clay (e.g., ODP Leg 202 Sites 1234 and 1235, [33]), which, on the basis of the Gas Hydrate Resources Pyramid model [37] results, are not convenient for mining in comparison with the sand bodies, which can contain discrete and isolated reservoirs being richly concentrated. Moreover, the proximity of the hydrate reservoir to the coast is an aggravating factor from an environmental point of view because the potential dissociation of gas hydrate induced by natural phenomena, such as climate change or earthquakes, and/or anthropogenic activities could affect the stability of the margin, as underlined by the modelling Figure 3 (see details in Reference [31]) and they should be considered during the exploitation planning in order to avoid risks for the population living near the coast. In addition, along the line SO161-35, the hydrate is present close to the seafloor (Figure 3A, [14]), where the slope reaches the highest values, suggesting that the slope stability of the margin should be appropriately monitored in the case of exploitation.
The central and southern sectors of the margin seem to be less interesting from an energy point of view due to limited and local distribution of gas hydrates (Figure 6 and Figure 7). Furthermore, as well as the northern part, sediments in the area of the CTJ consist primarily of fine grain silty clays [38], which are not promising for exploitation. Nevertheless, southern of the CTJ, there are a lack of well data (e.g., ODP Legs). Therefore, no information on deposit permeability, porosity, or sediment content is available. At this stage, it requires more efforts to obtain these parameters for evaluating the potentiality of the reservoir. In conclusion, the future exploitation of a gas hydrate reservoir requires a deep knowledge of the natural and anthropogenic factors affecting hydrate stability. The improvement of the geological dataset will become essential when defining prospecting areas in all sites interesting from a gas hydrate point of view.
5. Conclusions
The Chilean margin is very interesting from a gas hydrate point of view, as pointed out from the analysis of seismic lines acquired along the whole margin. Therefore, the gas hydrate could be a good opportunity to answer energy demand of Chile. In the north portion (from about 35° S and 39° S), the gas hydrate reservoir is interesting from an energy point of view, even if the reservoir is hosted in low permeability sediments. Then, efforts should be devoted to better characterize the gas hydrate reservoir in this portion of Chile, considering the possible geo-hazards that could affect the exploitation activities. In the central and southern part of the margin, the gas hydrate presence is local and limited, so the interest from an energy point of view is more limited. In any case, the additional dataset, including geophysical, geochemical, and geological data, are required to better characterize the reservoir. In addition, this area is sensitive to different geo-hazards, which should be considered in the case of exploitation of the reservoir. In fact, here, gas hydrate reservoirs are strongly affected by geological activity (tectonics, earthquakes) and climate change that could determine gas hydrate dissociations and/or leakage of the free gas trapped below HSZ. Furthermore, the steady-state modelling performed from Valparaíso to Taitao Peninsula pointed out that the climate change could determine gas hydrate dissociation, triggering slope failure. This hypothesis is supported by the presence of high concentrations of gas hydrate in correspondence of an important seafloor slope. The hydrate dissociation could change the petrophysical characteristics and, in particular, the fluid and solid contents of the subsoil triggering slopes, which already occurred in the past. In conclusion, before exploiting this important reservoir, more effort should be devoted to gaining a better characterization of the reservoir acquiring a new dataset, including geophysical, geochemical, geological, and well data, and a better understanding of the relation between the hydrate system and hazards that could affect the exploitation.
Author Contributions
Funding
This research was partially supported by the Italian Ministry of Education, Universities and Research (Decreto MIUR No. 631 dd. 8 August 2016) under the extraordinary contribution for Italian participation in activities related to the international infrastructure PRACE—The Partnership for Advanced Computing in Europe (www.prace-ri.eu).
Conflicts of Interest
The authors declare no conflict of interest.
References
- Bangs, N.L.; Sawyer, D.S.; Golovchenko, X. Free gas at the base of the gas hydrate zone in the vicinity of the Chile triple Junction. Geology 1993, 21, 905–908. [Google Scholar] [CrossRef]
- Brown, K.M.; Bangs, N.L.; Froelich, P.N.; Kvenvolden, K.A. The nature, distribution, and origin of gas hydrate in the Chile Triple Junction region. Earth Planet Sci. Lett. 1996, 139, 471–483. [Google Scholar] [CrossRef]
- Grevemeyer, I.; Kaul, N.; Díaz-Naveas, J.L. Geothermal evidence for fluid flow through the gas hydrate stability field off Central Chile-transient flow related to large subduction zone earthquakes? Geophys. J. Int. 2006, 166, 461–468. [Google Scholar] [CrossRef]
- Loreto, M.F.; Tinivella, U.; Ranero, C. Evidence for fluid circulation, overpressure and tectonic style along the Southern Chilean margin. Tectonophysics 2007, 429, 183–200. [Google Scholar] [CrossRef]
- Polonia, A.; Brancolini, G.; Torelli, L.; Vera, E. Structural variability at the active continental margin off southernmost Chile. J. Geodyn. 1999, 27, 289–307. [Google Scholar] [CrossRef]
- Polonia, A.; Brancolini, G.; Torelli, L. The accretionary complex of southernmost Chile from the strait of Magellan to the Drake passage. Terra Antarct. 2001, 8, 87–98. [Google Scholar]
- Polonia, A.; Torelli, L.; Brancolini, G.; Loreto, M.F. Tectonic accretion versus erosion along the southern Chile trench: Oblique subduction and margin segmentation. Tectonics 2007, 26, TC3005. [Google Scholar] [CrossRef]
- Polonia, A.; Torelli, L. Antarctic/Scotia plate convergence off southernmost Chile. Geol. Acta 2007, 5, 295–306. [Google Scholar]
- Vargas-Cordero, I.; Tinivella, U.; Accaino, F.; Loreto, M.F.; Fanucci, F.; Reichert, C. Analyses of bottom simulating reflections offshore Arauco and Coyhaique (Chile). Geo-Mar. Lett. 2010, 30, 271–281. [Google Scholar] [CrossRef]
- Vargas-Cordero, I.; Tinivella, U.; Accaino, F.; Loreto, M.F.; Fanucci, F. Thermal state and concentration of gas hydrate and free gas of Coyhaique, Chilean Margin (44_ 300 S). Mar. Pet. Geol. 2010, 27, 1148–1156. [Google Scholar] [CrossRef]
- Vargas-Cordero, I.; Tinivella, U.; Accaino, F.; Fanucci, F.; Loreto, M.F.; Lascano, M.E.; Reichert, C. Basal and frontal accretion processes versus BSR characteristics along the Chilean Margin. J. Geol. Res. 2011, 2011, 1–10. [Google Scholar] [CrossRef]
- Vargas-Cordero, I.; Tinivella, U.; Villar-Muñoz, L.; Giustiniani, M. Gas hydrate and free gas estimation from seismic analysis offshore Chiloé island (Chile). Andean Geol. 2016, 43, 263–274. [Google Scholar] [CrossRef]
- Vargas-Cordero, I.; Tinivella, U.; Villar-Muñoz, L. Gas hydrate and free gas concentrations in two sites inside the Chilean Margin (Itata and Valdivia offshores). Energies 2017, 10, 2154. [Google Scholar]
- Vargas-Cordero, I.; Tinivella, U.; Villar-Muñoz, L.; Bento, J.P. High gas hydrate and free gas concentrations: An explanation for seeps offshore south Mocha island. Energies 2018, 11, 3062. [Google Scholar] [CrossRef]
- Villar-Muñoz, L.; Behrmann, J.H.; Diaz-Naveas, J.; Klaeschen, D.; Karstens, J. Heat flow in the southern Chile forearc controlled by large-scale tectonic processes. Geo-Mar. Lett. 2014, 34, 185–198. [Google Scholar] [CrossRef]
- Villar-Muñoz, L.; Bento, J.P.; Klaeschen, D.; Tinivella, U.; Vargas-Cordero, I.; Behrmann, J.H. A first estimation of gas hydrates offshore Patagonia (Chile). Mar. Pet. Geol. 2018, 96, 232–239. [Google Scholar] [CrossRef]
- Villar-Muñoz, L.; Vargas-Cordero, I.; Bento, J.P.; Tinivella, U.; Fernandoy, F.; Giustiniani, M.; Behrmann, J.H.; Calderón-Díaz, S. Gas hydrate estimate in an area of deformation and high heat flow at the Chile Triple Junction. Geosciences 2019, 9, 28. [Google Scholar] [CrossRef]
- Coffin, R.; Pohlman, J.; Gardner, J.; Downer, R.; Wood, W.; Hamdan, L.; Walker, S.; Plummerg, R.; Gettrus, J.; Diaz, J. Methane hydrate exploration on the mid Chilean coast: A geochemical and geophysical survey. J. Pet. Sci. Eng. 2007, 6, 32–41. [Google Scholar] [CrossRef]
- Geersen, J.; Scholz, F.; Linke, P.; Schmidt, M.; Lange, D.; Behrmann, J.H.; Volker, D.; Hensen, C. Fault zone controlled seafloor methane seepage in the rupture area of the 2010 Maule earthquake, Central Chile. Geochem. Geophys. Geosyst. 2016, 17, 4802–4813. [Google Scholar] [CrossRef]
- Jessen, G.L.; Pantoja, S.; Gutierrez, M.A.; Quinones, R.A.; Gonzalez, R.R.; Sellanes, J.; Kellermann, M.Y.; Hinrichs, K.U. Methane in shallow cold seeps at Mocha Island off central Chile. Cont. Shelf Res. 2011, 31, 574–581. [Google Scholar] [CrossRef]
- Sellanes, J.; Quiroga, E.; Gallardo, V. First direct evidence of methane seepage and associated chemosynthetic communities in the bathyal zone off Chile. J. Mar. Biol. Assoc. UK 2004, 84, 1065–1066. [Google Scholar] [CrossRef]
- Sellanes, J.; Krylova, E. A new species of Calyptogena (Bivalvia, Vesicomyidae) from a recently discovered methane seepage area off Concepción Bay, Chile (36S). J. Mar. Biol. Assoc. UK 2005, 85, 969–976. [Google Scholar] [CrossRef]
- Sellanes, J.; Quiroga, E.; Neira, C. Megafaunal community structure and trophic relationships of the recently discovered Concepción Methane Seep Area (Chile, 36S). ICES J. Mar. Sci. 2008, 65, 1102–1111. [Google Scholar] [CrossRef]
- Scholz, F.; Hensen, C.; Schmidt, M.; Geersen, J. Submarine weathering of silicate minerals and the extent of pore water freshening at active continental margins. Geochim. Cosmochim. Acta 2013, 100, 200–216. [Google Scholar] [CrossRef]
- Tinivella, U. A method for estimating gas hydrate and free gas concentrations in marine sediments. Bolletino Geofis. Teor. Appl. 1999, 40, 19–30. [Google Scholar]
- Tinivella, U. The seismic response to overpressure versus gas 638 hydrate and free gas concentration. J. Seism. Explor. 2002, 11, 283–305. [Google Scholar]
- Villar-Muñoz, L. Gas Hydrate in Sediments on the Southern Chile Continental Slope. Ph.D. Thesis, Kiel University, Kiel, Germany, 11 November 2019. [Google Scholar] [CrossRef]
- Cisternas, M.; Atwater, B.F.; Torrejón, F.; Sawai, Y.; Machuca, G.; Lagos, M.; Eipert, A.; Youlton, C.; Salgado, I.; Kamataki, T.; et al. Predecessors of the giant 1960 Chile earthquake. Nature 2005, 437, 404–407. [Google Scholar] [CrossRef]
- Ranero, C.R.; von Huene, R.; Weinrebe, W.; Reichert, C. Tectonic processes along the Chile convergent margin. In The Andes. Frontiers in Earth Sciences; Oncken, O., Chong, G., Franz, G., Giese, P., Götze, H.-J., Ramos, V.A., Strecker, M.R., Wigger, P., Eds.; Springer: Berlin, Germany, 2006. [Google Scholar] [CrossRef]
- Loreto, M.F.; Tinivella, U. Gas hydrate versus geological features: The South Shetland case study. Mar. Pet. Geol. 2012, 36, 164–171. [Google Scholar] [CrossRef]
- Alessandrini, G.; Tinivella, U.; Giustiniani, M.; Vargas-Cordero, I.L.C.; Castellaro, S. Potential instability of gas hydrates along the Chilean margin due to ocean warming. Geosciences 2019, 9, 234. [Google Scholar] [CrossRef]
- Bangs, N.L.; Brown, K.M. Regional heat flow in the vicinity of the Chile Triple Junction constrained by the depth of the bottom simulating reflection. Proc. ODP Sci. Results 1995, 141, 253–259. [Google Scholar]
- Mix, A.C.; Tiedemann, R.; Blum, P. Shipboard Scientific Party Proceedings of the ODP; Initial Reports, 202; Ocean Drilling Program: College Station, TX, USA, 2003; pp. 1–145. [Google Scholar]
- Vargas-Cordero, I.; Tinivella, U.; Villar-Muñoz, L.; Bento, J.P.; Cárcamo, C.; López-Acevedo, D.; Fernandoy, F.; Rivero, A.; San Juan, M. Gas hydrate versus seabed morphology offshore Lebu (Chilean margin). Sci. Rep. 2020, 10, 21928. [Google Scholar] [CrossRef] [PubMed]
- Geersen, J.; Völker, D.; Behrmann, J.H.; Reichert, C.; Krastel, S. Pleistocene giant slope failures offshore Arauco peninsula, southern Chile. J. Geol. Soc. 2011, 168, 1237–1248. [Google Scholar] [CrossRef]
- Tinivella, U.; Carcione, J.M. Estimation of gas-hydrate concentration and free-gas saturation from log and seismic data. Lead. Edge 2001, 20, 200–2003. [Google Scholar] [CrossRef]
- Boswell, R. Engineering. Is gas hydrate energy within reach? Science 2009, 325, 957. [Google Scholar] [CrossRef]
- Behrmann, J.H.; Lewis, S.D.; Musgrave, R.J.; Arqueros, R.; Bangs, N.; Boden, P.; Brown, M.K.; Collombat, H.; Didenko, A.N.; DiDuk, B.M. Chile Triple Junction. In Proceedings of the ODP; Initial Reports, 141; Ocean Drilling Program: College Station, TX, USA, 1992. [Google Scholar] [CrossRef]


Publisher’s Note: MDPI stays neutral with regard to jurisdictional claims in published maps and institutional affiliations. |
© 2021 by the authors. Licensee MDPI, Basel, Switzerland. This article is an open access article distributed under the terms and conditions of the Creative Commons Attribution (CC BY) license (http://creativecommons.org/licenses/by/4.0/).