Article

Emission Characteristics for Swirl Methane–Air Premixed Flames with Ammonia Addition

Institute of Thermal Engineering, Poznan University of Technology, 60-965 Poznan, Poland
*
Author to whom correspondence should be addressed.
Energies 2021, 14(3), 662; https://doi.org/10.3390/en14030662
Submission received: 5 January 2021 / Revised: 20 January 2021 / Accepted: 22 January 2021 / Published: 28 January 2021
(This article belongs to the Special Issue Computational Thermal, Energy, and Environmental Engineering)

Abstract

:
This paper details the experimental and numerical analysis of a combustion process for atmospheric swirl burners using methane with added ammonia as fuel. The research was carried out for lean methane–air mixtures, which were doped with ammonia up to 5% and preheated up to 473 K. A flow with internal recirculation was induced by burners with different outflow angles from swirling blades, 30° and 50°, where tested equivalence ratio was 0.71. The NO and CO distribution profiles on specified axial positions of the combustor and the overall emission levels at the combustor outlet were measured and compared to a modelled outcome. The highest values of the NO emissions were collected for 5% NH3 and 50° (1950 ppmv), while a reduction to 1585 ppmv was observed at 30°. The doubling of the firing rates from 15 kW up to 30 kW did not have any great influence on the overall emissions. The emission trend lines were not proportional to the raising share of the ammonia in the fuel. 3D numerical tests and a kinetic study with a reactor network showed that the NO outlet concentration for swirl flame depended on the recirculation ratio, residence time, wall temperature, and the mechanism used. Those parameters need to be carefully defined in order to get highly accurate NO predictions—both for 3D simulations and simplified reactor-based models.

1. Introduction

The simultaneous oxidation and reduction of ammonia has been investigated over a few decades ago, in the context of pollutant emissions. The above-mentioned research was connected mainly with NO fuel formation and its mitigation with selective non-catalytic reduction (SNCR) systems. An additional point of an interest was the influence of impurities on synthetic and biofuels combustion, with its NH3 share up to few thousands of ppmv [1,2,3]. Nowadays, the researchers’ efforts are focused on low emission and a carbonless combustion, where the ammonia plays an important role as an efficient hydrogen vector [4]. The long record of industrial use of ammonia, followed by similar transportation and storage methods to that of propane, are the advantages worth mentioning as well. However, some challenges still need to be faced, like flame instabilities and outlet NO emissions, which highly exceed any acceptable values.
Lean premixed combustion is one of the most common solutions for low-emission power generation, which is connected with gas turbine combustion and emission mitigation techniques. The method works properly for pure hydrocarbon–air flames but can be insufficient, even for the ammonia-doped flames. Maintaining a moderate process temperature allows avoiding additional thermal NO formation, although an excess of oxygen in the reaction zone leads directly to ammonia oxidation. Kurata et al. [5] observed a global rise of NO emissions, with an increase of the NH3 share in the relevant gas turbine conditions. It was also reported that a further increase of a NH3/CH4 fuel ratio lowers the NO share because of the NO reduction by residual ammonia, which was not burned in the primary zone, if the combustion was non-homogeneous.
Recently investigated fuel blends cover a full range of ammonia shares, from percentages to pure ammonia combustion, both for hydrogen mixtures [6,7,8,9,10,11] and hydrocarbon fuels [5,8,12,13,14,15,16]. Several studies also discussed the ammonia behavior in oxygen-enriched conditions [17,18]. Additional oxygen could improve the combustion characteristics, such as flame speed and temperature, when it is utilized as fuel. However, safety issues should be carefully considered for potential ammonia industrial applications, where an oxygen-enriched atmosphere is present. A shift from air to pure oxygen could result in the combustion-induced pressure pulses with over-adiabatic peaks [19].
The following research is focused on the lowest range of the above-mentioned shares, with methane as a base fuel and the ammonia addition being up to 5%. It is a characteristic point where the ammonia conversion to NO is incomplete and the reduction process takes place only partially [20]. Moreover, this value is also corresponding to the ammonia content in the fuel impurities of nonstandard gaseous fuels.
The behavior of ammonia in lean combustion is discussed widely in the literature [7,21,22,23,24,25,26,27,28]. The general consumption of NH3 by H abstraction through OH is observed for all equivalence ratios in a range of mixture flammability. A secondary decomposition follows in the presence of H and O radicals, with NH2 as a product. Oxidation of NH to NO proceeds mainly through an intermediate HNO, while the NO reduction with NH depends on the concentration of O/H radicals. An excess of O/H radicals supports the conversion of NH to NO and could lower the rates of NO reduction by NH radicals. Unfavorably, lean flames have a sufficient supply of O/H, with maximum value reported for the equivalence ratios at around 0.9, so the highest emission values could be expected there. One of the most important reduction pathways is connected with the reaction of NH2 with NO through two different channels—NNH + OH and N2 + H2O. The second method of NO reduction is flue gas recirculation (FGR). Mendiara and Glarborg [29] have also investigated the addition of CO2 to the NH3/CH4/air flames, which could be interesting in context of FGR. The research showed that a significant decrease of the NO share could be obtained for stoichiometric conditions, because of CO formation from CO2, with consumption of H radicals.
Lean flames tend to generate instabilities, which could be compensated for with an induction of an internal (or central) recirculation zone (CTRZ). The specified flow formation provides a constant inflow of reacting gases into the reaction zone. Di Sarli et al. [30] investigated lean premixed swirl flames and different mechanisms of self-excited oscillations. The coupling between pressure waves and the variations of the fresh mixture flow rate at the flame is responsible for the system’s instability, while the clash between the heat production rate and the heat loss rate is the reason of its intrinsic instability. The thermal conditions of the walls were found to be important in the context of compensating the instabilities—an increase of the combustor wall temperature could dampen the thermo-kinetic originated oscillations. However, the rise of the combustor wall temperature followed by an increase of the local process temperatures will also lead to an intensified NO formation, in case of ammonia co-combustion. The importance of heat exchange conditions regarding the ammonia swirl flame was also pointed out by Honzawa et al. [16]. Heat losses affected both NO and CO emissions, because their reactions are responsive to H and OH concentrations and gas temperature fluctuations. Moreover, the temperature dependency of the NO reaction was different between NH3/CH4/air and methane–air swirl flames. Somaranthe et al. [31] numerically compared the isothermal and adiabatic wall boundary condition for combustion chamber and swirl ammonia–methane flame. The wall heat losses of the combustor reduced NO emissions, but caused a significant ammonia slip, which could be compensated with preheating of a flammable mixture in order to increase the flame OH concentration.
The characteristic flow conditions for swirl flames also provide an active radical supply in the region of the fresh mixture delivery, which can affect the local flame structure and its influence on the ammonia chemistry. A significant contribution to the field of the lean ammonia–methane swirl flame studies was done by Valera-Medina, Xiao et al. [4,8,9,18,32,33], both experimentally and numerically. A chemical reactor network was designed and based on three perfectly stirred reactors in a loop, and a plug flow reactor for post flame zone modelling. A reduced kinetic reaction mechanism was proposed as well. A good agreement with the experimental outcome was achieved, and additionally, its performance was also checked with a LES simulation of a can combustor with a swirl burner. Khateeb et al. [34] experimentally investigated the effect of the swirl number and the equivalence ratio on a tangential burner flame’s stability in a function of the ammonia share in the fuel. The addition of ammonia to the methane significantly widened the flammability range, but also shifted it from the lean to the rich mixtures (0.79 ≤ φ ≤ 1.24). The research was conducted with a burner outflow nozzle of a constant diameter. Different types of nozzles could further increase the stability range, but that depends on the initial swirl number and the potential nozzle angle. Moreover, it could also unify a radial flow profile when blade-type swirl generators are used. A burner modification with a variable outflow angle from the nozzle was tested by Baej et al. [35]. The change of the outflow geometry can affect the CTRZ shape and residence time because of the control of the shear layer direction. Detailed investigation on diffuser cup influence was carried out by Degeneve et al. [36]. Dominant effects that control the leading-edge position of the CTRZ of the swirled flow include a decline of the axial velocity and an increase of the adverse axial pressure gradient, both due to the cross-section area change through the diffuser cup.
The evaluation of the circulating flow’s influence on the emission characteristics for the premixed swirl stands as a point of interest for the following investigation. The mass flow recirculation ratio is a significant variable, which simultaneously affects the residence time, the volume of the reactors and the local temperature near the hot walls of the combustor. The relationship of the combustion system elements and their setup could be tested with an iterative combination of numerical flow modelling and kinetic analysis, with reactor networks to balance calculation time and reliability, when finite-rate chemistry is required. The main objectives of this study are:
  • the determination of overall emission values and local parameters’ distribution for different swirl flames;
  • the identification of the influence of the combustion process’ parameters, such as recirculation ratio, residence time and wall thermal condition on the NO concentration for ammonia doped lean methane–air swirl flames;
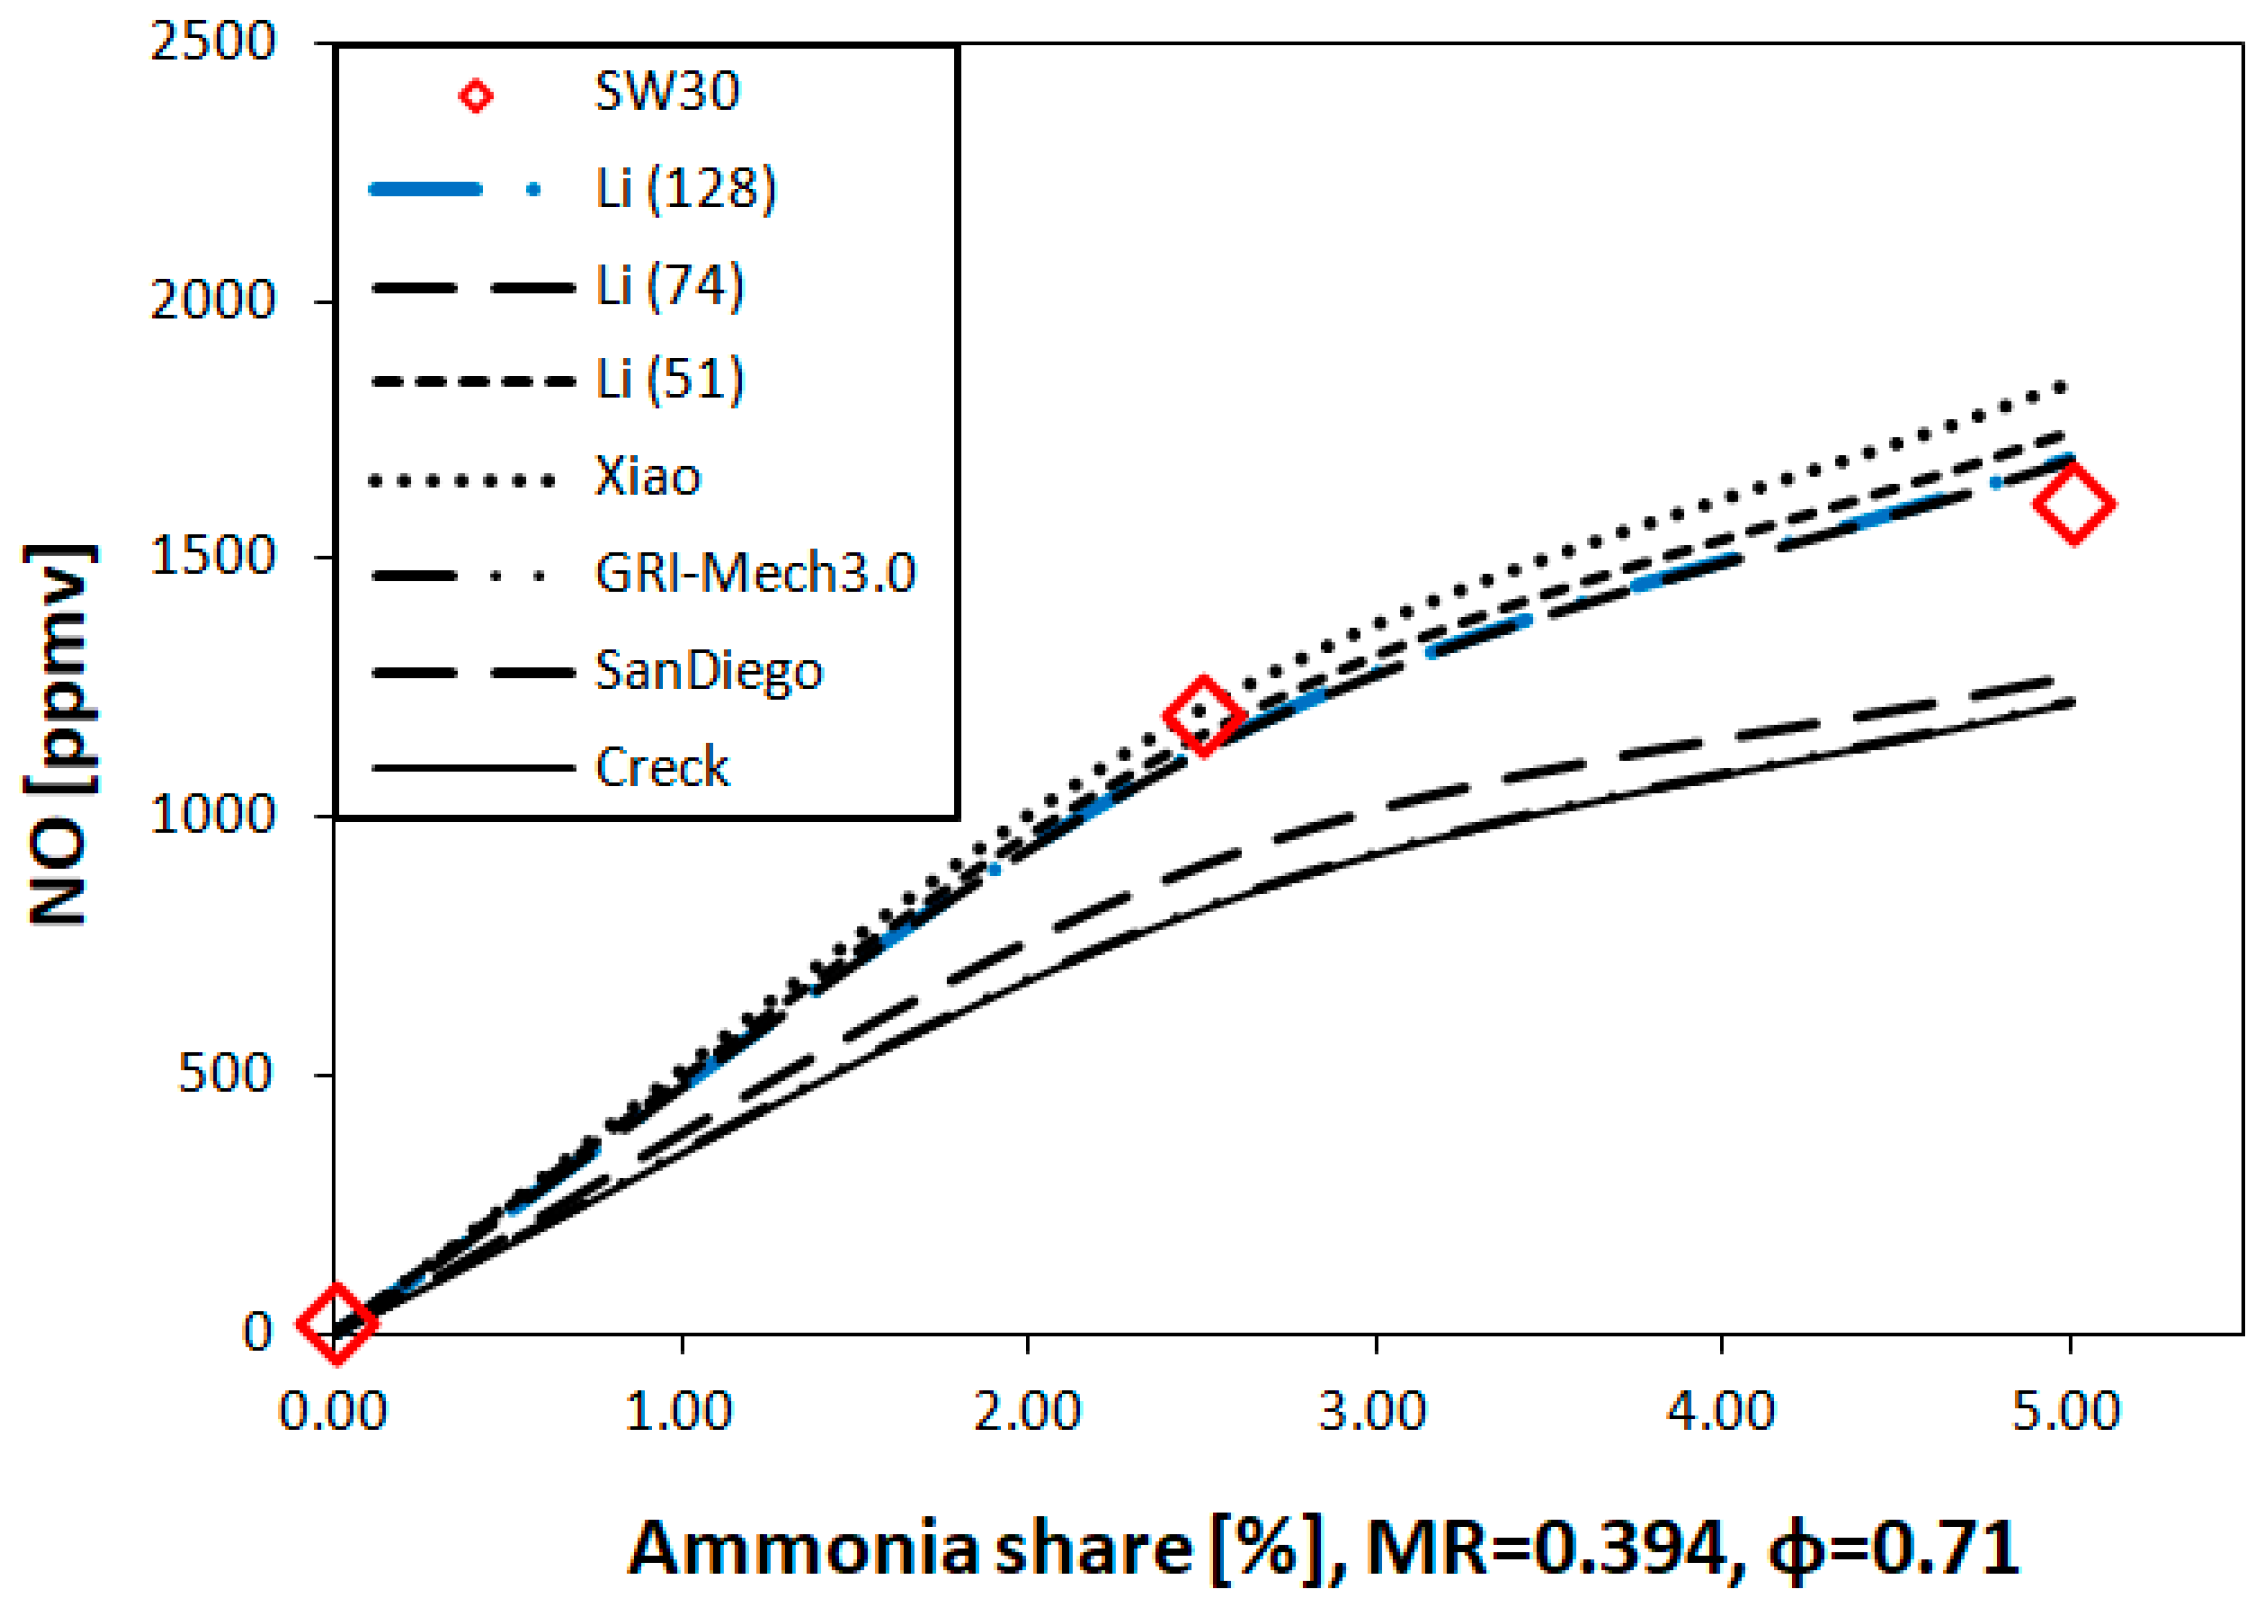
  • the evaluation of the of the NO emission prediction with different kinetic reaction mechanisms for ammonia doped lean methane–air swirl flames.

2. Research Methods

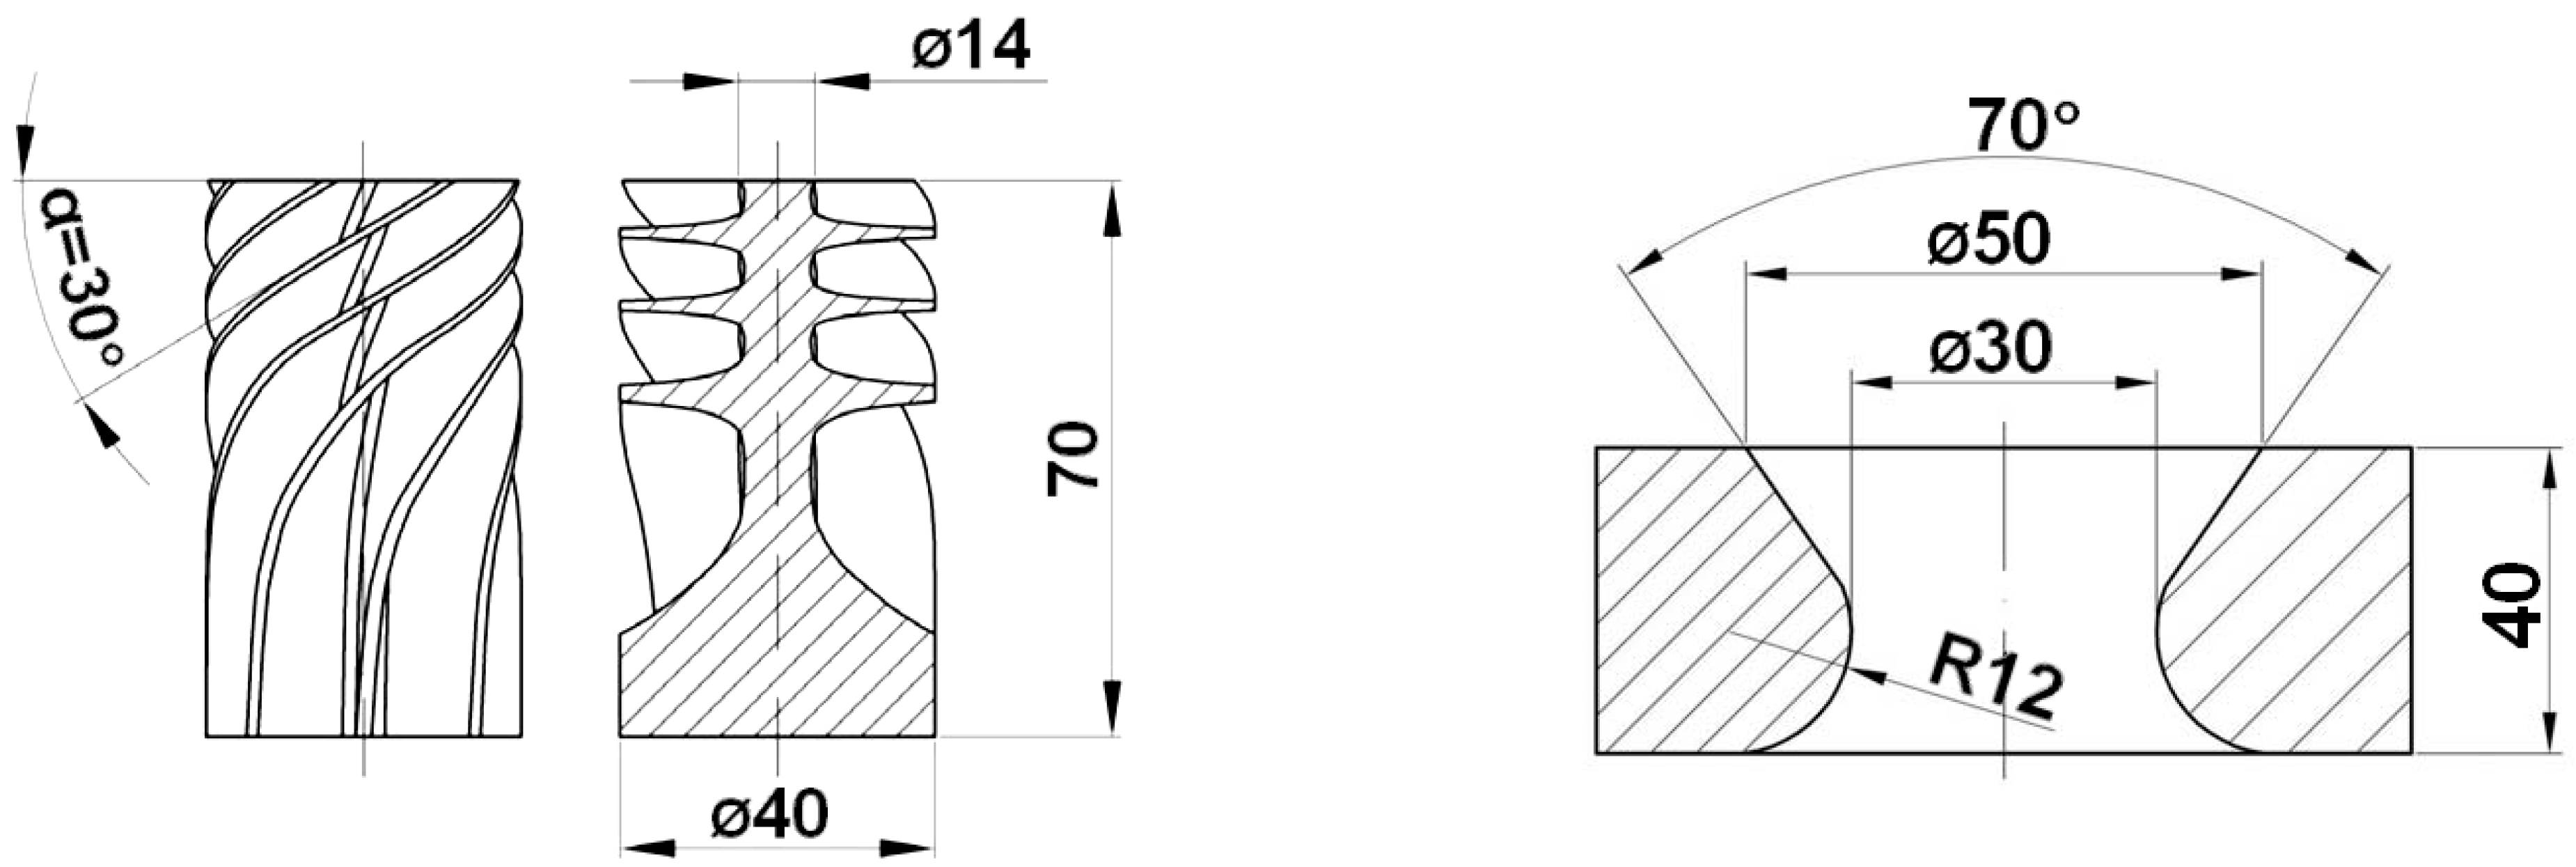
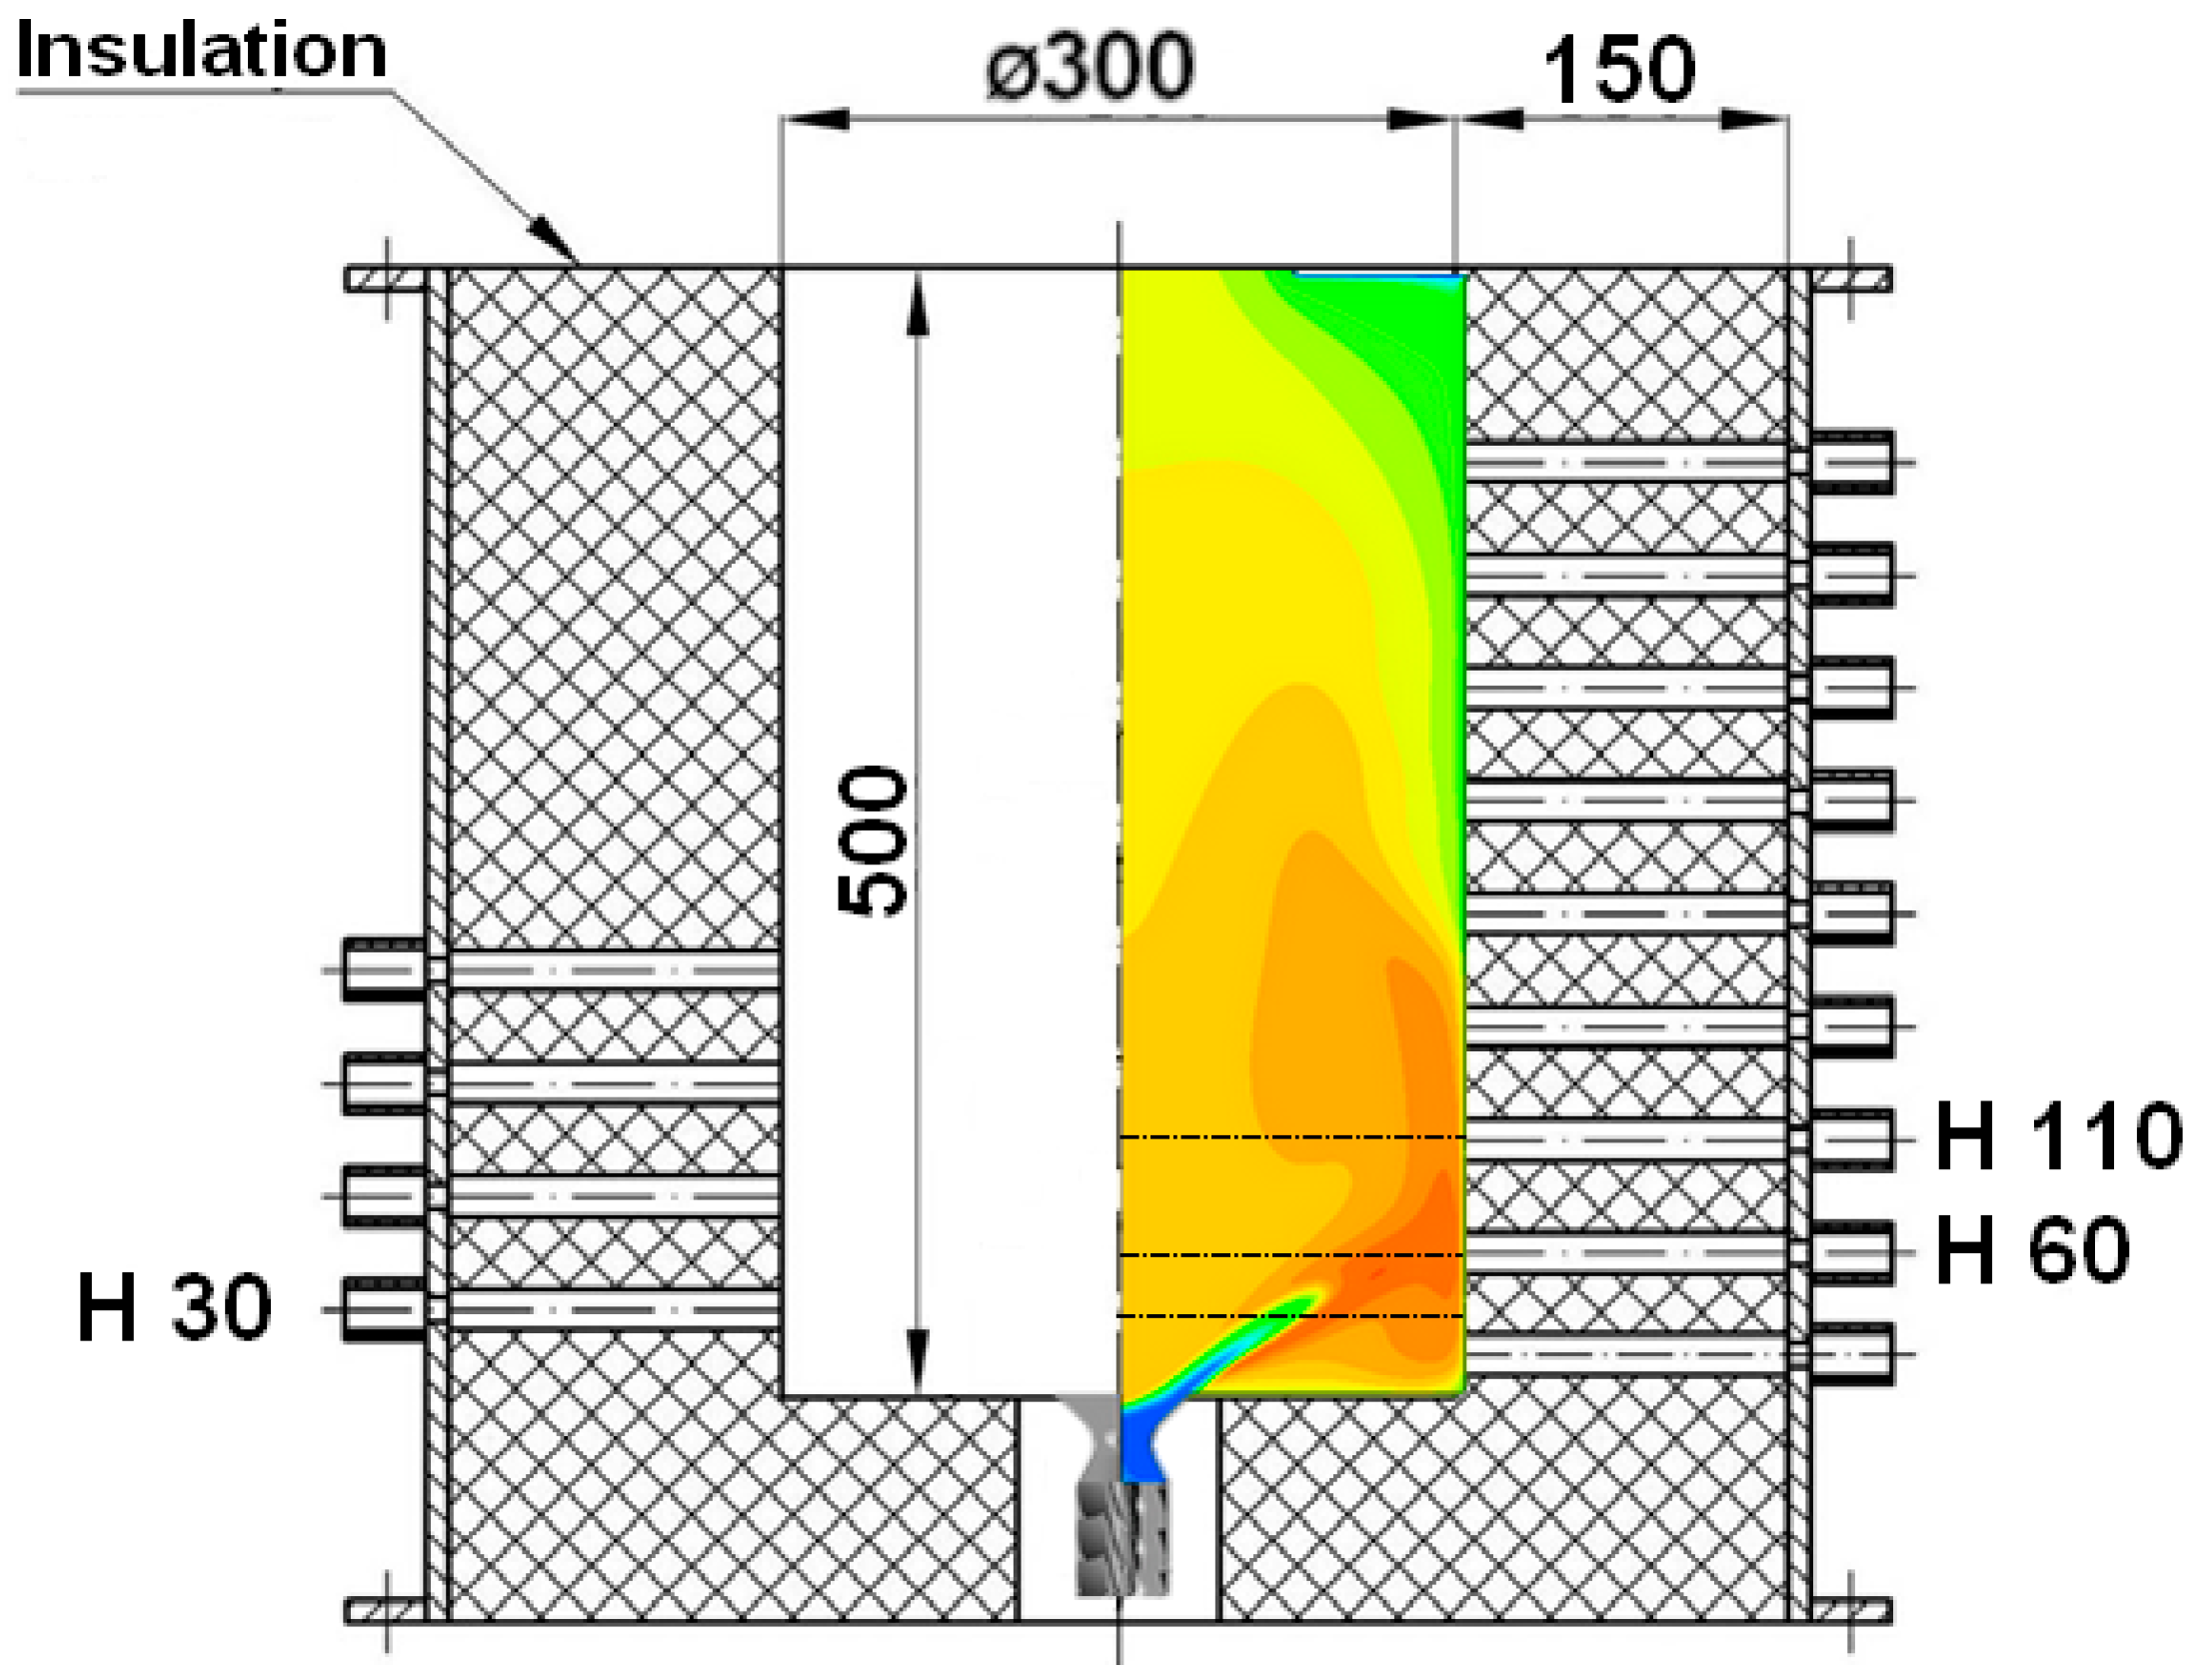
2.1. Experimental Setup

The following investigation was divided into two parts: in-flame measurements with an aspiration (suction) probe and an overall flue gases composition analysis in a chimney. The emission and temperature profiles were presented as a function of tests variables and compared to simulations’ outcome.
The experimental tests were conducted for lean methane flames with an addition of 2.5% and 5% of NH3. Moreover, testes without any addition of ammonia were performed as a reference point. An atmospheric pressure swirl burner, with an inner diameter of 14 mm and an outer diameter of 40 mm was placed in a ceramic round combustion chamber with a diameter of 300 mm. The combustor was insulated to prevent major heat losses.
Swirlers with different blade outflow angles were used to induce the flow recirculation. The outflow angle of 30° and 50° was chosen, referred to as SW30 and SW50, respectively (Figure 1). A convergent–divergent nozzle was placed at the burner outlet in order to increase the flame stability ranges and the uniformity of flow profile in a vertical flame cross-section. Additional flame stabilization was provided by initial mixture preheating—up to 473 K. It was also applied to minimize any potential NH3 slip.
The tests were conducted for constant burner firing rates—15 and 30 kW, which were corresponding to the change of temperature regimes and the total mass flow ratios in the combustion chamber. The equivalence ratio of 0.71 was chosen as a representative value for comparison of both of the swirling degrees for the local (in-flame) measurements.
The species distribution measurements were carried out with the ceramic aspiration probe without cooling, to preserve the system from additional heat flux losses. The probe was connected with a set of gas analyzers, moreover it was equipped with a coated type S thermocouple in order to measure the temperature profile inside the combustor. The local measurement levels were positioned over the burner outlet plane, on specified heights (H = 30 mm, H = 60 mm and H = 110 mm). Precise horizontal movement control of the aspiration probe was ensured by a traverse mechanism. The radial probe range was 10 cm, with a spacing of 1 cm, while the inner radius of the combustion chamber was 15 cm. The radial measuring range was not reaching out of the burner axis position, in order to avoid any reheating of the flue gases which were aspired into the ceramic probe. The CO indications could be falsely lowered if there is a possibility of secondary CO oxidation in the hot probe, if the oxygen was also present.
Experimental variables for the tests are shown in Table 1, while the test rig and scheme for the distribution measurement heights are presented in Figure 2.
The values measured during the experimental tests were temperature and flue gas composition inside the combustion chamber (NO/NOx, CO, O2, CO2), wall temperature, and molar fraction of the pollutants in the chimney (NO/NOx, CO, O2, CO2).
The composition of the flue gases was measured with the set of NGA 2000 gas analyzers (Emerson Rosemount)—chemiluminescence cells for NO/NOx as a reference method for gas turbine conditions, infrared CO and CO2 sensors, and a paramagnetic method for the O2. For the ammonia slip, a Honeywell MultiRAE gas detector was used. The calibration gas concentration uncertainty was at ±2%, while the error range for the gas analyzers was estimated on 1% of the full scale. The mass flow rates of the NH3, CH4 and the air were controlled by Brooks Mass Flow controllers (SLA series), with an accuracy of 0.2% of the full scale.
The measurements for the each considered parameter were conducted simultaneously, data sets were collected using LabVIEW software and processed with a dedicated Python code. The data for each test point was averaged over the time of the measurements and filtered with a standard error of the mean (SEM) for small size samples (n = 30). The final values of SEM were below 0.91%, what could be considered as statistically reliable. The species and the temperature distribution curves were interpolated using cubic-spline estimation, based on the test points in order to show the probable position of the CO peak values.

2.2. Numerical Modelling

Simulations of the combustion process were conducted to describe the NO prediction possibilities for ammonia-doped methane combustion, with a specified recirculation ratio of the reacting mixture. The results were compared to the experimental outcome. The calculations were performed with a chemical reactor network approach (0D IdealGasReactor, Cantera [37]) and for a periodic slice of the combustor geometry (3D Fluent 2019 R3). The numerical study parameters are presented in the Table 2.

2.2.1. Reacting Flow Modelling

Calculations for the 3D burner geometry were conducted with Ansys Fluent software in order to perform a comparison between the reactor network modelling and the reacting mixture’s turbulent flow. The Species Transport Model and the Eddy Dissipation Concept were chosen. The nitrogen chemistry is considered relatively slow in a comparison to the time scale of hydrocarbon combustion, so a finite rate chemistry was introduced with a reduced mechanism. The swirl number for the applied swirling vanes SW30 and SW50 was 1.26 and 0.71 respectively (isothermal, non-viscous). A recirculation zone with Reynolds Stresses was modelled. However, the convergent–divergent type of the outflow nozzle used to increase the flame stability affected the base swirl number characteristics and a calculation of the actual swirl number was made to evaluate this change. A recalculated swirl number (Snr N) was defined as the flow rate of the tangential momentum overflow rate of the axial momentum, reported at the burner nozzle outflow’s surface. Additionally, values for the swirler vanes outflow (Snr S) and the nozzle throat (Snr T) were calculated and compared with theoretical values.
S n = G T A N G T A X
S nr = F L O W   R A T E ( r a d i a l   c o o r d i n a t e t a n g e n i a l   v e l o c i t y ) F L O W   R A T E ( r a d i a l   c o o r d i n a t e a x i a l   v e l o c i t y )
Inlet mass flow rates and compositions at each test point were calculated as for the reactor network and were corresponding with the experimental matrix points. The wall properties were changed according to the measured temperature values (Twall) and the surface emissivity. A solution was obtained with a coupled pressure-velocity solver with a pseudo-transient formulation, moreover the chemistry was calculated with a Chemkin-CFD solver, with an ISAT table with a decreasing tolerance up to 1 × 10⁻⁵.
The flow domain was modelled as a periodic 90° slice of the whole combustion chamber and burner geometry (2 vanes of 8). A hexahedral mesh was refined to meet the independency of the prediction of key species (NO, CO, O2, CO2) and the average value of the axial velocity. The final mesh was representing ¼ of total geometry with 0.5 mil elements, 0.88 and 0.81 for mean and average orthogonal qualities respectively.

2.2.2. Reactor Network Setup

The main aim of the numerical studies was to determine the influence of gas recirculation on the final pollution emission. NO was considered as the most important species. A combustion system based on the 0D IdealGasReactors from Cantera libraries was prepared. The reactor network starts with a premixed fuel–air reservoir (MIX) and ends with an outlet (OUT) reservoir. The total number of reactors was formulated as 3n + 1, where an inspected range of n was from 2 to 10. The final network consisted of 10 reactors (n = 3), because it was found purposeless to do any further scaling of the network. A scheme of the reactor network for the modelled recirculation zone was presented in Figure 3.
The presented concept is based on a simplification of the periodical movement in the swirl flow with recirculation. The initial volume of each reactor was specified as an equal element to the considered combustion chamber volume. The mixture mass flow was corresponding to the system volume with respect to the combustion chamber’s thermal load. The mass flow of the flammable mixture was calculated for a constant burner firing rate (15 kW or 30 kW).
The premixed mixture was introduced to R0 and channeled to forward reactors R1–Rn. The mass flow was divided in the Rm reactor and redirected into a recirculation loop, according to the recirculation mass flow ratio (MR) understood as the backward mass flow ( m ˙ R ) divided by the inlet mixture mass flow ( m ˙ M I X ) .
M R = m ˙ R m ˙ M I X
The flue gases were extracted from Rm to the post flame zone, which was represented by reactors from Rm to R3n. R3n was the end reactor, where the state of the reactor was collected. Significant importance was placed on the heat transfer issues inside the reactor network in order to avoid thermal NO formation, for cases where does not apply. Boundary conditions associated with hot walls were based on mean wall temperatures measured in the combustion chamber. Objects representing cold walls were defined using the flue gases temperature measurements—upstream and downstream of the cooling system respectively. Flexible walls were placed between outer and inner reactors, as they were responsible for heat flux in the recirculation zone and for the reactor expansion in a function of thermo properties of gas. The ratio between the volumes of initial combustor volume and final reactor summary was an indicator of reshaping of the reaction zone, in comparison to the simple jet flame modelled as CSRs, where MR = 0. The reaction pathways were tracked and presented on diagrams with normalized sensitivity coefficients, a 0.01 threshold.

2.2.3. Kinetic Reaction Mechanisms

A selection of suitable kinetic reaction mechanisms, which are in respect to CH4/NH3 oxidation/reduction pathways was based on the literature overview, a calculation stability study, and previous research of methane–air axis symmetric burner flames with ammonia addition [20]. An extended set of mechanisms was used in the reactor network’s numerical calculations, such as Creck [38], Xiao [8], and Li [39] mechanism with a set of reduced mechanisms (Table 3). The 3D calculations were carried out with Xiao, because it has been validated experimentally and numerically for the swirl flame [40].

3. Results and Discussion

3.1. Experimental Tests

3.1.1. Flame Stability

The flame stability range for the SW30 burner with a nozzle covered the slightly rich mixtures and the equivalence ratio of 0.62 for both of the applied firing rates (15 kW and 30 kW). The 50SW burner was characterized only by a lean stability range, which started from φ = 0.83 and has its limit at φ = 0.56. The presented ranges are wider than the stability limits obtained for the outflow nozzle with a constant diameter (φ = 0.48–0.70) investigated by Khateeb et al. [34]. The equivalence ratio of 0.71 was chosen as a midpoint of both of the swirling stability limits.

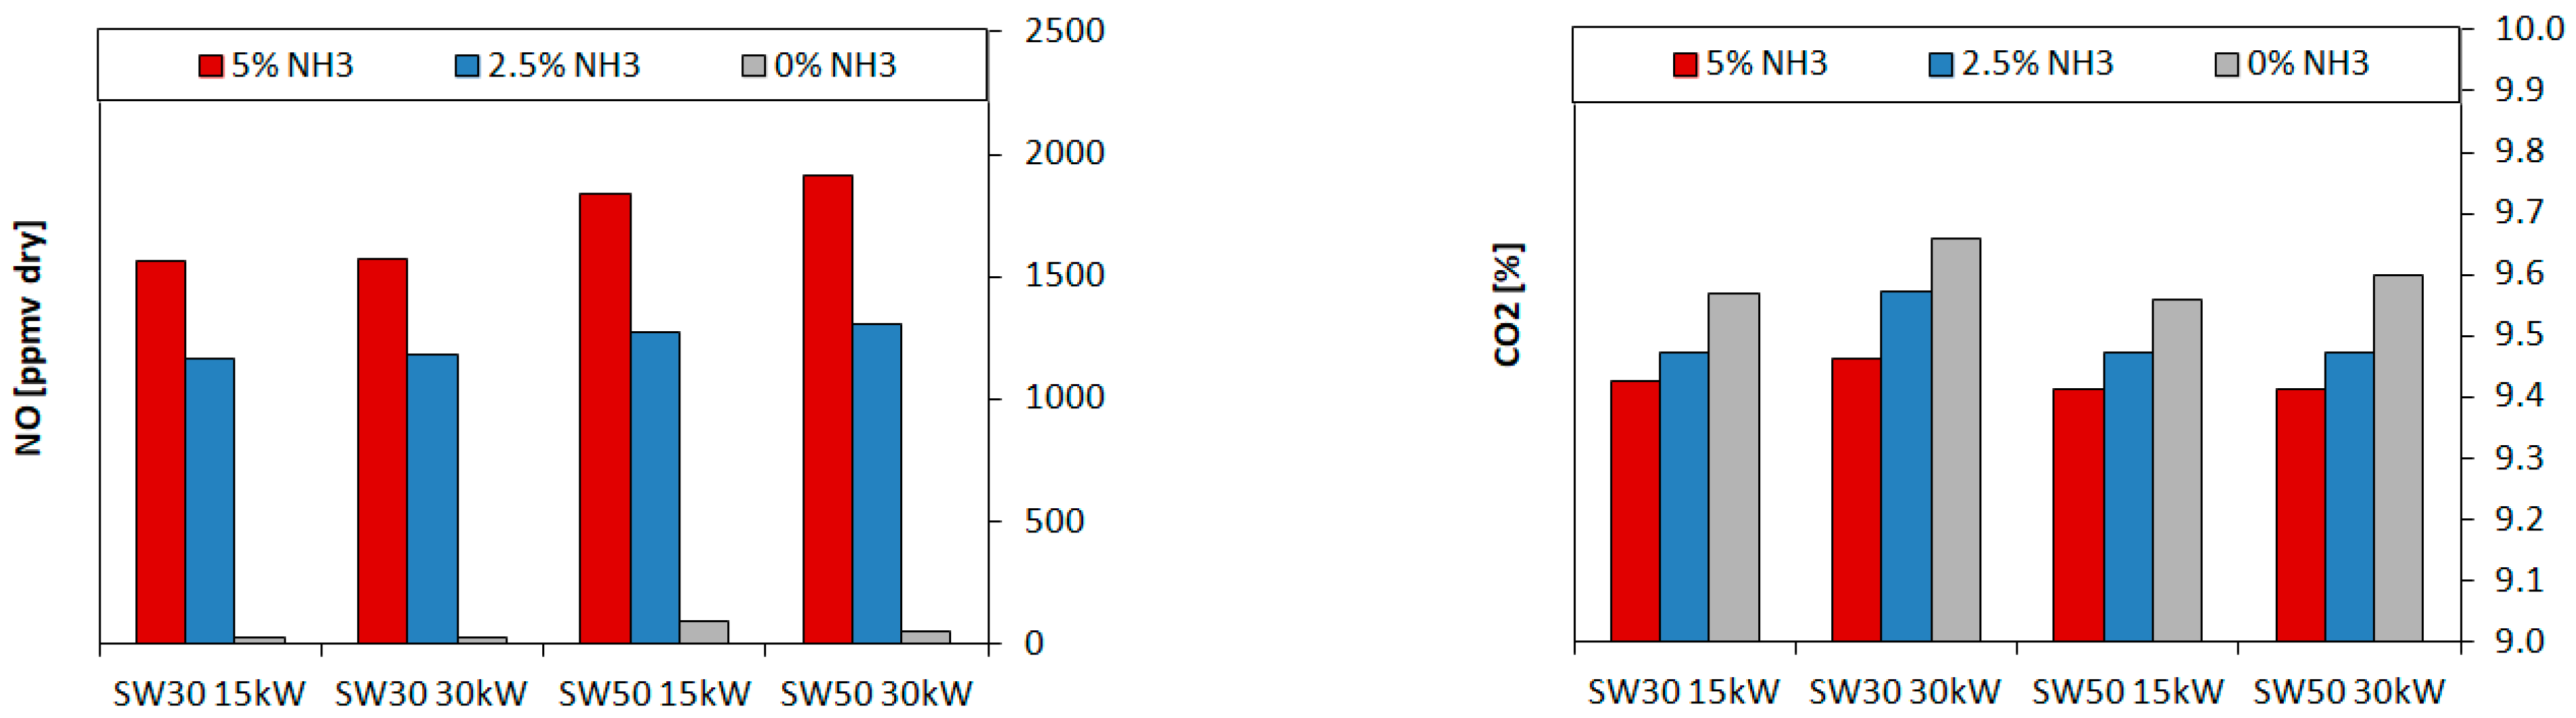
3.1.2. Overall Concentration

The highest values of the NO emission were collected for 5% NH3 and SW50 (1950 ppmv). Trend lines were not proportional to the raising share of the fuel ammonia, especially when they were compared to the emission values for 2.5% of NH3 (1320 ppmv). There was a significant change of the NO share at the outlet for the different swirling vanes, although the increase of the firing rates from 15 kW up to 30 kW did not have a great influence on the overall emission (Figure 4).
The SW50 burner indicated higher NO shares in the flue gases for both 15 kW and 30 kW-1877 and 1950 ppmv, respectively. The results were slightly higher than the corresponding values for an axisymmetric burner with the same ammonia share and equivalence ratio (1773 ppmv) [20]. The lowest emissions were achieved for 30SW 15 kW-1585 ppmv. However, it was comparable to the NO share for the doubled power in the fuel (30 kW), equal to 1612 ppmv.
It is worth mentioning that the CO emission at the chimney was extremely low for all the considered test points and did not exceeded 4 ppmv. A similar influence of the NH3 addition on the CO concentration was reported by Xiao [13]. The addition of carbonless fuel has a positive effect on the greenhouse gases emission—5% ammonia decreased the CO2 share by 0.2%. There is a need to further increase the ammonia contribution to achieve a significant reduction of the CO2 emissions, although the outcome NO emission level exceeded the acceptable range for most of industrial applications and should be reduced with NOx mitigation techniques. Such magnitude of NO share necessitates the use of primary emission reduction methods as the first step. One of the most promising solutions for ammonia co-combustion are rich-lean combustors where the first-stage rich flame is stabilized with a swirl flow and recirculation zones. An increase in NH3 fuel share leads to residual ammonia presence, which reacts as a reducing agent in the stages following, which was confirmed by Okafor et al. [41]. However, the above-mentioned control of the reacting flow requires complex burner and combustor geometry, which could be proposed and tested with a combination of experimental and numerical design methods. Flue gases aftertreatment could be used as supplementation, if there is a need to fulfill strict limits of industrial emission directives.

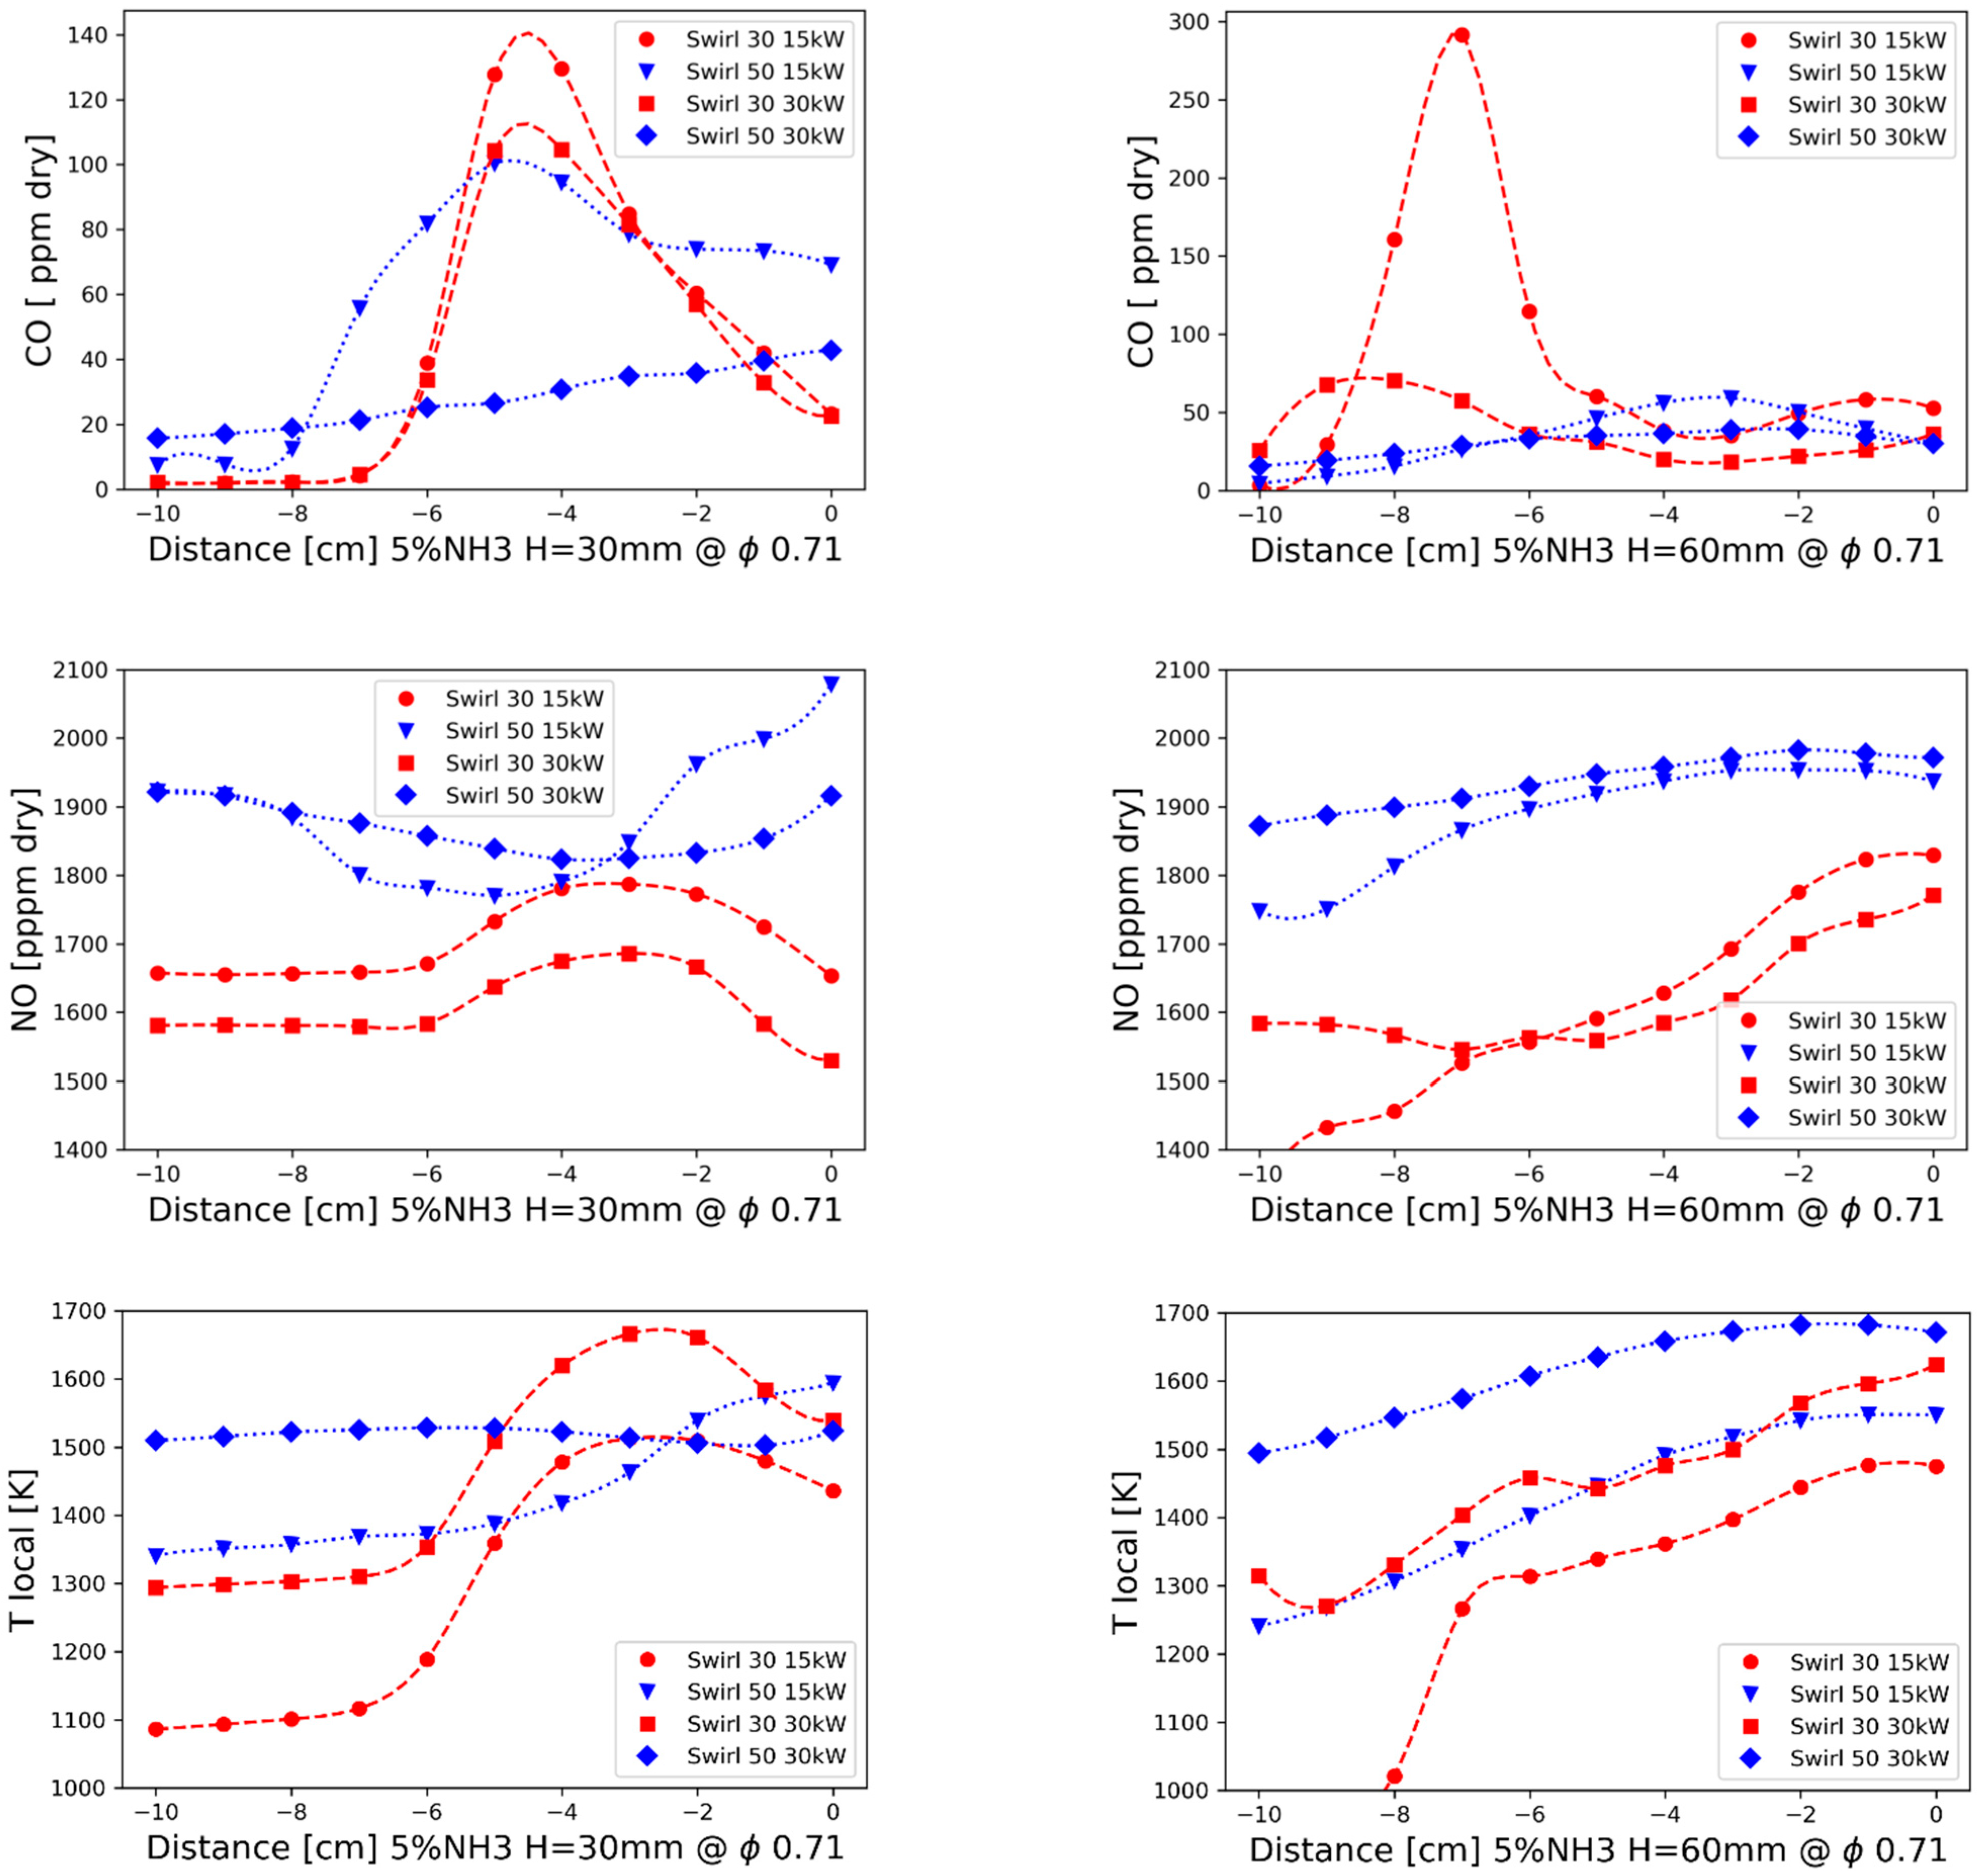
3.1.3. Distribution Measurements

Local measurements were carried out with an aspiration probe and a traverse system for the equivalence ratio 0.71. The profiles for the swirl flame probing are characterized by a great variation of the O2 concentration. Therefore, the distribution of CO and NO along the combustor radius was presented as for the local O2 share (Figure 5). Species concentrations were provided as for the local conditions. The data points were interpolated with spline curves to show probable profiles of monitored parameters.
A CO peak value is considered as one of the indicators of the probable flame position, therefore the size of the central recirculation zone was estimated with the radial position of the local CO peak. The maximum value of the CO concentration for the axial position H = 30 mm was located around a point −5 cm for SW30, independently of the burner thermal load. The location was corresponding to a significant rise of temperature and NO share. Complementary results without the addition of ammonia showed that the peak position is retained, but the CO concentrations are much higher for pure methane fuel than for ammonia-doped fuel. The central recirculation zone for 30SW 15 kW had a diameter of approximately 12 cm, which was based on the local CO measurements. The recirculation zone expanded with an increase of the burner power and reached the diameter of 18 cm. The location of the reaction front could also be detected with OH-PLIF imaging, next to NO-PLIF, as in [31]. However, the results scaled with fluorescence intensity rather than absolute concentration shares.
There were no significant CO peaks for SW50 30 kW. Furthermore, the observed flame was aligned with the bottom surface of the combustion chamber, the so-called wall jet regime. The flame structure could be linked to the diverging cup effect for angles greater than 30°, presented by Degeneve et al. [36]. The distribution profiles (NO, CO, Tlocal) were flattened, however slightly higher values for the monitored parameters were centered around the burner axis. A large zone of the internal recirculation could be expected with an intensive interaction between the flame and the walls. A quasi-uniform temperature profile fitted in a temperature window (up to 1373 K) could prove a favorable solution for the ammonia combustion. SW50 was outside this range, followed by a high NO concentration. However, a significant NO reduction could be achieved using highly diluted combustion of ammonia doped fuels. The addition of 5% of NH3 into the methane resulted in an emission of NO as low as 113 ppmv for an industrial furnace with a regenerative burner, which operated on highly preheated air [42].
A ratio of NOx/NO was not exceeding 1.07 even for the local measurements (2.5% NH3, SW30 15 kW NO = 1245 ppmv, T = 1478 K, radial position −1). Measurements of the NH3 concentration in the flue gases indicated that slip could be neglected. The measured value does not exceed a few ppmv of NH3.

3.2. Numerical Modelling

The numerical modelling of the presented swirl flames was carried out and compared to the experimental outcome in order to evaluate the NO prediction possibilities from ammonia-doped methane combustion, with a specified recirculation ratio of the reacting products. A chemical reactor network was proposed, which takes into account the effect of the flue gases’ backflow. There was no possibility to approximate the residence time and the recirculation ratio for the complex geometry of a swirl burner with a stabilizing nozzle, therefore reacting flow calculations were made.
The temperature contour and the streamline location (Figure 6) showed that the CTRZ was present for all the cases, although SW30 characteristics were also affected by outer recirculation zones (ORZ). The combustion process for SW50 15 kW took place in the boundary layer, close to the combustor dump plane, while the SW50 30 kW flame was lifted and shifted alongside the axis downstream.
An isothermal swirl number was reported on the swirler’s outflow surface (Snr ISO) which matched the theoretical values—1.26 for 30° and 0.61 for 50°, respectively. There was a slight increase of Sn with the introduction of a reacting flow. The converging nozzle throat centered all of the swirl values around 0.66. The nozzle magnified local velocities up to 80 m/s (SW30 30 kW), while the average volume velocity did not exceed 3.25 m/s. The diverging nozzle on the burner outflow (35°) resulted in a further decrease of the swirl number, so a highly swirling flow was observed for SW50 (Sn > 0.5) and a weak/moderate one for SW30 (Sn < 0.5). A significant rise of the static pressure near the swirler outflow was present for SW30, therefore a degradation of swirling characteristics was connected with the unfavorable geometry of nozzle—the swirling jet was impinging onto a nozzle surface.
The total residence time (τ) was calculated with average values of particles residence time (>600 seed points). The shortest time was 0.506 s for SW50 30 kW, and the longest was 1.42 s for SW30 15 kW, as the inlet mass flow was reduced (Table 4). The mass of the recirculating flow was defined as an area-averaged mass flow through iso-surface of negative axial velocity. MR was calculated according to (3) with a mean value of 0.43.

3.2.1. Concentration Profiles

The distribution measurements were based on 50 seed points for each data series and were able to capture the impact of the swirling jet on the species concentration and local temperature profiles. The CO peak locations were complimentary with the profiles investigated experimentally, although absolute values were several times higher. The number of experimental test points around the peak values could be refined, however the achieved qualitative agreement for peak positions was sufficient to localize the CTRZ. Comparison of the local species concentration for different swirlers and thermal load is presented in the Figure 7 while in the Figure 8 temperature profiles are presented.
Local concentrations of NO were corresponding to the temperature profiles. Different flame shapes were observed for SW30 and SW50 burners respectively. The volume of CTRZ for SW50 was limited by hot combustor walls, and that had its effect on the temperature peaks next to the walls. Significant NO formation occurred for SW50 30 kW in the ORZ. A similar effect was visible for experiments with NO-PLIF imaging in [41]. The temperature profiles inside the CTRZ were flat and lower than the experimental ones by 50 K each, but it was enough to intensify the reduction ratio of NO for SW50 15 kW due to the low local temperatures (<1373 K). The lack of the ORZ and lower temperatures resulted in a great divergence of the local NO concentration for the calculated emission values—1641 ppmv and 2318 ppmv, for 15 kW and 30 KW respectively. Boundary conditions (BC) connected with the heat exchange process need to be carefully defined in order to get a high accuracy of the NO predictions, which was in accordance to observations in [16,41].
The backflow created by the SW30 burner was divided and formed the CTRZ and ORZ. The highest NO shares for SW30 were bound with the CTRZ as well as the temperature peak locations, with their maximum around 1760 K. The computed temperature values near to the radial position −3 cm were only slightly lower for 15 kW than for 30 kW, while a difference of 150 K was reported during the experiments. More accurate results were obtained for the ORZ—flattened temperature profiles alongside the radius from −10 cm to −7 cm were in accordance with the measurements. The ORZ was characterized by a decreased NO concentration compared to the CTRZ shares, which applied also to the local temperatures. The heat losses through combustor walls lowered the flow temperature down to around 1100 K and 1300 K, for 15 kW and 30 kW, respectively. However, a further decrease of the temperature due to the wall cooling effect could cause a possible swirl flame destabilization, which was pointed out by Di Sarli et al. [30] and needs to be taken into account.

3.2.2. Overall Emission

The comparison of the experimental and numerical NO emissions (3D) at the outlet for the different swirlers and firing rates was carried out and presented in Figure 9. Additionally, preliminary reactor network (RN) results with the same mechanism (Xiao) were presented.
A general over-estimation of the NO concentration was observed for 3D numerical tests with NO shares up to 2319 ppmv and was visible for the simulated concentration profiles. Relatively low emissions were visible for 3D modelling in case SW50 15 kW- the calculated flow temperatures were lower than the measured values and an intensified reduction took place in a favorable temperature window below 1373 K, which could be a result of the adiabatic BC of the combustor dump plane and a decrease of the ORZ influence on the NO formation. Reactor network results were also higher than the experimental values, so greater NO emissions could be tied to the use of a reduced mechanism.
The main CFD investigated parameters which have a potential to influence the NO concentration for the presented research were wall thermal conditions (Twall), residence time (τ), backflow recirculation ratio (MR) and the kinetic reaction mechanism used. The local NO absolute values were overestimated, regardless of the accuracy of the local temperature prediction, which could be connected to the chosen reduced mechanism and needs to be evaluated. However, a number of species for non-reduced mechanisms multiply the calculation time by a significant factor. Therefore, a kinetic study with a reactor network was carried out to verify the relations between the identified parameters and the outlet NO emission.
A kinetic study with a variable recirculation ratio and residence time was performed with the reactor network (Figure 10 and Figure 11). A comparison of the combustion process and its emission was held for two swirl burners characterized by mean residence time (τRN m) and averaged recirculation ratio (MRave). Mean values of MR were 0.468 and 0.394 for SW50 and SW30, respectively.
All tested mechanisms showed the influence of the rising ammonia share on NO emissions. SanDiego, Creck and GRI-Mech3.0 under-estimated the emission values. Li (54) and Xiao showed good qualitative accuracy and reliability but over-estimated the NO concentration. The lowest relative differences compared to the experimental values were observed for Li (128) and (74). Based on that, a detailed version of Li (128) mechanism was chosen for further calculations with the reactor network. The analysis of the numerical modelling showed that the most important grid point of the reactor network was the R0 reactor. The R0 reactor was the place where a fresh flammable mixture was supplemented to the reactor network, as well as the mixing point of flue gases when recirculation was present. The mean combustion chamber wall temperature obtained from the experimental tests was used to define the wall temperature of the hot section reactors (Thot wall). A comparison of the combustion process with and without recirculation is presented in Table 5.
The outcome reactor temperature matched the mean value of experimental flame measurements. CO level from 648 ppmv up to 860 ppmv was present in R0, and fully oxidized in the subsequent reactors from R1 to R3 which corresponds to the local measurement peak values. The total of NO2 and N2O in the reaction products was lower than 1.9%. The share of NO reached maximum value for R0 and was only slightly lowered with the progress of the cooling process. It was observed that the mass flow recirculation ratio and the residence time affect nitrogen kinetics. Recirculation of flue gases lowered the process temperature by 50 K and resulted in a difference of 160 ppmv NO.
A greater outlet emission was observed for SW50, both for the experiments and the simulations. The residence time of SW50 was shorter than for SW30, which decreased the cooling effect of the walls on the reacting mixture, despite a greater ratio of the flow recirculation (0.468 and 0.394). Some difficulties with an exact matching of presented results need to be discussed. There was a noticeable divergence between the experimental outcome and the simulations, connected mainly with the models, assumptions and simplifications used. Some values for selected parameters (MR and τ) were calculated with 3D modeling and propagated those errors to the dimensionless modeling as well. In spite of the above-mentioned reservations, the reactor network could prove a useful and time-saving method to point out the relations between the investigated parameters and to evaluate the prediction mechanism possibilities for the selected conditions.
The reaction pathways involving nitrogen chemistry were considered to evaluate the influence of the recirculation zone and the residence time on the addition of ammonia to the combustion process. The diagram for reactor R0, and the 5% share of NH3 in the fuel is considered as reference (Figure 12).
Reaction rates, alongside with products composition, confirmed that most part of ammonia oxidation and reduction takes place in the initial reactor. Normalized reaction rates showed that ammonia reacts with OH radicals, decomposes to NH2 and further to NH or HNO. In the presence of OH radicals the process continues to form NO through HNO or N radicals as intermediate species. Forward reaction from HNO to NO through OH is considered as the most important, but also significant backward rates are present through H and third body reactions. Formation of NO2 from NO through nitrous acid is worth mentioning as well. However, most of the nitrogen dioxide is reacting with H radical in a backward loop to NO. Minor NO pathways are connected with prompt cyanides and cyanate formation, which are, in total, below ppmv levels in overall reaction products. The reduction of ammonia to N2 happens mainly through reactions with NO and NH2 or intermediate N2O mechanisms and NNH. Oxidation of N radicals with O2 or OH to NO states 11% of net NO formation.
A preferable way to lower the NO emissions could be to increase the specified production rates while controlling the local conditions. A normalized sensitivity diagram for R0 reactor is presented in Figure 13, in order to evaluate the possibilities for presented case.
Negative sensitivity coefficient reactions could be used in further combustion system designs in order to reduce overall NO emissions. An increase in N2O and NNH production rates could be helpful for following the reduction to N2 of the intermediate mechanism of NOx control, useful for gas turbine conditions. A change of the process parameters could be applied to limit the rates of chain branching reactions like OH and O outside of NH3 decomposition zone for lean conditions. It is worth mentioning that for processes held with different equivalence ratios, e.g., ammonia stage combustion, OH radicals are introduced intentionally by an injection of a steam in order to improve fuel ammonia decomposition and NO reduction rates [33].

4. Conclusions

The research was focused on the influence of ammonia addition on the emission characteristics of premixed methane–air swirl flames. SW30 and SW50 burners were tested. Experimental and numerical tests were conducted for lean methane flames (φ = 0.71) with an addition of 2.5% and 5% of NH3 in the fuel. Overall emission values and local parameters distribution were measured. Complimentary CFD modelling of reacting flow was carried out. Moreover, the influence of gas recirculation ratio, residence time and wall temperature on final pollutant emissions was investigated with selected chemical reaction mechanisms and reactor network. The combination of presented experimental and numerical methods will be further adjusted and used to examine synthetic fuels co-combustion process in the swirl flame with an increased ammonia share. The number of wall temperature measurement points should be increased. A summary of major findings in this study is given below.
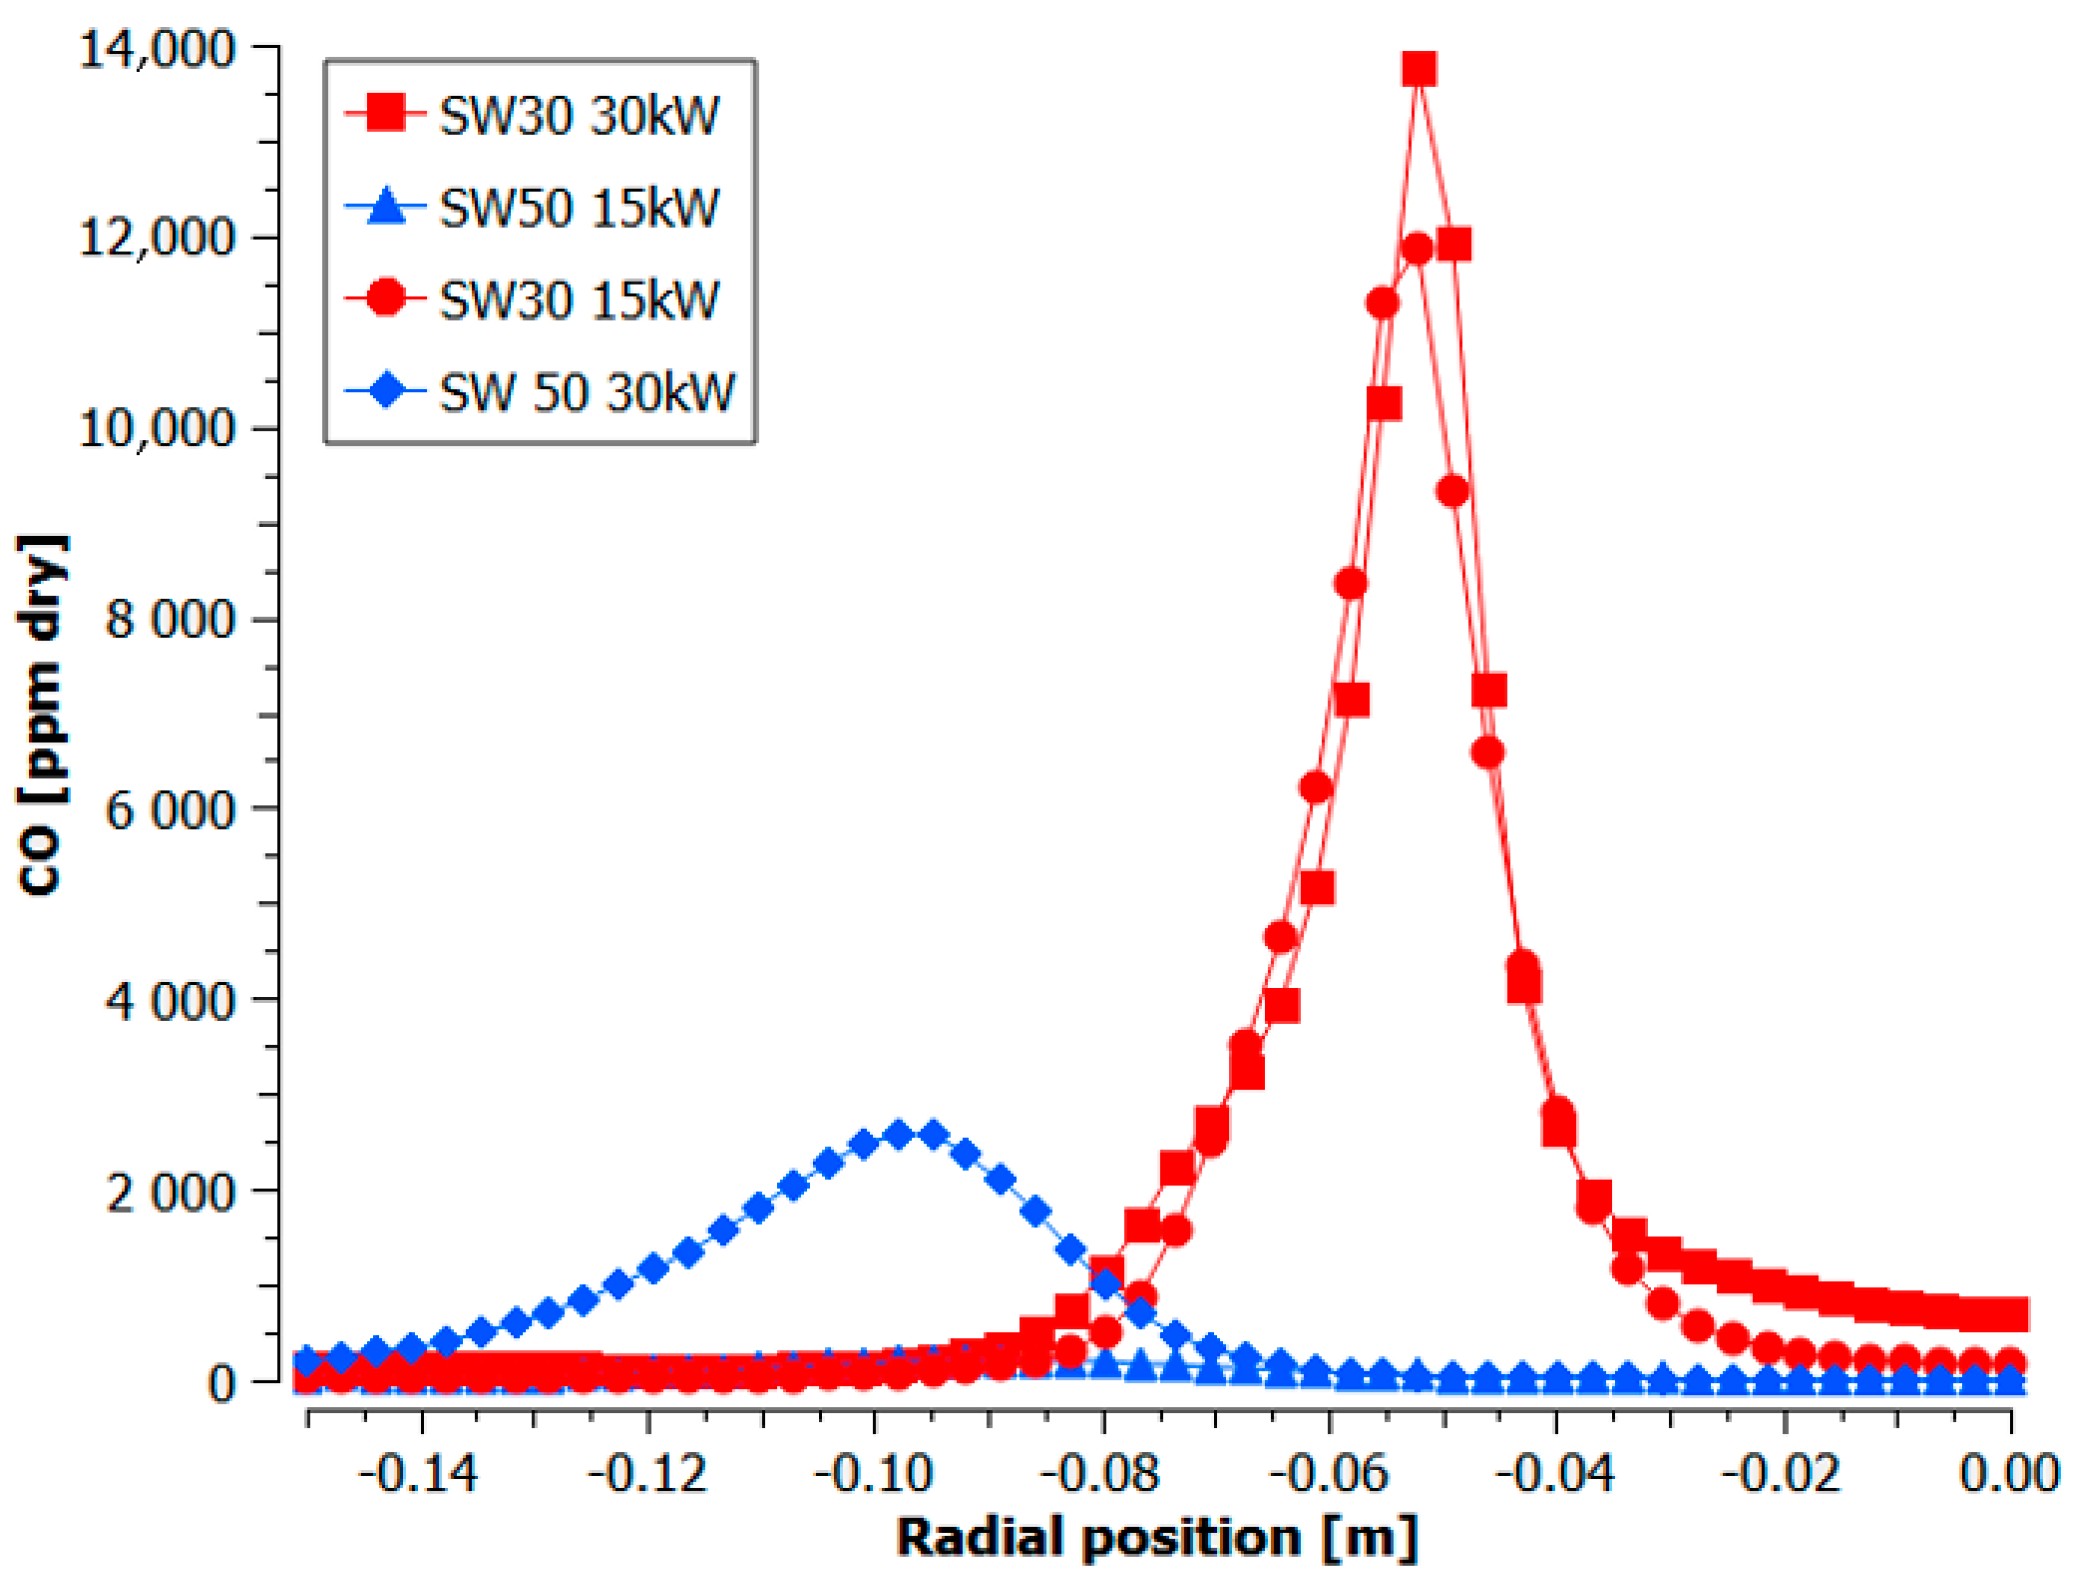
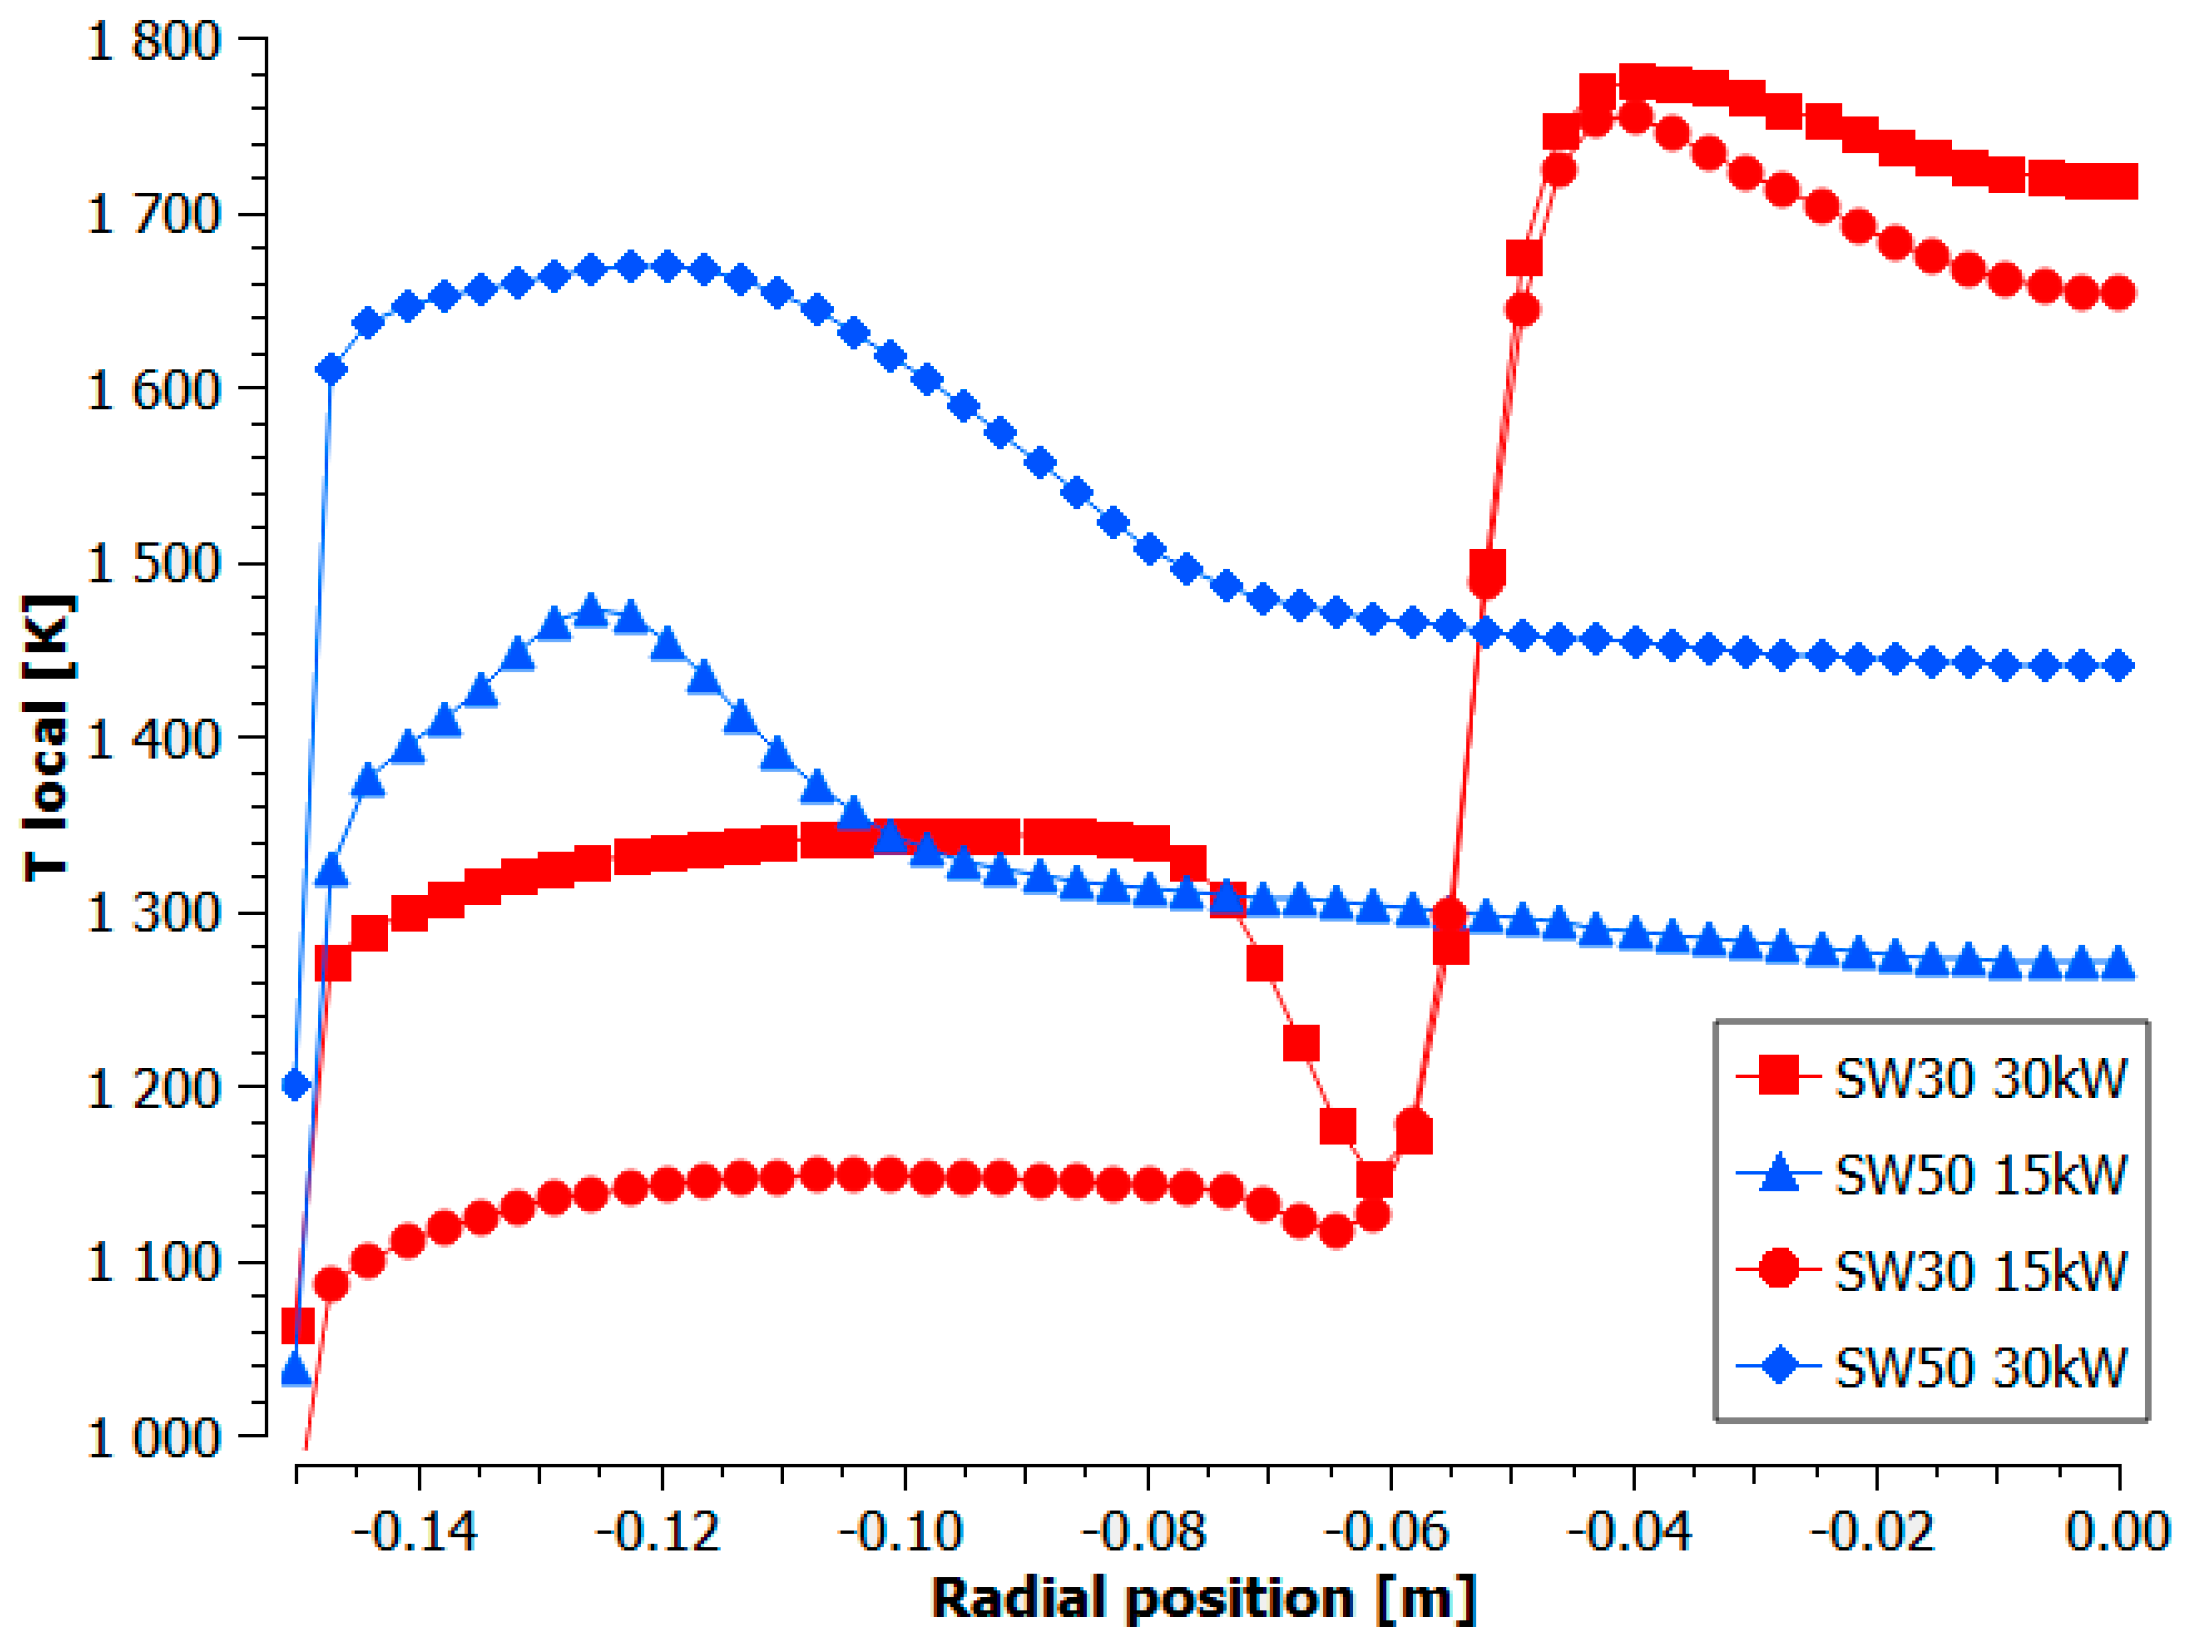
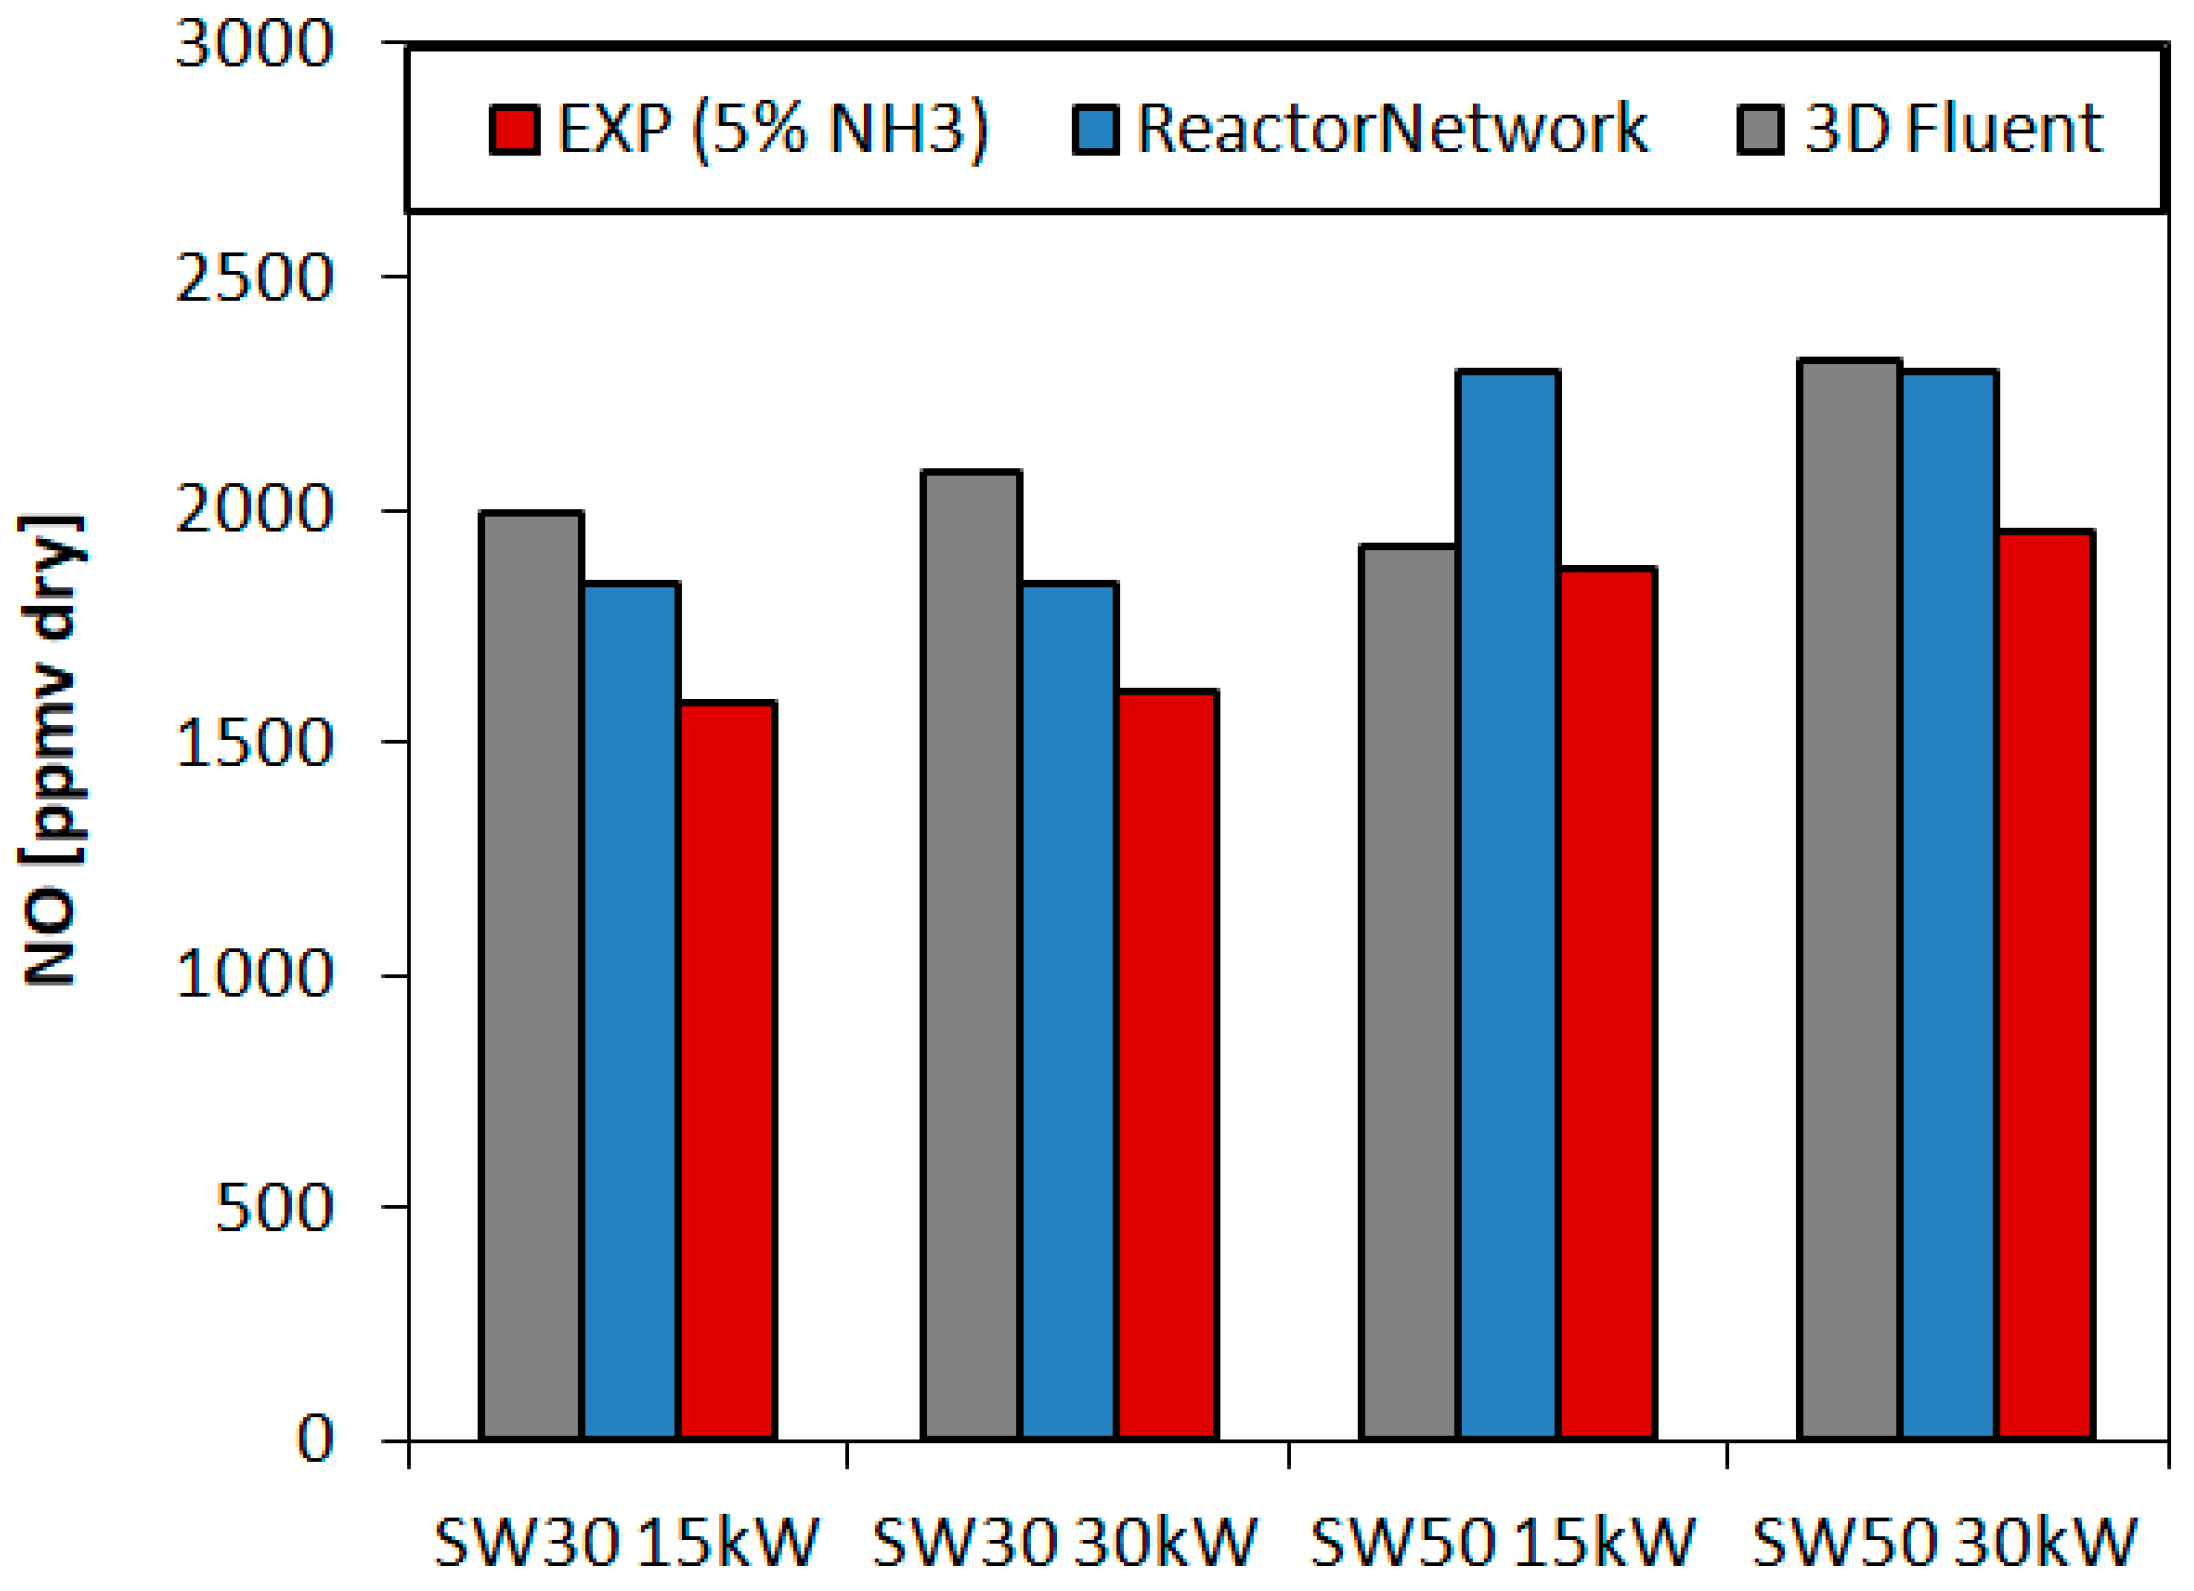
  • The lowest experimental emissions for 5% NH3 were achieved for burner 30SW (1585 ppmv) and it was comparable to the NO share for the doubled power in the fuel. The diameter of central recirculation zone for 30SW was 12 cm for the local CO measurements and the simulation outcome. The CTRZ location was corresponding to a significant rise in temperature and NO share. The presence of ORZ extended the residence time and lowered the local temperatures in the near-wall region due to heat losses, which decreased the resulting NO concentration
  • The highest values of the experimental NO emissions were collected for 5% NH3 and SW50 (1950 ppmv), both for the experiments and the simulations. SW50 was characterized by an expanded internal recirculation zone, bounded to the combustor walls. Short residence time and high local temperatures near the walls increased the amount of formed NO, despite a greater ratio of the flow recirculation than that of SW30 (0.468 and 0.394).
  • Boundary conditions connected with the heat exchange process need to be carefully defined in order to achieve a high accuracy of the NO predictions—both for 3D simulations and simplified reactor-based models.
  • The presented reactor network has proven itself a useful and time-efficient method to investigate the influence of recirculation on NO emissions and to evaluate the mechanism’s prediction possibilities for the selected conditions. However, its stand-alone reliability is limited, so an input data set needs to be supplemented with a complimentary 3D modeling outcome.

Author Contributions

Conceptualization, J.J. and R.Ś.; methodology, J.J.; numerical methodology and calculation, J.J.; investigation, J.J. and R.Ś.; writing—original draft preparation, J.J.; writing—review and editing, J.J. and R.Ś.; supervision, R.Ś.; All authors have read and agreed to the published version of the manuscript.

Funding

This work was supported by the National Science Centre, Poland (2018/29/N/ST8/01671), under research project “Experimental and numerical investigation on oxidation and reduction process of fuel-bound nitrogen species in swirl flame”.

Institutional Review Board Statement

Not applicable.

Informed Consent Statement

Not applicable.

Data Availability Statement

Not applicable.

Conflicts of Interest

The authors declare no conflict of interest.

Nomenclature

CSRcontinuously stirred reactor
CTRZcentral recirculation zone
FGRflue gas recirculation
LESlarge eddy simulation
MFCmass flow controller
MRrecirculation mass flow ratio
ORZouter recirculation zones
SNCRSelective Non-Catalytic Reduction
VFDvariable frequency drive
BCboundary condition

References

  1. Czyzewski, P.; Slefarski, R.; Jojka, J.; Jankowski, R. Experimental and numerical calculations of two stage combustion process of syngas fuels with high content of ammonia. In Proceedings of the 25th European Biomass Conference and Exhibition, Stockholm, Sweden, 12–15 June 2017; Volume 2017. [Google Scholar] [CrossRef]
  2. Szewczyk, D.; Jankowski, R.; Ślefarski, R.; Chmielewski, J. Experimental study of the combustion process of gaseous fuels containing nitrogen compounds with the use of new, low-emission Zonal Volumetric Combustion technology. Energy 2015, 92, 3–12. [Google Scholar] [CrossRef]
  3. Szewczyk, D.; Ślefarski, R.; Jankowski, R. Analysis of the combustion process of syngas fuels containing high hydrocarbons and nitrogen compounds in Zonal Volumetric Combustion technology. Energy 2017, 121, 716–725. [Google Scholar] [CrossRef]
  4. Chiaramonti, D.; Marsh, R.; Runyon, J.; Pugh, D.; Beasley, P.; Hughes, T.; Bowen, P. Ammonia–methane combustion in tangential swirl burners for gas turbine power generation. Appl. Energy 2017, 185, 1362–1371. [Google Scholar] [CrossRef] [Green Version]
  5. Kurata, O.; Iki, N.; Matsunuma, T.; Inoue, T.; Tsujimura, T.; Furutani, H.; Kobayashi, H.; Hayakawa, A. Performances and emission characteristics of NH3–air and NH3CH4–air combustion gas-turbine power generations. Proc. Combust. Inst. 2017, 36, 3351–3359. [Google Scholar] [CrossRef]
  6. Vigueras-Zuniga, M.; Tejeda-Del-Cueto, M.-E.; Vasquez-Santacruz, J.-A.; Herrera-May, A.L.; Valera-Medina, A. Numerical Predictions of a Swirl Combustor Using Complex Chemistry Fueled with Ammonia/Hydrogen Blends. Energies 2020, 13, 288. [Google Scholar] [CrossRef] [Green Version]
  7. Mathieu, O.; Petersen, E.L. Experimental and modeling study on the high-temperature oxidation of Ammonia and related NOx chemistry. Combust. Flame 2015, 162, 554–570. [Google Scholar] [CrossRef] [Green Version]
  8. Xiao, H.; Howard, M.; Valera-Medina, A.; Dooley, S.; Bowen, P.J. Study on Reduced Chemical Mechanisms of Ammonia/Methane Combustion under Gas Turbine Conditions. Energy Fuels 2016, 30, 8701–8710. [Google Scholar] [CrossRef]
  9. Valera-Medina, A.; Gutesa, M.; Xiao, H.; Pugh, D.; Giles, A.; Goktepe, B.; Marsh, R.; Bowen, P. Premixed ammonia/hydrogen swirl combustion under rich fuel conditions for gas turbines operation. Int. J. Hydrogen Energy 2019, 44, 8615–8626. [Google Scholar] [CrossRef]
  10. Ichikawa, A.; Hayakawa, A.; Kitagawa, Y.; Somarathne, K.K.A.; Kudo, T.; Kobayashi, H. Laminar burning velocity and Markstein length of ammonia/hydrogen/air premixed flames at elevated pressures. Int. J. Hydrogen Energy 2015, 40, 9570–9578. [Google Scholar] [CrossRef] [Green Version]
  11. Da Rocha, R.C.; Costa, M.; Bai, X.-S. Chemical kinetic modelling of ammonia/hydrogen/air ignition, premixed flame propagation and NO emission. Fuel 2019, 246, 24–33. [Google Scholar] [CrossRef]
  12. Valera-Medina, A.; Xiao, H.; Owen-Jones, M.; David, W.; Bowen, P. Ammonia for power. Prog. Energy Combust. Sci. 2018, 69, 63–102. [Google Scholar] [CrossRef]
  13. Xiao, H.; Chiaramonti, D.; Bowen, P.J. Study on premixed combustion characteristics of co-firing ammonia/methane fuels. Energy 2017, 140, 125–135. [Google Scholar] [CrossRef]
  14. Henshaw, P.F.; D’Andrea, T.; Mann, K.R.C.; Ting, D.S.-K. Premixed ammonia-methane-air combustion. Combust. Sci. Technol. 2005, 177, 2151–2170. [Google Scholar] [CrossRef]
  15. Okafor, E.C.; Naito, Y.; Colson, S.; Ichikawa, A.; Kudo, T.; Hayakawa, A.; Kobayashi, H. Experimental and numerical study of the laminar burning velocity of CH4–NH3–air premixed flames. Combust. Flame 2018, 187, 185–198. [Google Scholar] [CrossRef]
  16. Honzawa, T.; Kai, R.; Okada, A.; Valera-Medina, A.; Bowen, P.J.; Kurose, R. Predictions of NO and CO emissions in ammonia/methane/air combustion by LES using a non-adiabatic flamelet generated manifold. Energy 2019, 186, 115771. [Google Scholar] [CrossRef]
  17. Li, J.; Huang, H.; Kobayashi, N.; He, Z.; Osaka, Y.; Zeng, T. Numerical study on effect of oxygen content in combustion air on ammonia combustion. Energy 2015, 93, 2053–2068. [Google Scholar] [CrossRef]
  18. Xiao, H.; Wang, Z.; Chiaramonti, D.; Bowen, P.J. Study on Characteristics of Co-firing Ammonia/Methane Fuels under Oxygen Enriched Combustion Conditions. J. Therm. Sci. 2018, 27, 270–276. [Google Scholar] [CrossRef]
  19. Di Sarli, V.; Cammarota, F.; Salzano, E.; Di Benedetto, A. Explosion behavior of ammonia and ammonia/methane in oxygen-enriched air. Process. Saf. Prog. 2017, 36, 368–371. [Google Scholar] [CrossRef]
  20. Jójka, J.; Ślefarski, R. Dimensionally reduced modeling of nitric oxide formation for premixed methane-air flames with ammonia content. Fuel 2018, 217, 98–105. [Google Scholar] [CrossRef]
  21. Kobayashi, H.; Hayakawa, A.; Somarathne, K.D.K.A.; Okafor, E.C. Science and technology of ammonia combustion. Proc. Combust. Inst. 2019, 37, 109–133. [Google Scholar] [CrossRef]
  22. Skreiberg, Ø.; Kilpinen, P.; Glarborg, P. Ammonia chemistry below 1400 K under fuel-rich conditions in a flow reactor. Combust. Flame 2004, 136, 501–518. [Google Scholar] [CrossRef]
  23. Klippenstein, S.J.; Harding, L.B.; Glarborg, P.; Miller, J.A. The role of NNH in NO formation and control. Combust. Flame 2011, 158, 774–789. [Google Scholar] [CrossRef] [Green Version]
  24. Sullivan, N.; Jensen, A.; Glarborg, P.; Day, M.S.; Grcar, J.F.; Bell, J.B.; Pope, C.J. Ammonia Conversion and NO x Formation in Laminar Coflowing Nonpremixed Methane-Air Flames. Combust. Flame 2002, 131, 285–298. [Google Scholar] [CrossRef] [Green Version]
  25. Song, Y.; Hashemi, H.; Christensen, J.M.; Zou, C.; Marshall, P.; Glarborg, P. Ammonia oxidation at high pressure and intermediate temperatures. Fuel 2016, 181, 358–365. [Google Scholar] [CrossRef] [Green Version]
  26. Konnov, A.A.; De Ruyck, J. Kinetic Modeling of the Thermal Decomposition of Ammonia. Combust. Sci. Technol. 2000, 152, 23–37. [Google Scholar] [CrossRef]
  27. Konnov, A.A. Implementation of the NCN pathway of prompt-NO formation in the detailed reaction mechanism. Combust. Flame 2009, 156, 2093–2105. [Google Scholar] [CrossRef]
  28. Li, B.; He, Y.; Li, Z.; Konnov, A.A. Measurements of NO concentration in NH3-doped CH4+air flames using saturated laser-induced fluorescence and probe sampling. Combust. Flame 2013, 160, 40–46. [Google Scholar] [CrossRef]
  29. Mendiara, T.; Glarborg, P. Ammonia chemistry in oxy-fuel combustion of methane. Combust. Flame 2009, 156, 1937–1949. [Google Scholar] [CrossRef]
  30. Di Sarli, V.; Marra, F.S.; Di Benedetto, A. Spontaneous oscillations in lean premixed combustors: Cfd simulation. Combust. Sci. Technol. 2007, 179, 2335–2359. [Google Scholar] [CrossRef]
  31. Somarathne, K.D.K.A.; Okafor, E.C.; Hayakawa, A.; Kudo, T.; Kurata, O.; Iki, N.; Kobayashi, H. Emission characteristics of turbulent non-premixed ammonia/air and methane/air swirl flames through a rich-lean combustor under various wall thermal boundary conditions at high pressure. Combust. Flame 2019, 210, 247–261. [Google Scholar] [CrossRef]
  32. Xiao, H.; Howard, M.; Valera-Medina, A.; Dooley, S.; Bowen, P. Reduced Chemical Mechanisms for Ammonia/Methane Co-firing for Gas Turbine Applications. Energy Procedia 2017, 105, 1483–1488. [Google Scholar] [CrossRef]
  33. Pugh, D.; Bowen, P.; Valera-Medina, A.; Giles, A.; Runyon, J.; Marsh, R. Influence of steam addition and elevated ambient conditions on NOx reduction in a staged premixed swirling NH3/H2 flame. Proc. Combust. Inst. 2019, 37, 5401–5409. [Google Scholar] [CrossRef]
  34. Khateeb, A.A.; Guiberti, T.F.; Zhu, X.; Younes, M.; Jamal, A.; Roberts, W.L. Stability limits and exhaust NO performances of ammonia-methane-air swirl flames. Exp. Therm. Fluid Sci. 2020, 114, 110058. [Google Scholar] [CrossRef]
  35. Baej, H.; Syred, N.; Bowen, P.; Valera-Medina, A.; March, R. CFD predictions of Swirl burner aerodynamics with variable outlet configurations. Int. J. Energy Technol. 2019, 31–43. [Google Scholar] [CrossRef]
  36. Degeneve, A.; Jourdaine, P.; Mirat, C.; Caudal, J.; Vicquelin, R.; Schuller, T. Effects of a Diverging Cup on Swirl Number, Flow Pattern, and Topology of Premixed Flames. J. Eng. Gas. Turbines Power 2018, 141, 031022. [Google Scholar] [CrossRef] [Green Version]
  37. Goodwin, D.G.; Moffat, H.K.; Speth, R.L.; Weber, B.W. Cantera: An Object-Oriented Software Toolkit for Chemical Kinetics, Thermodynamics, and Transport Processes. Version 2.4.0. 2018. Available online: https://www.cantera.org (accessed on 22 January 2021). [CrossRef]
  38. Ranzi, E.; Frassoldati, A.; Grana, R.; Cuoci, A.; Faravelli, T.; Kelley, A.P.; Law, C. Hierarchical and comparative kinetic modeling of laminar flame speeds of hydrocarbon and oxygenated fuels. Prog. Energy Combust. Sci. 2012, 38, 468–501. [Google Scholar] [CrossRef]
  39. Li, R.; Konnov, A.A.; He, G.; Konnov, A.A.; Zhang, D. Chemical mechanism development and reduction for combustion of NH3/H2/CH4 mixtures. Fuel 2019, 257, 116059. [Google Scholar] [CrossRef]
  40. Xiao, H.; Valera-Medina, A.; Bowen, P.; Dooley, S. 3D Simulation of Ammonia Combustion in a Lean Premixed Swirl Burner. Energy Procedia 2017, 142, 1294–1299. [Google Scholar] [CrossRef]
  41. Okafor, E.C.; Somarathne, K.K.A.; Ratthanan, R.; Hayakawa, A.; Kudo, T.; Kurata, O.; Iki, N.; Tsujimura, T.; Furutani, H.; Kobayashi, H. Control of NOx and other emissions in micro gas turbine combustors fuelled with mixtures of methane and ammonia. Combust. Flame 2020, 211, 406–416. [Google Scholar] [CrossRef]
  42. Slefarski, R.; Czyzewski, P.; Golebiewski, M. Experimental study on combustion of CH4/NH3 fuel blends in an industrial furnace operated in flameless conditions. Therm. Sci. 2020, 24, 3625–3635. [Google Scholar] [CrossRef]
Figure 1. The swirler and the nozzle geometry.
Energies 14 00662 g001
Figure 2. The experimental combustion chamber and the distribution of measurement levels.
Energies 14 00662 g002
Figure 3. Reactor network schematic, with recirculation.
Energies 14 00662 g003
Figure 4. Comparison of the experimental NO and CO2 emission at the outlet for the different swirlers and firing rates, φ = 0.71 (6% O2).
Energies 14 00662 g004
Figure 5. Comparison of the local species concentration for different swirlers and firing rates—axial position 30 mm and 60 mm, φ = 0.71.
Energies 14 00662 g005
Figure 6. Temperature contours and streamlines location, φ = 0.71.
Energies 14 00662 g006
Figure 7. Comparison of the local species concentration for different swirlers and thermal load—3D modelling, Xiao, axial position 30 mm, φ = 0.71.
Energies 14 00662 g007aEnergies 14 00662 g007b
Figure 8. Comparison of the local temperature distribution for different swirlers and thermal load, 3D modelling, Xiao, axial position 30 mm, φ = 0.71.
Energies 14 00662 g008
Figure 9. Comparison of the experimental and numerical NO emission at the outlet for the different swirlers and thermal load, φ = 0.71, mechanism Xiao.
Energies 14 00662 g009
Figure 10. Comparison of kinetic reaction mechanisms in a function of ammonia share in fuel with reactor network, swirler SW30, τRN = 1.088 s, Thot wall = 1050 K.
Energies 14 00662 g010
Figure 11. Comparison of kinetic reaction mechanisms in a function of ammonia share in fuel with reactor network, swirler SW50, τRN = 0.848 s, Thot wall = 1230 K.
Energies 14 00662 g011
Figure 12. Reaction pathway diagram of nitrogen species for 5% NH3 and φ = 0.71.
Energies 14 00662 g012
Figure 13. Normalized NO sensitivity diagram for reactor R0 (5%NH3, Φ = 0.71, T = 1556 K, MR = 0.4).
Energies 14 00662 g013
Table 1. Experimental test variables matrix.
Parameter RangeUnit
Inlet temperature 473K
Burners Swirl 30° (SW30), Swirl 50° (SW50)deg
Power 15, 30kW
Axial position 30, 60, 110mm
Equivalence ratio 0.71-
Fuel composition 0.0, 2.5, 5.0 NH3 (CH4 balance)%
Table 2. Numerical analysis variable matrix.
ParameterRangeUnit
Model0D IdealGasReactor Network
3D EDC RSM Fluent
-
Fuel0.0–5.0 NH3, CH4 balance%
Inlet temperature473K
Equivalence ratio ϕ0.71-
Power in the fuel15, 30kW
Mass flow recirculation ratio (MR)0.0, 0.1, 0.2, 0.4-
Table 3. Outline of the chemical reaction mechanisms.
NameLiXiaoCreckSanDiegoGRI-Mech3.0
Species1287451481156652
Reactions9576344205002141321325
Table 4. Summary of selected monitored variables for 3D reacting flow calculations.
Test Caseτ
[s]
MR
[-]
Snr N
[-]
Snr T
[-]
Snr S
[-]
Snr ISO
[-]
SW50 30 kW0.5060.5130.5060.6530.6540.61
SW50 15 kW1.1900.4240.7300.6600.6400.61
SW30 30 kW0.7560.4140.3470.6781.2961.26
SW30 15 kW1.4200.3730.3840.7001.3001.26
Table 5. Influence of the recirculation ratio on the NO concentration, 5%NH3 Φ = 0.71, Li (128).
Test CaseτRN ave
[s]
Thot wall
[K]
MRave
[-]
τR0
[ms]
TR0
[K]
TR OUT
[K]
NO
[ppm dry]
N2O, NO2
[ppm dry]
NOexp
[ppm dry]
SW500.84812300.0871707515224618-
0.4685916515202098191914
SW301.08810500.01091597435186330-
0.3947915464391703321598
Publisher’s Note: MDPI stays neutral with regard to jurisdictional claims in published maps and institutional affiliations.

