Abstract
As a large number of distributed generations are connected to the distribution system, research on the hosting capacity is actively being conducted. In particular, various methods, such as smart inverter functionality, co-located energy storage systems (ESS), and the use of on-load tap changers (OLTC), have been proposed to improve the hosting capacity. In this paper, a method to improve the hosting capacity by utilizing a solid-state transformer (SST) and its unique control capability is proposed. Lastly, the proposed method is verified in the distribution system of the Republic of Korea using the OpenDSS program.
1. Introduction
Many distributed generations (DGs) are interconnected to the distribution system from all over the world. However, as the interconnection of a large amount of DGs can cause voltage fluctuations and overcurrent exceeding the ampacity of the feeders in the distribution system, the power quality of the distribution system can be degraded. Therefore, it is very important to know the limit of DGs that can be interconnected to the distribution system without degrading the power quality. This is called the hosting capacity, which many researchers have worked to evaluate.
Additionally, researchers have studied methods to expand the hosting capacity [1]. Many pieces of literature have been written on how to expand the hosting capacity through utilizing smart inverters [2,3,4]; on-load-tap changers (OLTCs) [5,6]; reactive power sources, such as capacitor banks (CB) [7], energy storage systems (ESS) [8], curtailment of DG [9], and demand response [10]; or mixing several methods [11,12,13]. Smart inverters can control the active and reactive power to regulate power system voltage for extending the hosting capacity. The authors in [2] evaluated the impact of a smart inverter on the hosting capacity compared with conventional inverters. The authors of [3] compared smart inverter control methods such as Volt-VAR control, PF (P), and Q (U) for supporting a higher hosting capacity. The authors of [4] evaluated the effectiveness of active and reactive power controls of inverters for an increased hosting capacity. However, the reactive power control of the smart inverter does not alleviate an overcurrent larger than the ampacity of the power line, and the active power control reduces the amount of generation power. In addition, OLTC and reactive power sources can be used to regulate voltage to increase the hosting capacity. The authors in [5] proposed three OLTC-based control strategies and assessed the performance of the strategies for their hosting capacity within limiting tap operations. The authors of [6] proposed a hosting capacity evaluation method considering the robust optimal operation of OLTC using static Var compensators (SVCs). The authors in [7] proposed a feeder voltage profile design algorithm to achieve a specified voltage profile and hosting capacity enhancement by placing voltage control devices like CBs. However, OLTC and reactive power sources also focus on only regulating the power system voltage. In [8], a method to select the optimal size and place of Battery Energy Storage System (BESS) with optimal quadratic power control is proposed for improving the hosting capacity. To further increase the hosting capacity, not only the converter capacity, but also the BESS capacity, should be larger. In [9], two optimization models to maximize the net benefit of a distribution system and a wind farm owner with an enhancement hosting capacity using active management strategies, such as curtailment, is proposed. Curtailment can be utilized for hosting capacity enhancement, but it reduces the DG owner benefit. In [10], a multi-objective and multi-period Non Linear Programming (NLP) optimization model is formulated to utilize the demand response for increasing the hosting capacity and decreasing the energy losses. Generally, to increase the hosting capacity, demand response should consume more power. In many cases, authors use more than one technique to improve the hosting capacity. In [11], BESS and smart inverters are used, and in [12], OLTC, curtailment, and smart inverters are used to increase the hosting capacity. In [13], many hosting capacity enhancement techniques are evaluated and compared. If several techniques are used simultaneously, more costs are expected, but an improved hosting capacity is also expected.
Here, we study the method to expand the hosting capacity using a solid-state transformer (SST). An SST is a transformer that has several functions like reactive power compensation and voltage regulation, including a communication function and voltage step-up/step down capability. Because SSTs utilize a high-frequency transformer and a power electronics system, they have a low volume and weight [14]. Furthermore, the recent improvement of silicon carbide (SiC) technology will contribute to the commercialization of SST, which has a higher efficiency and reliability than the existing silicon (Si) [15].
In general, an SST is used to step-down the voltage from the Medium Voltage (MV)-to-Low Voltage (LV) system. However, in this paper, we locate the SST as a connector between MV systems (MV-to-MV), and control the active and reactive power flow through the SST that interconnects two MV power systems to extend the hosting capacity for the DG. Unlike conventional reactive power control methods such as Volt/Var control and reactive power compensation devices, MV-to-MV SSTs can control reactive power as well as active power. In addition, an SST does not reduce the amount of active power generation of distributed generation like curtailment-based hosting capacity expansion methods, and the kWh capacity is not limited like with ESS, and it just transfers excess active power from one MV level power system to another. By using the stochastic hosting capacity algorithm based on Monte-Carlo simulation, the effect of the SST on the hosting capacity extending is verified.
In Section 2, the concept of the hosting capacity and the stochastic hosting capacity calculation algorithm are introduced. In Section 3, the modeling methodology using OpenDSS is described and the control algorithm for SST to extend the hosting capacity is proposed. In Section 4, the performance of the SST for hosting capacity enhancement is validated in a South Korea test system. In Section 5, the conclusions are summarized.
2. Stochastic Hosting Capacity
2.1. Hosting Capacity
Hosting capacity refers to the maximum capacity of DG that can be interconnected to the distribution system without additional reinforcement [16]. In order for the distribution system to operate normally, the voltage of the distribution system must not exceed the rated voltage range, and the magnitude of the flowing current in the feeder must not be greater than the ampacity. However, when a large amount of DG is interconnected to the distribution system, the above-mentioned phenomenon may occur because of the intermittent characteristics of the DG, which may seriously affect the operation of the distribution system. Therefore, in order to evaluate the hosting capacity, it is determined whether or not a situation such as voltage violation or ampacity violation occurs when additional DGs are interconnected.
A more detailed hosting capacity calculation process will follow. First, the algorithm sets the loads and DGs’ profiles for a specific time period in the test distribution system. The determined profiles can be calculated using historical data or using predicative methods. Next, the power flow of the test distribution system is performed for the specific time period. As a result of the power flow, it is determined whether the voltage or current in the test distribution system violates the condition of Equations (1) and (2). Equations (1) and (2) indicate the bounds for voltage violations and ampacity violations, respectively, and constraints may be added depending on the conditions under consideration.
where is the bus voltage; are lower limit and upper limit for bus voltage, respectively; is the line current; and is the line ampacity. If there is a situation in which Equations (1) and (2) are violated, the location and capacity of the DG in the test distribution system may be judged to be in excess of the base hosting capacity limit. Then, new location and capacity candidates of DG are searched for to evaluate the hosting capacity.
Representative hosting capacity computation methods include optimization algorithms such as genetic algorithms. These methods formulate problems with Equations (1) and (2) as the constraints—the maximum capacity of DG that can be installed in distributed system is the objective function, as Equation (3), and the capacity and location of DG are the variables. Then, optimization algorithms calculate the maximum hosting capacity by solving these problems using optimization techniques.
where means the capacity of DG installed in each bus of the distribution system and L is the total number of the bus.
However, the above-mentioned methods need the assumption that the power system operator can completely control the location and capacity of the DG. However, in practice, the power system operator cannot control them. So, the hosting capacity computation method using the Monte-Carlo simulation is proposed in order to consider the uncertainty regardign the location and the capacity of the distributed generation that might be realized. We also used the Monte-Carlo simulation to calculate the hosting capacity in this paper.
2.2. Stochastic Hosting Capacity Computation Method
The Monte-Carlo simulation is an algorithm that derives the probability distribution of the output by repeatedly calculating a large number of outputs using inputs following certain probability distributions, and is often used to solve problems including uncertainty. In general, the power system operator cannot control the location and capacity of the DG in the distribution system in the future, so they are uncertain. To consider this uncertainty, methods for calculating the hosting capacity in distribution systems using Monte-Carlo simulation have been studied in recent papers [17,18,19].
The computation process of the hosting capacity using the Monte-Carlo simulation is as follows. First, the sum of the capacity (SumCap) of the DG in the distribution system is fixed. Next, capacities of DG () are distributed to the distribution system to satisfy the sum of the DG capacity as Equation (4). After that, the algorithm evaluates whether a voltage violation or ampacity violation occurs in the distribution system through power flow analysis. If a violation occurs, the number of violations is counted (“cnt”).
By repeating the above sequence, a predetermined number of times (“MAX”), it is possible to calculate the probability of violation for the corresponding hosting capacity (“Prob(SumCap)”). Similarly, it is possible to calculate the probability of violation for other hosting capacity conditions, which can be used as a reference for the power system operator to determine the hosting capacity. For example, if a power system currently operates with voltage violations 5% of the time, a hosting capacity that results in less than 5% violations is allowed. Figure 1 shows the flowchart for the hosting capacity computation method using the Monte-Carlo simulation.

Figure 1.
Flowchart for the hosting capacity computation method using the Monte-Carlo simulation.
3. Modeling and Control of SST
3.1. Modeling of the SST in OpenDSS
An SST is composed of electronic devices and a high frequency transformer (Figure 2 shows a basic diagram for an SST). The SST is divided into the following three stages: AC-to-DC stage, DC-to-DC stage, and DC-to-AC stage. In the AC-to-DC stage, 60Hz AC power is converted to DC power through an AC/DC converter. Next, in the DC-to-DC stage, the DC power is converted to high frequency AC power and is processed through a high frequency transformer, and the AC power is re-converted to DC power. Lastly, in the DC-to-AC stage, the DC power is converted to 60Hz AC power, to be injected into the AC power system [20].
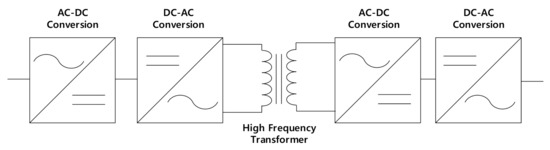
Figure 2.
Diagram of a solid-state transformer (SST).
The objective of this paper is to assess the performance of the SST and to develop the proposed SST control for extending the hosting capacity. To calculate the maximum hosting capacity, the power flow simulator is necessary to check whether violation of the voltage regulation and ampacity regulation occur. However, modeling of the SST in a power flow simulator such as OpenDSS is very difficult because of the SST’s complicated construction. So, this paper uses a simple SST modeling method that is similar to the proposed model in the literature [21]. The authors in [21] propose a MV-to-LV SST model consisting of two separated elements, loads on the MV side and a voltage source on the LV side, which are modeled simply in OpenDSS, as in Figure 3a. Here, when the demand is larger than the generation in the LV system, loads in the MV side of the SST consume the active power and voltage source, and the LV side of SST injects the same amount of active power, except there is 10% power loss in the LV system. In the opposite case, the voltage source in the LV side of SST consumes active power, and load in the MV side of SST injects the active power into MV system. Reactive power in the LV side of SST is then controlled to regulate the voltage in the LV system.

Figure 3.
SST model for OpenDSS: (a) conventional MV-to-LV SST model [10] and (b) proposed MV-to-MV SST model.
The MV-to-MV SST model proposed in this paper consists of two power-controlled sources and one active power loss element. Two power-controlled sources have the same active power and power flow direction, except for 10% power loss according to the active power loss element and considering the loss of the SST. In addition, there is independent reactive power for each terminal, as shown in Figure 3b. The active power and reactive power for each power-controlled source are determined to extend the hosting capacity. The detailed power control algorithm is described in Section 3.3.
3.2. MV-to-MV SST in the Interconnection System
In this paper, MV-to-MV SST is used to interconnect two MV power systems—the upper power system connected with terminal 1 of SST and the lower power system connected with terminal 2, as in Figure 4. If the distance between the two power systems is close enough, it is possible to interconnect the two power systems by using a power line and MV-to-MV SST, and to control the power flow between the two MV systems by using SST for providing more flexibility to the power system.
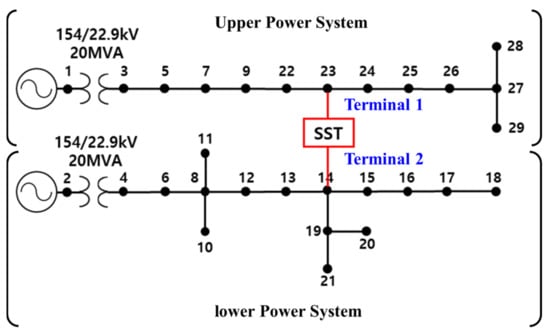
Figure 4.
Diagram of an SST.
3.3. MV-to-MV SST in the Interconnection System
The control algorithm proposed for SST regulates the voltage in all buses and the line current by controlling the active and reactive power flowing through the SST. The objective of this paper is the operation of a power system with a large amount of distributed generation and an SST without any reliability problem for extending the hosting capacity. The SST control algorithm is described as follows:
- -
- Step (1): Monitor the per-unit bus voltage () and line current () magnitude in the upper and lower power systems using the communication system. Where means number of the SST terminal, which is 1 or 2. and represent the bus and line number for the corresponding power systems, respectively. For example, in Figure 4, is the voltage of bus 9 in the upper power system, and there is no because bus 9 exists in the upper power system not in the lower power system.
- -
- Step (2): Using the Volt/Var curve [22], like in Figure 5, based on the largest voltage () among all buses of each power system (upper and lower power system), each terminal of the SST will absorb or supply reactive power () to the corresponding power system. Note that the reactive power of each terminal of the SST is independent.
 Figure 5. Volt/Var curve for the SST.
 - -
- Step (3): Control the active power flow through SST to restrain the maximum violation of the voltage or current (), which is calculated by Equation (5). If or is bigger than 1, it means that one of the power systems has at least one violation. For example, when is bigger than 1, the SST controls the active power flow from terminal “1” to terminal “2” in order to reduce the voltage magnitude or the line current in the power system on terminal “1” of the SST until becomes smaller than 1 or the active power flow reaches the active power flow limit. If case of both and are bigger than 1, SST controls the active power to reduce a bigger .where is the ampacity of the power lines.
- -
- Step (4): If the violation of voltage or current remains, control the reactive power of SST up to reactive power limit beyond the Volt/Var curve so as to mitigate violation situation.
The detailed SST control algorithm is shown in Figure 6.
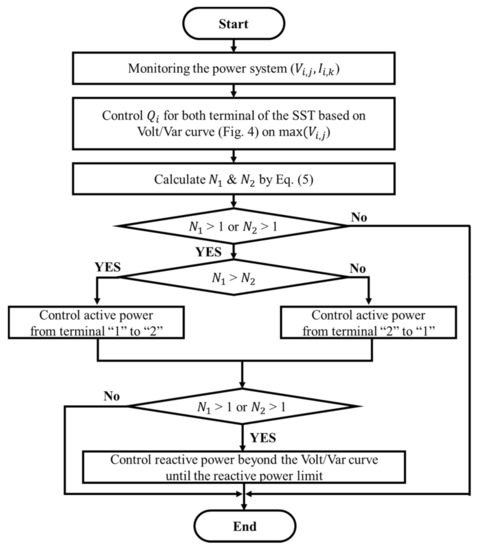
Figure 6.
Flowchart for th eSST control algorithm.
4. Simulation Conditions and Results
4.1. Simulation Condition
The proposed SST control algorithm is verified in a Republic of Korea distribution system with MV-to-MV SST, as shown in Figure 4. The distribution system is energized by a 154/22.9kV transformer and the MV-to-MV SST is installed with between 14 and 23 buses. Figure 7 and Table 1 show the load profile for each load type, and the load location for each load type. Figure 8 shows the photovoltaic (PV) generation profile for all PVs connected to the test system. To consider the worst case, the lowest load and highest PV generation one-day profiles were chosen for the analysis.
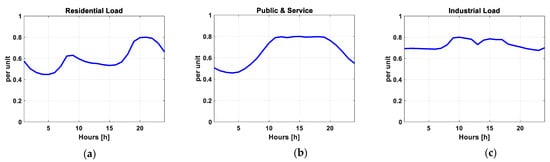
Figure 7.
Load profile for each load type: (a) type I—residential load; (b) type II—public and service; (c) type III—industrial load.

Table 1.
Load type and locations.
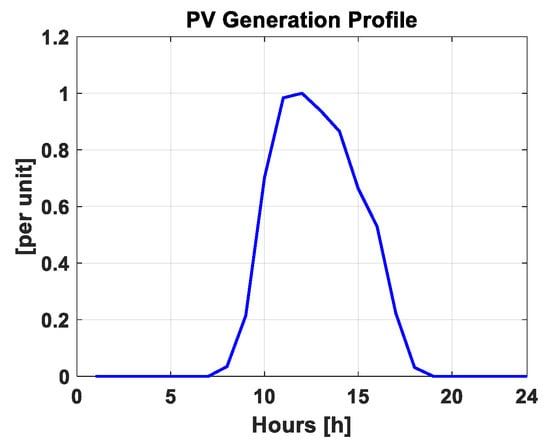
Figure 8.
Photovoltaic (PV) generation profile.
4.2. Power Flow Control of SST
In this subsection, the power flow through the SST implementing the proposed control algorithm is described. Table 2 shows the PV location and capacity, as well as the active/reactive power limit for the SST. Buses 8, 13, 18, and 21 are located in the lower part of the power system and a total of 13,830kVA of PV is connected to the lower power system. Notably, only 2000 kVA of PV is connected to the upper part of the power system. Figure 9 shows the SST power flow at 13:00 p.m., when the PV generation is the highest, and compares three different SST conditions. Without an SST, the maximum bus voltage in the distribution system is 1.0482 (p.u.), detected in bus 18, and it is lower than the voltage upper limit. However, because the line currents (500 A) are over the ampacity (460 A) of lines 4–6, line violations can occur, as shown in Figure 9a. With the SST operating using only the Volt/Var functionality in Figure 5, both terminals of SST consume a reactive power of 356 kVar and 2056 kVar, respectively, and the magnitude of the bus voltages becomes lower. However, the line currents become higher (from 500 A to 520 A, through line 4–6) because of more reactive power flowing from the power system, and the current violation remains as shown in Figure 9b. If the SST controls reactive power and active power based on the proposed control algorithm, the results shown in Figure 9c are produced. To reduce the line current, terminal 2 of the SST injects reactive power (1197 kVar) and active power (1839 kW) flows from terminal 2 to terminal 1. As a result, the line current through line 4–6 reduced to 458 [A], which is lower than the ampacity of line 4–6, and also a line current violation does not occur in any line. Although through the injection of reactive power through terminal 2 of the SST, the bus voltage at bus 18 increases to 1.0496 p.u., it is still smaller than the voltage upper limit.
Table 2.
Load type and locations.
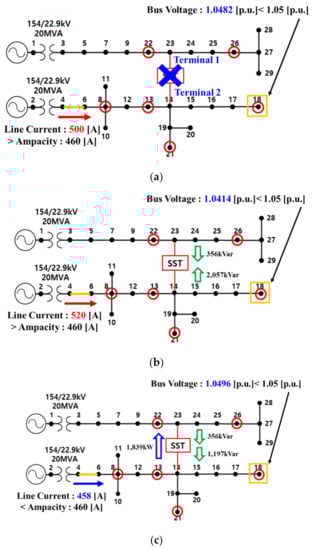
Figure 9.
SST power flow at Table 2 conditions at 13:00 p.m.: (a) without the SST; (b) only the Volt/Var function of the SST; (c) proposed control of the SST.
Figure 10 shows the power flow through the SST for one day. From 11:00 a.m. to 13:00 p.m., because of the large PV generation in the lower power system, active power flows from terminal 2 to terminal 1. In the case of reactive power, to reduce the line current, which is larger than the power system ampacity limit, the SST injects reactive power into the lower power system.
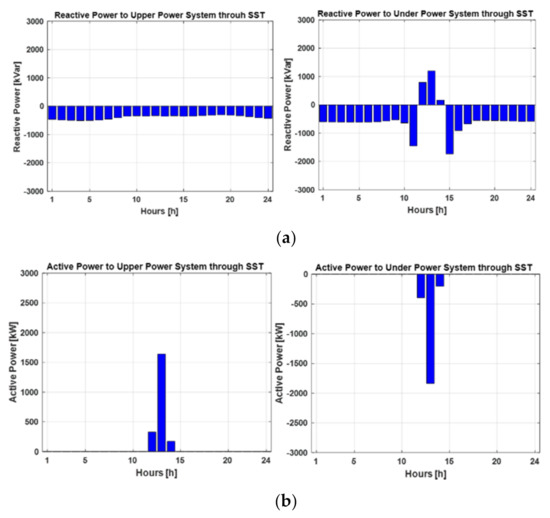
Figure 10.
Power flow through SST for one day: (a) reactive power flow through SST; (b) active power flow through SST.
4.3. Effect for Hosting Capacity
In this subsection, the effect of the SST and the proposed SST control algorithm for increasing the hosting capacity is verified using a stochastic hosting capacity calculation method. Using the algorithm in Figure 1, the distributed generations are randomly distributed amongst all of the buses of the test system, and the probability of violations (bus voltage and line current) are calculated as shown in Table 3. The “No SST” case and several other cases where the overall the nameplate capacity of the SST are considered. For each case, the number in brackets refers to the active and reactive power limit for the SST. The Volt/Var function of smart inverters for PV is also considered. In Table 3, if the probability of violation is over 5%, the corresponding penetration level is assumed to be above the base hosting capacity level of the power system. Therefore, the maximum permissible penetration rate can be viewed as the determined hosting capacity. For example, in the case of “No SST”, the hosting capacity is 74%.
Table 3.
Probability of violation for each case.
As a result of the simulation, as the SST capacity increased, the hosting capacity also increased, and it is confirmed that a linear relationship exists between the SST capacity and the hosting capacity, as shown in Figure 11. On the other hand, because consuming reactive power cannot reduce the line current, the Volt/Var function of the smart inverter is not effective to mitigate current violations. Therefore, the Volt/Var function is rather counter-productive to expanding the hosting capacity in this case.
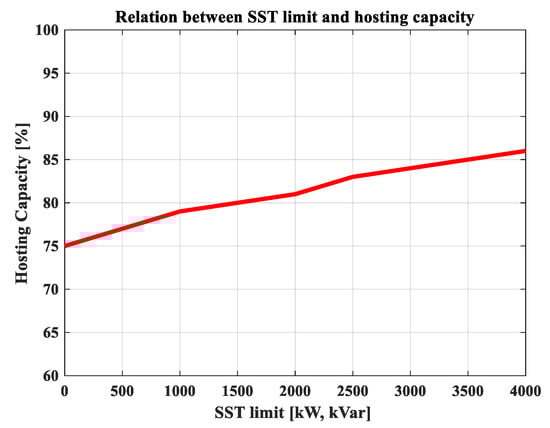
Figure 11.
Relation between the SST limit and the hosting capacity.
5. Conclusions
In this paper, a hosting capacity extending methods using an SST and a control algorithm for the SST are proposed. The SST is modeled by two power-controlled sources in OpenDSS. Active power and reactive power flows are controlled by the SST so as to alleviate the voltage and current violations in order to extend the overall hosting capacity. As a result of the simulation using the Korean test system, it is confirmed that the SST controls the active and reactive power in order to alleviate voltage and current violations, and improves the hosting capacity. In this paper, only the merits of SST on increasing the hosting capacity of DG have been addressed, but the functionality of SST can also be used to improve the flexibility of the power system. In future work, we will study the various advantages of SST and compare it in terms of economy with other power system equipment, such as a smart inverter, OLTC, and ESS. The practical feasibility of the MV-to-MV SST in the distribution system will also be reviewed. The hosting capacity has also only been calculated in a specifically chosen day in the paper, but in order to consider the dynamic nature existing in the distribution system, the hosting capacity must be analyzed through a period of time (from a week to a year), which is called the dynamic hosting capacity [23,24]. Therefore, the dynamic hosting capacity will be analyzed in future work.
Author Contributions
J.-S.S. conceptualized the proposed algorithm and wrote the original draft. J.-S.K. reviewed and edited paper. This study was carried out under the supervision of B.M. and C.-H.K. All authors have read and agreed to the published version of the manuscript.
Funding
This research was supported by the MOTIE (Ministry of Trade, Industry, and Energy) in Korea, under the Fostering Global Talents for Innovative Growth Program (P0008746), supervised by the Korea Institute for the Advancement of Technology (KIAT), and the National Research Foundation of Korea (NRF) grant funded by the Korean Government (MSIP), grant number no. 2018R1A2A1A05078680.
Institutional Review Board Statement
Not applicable.
Informed Consent Statement
Not applicable.
Data Availability Statement
Data sharing not applicable.
Conflicts of Interest
The authors declare no conflict of interest.
References
- Ustun, T.S.; Hashimoto, J.; Otani, K. Impact of Smart Inverters on Feeder Hosting Capacity of Distribution Networks. IEEE Access 2019, 7, 163526–163536. [Google Scholar] [CrossRef]
- Luo, K.; Shi, W. Comparison of Voltage Control by Inverters for Improving the PV Penetration in Low Voltage Networks. IEEE Access 2020, 8, 161488–161497. [Google Scholar] [CrossRef]
- Collins, L.; Ward, J.K. Real and reactive power control of distributed PV inverters for overvoltage prevention and increased renewable generation hosting capacity. Renew. Energy 2015, 81, 464–471. [Google Scholar] [CrossRef]
- Long, C.; Ochoa, L.F. Voltage Control of PV Rich LV Networks: OLTC-Fitted Transformer and Capacitor Banks. IEEE Trans. Power Syst. 2016, 31, 4016–4025. [Google Scholar] [CrossRef]
- Varma, R.K.; Siavashi, E.M. Enhancement of Solar Farm Connectivity with Smart PV Inverter PV-STATCOM. IEEE Trans. Sustain. Energy 2019, 10, 1161–1171. [Google Scholar] [CrossRef]
- Divshali, P.H.; Söder, L. Improving Hosting Capacity of Rooftop PVs by Quaratic Control of an LV-Central BSS. IEEE Trans. Smart Grid 2019, 10, 919–927. [Google Scholar] [CrossRef]
- Wang, S.; Chen, S.; Ge, L.; Wu, L. Distributed Generation Hosting Capacity Evaluation for Distribution Systems Considering the Robust Optimal Operation of OLTC and SVC. IEEE Trans. Sustain. Energy 2016, 7, 1111–1123. [Google Scholar] [CrossRef]
- Nursebo, S.S.; Chen, P.; Carlson, O.; Bertling Tjernberg, L. Optimizing Wind Power Hosting Capacity of Distribution Systems Using Cost Benefit Analysis. IEEE Trans. Power Delivery 2014, 29, 1436–1445. [Google Scholar] [CrossRef]
- Quijano, D.A.; Wang, J.; Sarker, M.R.; Padilha-Feltrin, A. Stochastic assessment of distributed generation hosting capacity and energy efficiency in active distribution networks. IET Gener. Trans. Distrib. 2017, 11, 4617–4625. [Google Scholar] [CrossRef]
- Lee, J.; Bérard, J.-P.; Razeghi, G.; Samuelsen, S. Maximizing PV hosting capacity of distribution feeder microgrid. Appl. Energy 2020, 269, 114400. [Google Scholar] [CrossRef]
- Ismael, S.M.; Abdel Aleem, S.H.E.; Abdelaziz, A.Y.; Zobaad, A.F. State-of-the-art of hosting capacity in modern power systems with distributed generation. Renew. Energy 2019, 130, 1002–1020. [Google Scholar] [CrossRef]
- Ding, F.; Mather, B. On Distributed PV Hosting Capacity Estimation, Sensitivity Study, and Improvement. IEEE Trans. Sustain. Energy 2017, 8, 1010–1020. [Google Scholar] [CrossRef]
- Sousa, J.F.B.; Borges, C.L.T.; Mitra, J. PV hosting capacity of LV distribution networks using smart inverters and storage systems: A practical margin. IET Renew. Power Gener. 2020, 14, 1332–1339. [Google Scholar] [CrossRef]
- Costa, L.F.; De Carne, G.; Buticchi, G.; Liserre, M. The Smart Transformer: A solid-state transformer tailored to provide ancillary services to the distribution grid. IEEE Power Electron. Mag. 2017, 4, 56–67. [Google Scholar] [CrossRef]
- Mainali, K.; Tripathi, A.; Madhusoodhanan, S.; Kadavelugu, A.; Patel, D.; Hazra, S.; Hatua, K.; Bhattacharya, S. A Transformerless Intelligent Power Substation: A three-phase SST enabled by a 15-kV SiC IGBT. IEEE Power Electron. Mag. 2015, 4, 31–43. [Google Scholar] [CrossRef]
- Lee, H.D.; Tae, D.H.; Kim, J.M.; Rho, D.S. Evaluation Method for Hosting Capacity of PV System in Distribution System with Micro Hydropower Generator. J. Electr. Eng. 2020, 15, 2489–2499. [Google Scholar] [CrossRef]
- Arshad, A.; Lehtonen, M. A Stochastic Assessment of PV Hosting Capacity Enhancement in Distribution Network Utilizing Voltage Support Techniques. IEEE Access 2019, 7, 46461–46471. [Google Scholar] [CrossRef]
- Abad, M.S.S.; Ma, J.; Zhang, D.; Ahmadyar, A.S.; Marzooghi, H. Probabilistic Assessment of Hosting Capacity in Radial Distribution Systems. IEEE Trans. Sustain. Energy 2018, 9, 1935–1947. [Google Scholar] [CrossRef]
- Torquato, R.; Salles, D.; Pereira, C.O.; Magalhaes Meira, P.C.; Freitas, W. A Comprehensive Assessment of PV Hosting Capacity on Low-Voltage Distribution Systems. IEEE Trans. Power Deliv. 2018, 33, 1002–1012. [Google Scholar] [CrossRef]
- Sanduleac, M.; Martins, J.F.; Ciornei, I.; Albu, M.; Toma, L.; Fernao Pires, V.; Hadjidemetriou, L.; Sauba, R. Resilient and Immune by Design Microgrids Using Solid State Transformers. Energies 2018, 11, 3377. [Google Scholar] [CrossRef]
- Guerra, G.; Martinez-Velasco, J.A. A Solid State Transformer Model for Power Flow Calculations. Electr. Power Energy Syst. 2017, 89, 40–51. [Google Scholar] [CrossRef]
- Hwang, J.H.; Lim, S.G.; Choi, M.S.; Kim, M.S. Reactive Power Control Method for Grid-Tie Inverters Using Current Measurement of DG Output. J. Electr. Eng. 2019, 14, 603–612. [Google Scholar] [CrossRef]
- Castelo de Oliveira, T.E.; Bollen, M.; Ribeiro, P.F.; de Carvalho, P.M.S.; Zambroni, A.C.; Bonatto, B.D. The Concept of Dynamic Hosting Capacity for Distributed Energy Resources: Analytics and Practical Considerations. Energies 2019, 12, 2576. [Google Scholar] [CrossRef]
- Jain, A.K.; Horowitz, K.; Ding, F.; Sedzro, K.S.; Palmintier, B.; Mather, B.; Jain, H. Dynamic hosting capacity analysis for distributed photovoltaic resources—Framework and case study. Appl. Energy 2020, 280, 115633. [Google Scholar] [CrossRef]
Publisher’s Note: MDPI stays neutral with regard to jurisdictional claims in published maps and institutional affiliations. |
© 2021 by the authors. Licensee MDPI, Basel, Switzerland. This article is an open access article distributed under the terms and conditions of the Creative Commons Attribution (CC BY) license (http://creativecommons.org/licenses/by/4.0/).