
Comparison of Tar Samples from Reaction Zone and Outlet in Ex-Situ Underground Coal Gasification Experiment


Abstract
:1. Introduction
2. Materials and Methods
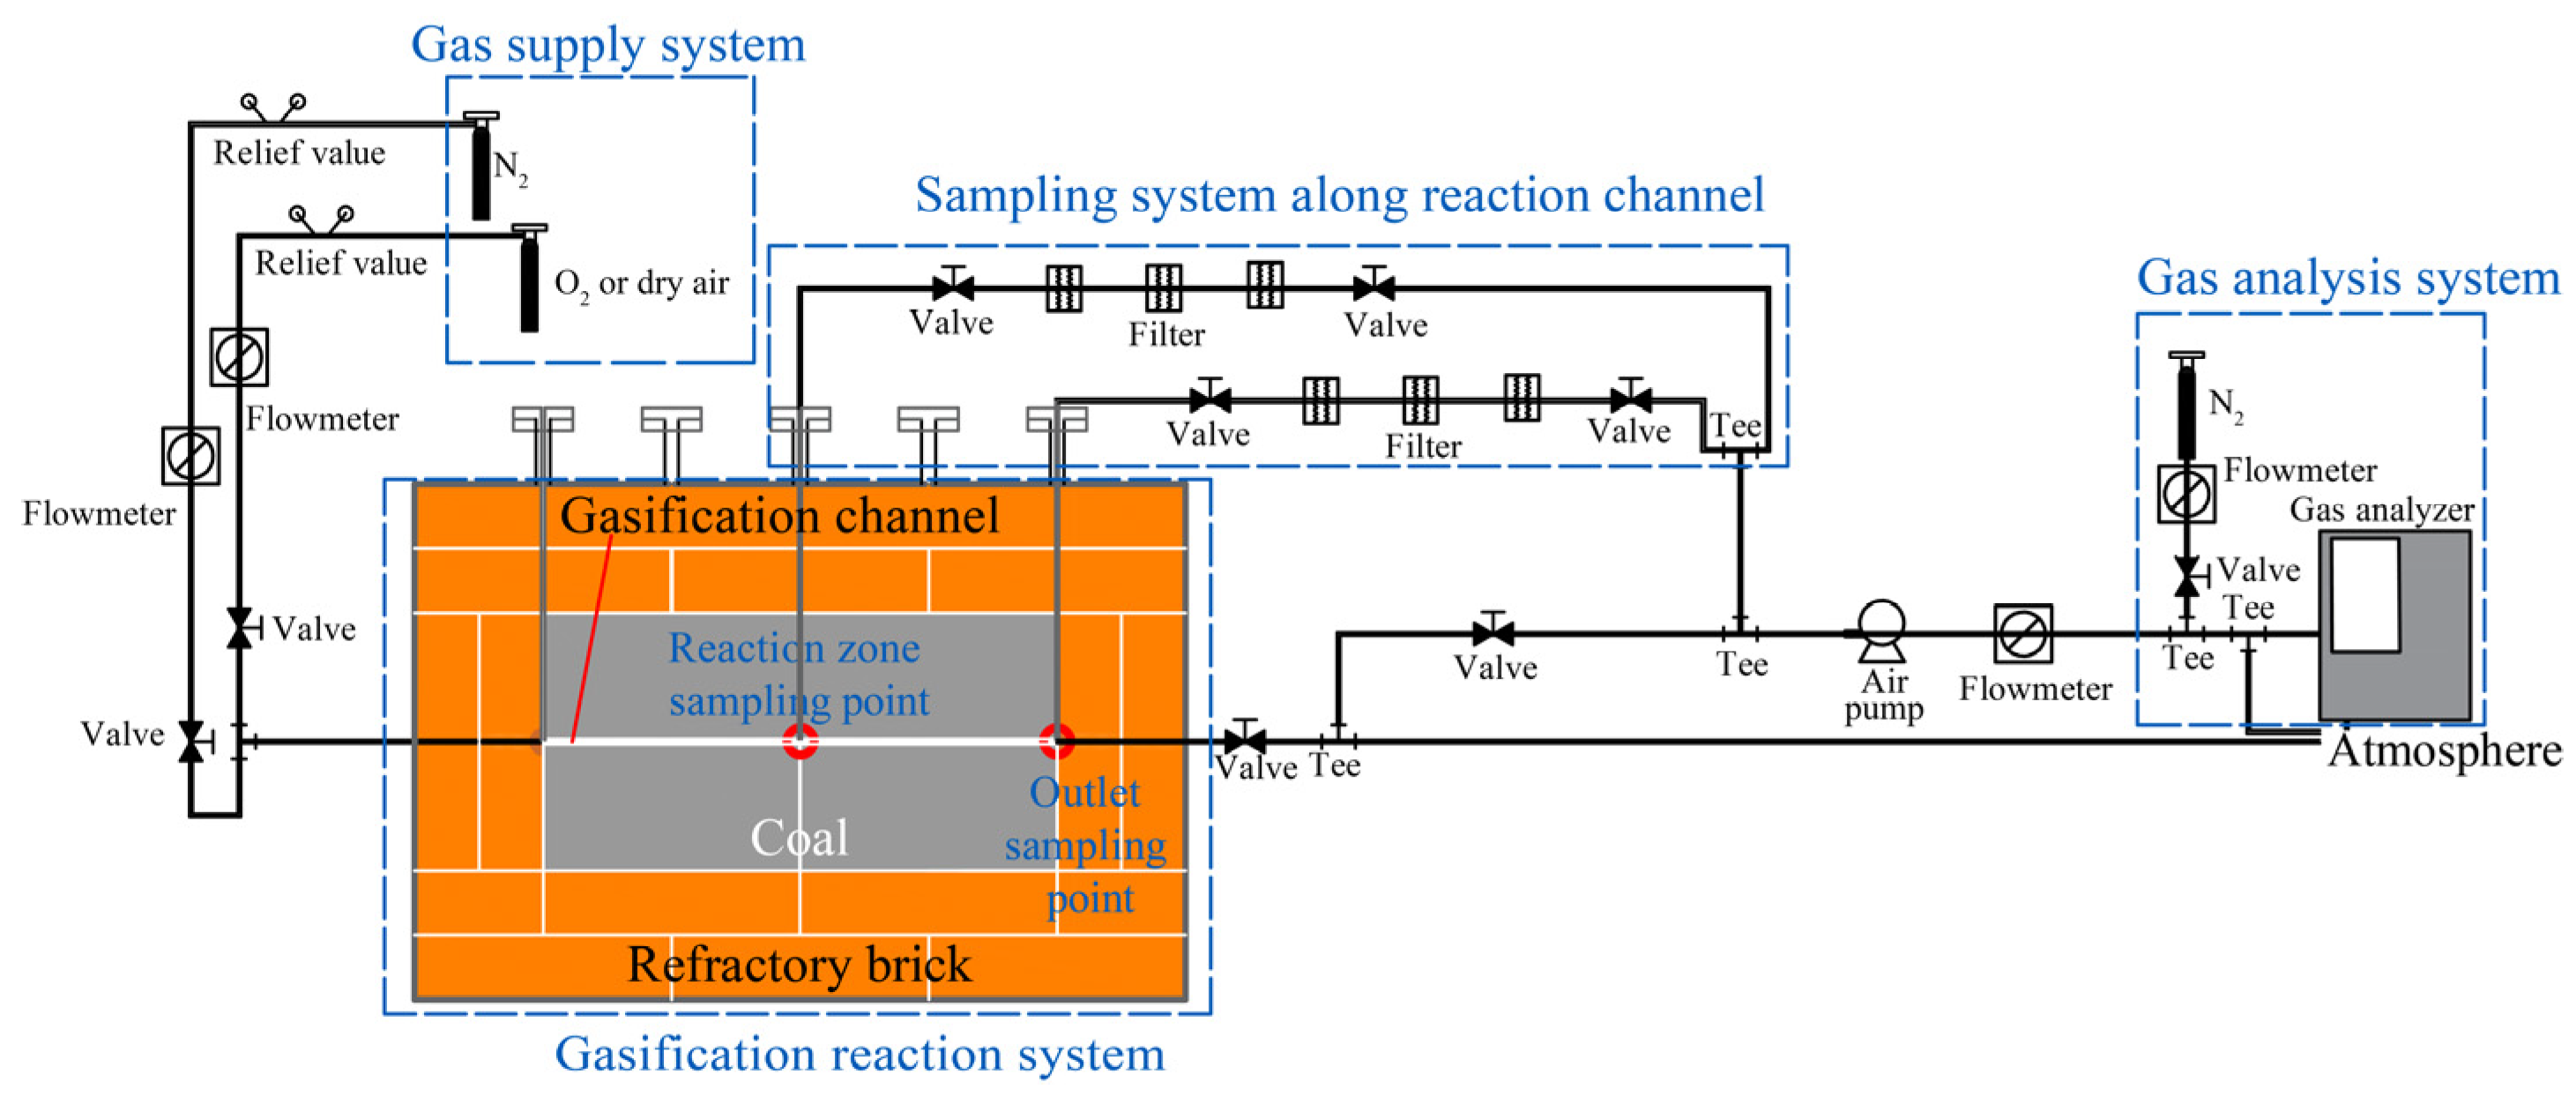
2.1. Underground Gasification Experimental System
2.2. Tar Sample Collection
2.3. Tar Sample Analysis
2.4. Experimental Conditions
3. Results
3.1. Tar Sample Analysis
3.1.1. Content and Properties
3.1.2. Comparison with Literature
3.2. Tar-Related Results
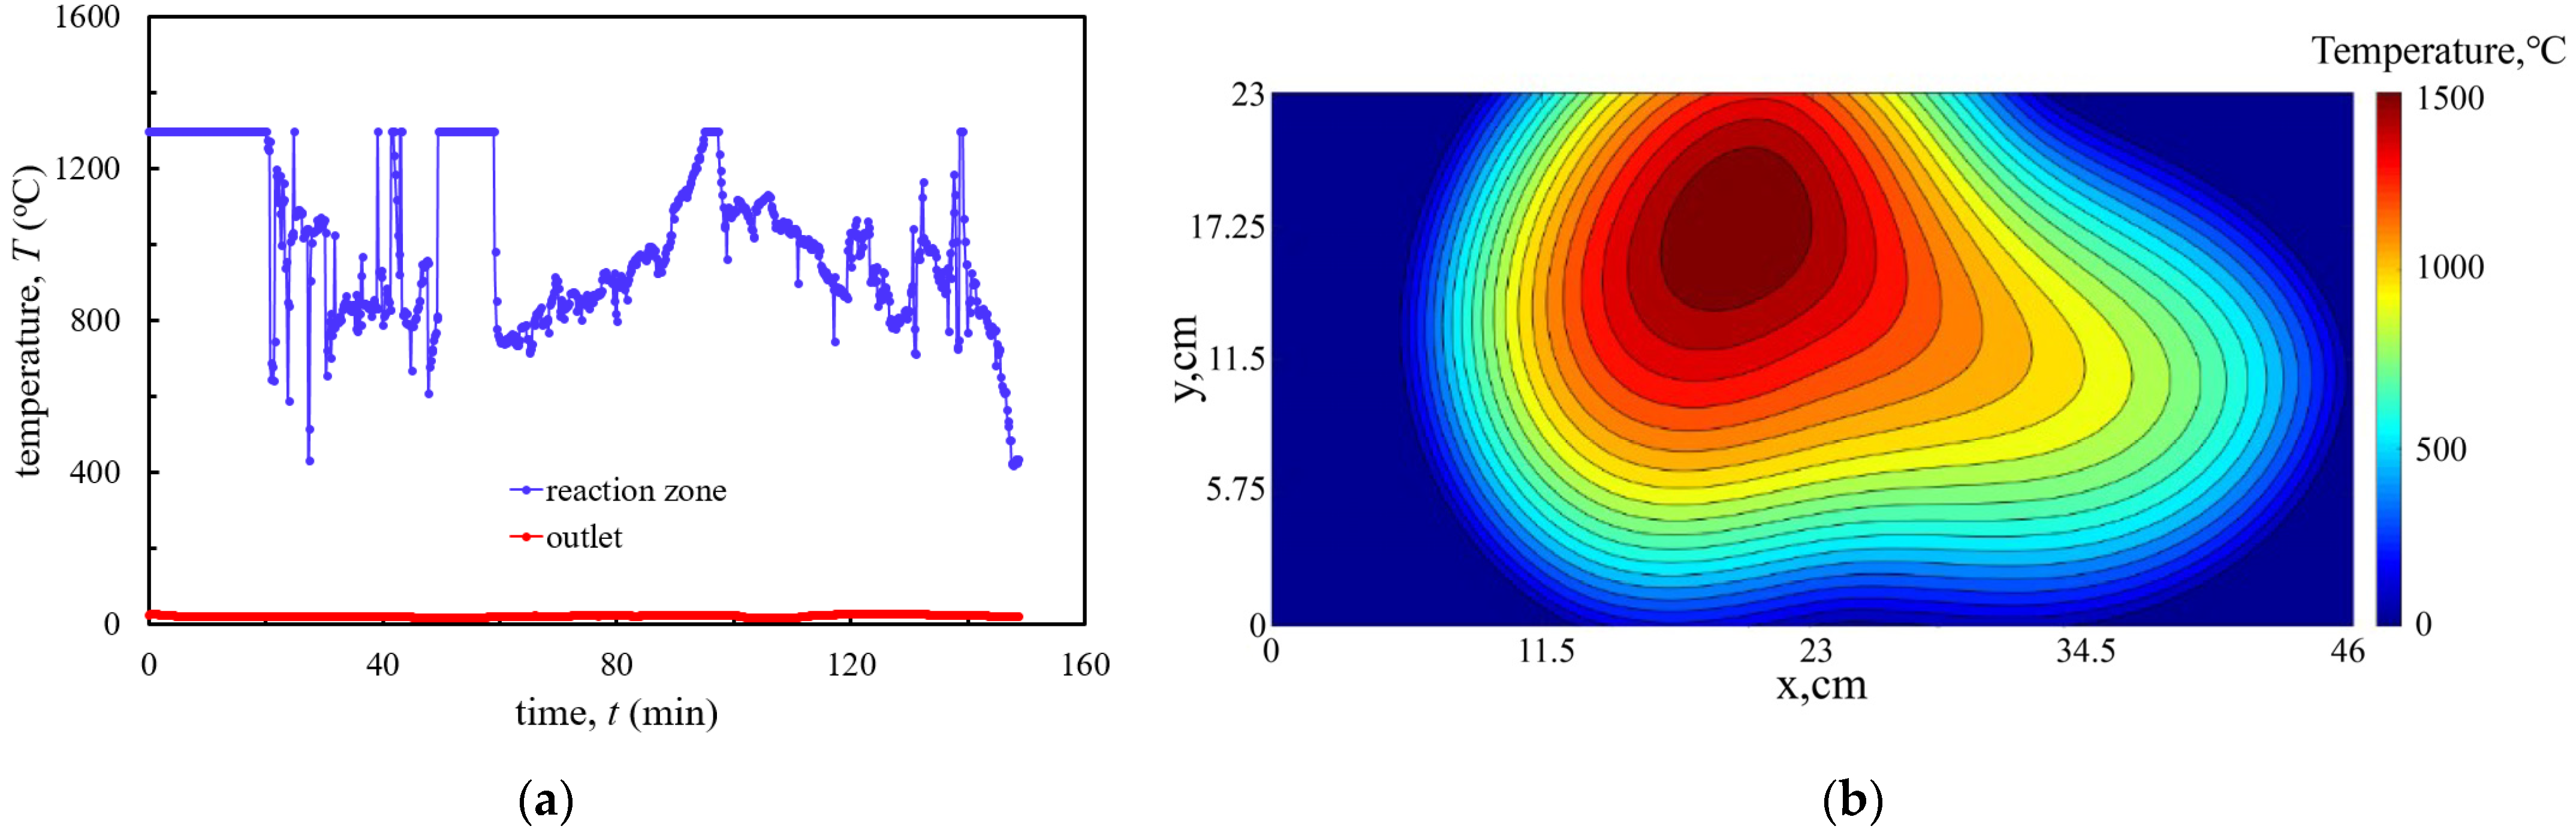
3.2.1. Temperature
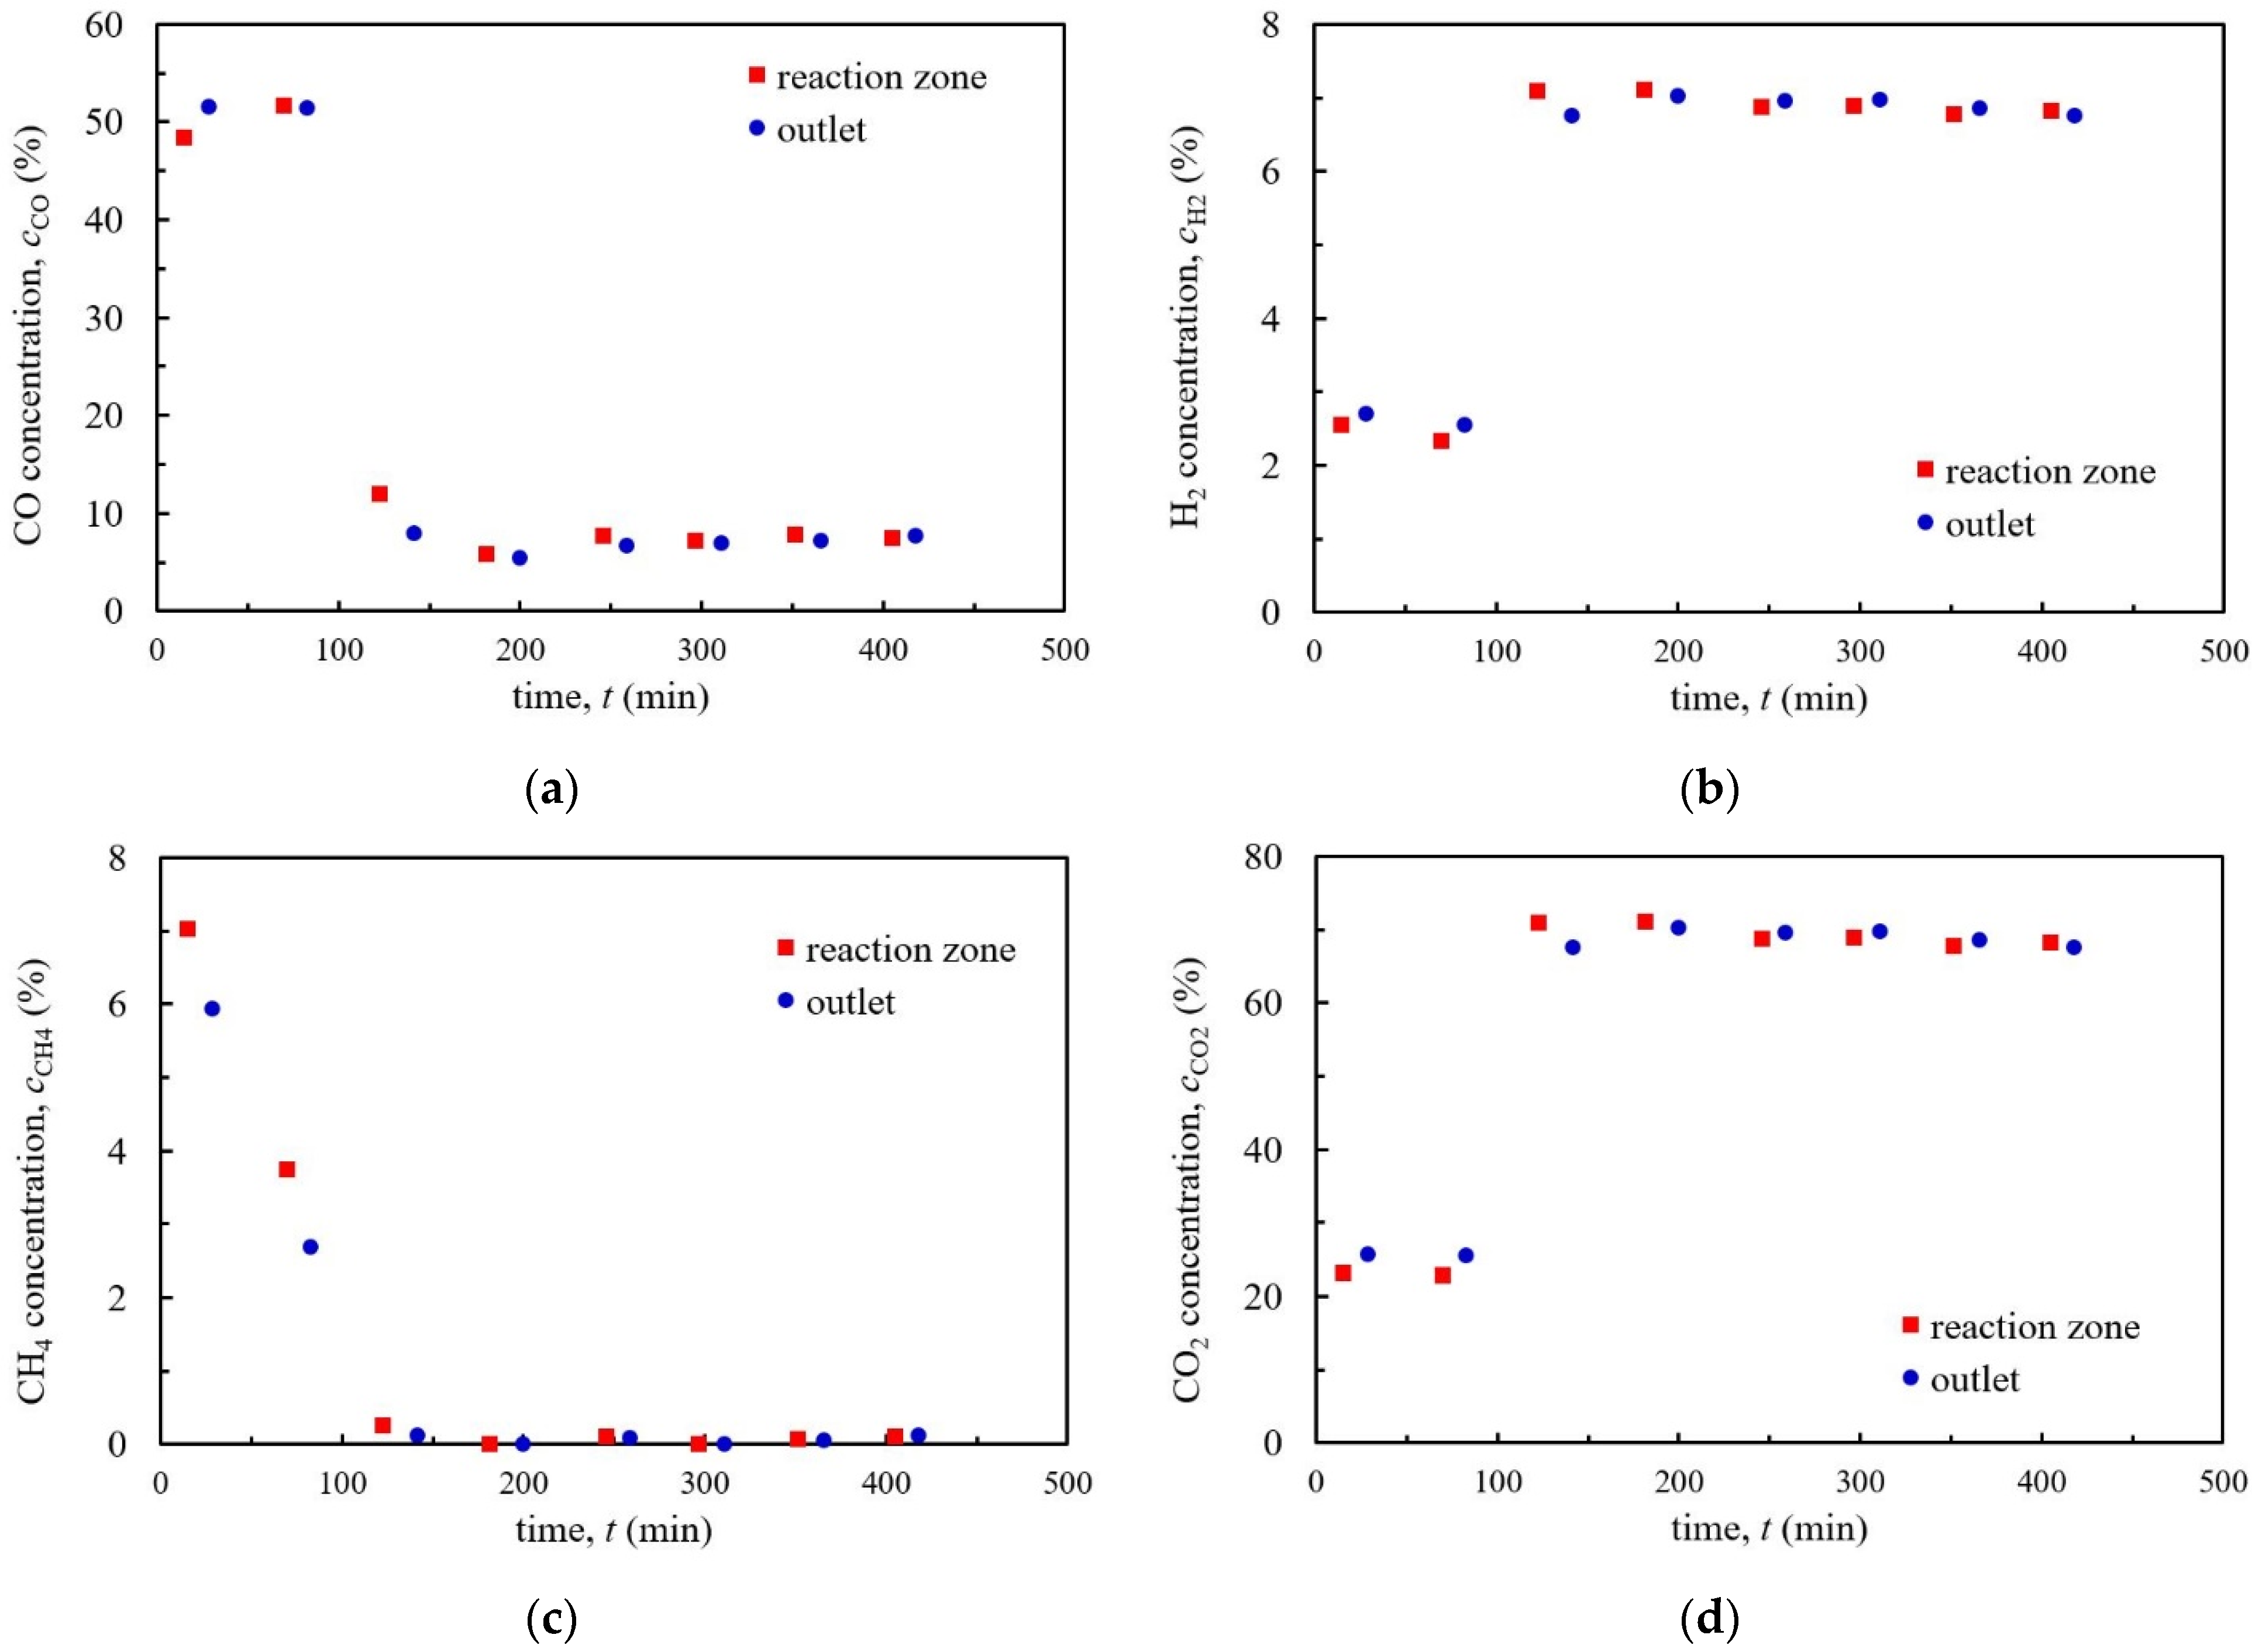
3.2.2. Gas Composition
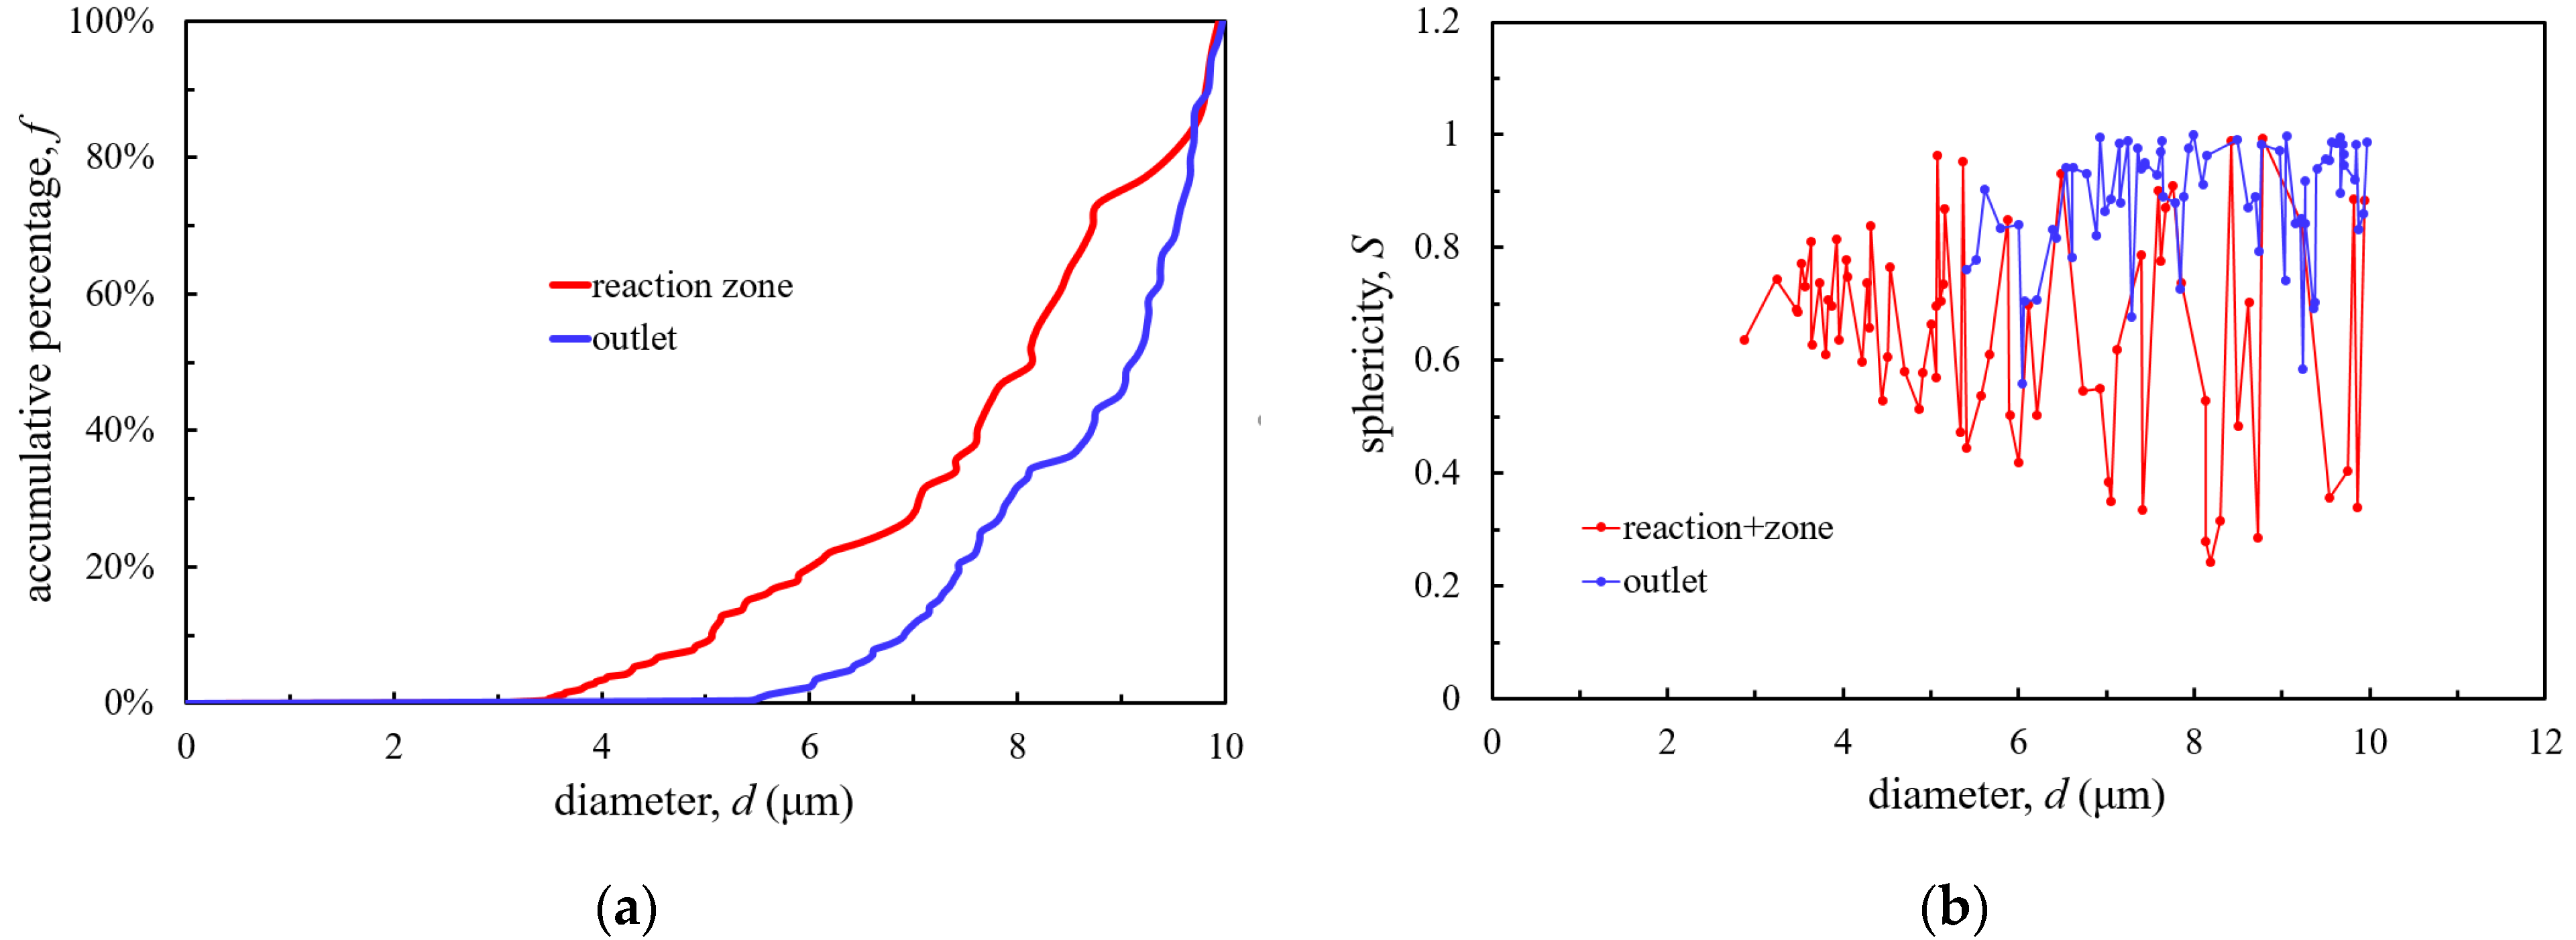
3.2.3. PM10
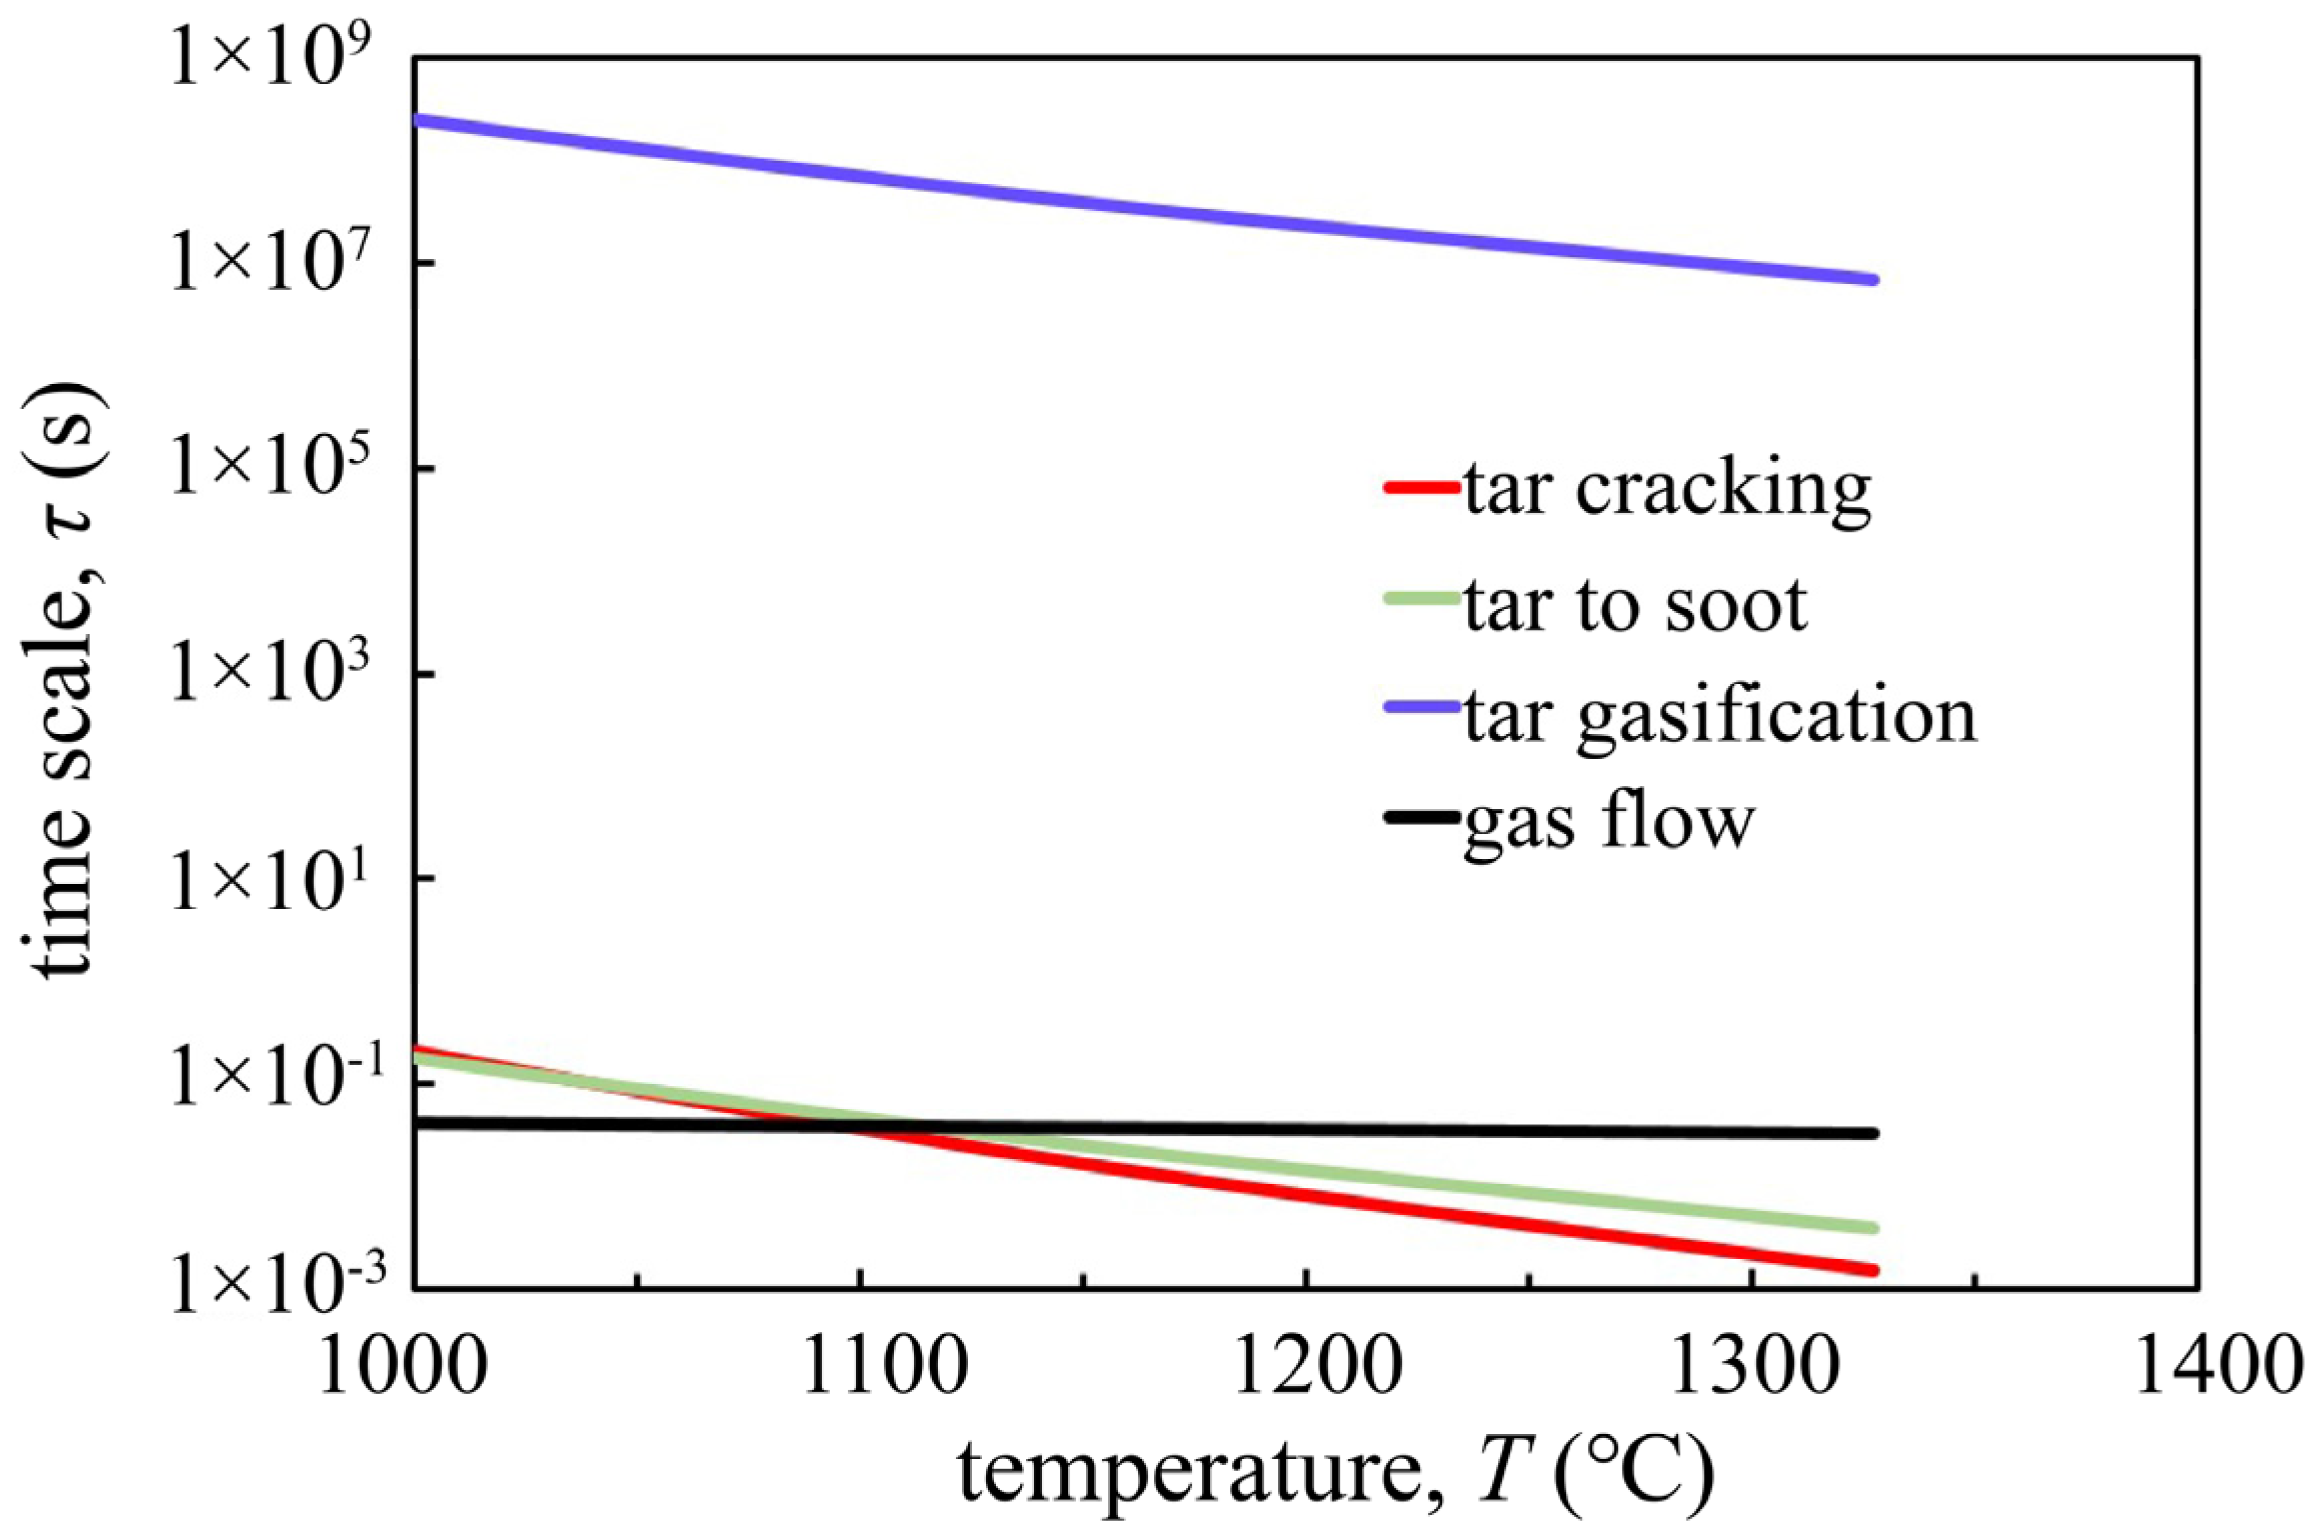
3.3. Tar-Related Reaction Analysis
4. Discussion
5. Conclusions
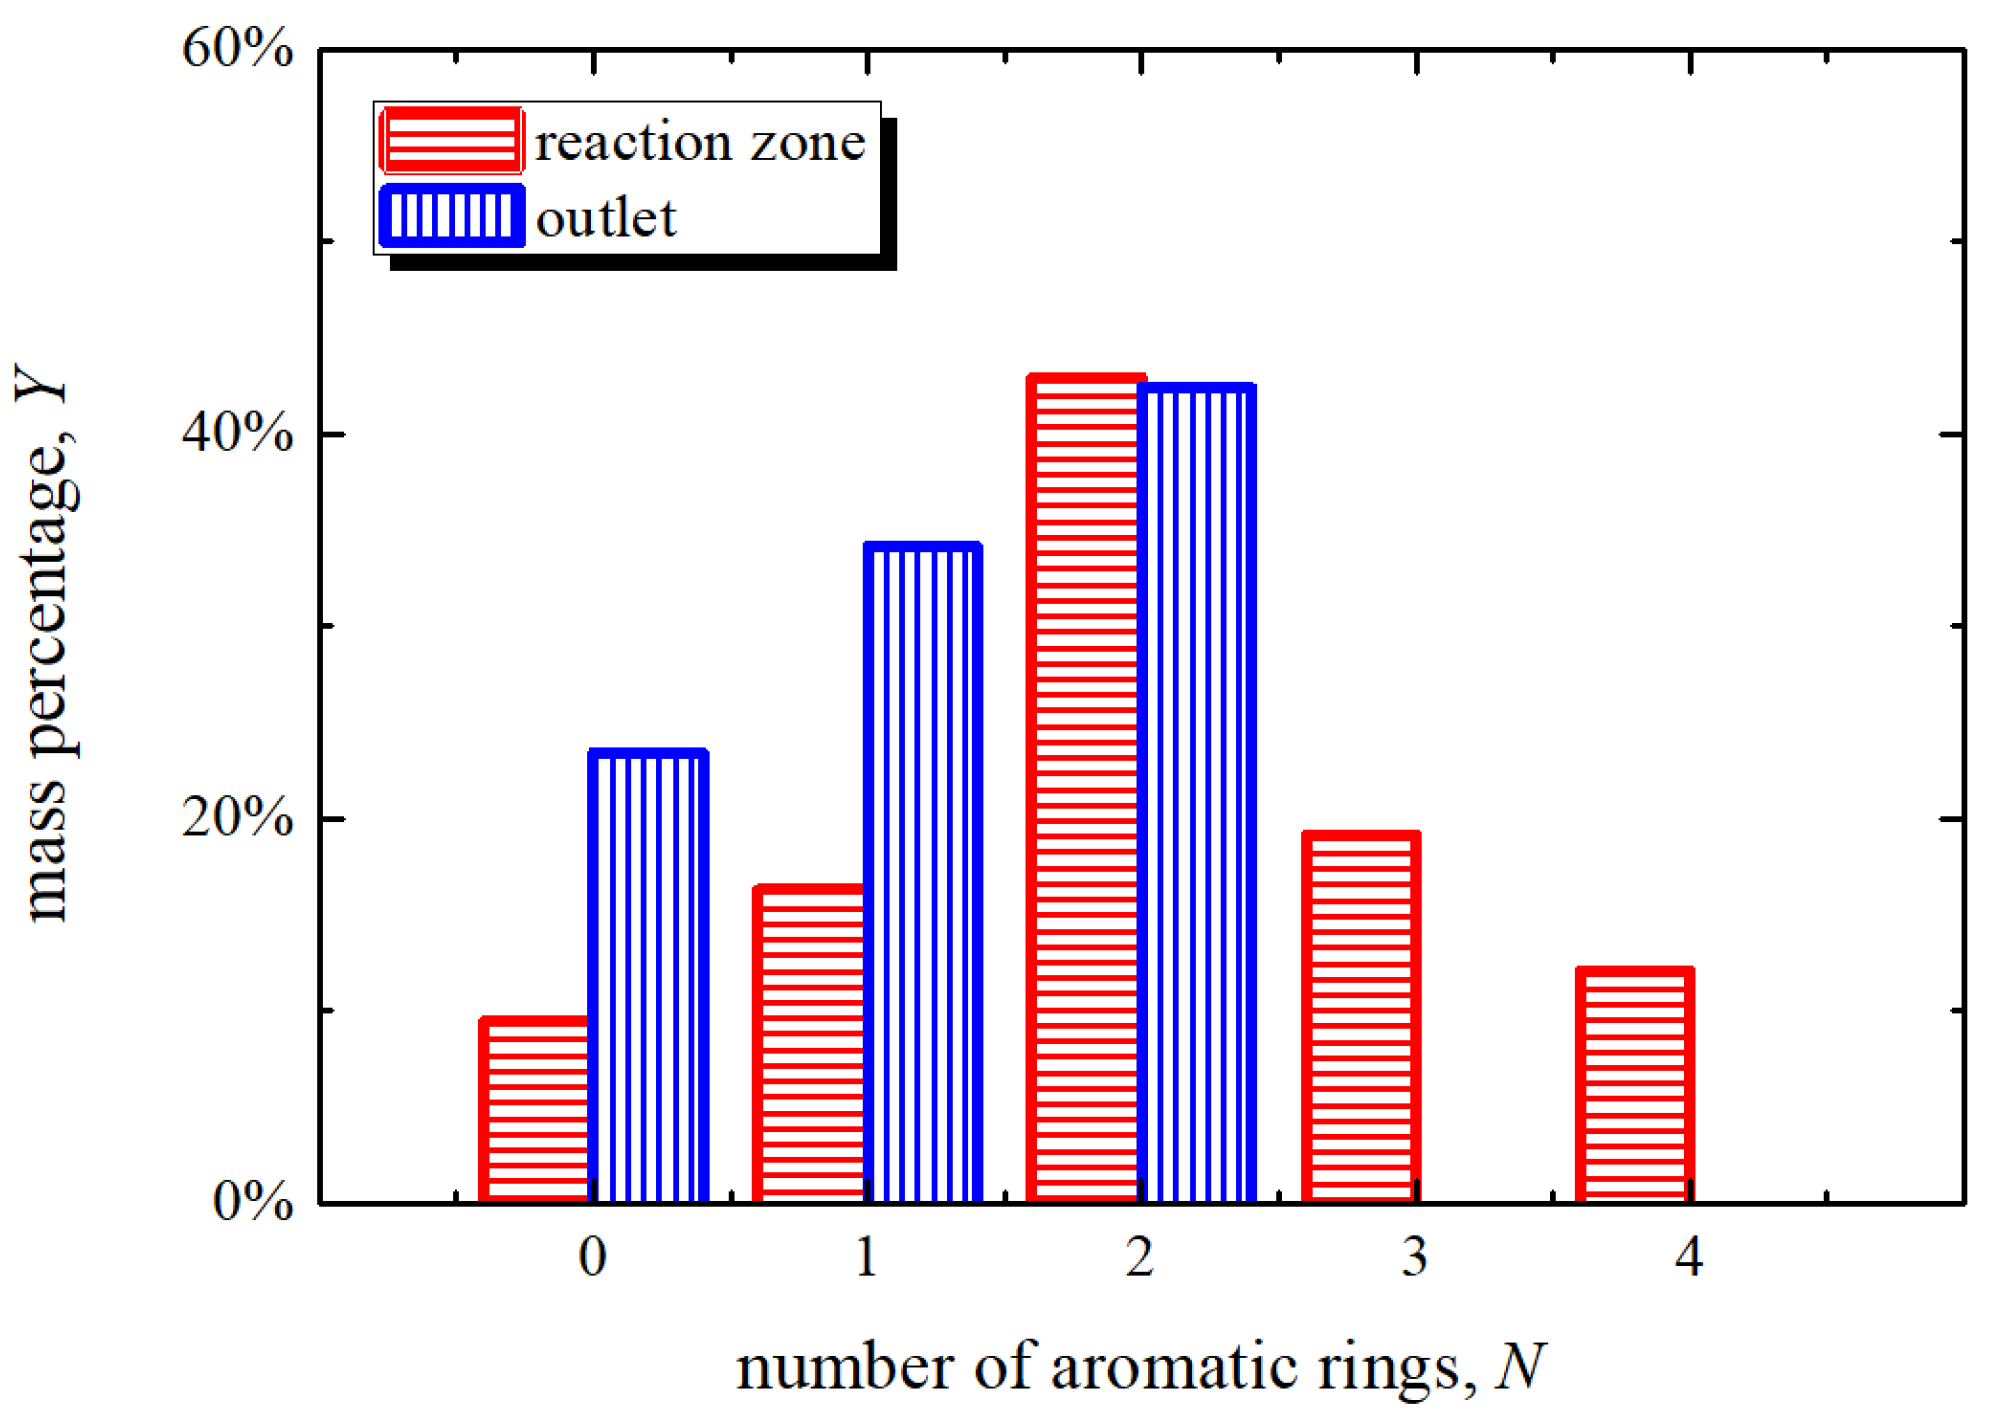
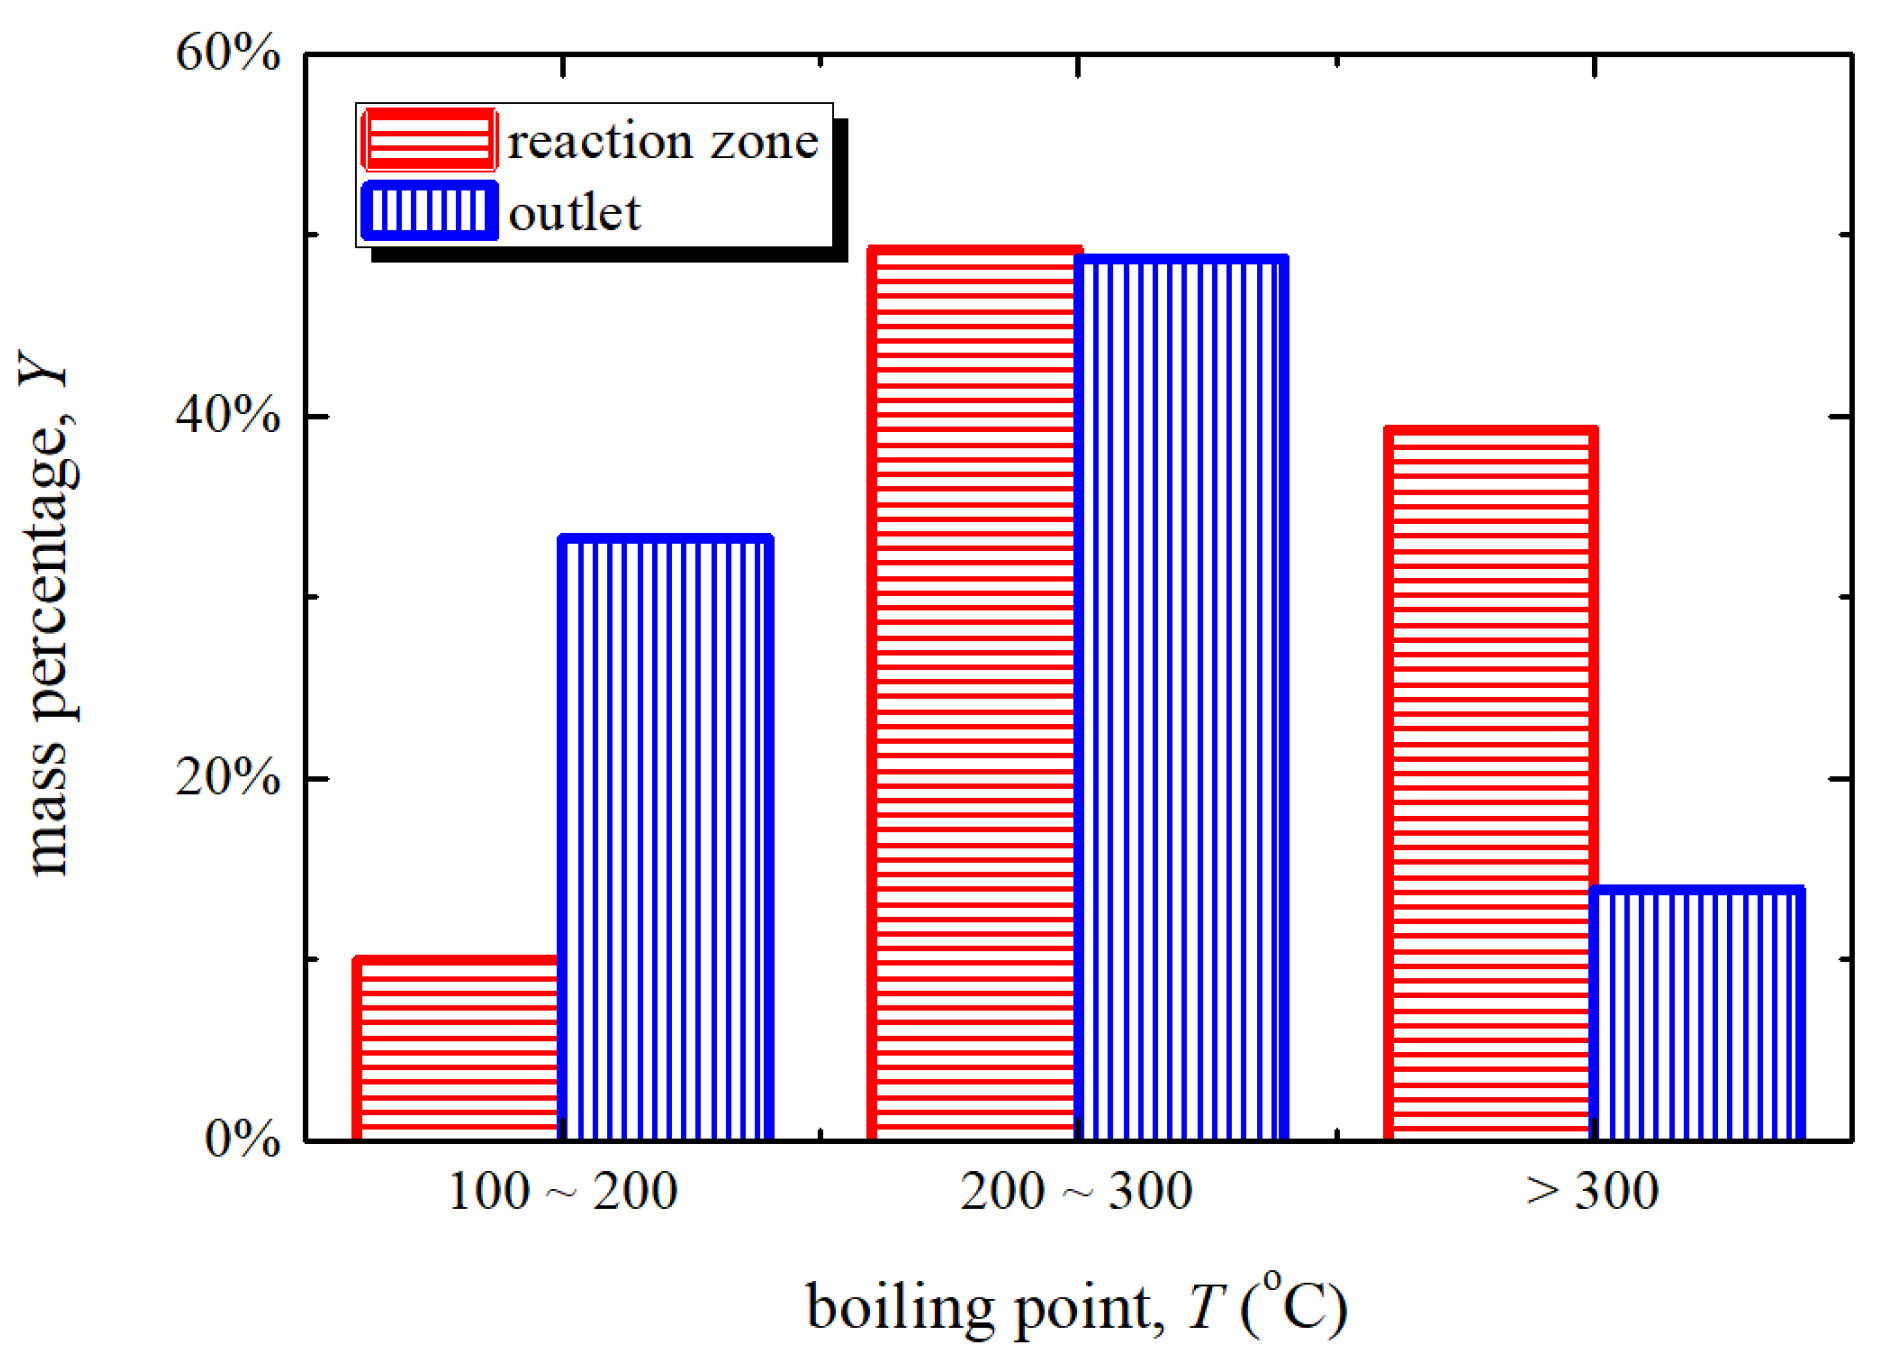
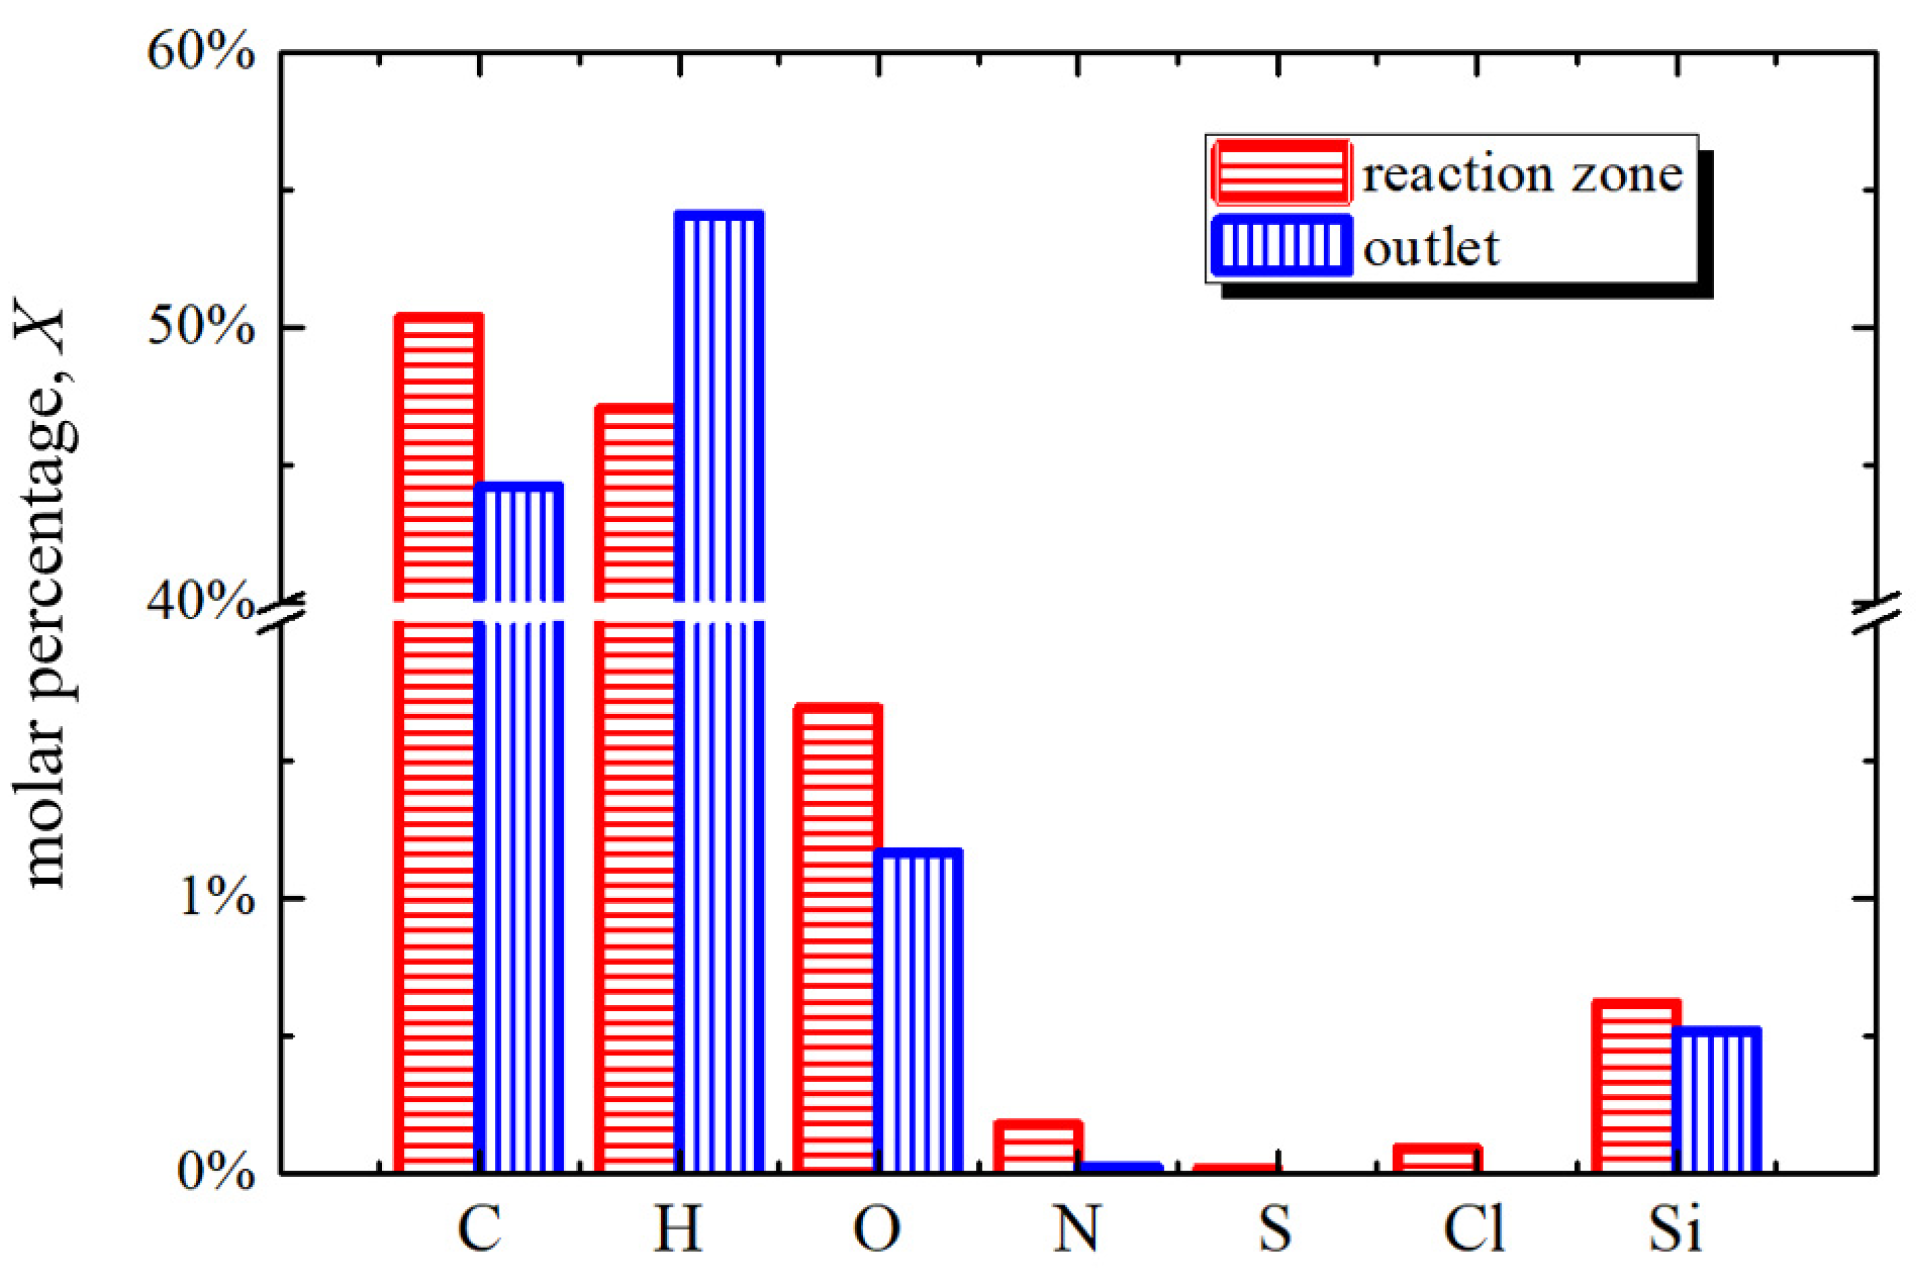
- Compared with the tar from reaction zone, the tar from outlet has a smaller percentage of high boiling point content, PAHs, C, O, N, S, Cl, Si, and a larger percentage of H.
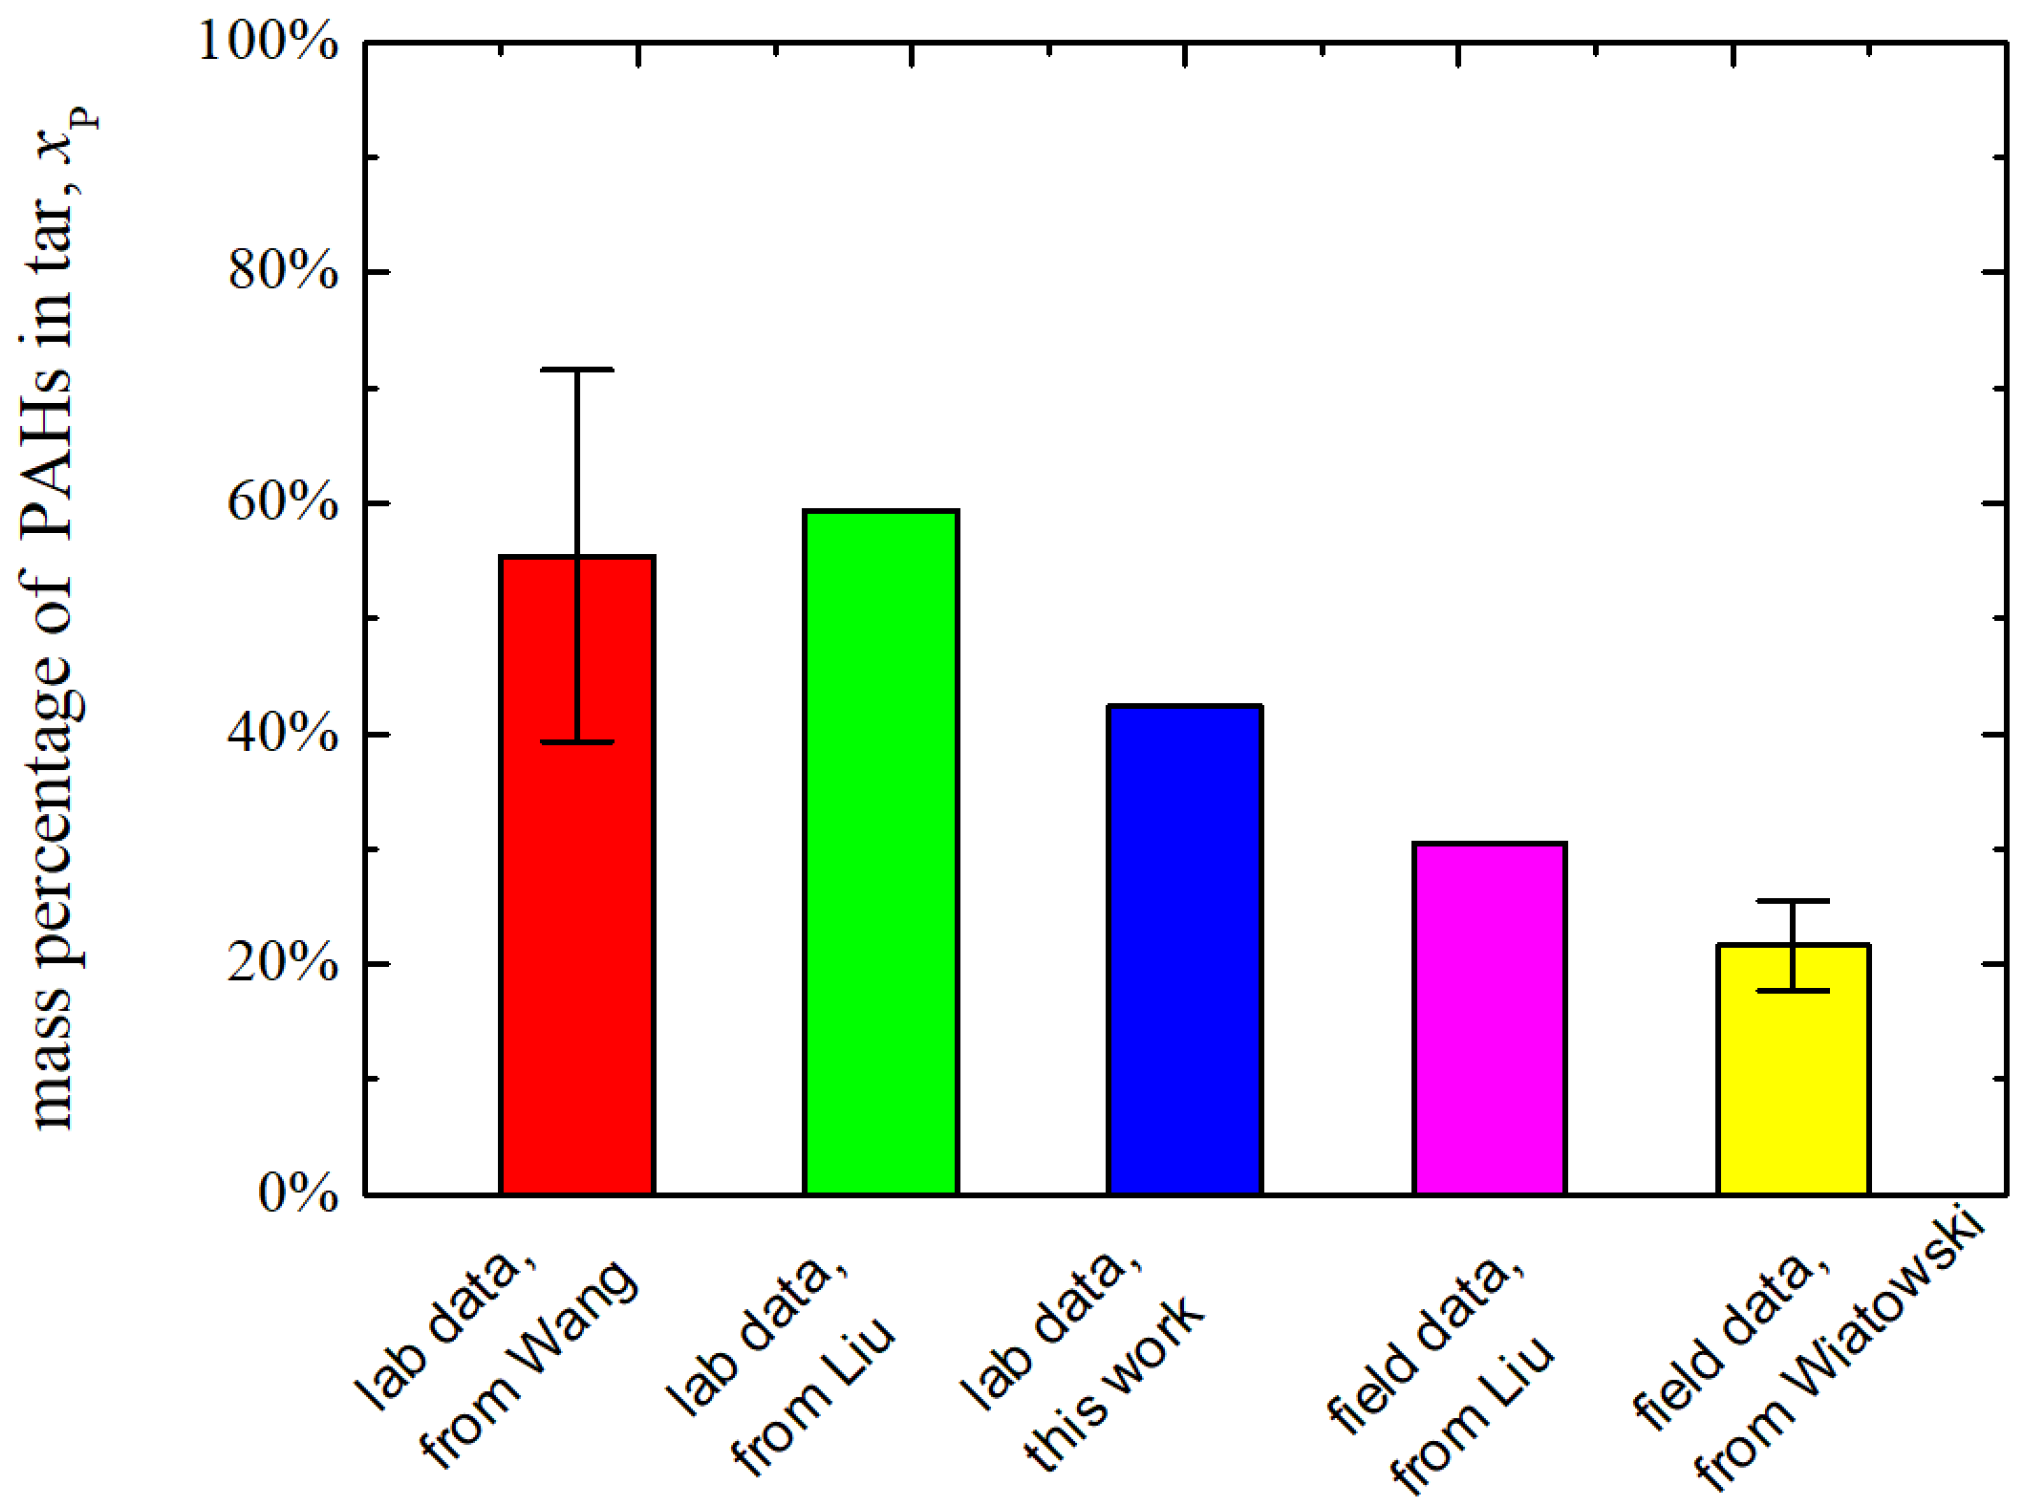
- The PAHs percentage in tar at the outlet in this work is closer to the field data than the lab data from literature.
- Condensation, tar cracking, and soot formation are the reasons for decrease of heavy tar from reaction zone to outlet.
Author Contributions
Funding
Institutional Review Board Statement
Informed Consent Statement
Data Availability Statement
Acknowledgments
Conflicts of Interest
References
- Zelenak, S.; Skvarekova, E.; Senova, A.; Wittenberger, G. The usage of UCG technology as alternative to reach low-carbon energy. Energies 2021, 14, 3718. [Google Scholar] [CrossRef]
- An, N.; Zagorscak, R.; Thomas, H.R.; Gao, W. A numerical investigation into the environmental impact of underground coal gasification technology based on a coupled thermal-hydro-chemical model. Jounal Clean. Prod. 2021, 290, 125181. [Google Scholar] [CrossRef]
- Mandapati, R.N.; Ghodke, P.K. Kinetic modeling of Indian lignites pyrolysis in the context of underground coal gasification (UCG). Fuel 2021, 283, 118939. [Google Scholar] [CrossRef]
- Walowski, G. Gas Permeability Model for Porous Materials from Underground Coal Gasification Technology. Energies 2021, 14, 4462. [Google Scholar] [CrossRef]
- Janoszek, T.; Masny, W. CFD Simulations of Allothermal Steam Gasification Process for Hydrogen Production. Energies 2021, 14, 1532. [Google Scholar] [CrossRef]
- Perkins, G. Underground coal gasification—Part I: Field demonstrations and process performance. Prog. Energy Combust. Sci. 2018, 67, 158–187. [Google Scholar] [CrossRef]
- Perkins, G. Underground coal gasification—Part II: Fundamental phenomena and modeling. Prog. Energy Combust. Sci. 2018, 67, 234–274. [Google Scholar] [CrossRef]
- Strugała-Wilczek, A.; Stanczyk, K. Comparison of metal elution from cavern residue after underground coal gasification and from ash obtained during coal combustion. Fuel 2015, 158, 733–743. [Google Scholar] [CrossRef]
- Strugała-Wilczek, A.; Stanczyk, K. Leaching behaviour of metals from post-underground coal gasification cavity residues in water differing in mineralization. Fuel 2016, 173, 106–114. [Google Scholar] [CrossRef]
- Kumari, G.; Vairakannu, P. CO2-O2 dry reforming based underground coal gasification using low and high ash Indian coals. Fuel 2018, 216, 301–312. [Google Scholar] [CrossRef]
- Kumari, G.; Vairakannu, P. Laboratory scale studies on CO2 oxy-fuel combustion in the context of underground coal gasification. J. CO2 Util. 2017, 21, 177–190. [Google Scholar] [CrossRef]
- Xu, M.; Xin, L.; Liu, W.; Hu, X.; Cheng, W.; Li, C.; Wang, Z. Study on the physical properties of coal pyrolysis in underground coal gasification channel. Powder Technol. 2020, 376, 573–592. [Google Scholar] [CrossRef]
- Mandal, R.; Maity, T.; Chaulya, S.K.; Prasad, G.M. Laboratory investigation on underground coal gasification technique with real-time analysis. Fuel 2020, 275, 117865. [Google Scholar] [CrossRef]
- Pankiewicz-Sperka, M.; Stańczyk, K.; Płaza, G. Assessment of the chemical, microbiological and toxicological aspects of post-processing water from underground coal gasification. Ecotoxicol. Environ. Saf. 2014, 108, 294–301. [Google Scholar] [CrossRef]
- Zhou, L.; Zhang, J. Study On Green Safety Production Technology In Modern Coal Mines. Fresenius Environ. Bull. 2020, 29, 2850–2857. [Google Scholar]
- Wiatowski, M.; Kapusta, K.; Stańczyk, K. Analysis and characteristics of tars collected during a pilot-scale underground coal gasification (UCG) trial. Fuel 2017, 208, 595–601. [Google Scholar] [CrossRef]
- Wiatowski, M.; Kapusta, K.; Muzyka, R. Study of properties of tar obtained from underground coal gasification trials. Fuel 2018, 228, 206–214. [Google Scholar] [CrossRef]
- Wiatowski, M.; Kapusta, K. Evolution of tar compounds in raw gas from a pilot-scale underground coal gasification (UCG) trial at Wieczorek mine in Poland. Fuel 2020, 276, 118070. [Google Scholar] [CrossRef]
- Grabowski, J.; Korczak, K.; Tokarz, A. Aquatic risk assessment based on the results of research on mine waters as a part of a pilot underground coal gasification process. Process Saf. Environ. Prot. 2021, 148, 548–558. [Google Scholar] [CrossRef]
- Mallett, C. Environmental controls for underground coal gasification. J. Power Energy 2018, 232, 47–55. [Google Scholar] [CrossRef]
- Klebingat, S.; Kempka, T.; Schulten, M.; Azzama, R.; Fernández-Steegera, T.M. Innovative thermodynamic underground coal gasification model for coupled synthesis gas quality and tar production analyses. Fuel 2016, 183, 680–686. [Google Scholar] [CrossRef] [Green Version]
- Klebingat, S.; Kempka, T.; Schulten, M.; Azzama, R.; Fernández-Steegera, T.M. Optimization of synthesis gas heating values and tar by-product yield in underground coal gasification. Fuel 2018, 229, 248–261. [Google Scholar] [CrossRef]
- Soukup, K.; Hejtmánek, V.; Čapek, P. Modeling of contaminant migration through porous media after underground coal gasification in shallow coal seam. Fuel Process. Technol. 2015, 140, 188–197. [Google Scholar] [CrossRef]
- Liu, S.; Zhou, R.; Zeng, Y.; Zhao, J.; Hu, J.; Chen, F. Formation and characteristics of tar from underground coal gasification. J. China Univ. Min. Technol. 2013, 42, 271–277. [Google Scholar]
- Wang, Z.; Cao, J.; Jiang, S.; Li, Y.; Liang, J. Characteristics of tar composition and content in Tianjin Jinghai underground coal gasification. Coal Eng. 2017, 49, 32–35. [Google Scholar]
- Feng, L.; Wu, Y.; Xu, K.; Zhang, H.; Zhang, Y.; Zhang, M. Coal-Derived Soot Behaviors In O2/N2 And O2/Co2 Atmosphere Through 1-D Transient Coal Combustion Model. Energy Fuels 2019, 33, 3620–3629. [Google Scholar] [CrossRef]


| Moisture (Mad) | Ash Content (Aad) | Volatile Matter (Vad) | Fixed Carbon (FCad) |
|---|---|---|---|
| 14.22 | 6.45 | 24.44 | 54.89 |
| Reaction Zone | Outlet | ||
|---|---|---|---|
| Name | Percentage | Name | Percentage |
| Naphthalene | 8.9% | Naphthalene | 15.3% |
| Pyrene | 6.2% | 1-Methylnaphthalene | 15.2% |
| 1-Methylnaphthalene | 5.8% | Toluene | 14.7% |
| Fluorene | 5.3% | 3-Ethynyltoluene | 7.8% |
| Phenanthrene | 4.4% | 2-Methylnaphthalene | 5.5% |
| Acenaphthylene | 4.3% | 2,2′-Methylenebis(6-tert-butyl-4-Methylphenol) | 4.9% |
| Benzo(c)fluorene | 4.0% | 1-Hydroxycyclohexyl phenyl ketone | 3.9% |
| 2-Methylanthracene | 3.6% | M-Xylene | 3.5% |
| P-Cresol | 2.8% | Styrene | 2.5% |
| 1,7-Dimethylnaphthalene | 2.8% | 3,5-di-tert-butylphenol | 1.7% |
Publisher’s Note: MDPI stays neutral with regard to jurisdictional claims in published maps and institutional affiliations. |
© 2021 by the authors. Licensee MDPI, Basel, Switzerland. This article is an open access article distributed under the terms and conditions of the Creative Commons Attribution (CC BY) license (https://creativecommons.org/licenses/by/4.0/).
Share and Cite
Feng, L.; Dong, M.; Wu, Y.; Gu, J. Comparison of Tar Samples from Reaction Zone and Outlet in Ex-Situ Underground Coal Gasification Experiment. Energies 2021, 14, 8570. https://doi.org/10.3390/en14248570
Feng L, Dong M, Wu Y, Gu J. Comparison of Tar Samples from Reaction Zone and Outlet in Ex-Situ Underground Coal Gasification Experiment. Energies. 2021; 14(24):8570. https://doi.org/10.3390/en14248570
Chicago/Turabian StyleFeng, Lele, Maifan Dong, Yuxin Wu, and Junping Gu. 2021. "Comparison of Tar Samples from Reaction Zone and Outlet in Ex-Situ Underground Coal Gasification Experiment" Energies 14, no. 24: 8570. https://doi.org/10.3390/en14248570
APA StyleFeng, L., Dong, M., Wu, Y., & Gu, J. (2021). Comparison of Tar Samples from Reaction Zone and Outlet in Ex-Situ Underground Coal Gasification Experiment. Energies, 14(24), 8570. https://doi.org/10.3390/en14248570