
Physicochemical Analysis of the Particulate Matter Emitted from Road Vehicle Engines

 ,
, 
 ,
,
Abstract
:1. Introduction
- Very small amount of the compounds that are at the limit of the detection of the known nowadays techniques (e.g., benzo(a)pyrene present at PM2.5 was found equal to 15.4 ng/m3 per year in the Polish city of Katowice).
- Many factors influence human health, and it is extremely hard (even impossible) to prove that the higher level of some particular compound is dangerous.
- Because of the small amount of PM, the measurements are performed in the long term. Most often, the chemical composition of PM is assessed in the measurements at least collected in a day, mostly one month, or year. Thus, most often, the concrete hazardous compound present in PM can be assessed in the long term, and what is important for the risk for human is the time of exposure that is extremely (not possible) to assess as it will be very variable and dependent on many factors (e.g., weather, humidity).
2. Materials and Methods
2.1. Test Engine, Fuels, Operating Schedule
2.2. Apparatus and Procedures
2.2.1. PM Emissions
2.2.2. Fourier Transform Infrared Spectroscopy (FTIR)
2.2.3. Scanning Electron Microscope with Energy Dispersive Spectroscopy (SEM-EDS)
2.2.4. Evolved Gas Analysis (EGA)
3. Results
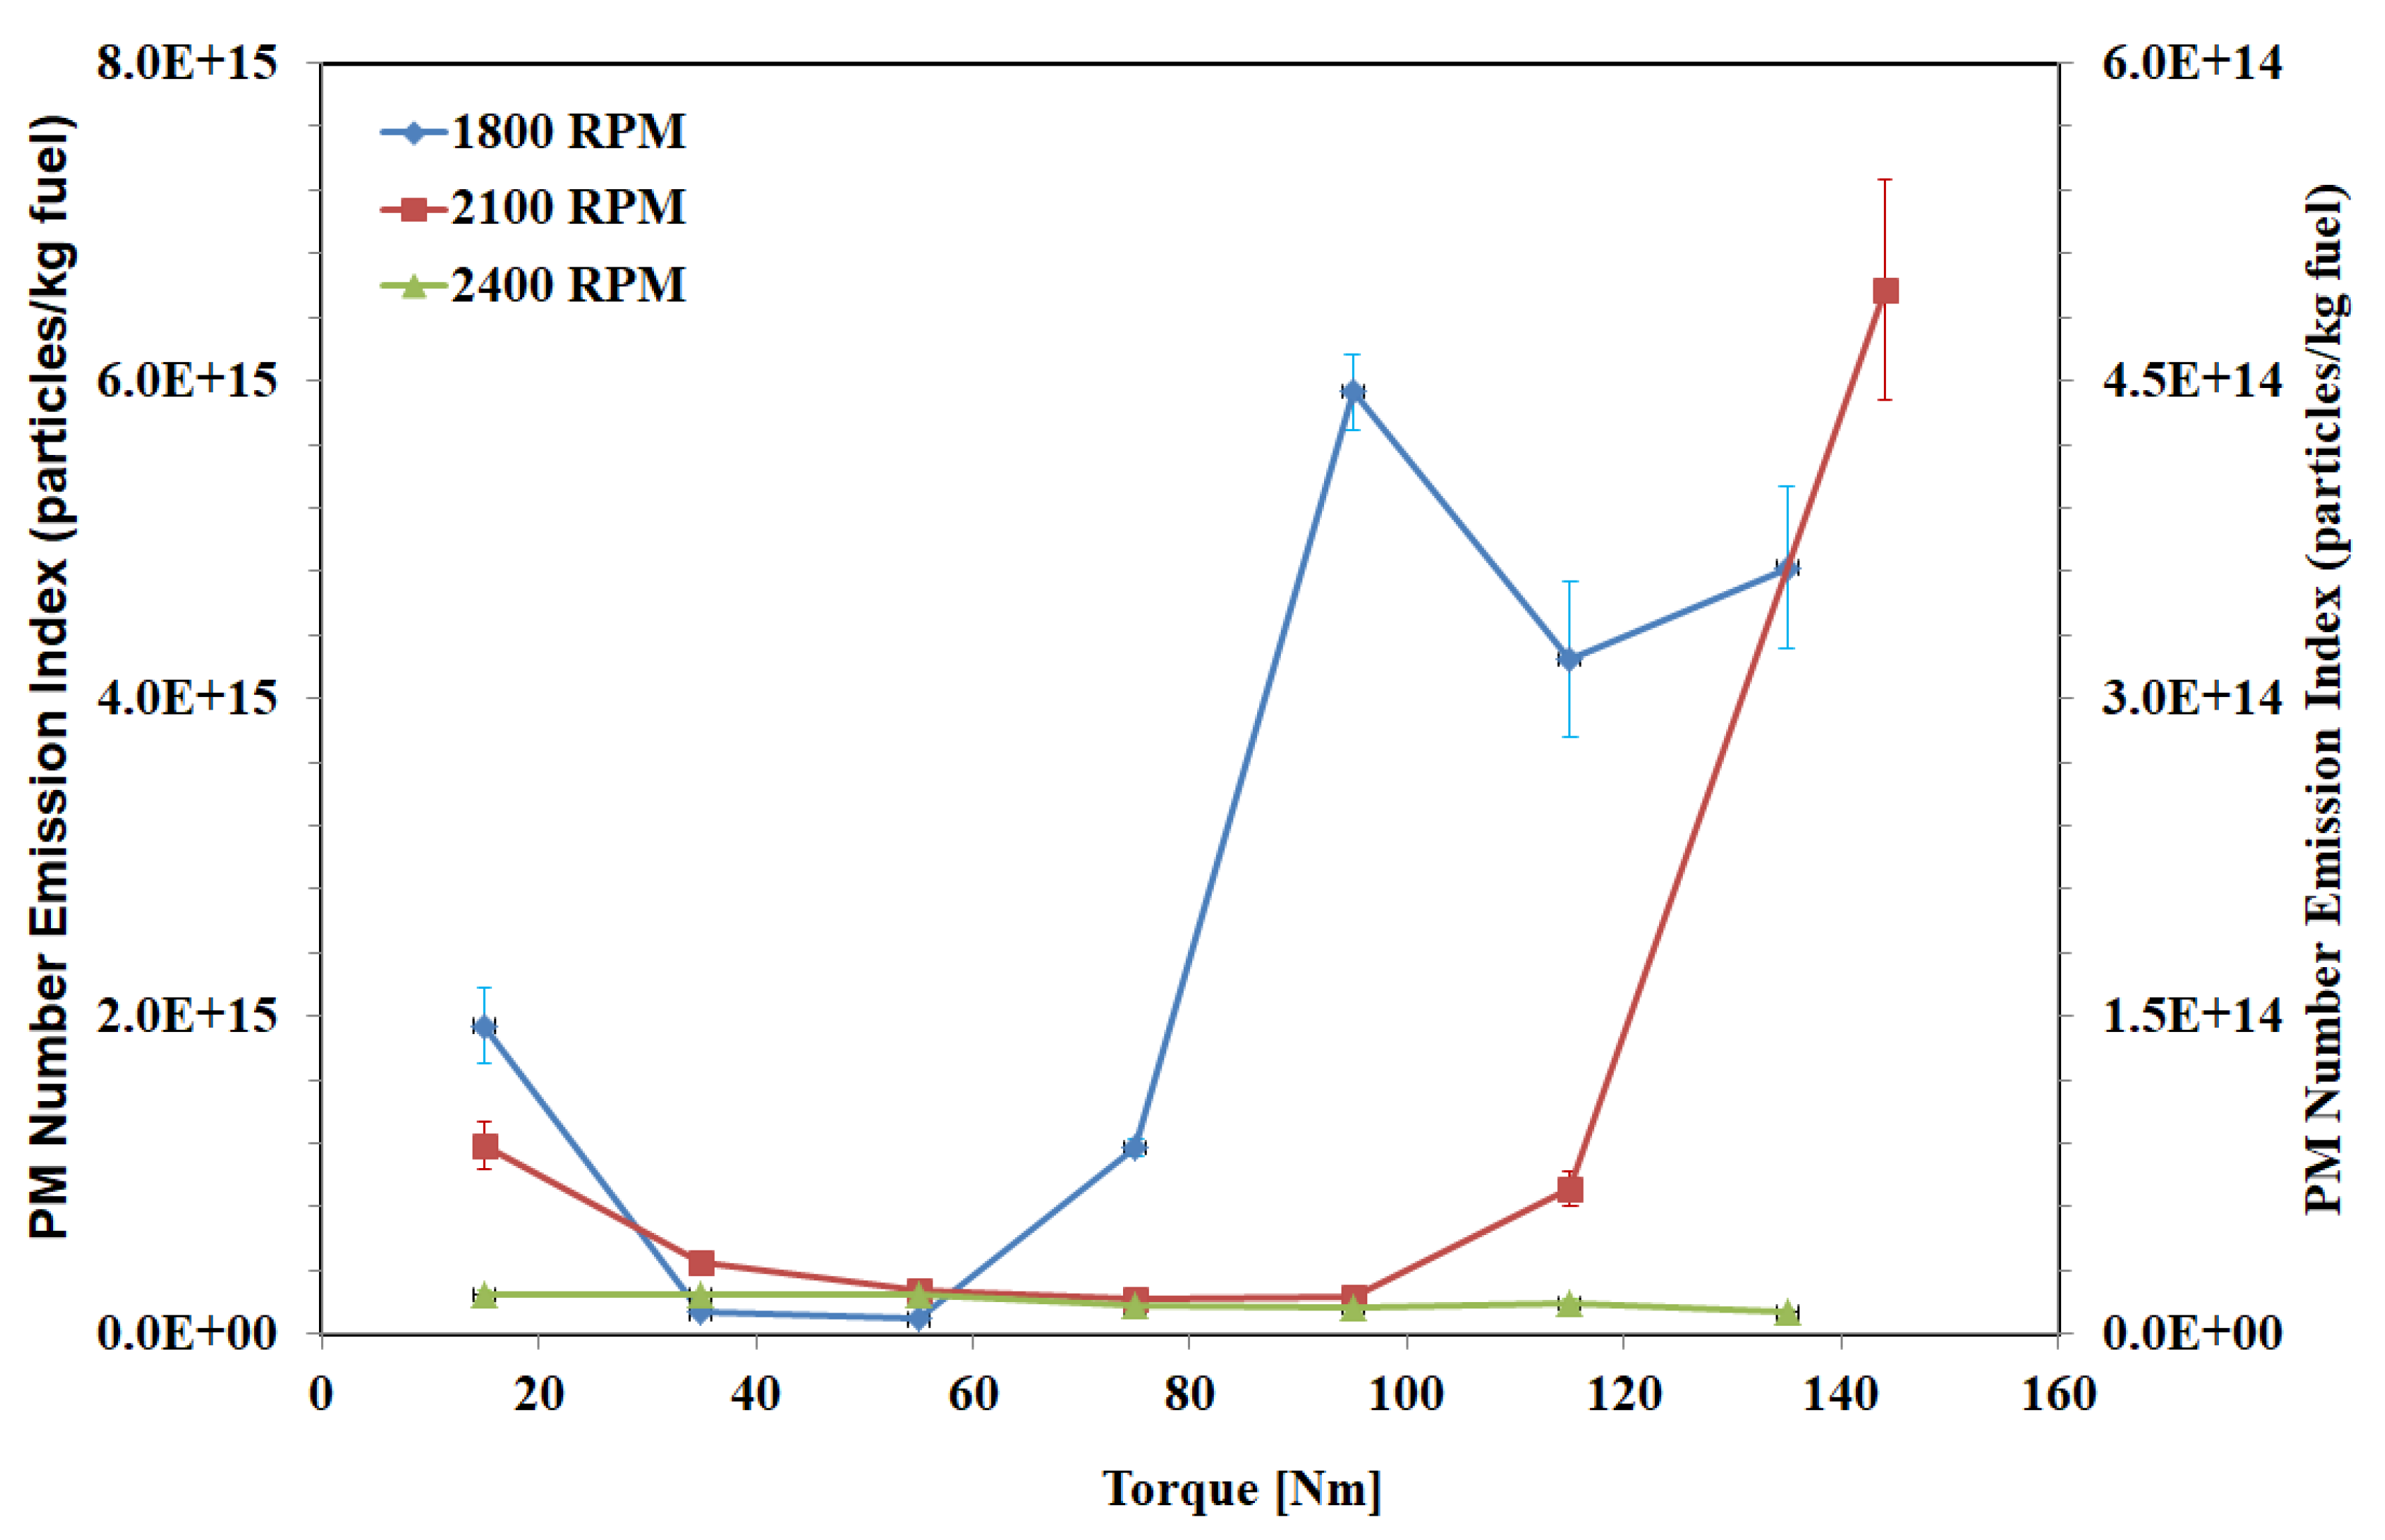
3.1. Particle Number Emission Indices
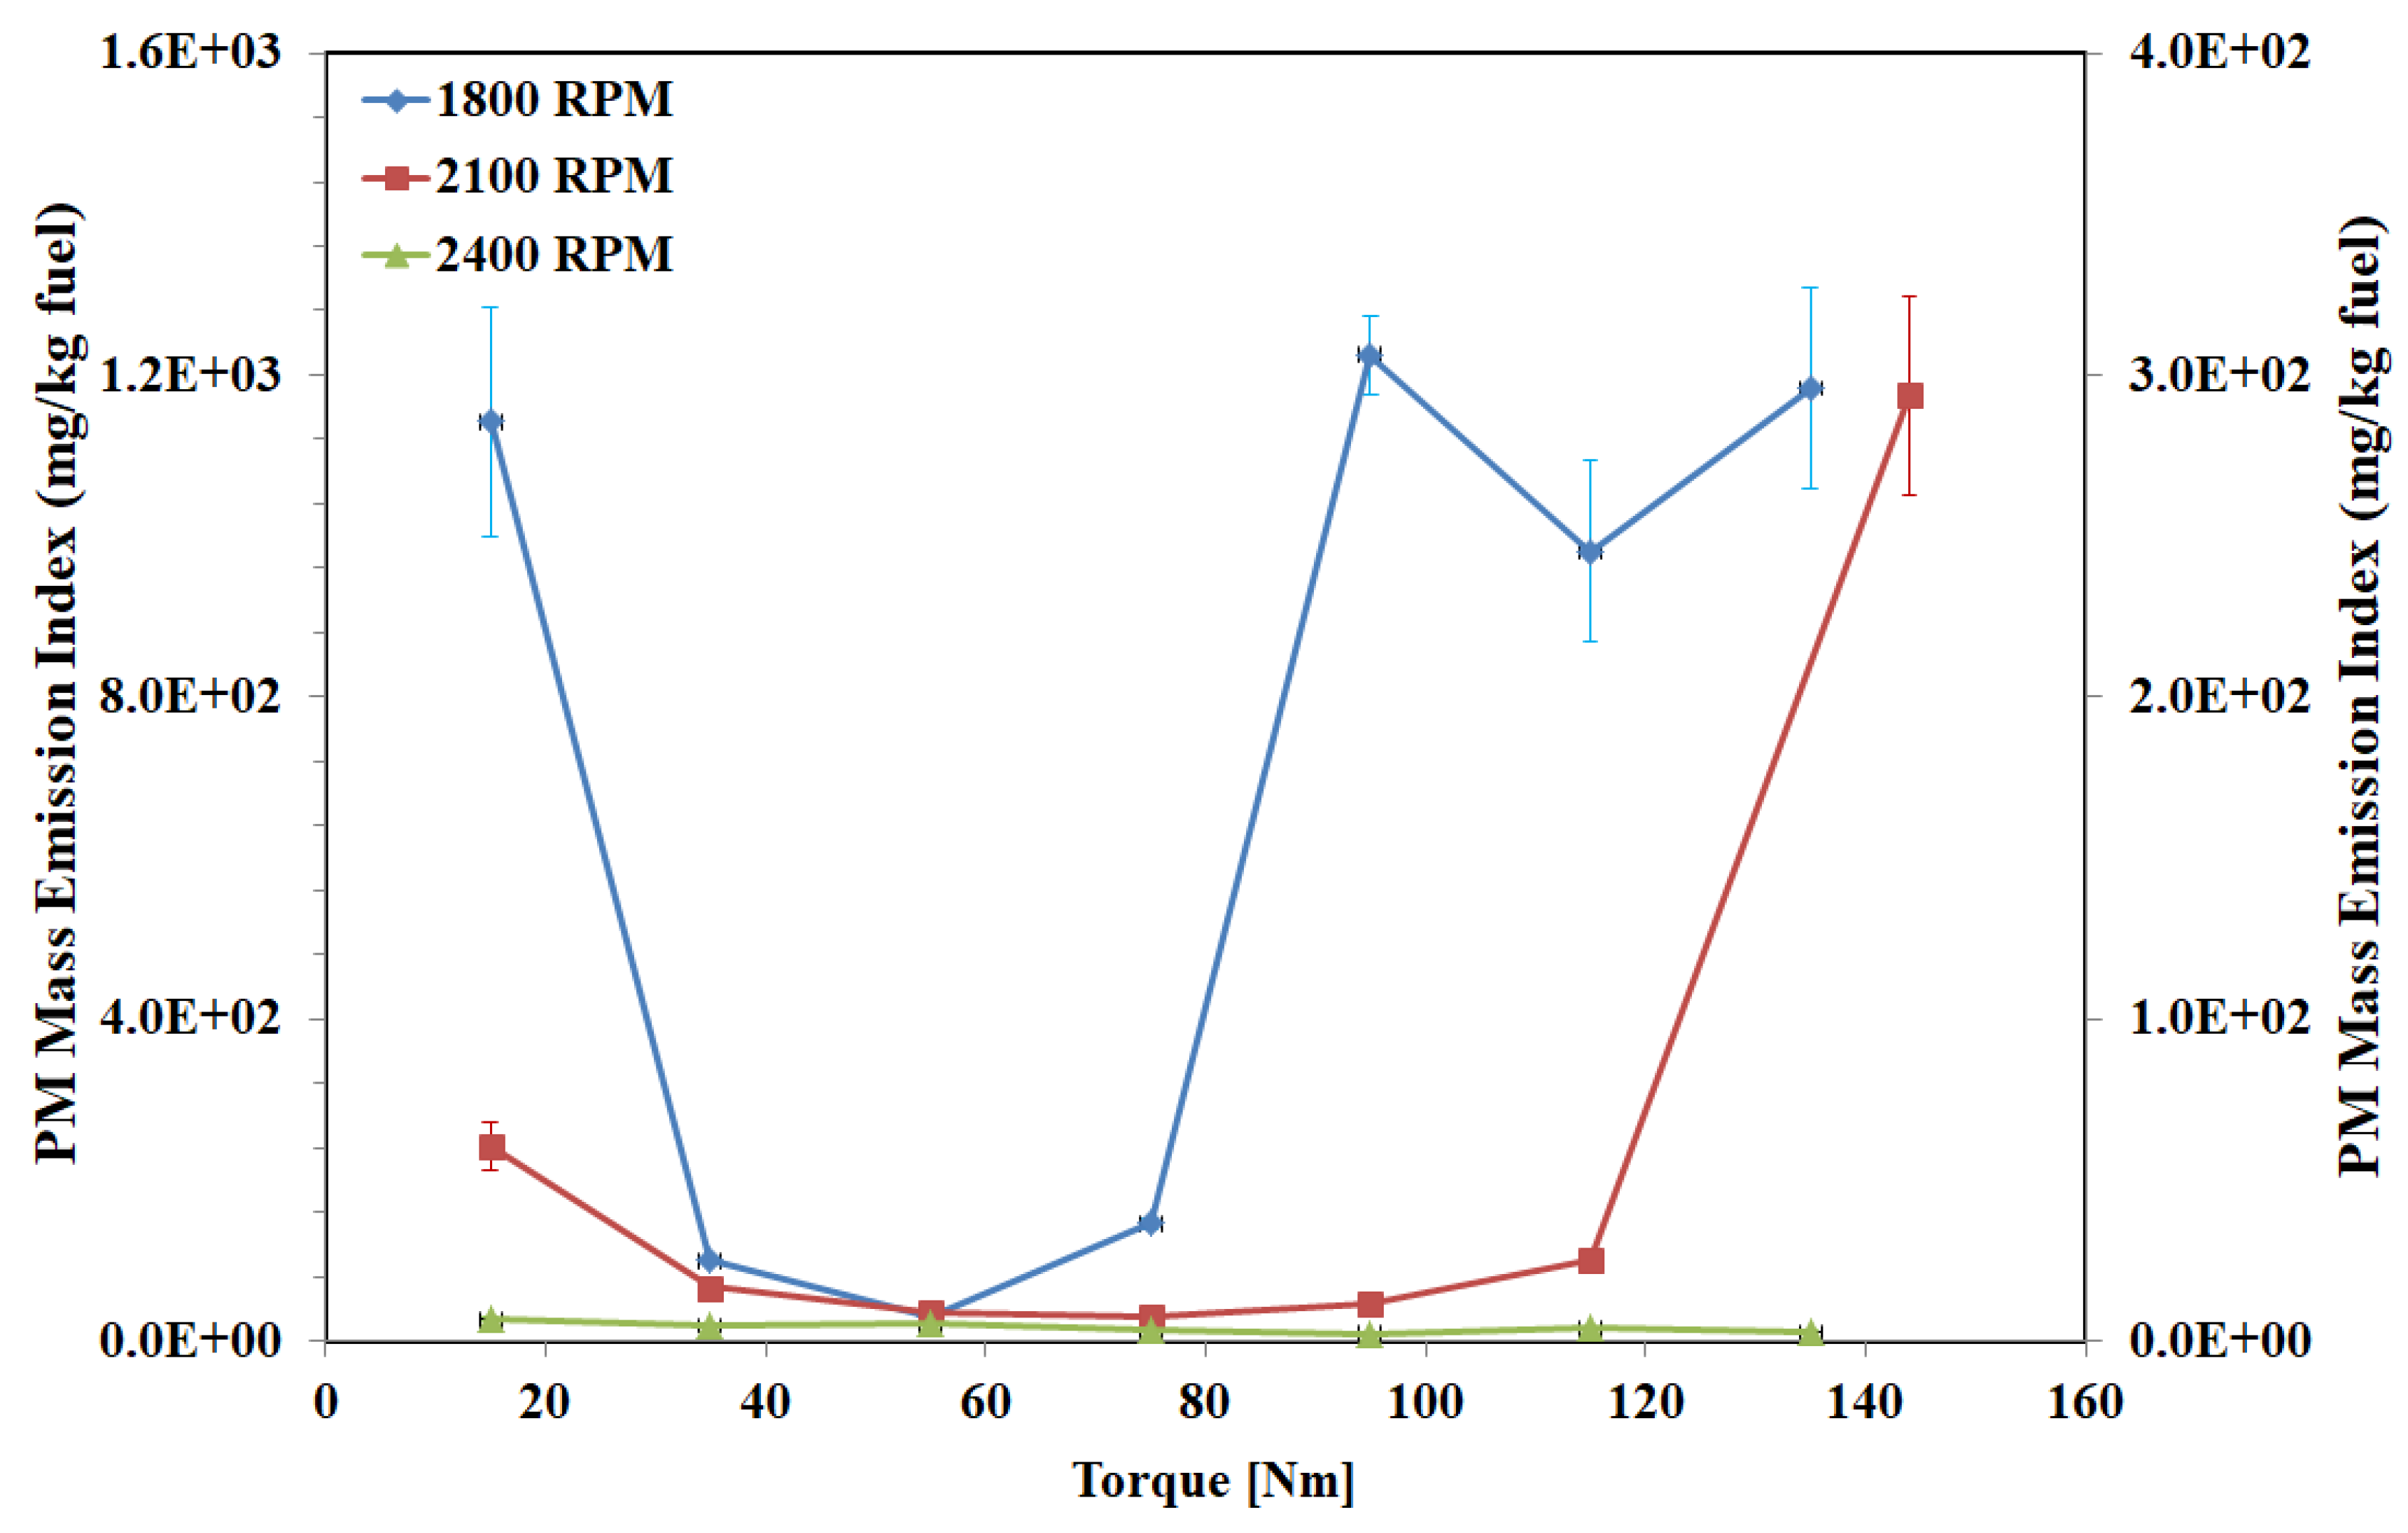
3.2. PM Mass Emission Indices
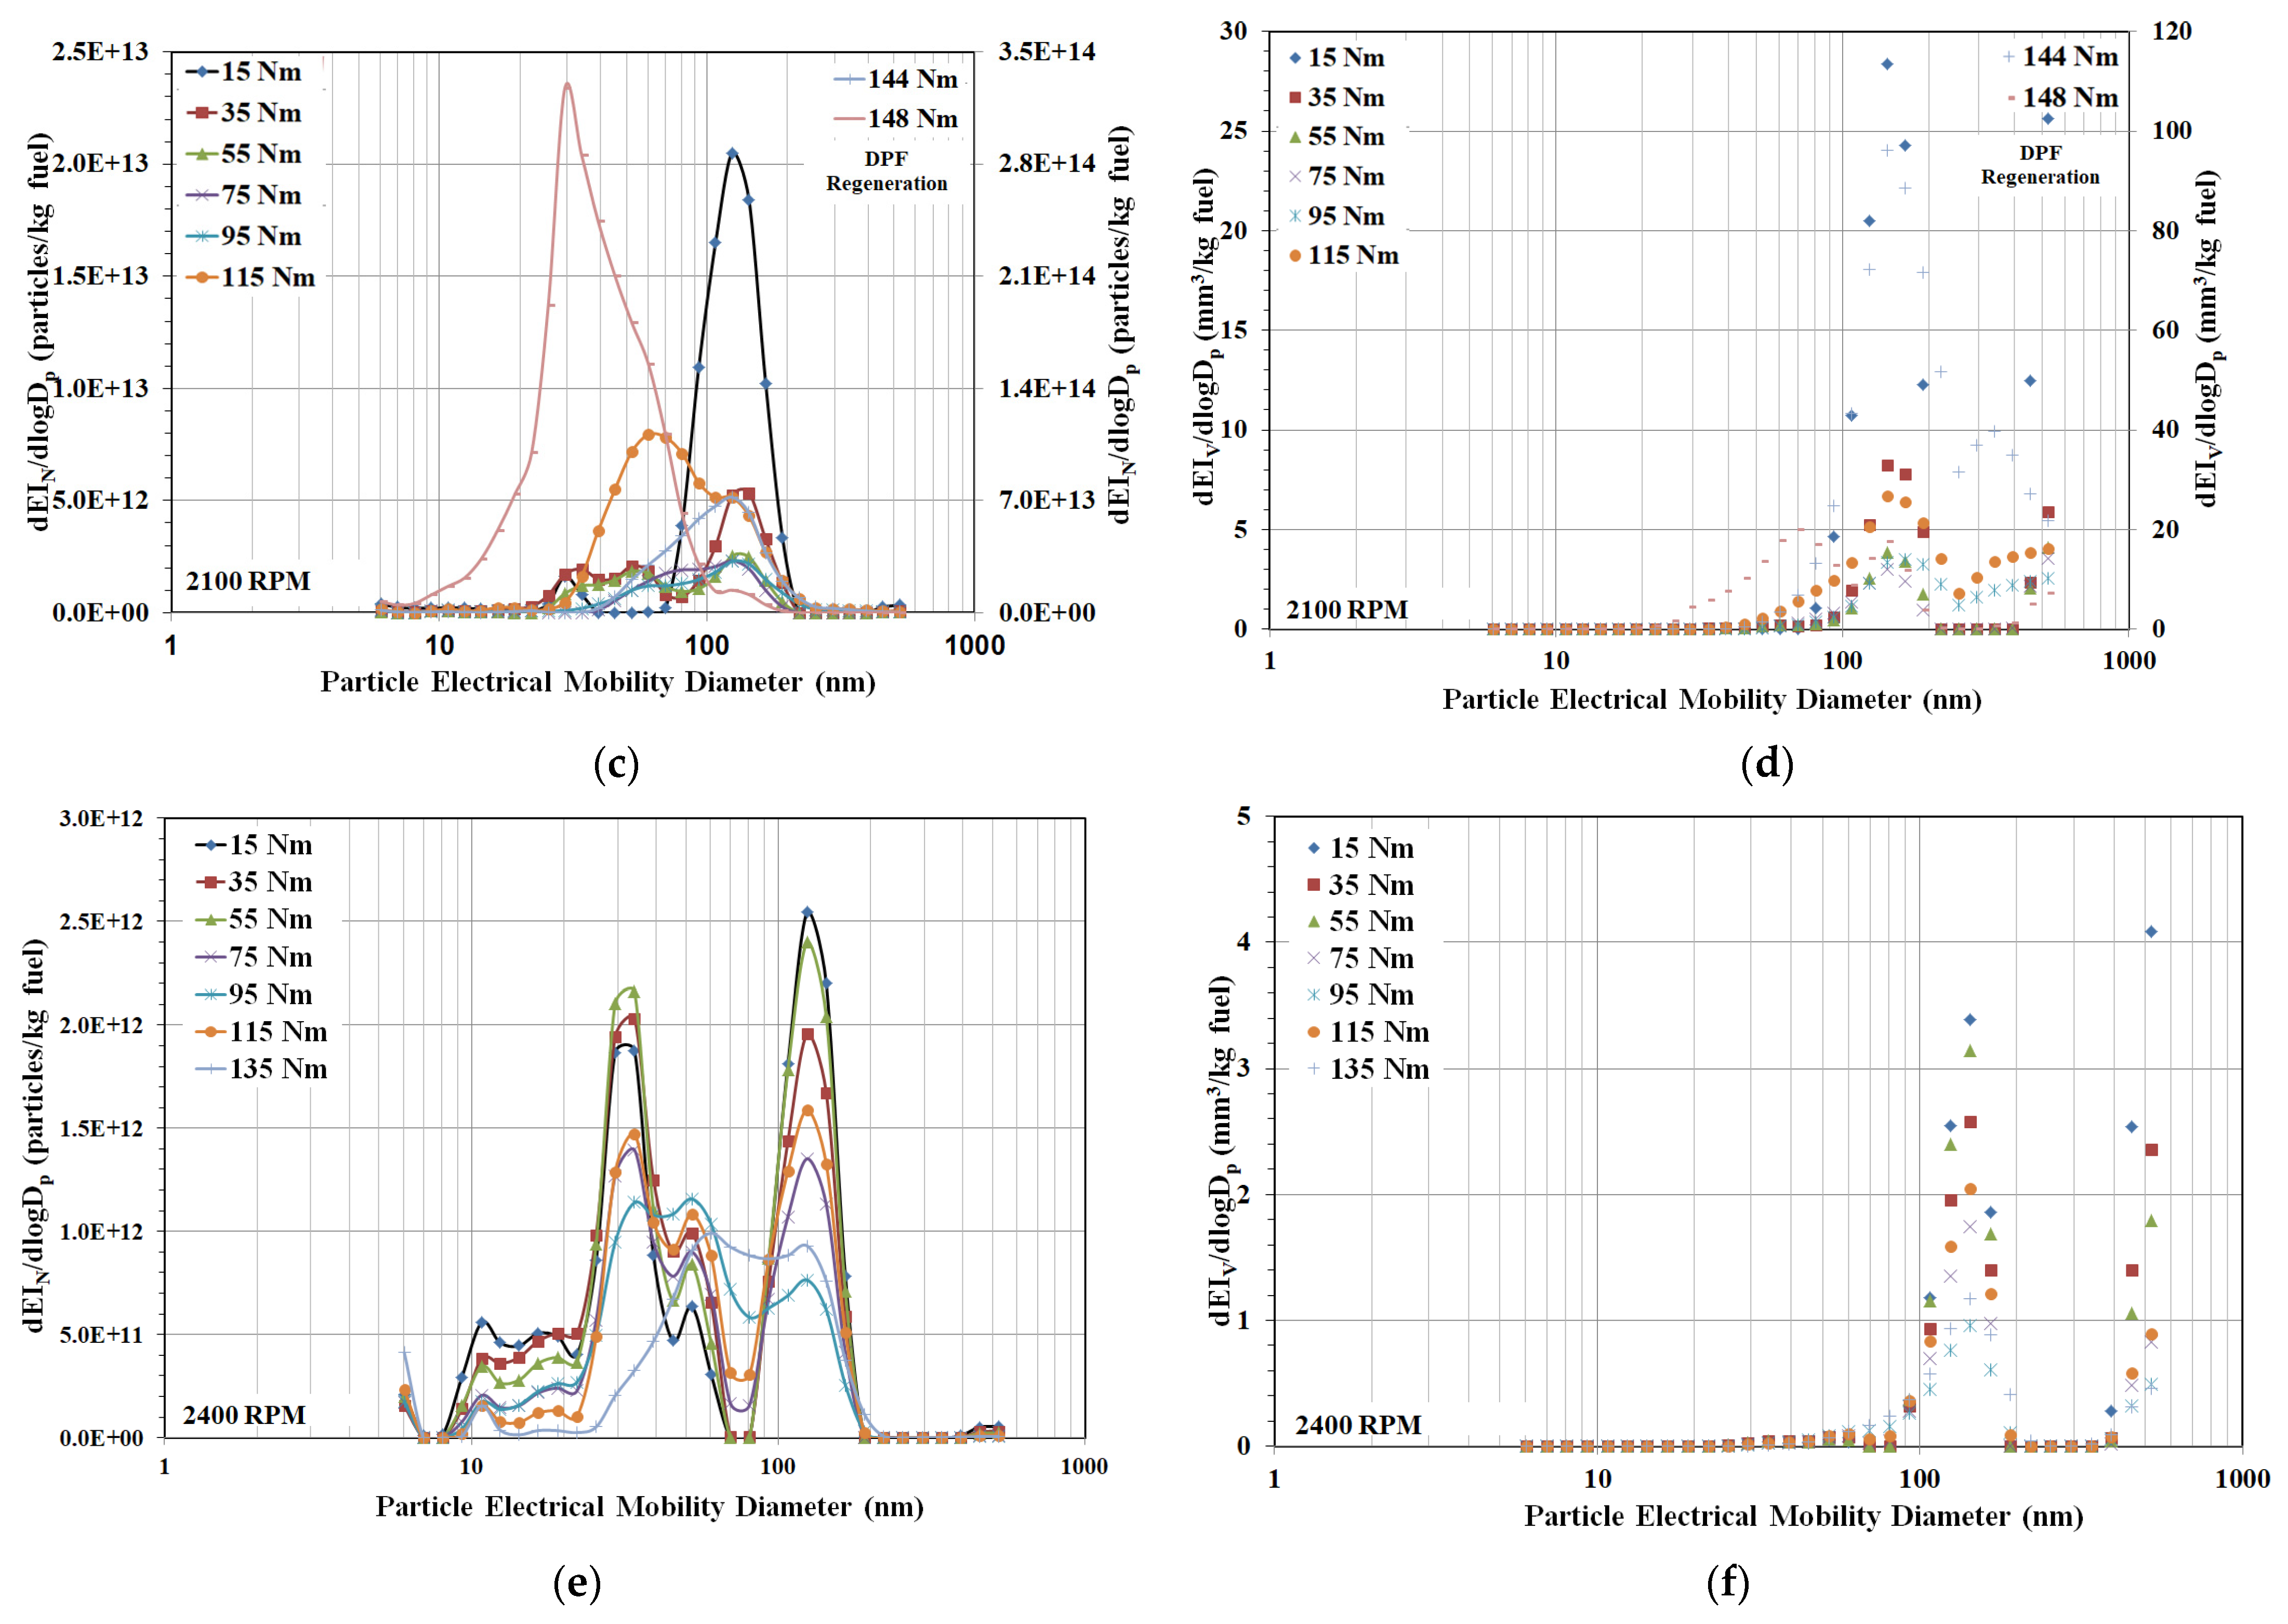
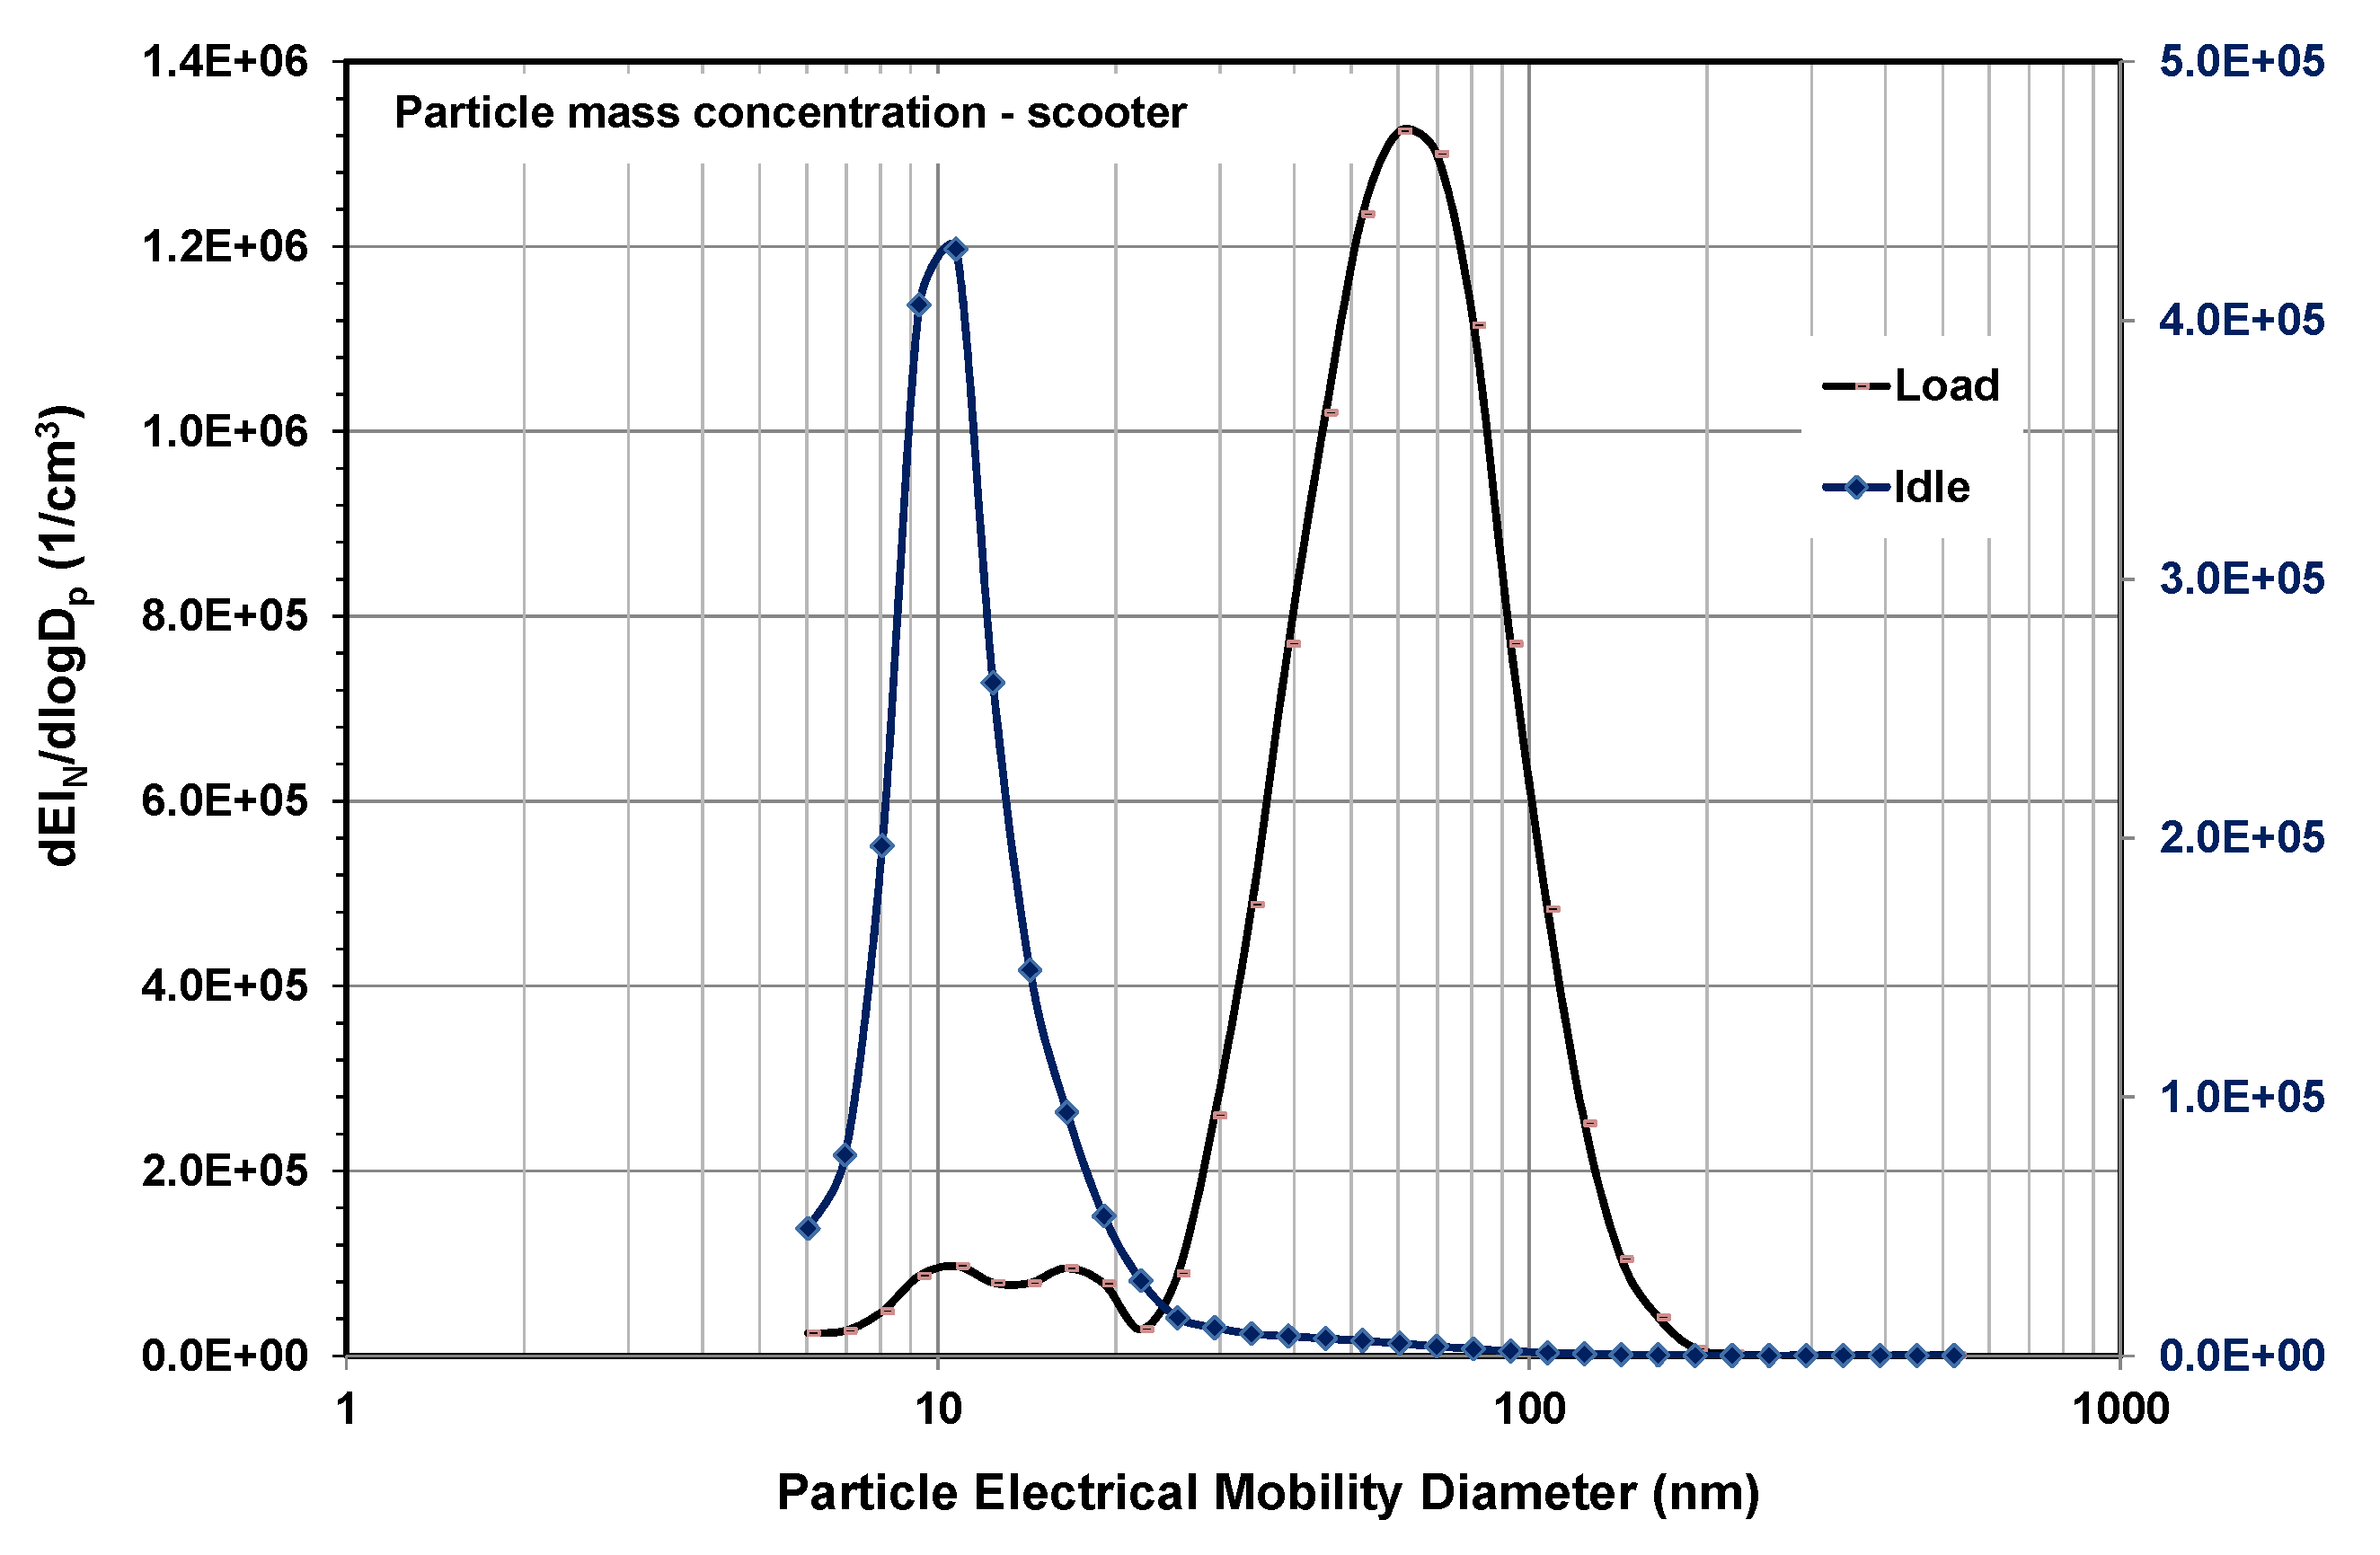
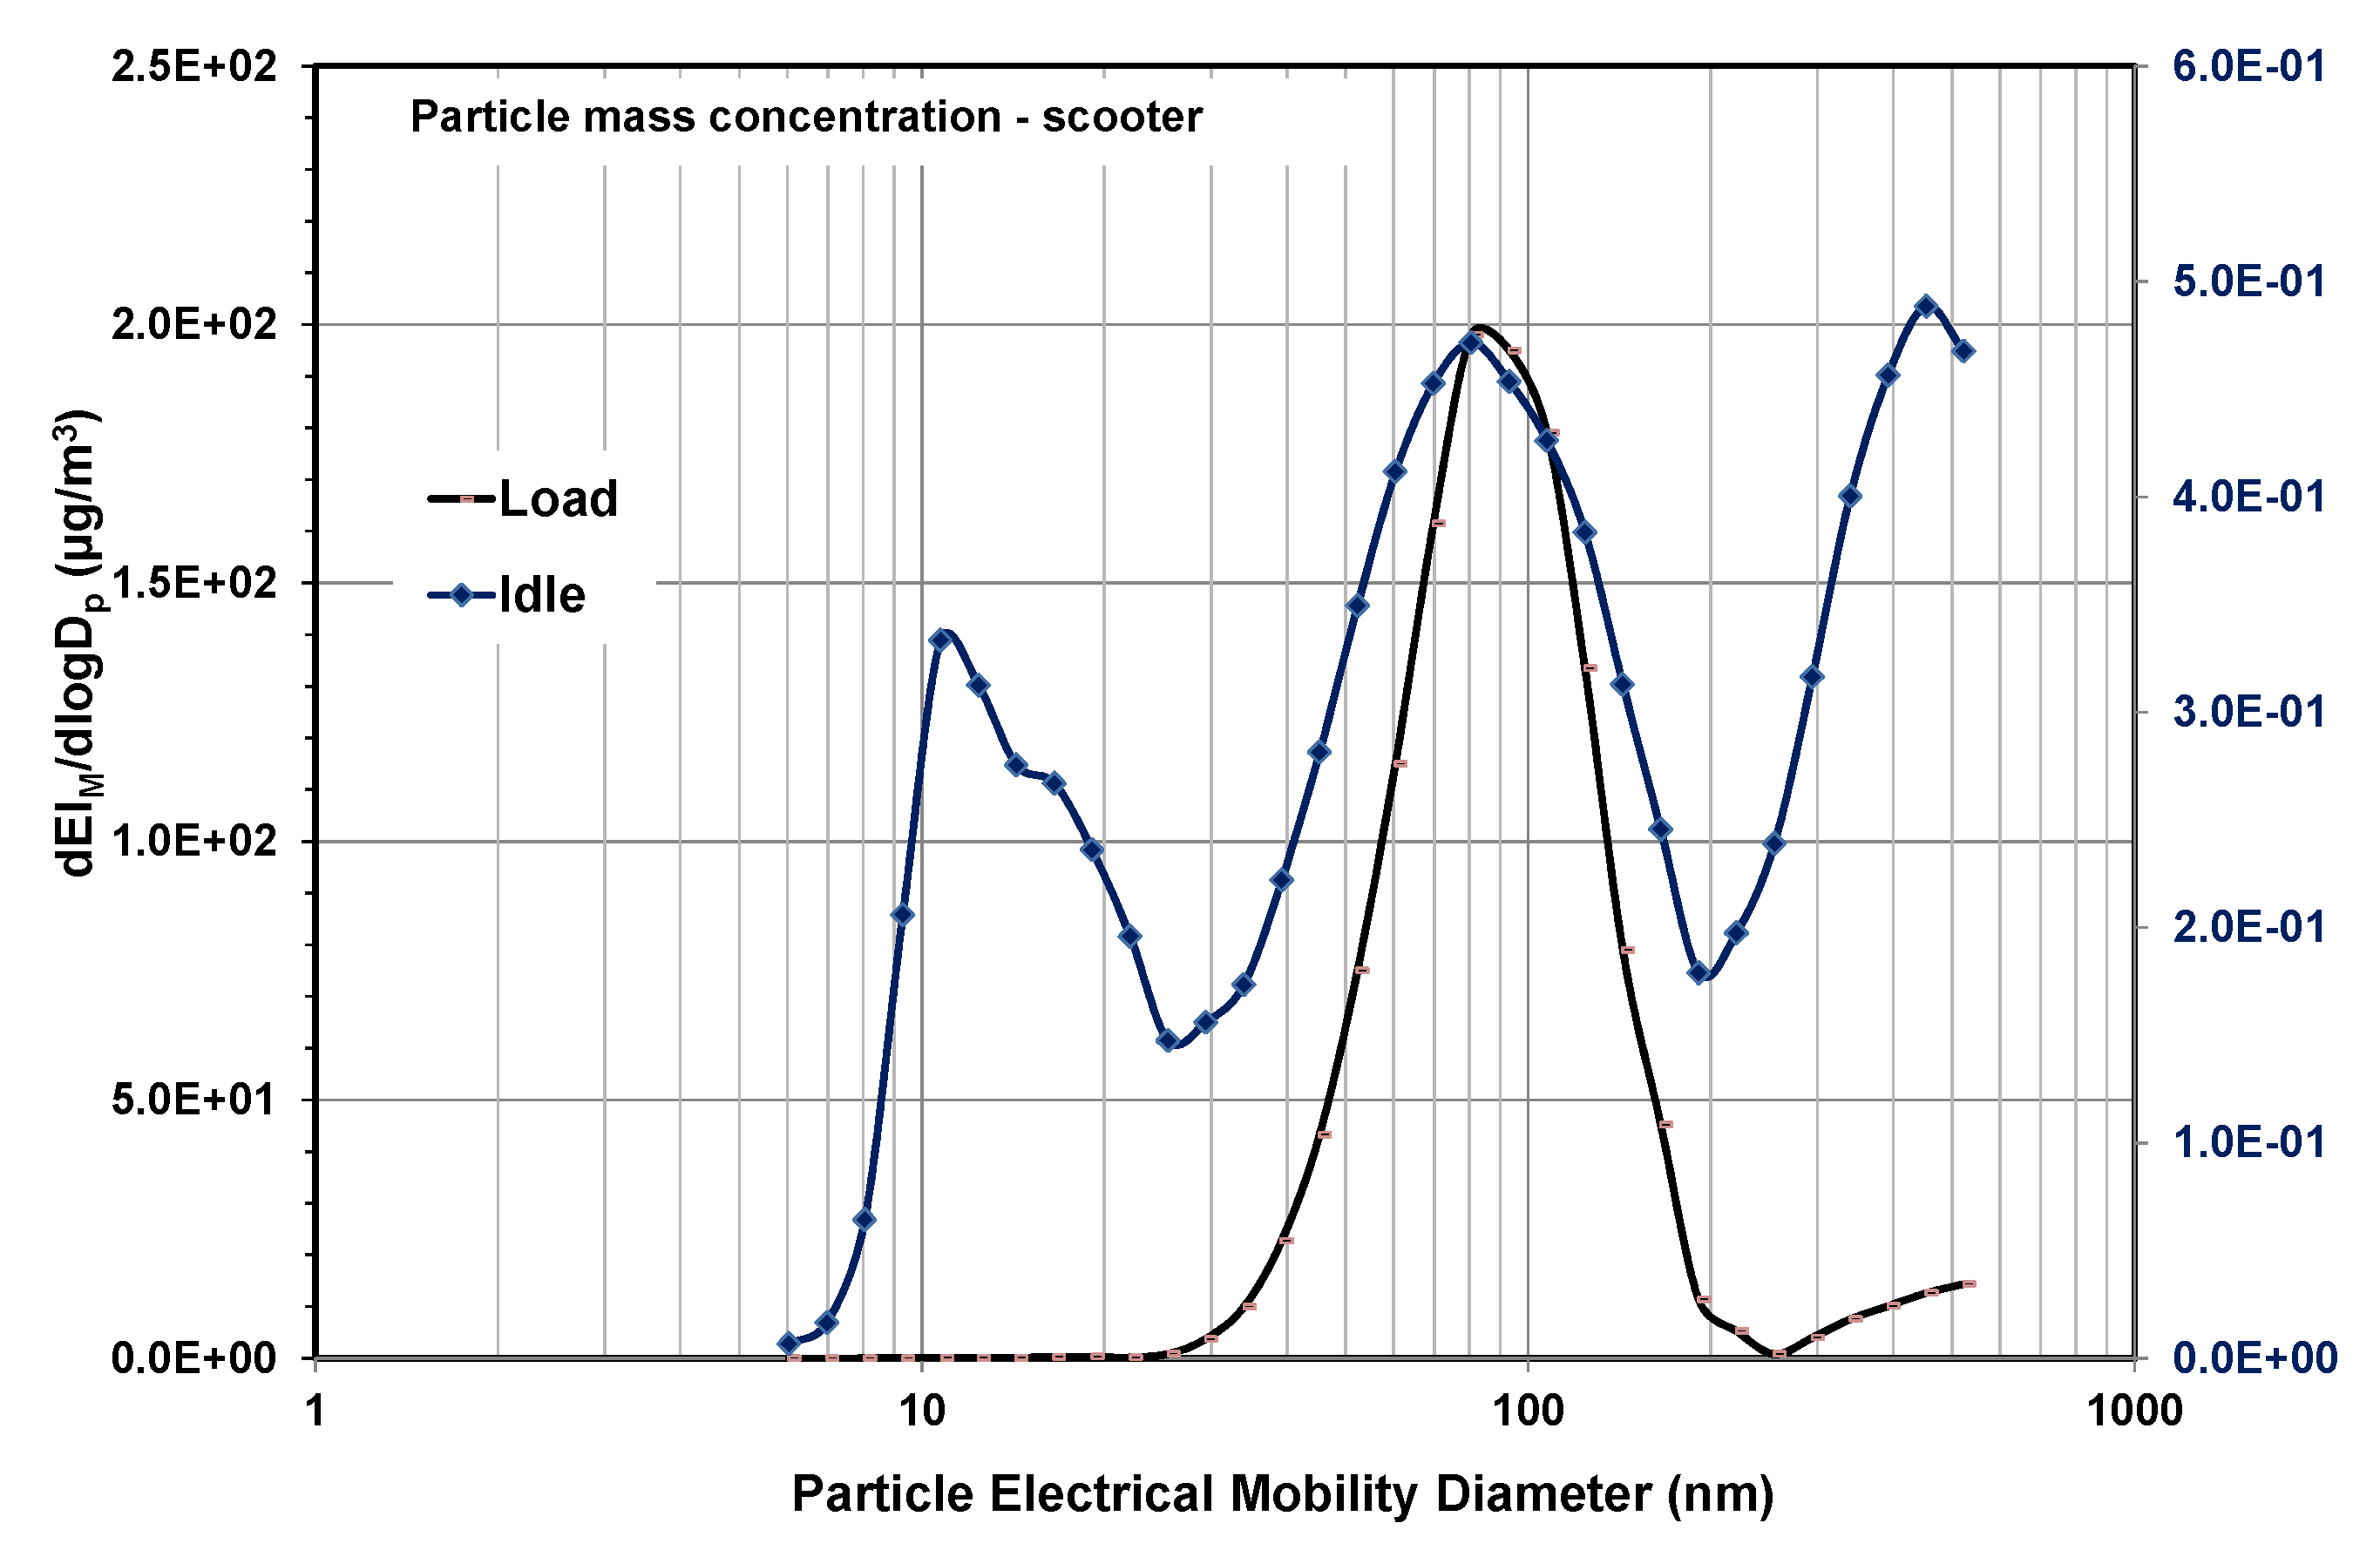
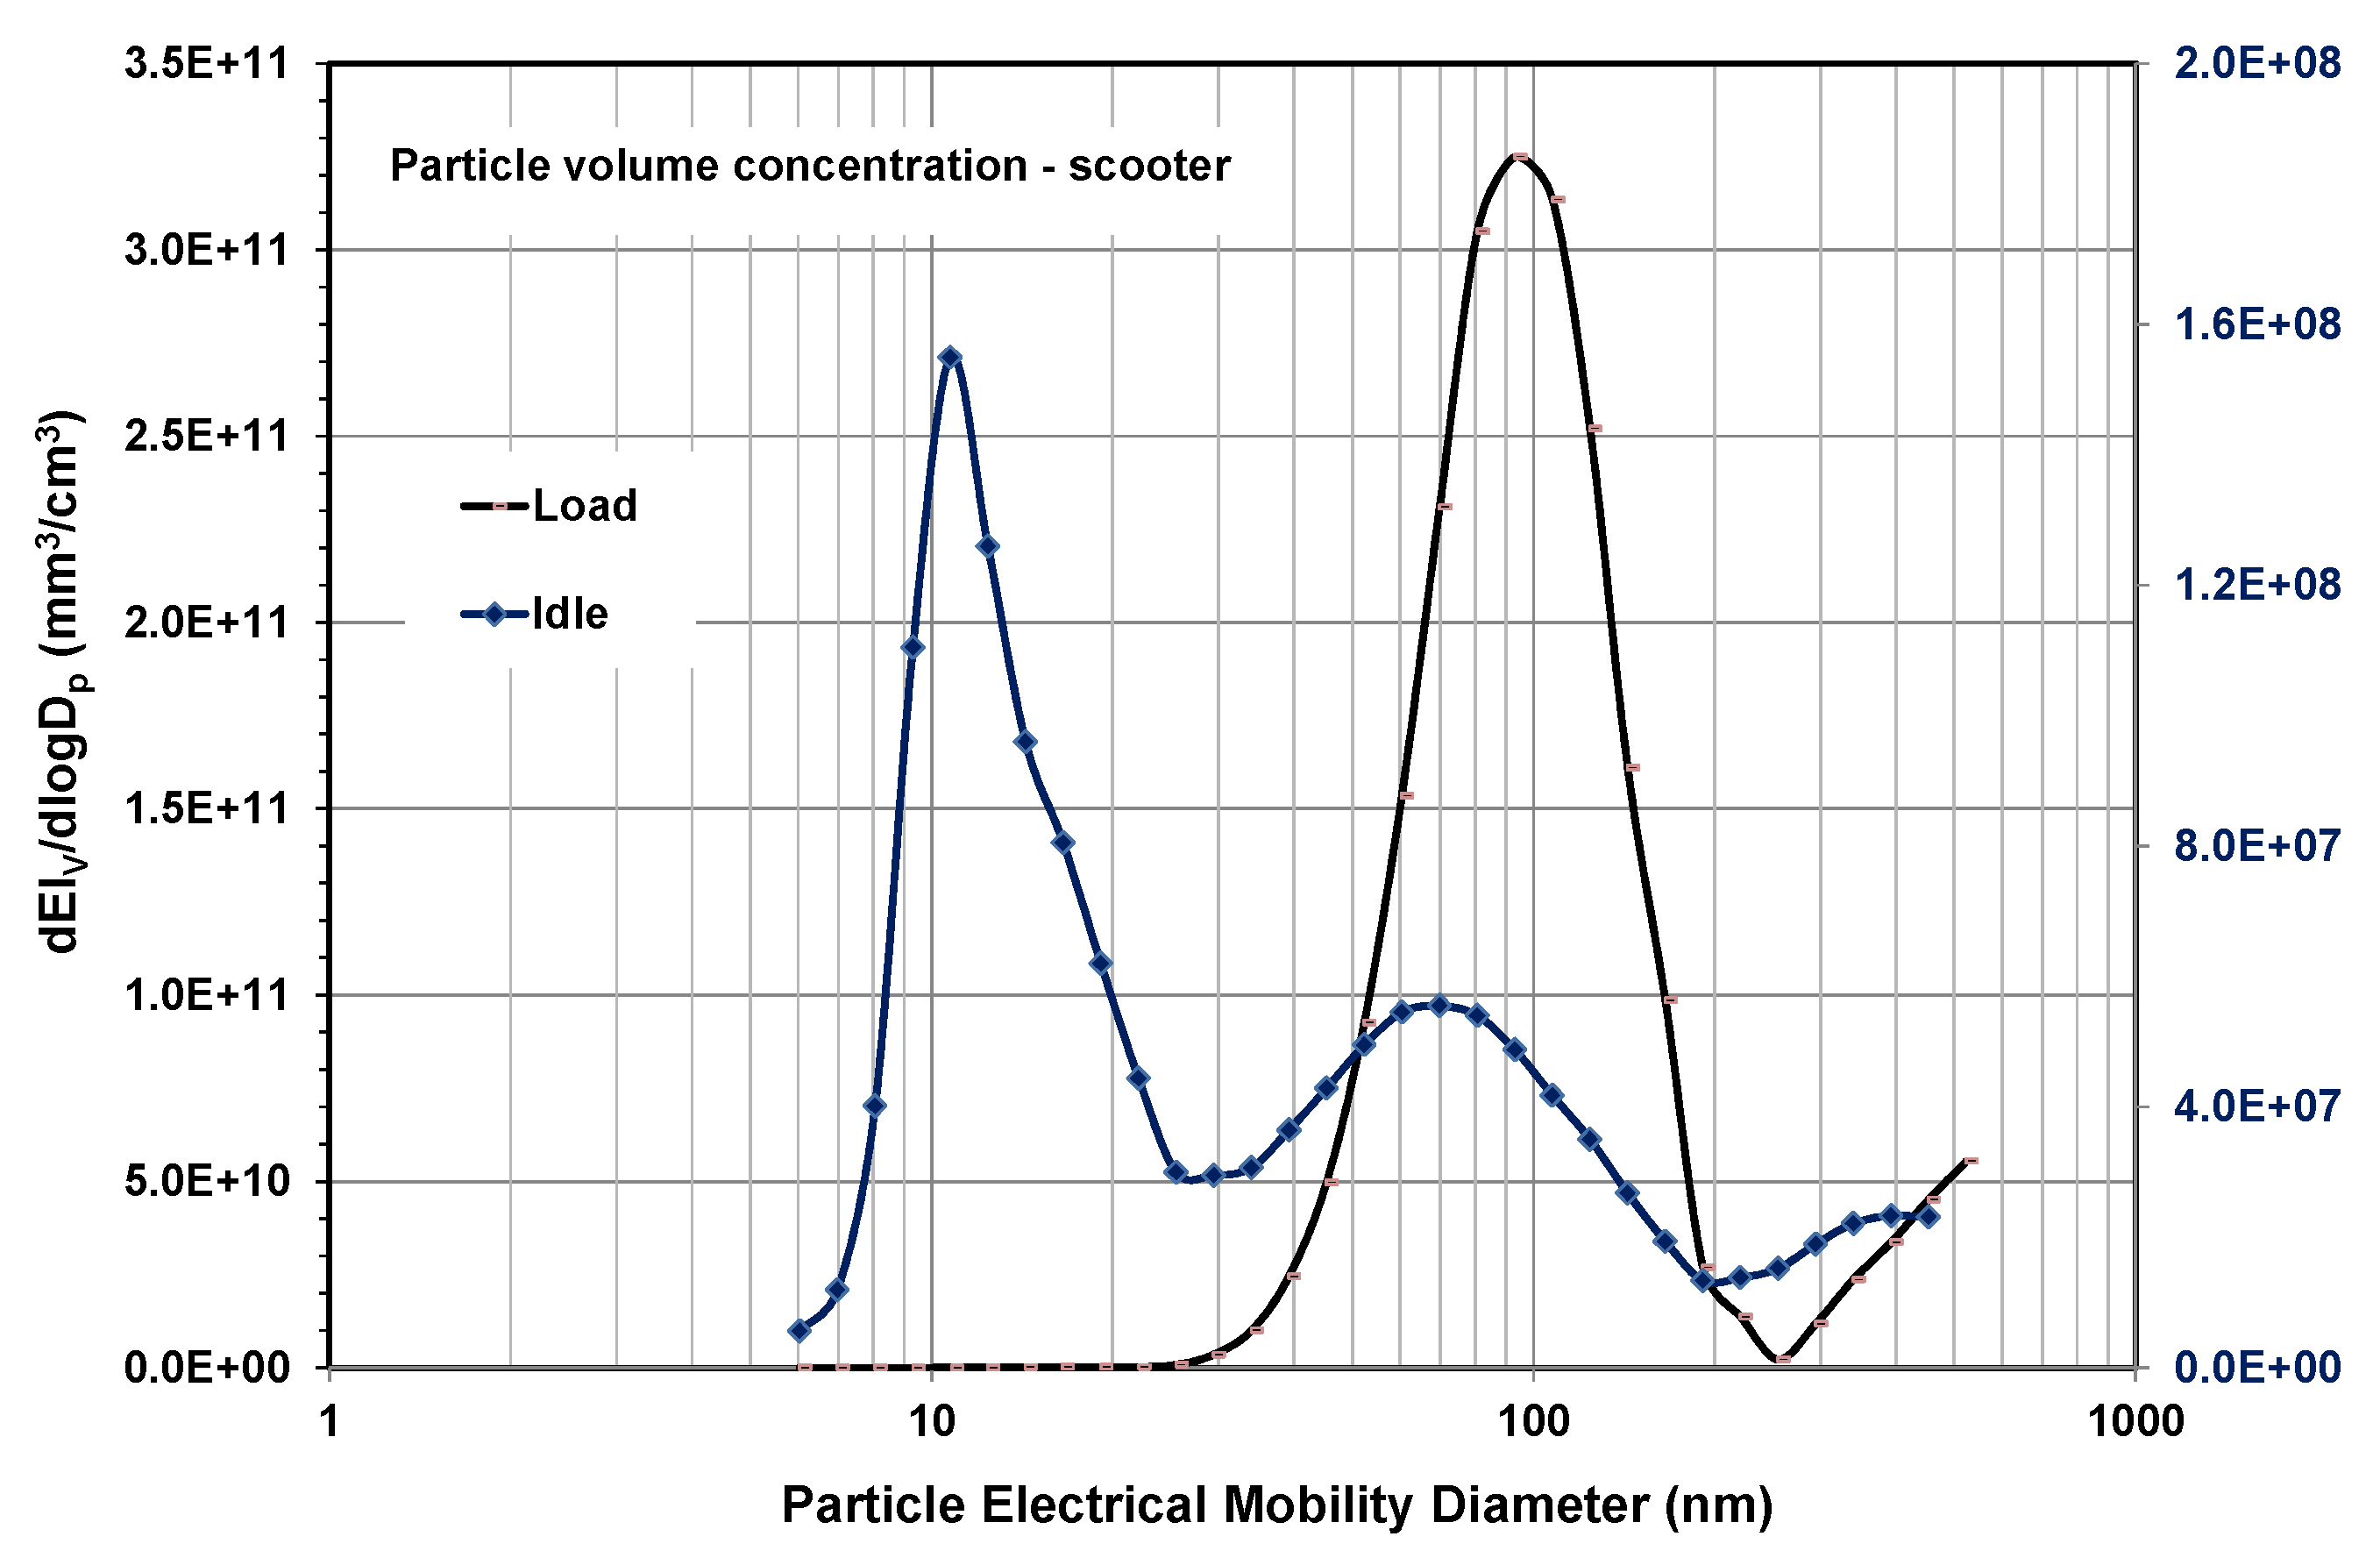
3.3. Particle Size Distribution
3.4. FTIR ATR of PM Adsorbed on Filter
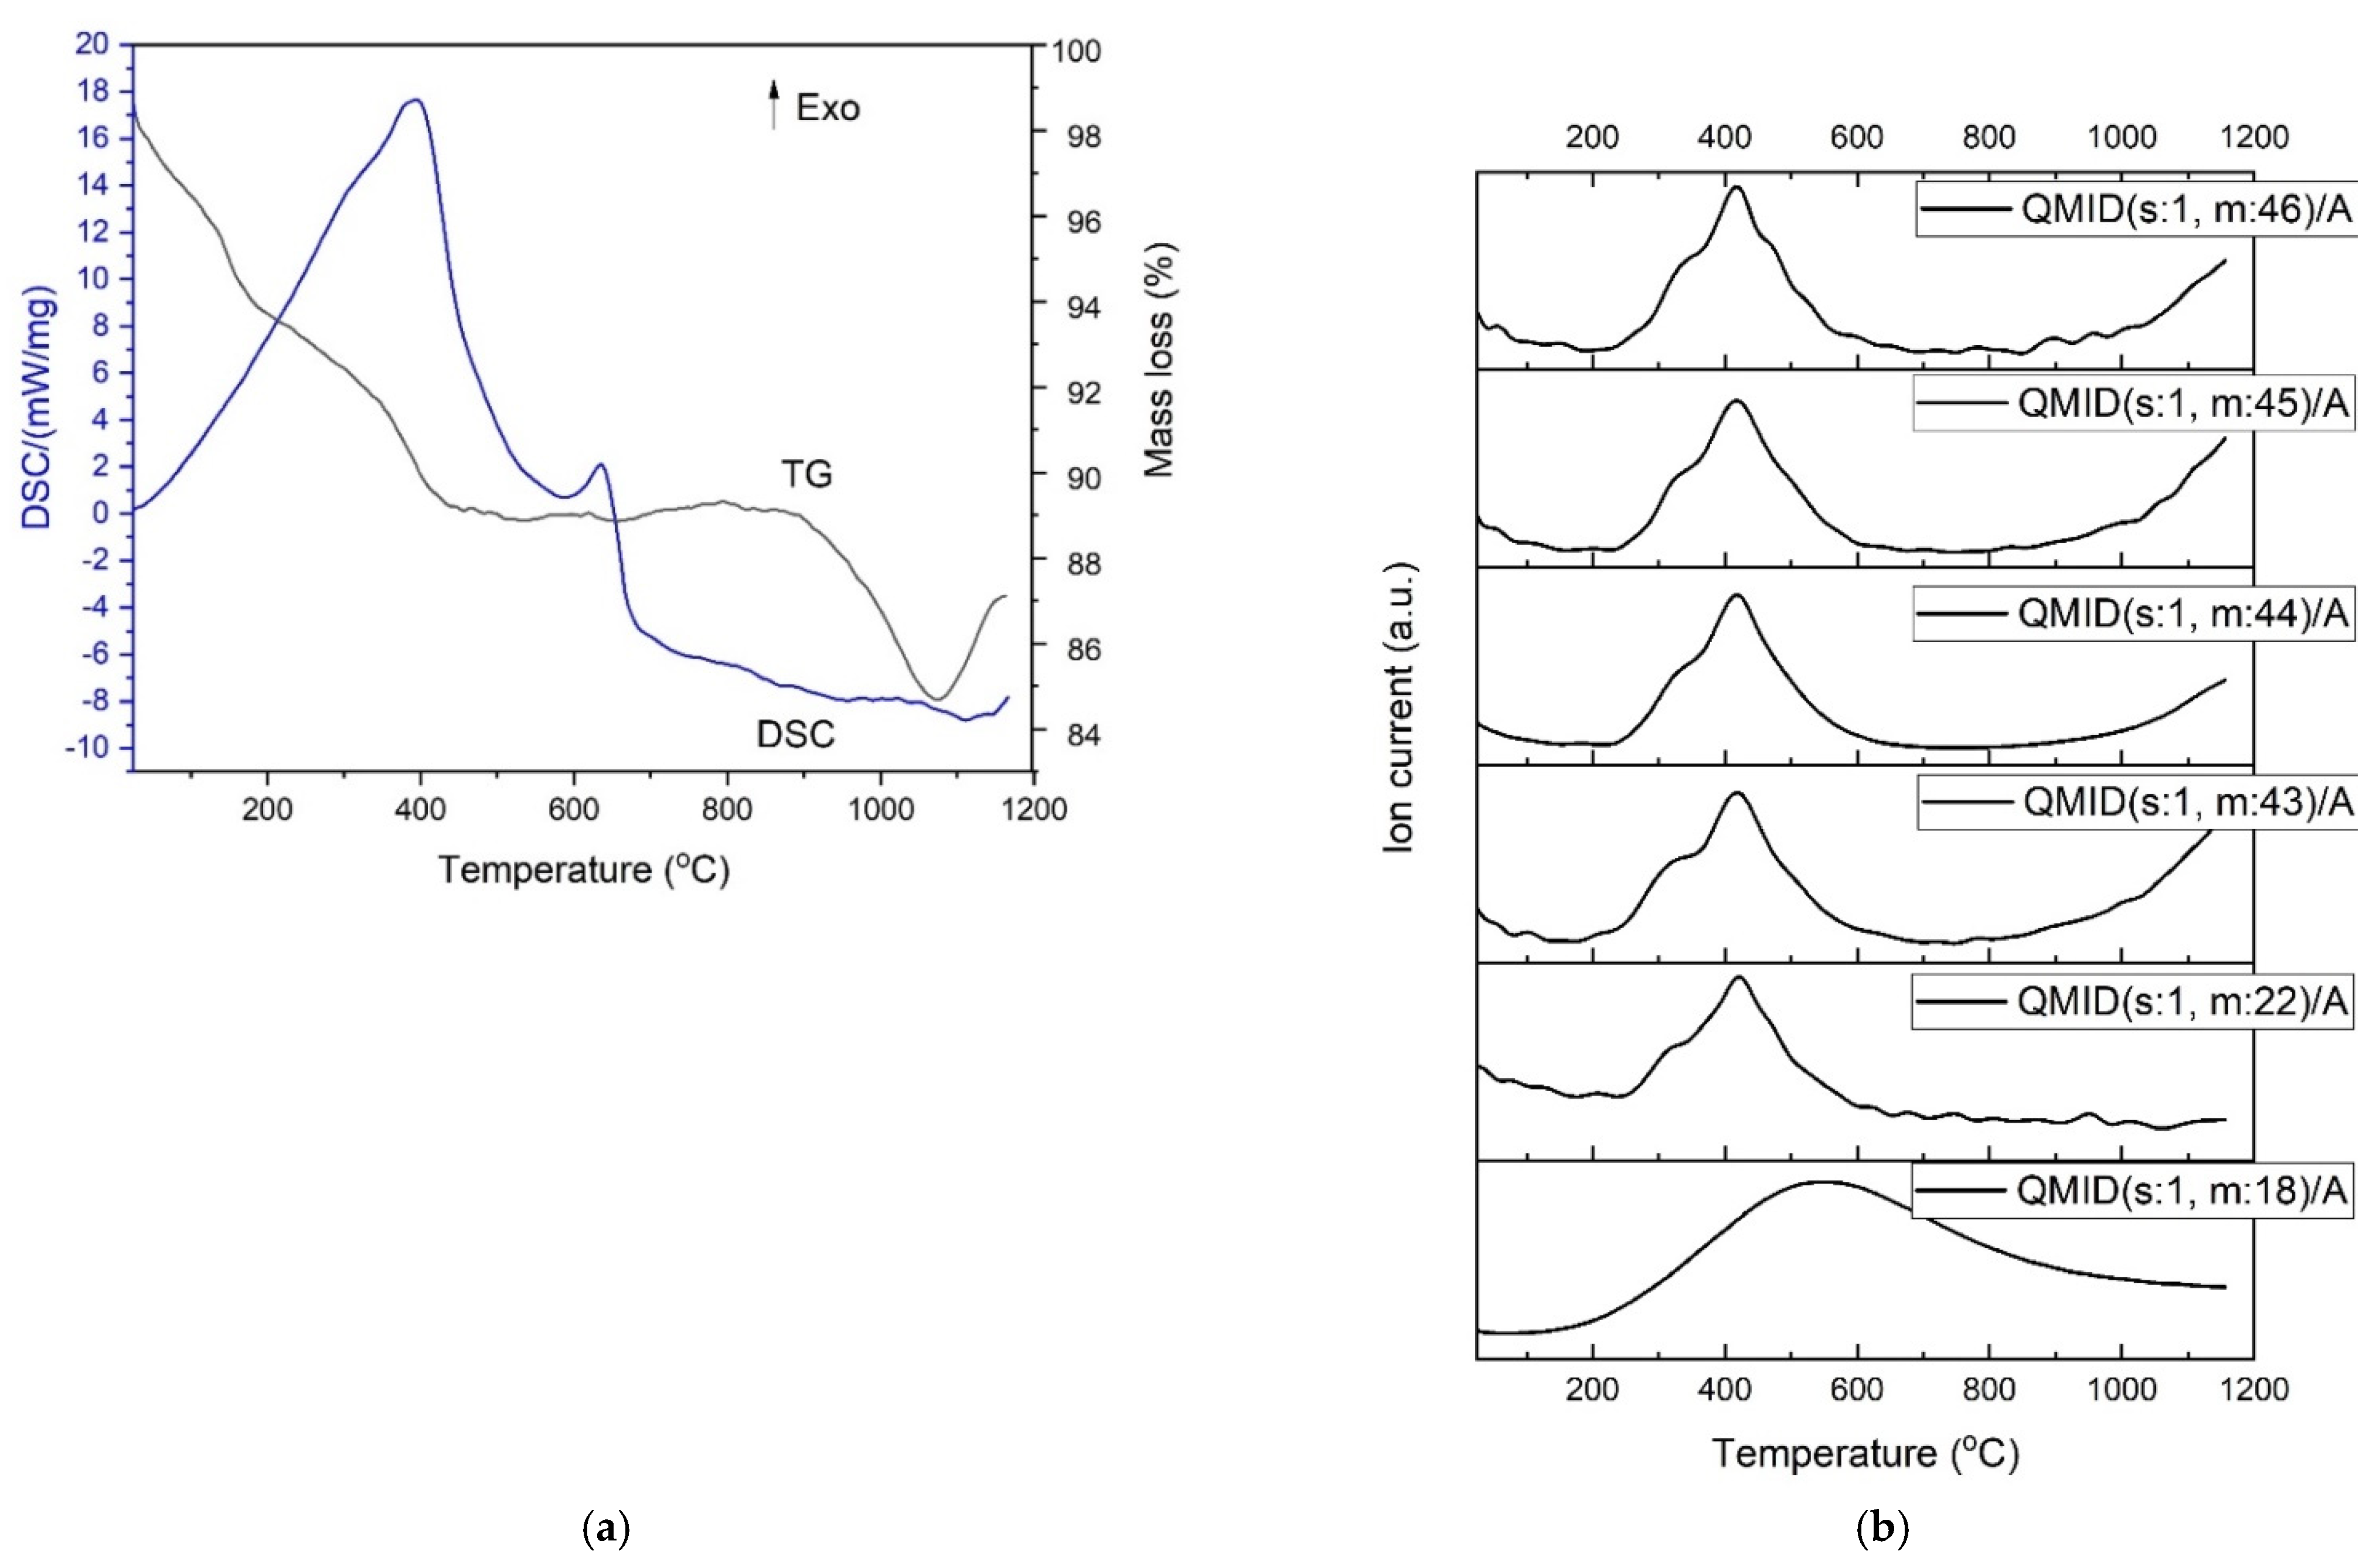
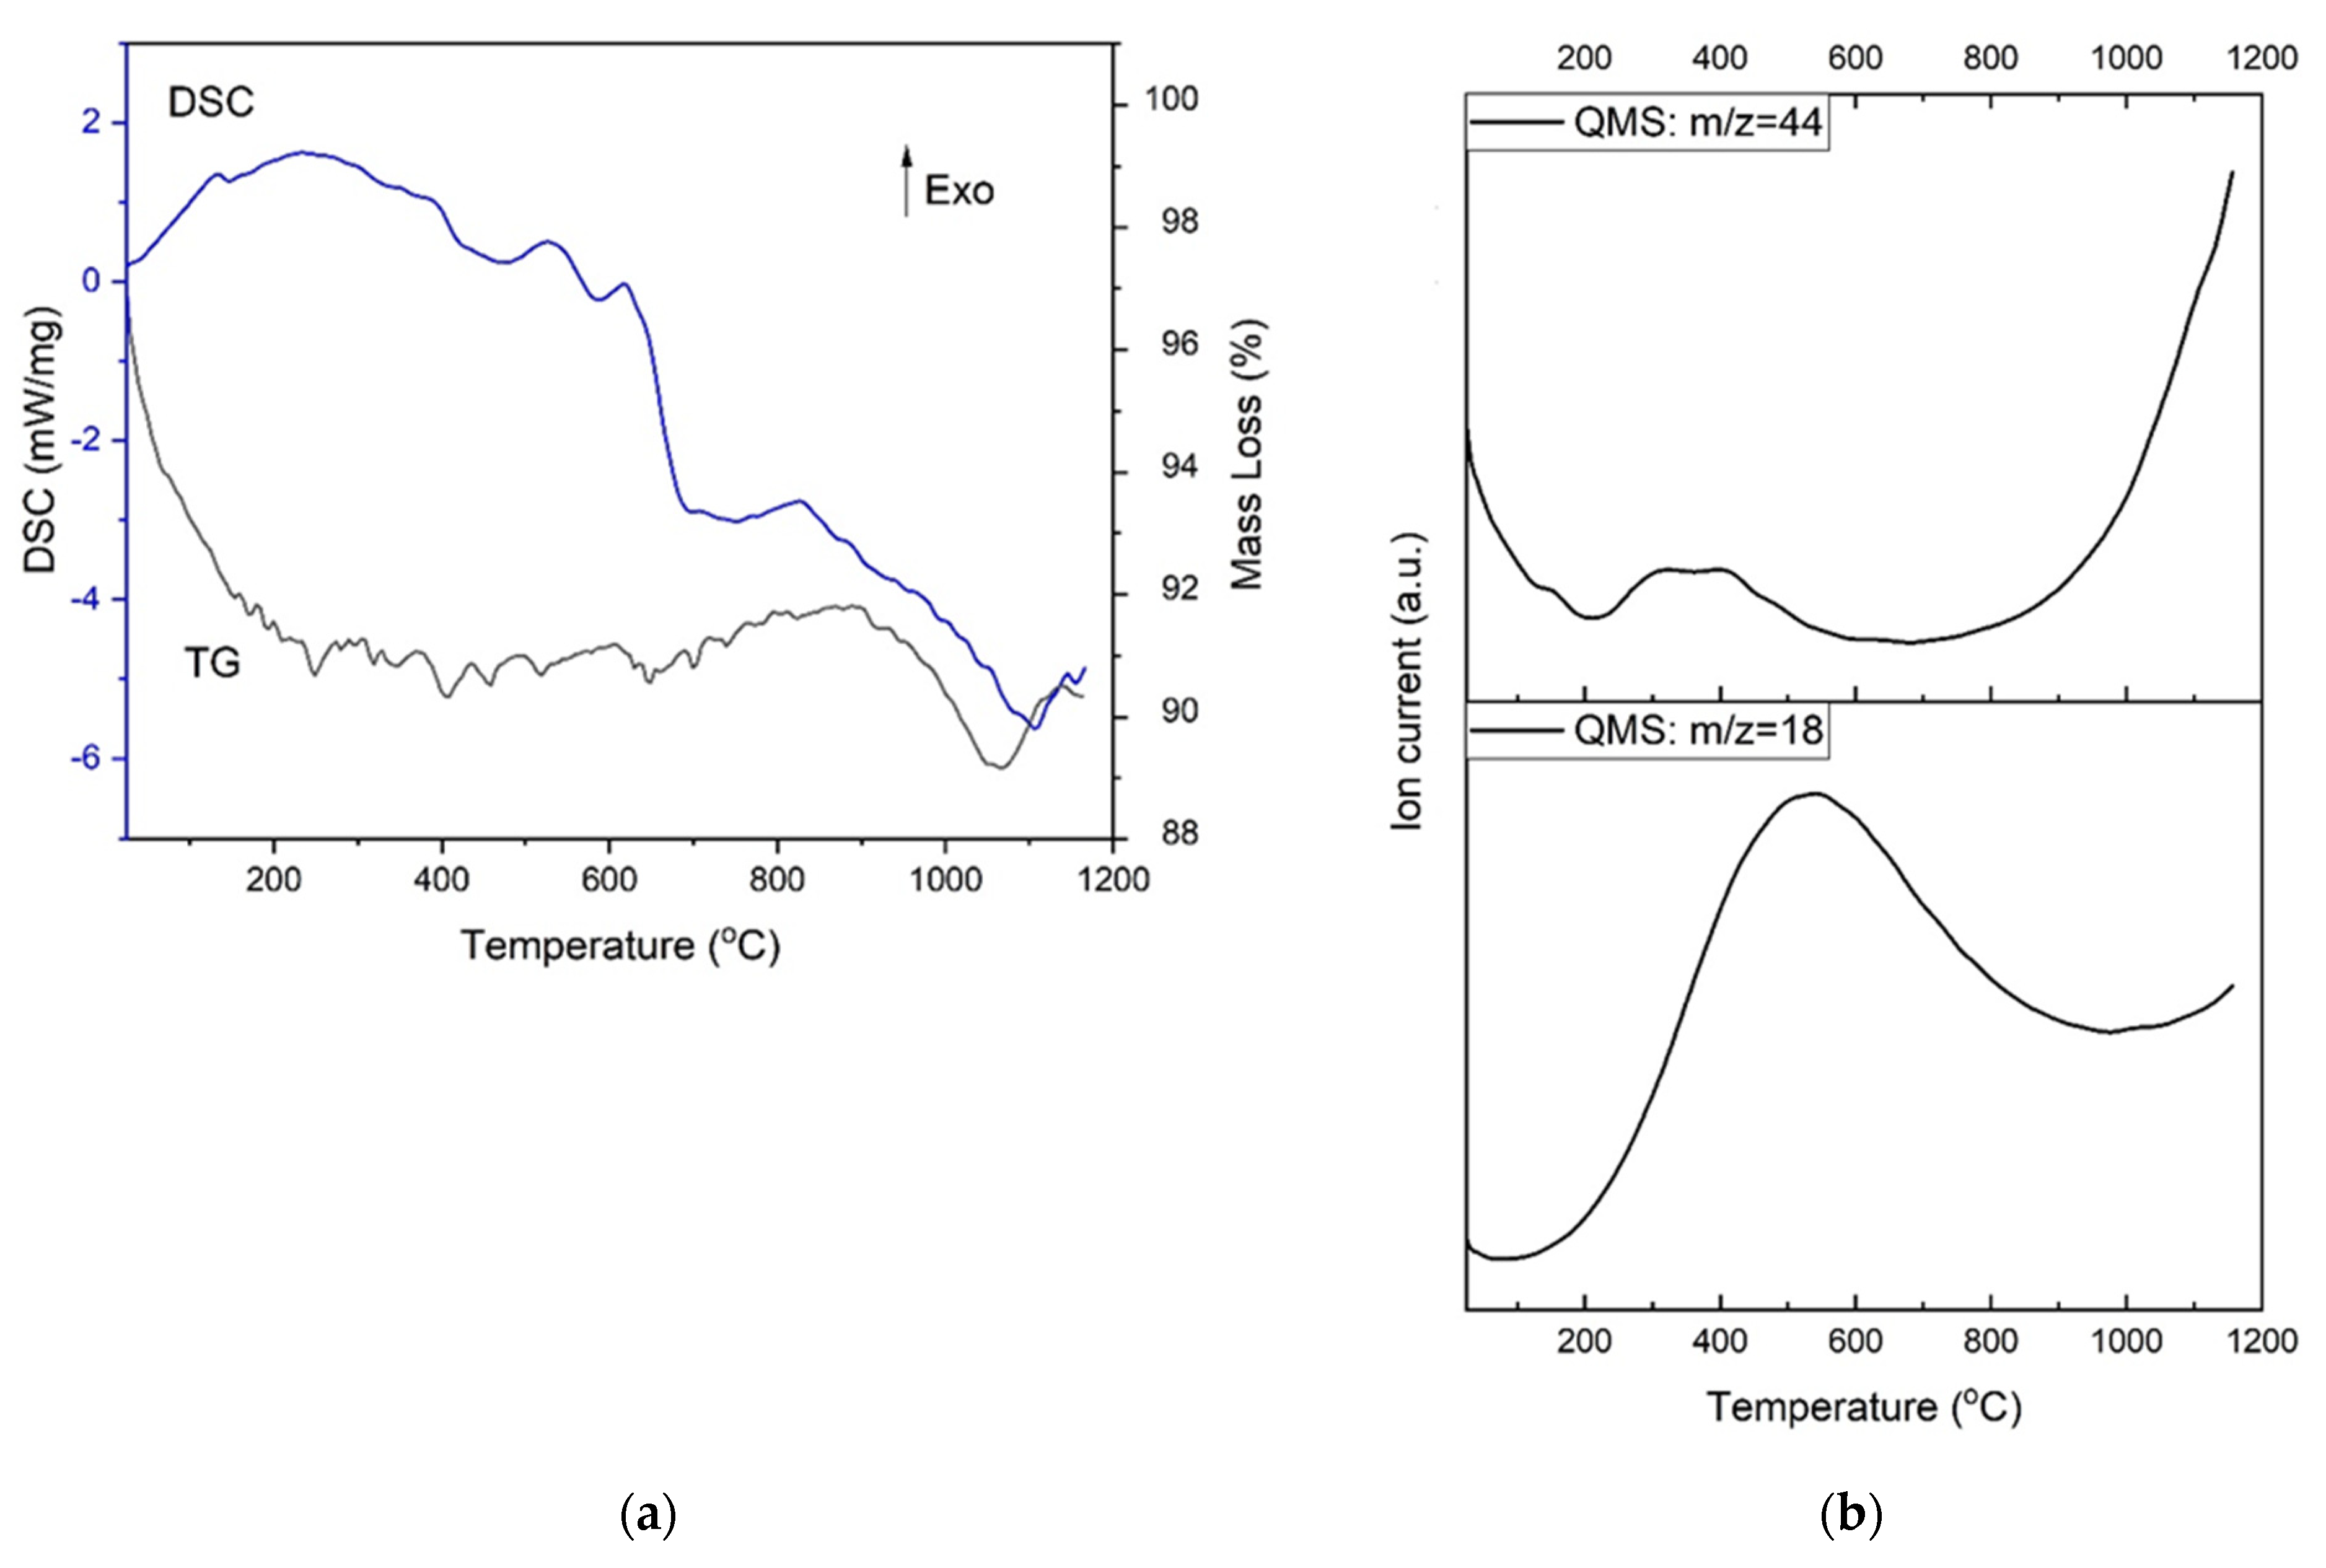
3.5. Evolved Gas Analysis (EGA)
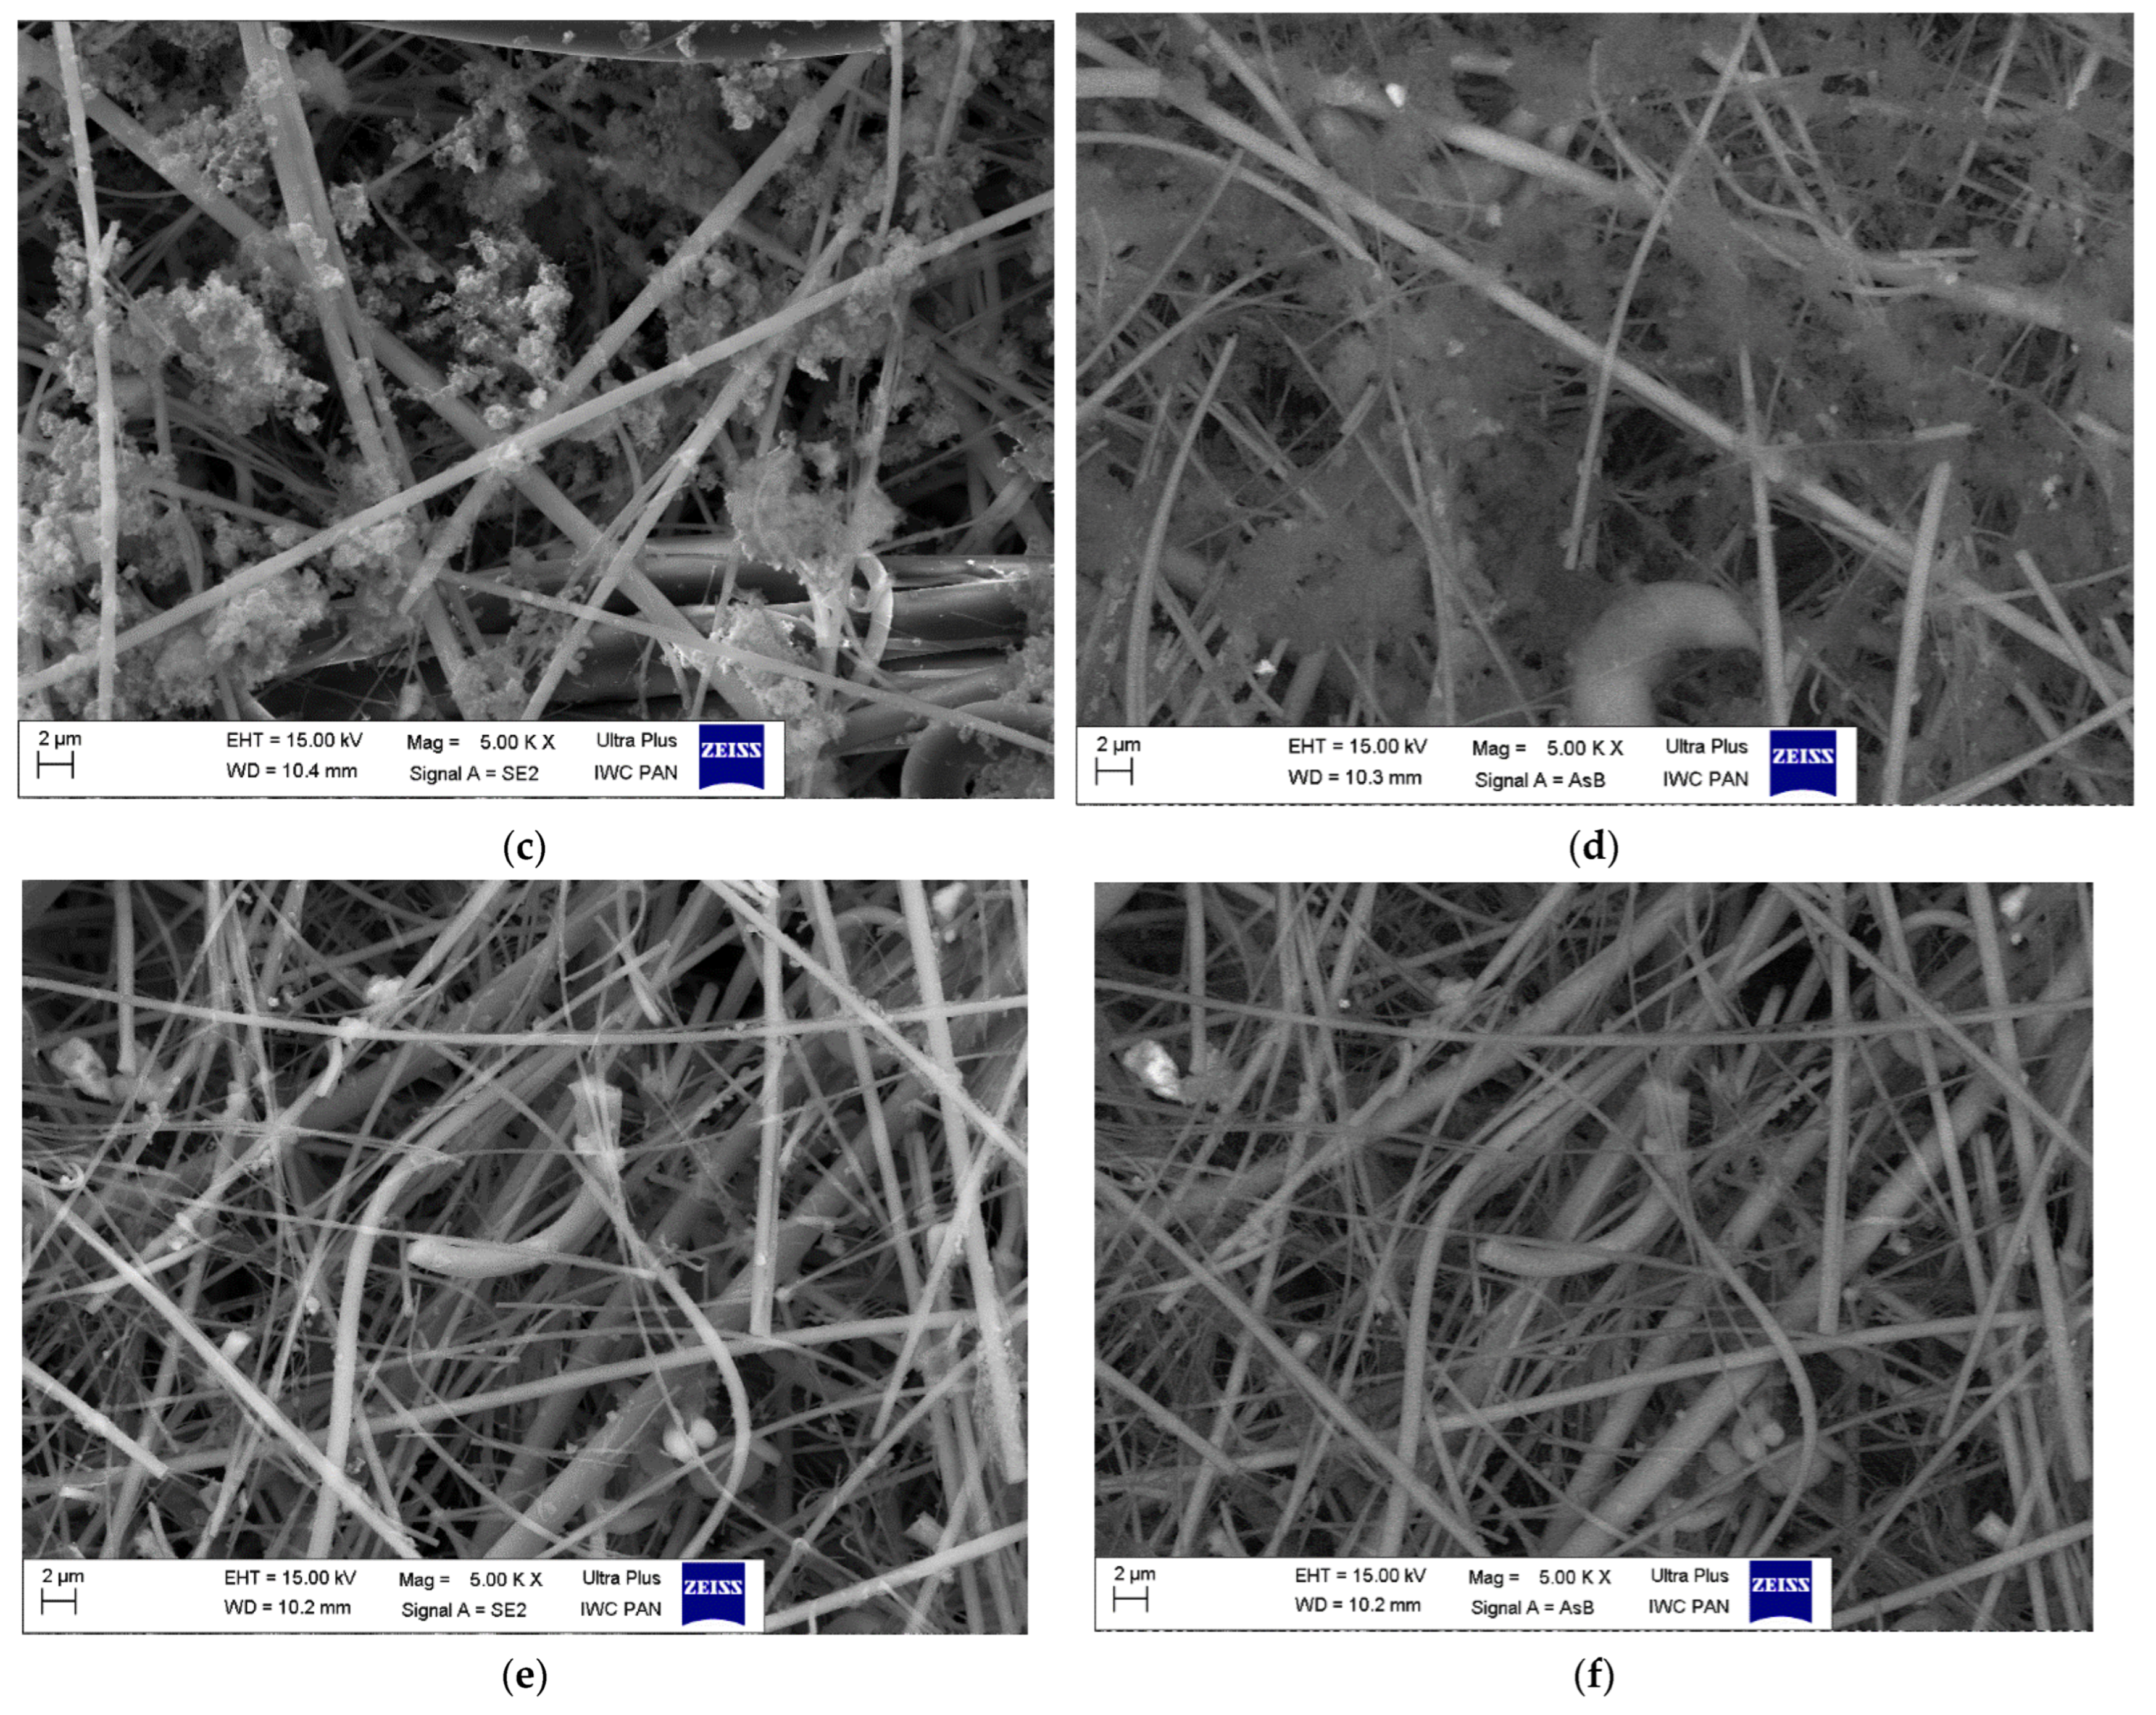
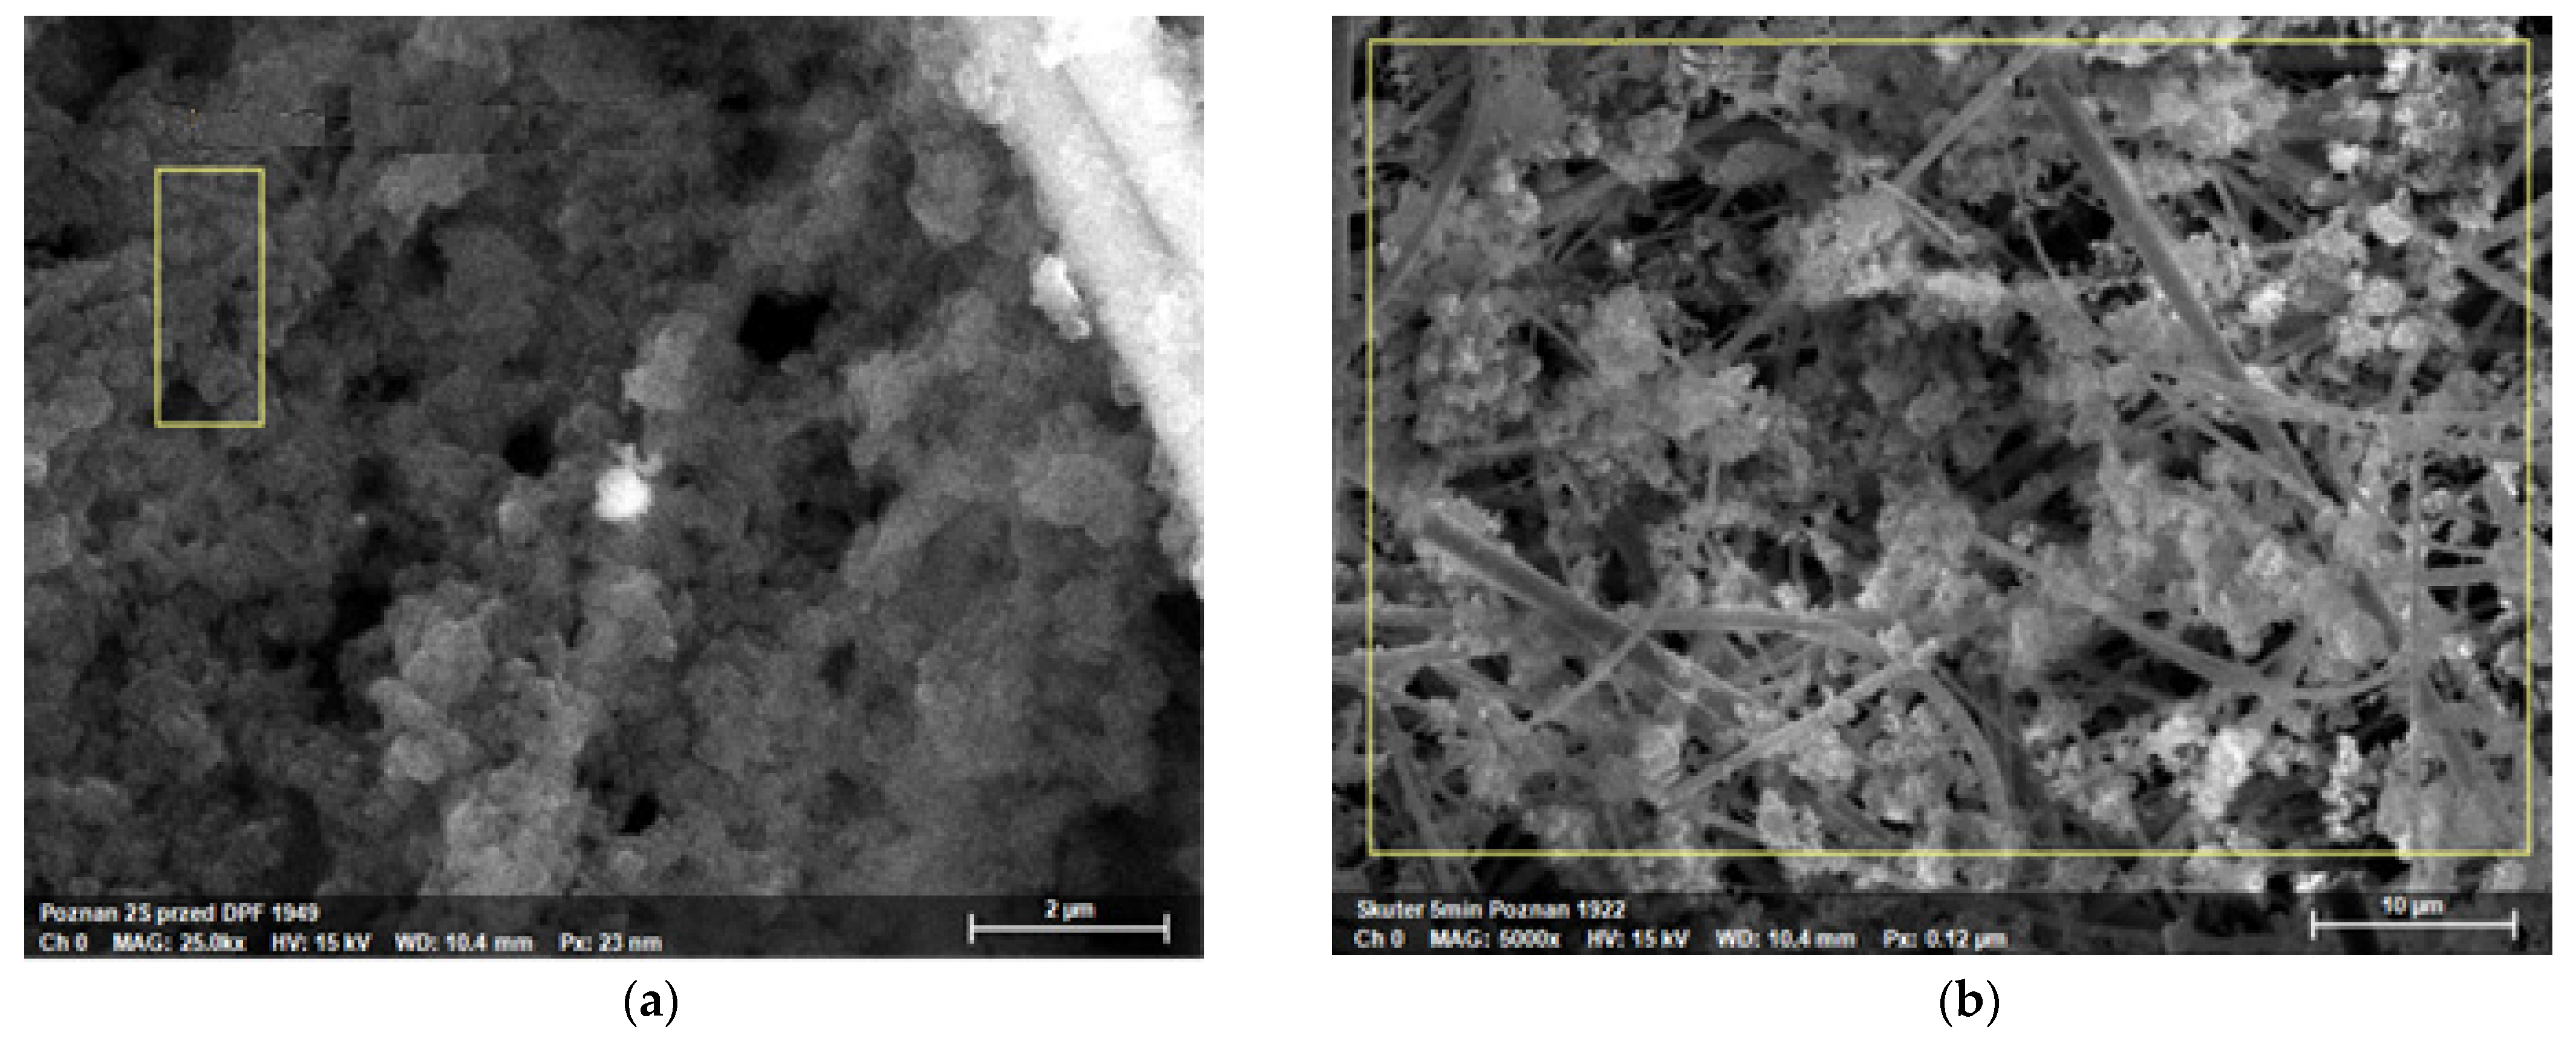
3.6. Scanning Electron Microscope with Energy Dispersive Spectroscopy (SEM-EDS)
4. Conclusions
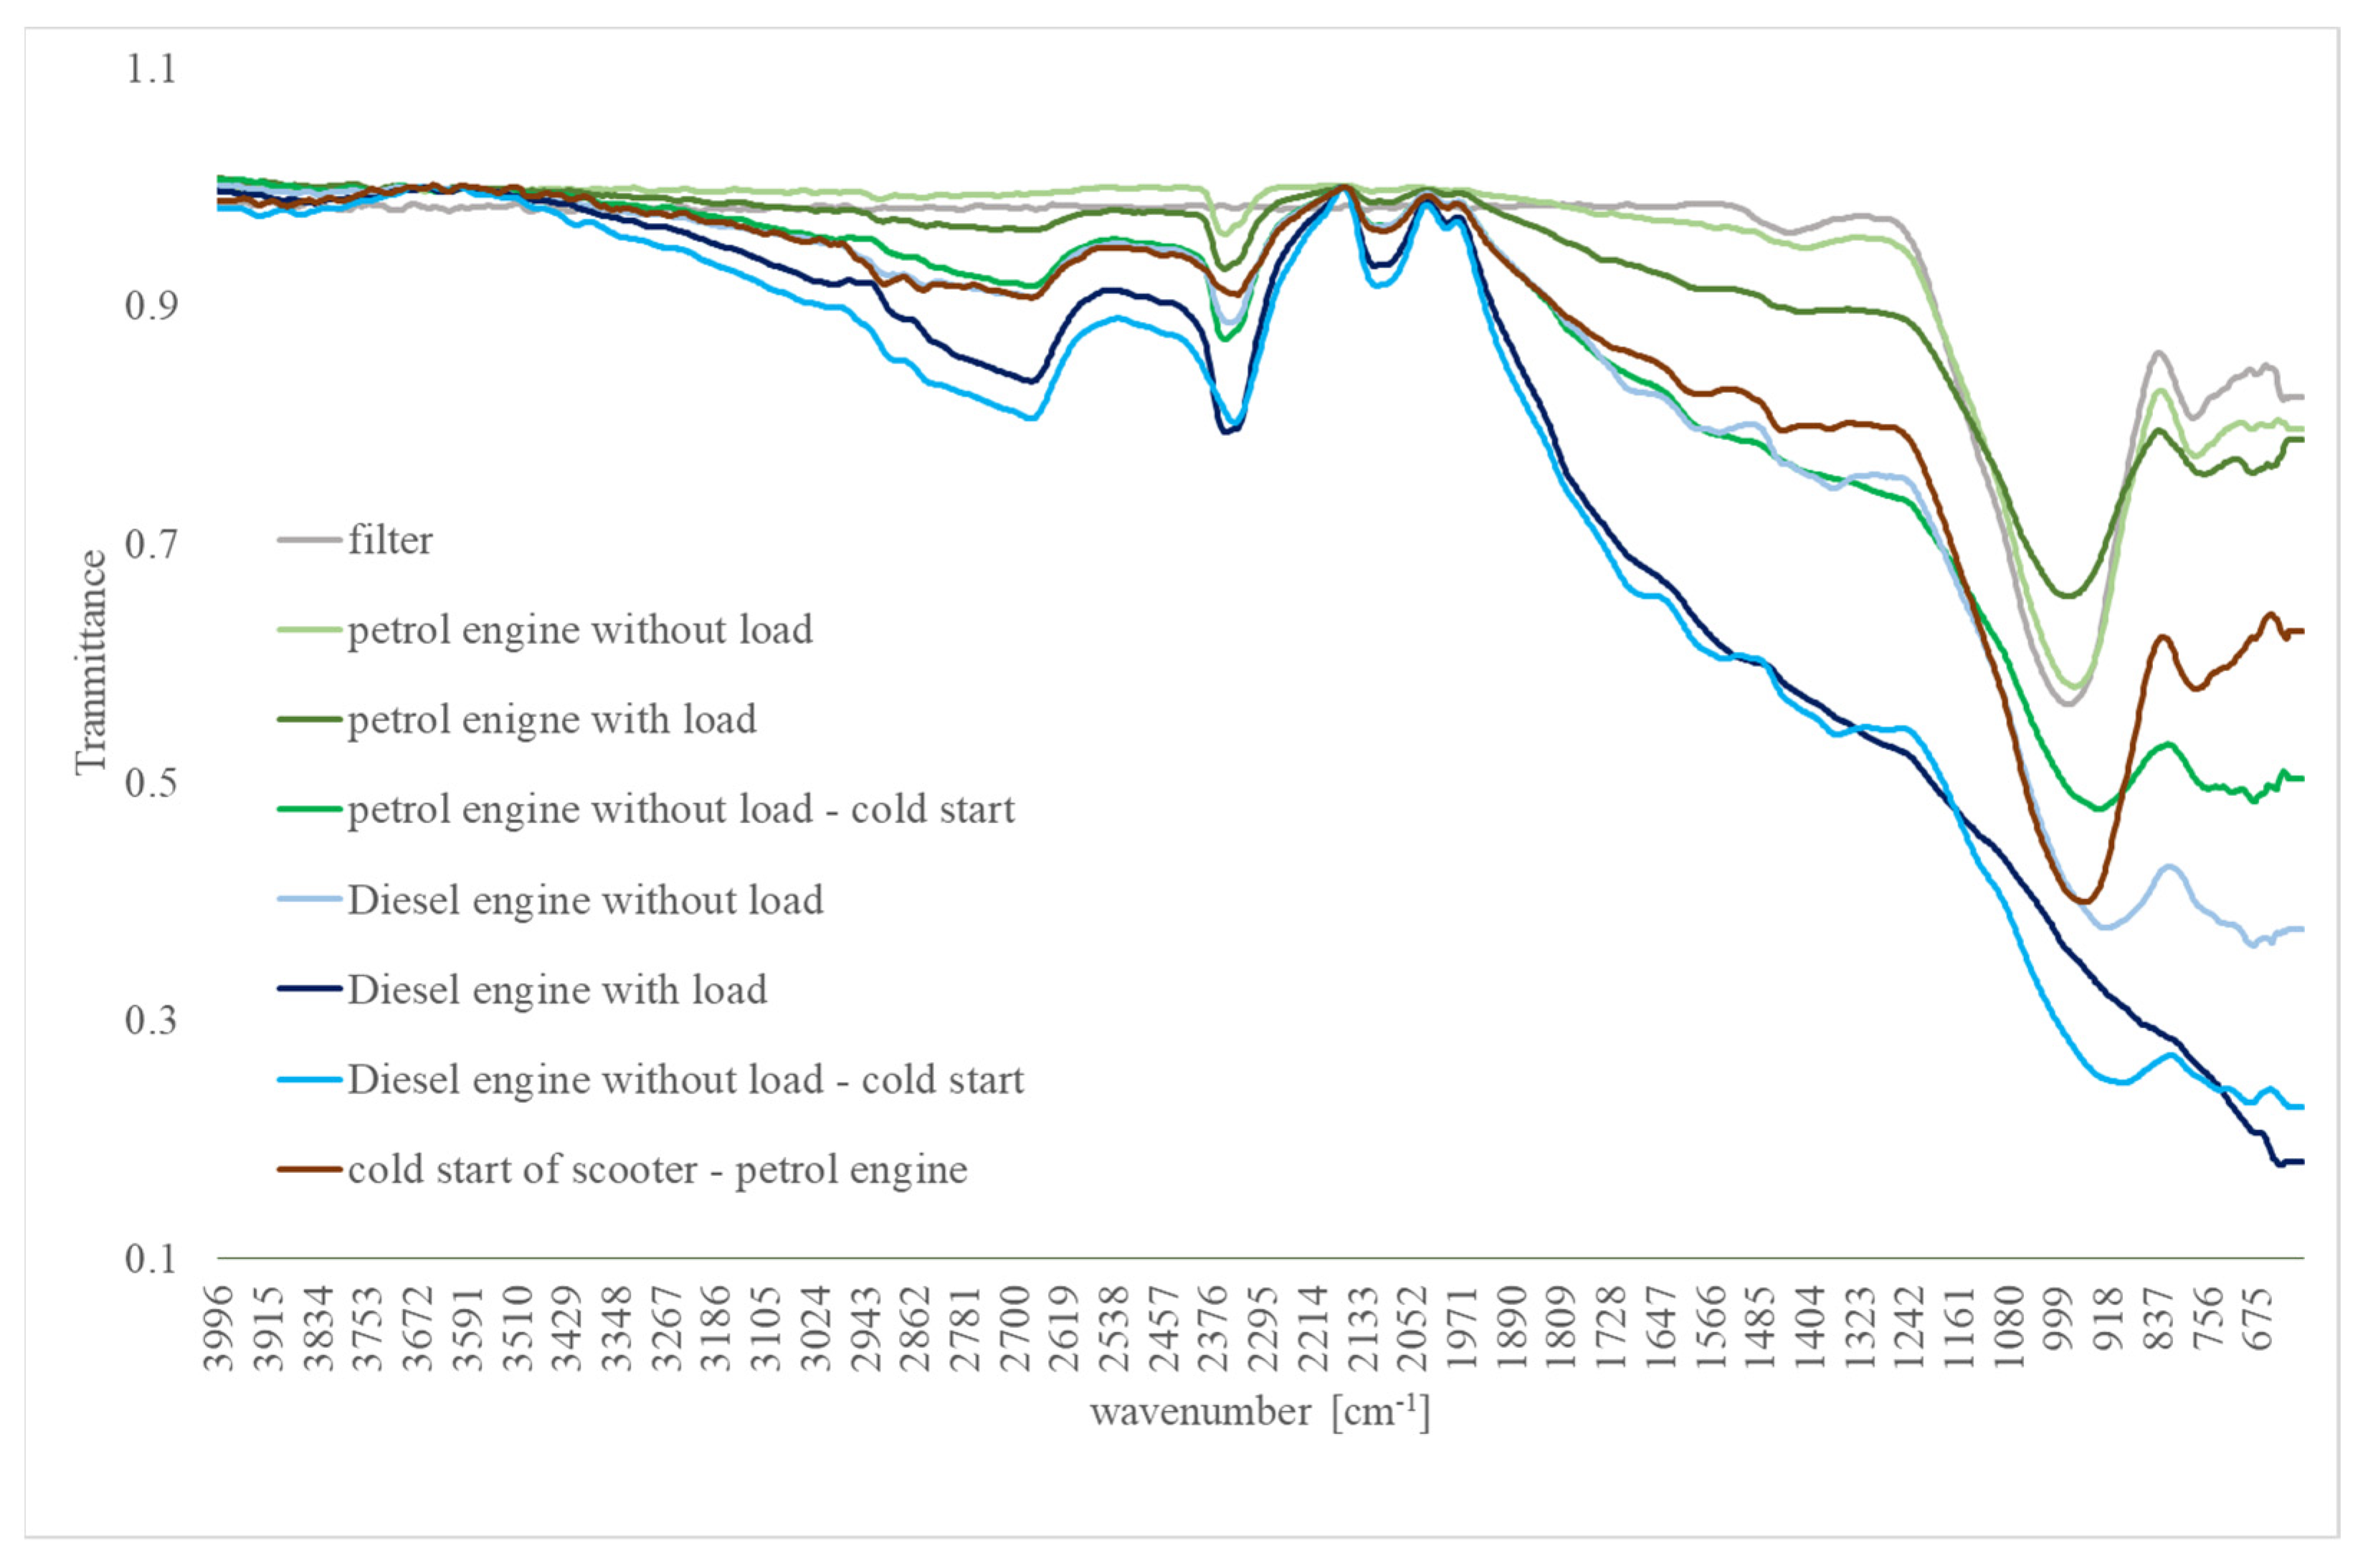
- All adsorbed particulate matter collected from the Diesel and petrol engine contain carbon black. Carbon black shows absorption in the entire area from 4000 to 400 cm−1, and, when using the ATR technique, the effect of carbon black becomes greater with deeper light penetration at the long wavelength end.
- The largest amount of carbon black is present at particulate matter emitted from the Diesel engine, both working with and without load and during cold start. Slightly less carbon black is emitted in the case of an engine without load than with load.
- There are no evidence signals from alkanes or aromatic compounds; however, the weak signals at ~2900 cm−1 at the range 1650–1400 cm−1 might be seen. It is larger for PM from the Diesel engine than the petrol engine.
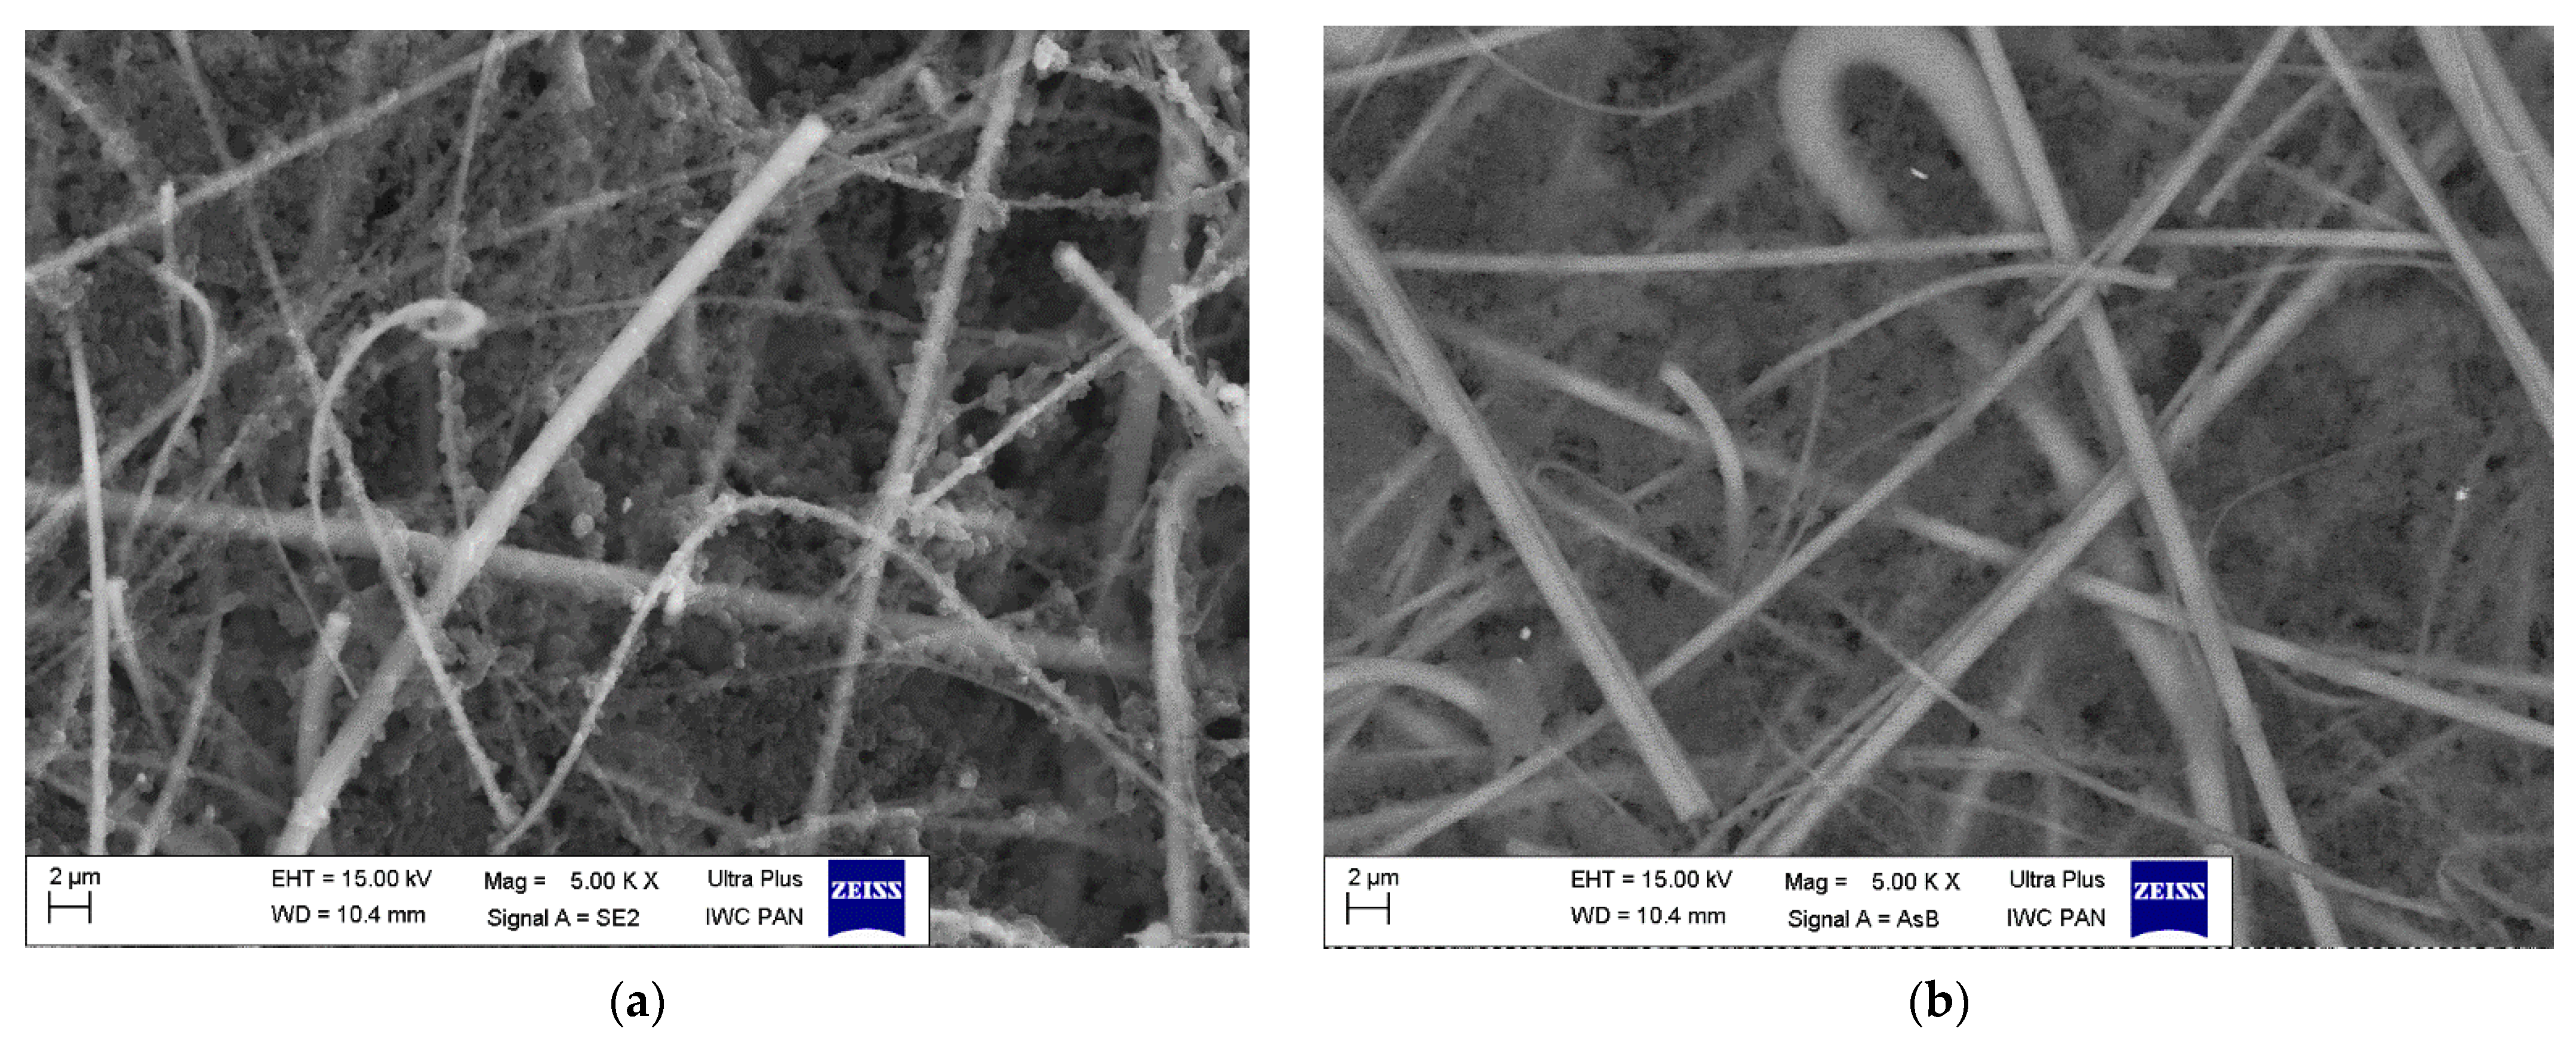
- It can be seen that particles deposited on the Diesel engine fibers are smaller, and their amount is lower, than in case of petrol engine. PM from the petrol engine show more agglomerations.
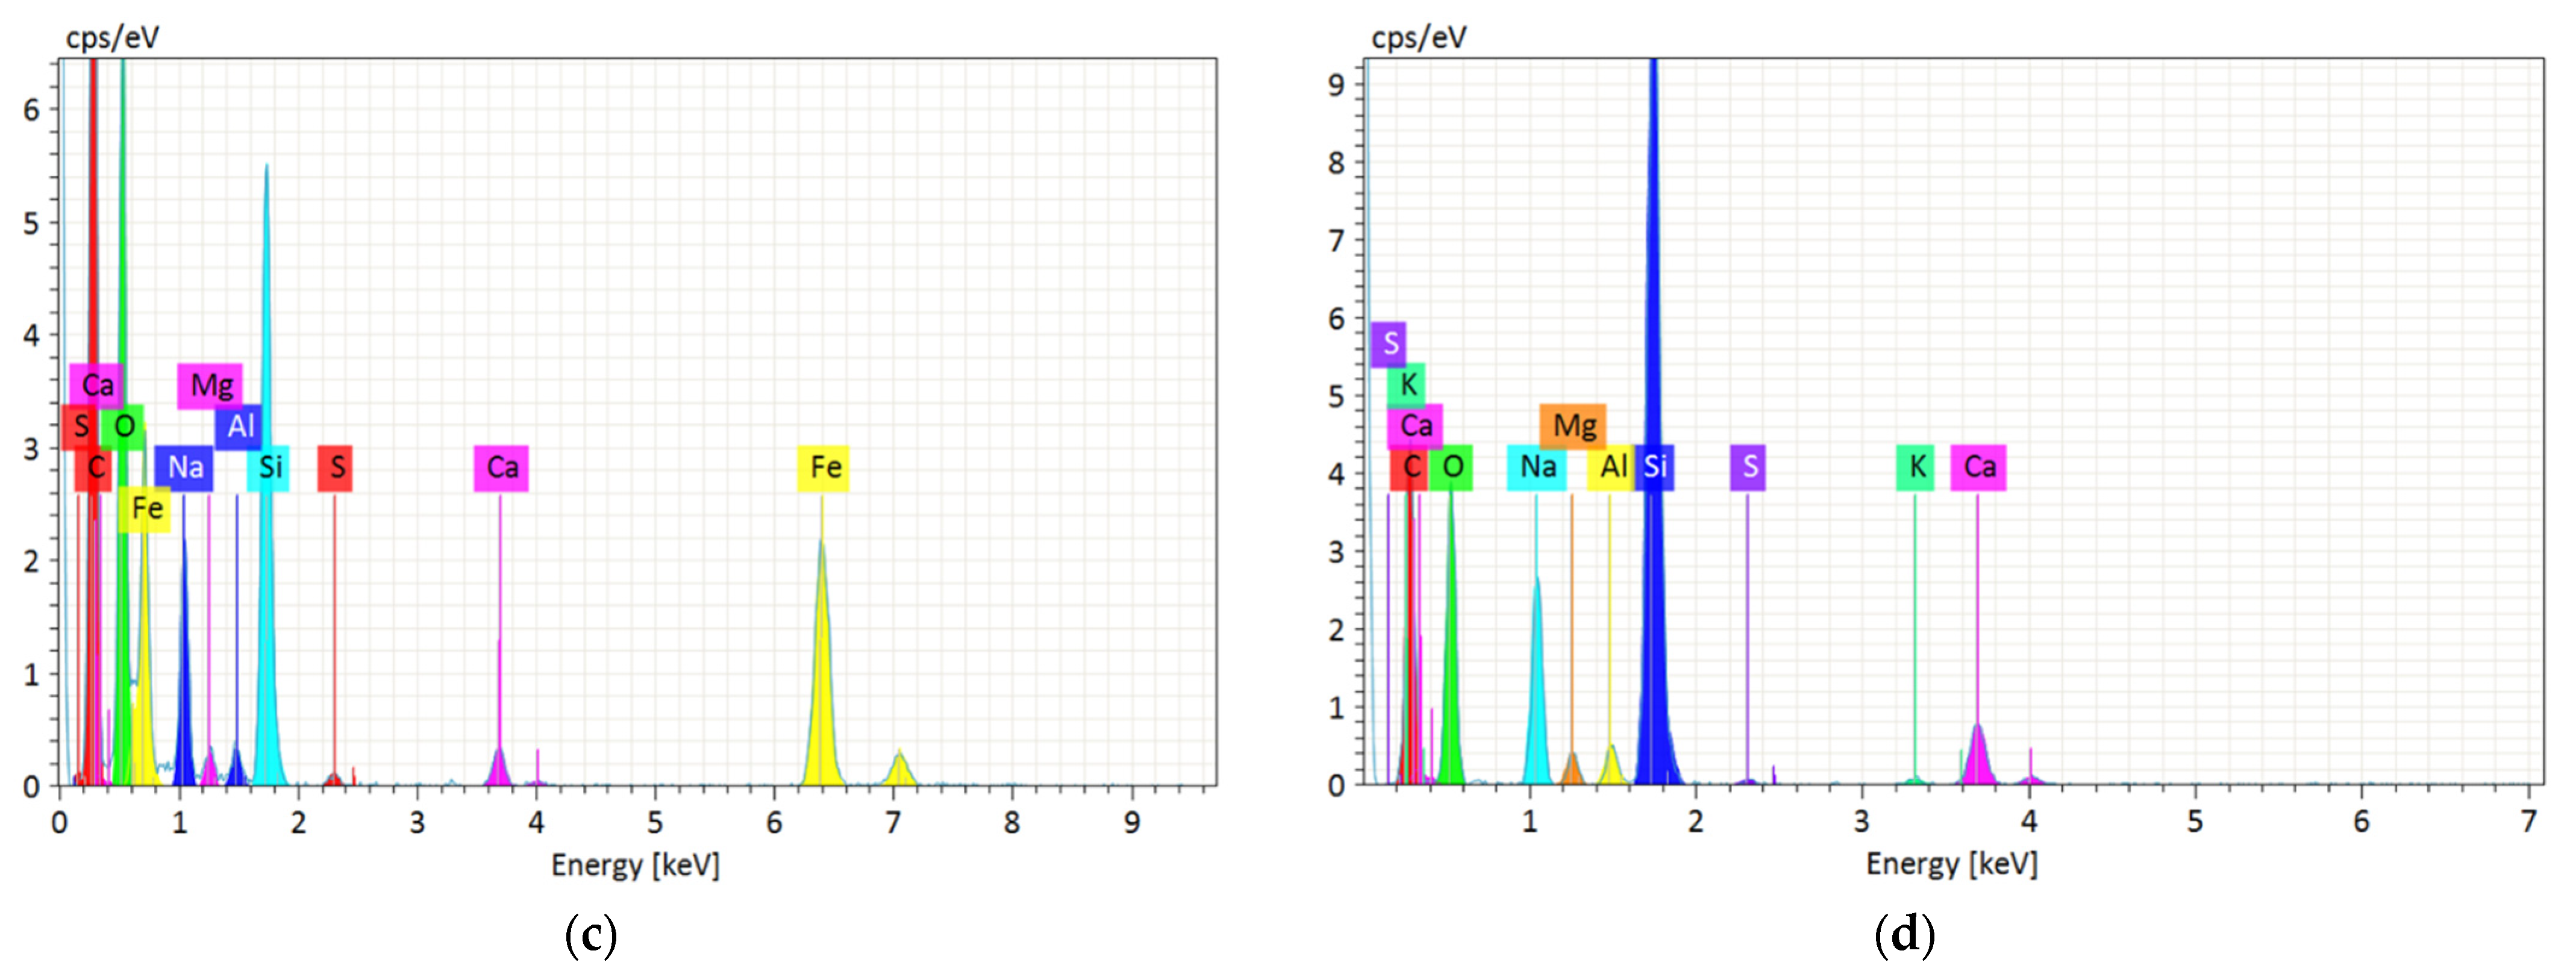
- The main component of PM from both engines is carbon, which most likely comes from organic compounds derived from the combustion process.
- The amount of oxygen is similar to the pure filter in the case of the Diesel engine, and it is significantly smaller for the petrol engine: this phenomenon can be the effect of covering filter fibers by carbon agglomerates in the case of the petrol engine and more distracted particles in the case of Diesel engine that do not stick the filter fibers. This phenomenon is also present in case of Na, Ca, Si, Al, and Mg.
- Sulfur is present in particulate matter from both engines on the similar level.
- Fe was noticed only for particulate matters from the Diesel engine.
Author Contributions
Funding
Institutional Review Board Statement
Informed Consent Statement
Conflicts of Interest
References
- Sicard, P.; Agathokleous, E.; De Marco, A.; Paoletti, E.; Calatayud, V. Urban population exposure to air pollution in Europe over the last decades. Environ. Sci. Eur. 2021, 33, 1–12. [Google Scholar] [CrossRef] [PubMed]
- Lelieveld, J.; Evans, J.S.; Fnais, M.; Giannadaki, D.; Pozzer, A. The contribution of outdoor air pollution sources to premature mortality on a global scale. Nature 2015, 525, 367–371. [Google Scholar] [CrossRef] [PubMed]
- OECD/European Union. Health at a Glance: Europe 2020: State of Health in the EU Cycle; OECD Publishing: Paris, France, 2020. [Google Scholar] [CrossRef]
- World Health Organization. Air Pollution. Available online: https://www.who.int/health-topics/air-pollution#tab=tab_2 (accessed on 3 January 2021).
- WHO. Air Quality Guidelines for Particulate Matter, Ozone, Nitrogen Dioxide and Sulfur Dioxide; WHO: Geneva, Switzerland, 2006. [Google Scholar]
- Available online: https://whoairquality.shinyapps.io/AirQualityStandards/ (accessed on 29 June 2021).
- Brook, R.D.; Rajagopalan, S.; Pope, C.A.; Brook, J.R.; Bhatnagar, A.; Diez-Roux, A.V.; Holguin, F.; Hong, Y.; Luepker, R.V.; Mittleman, M.A.; et al. Particulate Matter Air Pollution and Cardiovascular Disease: An update to the scientific statement from the american heart association. Circulation 2010, 121, 2331–2378. [Google Scholar] [CrossRef] [Green Version]
- Jasiński, R.; Galant-Gołębiewska, M.; Nowak, M.; Ginter, M.; Kurzawska, P.; Kurtyka, K.; Maciejewska, M. Case Study of Pollution with Particulate Matter in Selected Locations of Polish Cities. Energies 2021, 14, 2529. [Google Scholar] [CrossRef]
- Schikowski, T.; Vossoughi, M.; Vierkötter, A.; Schulte, T.; Teichert, T.; Sugiri, D.; Fehsel, K.; Tzivian, L.; Bae, I.-S.; Ranft, U.; et al. Association of air pollution with cognitive functions and its modification by APOE gene variants in elderly women. Environ. Res. 2015, 142, 10–16. [Google Scholar] [CrossRef]
- Tonne, C.; Elbaz, A.; Beevers, S.; Singh-Manoux, A. Traffic-related Air Pollution in Relation to Cognitive Function in Older Adults. Epidemiology 2014, 25, 674–681. [Google Scholar] [CrossRef] [PubMed] [Green Version]
- Ailshire, J.A.; Crimmins, E.M. Fine Particulate Matter Air Pollution and Cognitive Function Among Older US Adults. Am. J. Epidemiol. 2014, 180, 359–366. [Google Scholar] [CrossRef] [PubMed] [Green Version]
- Gao, H.; Shi, J.; Cheng, H.; Zhang, Y. The impact of long- and short-term exposure to different ambient air pollutants on cognitive function in China. Environ. Int. 2021, 151, 106416. [Google Scholar] [CrossRef]
- Pielecha, J.; Merkisz, J.; Markowski, J.; Jasiński, R. Analysis of Passenger Car Emission Factors in RDE Tests. E3S Web Conf. 2016, 10, 73. [Google Scholar] [CrossRef] [Green Version]
- Guevara, M. Emissions of Primary Particulate Matter. Issues Environ. Sci. Technol. 2016, 1–34. [Google Scholar] [CrossRef]
- Reşitoğlu, İ.A.; Altinişik, K.; Keskin, A. The pollutant emissions from diesel-engine vehicles and exhaust aftertreatment systems. Clean Technol. Environ. Policy 2015, 17, 15–27. [Google Scholar] [CrossRef] [Green Version]
- Report–Vehicles in Use, Europe 2019–ACEA–European Automobile Manufacturers’ Association. 2021. Available online: https://www.acea.auto/publication/report-vehicles-in-use-europe-2019/ (accessed on 17 August 2021).
- Dun, C.; Horton, G.; Kollamthodi, S. Improvements to the Definition of Lifetime Mileage of Light Duty Vehicles; Ricardo-AEA: London, UK, 2015. [Google Scholar]
- Burtscher, H. Physical characterization of particulate emissions from diesel engines: A review. J. Aerosol Sci. 2005, 36, 896–932. [Google Scholar] [CrossRef]
- Keskinen, J.; Rönkkö, T. Can Real-World Diesel Exhaust Particle Size Distribution be Reproduced in the Laboratory? A Critical Review Jorma Keskinen. J. Air Waste Manag. Assoc. 2010, 60, 1245–1255. [Google Scholar] [CrossRef] [PubMed]
- Wróblewski, P.; Iskra, A. Problems of Reducing Friction Losses of a Piston-Ring-Cylinder Configuration in a Combustion Piston Engine with an Increased Isochoric Pressure Gain; SAE Technical Paper Series, SAE Technical Paper 2020-01-2227; SAE International: Warrendale, PA, USA, 2020. [Google Scholar] [CrossRef]
- R’Mili, B.; Boréave, A.; Meme, A.; Vernoux, P.; Leblanc, M.; Noël, L.; Raux, S.; D’Anna, B. Physico-Chemical Characterization of Fine and Ultrafine Particles Emitted during Diesel Particulate Filter Active Regeneration of Euro5 Diesel Vehicles. Environ. Sci. Technol. 2018, 52, 3312–3319. [Google Scholar] [CrossRef]
- Staps, I.; Ligterink, N. Diesel Particle Filters; TNO: The Hague, The Netherlands, 2018. [Google Scholar] [CrossRef]
- Steininger, N. Particle number emission limits for Euro 6 positive ignition vehicles (PI). In Proceedings of the 15 ETH Conference on Combustion Generated Nano-Particles, Zurich, Switzerland, 27–29 June 2011. [Google Scholar]
- Diesel Particulate Filters-GOV.UK. Retrieved 17 August 2021. Available online: https://www.gov.uk/government/publications/diesel-particulate-filters-guidance-note/diesel-particulate-filters (accessed on 17 August 2021).
- Green-Zones.eu.—Green-Zones.eu. Retrieved 17 August 2021. Available online: https://www.green-zones.eu/en/ (accessed on 17 August 2021).
- Plötz, P.; Axsen, J.; Funke, S.A.; Gnann, T. Designing car bans for sustainable transportation. Nat. Sustain. 2019, 2, 534–536. [Google Scholar] [CrossRef]
- Chang, A.S.F.; Kalawsky, R.S. European transport sector interventions for smart city. In Proceedings of the 2017 7th International Conference on Power Electronics Systems and Applications—Smart Mobility, Power Transfer & Security (PESA), Hong Kong, China, 12–14 December 2017; IEEE: New York, NY, USA, 2017; Volume 5, pp. 1–6. [Google Scholar] [CrossRef] [Green Version]
- National Research Council. Cost, Effectiveness, and Deployment of Fuel Economy Technologies for Light-Duty Vehicles; National Academies Press: Cambridge, MA, USA, 2015. [Google Scholar]
- Conway, G.; Joshi, A.; Leach, F.; García, A.; Senecal, P.K. A review of current and future powertrain technologies and trends in 2020. Transp. Eng. 2021, 5, 100080. [Google Scholar] [CrossRef]
- Macioszek, E.; Sierpiński, G. Charging Stations for Electric Vehicles—Current Situation in Poland. Commun. Comput. Inf. Sci. 2020, 13, 124–137. [Google Scholar] [CrossRef]
- Wróblewski, P.; Drożdż, W.; Lewicki, W.; Dowejko, J. Total Cost of Ownership and Its Potential Consequences for the Development of the Hydrogen Fuel Cell Powered Vehicle Market in Poland. Energies 2021, 14, 2131. [Google Scholar] [CrossRef]
- Li, Q.; Zhu, Q.; Xu, M.; Zhao, Y.; Narayan, K.; Liu, Y. Estimating the Impact of COVID-19 on the PM2.5 Levels in China with a Satellite-Driven Machine Learning Model. Remote Sens. 2021, 13, 1351. [Google Scholar] [CrossRef]
- Rogula-Kozłowska, W.; Klejnowski, K.; Rogula-Kopiec, P.; Ośródka, L.; Krajny, E.; Błaszczak, B.; Mathews, B. Spatial and seasonal variability of the mass concentration and chemical composition of PM2.5 in Poland. Air Qual. Atmos. Health 2014, 7, 41–58. [Google Scholar] [CrossRef] [Green Version]
- Popovicheva, O.B.; Kireeva, E.D.; Shonija, N.K.; Vojtisek-Lom, M.; Schwarz, J. FTIR analysis of surface functionalities on particulate matter produced by off-road diesel engines operating on diesel and biofuel. Environ. Sci. Pollut. Res. 2014, 22, 4534–4544. [Google Scholar] [CrossRef]
- Mico, S.; Tsaousi, E.; Deda, A.; Pomonis, P. Characterization of airborne particles and source identification using SEM/EDS. Eur. Chem. Bull. 2015, 4, 224–229. [Google Scholar] [CrossRef]
- Genga, A.; Baglivi, F.; Siciliano, M.; Siciliano, T.; Aiello, D.; Tortorella, C. Chemical and Morphological Study of Particulate Matter Analysed by Sem-Eds. In Proceedings of the 4th Imeko TC19 Symposium on Environmental Instrumentation and Measurements Protecting Environment, Climate Changes and Pollution Control, Lecce, Italy, 3–4 June 2013; pp. 43–46. [Google Scholar]
- Kurzawska, P.; Jasiński, R. Overview of Sustainable Aviation Fuels with Emission Characteristic and Particles Emission of the Turbine Engine Fueled ATJ Blends with Different Percentages of ATJ Fuel. Energies 2021, 14, 1858. [Google Scholar] [CrossRef]
- Merkisz, J. On-road exhaust emission testing. Combust. Engines 2011, 146, 3–15. [Google Scholar] [CrossRef]
- Güney, B.; Aladağ, A. Microstructural characterization of particulate matter from gasoline-fuelled vehicle emissions. J. Eng. Res. Rep. 2020, 16, 29–39. [Google Scholar] [CrossRef]
- Yang, H.H.; Dhital, N.B.; Wang, L.C.; Hsieh, Y.S.; Lee, K.T.; Hsu, Y.T.; Huang, S.C. Chemical characterization of fine particulate matter in gasoline and diesel vehicle exhaust. Aerosol Air Qual. Res. 2019, 19, 1349–1449. [Google Scholar] [CrossRef] [Green Version]
- Cheung, K.L.; Ntziachristos, L.; Tzamkiozis, T.; Schauer, J.J.; Samaras, Z.; Moore, K.F.; Sioutas, C. Emissions of particulate trace elements, metals and organic species from gasoline, diesel, and biodiesel passenger vehicles and their relation to oxidative potential. Aerosol Sci. Technol. 2010, 44, 500–513. [Google Scholar] [CrossRef]
- Hao, Y.; Gao, C.; Deng, S.; Yuan, M.; Song, W.; Lu, Z.; Qiu, Z. Chemical characterisation of PM2.5 emitted from motor vehicles powered by diesel, gasoline, natural gas and methanol fuel. Sci. Total Environ. 2019, 674, 128–139. [Google Scholar] [CrossRef] [PubMed]


| Parameter | Value |
|---|---|
| Engine type | Diesel engine |
| Capacity | 1.3 dm3 |
| Power | 55 kW for 4000 rpm |
| Torque | 190 Nm for 1750–2500 rpm |
| Number of cylinders | 4 |
| Number of valves | 16 |
| Piston stroke | 82 mm |
| Cylinder diameter | 69.6 mm |
| Compression ratio | 17.0:1 |
| Registered Mass (m/z) | Chemical Formula | Registered Mass (m/z) | Chemical Formula |
|---|---|---|---|
| 18 | H2O | 45 | CH3CHOH, CH2OCH3, CH2CH2OH, COOH |
| 22 | doubly charged molecular ion, CO22+. | 46 | NO2 |
| 43 | C3H7, CH3C=O | 58 | C2H2S CH3-CO-CH2+H |
| 44 | CO2, CH3CH-NH2 |
| Elemental Composition for Diesel Engine | Elemental Composition for Petrol Engine | Elemental Composition for Pure Filter | ||||
|---|---|---|---|---|---|---|
| Element | Mass Norm. (%) | Abs. Error (1sigma) % | Mass Norm. (%) | Abs. Error (1sigma) % | Mass Norm. (%) | Abs.Error (1sigma) % |
| Carbon | 45.72 | 8.98 | 41.69 | 7.12 | 9.28 | 1.75 |
| Oxygen | 38.48 | 5.19 | 28.95 | 4.96 | 43.75 | 5.09 |
| Sodium | 3.65 | 0.39 | 5.83 | 0.48 | 7.46 | 5.09 |
| Silicon | 6.16 | 0.44 | 18.63 | 0.98 | 26.11 | 1.03 |
| Calcium | 0.84 | 0.09 | 2.86 | 0.15 | 1.43 | 0.09 |
| Iron | 18.02 | 0.91 | Not detected | Not detected | Not detected | Not detected |
| Sulfur | 0.16 | 0.05 | 0.15 | 0.05 | Not detected | Not detected |
| Aluminum | 0.38 | 0.07 | 0.90 | 0.09 | 2.88 | 0.16 |
| Magnesium | 0.38 | 0.08 | 0.77 | 0.09 | Not detected | Not detected |
| Potassium | Not detected | Not detected | 0.22 | 0.05 | 2.43 | 0.11 |
Publisher’s Note: MDPI stays neutral with regard to jurisdictional claims in published maps and institutional affiliations. |
© 2021 by the authors. Licensee MDPI, Basel, Switzerland. This article is an open access article distributed under the terms and conditions of the Creative Commons Attribution (CC BY) license (https://creativecommons.org/licenses/by/4.0/).
Share and Cite
Jasiński, R.; Strzemiecka, B.; Koltsov, I.; Mizeracki, J.; Kurzawska, P. Physicochemical Analysis of the Particulate Matter Emitted from Road Vehicle Engines. Energies 2021, 14, 8556. https://doi.org/10.3390/en14248556
Jasiński R, Strzemiecka B, Koltsov I, Mizeracki J, Kurzawska P. Physicochemical Analysis of the Particulate Matter Emitted from Road Vehicle Engines. Energies. 2021; 14(24):8556. https://doi.org/10.3390/en14248556
Chicago/Turabian StyleJasiński, Remigiusz, Beata Strzemiecka, Iwona Koltsov, Jan Mizeracki, and Paula Kurzawska. 2021. "Physicochemical Analysis of the Particulate Matter Emitted from Road Vehicle Engines" Energies 14, no. 24: 8556. https://doi.org/10.3390/en14248556
APA StyleJasiński, R., Strzemiecka, B., Koltsov, I., Mizeracki, J., & Kurzawska, P. (2021). Physicochemical Analysis of the Particulate Matter Emitted from Road Vehicle Engines. Energies, 14(24), 8556. https://doi.org/10.3390/en14248556