1. Introduction
In order to meet Paris Agreement [
1] and limit global emissions, electricity production needs to accelerate the shift to cleaner sources. Wind energy is already largely contributing to this clean energy mix as it represents one fourth of the global renewable energy capacity, and is bound to increase in the near future. Among this production, offshore wind energy accounts for 4.5%. Offshore production has several advantages, such as less land use and better opportunities to benefit from high wind speeds. Hence researchers, along with Transmission System Operators (TSOs), are focusing on planning the roll-out of large scale offshore energy hubs. For instance, the North Sea Wind Power Hub (NSWPH) consortium specifically aims at managing this roll-out, as stated in [
2].
This progressive, but swift, deployment of intermittent renewable sources ineluctably calls for a matching deployment of storage solutions, in order to continue to ensure security of supply of electricity all day long and all year round. Along with large scale offshore wind hubs comes the topic of large scale seasonal storage. One of the most feasible and investigated options for such long-term storage is the power-to-gas solution, as can be read in [
3]. For example, part of the electricity produced offshore could be converted into hydrogen, stored in tanks or salt caverns [
4], and either used as such or converted back into electricity when needed. Multiple studies reveal that in such a scenario, directly converting the electricity into hydrogen offshore is beneficial: complete analysis was carried out in [
5,
6], highlighting economical advantages, social acceptance, flexibility for TSOs and offshore large scale gas storage option. Other studies focus on one precise aspect, such as economic benefits [
7] or geological storage potential [
8].
Another advantage of producing hydrogen offshore is that electrolysers can provide ancillary services to the offshore hub, as investigated in [
9]. Because offshore energy hubs are zero-inertia networks, they are very vulnerable to disturbances (e.g., sudden wind speed fluctuations, short circuits) [
10]. Ancillary services such as frequency and voltage support are of great importance in this kind of networks. Large scale multi-MW electrolysers, along with their converters and appropriate control functions could become a provider of such services in an offshore hub. According to recent literature, Electromagnetic Transient (EMT) models are the preferred option for the study of offshore energy hubs due to the fast dynamic phenomena that can be excited by disturbances [
10].
In [
11], the first EMT model of a 300 MW scale Proton Exchange Membrane (PEM) electrolyser for real-time simulation in RSCAD
® was developed for stability studies of onshore systems. Assuming that mass transfer losses and activation losses are negligible, the PEM stack is modeled as a constant voltage source in series with a resistance. The stack is then connected to the grid through a buck converter (DC-DC converter), a rectifier and a transformer. The Balance of Plant (BoP) components are modeled as a constant voltage source, representing a load of about 10% of the total electrolyser power demand. The control scheme implemented in [
11] for monitoring of the electrolyser has two main objectives: maximizing the hydrogen production, and enabling ancillary services capabilities in a stable manner. The above-mentioned PEM electrolyser model was tested by considering the connection to a high inertia onshore system. However, there is no warranty that the model will perform well when connected to zero-inertia network (e.g., due to the non-ideal representation of switches).
Aside from the model development, the location of the conversion in the energy transmission network should be considered. No studies on the physical response (fast dynamic phenomena) based on EMT models of a large scale electrolyser connected to an offshore hub have been reported so far. Some preliminary techno-economic studies, using very simplified models and considering several possible locations of the conversion step, have been done, such as in [
12]; some similar techno-economic studies considering various locations has been done in [
13], with another type of energy storage, namely superconducting magnetic energy storage.
Parallel to model development, the first pilot projects of wind-turbine connected electrolysers are in progress. The first platform for offshore green hydrogen production has been commissioned in 2019 and is being built in the North Sea as part of the PosHYdon project [
14]. Additionally, the first pilot project of a wind turbine (3 MW) connected to an electrolyser (400 kW) and capable of operating in islanded mode is currently being tested in Denmark, with the project Brande Hydrogen [
15]. The effect of fluctuating power input on the operation of the electrolyser is one of the main stakes of the study. Offshore hydrogen production is already a medium-term goal for the industry [
16]. The full-scale wind turbine-integrated electrolyser demonstrators are planned for 2026 [
17].
The key technical contribution of this paper is the integration of an electrolyser system in the EMT model of a multi-GW offshore renewable energy hub, and the investigation of two possible locations for the connection of the electrolyser, under wind speed fluctuation.
Based on the EMT real-time simulation model of an offshore hub presented in [
10], this paper focuses on the addition of PEM electrolysers for the study of the dynamics of active power and voltage responses of offshore hubs due to wind speed fluctuations. The main contribution of the paper resides in the investigation of two theoretical locations of the connection of PEM electrolysers: centralised (at the AC common bus of the hub) or distributed (at the DC link of the wind turbines). In the centralised case, the PEM electrolyser model proposed in [
11] is modified to solve the issue of high artificial losses (due to the simplified switch representation in RSCAD
®) in the buck converter. In the distributed case, the control of the electrolyser’s buck converter is modified to prevent adverse implications on the DC voltage of the DC link of the back-to-back converter of the Type-4 wind generators.
The subsequent sections are organised as follows. In
Section 2, the RSCAD
® software and the hub model layout are introduced, and the model of the electrolyser system is presented. In
Section 3, the control strategy of the converters of the electrolyser system is explained. Only control logic that is relevant to the addition of the PEM electrolyser in a specific location is detailed. The results of the simulations are presented in
Section 4.
Section 5 concludes the paper.
2. Electrolyser System Model in RSCAD®
The Real Time Digital Simulator (RTDS) tool has been chosen to preform the simulations presented in this paper, as it enables to perform real-time EMT simulations. This tool is associated with a software called RSCAD
®. This section focuses first on the RSCAD
® software, and then on the RSCAD
® model of the hub and the design of the electrolyser system. The baseline model chosen for the hub is presented in this section, and the design choices for the electrolyser model are explained. Only the modelling of the electrolyser is described in this section, with focus on the integration either at the DC link of the wind turbine or at the common bus. Detailed description of the electrolyser model can be found in [
11].
2.1. EMT Simulations
Two types of models can mainly be used to simulate power systems: Root Mean Square (RMS) models and Electromagnetic Transient (EMT) models. RMS models use a phasor simulation method, in which the network is simulated with fixed complex impedances instead of differential equations. It is an average model, convenient to study power system stability in the case of large interconnected systems, including electro-mechanical oscillations (small-signal stability), rotor-angle stability of synchronous generators and voltage and frequency stability. In these kinds of models, the network is assumed to operate in perfectly balanced conditions, therefore only the positive sequence components is non-zero, hence it is the only component considered. Fast switching transients, as well as controls with very small time constants, are ignored [
18].
EMT models solve the differential equations representing a three phase electrical network, by converting them to algebraic equation, based on the Dommel algorithm [
19]. The Dommel algorithm, which principle is described in [
20], uses the trapezoidal rule of integration to achieve the conversion. Once the algebraic equations are computed, the conductance matrix of the network (which is a square matrix with a size of the number of nodes in the network) is obtained. The RTDS solves the inverse of this matrix using the LU decomposition, which is then multiplied by the current vector to obtain the voltage vector [
19].
To conclude, EMT simulation is used because it enables to visualize fast switching transients of power electronic equipment, which could not be captured by a phasor simulation method such as RMS.
2.2. RTDS and RSCAD®
2.2.1. Hardware
RSCAD
® is a software developed to run EMT simulations on the dedicated hardware of the RTDS Simulator. The software provides a user-friendly interface that can be run on the user’s computer, while the simulation is processed on specialized RTDS units: PB5 cards or NovaCor units, the latter having up to 10 cores [
21]. In this work, three NovaCor units of four cores each has been used. The different parts of the networks were assigned to the NovaCor units as shown in
Appendix B (Scenario 1) and
Section 2.6.2 (Scenario 2).
2.2.2. Modeling Environments and Time Step
In order to represent the transients as accurately as possible without saturating the computational capabilities of the hardware, different modeling environments are available in RSCAD
®, each having a different simulation time-step: the main step environment can range from 25 to 50
s and the small time step environment from 1 to 4
s. The time step size of the substep environment is in the same range as the small time step environment, but with different features, such as a different switch representation, as detailed in
Section 2.6.
2.2.3. Switch Control in RSCAD®
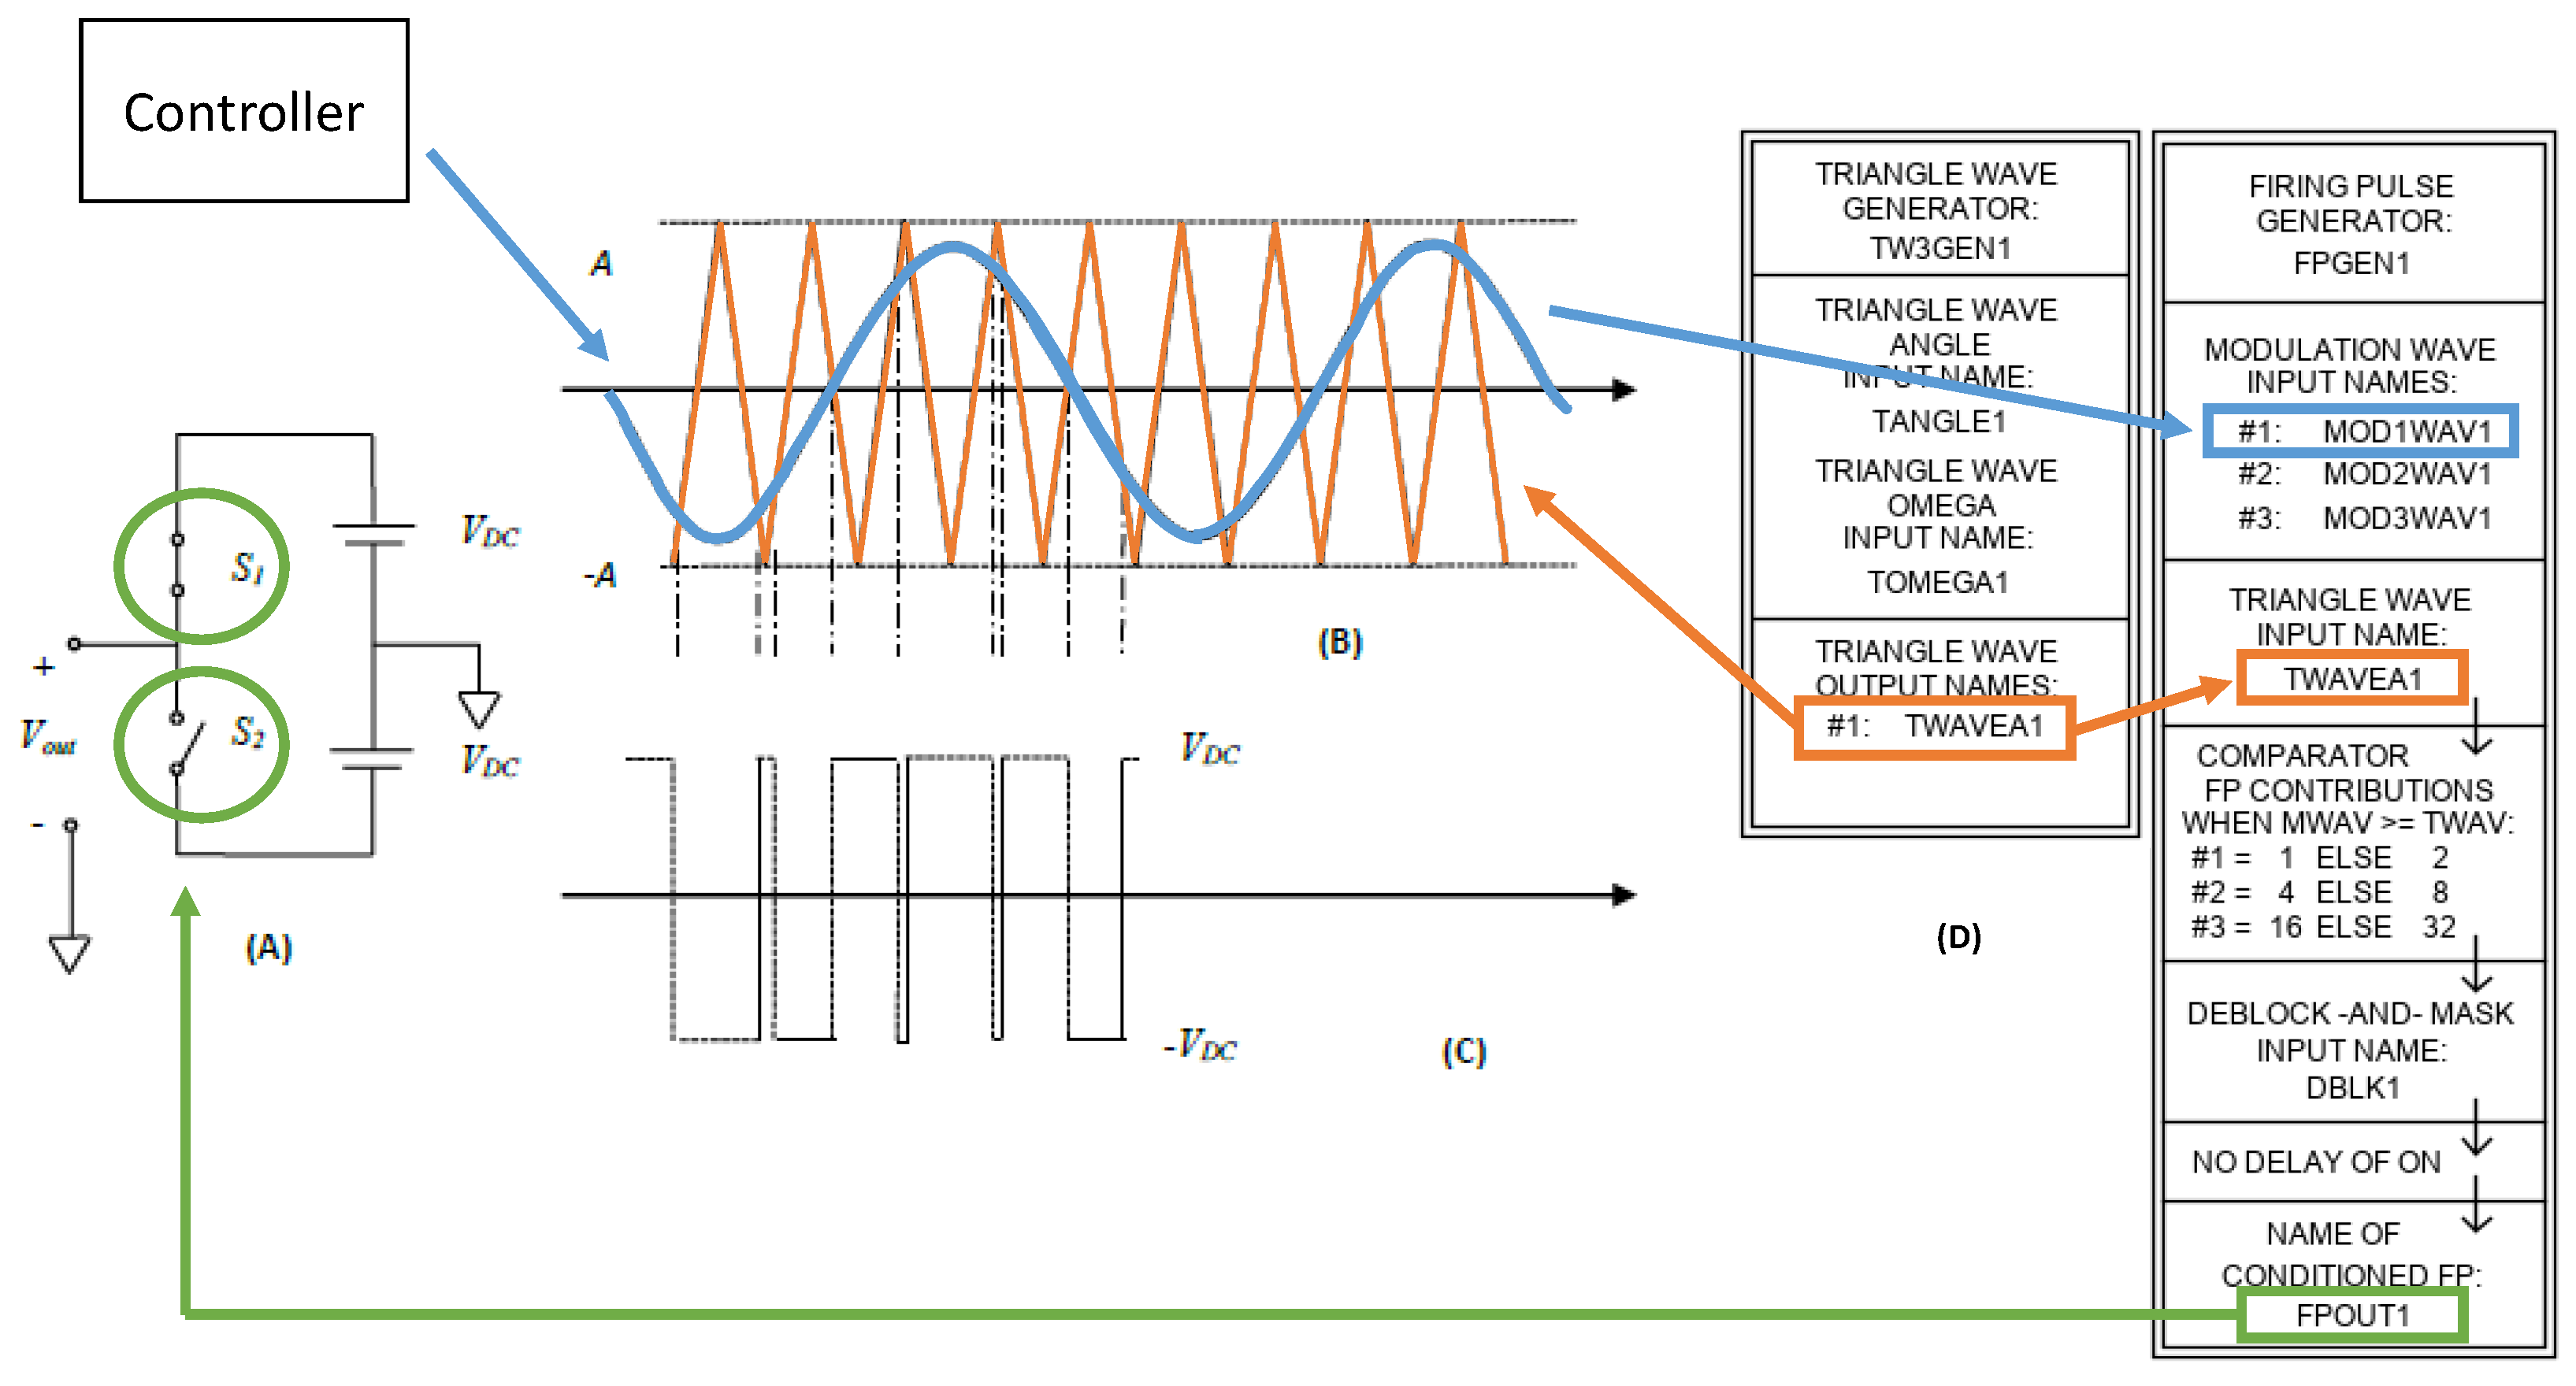
The method used in RSCAD
® to control the switches in the different converters is Sinusoidal Pulse Width Modulation (PWM). The converter controller generates a modulation signal (in blue in
Figure 1) which is compared to a triangular wave (in orange in
Figure 1), produced by a triangular wave generator. In
Figure 1, the example of a one-leg system is considered. The two signals mentioned above are compared by the firing pulse generator. The first switch will be turned off as soon as the value of the triangular wave rises above the value of the modulation signal. When the value of the triangular signal falls below the value of the modulation signal, the first switch will be turned on. The second switch will be the control in a complimentary way. The voltage output of the system will be similar to the square signal shown on the figure. Similarly, two other modulation signals can be added to the firing pulse generator to generate the signals for the two other legs of a three-leg converter [
19].
2.3. Network Topology
2.3.1. Baseline Hub Model
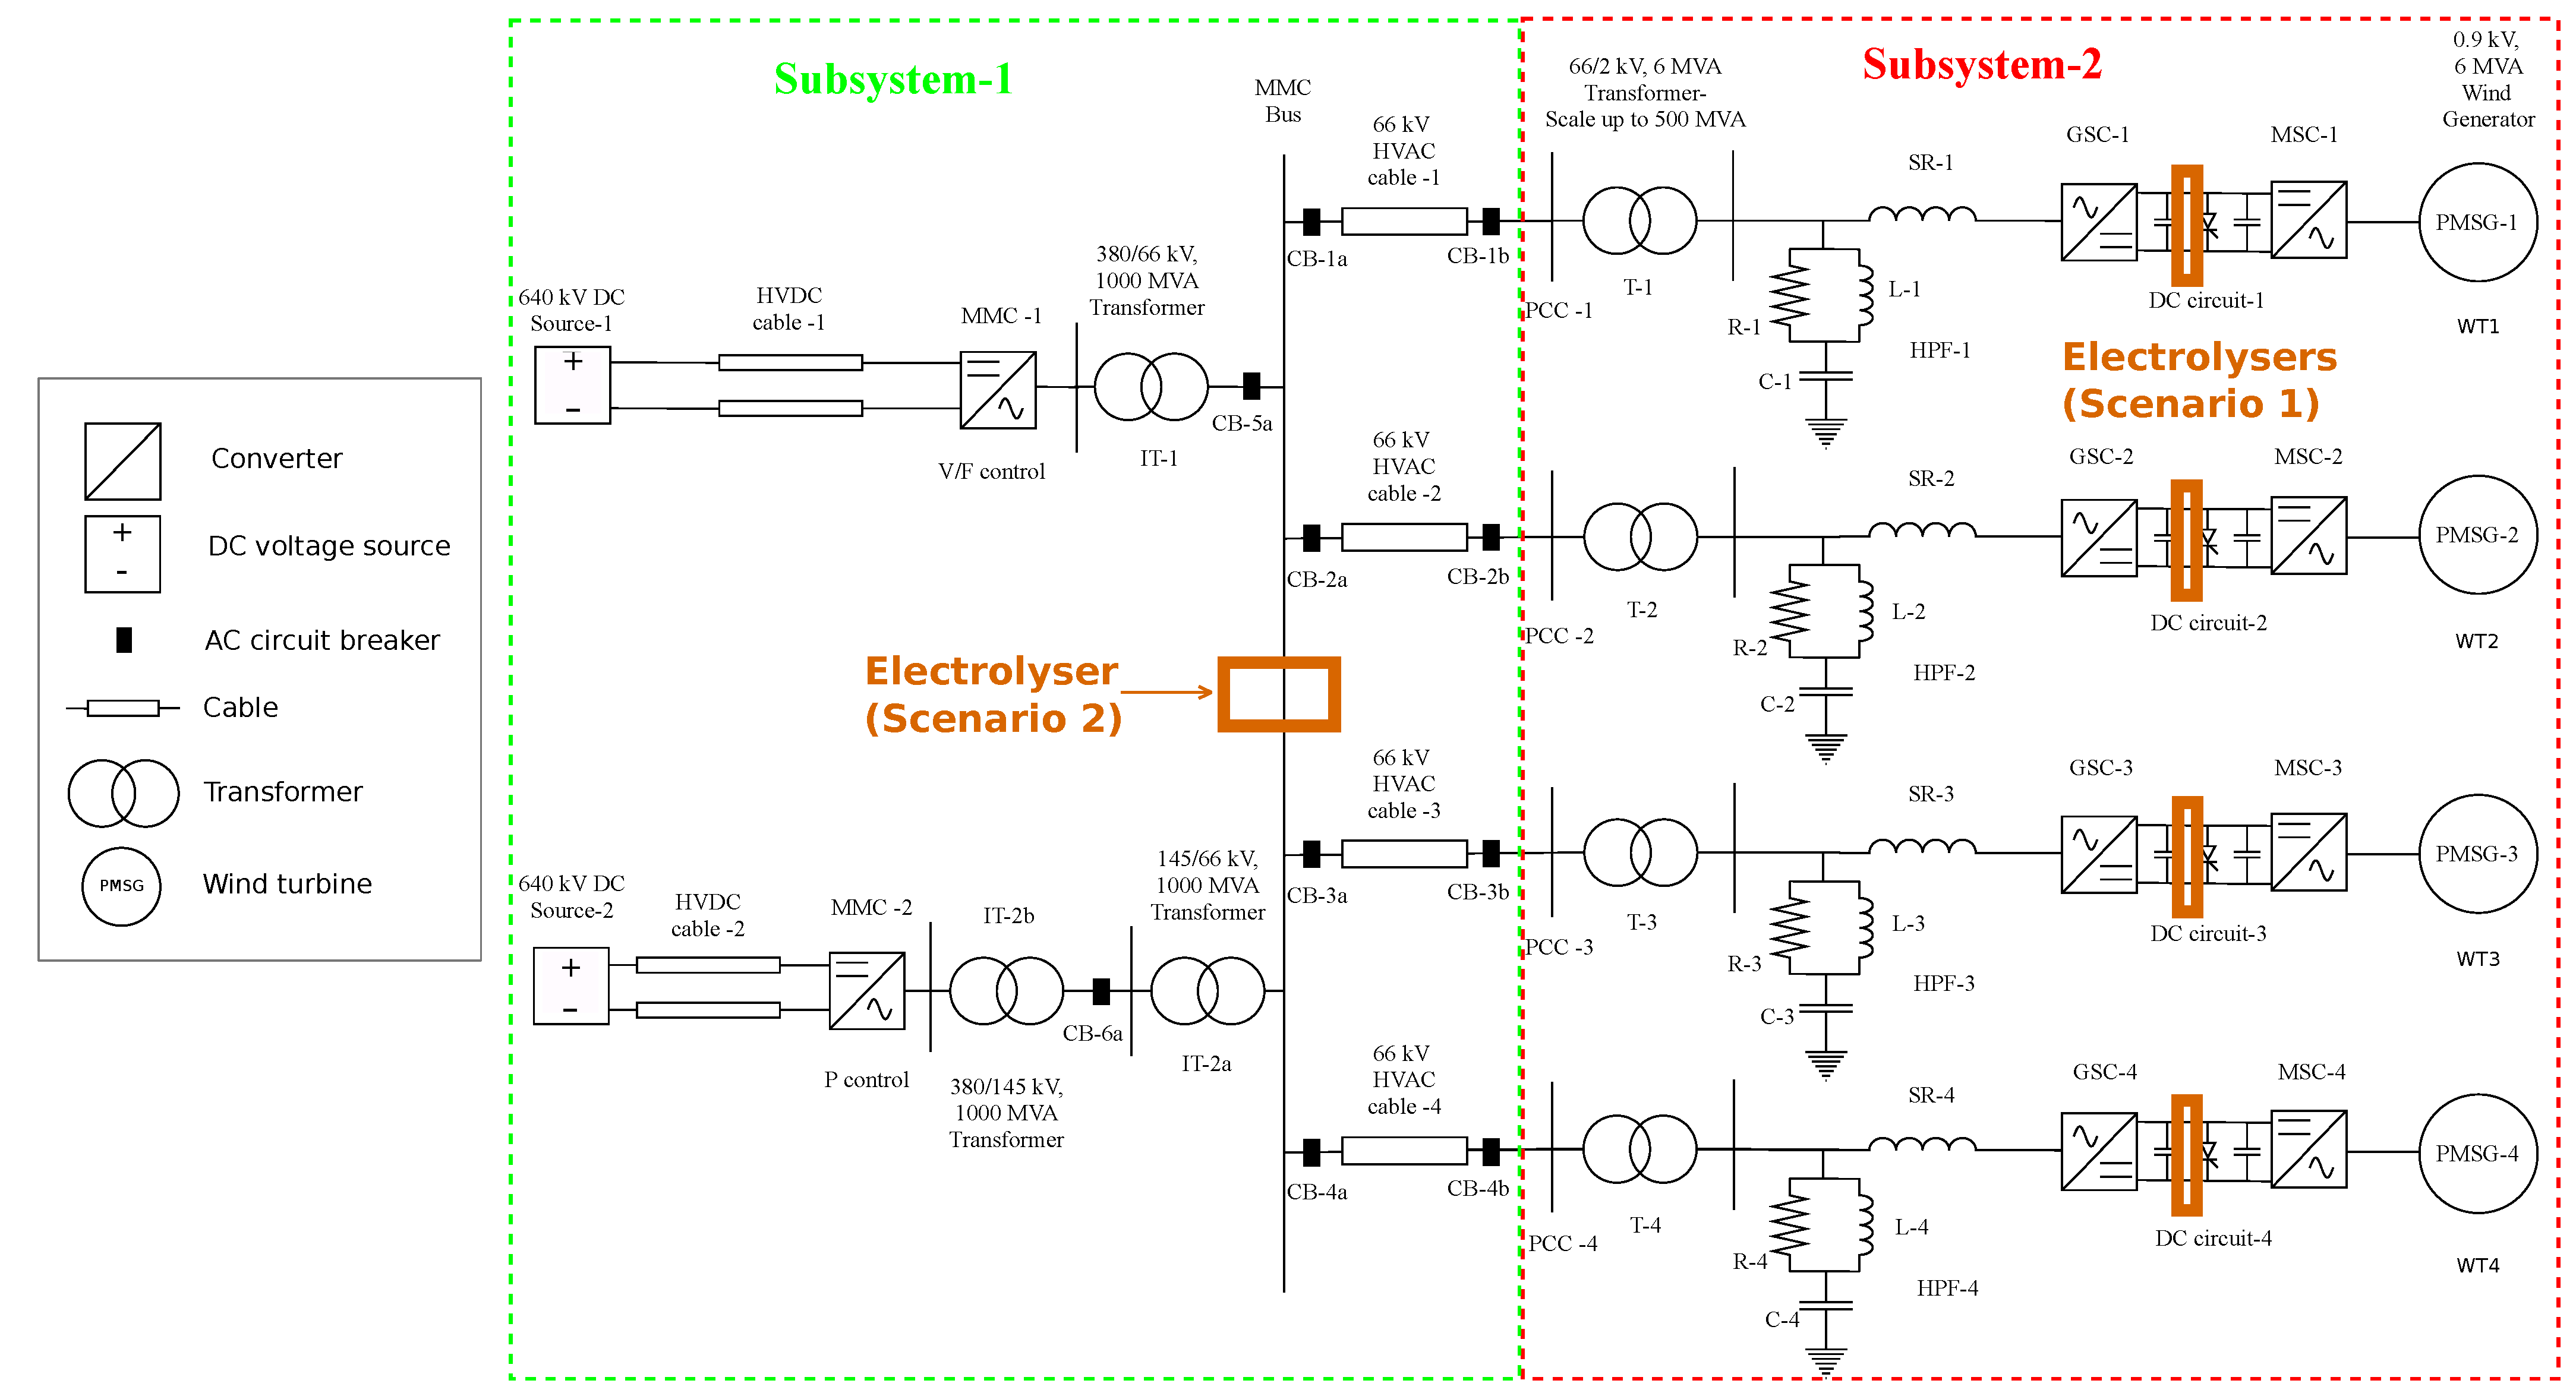
The network taken as baseline in this paper is the model developed in [
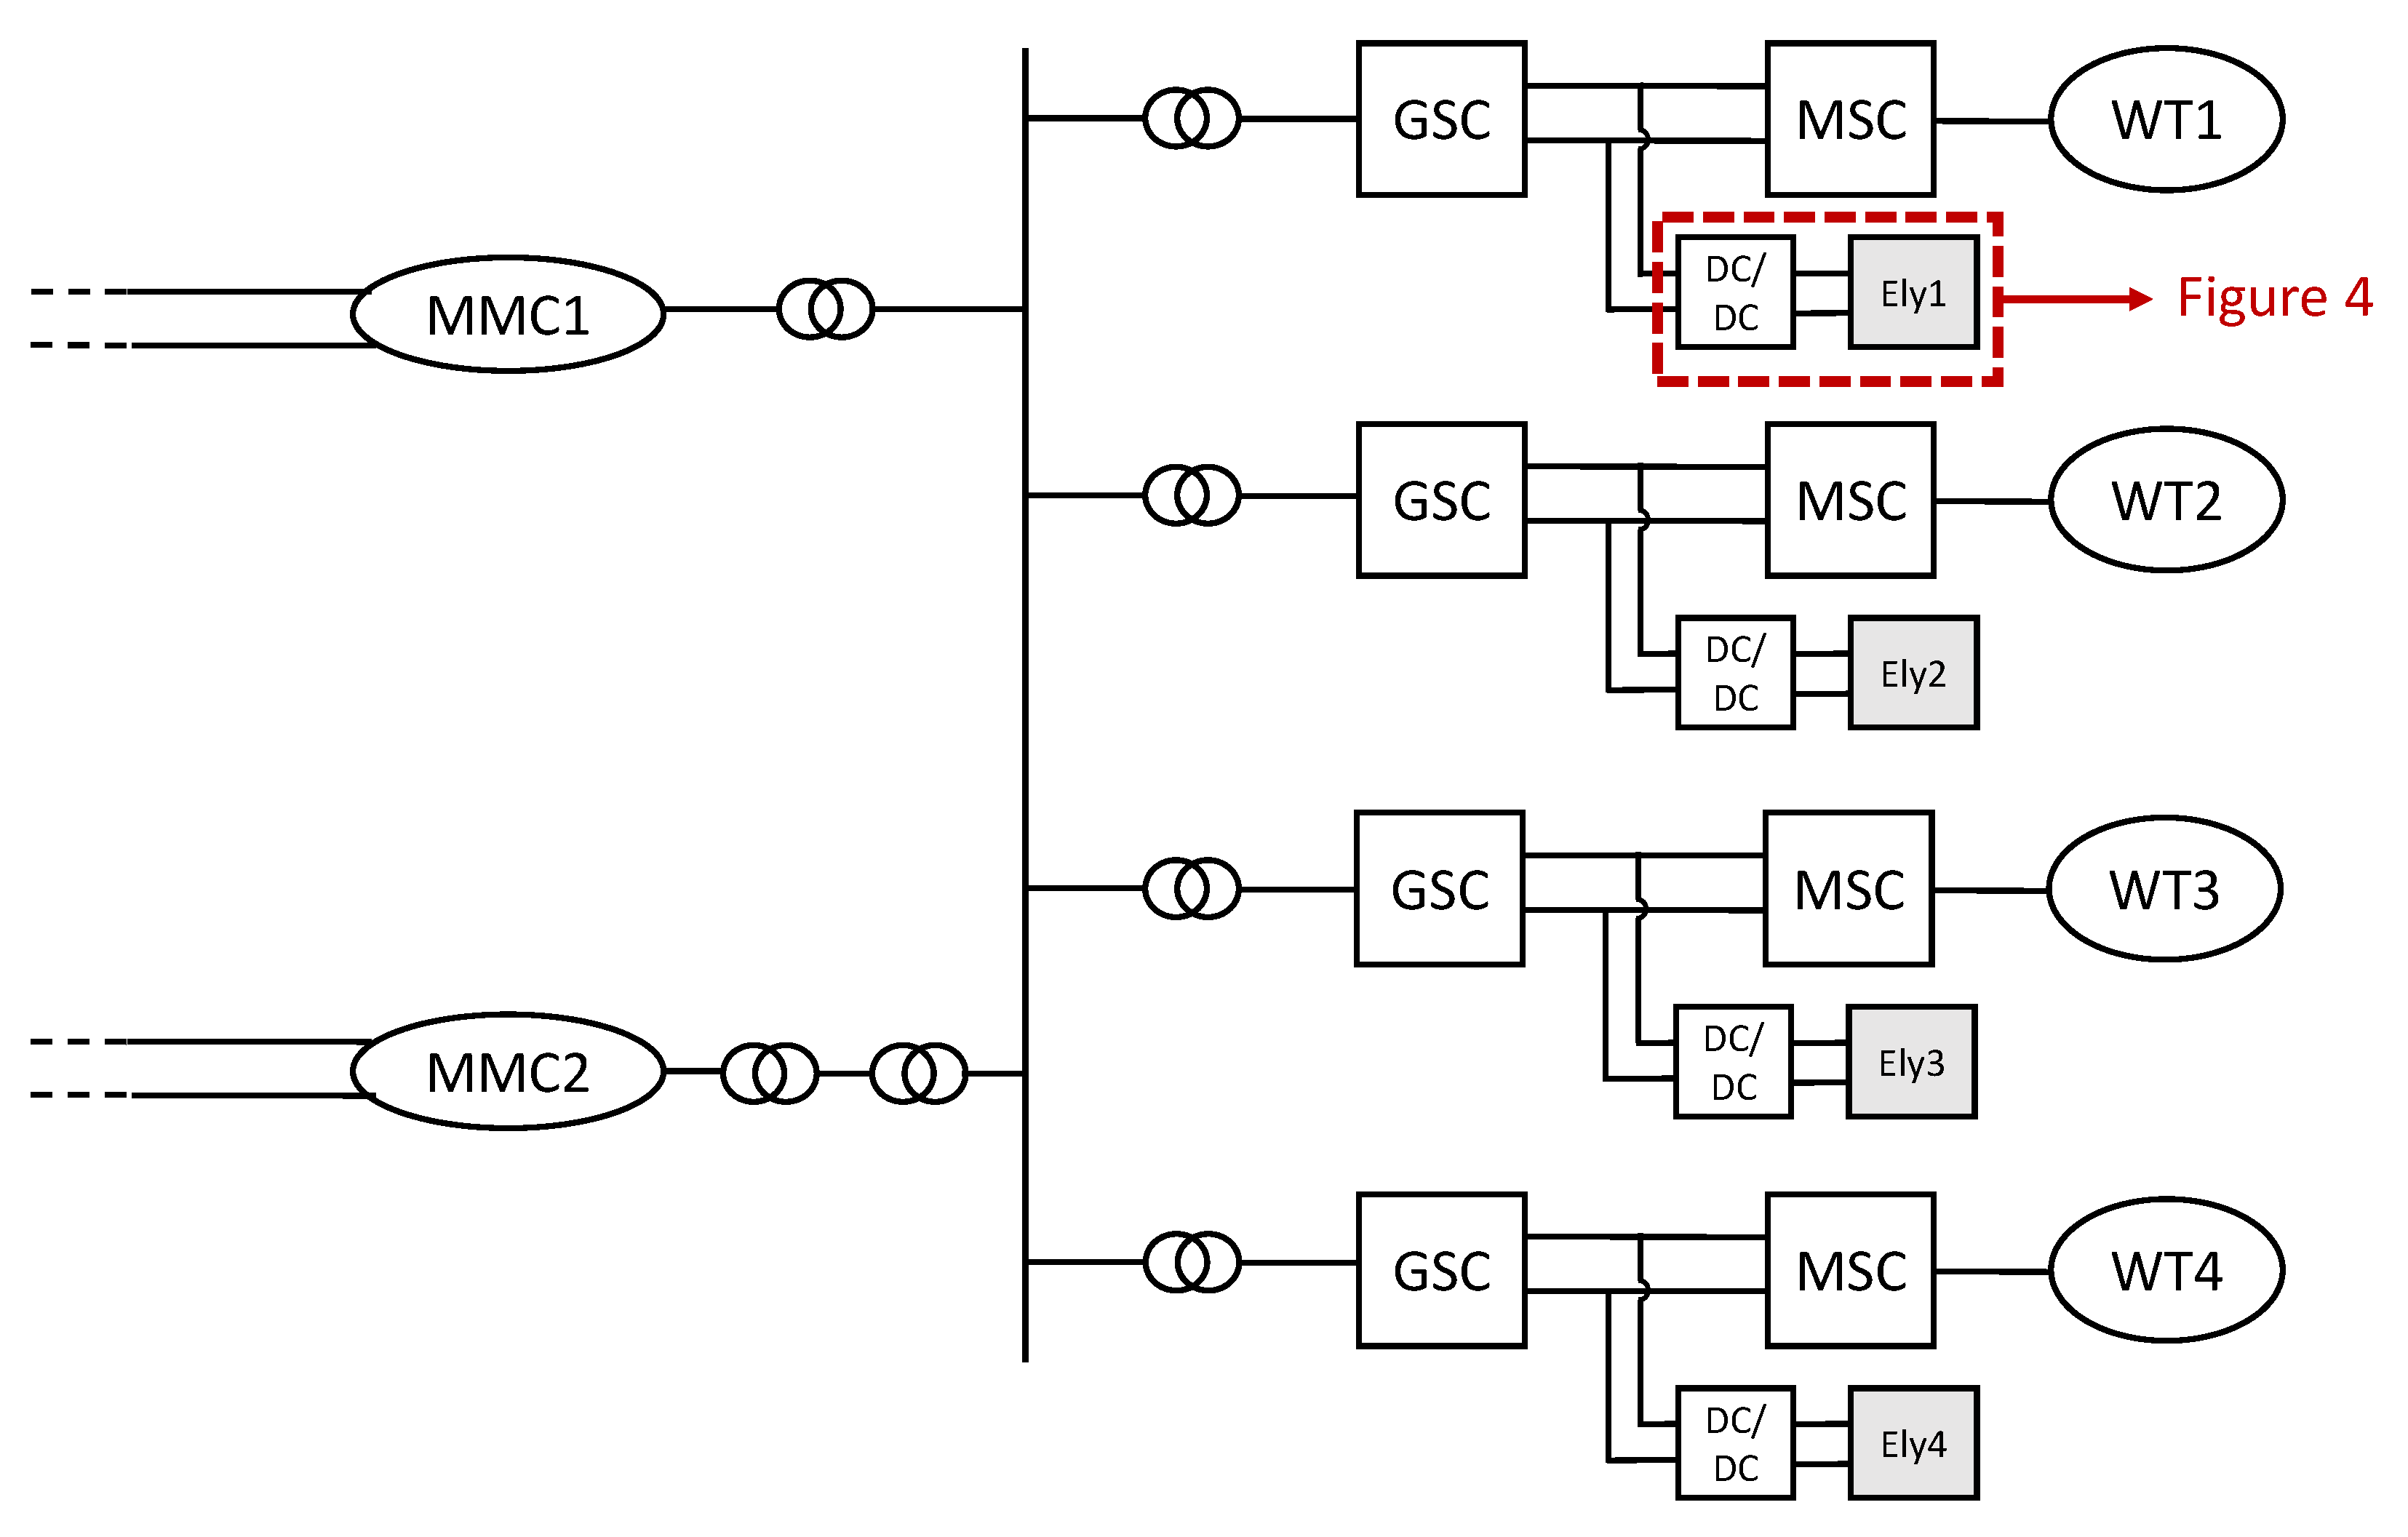
10], which is the first EMT model of a multi-GW offshore renewable energy hub available. The network layout can be seen in
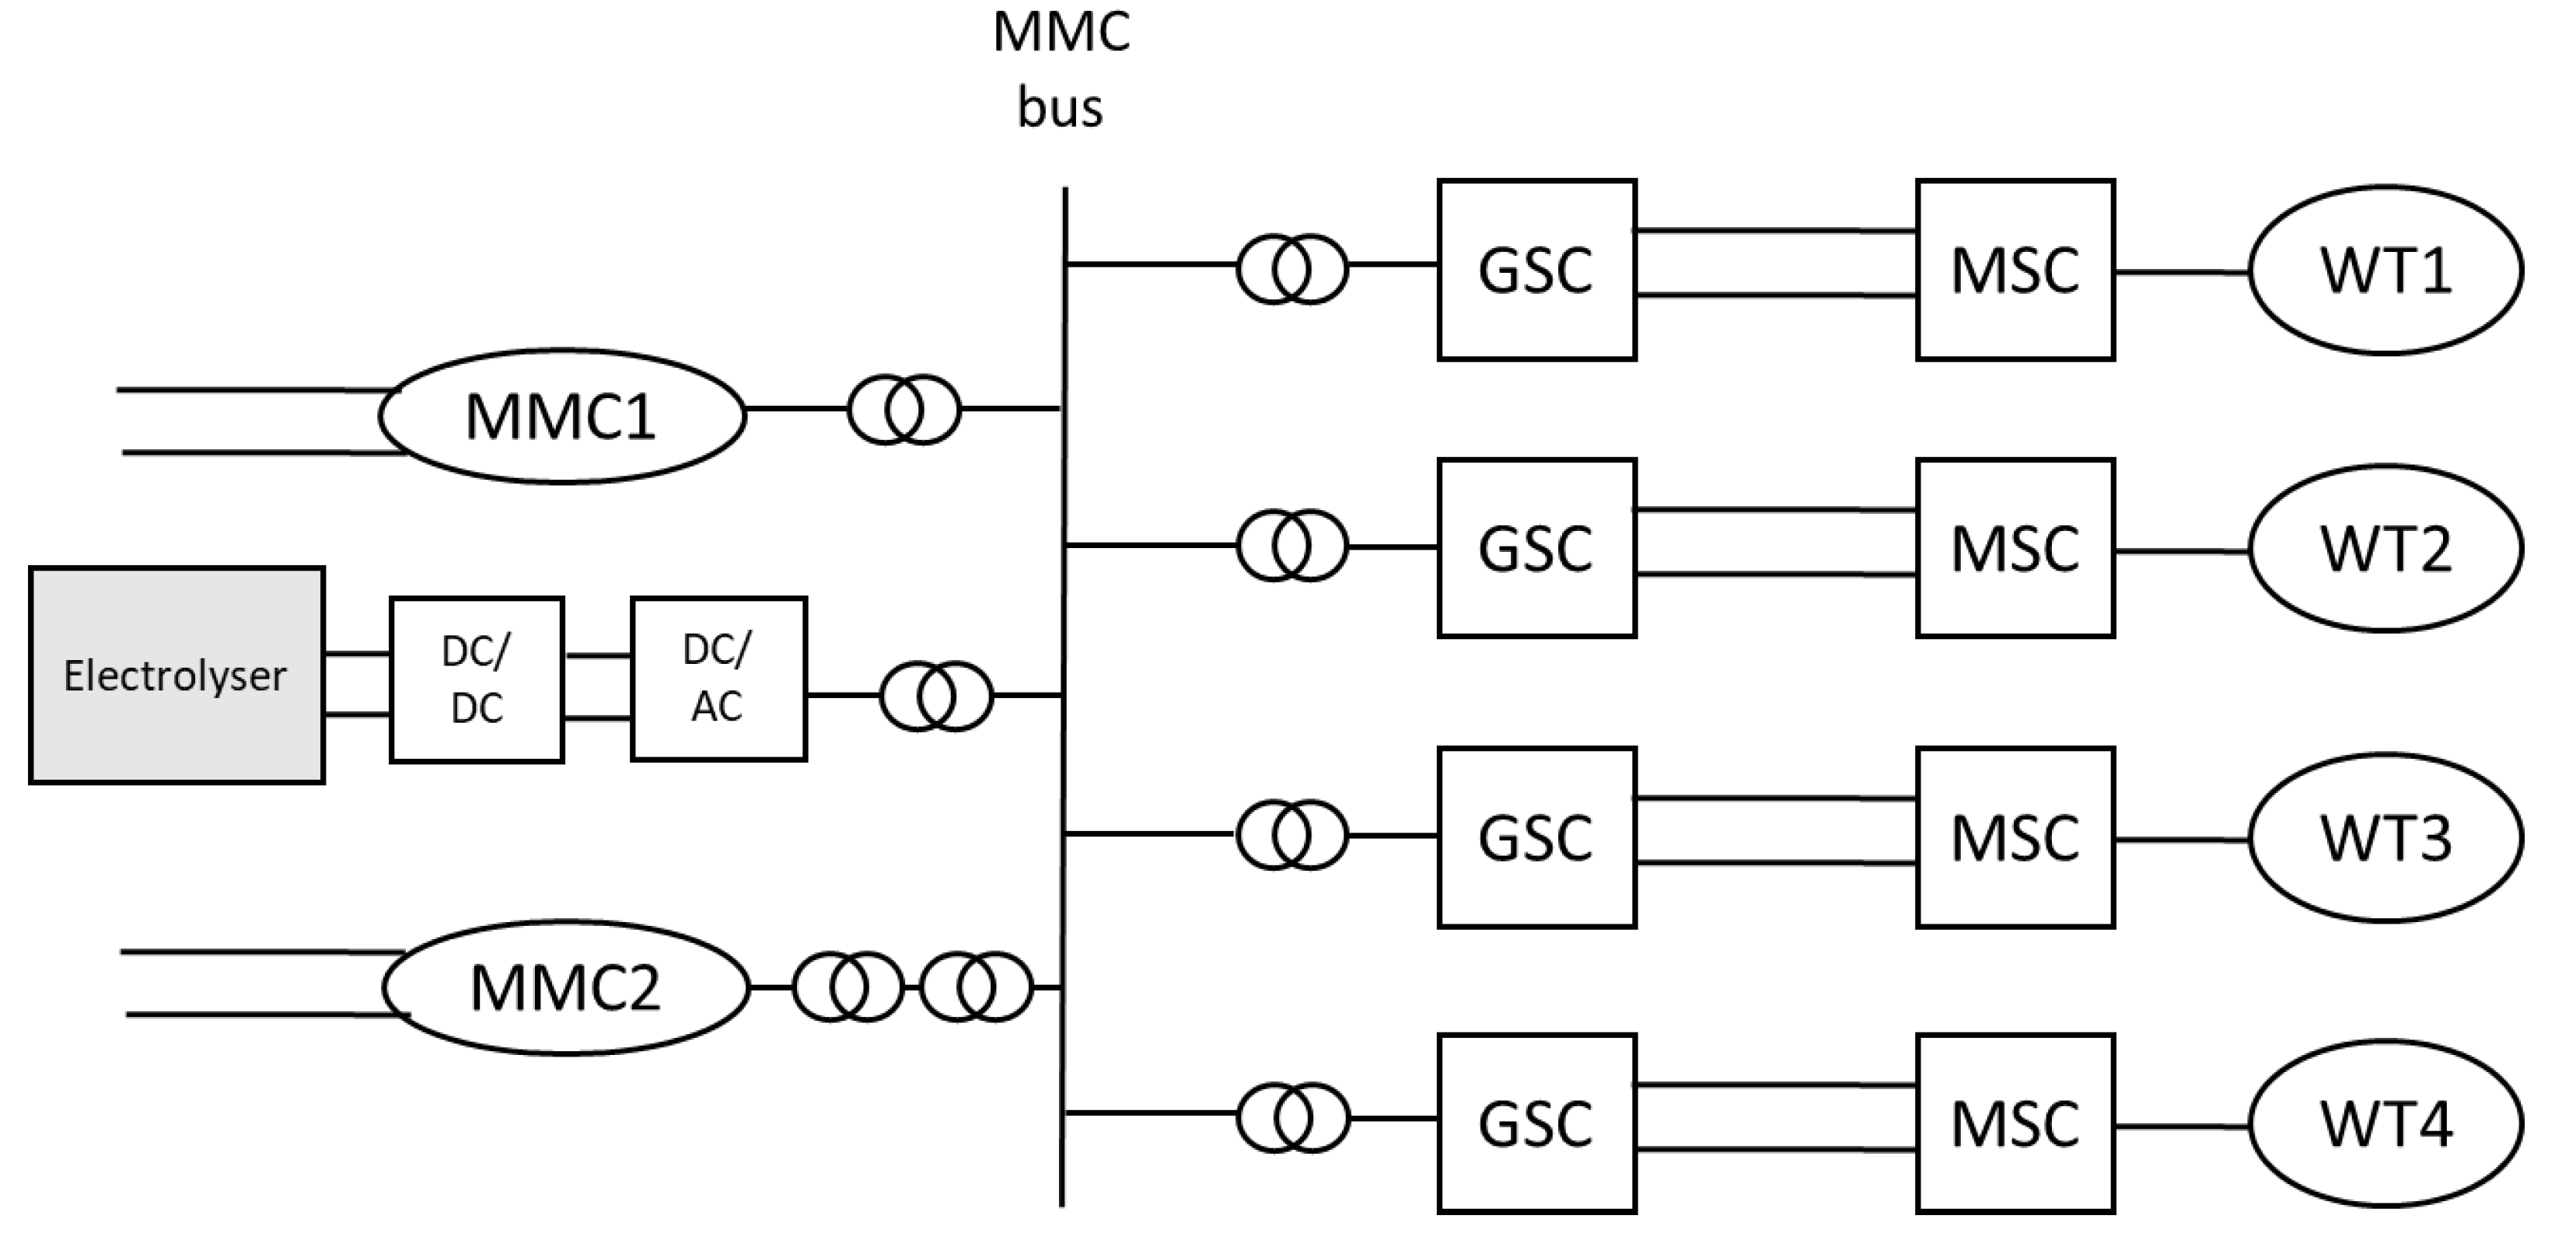
Figure 2. The hub consists of four offshore wind turbines, each feeding a rated power of 500 MW to the hub, and two Modular Multi-level converters (MMCs) rated at 1 GW each.
Each wind turbine is a type 4 model, connected to the common bus of the hub via a back-to-back converter, a transformer and a HVAC cable rated at 66 kV. The back-to-back converter is composed by a Machine Side Converter (MSC), a rectifier, a Grid Side Converter (GSC), and an inverter. The wind turbines are modelled with the Permanent Magnet Synchronous Generator (PMSG) technology. They are rated at 6 MW each, and their output is scaled up to 500 MW thanks to a scale up factor implemented in each transformer model in RSCAD
®. The parameters of the model can be found in [
10];
MMC models are average models. Each MMC forms a monopolar link, which is connected to an ideal voltage source representing a strong DC grid. One of the MMCs is grid-forming, while the other one is grid following. The voltage of the HVDC links is ±640 kV.
A more extensive description of the MMC and wind turbine models and controls can be found in [
22].
2.3.2. Location of the Electrolyser
Regarding the location, in [
12] as well as in [
13], three main locations are considered for the electrolyser: (i) in-turbine (DC link), (ii) next to the HVDC substation (common bus), and (iii) onshore. The third location is out of the scope of this work; therefore, in this paper, only the two offshore locations, which focus on the offshore hub performance, are considered. They constitute the two scenarios studied in this paper:
The location of the connection in the two scenarios can be seen in
Figure 2.
2.3.3. Sizing
Optimal electrolyser rated capacity has been estimated to be close to 30% of the wind turbine rated capacity in both [
12,
23]. This ratio has been adopted in the present work, but similarly to wind turbines, a scaling factor has been used. The scaling factor is implemented in the interface transformer between the electrolyser to the common bus of the hub, and it is multiplying the primary current (common bus side), therefore scaling up the power absorbed by the electrolyser. The scaling factors used are summarized in
Table 1. In Scenario 1, the scaling factor is the same as the one used for scaling up the power from the wind generators, since the electrolyser is located on the same side of the scaling transformer as the wind generator. The same value as in the baseline model has been used, because it enabled to achieve a total power of 2 GW. In Scenario 2, the value of the scaling factor has been rounded to 600 to get about one third of the total hub power (2 GW) from the 1 MW electrolyser.
2.4. Electrolyser Model
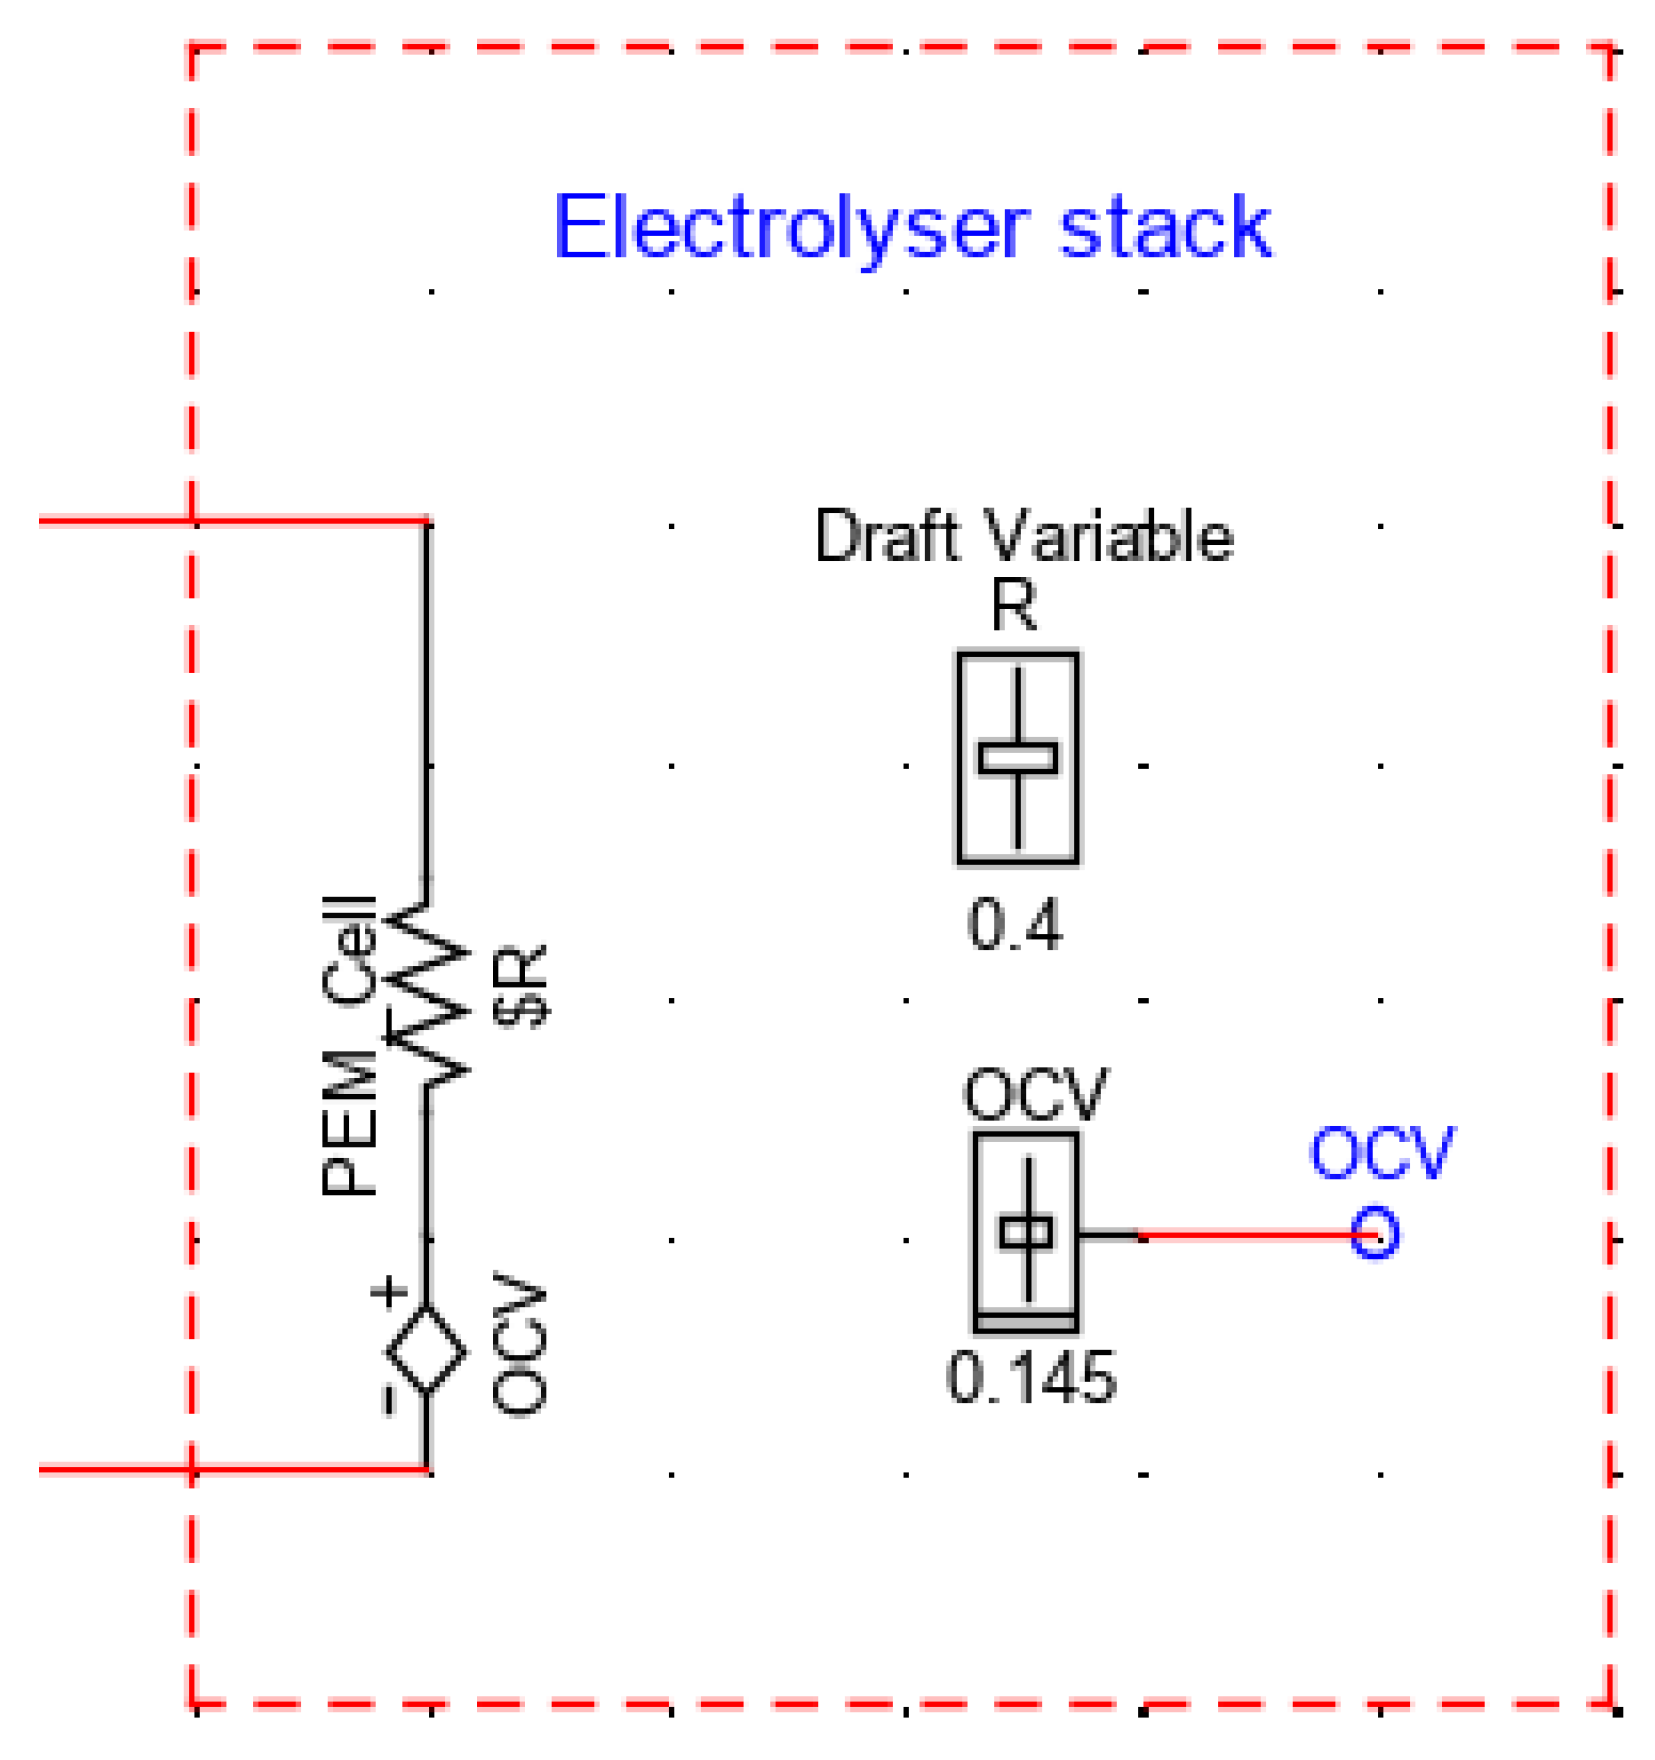
The electrolyser stack is modeled in RSCAD
® as a resistor connected in series with a voltage source, as proposed in [
11]. This model is shown in
Figure 3. With this simplified model, only ohmic losses in the electrolyser are modeled. This can be justified by the fact that the two other kinds of losses, activation losses and mass transport losses, can be neglected at medium current density [
11].
This model is an equivalent model to the actual stack, which is composed of multiple cells connected in series and in parallel. The corresponding parameters, that is, the equivalent resistance value and the equivalent open voltage value, can therefore be adapted by modifying the number of cells connected respectively in parallel and in series.
2.5. Control Logic
In both scenarios, the electrolyser buck converter is connected to a point at which the voltage is stable, because it is regulated by:
the GSC of the corresponding wind turbine, controlled with a Direct Voltage Control (DVC) scheme [
24], in Scenario 1;
MMC-1, the grid-forming MMC, to which a V/F control is applied [
10].
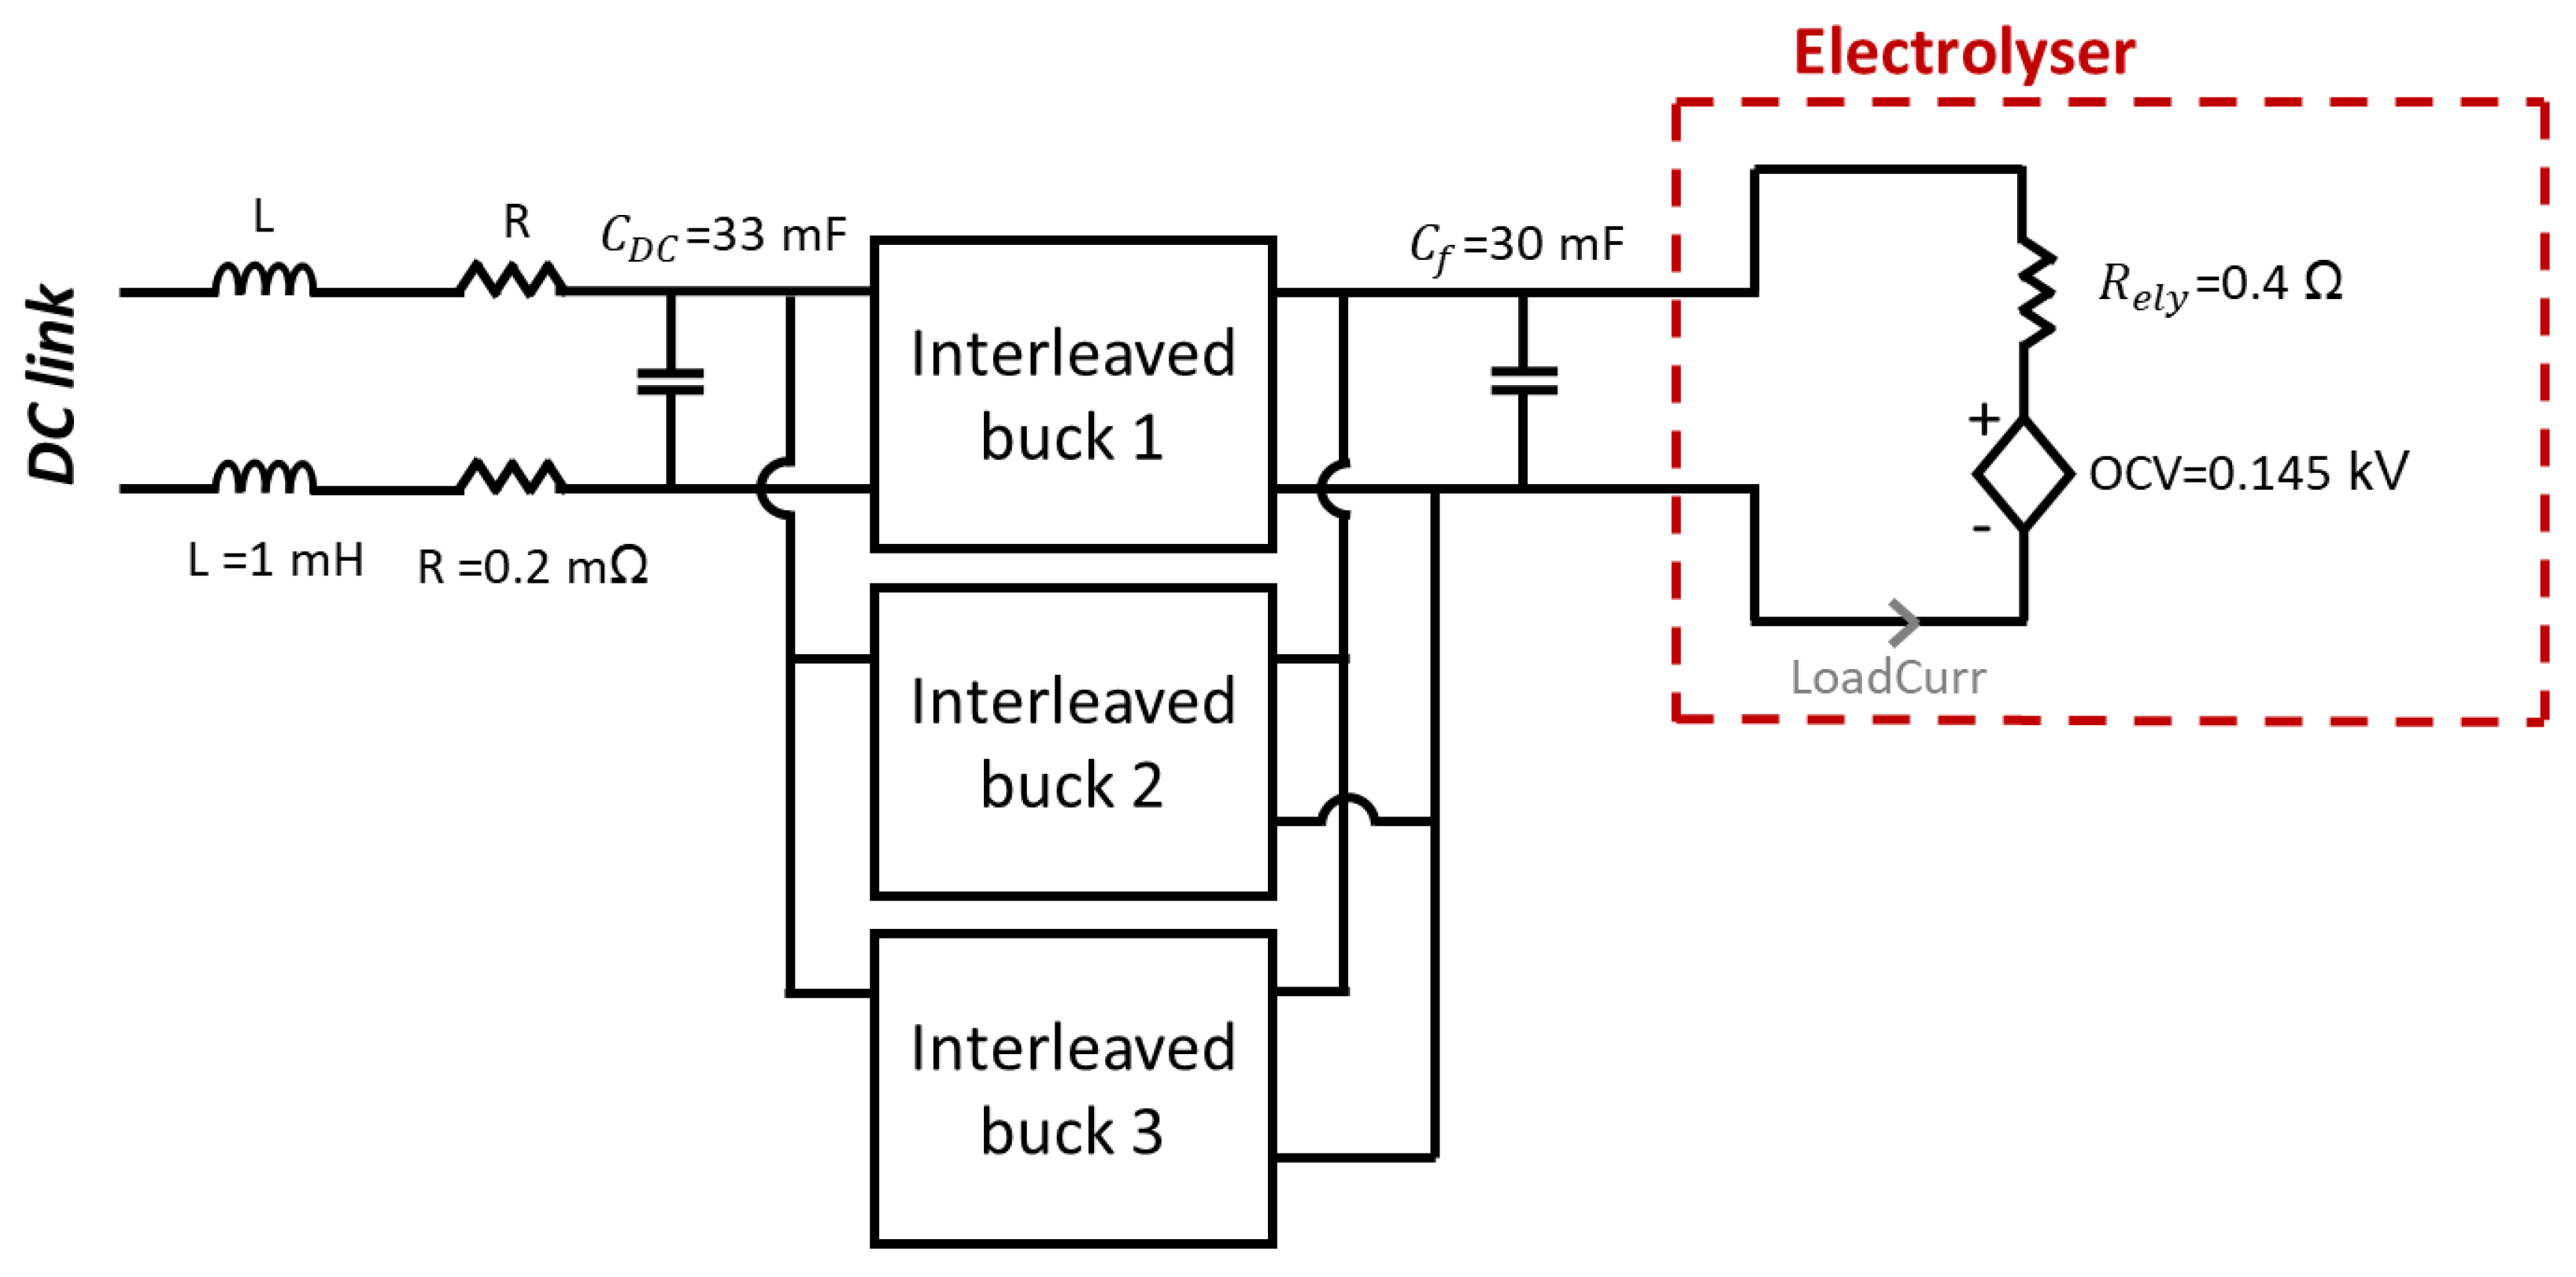
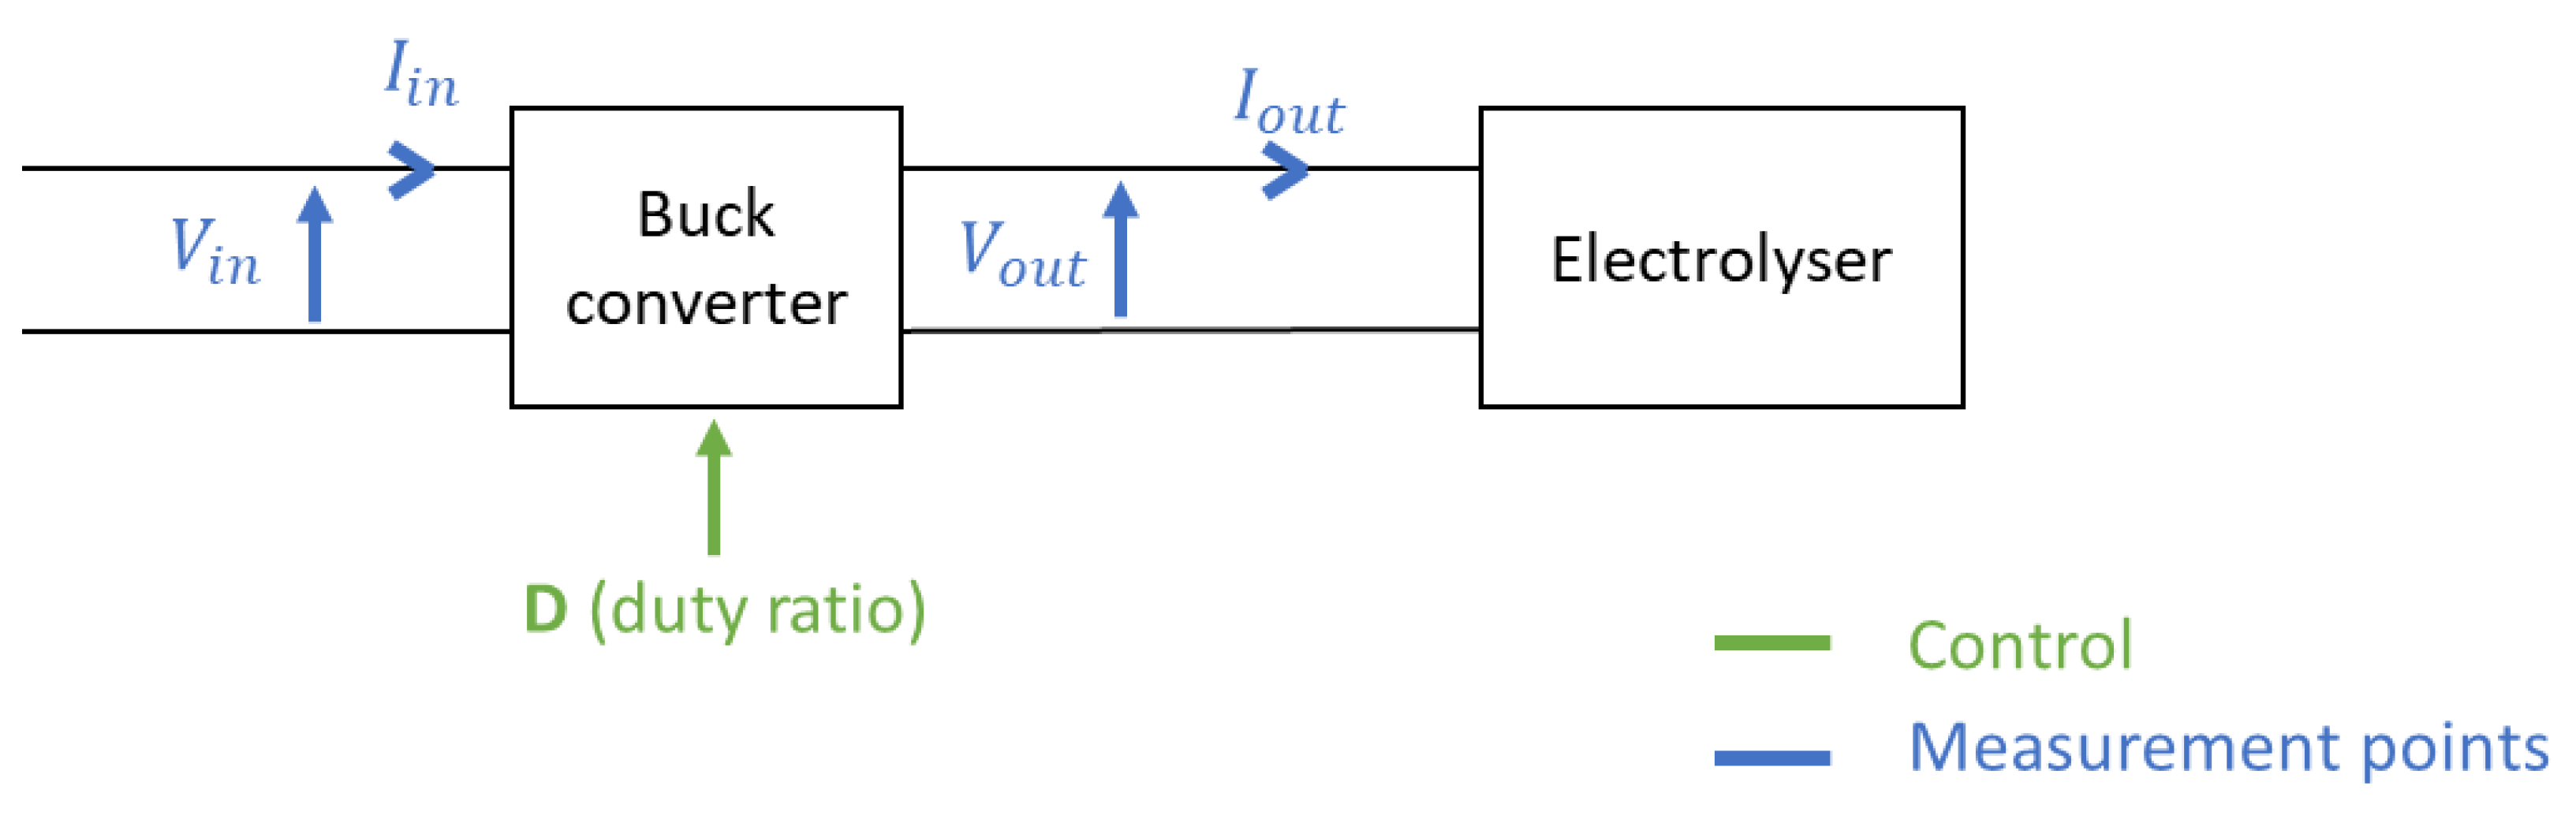
Therefore, the input voltage of the buck converter,
as defined in
Figure 4, is constant. Using the equation of the buck converter,
we can see that the output voltage of the buck converter,
, can be controlled by controlling the duty ratio
D of the buck converter. Assuming a linear model for the electrolyser, the output current
of the buck converter, which is the current of the electrolyser stack, will be proportional to
. Finally, the input current of the buck converter
will be set by the relation
Since can be monitored while is kept constant by the GSC, the input power of the buck converter (hence the electrolyser consumption) can be monitored.
2.6. Scenario Descriptions
2.6.1. Scenario 1: Electrolysers Connected to the DC Link of the Wind Turbines
In Scenario 1, the electrolysers are connected as pictured in
Figure 5. Each electrolyser is connected to the DC link of a wind turbine via a buck (DC/DC step-down) converter.
The RSCAD
® electrolyser cell and converter model, which can be seen in
Figure 6, are taken from the model developed in [
11]. In this model, the interleaved mode of operation is used, as it is usual for high current applications which require low output current ripple. This means that an inductor is connected to three branches of switches, connected in parallel, and with a relative phase shift (but the same duty ratio). This method is known to reduce the output current ripple. Three buck converters have been connected in parallel to realise high output currents [
11].
In RSCAD
®, different modeling environments are available, as mentioned in
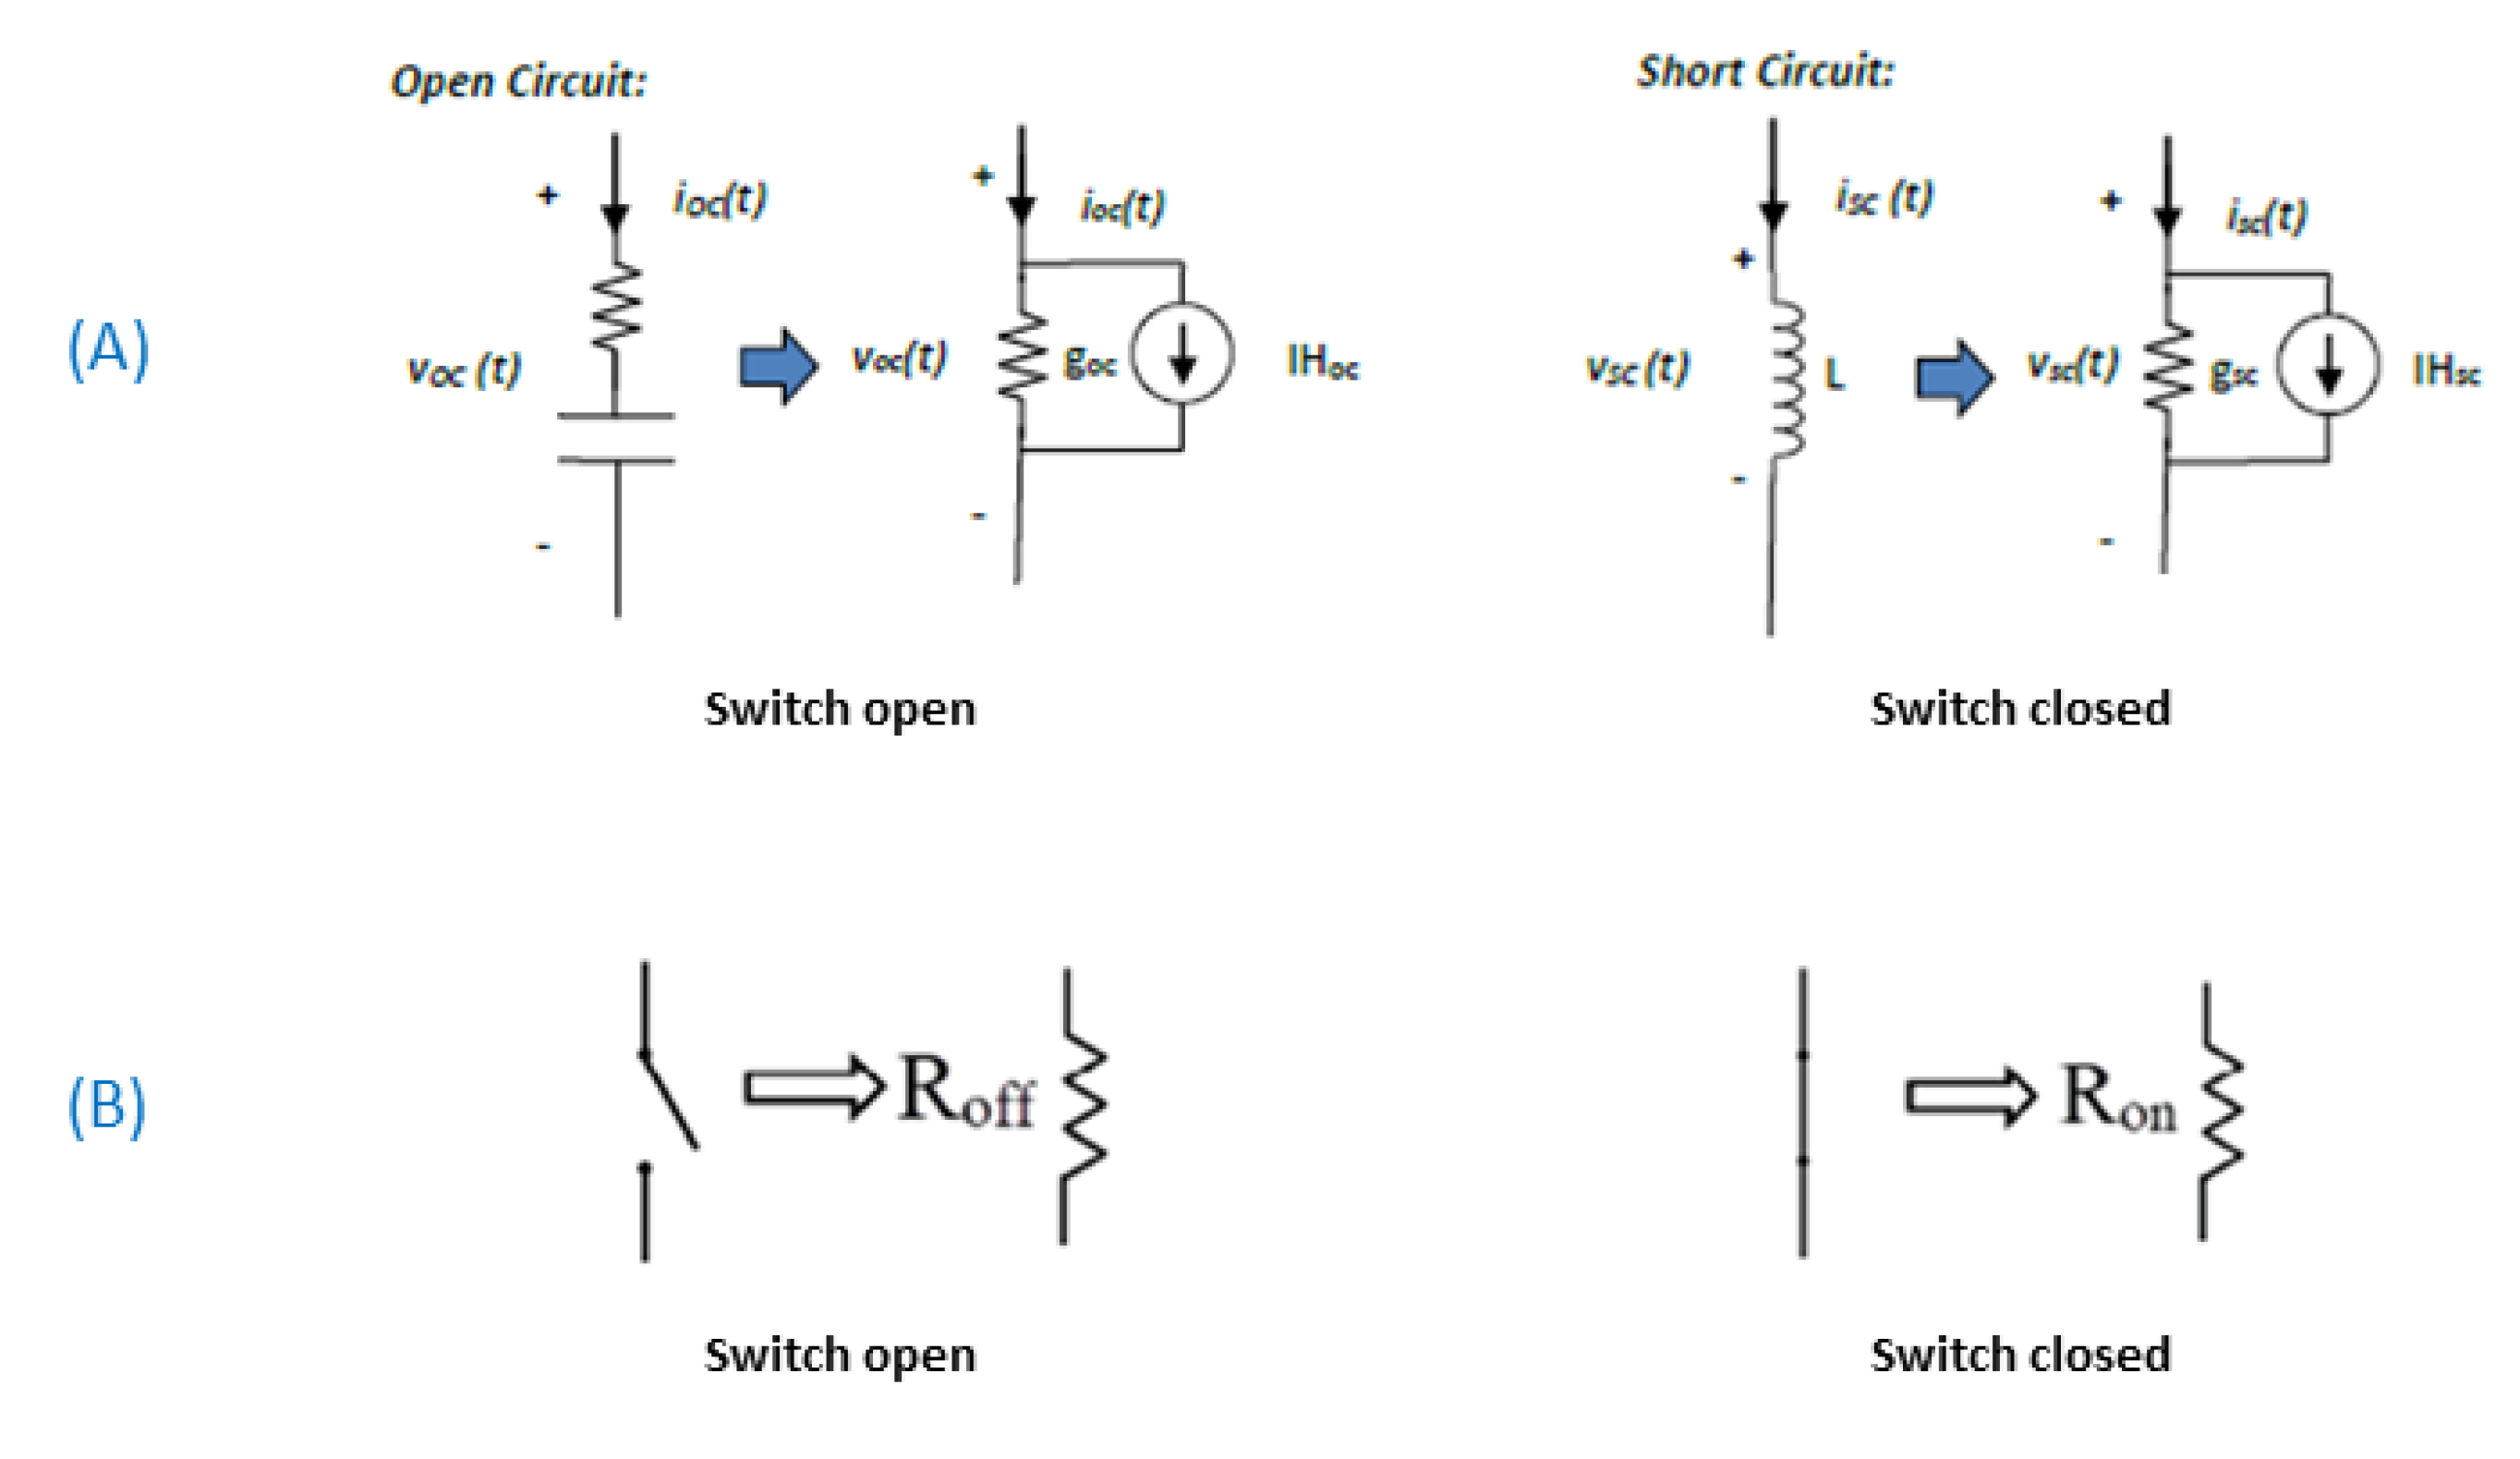
Section 2.2. Aside from the difference of time step size between the different environment, another specificity of each environment is the way switches are modeled [
19]. As shown in
Figure 7A, the switches in the small-time step environment are represented using inductors and capacitors. The drawback is that the energy stored in those components is lost when changing the On/Off state of the switch. A solution can be found by using the substep environment (cf.
Figure 7B), in which the switches are represented by resistors with variable resistance value. For one switch, two resistance values
(switch open) and
(switch closed) are selected so that
. The general solution process in the substep environment is based on the Dommel algorithm and similar to the one used in the mainstep environment, except that optimized components (stored in a dedicated library) are used [
19].
The wind turbines are modelled in the small time-step environment. The electrolyser is connected in the same small time-step box as the wind turbine to which it is connected. Implementing the buck converter model in the substep environment would have resulted in less artificial losses caused by the switch representation in the small time-step environment [
19]. However, this was not possible due to the complexity of interfacing small time-step and substep boxes.
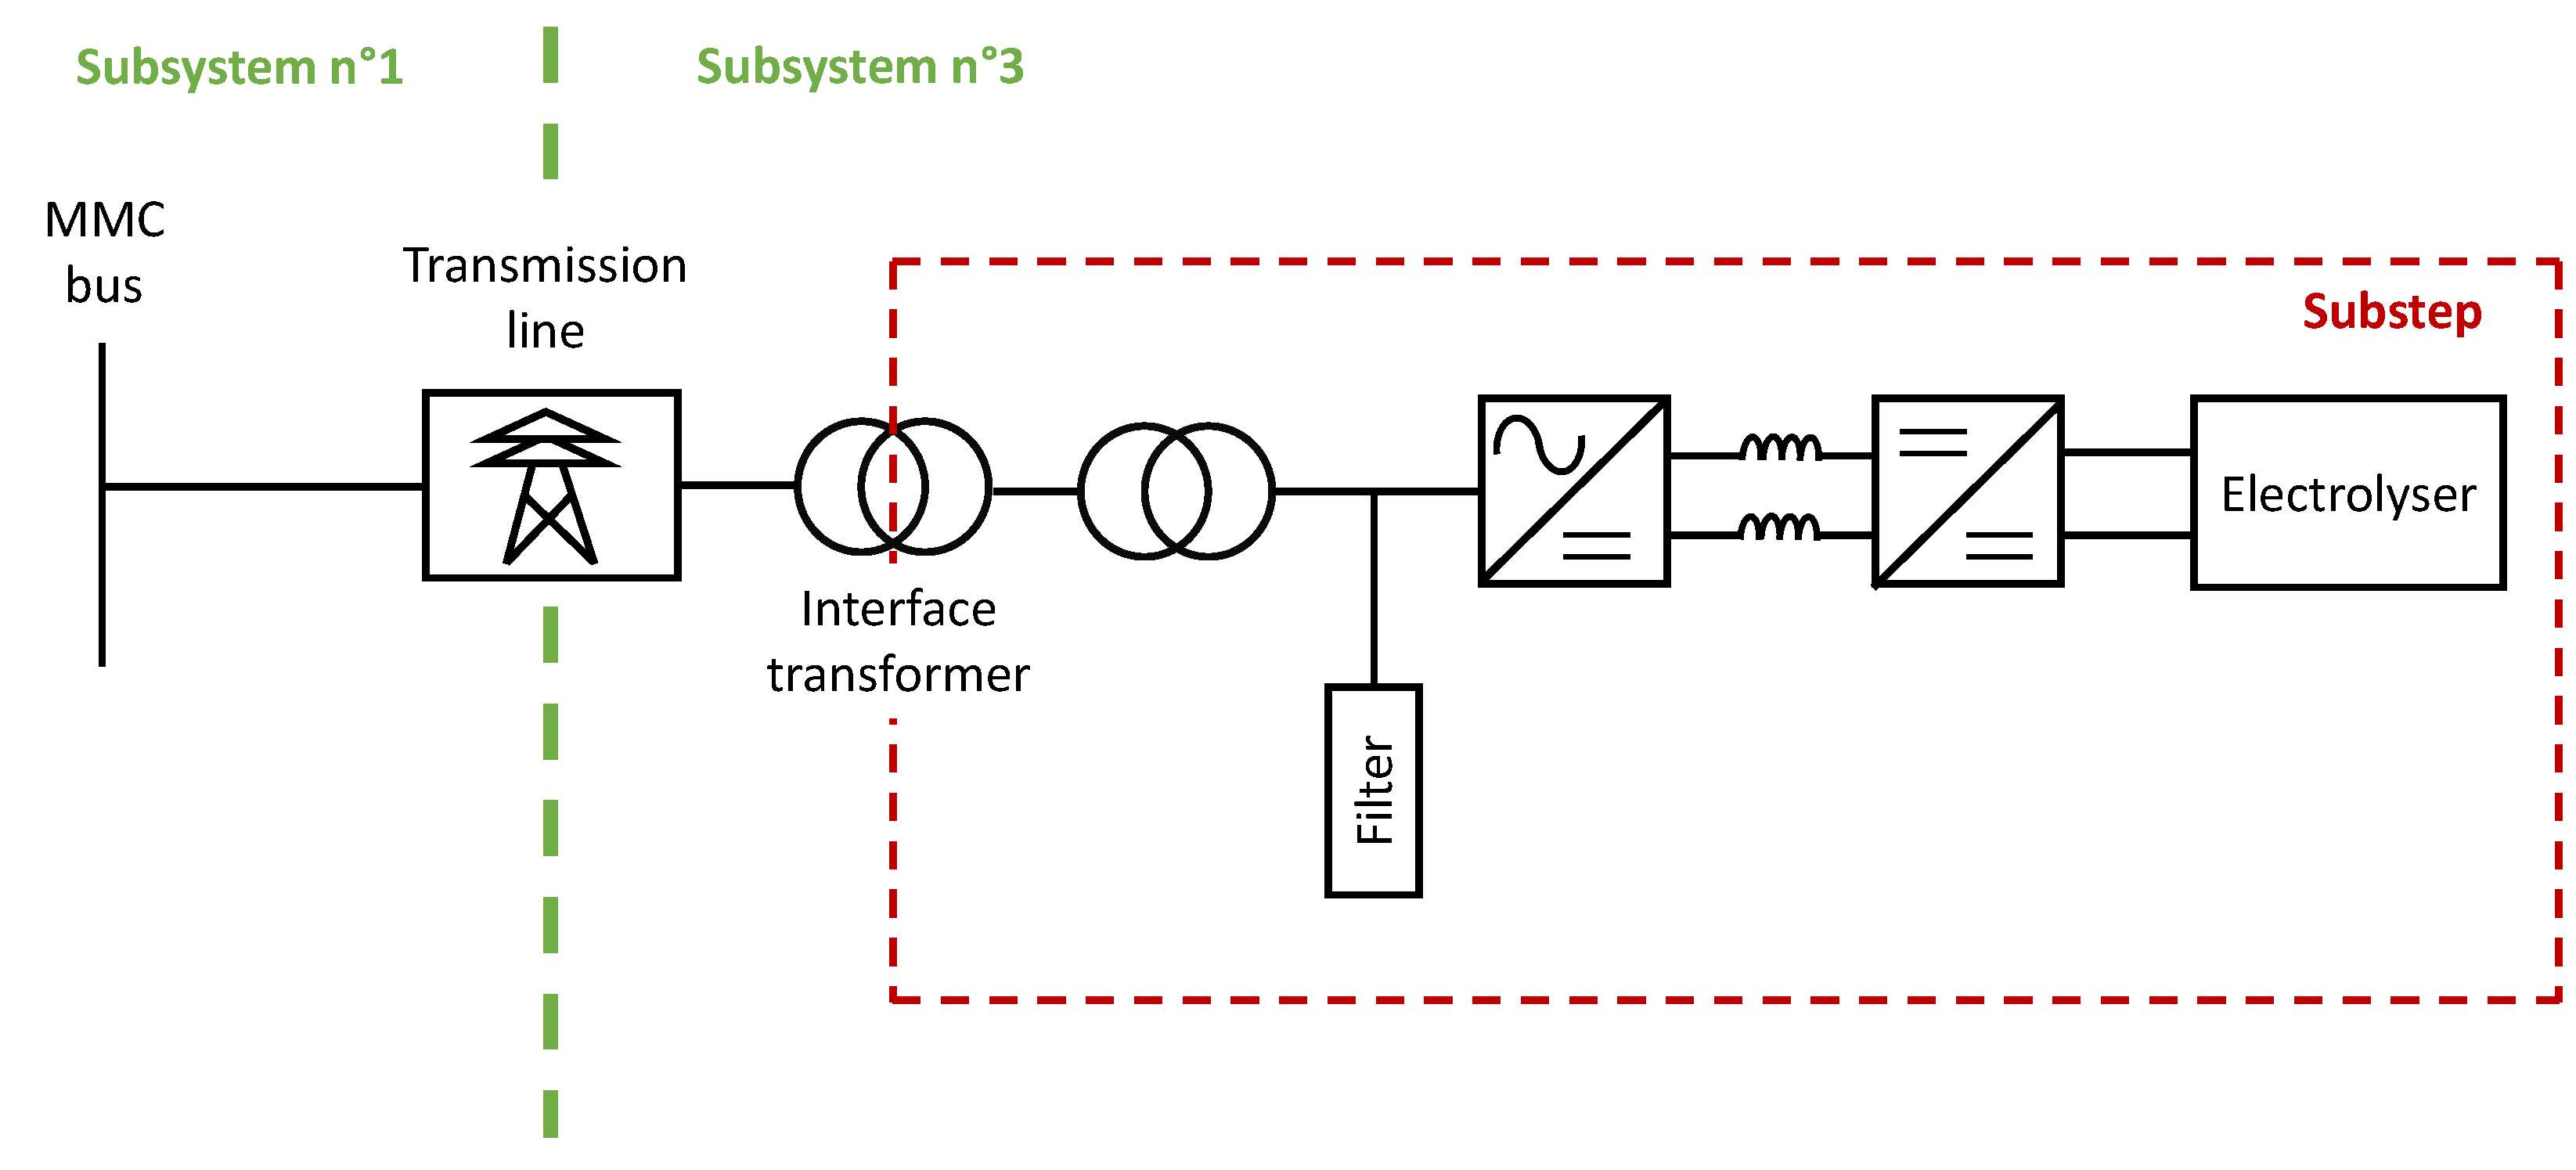
2.6.2. Scenario 2: Electrolyser Connected to the AC Common Bus of the Hub
In Scenario 2, one electrolyser is connected to the AC common bus of the hub, as pictured in
Figure 8. In this scenario, the electrolyser system is composed of the electrolyser cell (similar to Scenario 1), a buck converter, a rectifier, two transformers, and a transmission line. The layout is adapted from the model developed in [
25] and can be seen in
Figure 9. The substep environment has been chosen to avoid artificial losses created by the switch model in the small time-step environment [
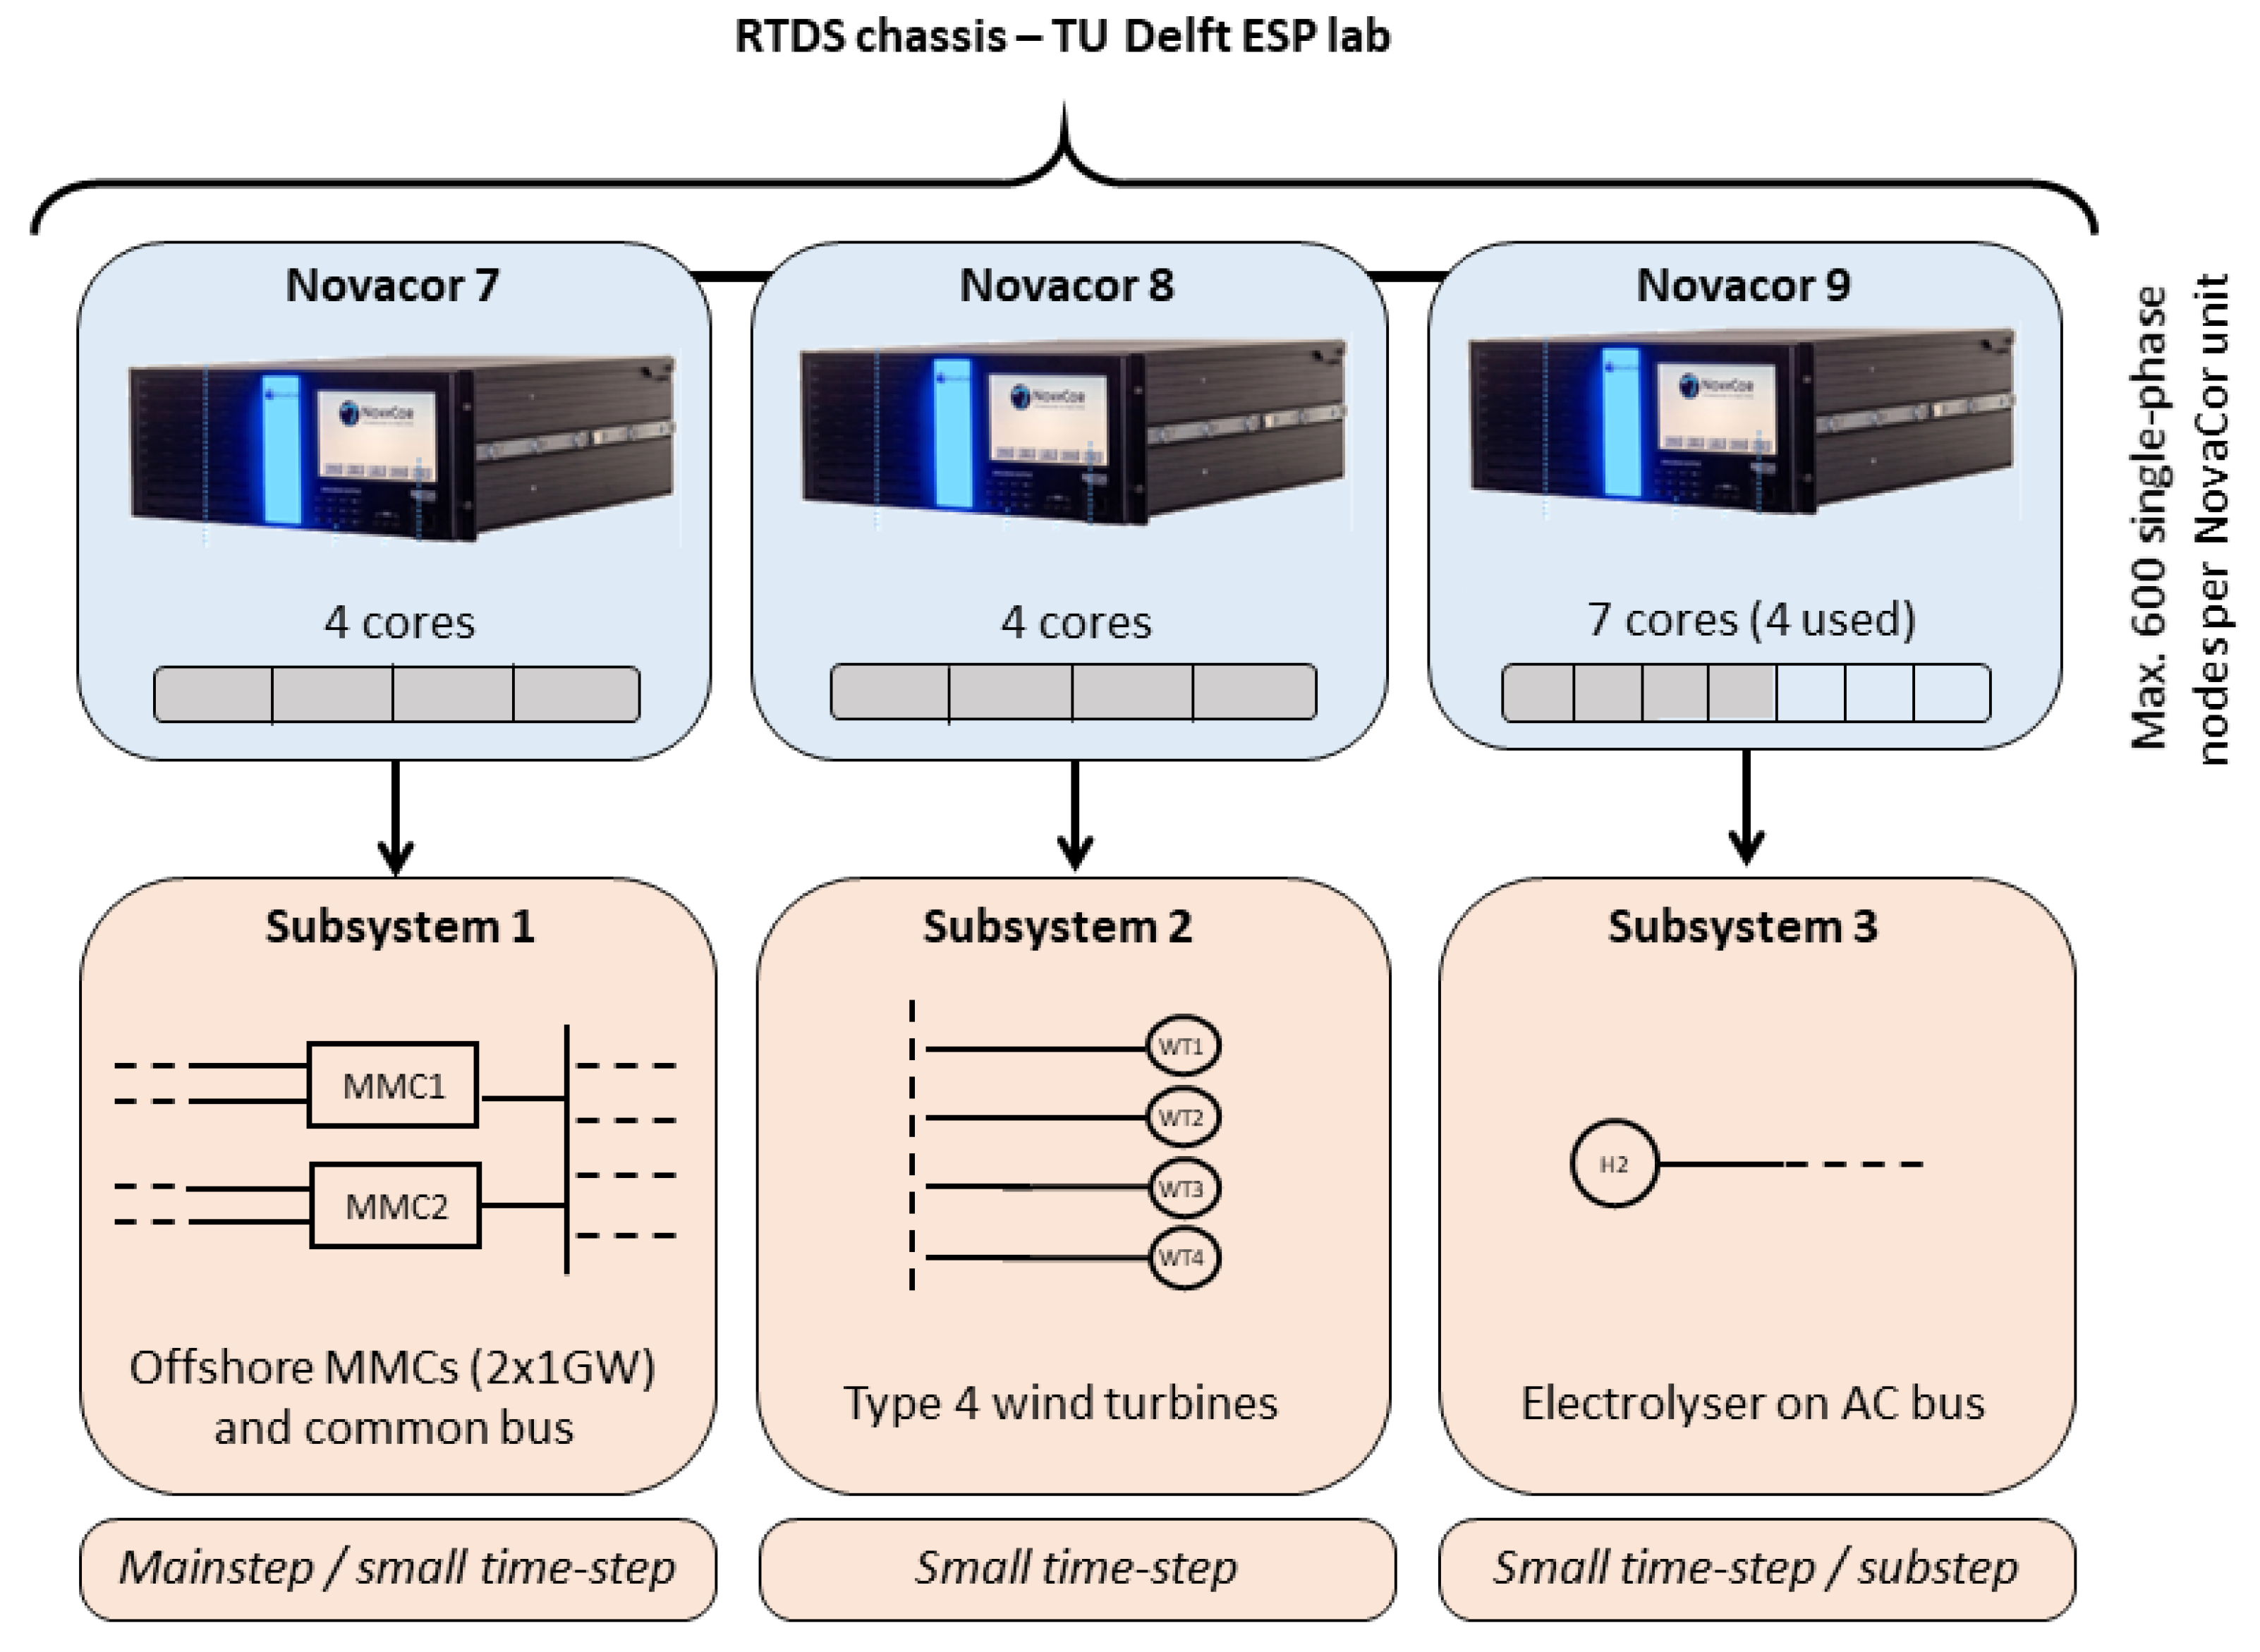
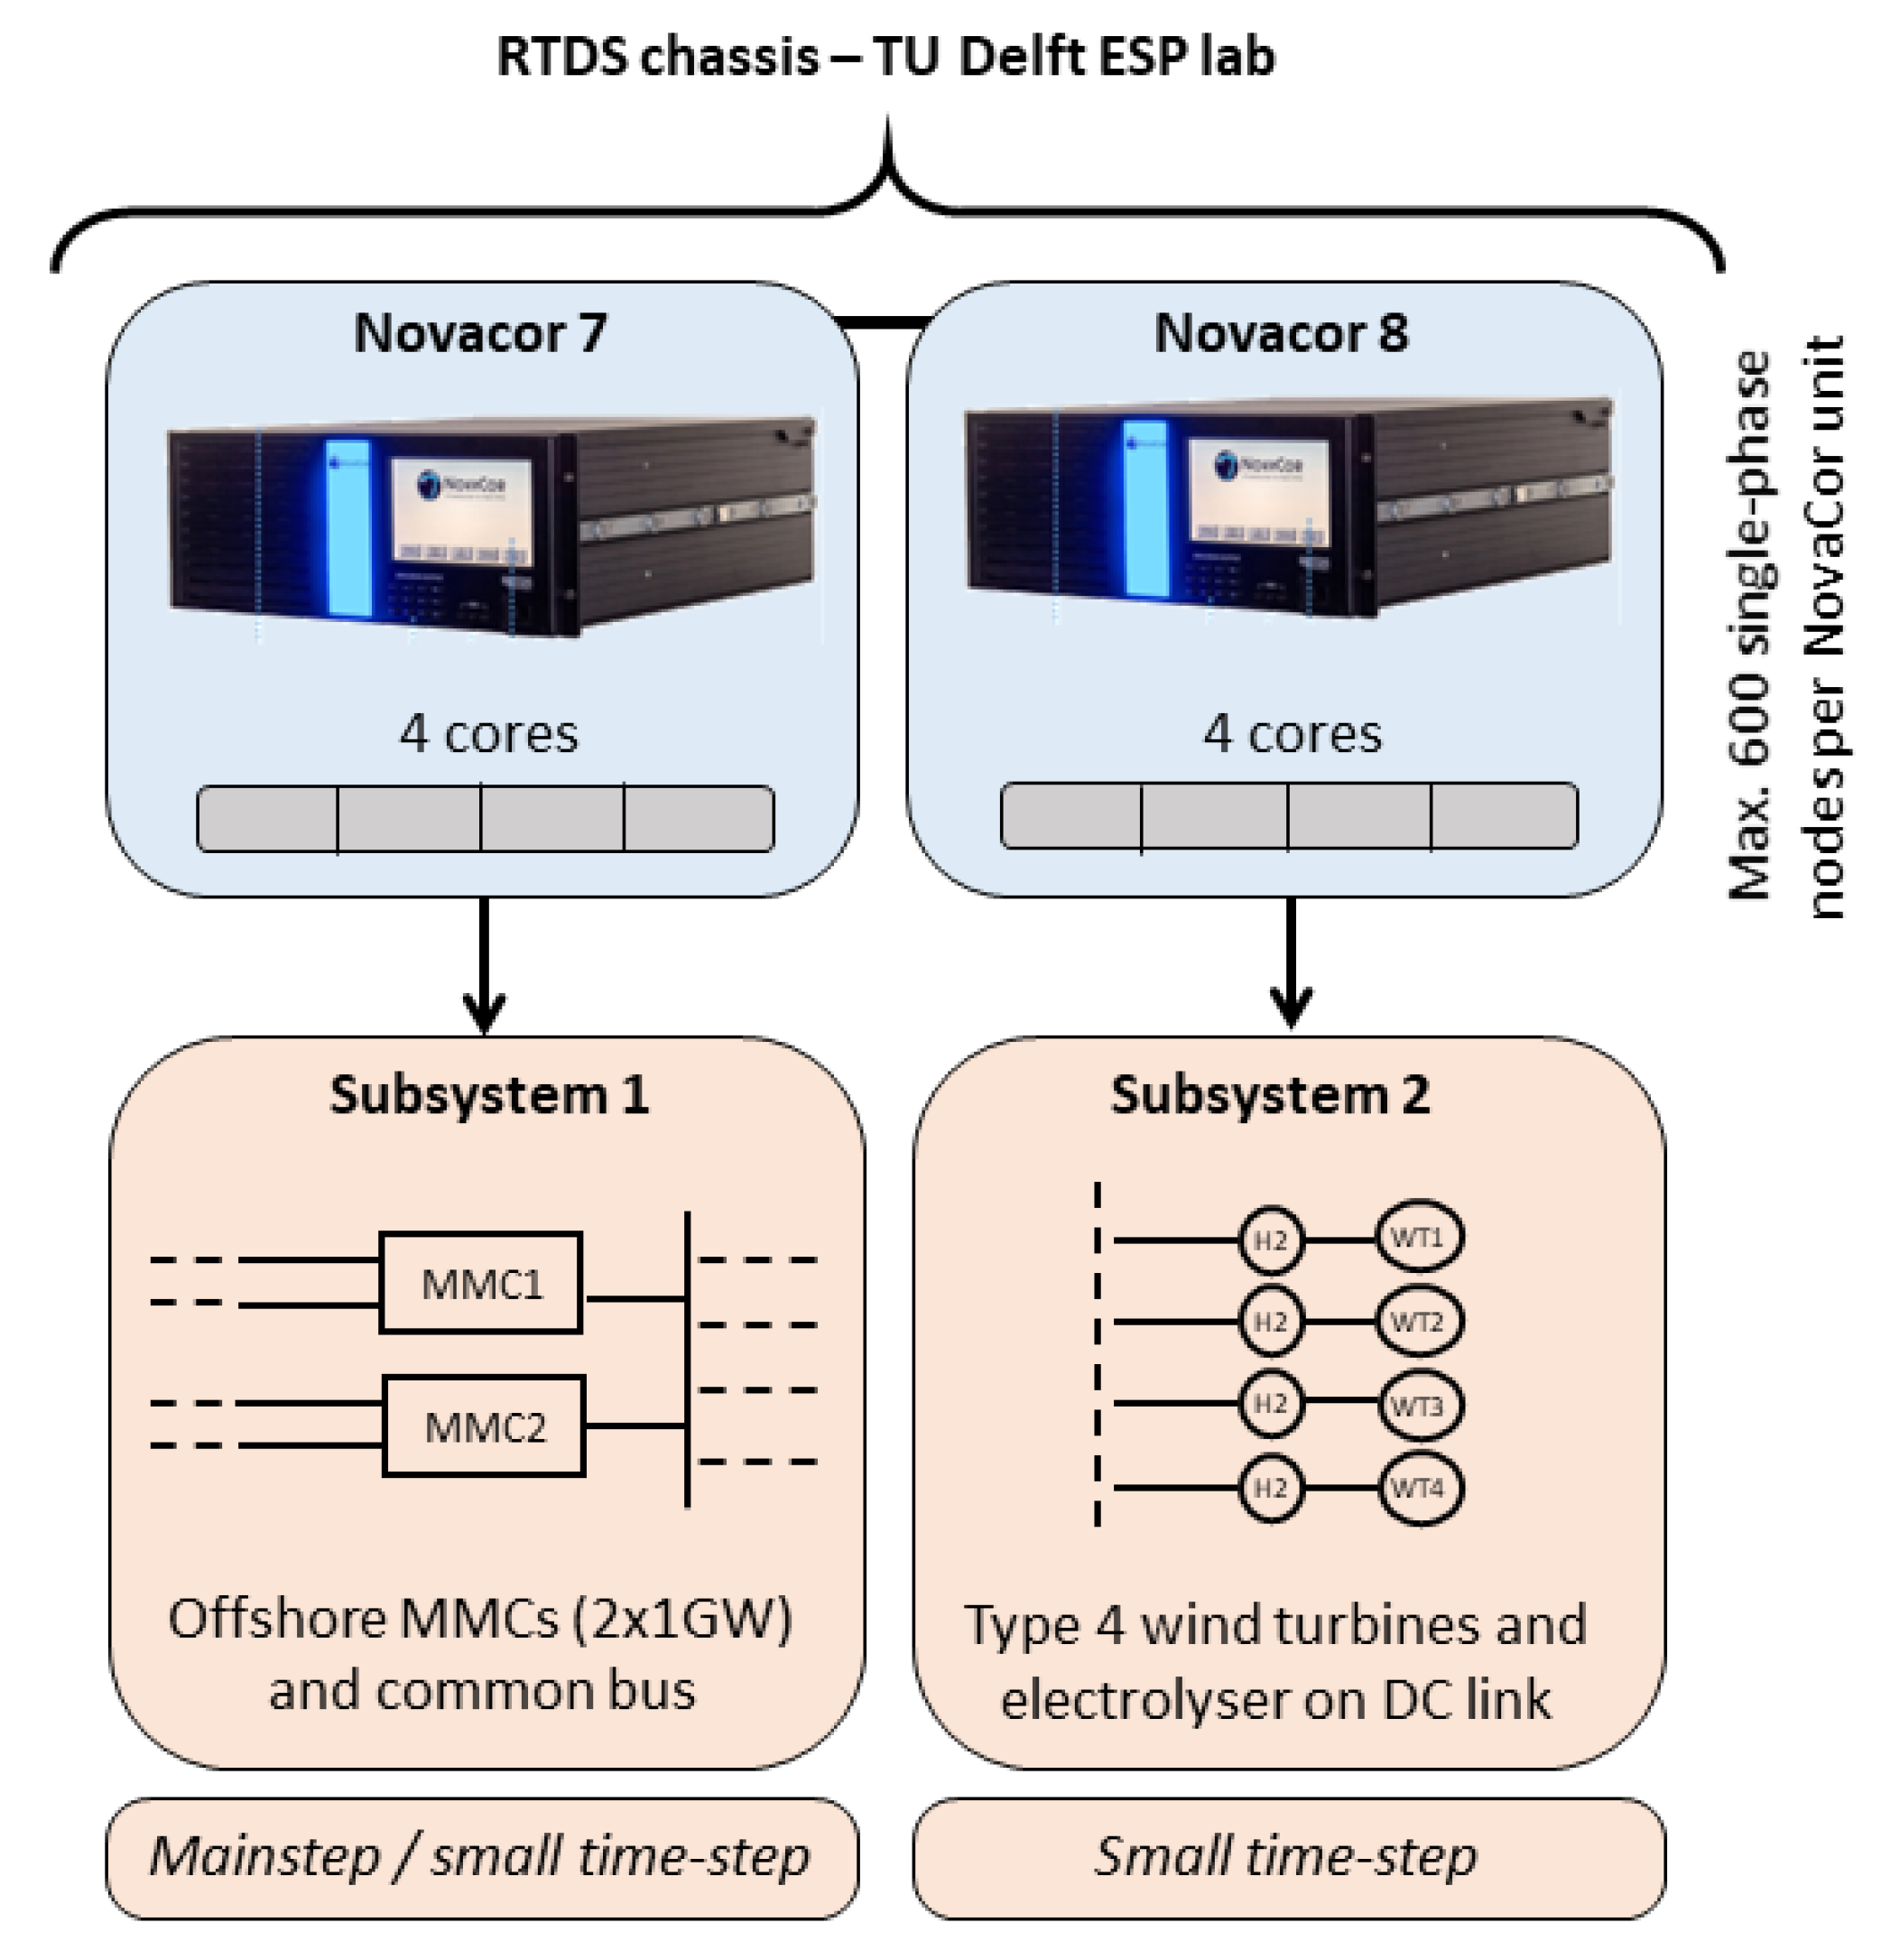
19]. One of the transformers is an interface transformer, necessary to connect the substep box to the main time-step network, and to scale up the electrolyser system model rated capacity. Additionally, the electrolyser system had to be computed on a third RTDS processor, as the two processors used to compute the hub model were already fully loaded. Therefore, the electrolyser system has been placed in a separate subsystem called Subsystem 3, as shown in
Figure 10. Subsystem 3 is connected to Subsystem 1 (were the common bus of the hub is computed) via a transmission line.
4. Results
In this section, the models represented in
Figure 5 (Scenario 1) and
Figure 8 (Scenario 2) were simulated under a wind speed step of at least 3 m/s, which represents an extreme wind speed step, in line for example with the wind speed time series proposed in [
26]. The same wind speed input is applied to all wind turbines. Version 5.011.1 of the RSCAD
® software was used for the simulations, with a small time step of 2500 ns, as recommended in [
10]. This time step complies with the requirement to have a ratio of the large time step to small time step higher than 12 in RSCAD [
10], while being large enough to accurately capture the behaviour of the system.
4.1. Scenario 1: Electrolysers Connected to the DC Link of the Wind Turbines
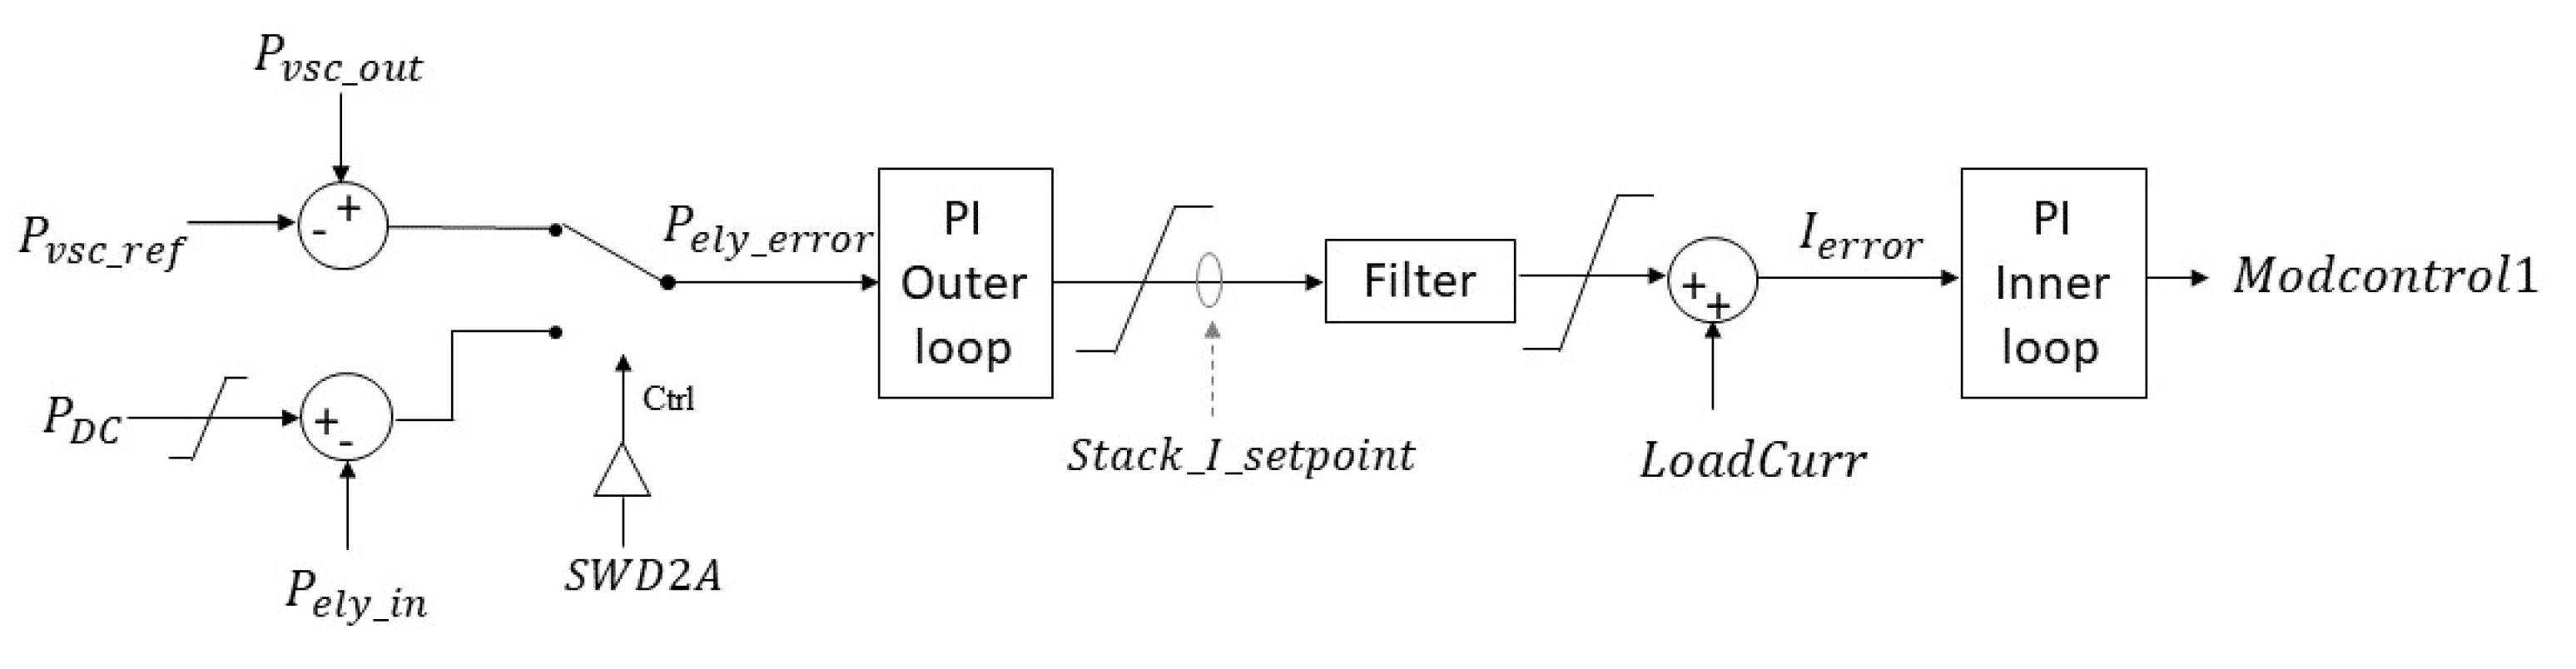
In this scenario, the buck converter is controlled according to the scheme presented in
Figure 12. The electrolyser is consuming the amount of energy necessary to maintain the output of the GSC to a set value. Contrary to Scenario 2, in this scenario, there is no manual mode.
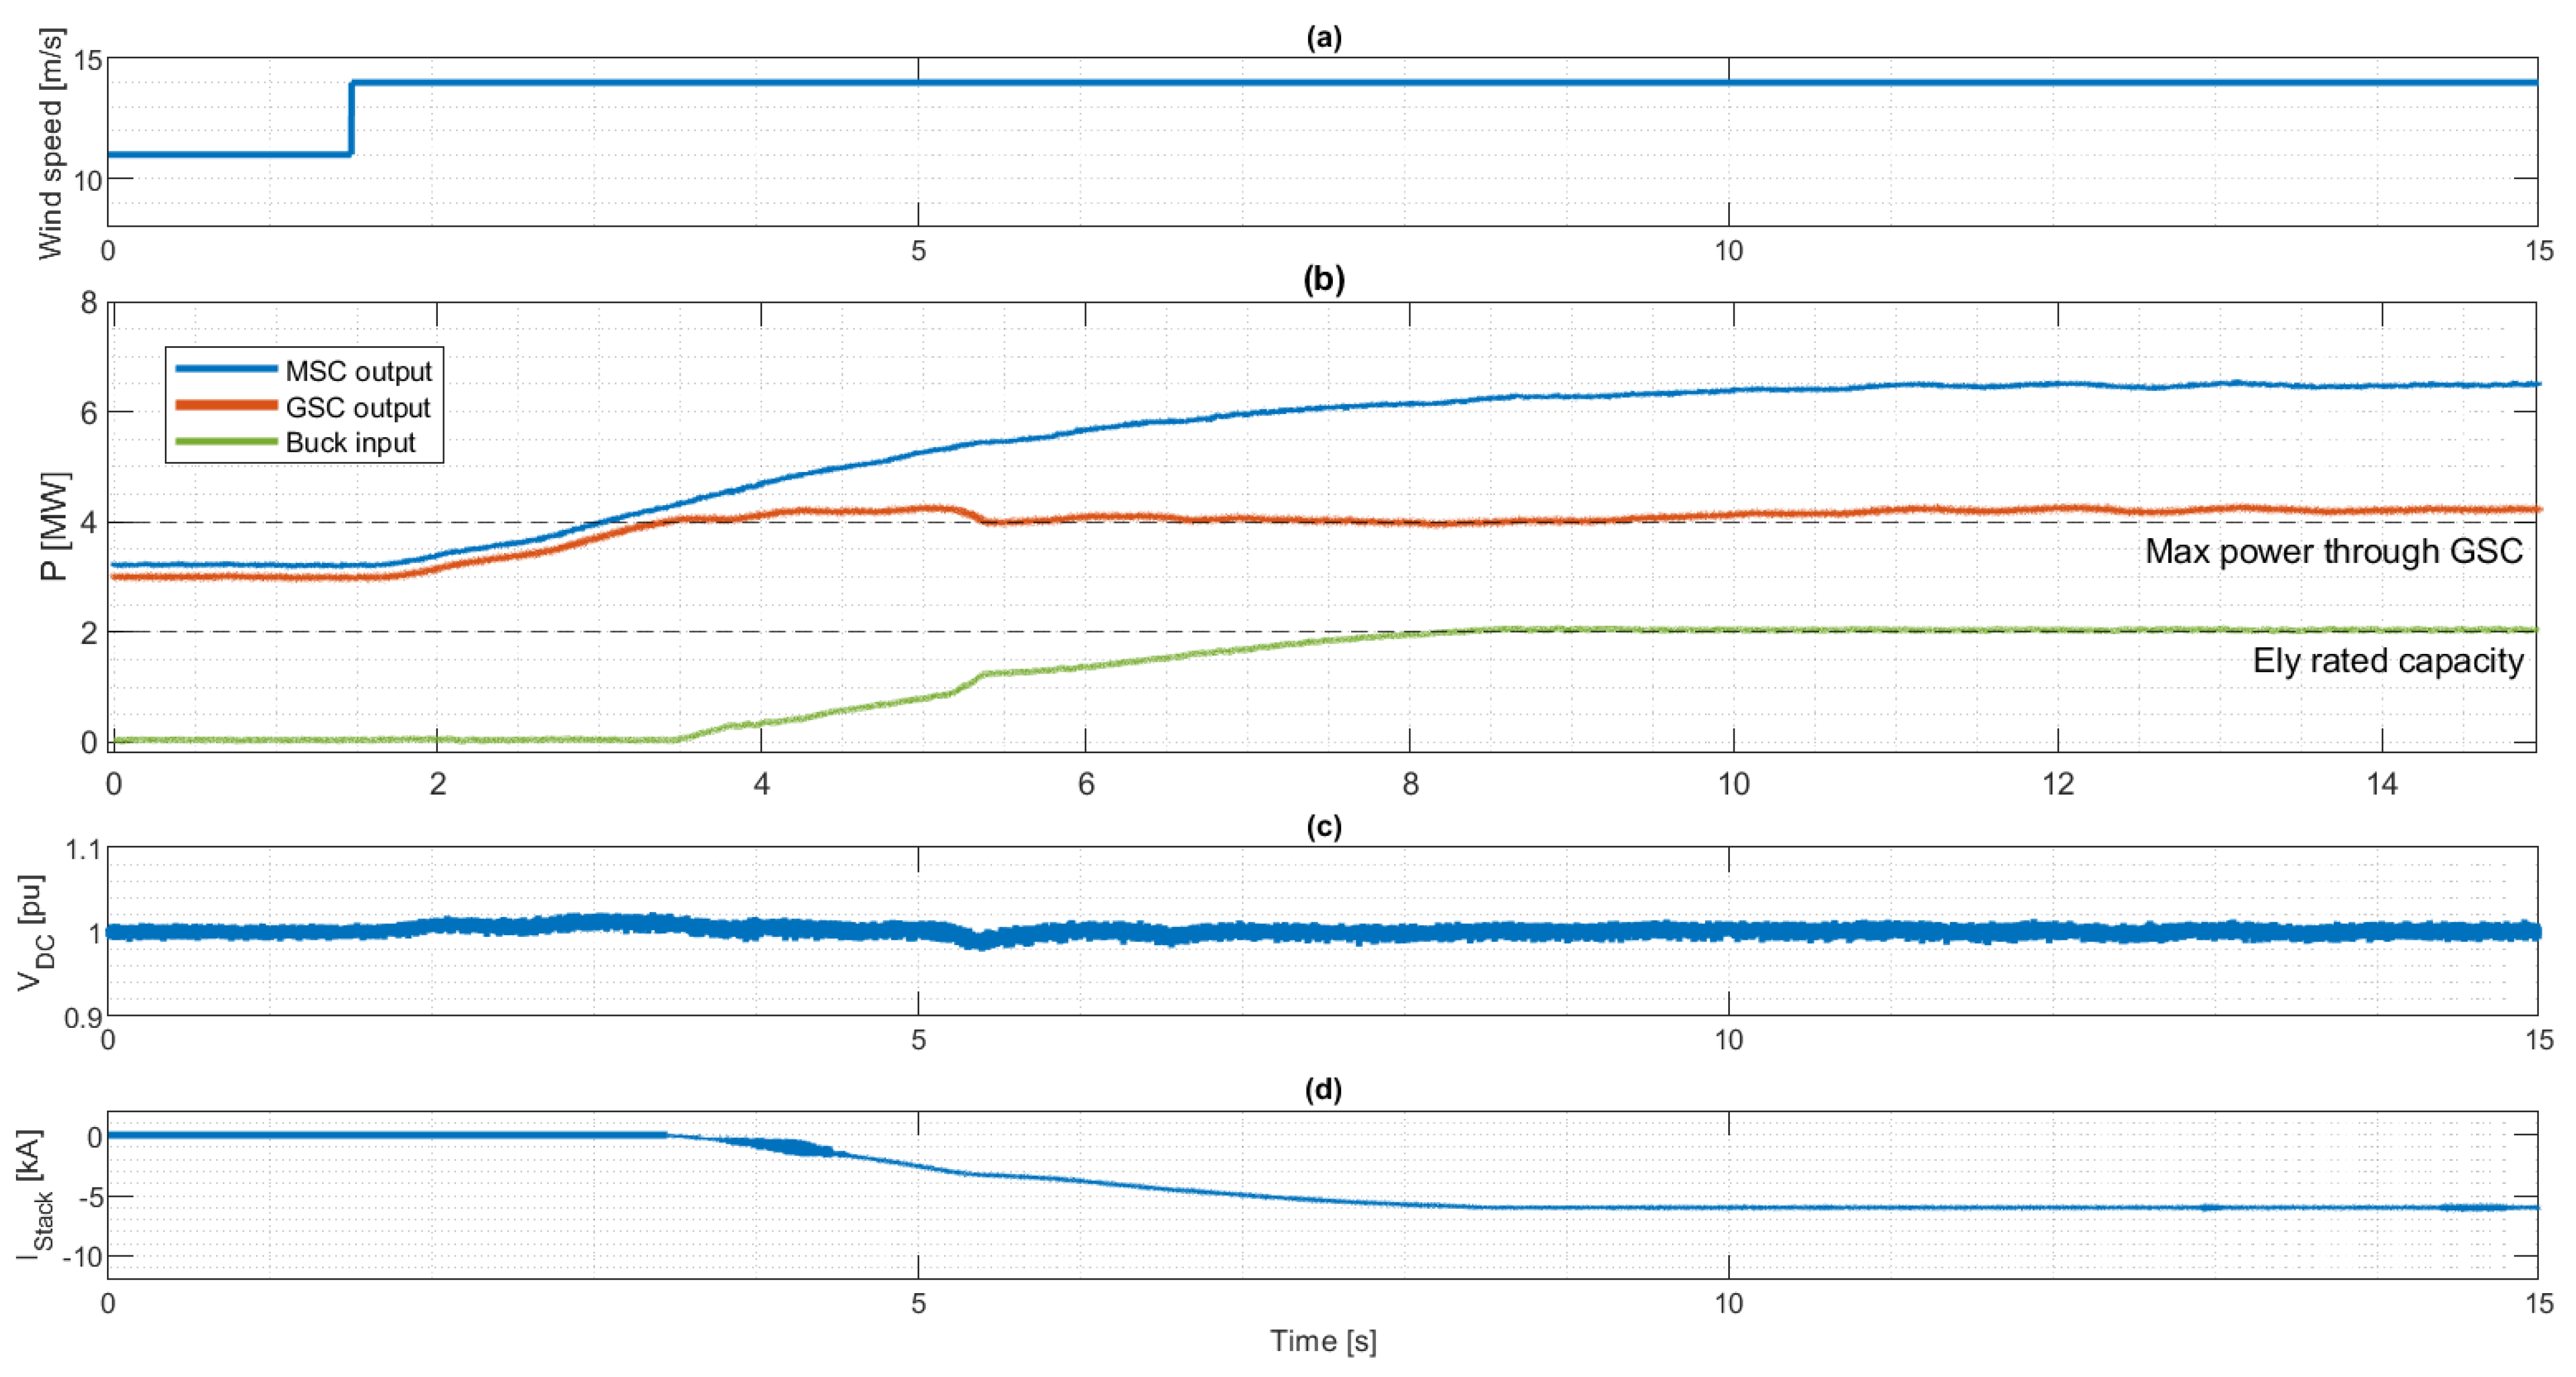
The resulting behaviour of the network is shown in
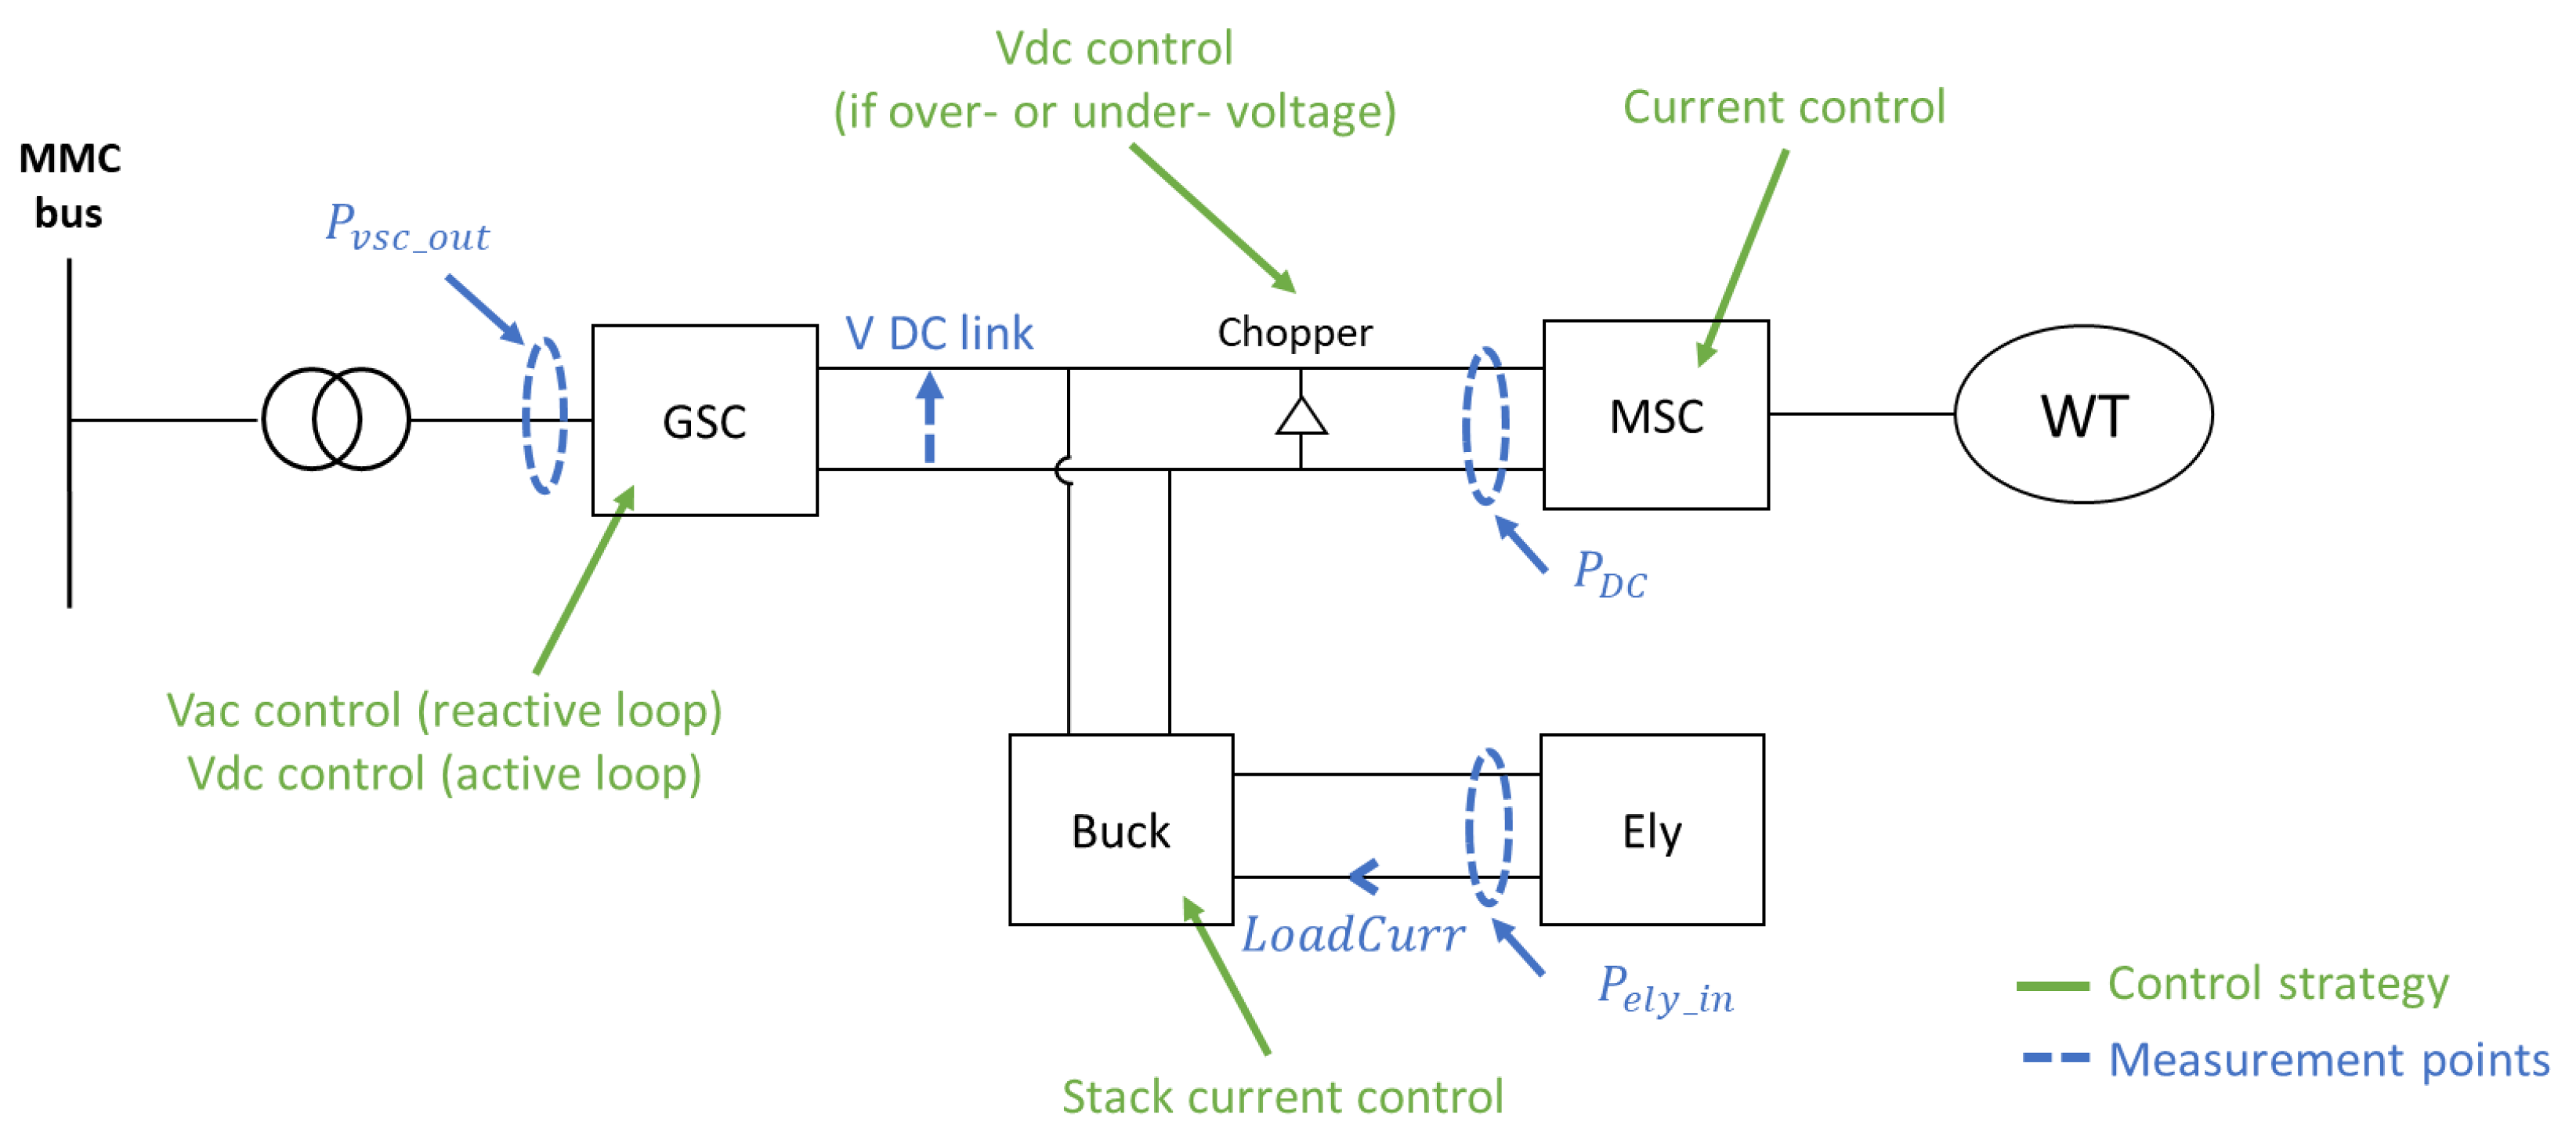
Figure 14: the power has been measured at the output of the MSC, at the output of the GSC and at the input of the electrolyser buck converter. Power measurements are shown in
Figure 14b. They have been filtered through a first order filter with time constant 0.02 s, and are expressed in MW before the interface transformer, so they are not scaled up. Additionally, unfiltered measurements of the DC-link voltage and electrolyser stack current are shown in
Figure 14c,d respectively. All the measurement points are indicated in
Figure 11.
Figure 14b shows that the control strategy presented in
Figure 12 is respected: as soon as the output of the GSC reaches 4 MW (at 3.5 s), the electrolyser starts to absorb the surplus power coming from the wind turbine, thus maintaining the output power to the set-point value of 4 MW. It should be noted that in this scenario, the power output of the four wind turbines was the same since they were applied the same wind speed step and they are identical (see
Figure 2). Therefore, for the sake of clarity only the measurements at DC link 1 are shown. After 8.5 s, the wind turbine output keeps increasing, while the electrolyser reaches its rated capacity (2 MW). Hence, the output of the GSC also increases over 4 MW.
Furthermore, attention was given to the choice of the control parameters. The time constant and gain of the PI controllers (starting with the inner loop PI) were changed incrementally in a predefined range until a satisfying behaviour was achieved. The system presented a minor sensitivity to changes of the gain values, but a considerable sensitivity to changes of the time constant values.
Figure 14c shows that the DC-link voltage is effectively maintained close to 1 pu by the GSC. The chopper is not activated during this time, so its power consumption is null and has not been plotted.
Figure 14d shows that the electrolyser current decreases steadily from 0 to −6 kA. This is possible thanks to a careful selection of the time constant of the PI controller in the inner loop of the buck converter controller. The time constant was chosen to be
s. It was found that if the time constant is too small, the system becomes too sensitive as the integral component reacts too fast (compared to the system response time) when trying to correct the static error. Consequently, the current flowing through the electrolyser stack is exhibiting an undesirable oscillatory behaviour. On the contrary, if the time constant of the PI controller is too high, the response time of the electrolyser is lengthened, as the integral part of the controller is too slow (compared to the dynamics of the system) in trying to correct the static error. As a result, the control rule is met with a delay.
Therefore a compromise had to be found between speed and stability of the system. Lowering the time constant of the PI led to a faster response, until a certain threshold where oscillations appear. This threshold was found to be located between 0.01 and 0.015 s for the PI controller in the inner loop. Finally a time constant of 0.015 s was selected. It can be noticed that the time constant of the outer loop PI controller has been chosen 10 times higher than the time constant of the inner loop PI controller, in order to avoid interference between the control actions of the loops, as advised in [
27].
4.2. Scenario 2: Electrolyser Connected to the AC Common Bus of the Hub
In this scenario, at first a resonant behaviour has been observed when connecting the electrolyser system to the common bus of the hub. The issue could be solved by using a passive RC parallel damper on the substep side of the interface transformer. The parameters F and were used to tune the damper. Dealing with this resonance phenomena might require tailor-made solution in other simulation platforms.
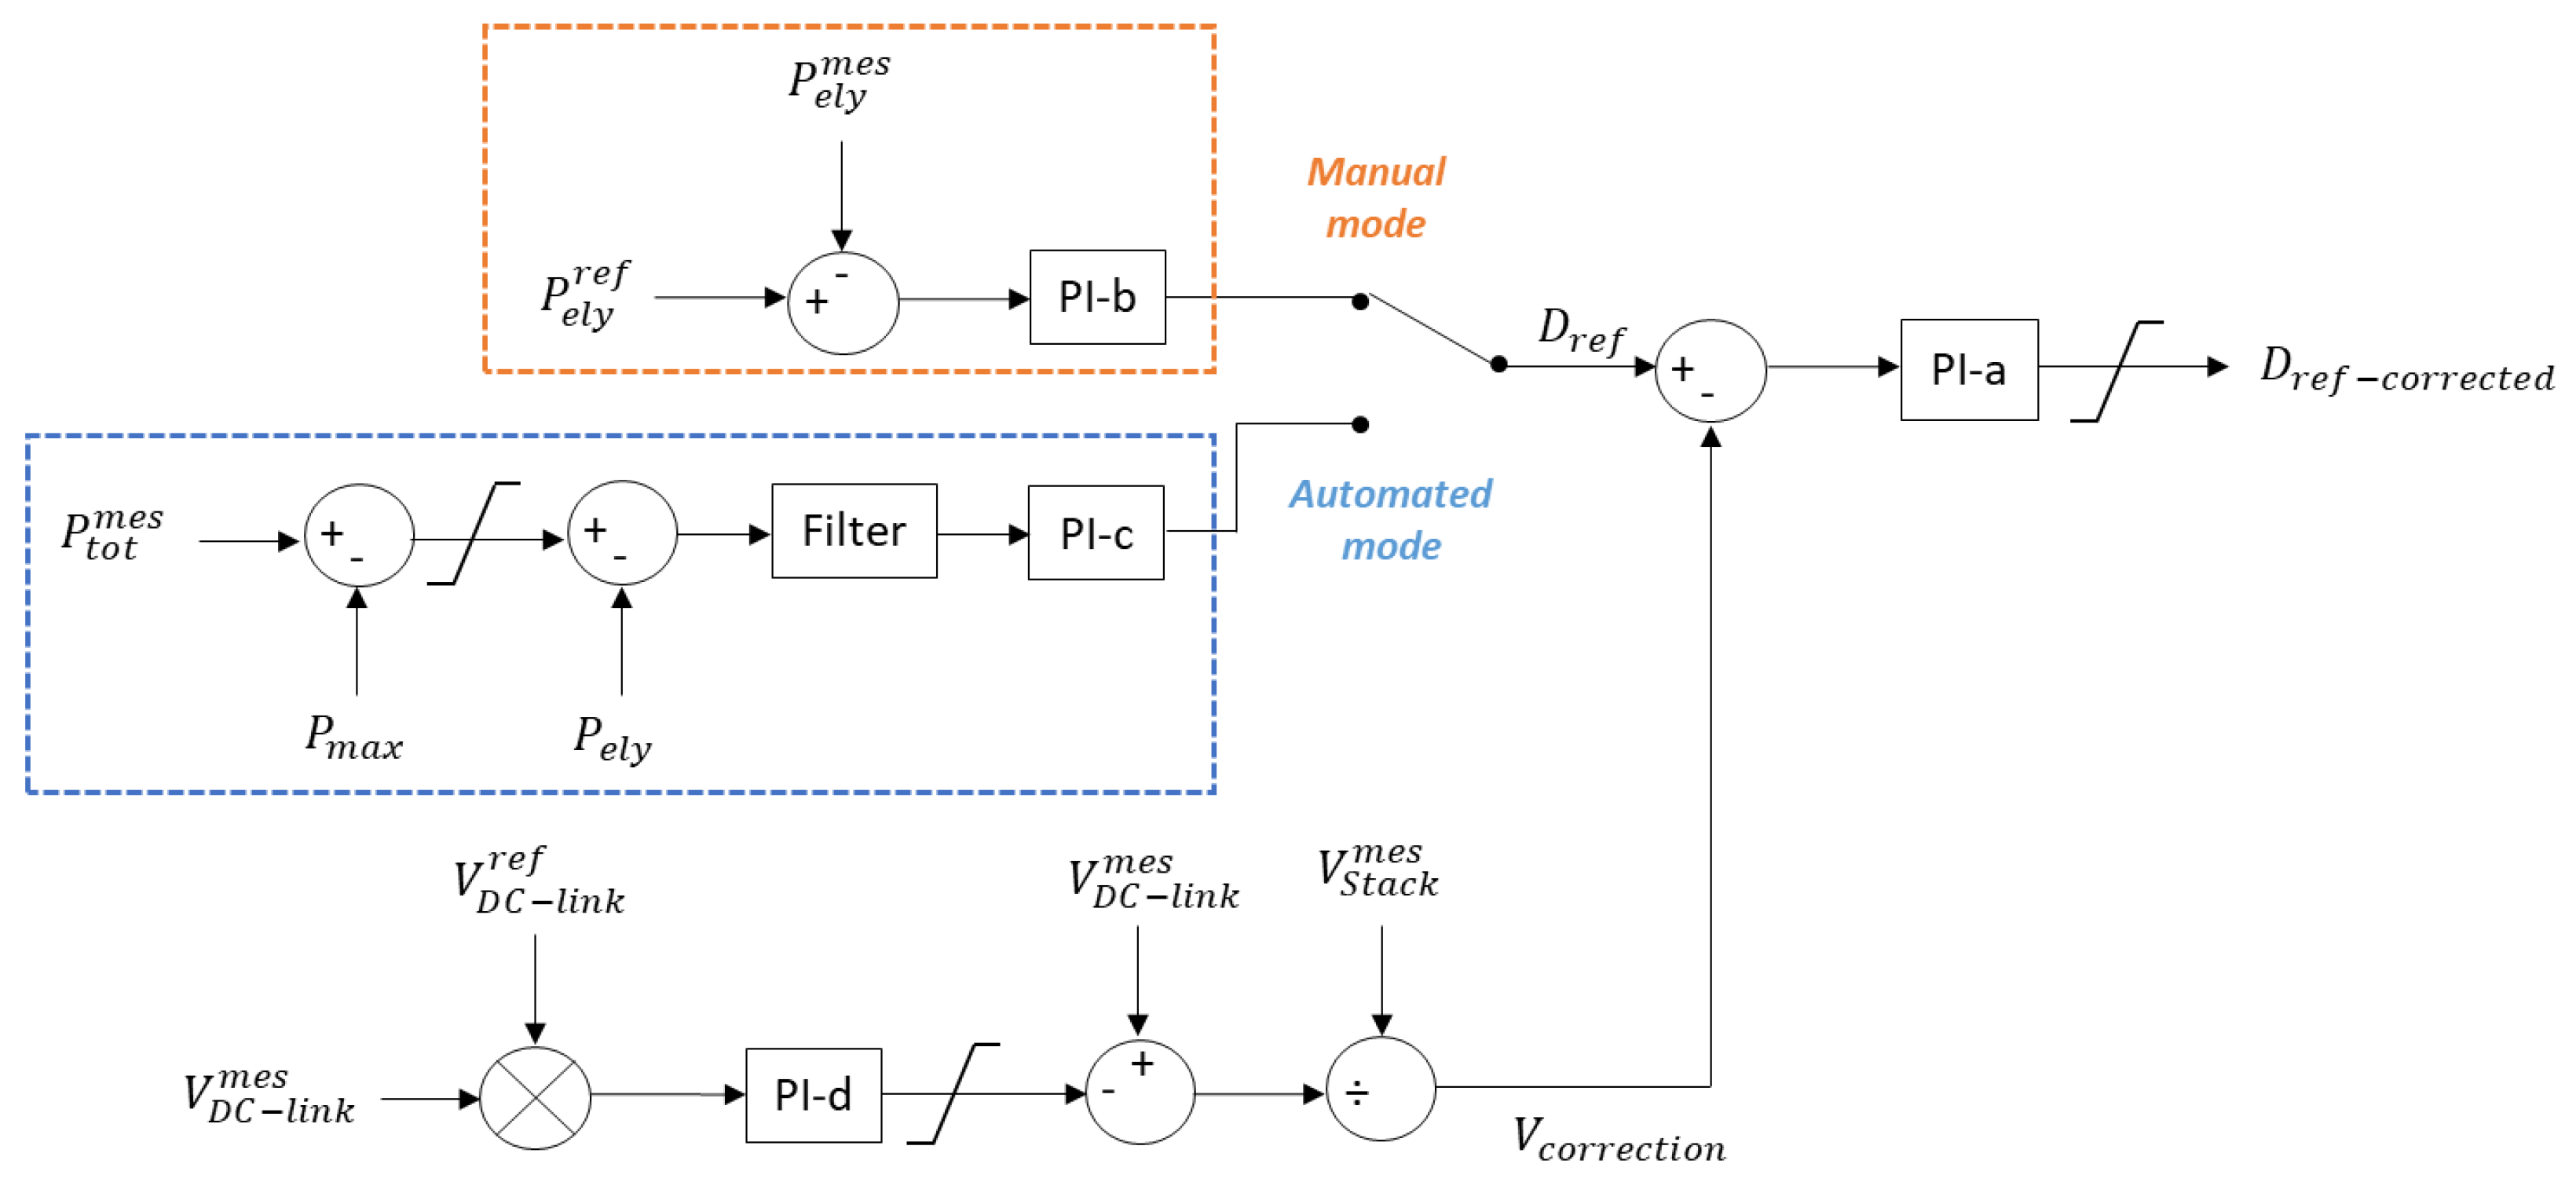
Then, the electrolyser was switched to automated mode thanks to a switch in the buck controller, as can be seen in
Figure 13. In automated mode, the logic of the buck controller is shown in Equation (
3):
where
is the total power generated by the wind turbines and
is the maximal power which should be transmitted to the shore. This parameter can be selected by the user and was set to 1500 MW in this section.
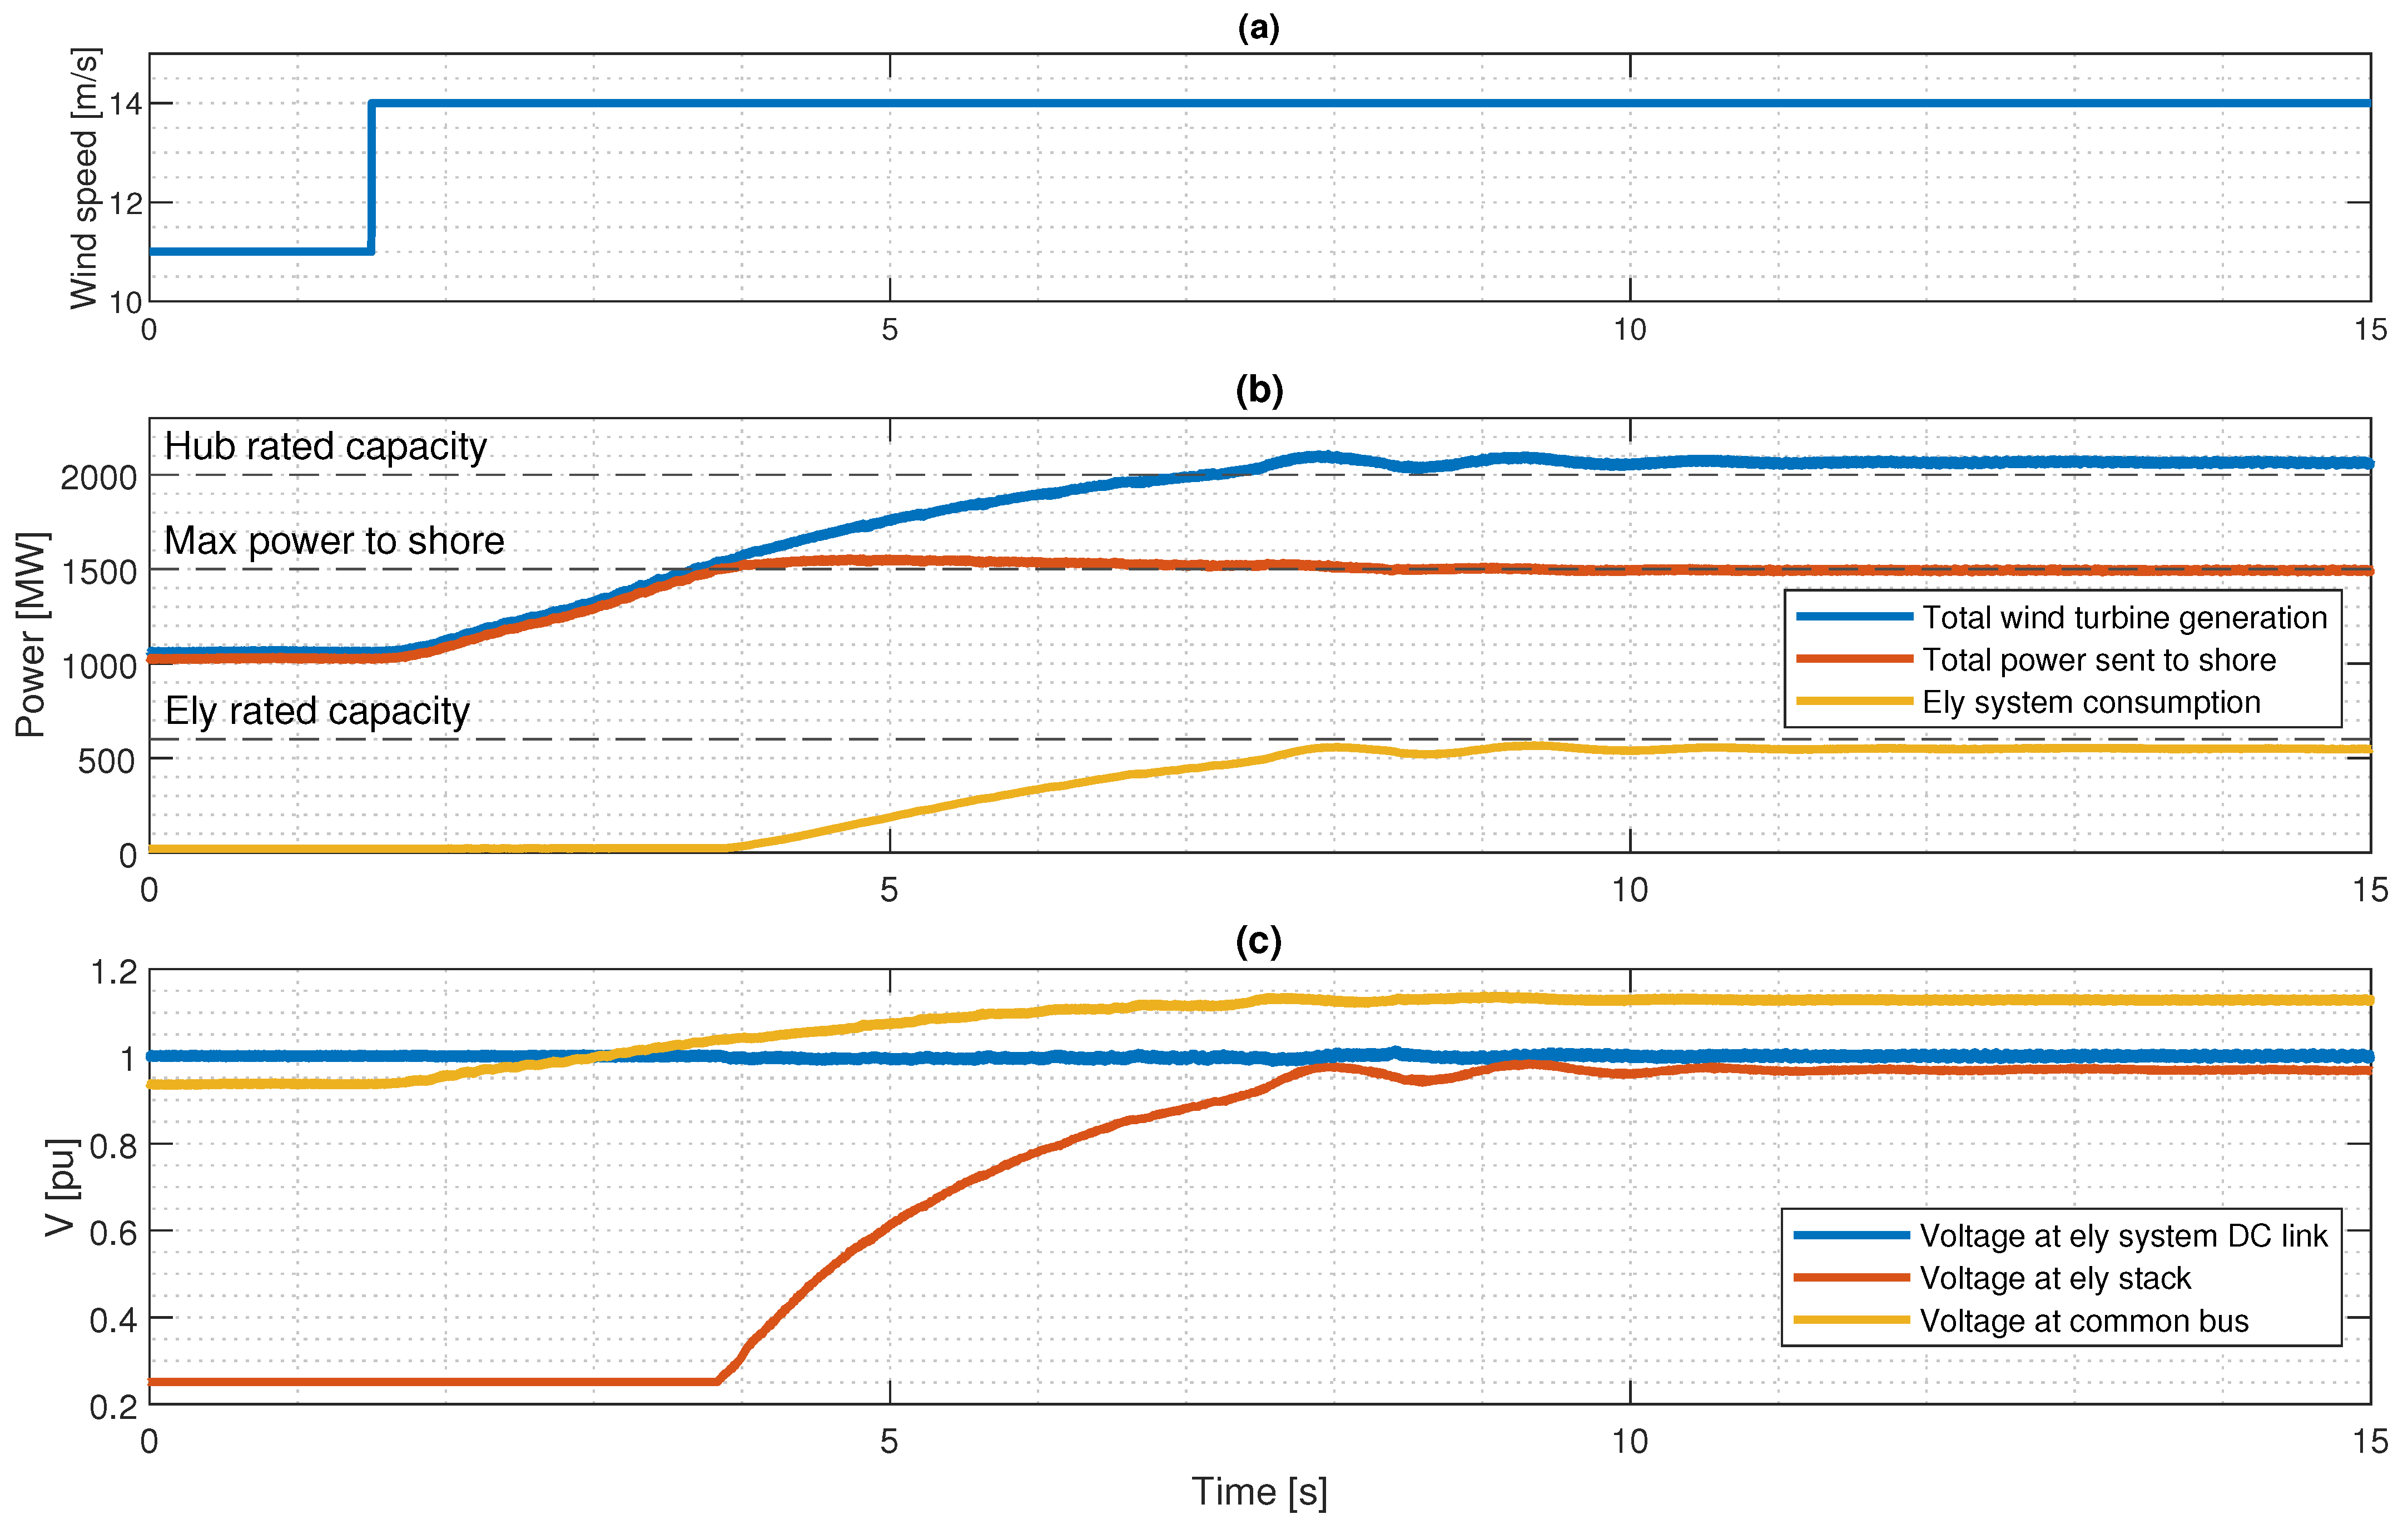
Figure 15a shows the wind speed step applied to the hub, from 11 to 14 m/s. On
Figure 15b, the active power measurements of the feeders connected to the common bus have been plotted. When the generated power (blue line) reaches 1500 MW, the electrolyser starts to consume power (yellow line), with a delay of about 0.2 s. This delay causes an overshoot of about 50 MW in the power transmitted to the shore (red line), after which the power transmitted to the shore is exactly 1500 MW, as required. It can be observed that the electrolyser consumption absorbs the small oscillations of the generated power in order to maintain the power transmitted to the shore at a steady value.
In
Figure 15c, voltage measurements have been plotted. It can be seen that the buck input voltage (blue line) is maintained at its rated value. The RMS of the AC voltage at the common bus of the hub (yellow line) increases from 0.95 to 1.15 pu. This behaviour was also observed when the electrolyser was not connected and is due to the increase in the generated power. The PI controller of MMC-1 is responsible for the AC voltage control. Since it fails to maintain it at rated value, another loop (for example a reactive power loop in MMC-2) could be implemented. Finally, the voltage at the electrolyser stack (red line), which is the same as the voltage at the buck output, increases from 0.25 to 0.95 pu. This voltage increases as the duty ratio of the buck converter increases, therefore increasing the power consumption of the electrolyser system as expected. The current consumed by the electrolyser (not represented here) is increasing along with the voltage at the electrolyser stack, as they are tied by a linear relation. The current is stabilizing at 1.3 kA.
5. Conclusions
This paper presents an EMT real-time simulation model of an offshore hub with focus on the integration of electrolysers. Two different locations for the connection of the electrolyser have been investigated, in order to mitigate wind speed fluctuations. Numerical simulations conducted in RSCAD® on a 2 GW offshore hub with 4 × 500 MW wind power plants and 600 MW PEM electrolysers show that connecting electrolysers locally at each wind turbine proved to be a great advantage to mitigate active power variations (due to stepwise wind speed increase) flowing to the common bus of the hub, and to maintain the voltage of the hub between admissible bonds. Future studies shall investigate other possible forms of wind speed variations and electrical disturbances (e.g., short circuit).
In the first case, an electrolyser was connected to the DC link of the back-to-back of each wind turbine. The controller of the electrolyser’s buck converter was designed with a inner/outer loop structure, in order to achieve the correct stack current consumption when given an active power regulation order. Both loops contain a PI controller, which parameters have been tuned to achieve the fastest response time while preventing oscillations. In the second case, an electrolyser was connected to the common bus of the hub. In this case, some resonance phenomena were first observed between the electrolyser system and the rest of the network, characterised by an oscillating behaviour of the voltage and current at the common bus of the hub. After a passive RC parallel damper was added, the hub was stabilized and the electrolyser showed promising results (e.g., stable operation, good response time).
It can be concluded that both connections show interesting features. Connecting an electrolyser to each wind turbine would require more converters (one for each turbine) while only two converters (rectifier and buck) would be necessary if the electrolyser is connected to the common bus of the hub. The first option could however be less space-consuming as electrolysers can be placed inside the structure of the turbines, like in the project described in [
15]. It would also be useful in case of islanding of one of the turbines, contrary to the second option.


