Article

A Piezoelectric Wave Energy Harvester Using Plucking-Driven and Frequency Up-Conversion Mechanism

1
Department of Mechanical Engineering, National Chung Hsing University, Taichung 40227, Taiwan
2
Department of Hydraulic and Ocean Engineering, National Cheng-Kung University, Tainan 70101, Taiwan
3
Innovation and Development Center of Sustainable Agriculture (IDCSA), National Chung Hsing University, Taichung 40227, Taiwan
*
Author to whom correspondence should be addressed.
Energies 2021, 14(24), 8441; https://doi.org/10.3390/en14248441
Submission received: 10 November 2021 / Revised: 8 December 2021 / Accepted: 11 December 2021 / Published: 14 December 2021
(This article belongs to the Topic Wave and Tidal Energy)

Abstract

:
In this study, a plucking-driven piezoelectric wave energy harvester (PDPWEH) consisted of a buoy, a gear train frequency up-conversion mechanism, and an array of piezoelectric cantilever beams was developed. The gear train frequency up-conversion mechanism with compact components included a rack, three gears, and a geared cam provide less energy loss to improve electrical output. Six individual piezoelectric composite beams were plucked by geared cam to generate electrical power in the array of piezoelectric cantilever beams. A sol-gel method was used to create the piezoelectric composite beams. To investigate PDPWEH, a mathematical model based on the Euler–Bernoulli beam theory was derived. The developed PDPWEH was tested in a wave flume. The wave heights were set to 100 and 75 mm, the wave periods were set to 1.0, 1.5, and 2.0 s. The maximum output voltage of the measured value was 12.4 V. The maximum RMS voltage was 5.01 V, which was measured by connecting to an external 200 kΩ resistive load. The maximum average electrical power was 125.5 μw.

1. Introduction

Recently, the demand for electrical energy has increased rapidly in response to the development of advanced technology a rapid increase in the human population. Generally, the electrical power generation system mainly uses fossil fuels (such as petroleum, coal, natural gas, and so.) as an energy source. However, with the continuous consumption of global fossil fuels, it is accompanied by increasingly serious energy crises and environmental problems. For the sustainable development of humanity, it is imperative to find and develop sustainable energy sources that can replace fossil fuels. Solar energy, wind energy, hydropower, ocean energy, and geothermal energy are clean and sustainable green renewable energy sources. Ocean energy is a green renewable energy source with great development potential because it occupies approximately 70% of the earth’s surface area and is stored in the form of kinetic energy (tides and waves), thermal energy (heat), biological energy (biomass), and chemical energy (chemicals) [1].
Significantly, the potential for extracting energy from ocean waves is estimated at 2 TW. Many designs and concepts of wave energy converter (WEC), which was used to extract wave energy have been proposed. The more dominant and widely developed types are attenuator, point absorber, terminator, submerged pressure differential, oscillating water column, and overtopping devices [2]. The conversion technologies of most WECs mentioned above use electromagnetic induction, which is powered by rotational or linear electrical generators [3,4]. Whether a turbine or a hydraulic motor is used as an intermediate mechanical mechanism to drive the generator, they will cause energy loss during the energy conversion process and cannot reduce the size of the WEC device. Direct-drive WEC (DDWEC), which does not use an intermediate mechanical mechanism, has attracted the attention of many researchers recently because of its higher energy conversion efficiency. Huang et al. [5] proposed a direct-drive WEC using an outer-permanent magnet linear generator that can increase the power density and relative movement distance to improve energy conversion efficiency. Wang et al. [6] proposed a planar generator for a WEC system that can use rolling and pitching motion to produce electrical power.
Piezoelectric transducers are considered for a type of direct-drive system, which can convert strain energy into electrical energy without requiring any intermediate operations [7]. Piezoelectric materials have excellent properties such as higher energy density and faster response. Malleable piezoelectric materials have been used to develop energy-harvesting devices from micro and nanoscale to generate electrical power for various applications [8,9,10,11]. Recently, piezoelectric materials have been used to apply WEC technology to convert wave energy into electrical energy [12]. Although there are still many challenges to overcome, such as highly variable frequency of wave motion, harsh ocean environment, and extremely variable climatic conditions, there are still many advantages such as low cost, low maintenance, and versatility that drives many researchers to invest in applying piezoelectric material on WEC technology. Nabavi et al. [13] developed a new low-volume piezoelectric beam-column energy-harvesting system, which generates electrical energy when an ocean wave breaks into its vertical face. Taylor et al. [14] presented a new energy-harvesting Eel, which uses piezoelectric polymer PVDF to convert mechanical flow energy into electrical energy. The Eel generators were tested in a flow tank and can produce 1 W in a nominal 1 m/s water flow. Xie et al. [15] proposed an ocean wave energy harvester with a piezoelectric plate that generates electrical energy from the transverse wave motion of water particles. A corresponding mathematical model has been developed, which was used to analyze the optimized design parameters. Vinolo et al. [16] developed an ocean kinetic energy converter that uses piezoelectric disk elements to apply on low-power applications. A horizontal suspended physical pendulum model had been chosen and studied. The experimental results concluded that low-power devices can be powered by ocean kinetic energy converter. Navabi et al. [17] and Xie et al. [18] invested in developing a piezoelectric energy-harvesting system composite with a buoy structure. The theoretical models of piezoelectric energy harvester have been described, which were validated by experimental results. The results show that the higher the wave rate that excites the buoy, the more electrical power is generated. Renzi [19] developed a fully coupled model of a Piezoelectric Wave Energy Converter, which is consisted of a flexible bimorph plate. The mathematical model combined linear piezoelectric constitutive equations for the piezoelectric plate with ocean wave potential-flow equations. When the frequency of the incident wave is close to the resonance frequency of the plate, the deformation of the piezoelectric plate becomes significant. Patel et al. [20] proposed an analytical model to investigate and improve an existing nonlinear analytical model for a highly flexible piezoelectric energy harvester. This model, which had been verified by experiments, considered the effects of piezoelectric material nonlinearity, geometric nonlinearity, self-weight, and prestress. This model will be a useful tool for designing a flexible piezoelectric energy harvester. Mustuda et al. [21] designed and optimized a flexible piezoelectric energy harvester in terms of aspect ratio, a support system, initial tension, and a bluff body to harvest mechanical energy through flow-induced vibration. A theoretical model that considered the initial tension force and natural frequency was used to evaluate the electric performance. Viet et al. [22] proposed a floating energy harvester, which used a mass-spring system to convert wave motions to mechanical vibrations. The collected mechanical vibration was amplified and converted into electrical energy by two piezoelectricity-lever devices. Lin et al. [23] developed mechanical impact-driven frequency up-converted wave energy harvester, which can transfer 0.03–1 Hz waves frequency to hundreds of hertz-operating frequencies. The fluid-structure interaction between the waves and the buoy, and the structural interactions between the beams and the teeth, were considered in the mathematical model, which proves the effectiveness of the wave energy harvester with a frequency up-converted device. For plucking dynamics, Pozzi [24] proposed a piezoelectric wearable energy harvester using mechanical plucking-based frequency up-conversion by deflecting the piezoelectric bimorph via a plectrum. Fu et al. [25] developed a comprehensive model based on Hertzian contact theory and electromechanical model to investigate the dynamic plucking mechanism for piezoelectric energy harvesting application. For array concept, Fang [26] developed a music-box-like extended rotational plucking energy harvester (E-RPEH) using multiple piezoelectric cantilevers. Priya [27] reported a theoretical model for piezoelectric bimorph transducer array used in windmill at low frequency. When wind speed was 10 mph, the power of 75 mW for ten piezoelectric bimorph transducers in windmill.
In this study, a plucking-driven piezoelectric wave energy harvester (PDPWEH) with gear train frequency up-conversion mechanism, and an array of piezoelectric cantilever beams were developed. The gear train is composed of a rack, three gears, and a geared cam, which can achieve frequency up-conversion through the design and assembly of gears. The geared-cam plucked the piezoelectric cantilever beams, which can convert mechanical vibration energy into electrical energy. The mathematical model presented here is based on Euler–Bernoulli beam theory, and is used to analyze the dynamics of the gear train and the vibration of the piezoelectric beam [28]. This model also considers the electromechanical coupling of piezoelectric materials. The developed PPWEH has been tested in the wave flume at Tainan Hydraulics Laboratory, National Chung Kung University, Taiwan (THL, NCKU).

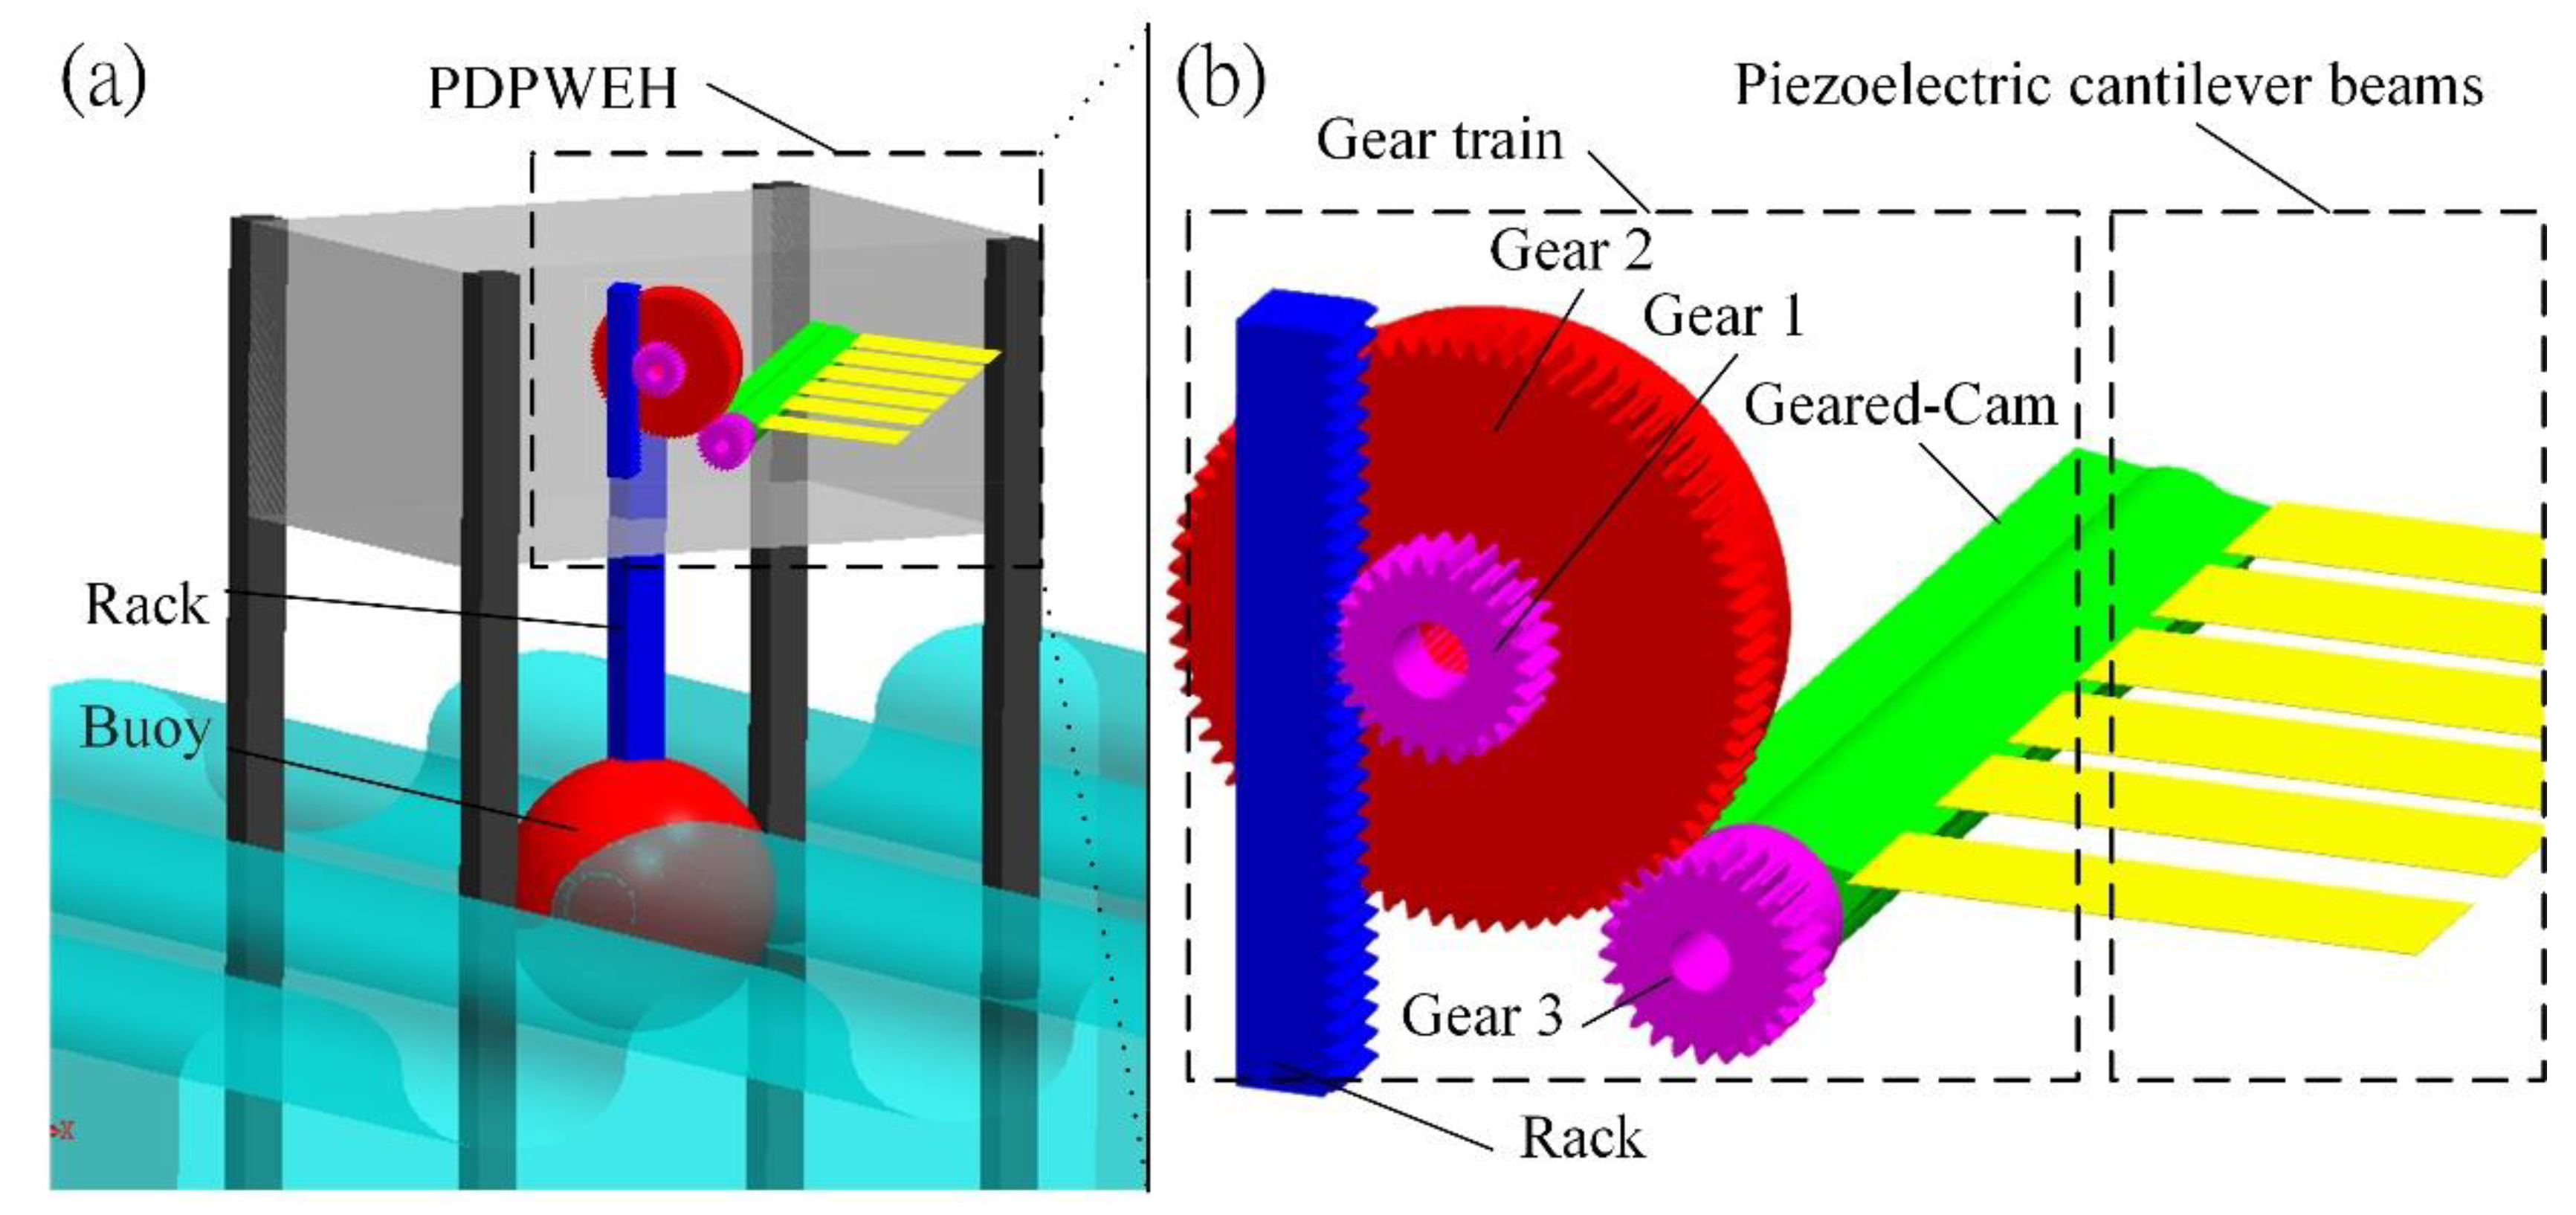
2. Conceptual Design

In our previous study, we used a geared-linkage mechanism to develop a type of Piezoelectric Wave Energy Converter (PWEC), which converted wave at lower frequencies into mechanical motion at higher frequencies to improve the electrical efficiency of the PWEC [29]. The gear-linkage-based frequency up-conversion mechanism converted lower frequency of wave motion into higher frequency mechanical motion to excite piezoelectric films. The developed piezoelectric composite films with higher flexibility can provide larger deformation. However, the inertial mass of the geared-linkage mechanism in the frequency-up-conversion mechanism was too large, reducing the energy conversion efficiency. In this study, a PDPWEH that uses continuous rotary to pluck piezoelectric cantilever beams was developed. Replacing the geared-linkage-driven with a plucking-driven simplifies the mechanism and reduces the inertial mass of the gear train frequency-up-conversion mechanism. It can improve the energy conversion efficiency of the PWEC.
As shown in Figure 1, the PDPWEH consisted of a spherical buoy, a gear train frequency up-conversion mechanism, and an array of piezoelectric cantilever beams. The body of the PDPWEH was set above the surface of the ocean wave (Figure 1a), and the wave motion causes the floating buoy to perform vertical heave motion. The buoy drives the rack in a vertical periodic movement. Therefore, the wave energy was converted into mechanical energy to drive IDPWEH.
Figure 1b shows a gear train frequency up-conversion mechanism, which is based on a gear train with one rack, three gears, and a geared cam. The rack was excited by a buoy to perform a vertical repetitive linear motion. The rotational motion of gear train was driven by the repetitive linear motion. The gear train consists of three gear assemblies. The first gear (gear 1) was directly driven by the rack; the second gear (gear 2) has the same angular velocity as gear 1 because of the coaxial assembly, and the third gear (gear 3) was driven by gear 2. The angular velocity of gear 3 was three times that of gear 2 because their gear ratio was 3. Those gears were obtained from Apex Dynamics, Inc. The numbers of teeth of gear 1, gear 2, and gear 3 are 25, 75, and 25, respectively. The module of gears is one. The geared cam was driven by gear 3 with the same angular velocity to perform the repetitive rotational motion. The geared cam with three teeth can pluck the piezoelectric cantilever beams three times in one revolution.
Figure 1b shows an array of piezoelectric cantilever beams containing six individual piezoelectric composite beams used in this study. The piezoelectric composite cantilever beam was plucked by geared cam to perform free vibration and the sol-gel PZT film was subjected to tensile and compressive stresses. The sol-gel PZT film generated the electric charges by the direct piezoelectric effect as the sensor application. In this study, the piezoelectric composite beam was prepared using a sol-gel method. The details of the preparation process would be described in the following paragraphs. A diagram of the size of the piezoelectric composite beam is shown in Figure 2a. The length L and width W of the beam was 80 and 20 mm, respectively. One end of the beam was clamped by the fixture, resulting in an effective length Lf of 74 mm. The A-A cross-section of the composite beam was shown in Figure 2b. The thickness of the silicon substrate, PZT, and silver top-electrode layers are 200, 130, and 15 μm, respectively. The neutral axis was used to determine the thickness of the piezoelectric layer. The neutral axis was placed in the substrate layer to maximize the voltage output of the piezoelectric material. The density of the silicon, PZT, and silver are 2330, 7800, and 10490 kg/m3, respectively. The Young’s modules of silicon and silver are 179 GPa and 83 GPa. The Poisson’s ratio of silicon and silver are 0.31 and 0.37. The elastic matrix C P Z T of PZT is shown as follows:
C P Z T = [ 67 41.8 41.6 0 0 0 41.8 67 41.6 0 0 0 41.6 41.6 61.4 0 0 0 0 0 0 11.7 0 0 0 0 0 0 11.7 0 0 0 0 0 0 12.5 ]

3. Design, Analysis, Fabrication, and Testing of PDPWEH

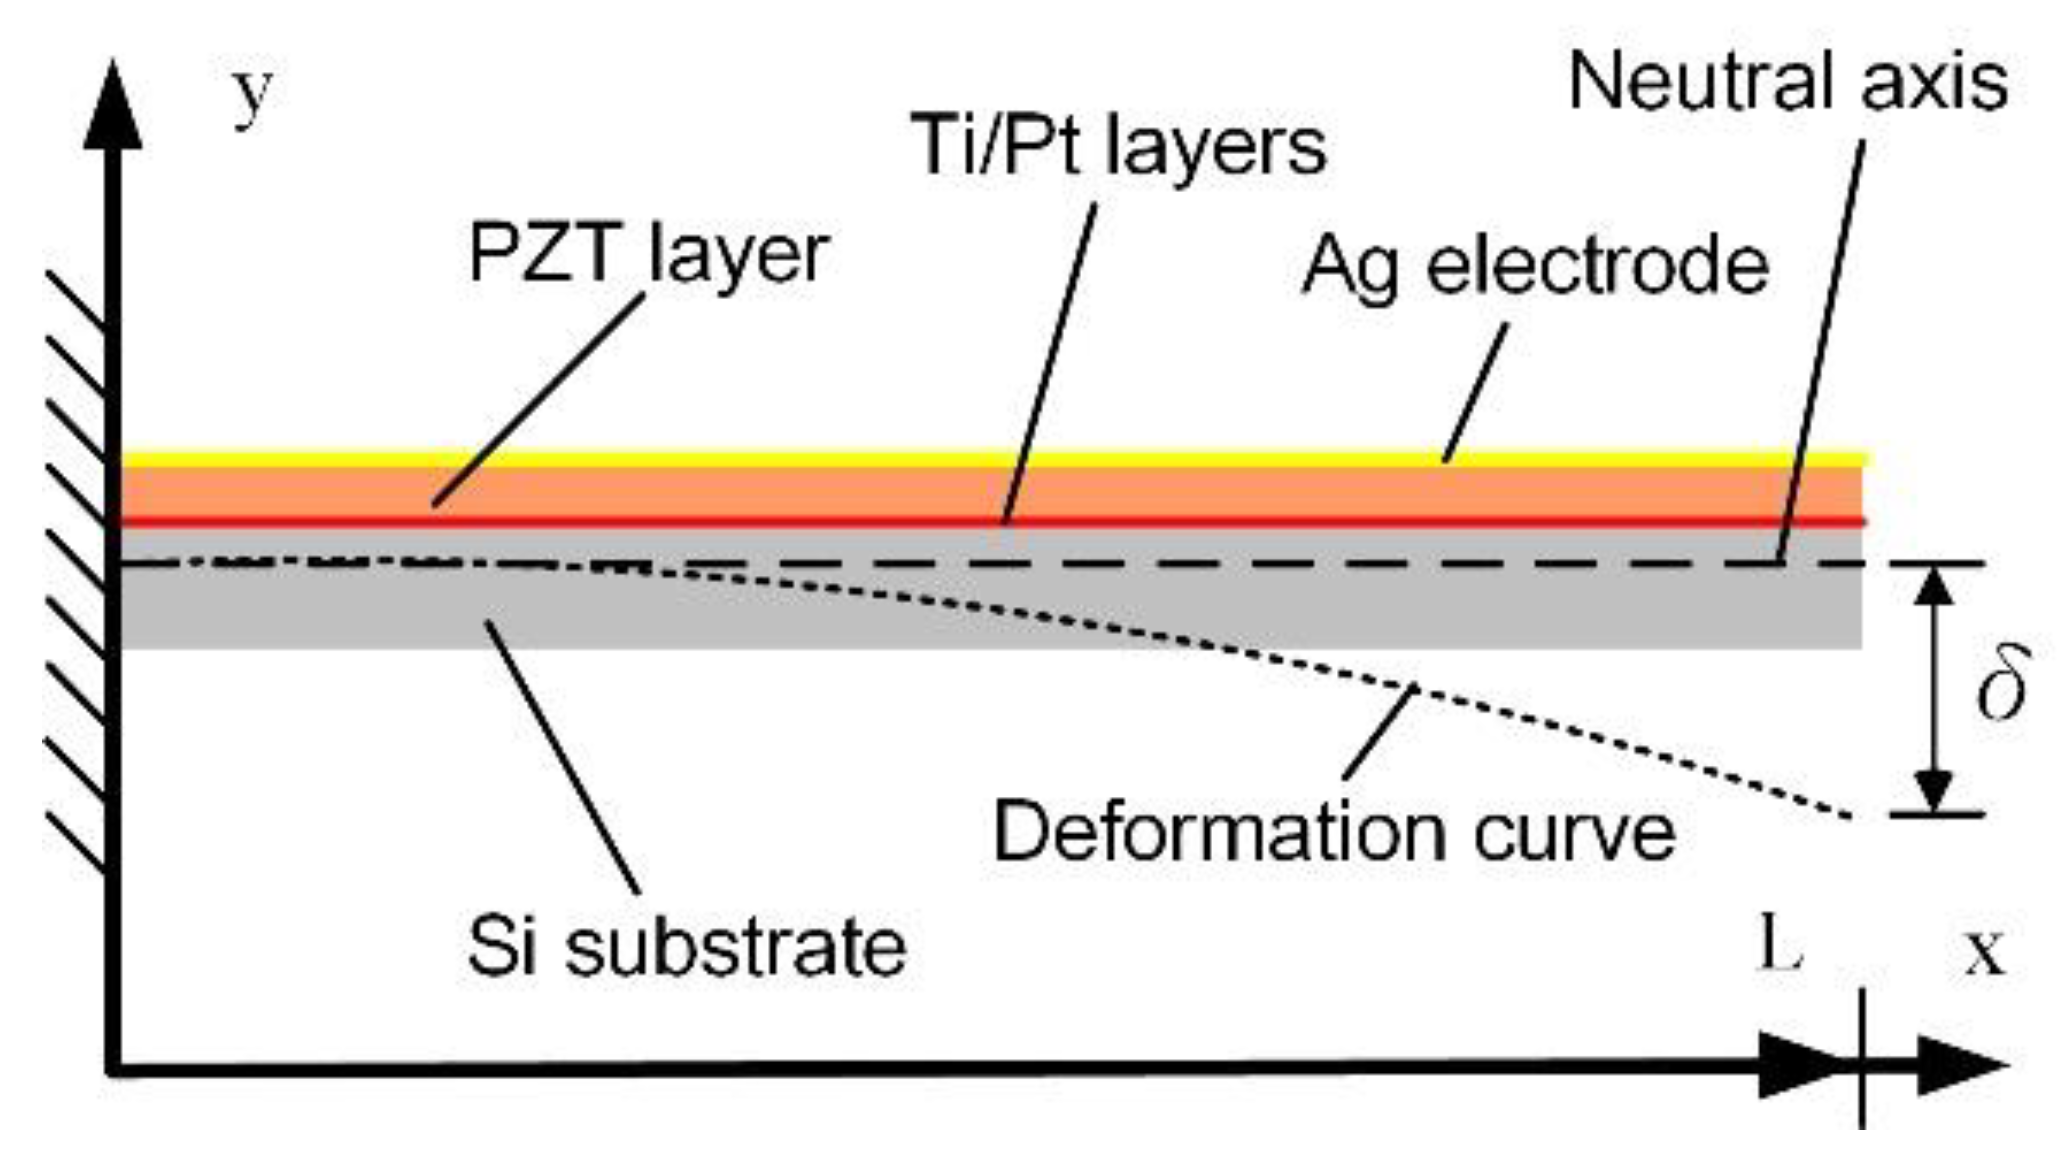
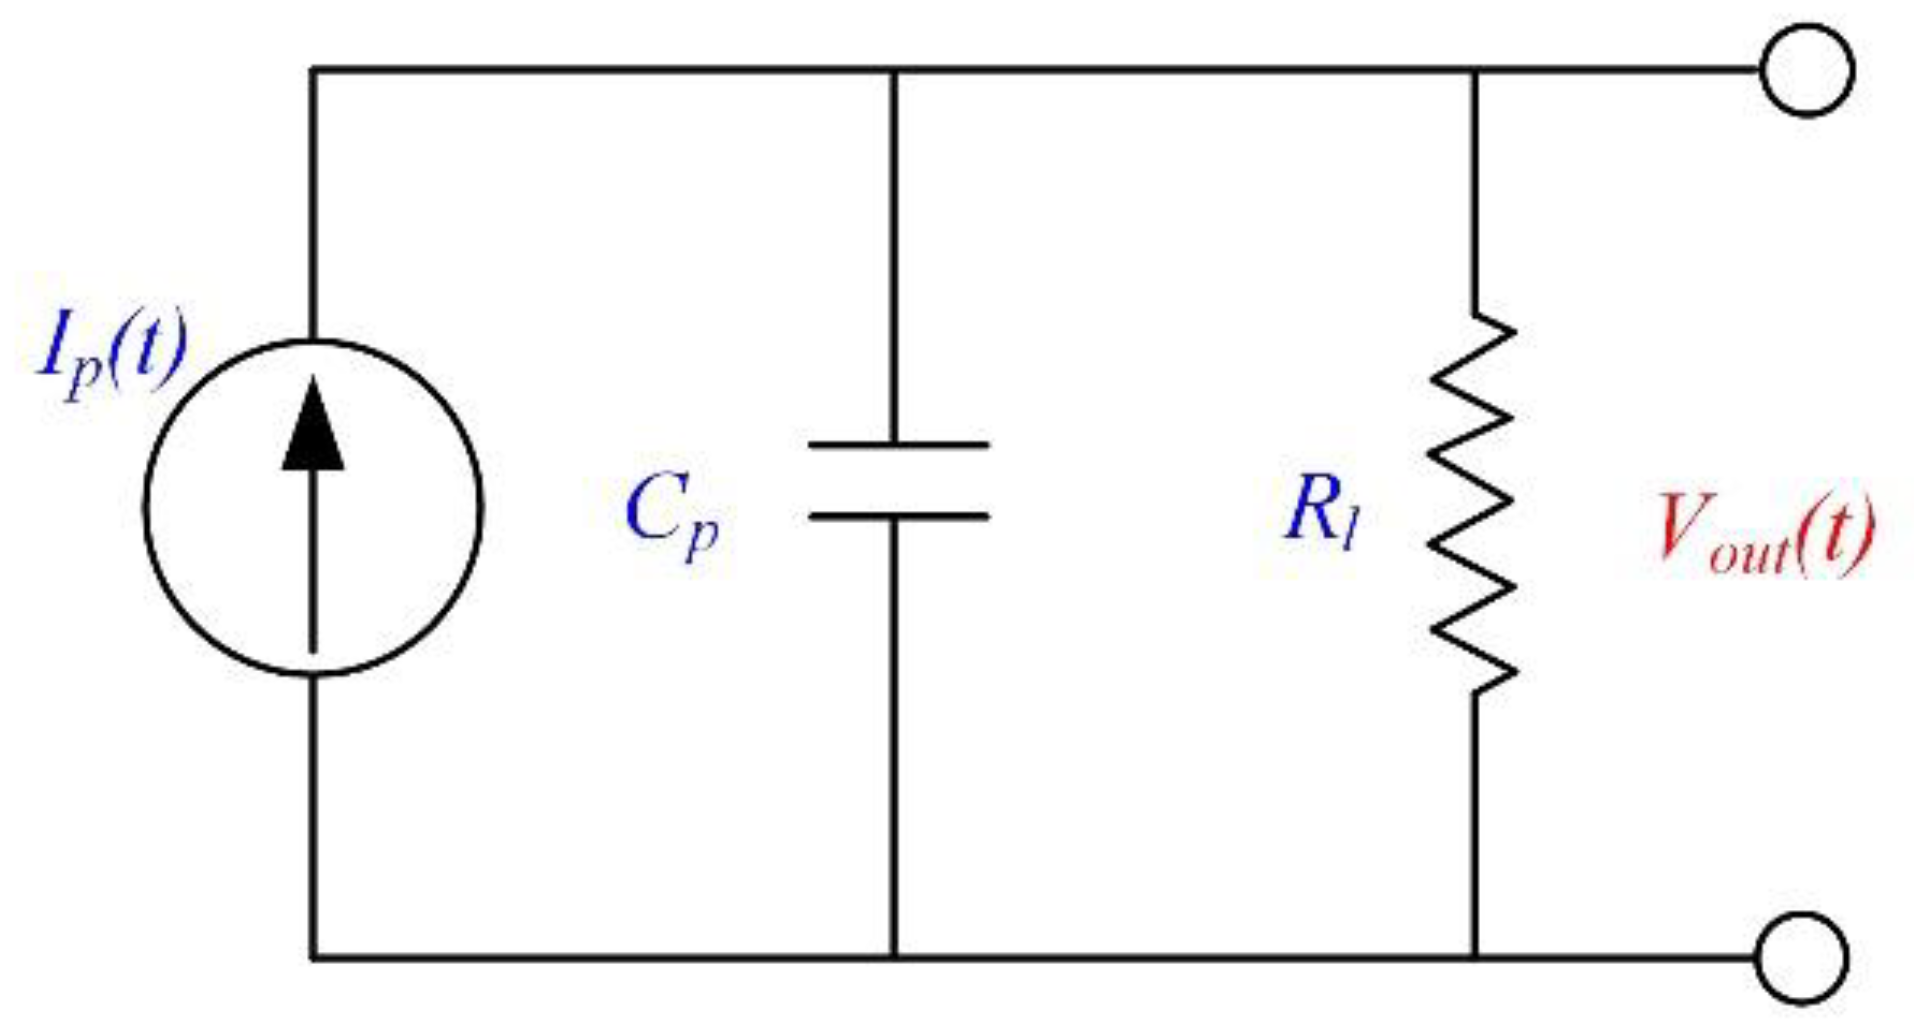
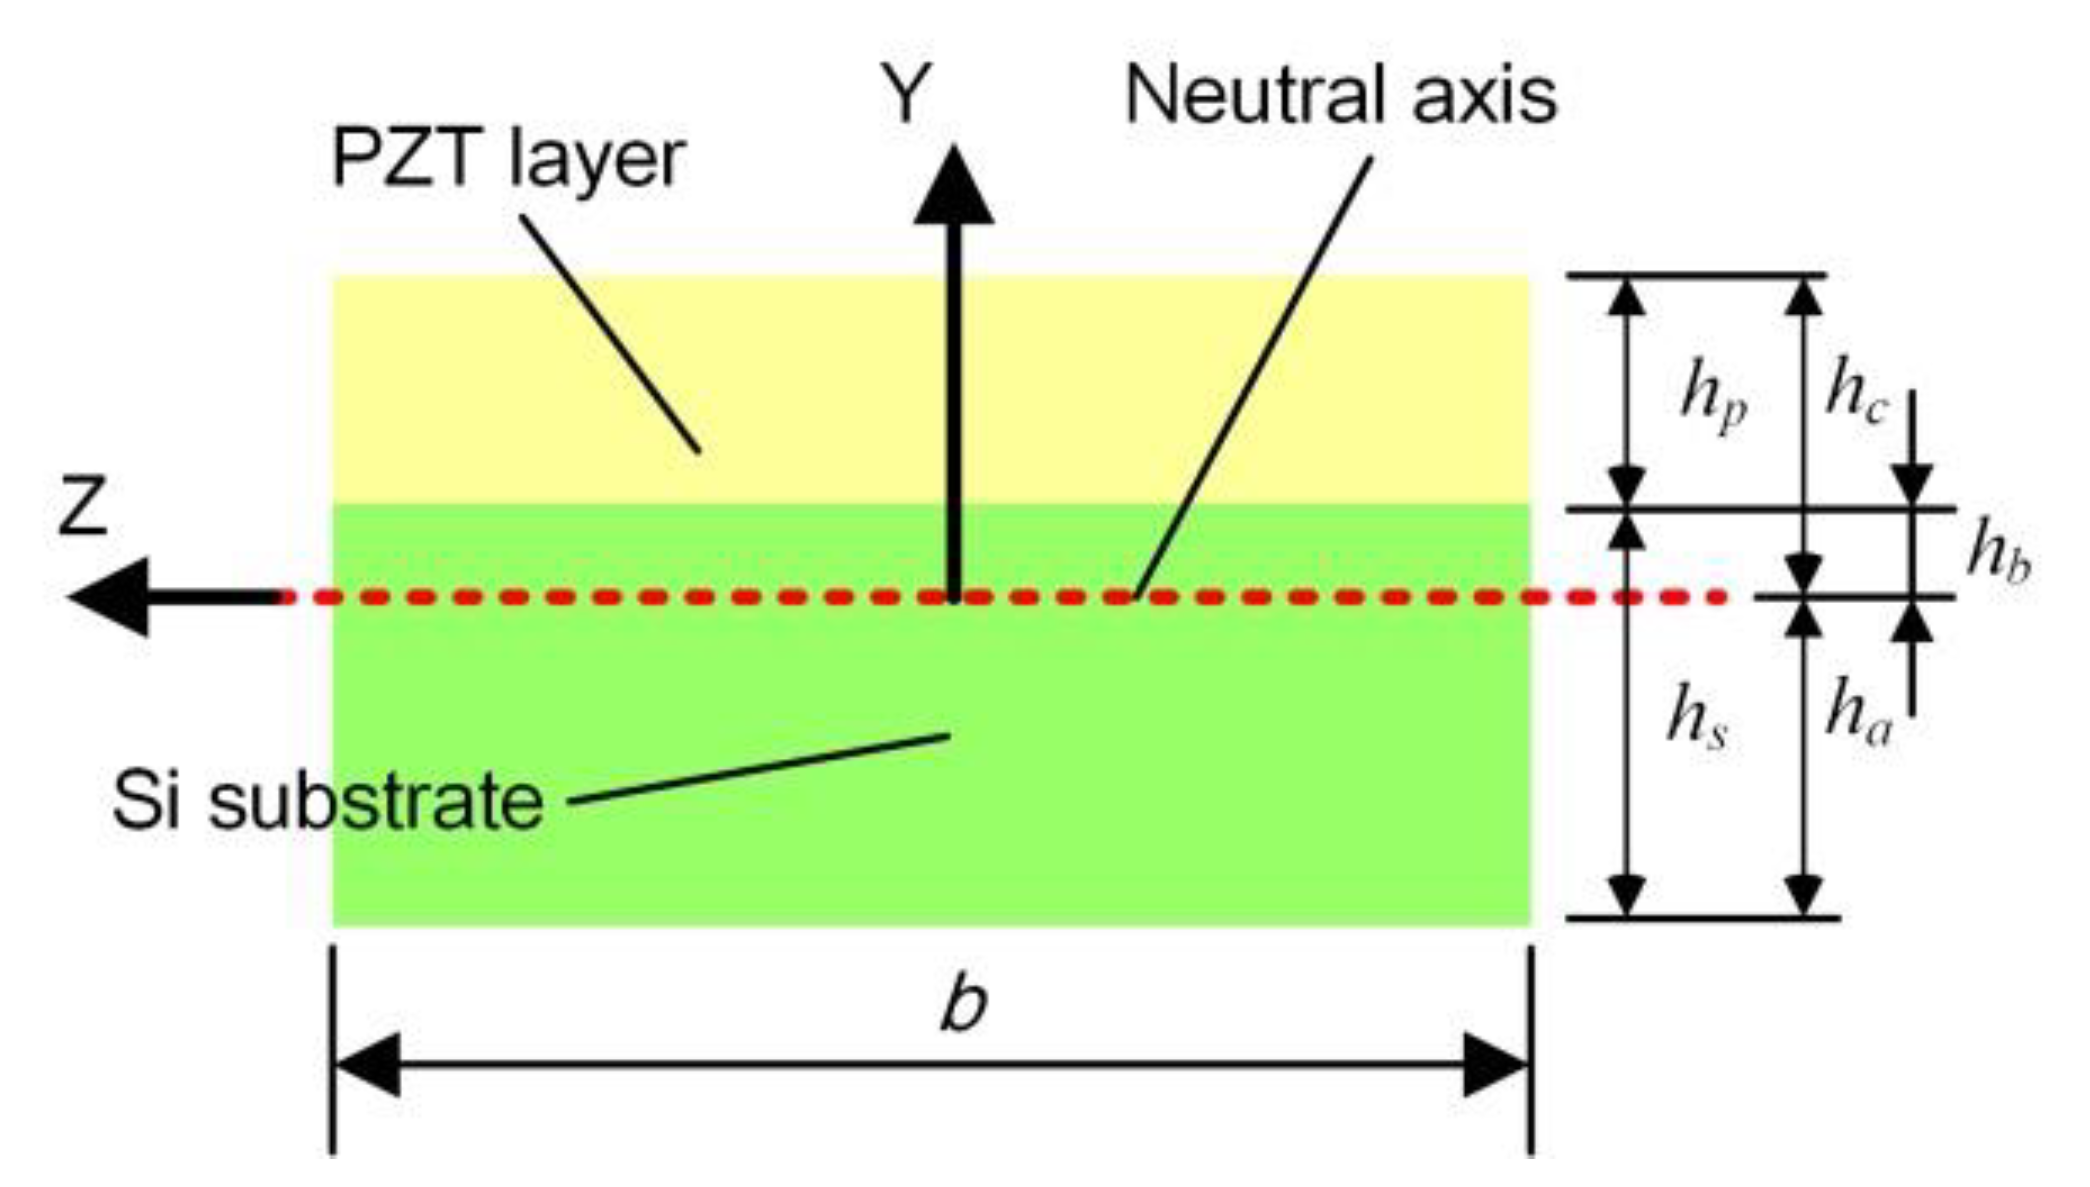
3.1. The Output Electromechanical Model of the Piezoelectric Composite Beam

In this study, Figure 3 shows the electromechanical model of a piezoelectric composite beam assumed to be a clamped-free uniform composite Euler–Bernoulli beam. This composite beam is composed of a silicon substrate, PZT layer, and silver electrode. To deform the structure, the rotating geared cam will pluck the beam at the free end. Symbol δ represents the deflected displacement at the free end of the beam in Figure 3. The plucked beam will perform free damped oscillating motion until the next plucking. The strain caused by the structure deformation of piezoelectric material is converted into electrical energy by the positive piezoelectric effect. The Ti/Pt layers deposited on the silicon substrate and the silver electrode screen printed on a PZT layer are assumed to be perfectly conductive. The length of the beam is much greater than the thickness of the Ti/Pt layers and the silver electrode, so the electrical field is uniform across the electrode area. The piezoelectric material can be considered a current source paralleled with a capacitance in an electrical circuit [28,30]; Figure 4 shows a simple output electrical circuit connected with a resistive load. The governing equation of motion can be written as:
2 M ( x , t ) x 2 + c s I 5 w ( w . t ) x 4 t + c a w ( w . t ) t + m 2 w ( x , t ) t 2 = 0
where M ( x , t ) , w ( w . t ) , c s , I , c a , and m are the internal moment of the beam, the transverse deflation of the composite beam relative to its natural axis, the equivalent coefficient of strain rate damping, the equivalent area moment of inertia for the composite beam cross-section, the air damping coefficient, and the mass per unit length of the composite beam, respectively. The internal moment of the composite beam is obtained by integrating the internal stress of the composite beam and written as
M ( x , t ) = h a h b T s b y d y + h b h c T p b y d y
where T s is the internal stress of the substrate, T p is the internal stress of the PZT layer. The cross-section of the composite beam was shown in Figure 5, where b is the width of the cantilever beam, h s is the thickness of the silicon substrate, h p is the thickness of the PZT layer, h a is the distance from the bottom of the substrate to the nature axis, h b is the distance from the nature axis to the bottom of the PZT layer, and h c is the distance from the nature axis to the top of the PZT layer. After mathematical formula,   h a , h b , and h c can be written as:
h a = h p 2 + 2 h p h s + n h s 2 2 ( h p + n h s )
h c = h p 2 + 2 n h p h s + n h s 2 2 ( h p + n h s )
h b = h c h p
n = Y s / Y p
where Y p and Y s are Young’s Modulus of the PZT layer and silicon substrate, respectively, and n is the ratio between them.
The d-type constitutive equation of piezoelectric materials describes the conversion relationship between mechanical and electrical energy. This equation includes stress T, strain S, electric field E, and electric displacement D. This equation can be expressed as follows in a two-dimensional system:
S 1 = s 11 E T 1 + d 31 E 3
D 3 = d 31 T 1 + ε 33 T E 3
where s 11 E is the elastic compliance at a constant electric field, which is the reciprocal of Young’s Modulus of PZT layer Y p , d 31 is the piezoelectric strain coefficient, and ε 33 T is the permittivity at constant stress. The subscripts 1 and 3 represent the x- and y-axis, respectively, in the mathematical model, and the y-direction is also the polarization direction of the piezoelectric material. By using Hook’s law, the stress term can be written as Young’s coefficient multiplied by the strain, so the stress terms of the silicon substrate and the piezoelectric layer are rewritten as follows:
T 1 s = Y s S 1 s
T 1 p = Y p ( S 1 p d 31 E 3 )
where T 1 s ,   Y s , and S 1 s are the stress, Young’s Modulus, and strain of the substrate, respectively. T 1 p   and S 1 p are the stress and strain of the PZT layer. E 3 is the electrical field of the PZT layer ( E 3 = v o u t ( t ) / h p ), where v o u t ( t ) is the voltage across the PZT layer. Substituting Equations (10) and (11) into Equation (3), and considering the relationship between strain and deflection, the equation of the internal moment of the beam can be rewritten as:
M ( x , t ) = h a h b Y s b 2 w ( x , t ) x 2 y 2 d y + h b h c Y p b 2 w ( x , t ) x 2 y 2 d y + h b h c Y p b d 31 y v o u t ( t ) h p d y
Equation (12) can be further simplified to obtain Equation (13):
M ( x , t ) = Y I 2 w ( x , t ) x 2 + α v o u t ( t ) [ H ( x ) H ( x L ) ]
where Y I is the bending stiffness of the cross-section of the composite cantilever beam and α is the piezoelectric coupling term. They can be written as follow:
Y I = b Y p 3 [ h c 3 + ( n 1 ) h b 3 n h a 3 ]
α = Y p b d 31 ( h b + h c ) / 2
The Heaviside Function H ( x ) in Equation (13) is used to represent the range of the electrode layer overlying the piezoelectric layer from 0 to L. Then, considering the moment generated from the electrode and integrating Equation (11) in Equation (2), the governing equation can be rewritten as:
Y I 4 w ( x , t ) x 4 + c s I 5 w ( w . t ) x 4 t + c a w ( w . t ) t + m 2 w ( x , t ) t 2 + α v o u t ( t ) [ d δ ( x ) d x d δ ( x L ) d x ] = 0
Then, a solution of the relative vibratory motion of the beam was represented in Eigen functions form, which was written as
w ( x , t ) = r = 1 ϕ r ( x ) η r ( t )
where ϕ ( x ) and η r ( t ) are the normal mode of the system and the modal coordinate of the cantilever beam for the rth mode, respectively. The mass normalized modes of the corresponding undamped free vibration problem were given by
ϕ r ( x ) = A r [ cosh β r x cos β r x σ r ( sinh β r x sin β r x ) ]
where the β r is the dimensionless frequency numbers, which can be obtained from the characteristic equation given by:
cos β r L cosh β r L + 1 = 0
and σ r is given by:
σ r = sinh β r L sin β r L cosh β r L + cos β r L
The mode shapes satisfy the following orthogonality conditions:
x = 0 L m ϕ s ϕ r ( x ) d x = { 0 ( r s ) 1 ( r = s )
x = 0 L Y I ϕ s d 4 ϕ r ( x ) d x 4 d x = { 0 ( r s ) ω r 2 ( r = s )
where ω r is the undamped natural frequency of the rth mode given by
ω r = ( β r L ) 2 Y I m L 4
and by Equation (21) we can obtain:
A r = 1 / m L
Integrating the partial differential equation of motion [Equation (17)] in the governing equation of motion [Equation (12)] to obtain the ordinary differential equation of electromechanically coupled for the modal response:
η r ¨ ( t ) + 2 ζ r ω r η r ˙ ( t ) + ω r 2 η r ( t ) = F ( t )
where ζ r is the mechanical damping ratio that includes the effects of strain rate and viscous air damping, and F ( t ) is the plucking force from geared cam to cantilever beam variety with time. The mechanical damping ratio was written as:
ζ r = c s I ω r 2 Y I + c a 2 m ω r
The Duhamel integral can be used to express the modal response:
η r ( t ) = 1 m L ω r d τ t F ( τ ) e ζ r ω r ( t τ ) sin [ ω r d ( t τ ) ] d τ
where ω r d = ω r ( 1 ζ r 2 ) is the damped natural frequency of the rth mode.
The governing circuit equation was derived using the e-type constitutive equations of piezoelectric materials, which are shown as Equations (28) and (29).
T 1 = c 11 E S 1 + e 31 E 3
D 3 = e 31 S 1 + ε 33 S E 3
where c 11 E is the elastic stiffness at a constant electric field, e 31 is the piezoelectric charge strain coefficient, and ε 33 S is the permittivity at constant strain ( ε 33 S = ε 33 T d 31 2 / s 11 E ). The electric current output was expressed using Gauss law as in the following equation:
d d t ( A D · n   d A ) = V o u t ( t ) R l
where D is the vector of electric displacement components, and n denotes the unit outward normal to the electrode area A. The inner product of the integrand in Equation (30) is from D 3 because the 3-direction (i.e., y-direction) is perpendicular to the electrode. The bending strain term in Equation (29) can be expressed in terms of curvature. When Equation (29) is substituted into Equation (30), we can obtain
e 31 b ( h b + h c ) 2 0 L 3 w ( w . t ) x 2 t d x ε 33 S b L h p d V o u t ( t ) d t = V o u t ( t ) R l
The modal expansion (Equation (17)) can be substituted in Equation (31) to obtain
r = 1 κ r d η r ( t ) d t ε 33 S b L h p d V o u t ( t ) d t = V o u t ( t ) R l
where κ r is the modal coupling term which can be written as:
κ r = e 31 b ( h b + h c ) 2 0 L d 2 ϕ r ( x ) d x 2 d x = e 31 b ( h b + h c ) 2 d ϕ r ( x ) d t | x = L
In the previous paragraph, the PZT layer was a capacitance component. Therefore, the electrical circuit model can be described as shown in Figure 4. The symbols of I p ( t ) , C p , R l , and V o u t ( t ) represent the positive piezoelectric effect’s current variation with time, internal capacitance of the PZT layer, resistive load, and output voltage variation with time. The electric circuit model can be expressed using Kirchhoff laws as the following equation:
I p ( t ) = V o u t ( t ) R l + C p d V o u t ( t ) d t
where the current source and the internal capacitance terms are:
C p = ε 33 S b L h p
I p ( t ) = r = 1 κ r d η r ( t ) d t
Additionally, the formula for open circuit output voltage can be written as follows:
I p ( t ) = C p d V o p e n ( t ) d t
where V o p e n is the output voltage of an open circuit.

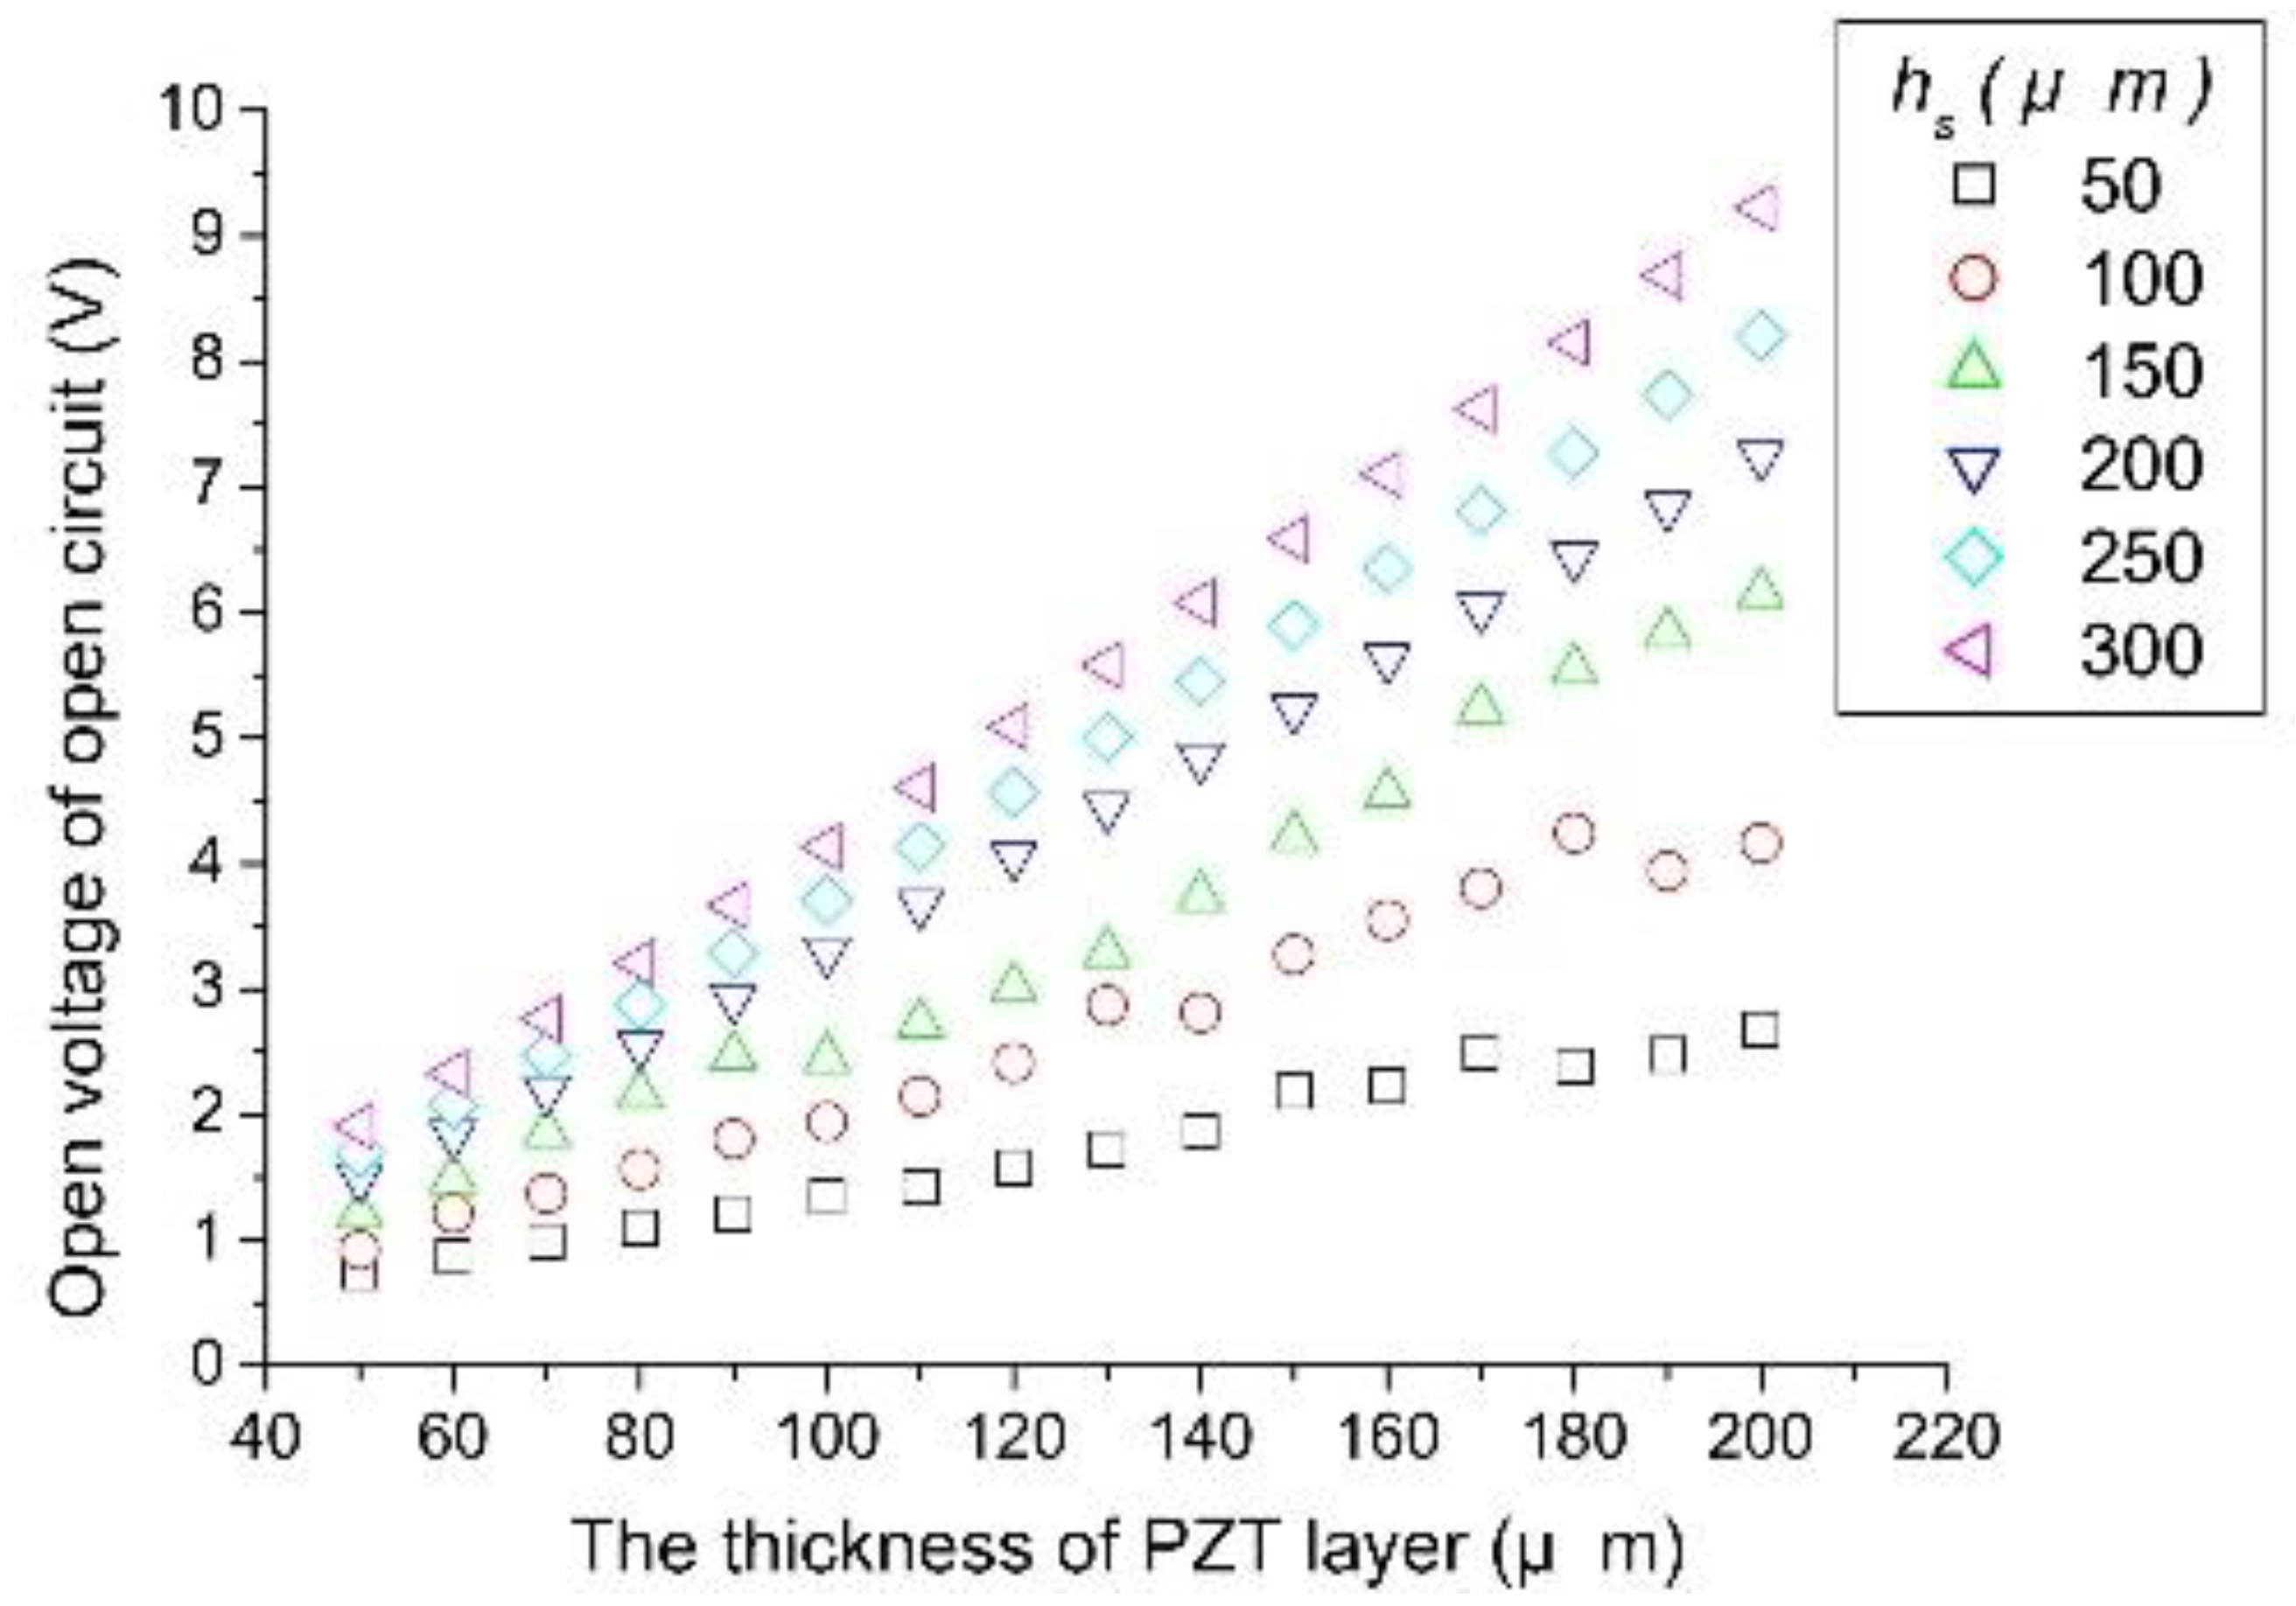
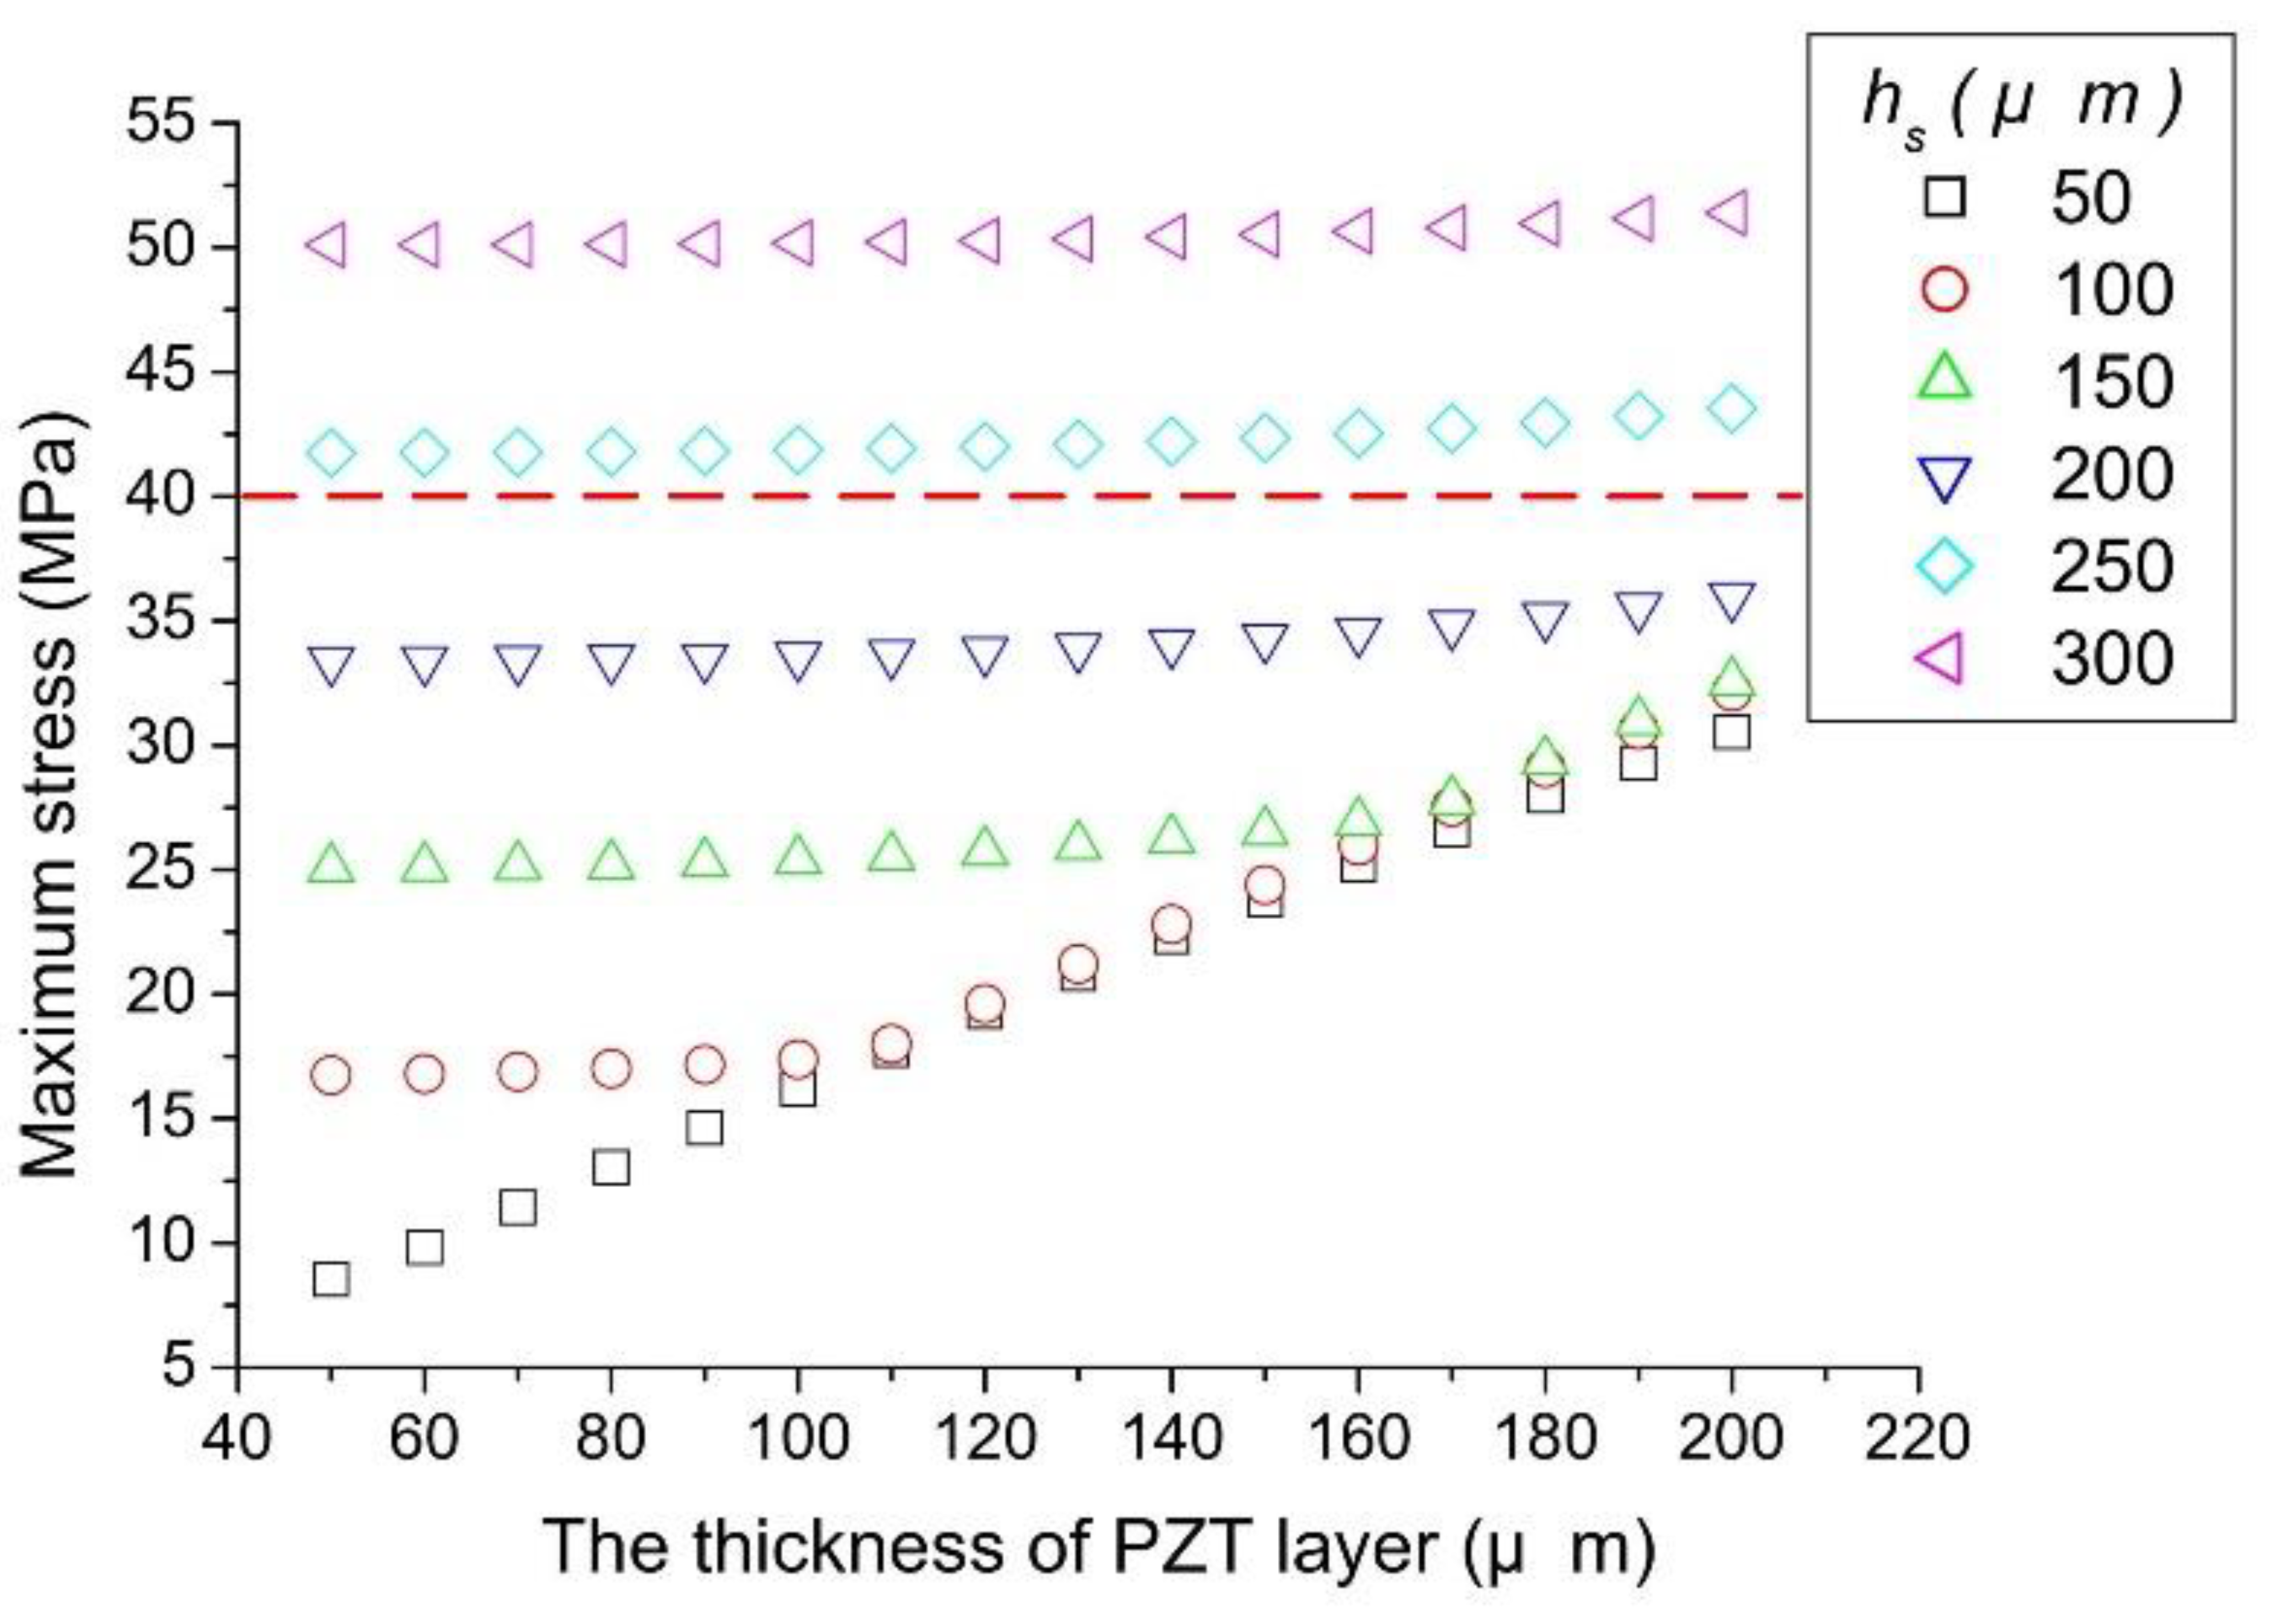
3.2. Analysis of Electromechanical Dynamics with Geometrical Parameters

The geometric parameters of the piezoelectric composite beam, such as length, width, and thickness, will be considered. The mathematical model introduced in the last section was used to evaluate the characteristics of the output voltage generated and natural frequency with different geometrical parameters of the piezoelectric beam. Finite element analysis software ANSYS was used to simulate the magnitude of maximum structural stress. Silicon wafer was chosen as the material of the substrate because it is compatible with the semiconductor manufacturing process and can withstand high temperatures during the sintering process. The material properties of the PZT layer and the silicon substrate are shown in Table 1.
The mathematical model shows that the induced charge from the PZT layer is not related to the width of the composite beam. Equation (23) shows that the natural frequency of a composite beam is related to the length of the composite beam. The lower the natural resonance frequency of the composite beam, the longer the length of the cantilever beam. Designing the length and width of the composite beam to 7.4 and 2 cm, respectively, the area of a 4-inch silicon wafer can be effectively used. The thicknesses of the PZT layer and silicon substrate will determine the electrical output value and the magnitude of the maximum stress. The results of PZT layer thickness vs. frequency, PZT layer thickness vs. output voltage in an open circuit, and thickness of PZT layer vs. maximum stress are shown in Figure 6, Figure 7 and Figure 8, respectively. It is shown that increasing the thickness of the silicon substrate will increase the natural resonance frequency and the electrical output of the piezoelectric composite beam. However, increasing or decreasing the thickness of the PZT layer is difficult to relate to the increase or decrease of the natural resonance frequency, but increasing it will increase the electrical output. Figure 8 shows the results of structural stress simulation using finite element analysis software. The measurement results in the literature showed that the yield strength of the PZT material was 40 Mpa, so the thickness of the silicon substrate was selected as 200 µm. The thickness of the PZT layer will be designed based on the maximum thickness that the laboratory process can reach to obtain a larger electrical output. Therefore, the thickness of the PZT layer is 130 µm. A laser Doppler vibration measuring instrument was used to measure the frequency of the piezoelectric composite beam. The designed composite piezoelectric cantilever beam has a low damping loss during vibration and can improve energy conversion efficiency. The structural resonance frequency is also close to the simulated value.

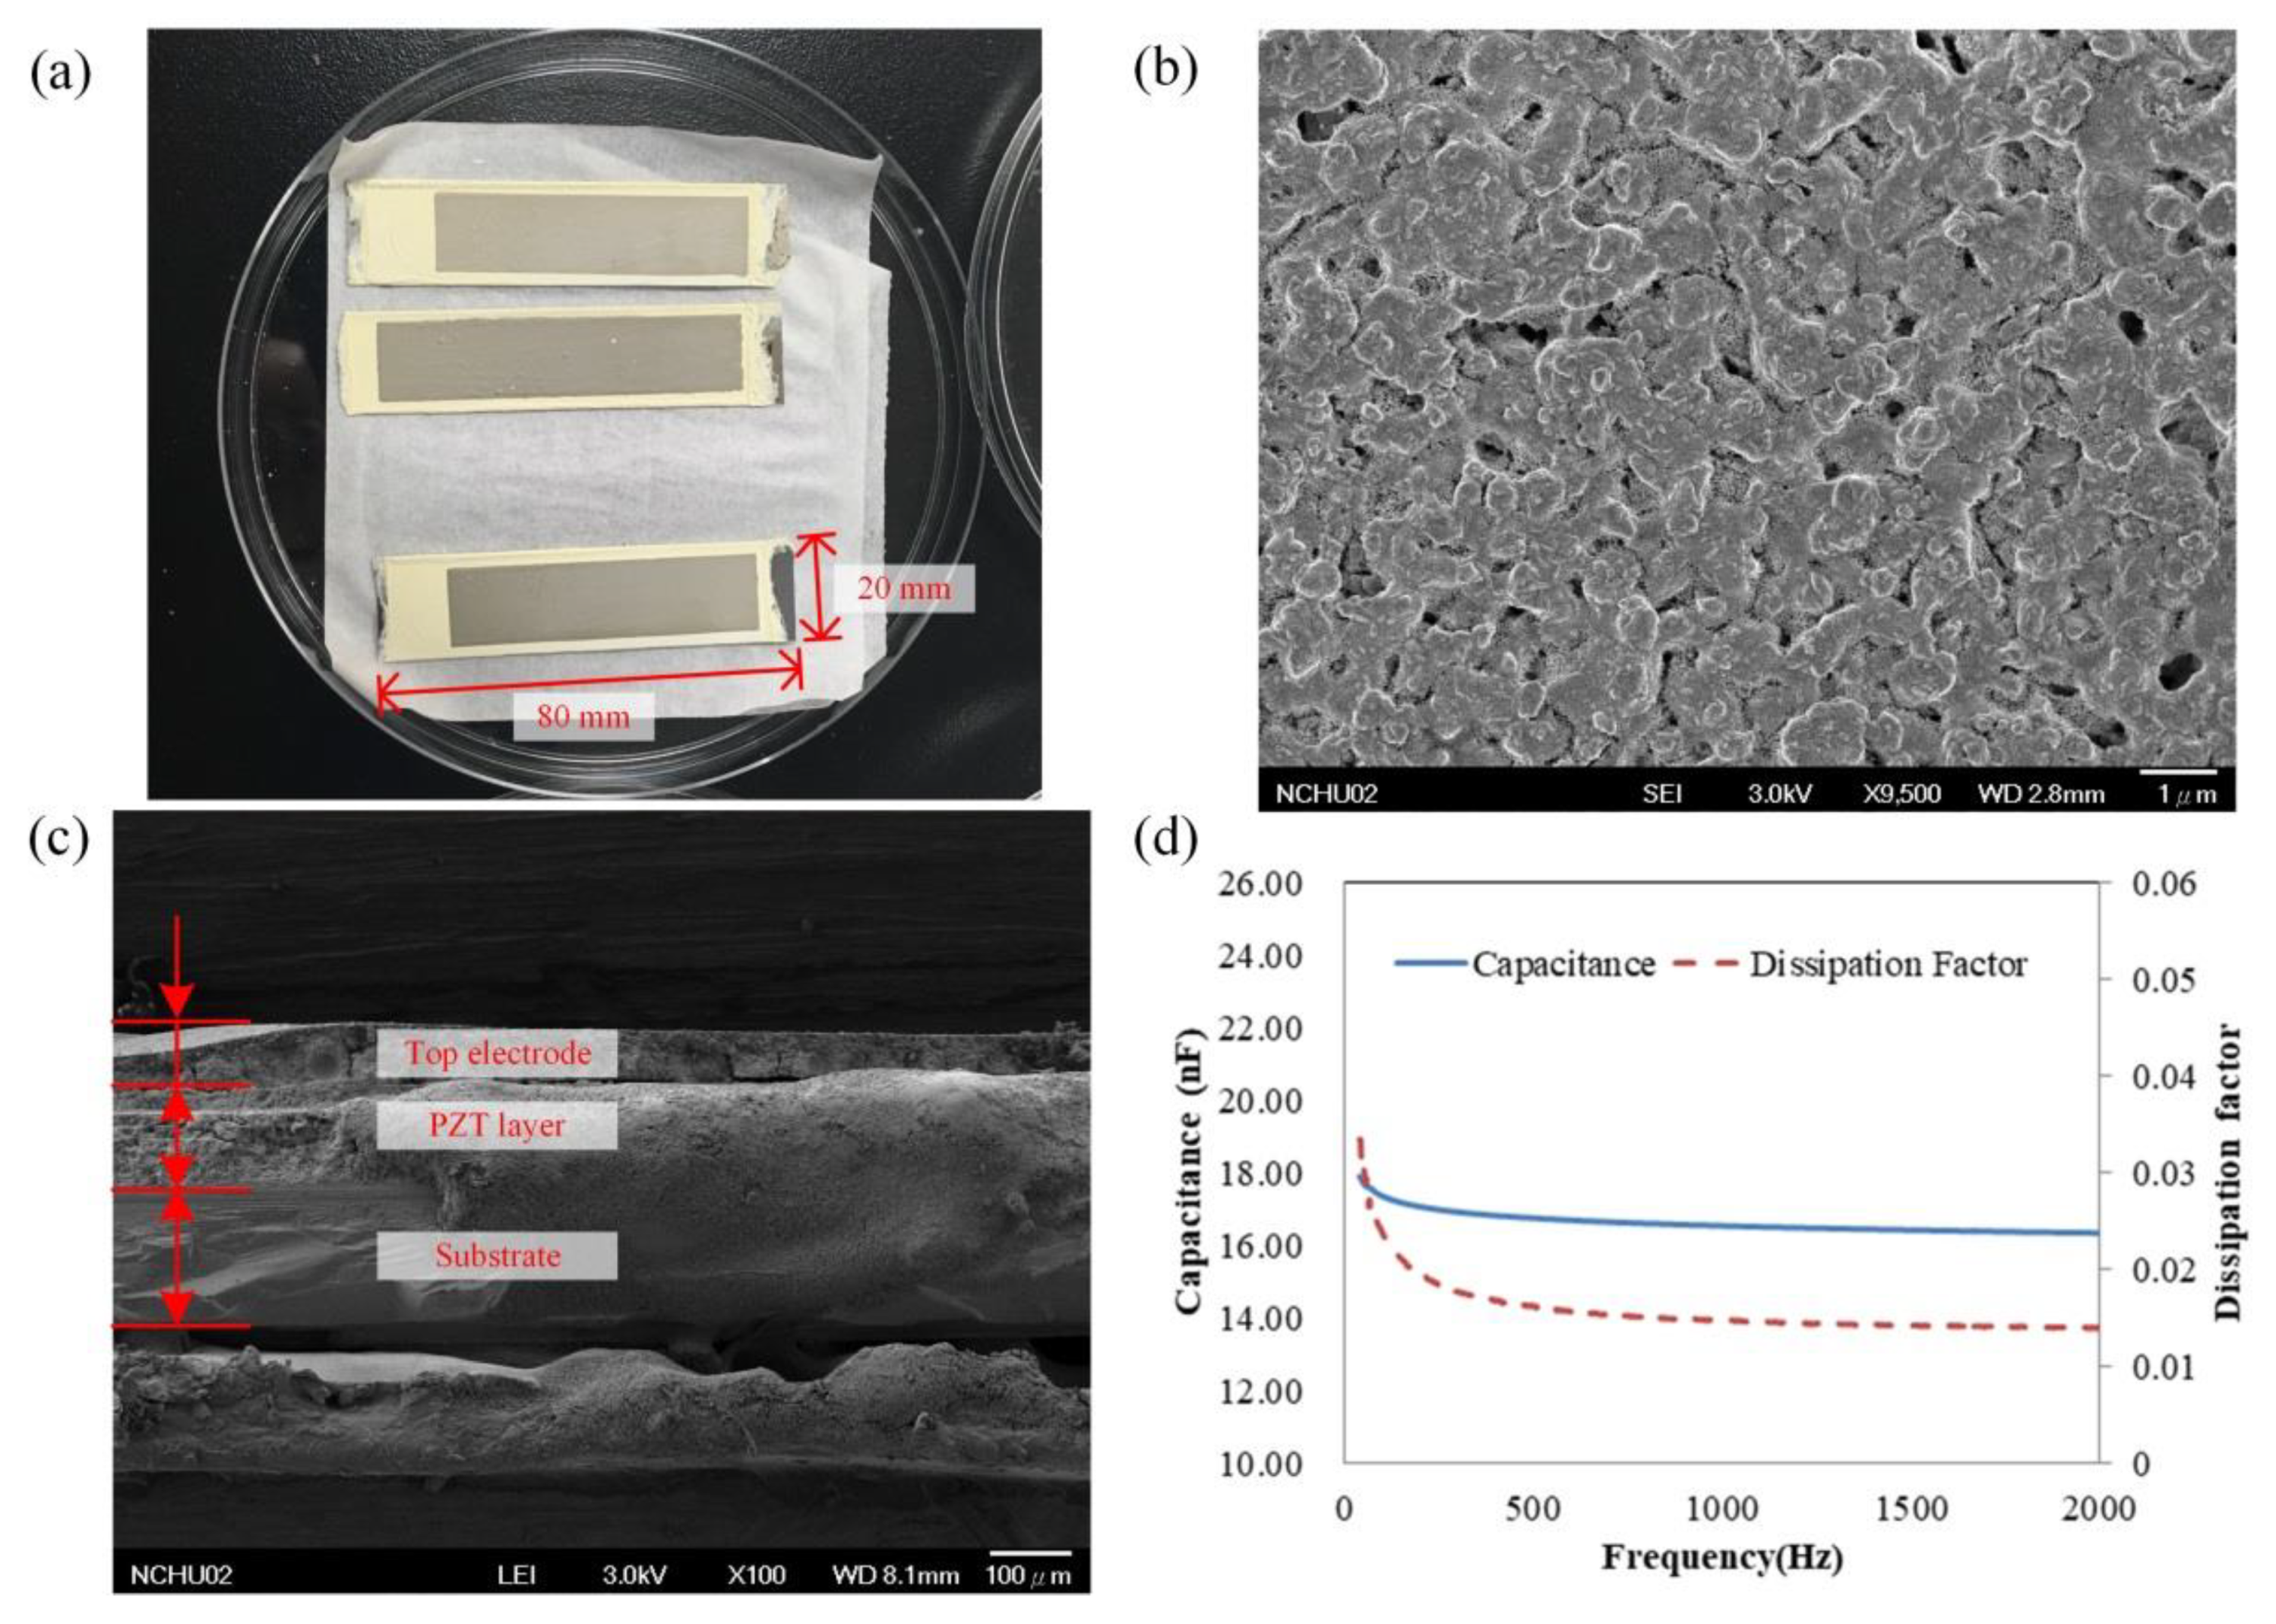
3.3. The Fabrication of the Piezoelectric Composite Beams

The piezoelectric composite beams consisted of Pt/Ti/SiN/SiO2/Si substrate, PZT layer, and a silver top-electrode layer. The single-sided polishing of 4-inch silicon wafers with a thickness of 525 μm was chosen. They were cleaned using an RCA cleaning process, which included ammonium hydroxide ( NH 3 ), hydrochloric acid ( HCl ), sulfuric acid ( H 2 SO 4 ) and hydrofluoric acid ( HF ). The insulating layers consist of silicon dioxide ( SiO 2 ) layer and silicon nitride ( Si 3 N 4 ) layer. Atmospheric Pressure Chemical Vapor Deposition was used to deposit a layer of silicon dioxide ( SiO 2 ) with a thickness of 500 nm. Low-Pressure Chemical Vapor Deposition was used to deposit a layer of silicon nitride ( Si 3 N 4 ) with a thickness of 500 nm. E-Gun evaporation was used to deposit a 50 nm titanium (Ti) and 100 nm platinum (Pt) layer as the button electrode on a silicon wafer. The previous deposition processes were performed in Industrial Technology Research Institute, Taiwan.
The sol-gel method was used to prepare the piezoelectric layer. First, PZT sol was prepared by the following steps. Lead acetate (Lead (II) acetate trihydrate, ACS, 99.0–103.0%) with 24.48 g was added to 15.2 mL of acetic acid and stirred at 550 rpm at 110 °C for 5 min before cooling to room temperature in beaker A. In beaker B, 8.17-mL titanium (IV) isopropoxide (95%) was added to 13.36-mL Zirconium (IV) n-propoxide (70% w/w in n-propanol) and stirred at 550 rpm for 30 min. Then, the solution in beaker B was poured into the solution in beaker A while vigorously stirring them at 550 rpm for 15 min. Then, 16 mL of DI water, 3.4 mL of lactic acid (DI-lactic acid-free acid 85% (w/w) × syrup), 4.8-mL glycerol (anhydrous bar, acs 99.5%), and 3.6 mL of ethylene glycol (Ethylene glycol baker analyzed reagent min 99%) was added and stirred at 550 rpm for 15 min in each step. The solution was then filtered through a 0.2 μ m pore diameter filter. Finally, at 70 °C, 1.6 g/mL of PZT-5A nanoparticles were added to the solution and stirred at 200 rpm for 60 min. Before the coating process, the prepared PZT sol-gel was oscillated in an ultrasonic machine for 30 min. The silicon-based Pt/Ti substrate was cleaned with ethanol 15 min and DI water 15 min. The substrate was then preheated at 250 °C for 15 min on a hotplate. A spin coater was used to coat PZT sol on the substrate. There were two spinning steps. The first step was at 500 rpm for 5 s and the final step was at 600 rpm for 20 s. The samples were heated on a hotplate at 110 °C for 7 min, at 130 °C for 6 min, and at 340 °C for 50 min. Finally, the substrates were sintered in the furnace at 650 °C for 15 min. Repeat these processes above until the film reaches the required thickness of the PZT layer.
Following the completion of the PZT layer deposition, the silver paste was screen printed as the top electrode on the piezoelectric-material layer. Sequentially, the piezoelectric layer was polarized at 90 °C for 30 min with an electric field of 46.2 kV/cm. Finally, the other side of the silicon wafer was thinned from 525 to 200 μm and cut into pieces of 80 mm length and 20 mm width. The final two processes were completed by Integrated Service Technology (iST), a laboratory for verification and tests of the electronic industry in Taiwan.

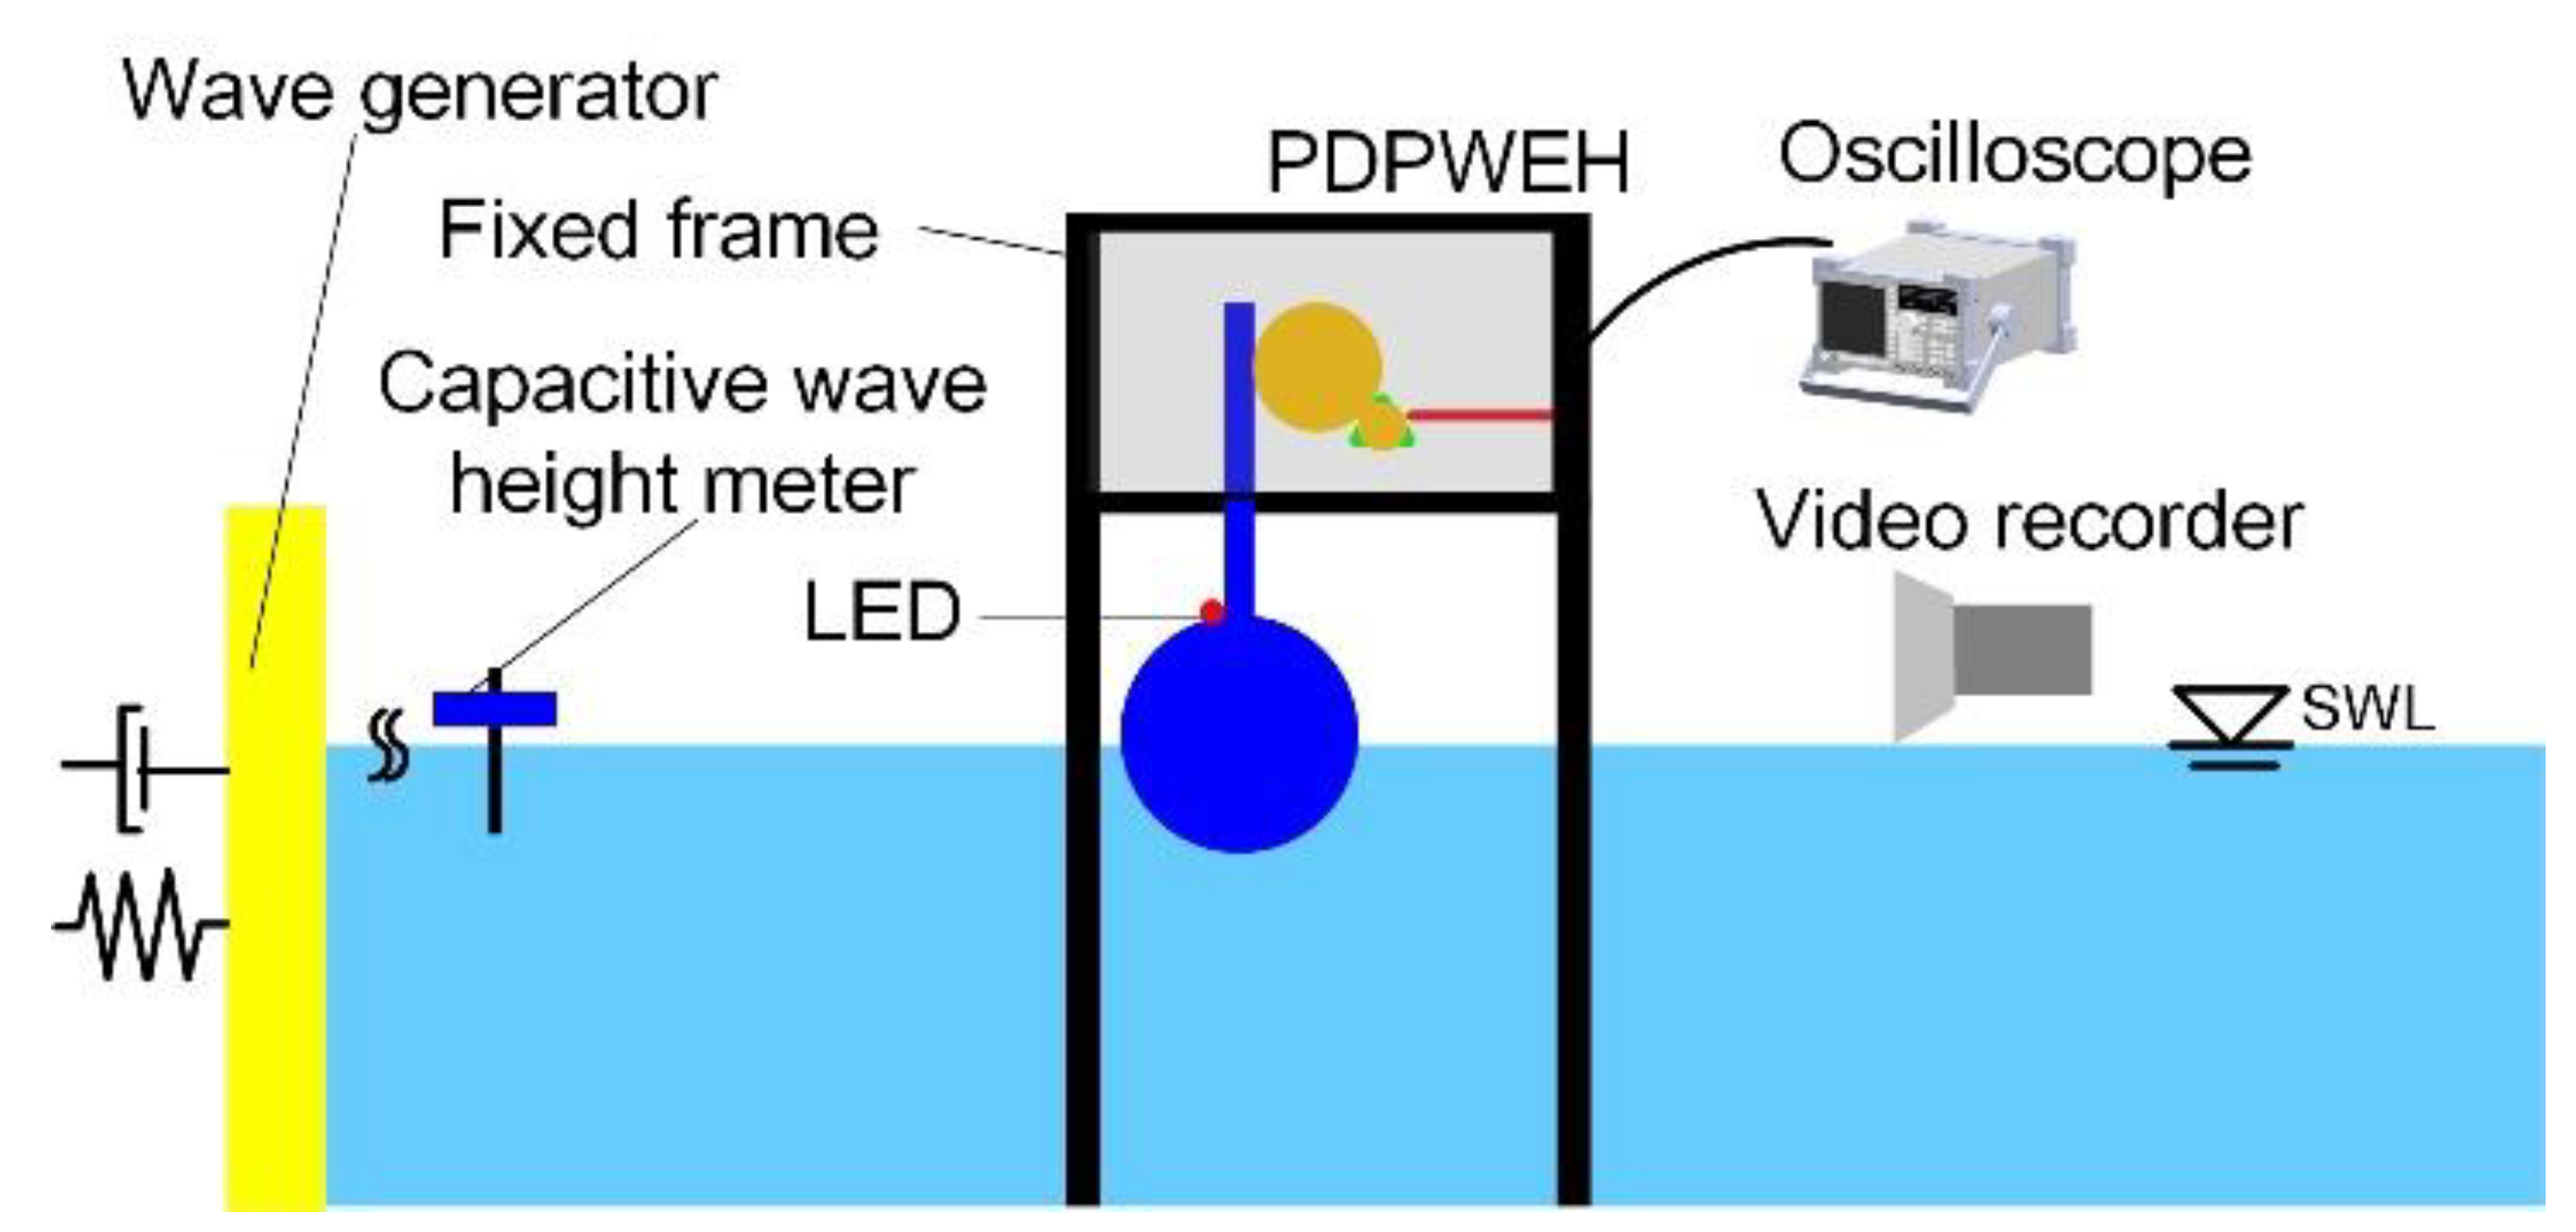
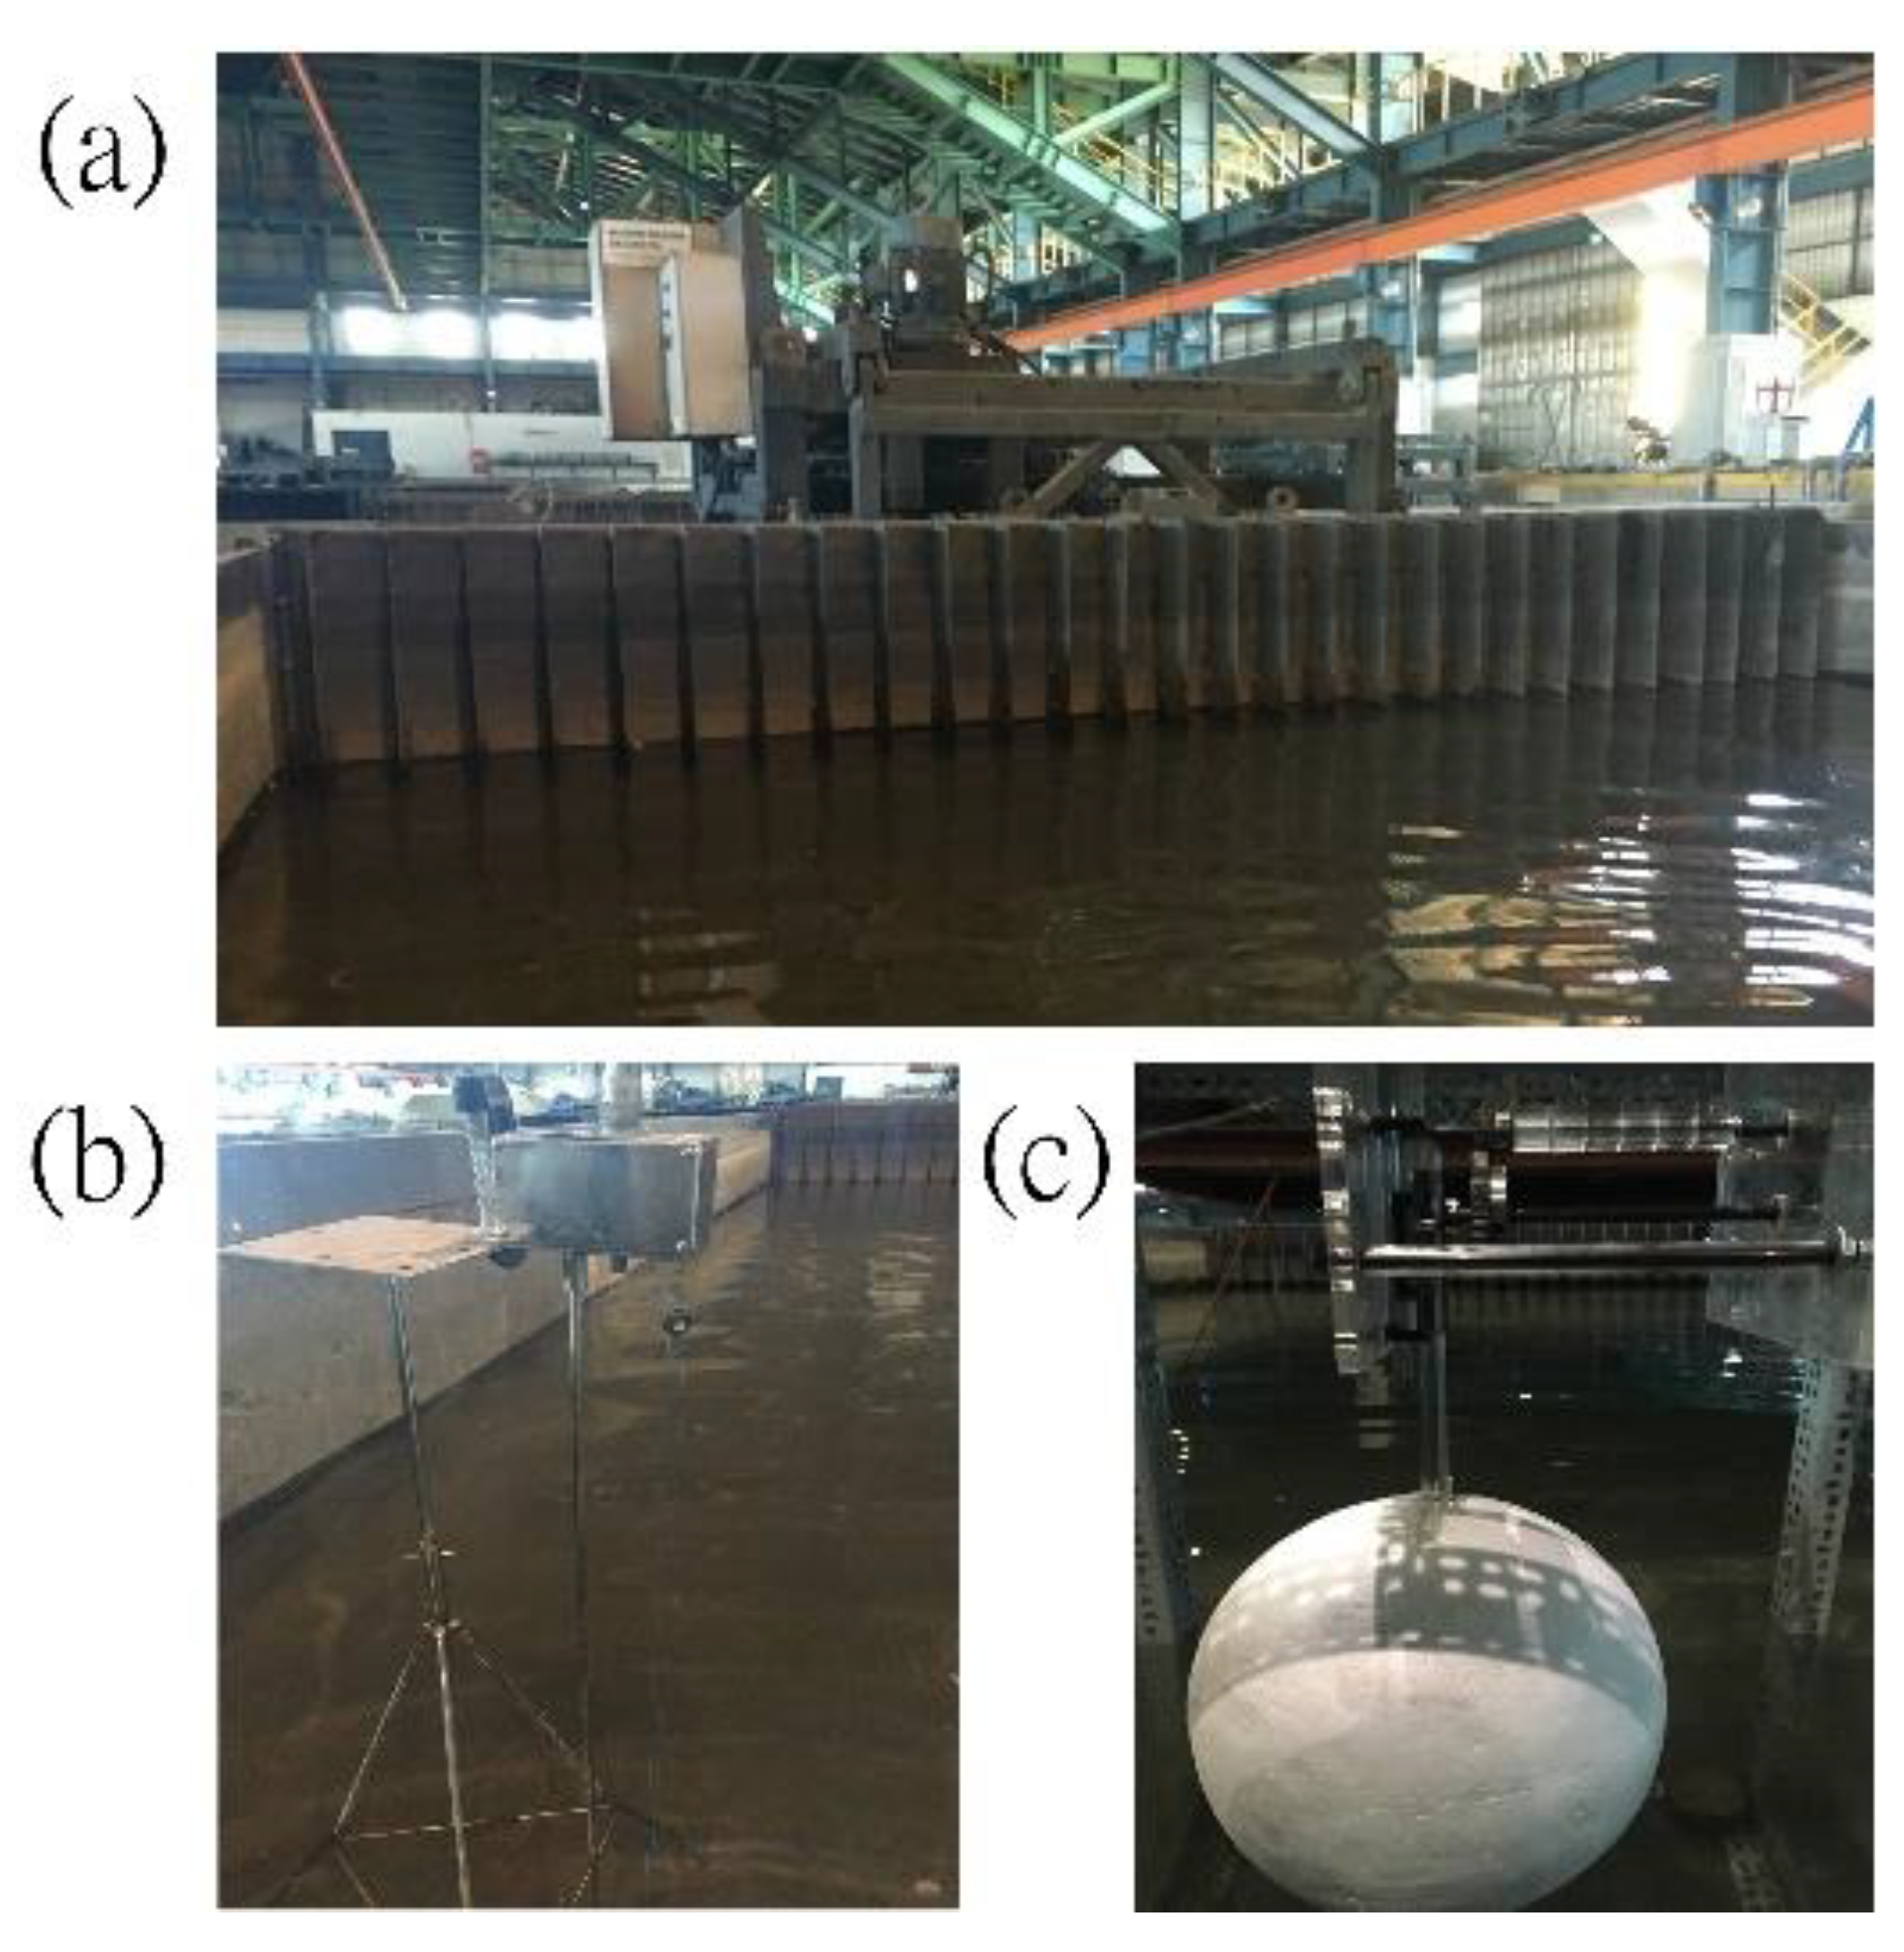
3.4. Experimental Setup

The experiment was conducted in a wave flume of length 27 m, width 19 m, and depth 1 m at Tainan Hydraulics Laboratory, National Chung Kung University, Taiwan (THL, NCKU). An absorbing beach is set on the downstream side of the wave flume to reduce the amplitude and relevant forces of waves. The wave generator in the flume can produce waves up to 0.3 m high at a period of 1.0 to 4.0 s. The experimental conditions for the wave test are shown in Table 2. The wave heights were set to 100 and 75 mm, and the wave periods were set to 1.0, 1.5, and 2.0 s.
Figure 9 shows a schematic view of the experimental setup. Figure 10 shows the image of the experimental devices including wave generator, capacitive wave height meter, and PDPWEH. In order to avoid the disturbance from the water surface and walls, the initial water depth was set at 0.45 m. The PDPWEH was supported by fixed frames and a suitable distance above the still water level. The displacement of the moving buoy was determined by analyzing the video image with a high-speed video recorder and a LED attached to the buoy. An oscilloscope was used to measure the output voltage of PDPWEH. The following equation was used to calculate the RMS output voltage and average electric power:
P a v e = V r m s 2 R l
where P a v e , V r m s , and R l are the average electric power, the RMS output voltage, and the resistive load in the electric circuit. The electrical current was rectified by a bridge-rectifier circuit.

4. Results and Discussion

4.1. Characterization of the PZT Film

In this study, the piezoelectric composite beam was prepared using a sol-gel method. The prepared composite beams with lengths of 80 mm and widths of 20 mm were shown in Figure 11a. Scanning electron microscope (SEM) and capacitance test were used to evaluate the characterization of the PZT composite beam. The morphology of the PZT film is shown in Figure 11b. The average particle size was approximately 1 to 2 μm, and the PZT film was extremely dense. The SEM image of the cross-section of Si/SiO2/SiN/Ti/Pt/PZT/Ag piezoelectric composite film was shown in Figure 11c. The thicknesses of the substrate and PZT layer were 200 and 130 μm, respectively. The capacitance and dissipation factor were measured to determine the electrical properties of the PZT film. A sinusoidal voltage from 40 Hz to 3 kHz was use to excite the PZT film and the response current was measure by an LCR meter (Agilent 4294A). The dielectric loss and capacitance were plotted as a function of frequency. The result of the capacitance test is shown in Figure 11d. The capacitance of the PZT film was 16.5 nF at 1 kHz. The dissipation factor was 0.0147 at 1 kHz.

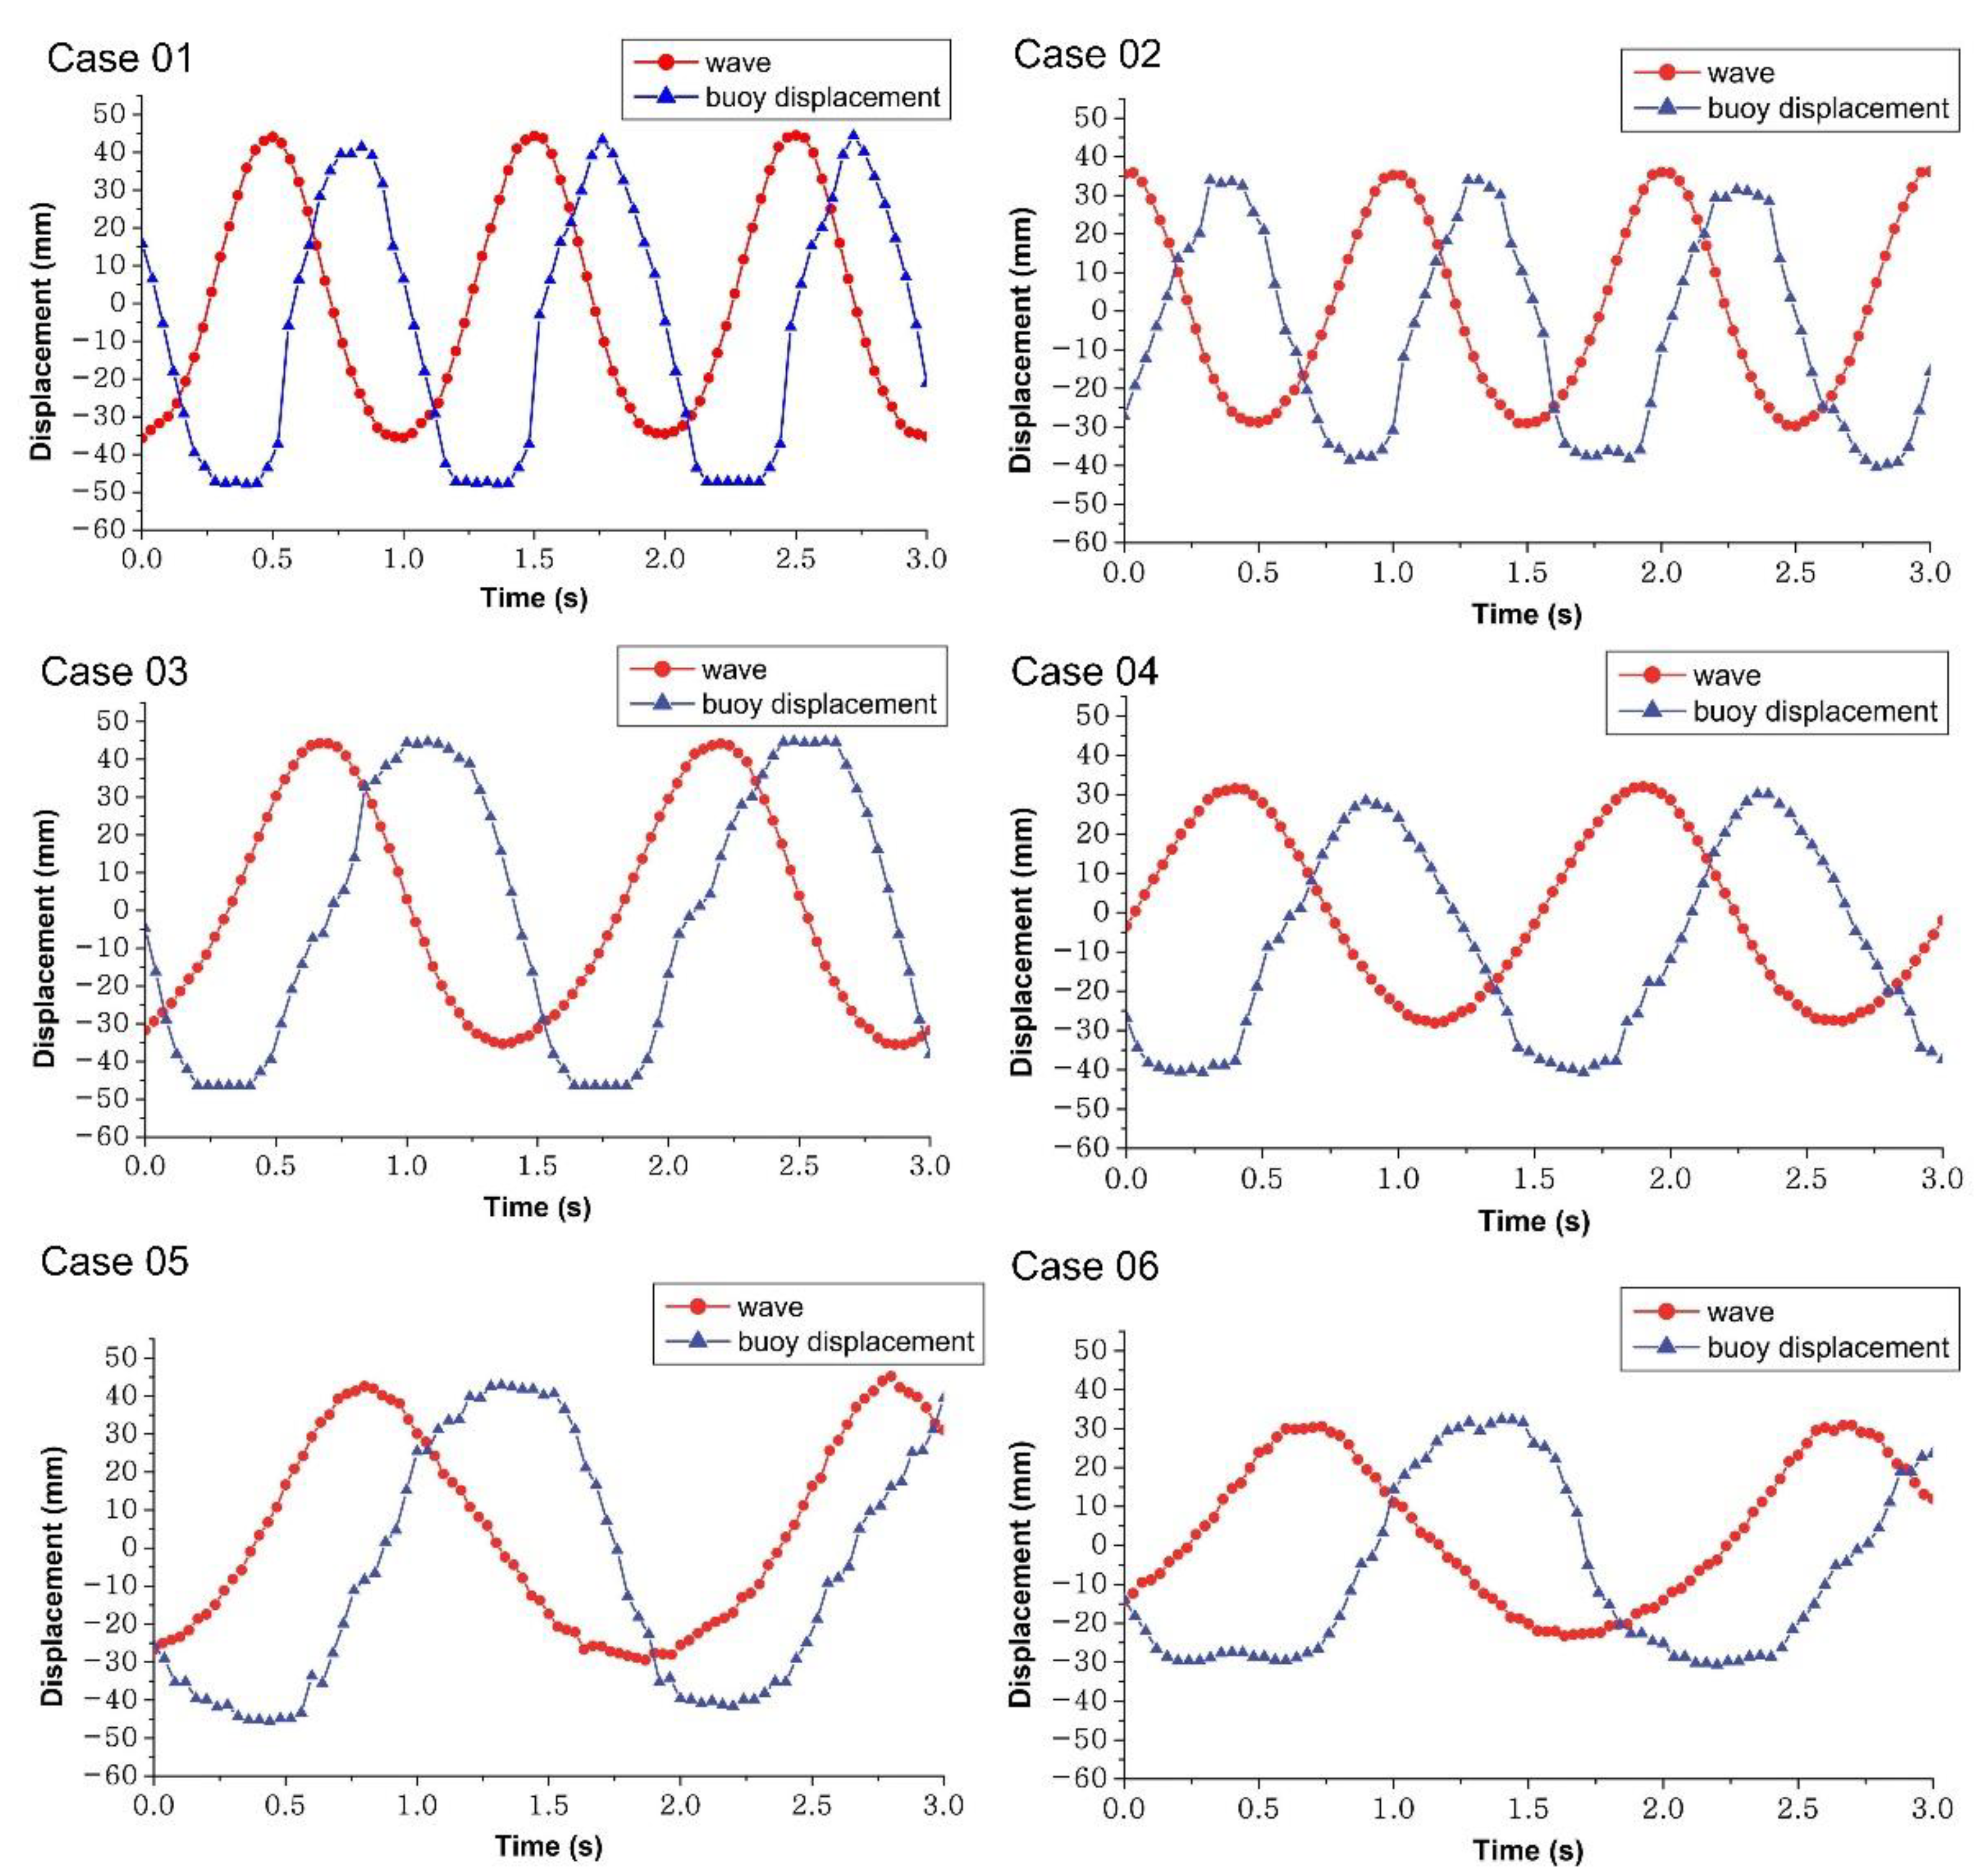
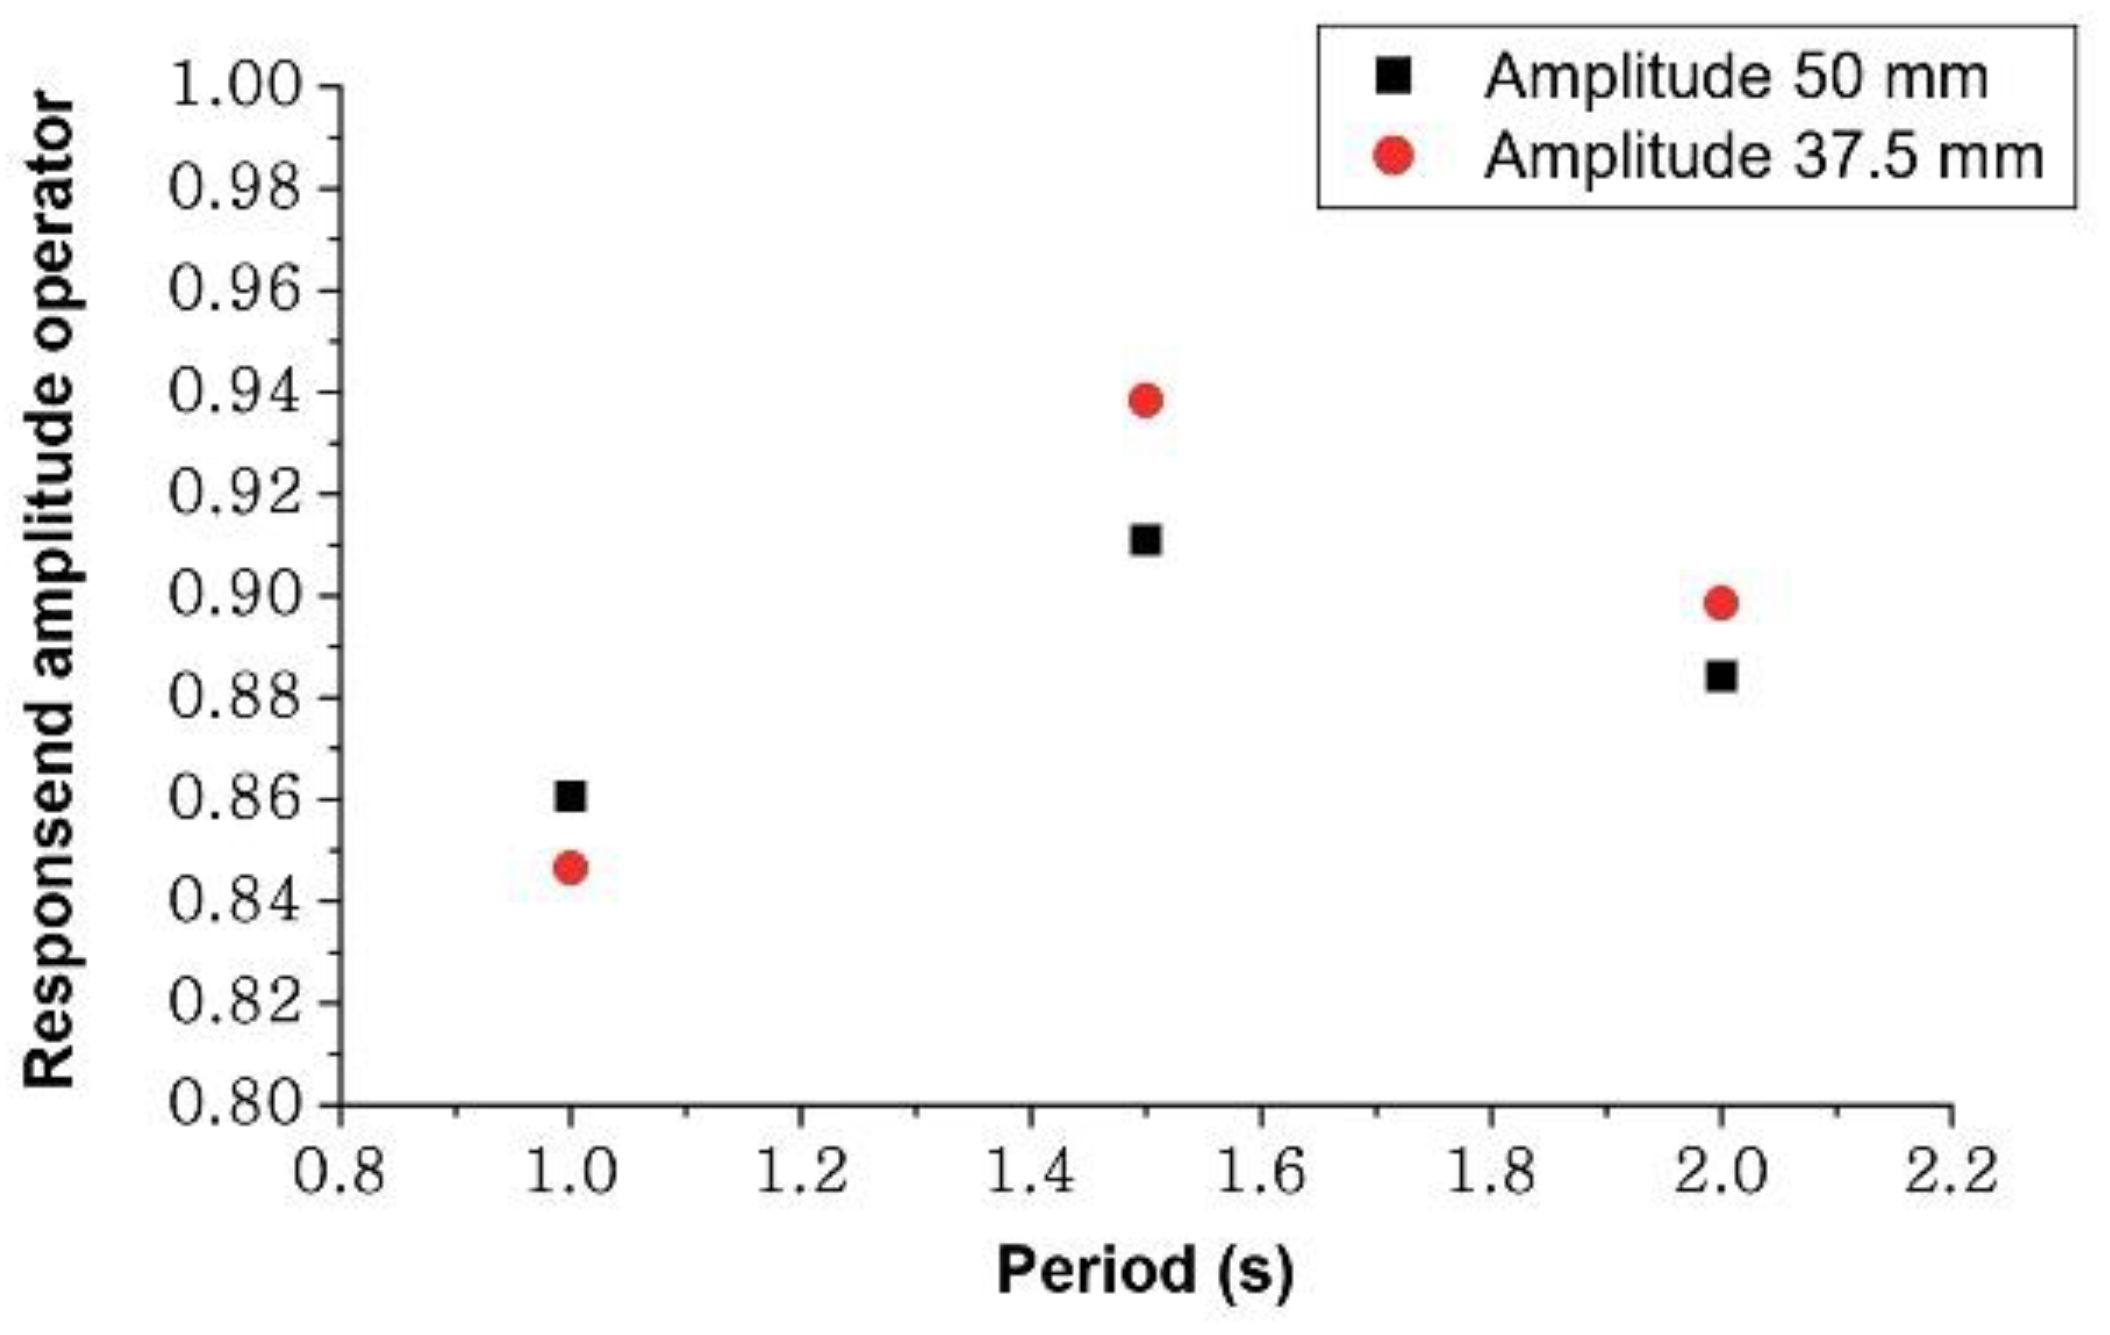
4.2. The Dynamic Characteristics of the PDPWEH

In this work, the experiment was performed in the wave flume at THI, NCKU, and the performance of the developed PDPWEH was tested in this experiment. The wave generator produced the regular waves. Figure 12 showed the results of the measured waves and buoy displacement obtained from image analysis for each case. The amplitudes of the measured waves were 48.8 ± 0.672 mm, 37.8 ± 0.605 mm, 48.3 ± 0.892 mm, 34.7 ± 0.509 mm, 47.5 ± 0.806 mm, and 34.5 ± 0.856 mm, respectively. The amplitudes of the buoy displacement were 42 ± 1.544 mm, 32 ± 1.637 mm, 44 ± 0.394 mm, 32 ± 1.152 mm, 42 ± 0.515 mm, and 31 ± 1.778 mm, respectively. The response amplitude operators (RAOs) were calculated as approximately 0.84 to 0.94 (Figure 13). This means that the buoy can absorb wave energy efficiently. The motion of the buoy improves the efficiency of power generation.

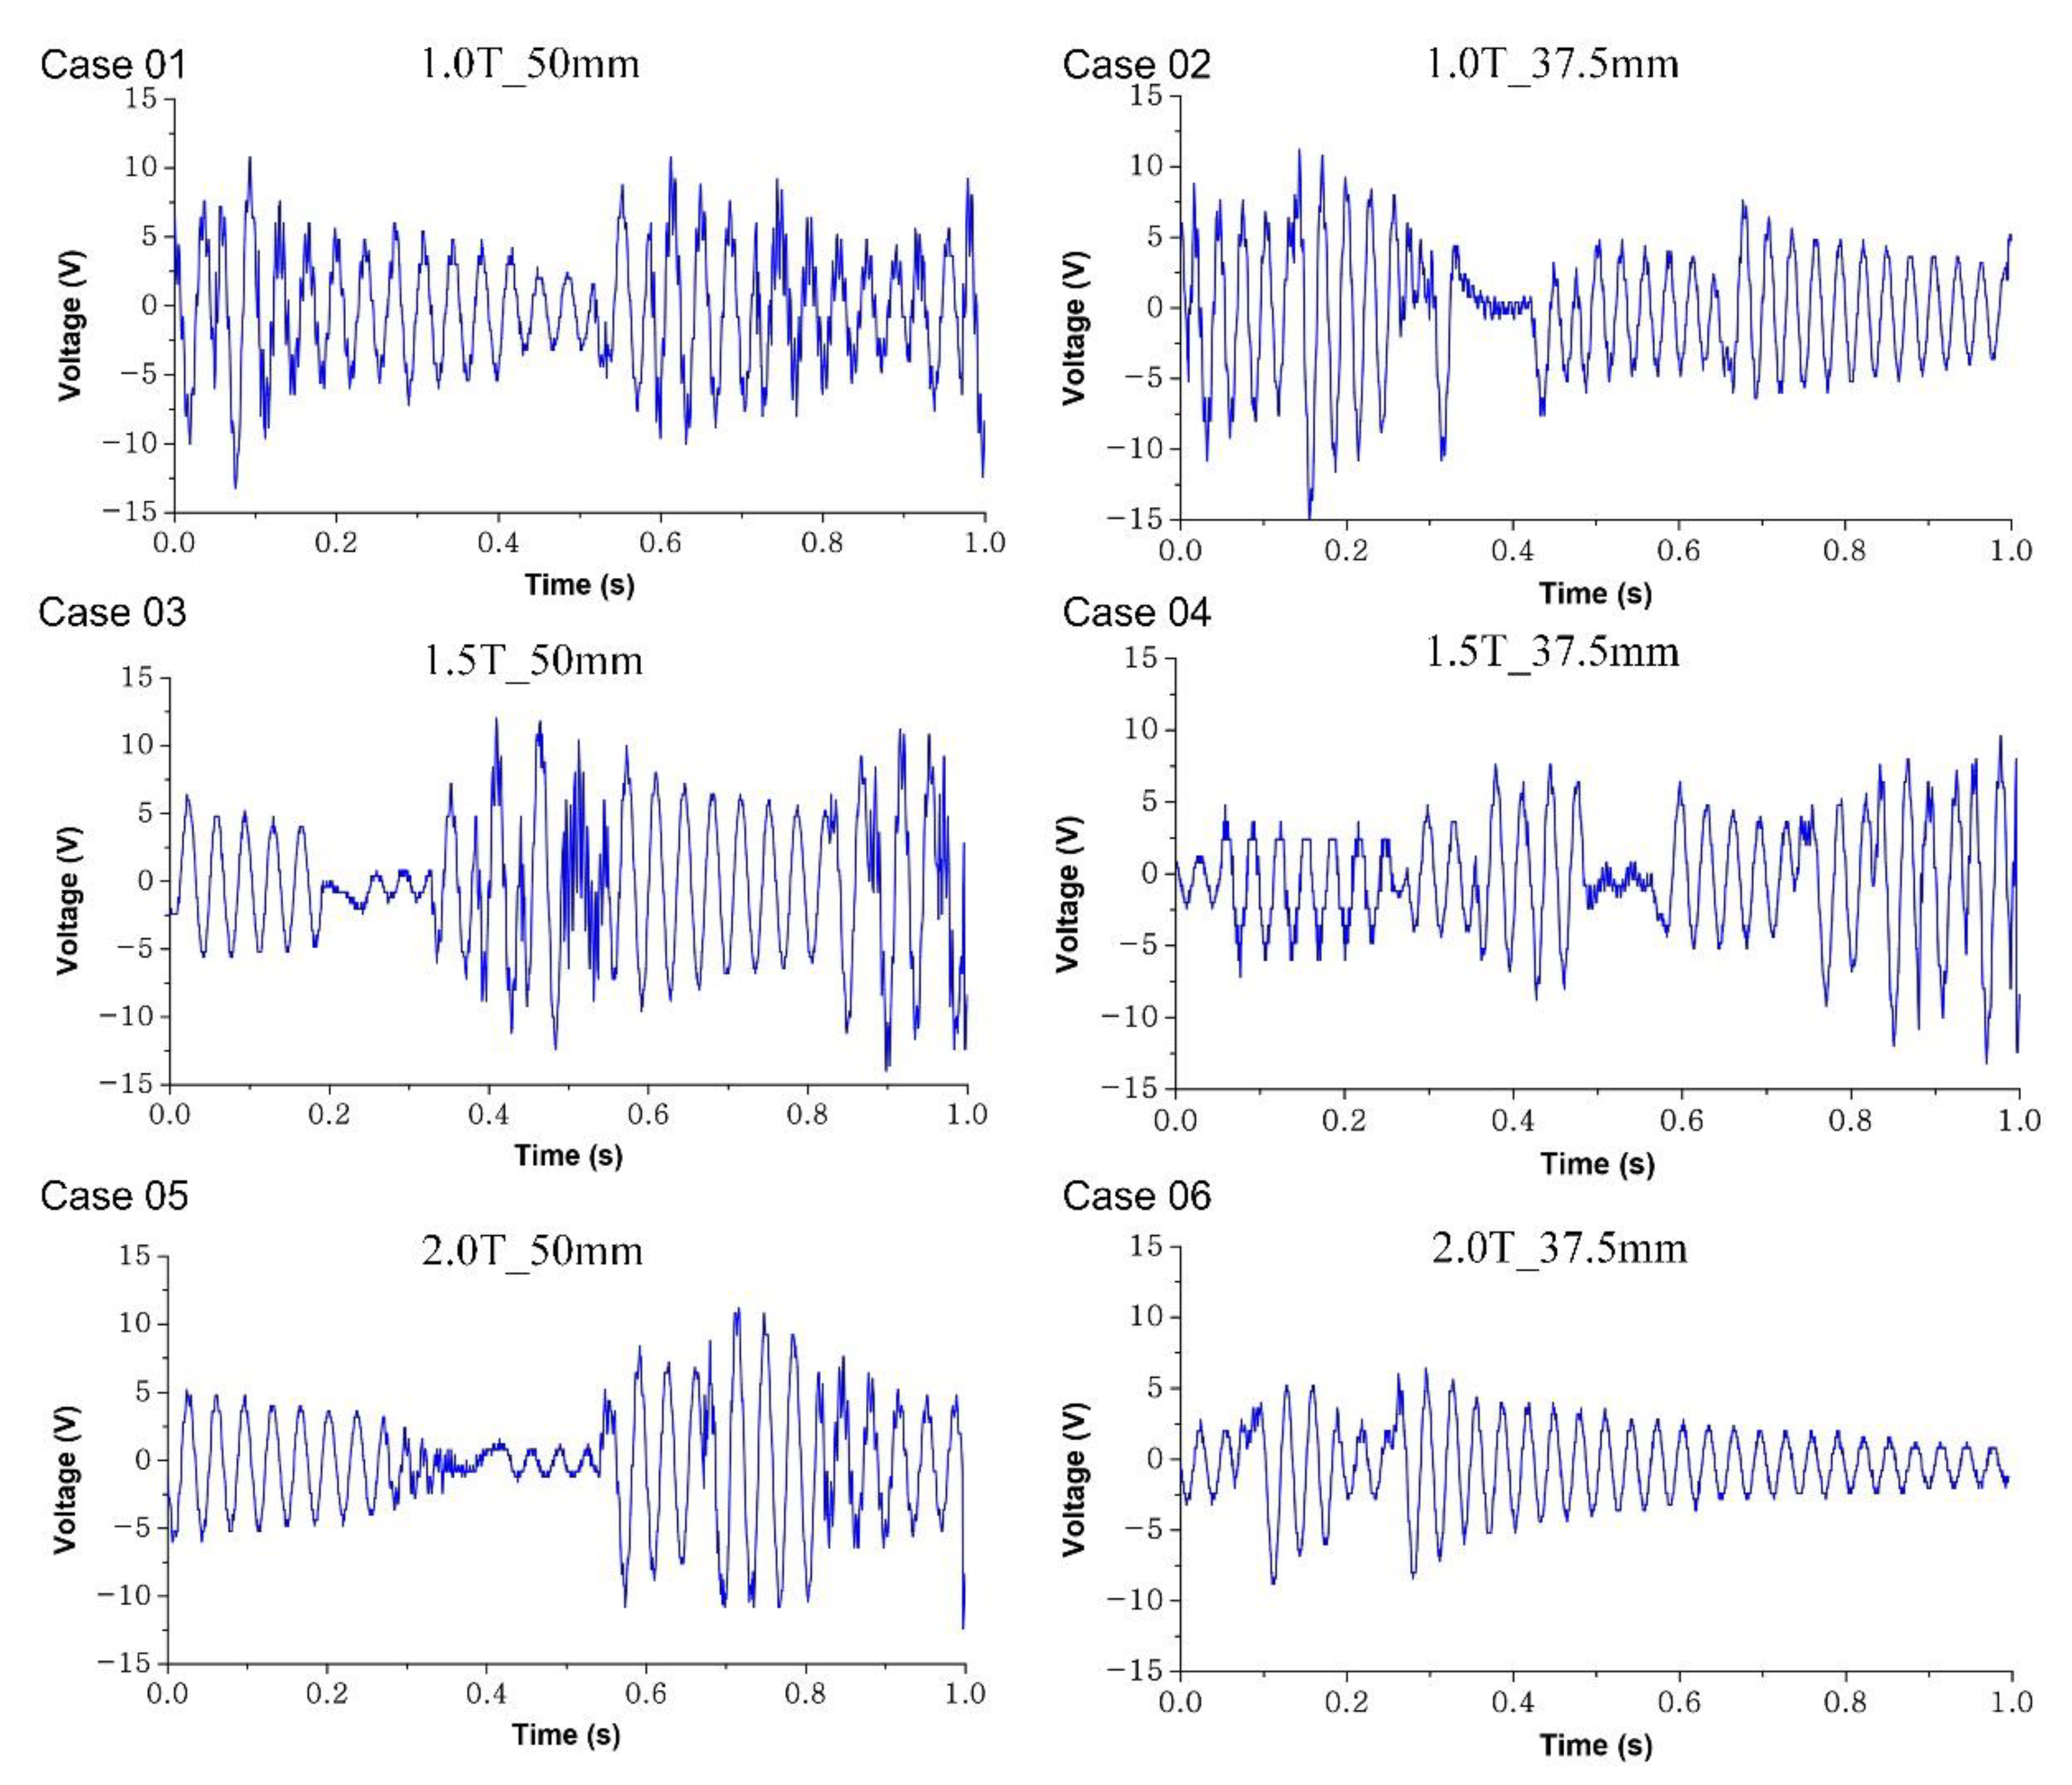
4.3. Electrical Performance of the PDPWEH

In this study, the voltage output of the developed PDPWEH was measured using an oscilloscope. The results of the output voltages of the open circuit for cases 1–6 were shown in Figure 14. The maximum voltages were 12.4 V, 11.2 V, 11.8 V, 9.6 V, 10.5 V, and 8.4 V for cases 1–6, respectively, which were listed in Table 3. The RMS voltages of the open circuit for each case were calculated and arranged in Table 3, which were 5.01, 4.18, 4.84, 3.8, 4.04, and 2.62 V, respectively. The average power of the open circuit for each case was listed in Table 3, calculated with an external resistance of 200 Ω, which were 125.5, 87.4, 117.1, 72.2, 81.6, and 34.3 μw, respectively. A full-wave diode–bridge rectifier (FDR) connected with a parallel RC shunt filter was used to produce a steady DC. The circuit was wired with a parallel 200 kΩ resistive load and a 3.3 nF capacitor. The RMS voltages and average power for each case were determined using the FDR filter circuit, which was shown in Table 3. The RMS voltages with FDR filter circuit for each case were 0.91 V, 0.74 V, 0.89 V, 0.63 V, 0.59 V, and 0.46 V, respectively, and the average power with FDR filter circuit for each case was 4.14, 2.7, 3.96, 1.97, 1.76, and 1.07 μw, respectively. The average output power for PDPWEH are 125.5, 87.4, 117.1 and 72.2 μw for case 01, case 02, case 03 and case 04. The average output power for PWEC [29] are 1.37, 0.71, 0.8 and 0.52 μw for case 01, case 02, case 03 and case 04. The average powers of PDPWEH are much larger than the average powers of PWEC under the same wave conditions.
The results showed that the developed PDPWEH in this study can generate electrical energy while being excited by a wave. Because the wave condition in case 1 would provide the largest wave energy, the maximum electrical voltage was measured. Compared with the previous study, the RMS voltage with an open circuit was significantly improved, and it was 6 times greater than the previous study in case 1. In the future, the DC filtered by the full-wave diode–bridge rectifier and parallel RC shunt filter will be used as a general energy storage device.

5. Conclusions

In this study, the PDPWEH consisted of a spherical buoy, a gear train frequency up-conversion mechanism, and an array of piezoelectric cantilever beams was developed. The spherical buoy absorbed wave energy and converted it into mechanical energy to drive the gear train frequency up-conversion mechanism. The geared-cam plucked the piezoelectric cantilever beams, which can convert the mechanical vibration energy into electrical energy. The sol-gel method was used to create the piezoelectric composite beam. The mathematical model presented here based on Euler–Bernoulli beam theory is used to analyze the dynamics of the gear train and the vibration of the piezoelectric beam. The developed PPWEH was tested in the wave flume at THL, NCKU.
The PDPWEH was tested in a wave flume with two target wave heights (100 and 75 mm) and three periods (1, 1.5, and 2.0 s). The measured wave amplitudes were 48.8 ± 0.672 mm, 37.8 ± 0.605 mm, 48.3 ± 0.892 mm, 34.7 ± 0.509 mm, 47.5 ± 0.806 mm, and 34.5 ± 0.856 mm for case 1, case 2, case 3, case 4, case 5, and case 6, respectively. The amplitudes of buoy displacement were 42 ± 1.544 mm, 32 ± 1.637 mm, 44 ± 0.394 mm, 32 ± 1.152 mm, 42 ± 0.515 mm, and 31 ± 1.778 mm for case 1, case 2, case 3, case 5, and case 6, respectively. The output voltages of the developed PDPWEH for case 1, case 2, case 3, case 4, case 5, and case were measured using an oscilloscope. The maximum voltages of the open circuit were 12.4, 11.2, 11.8, 9.6, 10.5, and 8.4 V for case 1, case 2, case 3, case 5, and case 6, respectively. The RMS voltages of the open circuit were calculated, which were 5.01, 4.18, 4.84, 3.8, 4.04, and 2.62 V for case 1, case 2, case 3, case 5, and case 6, respectively. The average powers of the open circuit were calculated with an external resistance of 200 Ω, which were 125.5, 87.4, 117.1, 72.2, 81.6, and 34.3 μw for case 1, case 2, case 3, case 5, and case 6, respectively. The wave condition of case 1 provides larger wave energy to generate the largest RMS voltage 5.01 V and average electric power of 125.5 μW. The FDR connected with a parallel RC shunt filter was used to produce a steady DC. The RMS voltages with the FDR filter circuit for each case were 0.91, 0.74, 0.89, 0.63, 0.59, and 0.46 V, respectively, and the average power with FDR filter circuit for each case was 4.14, 2.75, 3.96, 1.97, 1.76, and 1.07 μw, respectively. Compared with our previous study, the piezoelectric composite beams in PDPWEH were plucking-driven by a geared-cam mechanism with compact components and lighter mass than the geared-linkage mechanism in PWEC, which offers a lower energy loss and a higher driving force to achieve higher energy output. The average power was significantly increased from 1.37 to 125.5 μw. These results confirm that the developed PDPWEH can function well and generate electrical power.

Author Contributions

Conceptualization, R.-Y.Y. and C.-C.W.; methodology, S.-E.C., R.-Y.Y. and Z.-H.Q.; software, S.-E.C.; validation, S.-E.C. and C.-C.W.; formal analysis, S.-E.C., Z.-H.Q. and C.-C.W.; investigation, S.-E.C. and Z.-H.Q.; resources, R.-Y.Y. and C.-C.W.; data curation, S.-E.C. and Z.-H.Q.; writing—original draft preparation, S.-E.C. and C.-C.W.; writing—review and editing, S.-E.C. and C.-C.W.; project administration, R.-Y.Y. and C.-C.W.; funding acquisition, R.-Y.Y. and C.-C.W. All authors have read and agreed to the published version of the manuscript.

Funding

This research was funded by the Ministry of Science and Technology (MOST) of Taiwan grants numbers MOST 107-2221-E-005-054 and 108-2221-E-005-057. This research was also financially supported by the “Innovation and Development Center of Sustainable Agriculture” from The Featured Areas Research Center Program within the framework of the Higher Education Sprout Project by the Ministry of Education (MOE) in Taiwan.

Institutional Review Board Statement

Not applicable.

Informed Consent Statement

Not applicable.

Data Availability Statement

Not applicable.

Acknowledgments

We thank the MOST and MOE in Taiwan for funding this project.

Conflicts of Interest

The authors declare no conflict of interest.

References

  1. Khan, N.; Kalair, A.; Abas, N.; Haider, A. Review of ocean tidal, wave and thermal energy technologies. Renew. Sustain. Energy Rev. 2017, 72, 590–604. [Google Scholar] [CrossRef]
  2. Drew, B.; Plummer, A.R.; Sahinkaya, M.N. A review of wave energy converter technology. Proc. Inst. Mech. Eng. Part A J. Power Energy 2016, 223, 887–902. [Google Scholar] [CrossRef] [Green Version]
  3. Farrok, O.; Ahmed, K.; Tahlil, A.D.; Farah, M.M.; Kiran, M.R.; Islam, M.R. Electrical Power Generation from the Oceanic Wave for Sustainable Advancement in Renewable Energy Technologies. Sustainability 2020, 12, 2178. [Google Scholar] [CrossRef] [Green Version]
  4. Rahman, A.; Farrok, O.; Islam, M.R.; Xu, W. Recent Progress in Electrical Generators for Oceanic Wave Energy Conversion. IEEE Access 2020, 8, 138595–138615. [Google Scholar] [CrossRef]
  5. Huang, L.; Hu, M.; Yu, H.; Liu, C.; Chen, Z. Design and experiment of a direct-drive wave energy converter using outer-PM linear tubular generator. IET Renew. Power Gener. 2017, 11, 353–360. [Google Scholar] [CrossRef]
  6. Trapanese, M.; Curto, D.; Franzitta, V.; Liu, Z.; McNabb, L.; Wang, X. A Planar Generator for a Wave Energy Converter. IEEE Trans. Magn. 2019, 55, 1–7. [Google Scholar] [CrossRef] [Green Version]
  7. Mutsuda, H.; Tanaka, Y.; Patel, R.; Doi, Y.; Moriyama, Y.; Umino, Y. A painting type of flexible piezoelectric device for ocean energy harvesting. Appl. Ocean Res. 2017, 68, 182–193. [Google Scholar] [CrossRef]
  8. Yang, Z.; Zhou, S.; Zu, J.; Inman, D. High-Performance Piezoelectric Energy Harvesters and Their Applications. Joule 2018, 2, 642–697. [Google Scholar] [CrossRef] [Green Version]
  9. Elahi, H.; Eugeni, M.; Gaudenzi, P. A Review on Mechanisms for Piezoelectric-Based Energy Harvesters. Energies 2018, 11, 1850. [Google Scholar] [CrossRef] [Green Version]
  10. Tian, W.; Ling, Z.; Yu, W.; Shi, J. A Review of MEMS Scale Piezoelectric Energy Harvester. Appl. Sci. 2018, 8, 645. [Google Scholar] [CrossRef] [Green Version]
  11. Ali, F.; Raza, W.; Li, X.; Gul, H.; Kim, K.-H. Piezoelectric energy harvesters for biomedical applications. Nano Energy 2019, 57, 879–902. [Google Scholar] [CrossRef]
  12. Kiran, M.R.; Farrok, O.; Mamun, A.A.; Islam, R.; Xu, W. Progress in Piezoelectric Material Based Oceanic Wave Energy Conversion Technology. IEEE Access 2020, 8, 146428–146449. [Google Scholar] [CrossRef]
  13. Nabavi, S.F.; Farshidianfar, A.; Afsharfard, A.; Khodaparast, H.H. An ocean wave-based piezoelectric energy harvesting system using breaking wave force. Int. J. Mech. Sci. 2018, 151, 498–507. [Google Scholar] [CrossRef] [Green Version]
  14. Taylor, G.; Burns, J.; Kammann, S.; Powers, W.; Welsh, T. The Energy Harvesting Eel: A small subsurface ocean/river power generator. IEEE J. Ocean. Eng. 2001, 26, 539–547. [Google Scholar] [CrossRef] [Green Version]
  15. Xie, X.; Wang, Q.; Wu, N. Energy harvesting from transverse ocean waves by a piezoelectric plate. Int. J. Eng. Sci. 2014, 81, 41–48. [Google Scholar] [CrossRef]
  16. Viñolo, C.; Toma, D.; Mànuel, A.; del Rio, J. An ocean kinetic energy converter for low-power applications using piezoelectric disk elements. Eur. Phys. J. Spec. Top. 2013, 222, 1685–1698. [Google Scholar] [CrossRef]
  17. Nabavi, S.F.; Farshidianfar, A.; Afsharfard, A. Novel piezoelectric-based ocean wave energy harvesting from offshore buoys. Appl. Ocean Res. 2018, 76, 174–183. [Google Scholar] [CrossRef]
  18. Xie, X.; Wang, Q. A study on an ocean wave energy harvester made of a composite piezoelectric buoy structure. Compos. Struct. 2017, 178, 447–454. [Google Scholar] [CrossRef]
  19. Renzi, E. Hydroelectromechanical modelling of a piezoelectric wave energy converter. Proc. R. Soc. A Math. Phys. Eng. Sci. 2016, 472, 20160715. [Google Scholar] [CrossRef] [Green Version]
  20. Patel, R.; Tanaka, Y.; McWilliam, S.; Mutsuda, H.; Popov, A. Model refinements and experimental testing of highly flexible piezoelectric energy harvesters. J. Sound Vib. 2016, 368, 87–102. [Google Scholar] [CrossRef]
  21. Mutsuda, H.; Tanaka, Y.; Patel, R.; Doi, Y. Harvesting flow-induced vibration using a highly flexible piezoelectric energy device. Appl. Ocean Res. 2017, 68, 39–52. [Google Scholar] [CrossRef]
  22. Viet, N.; Xie, X.; Liew, K.M.; Banthia, N.; Wang, Q. Energy harvesting from ocean waves by a floating energy harvester. Energy 2016, 112, 1219–1226. [Google Scholar] [CrossRef]
  23. Lin, Z.; Zhang, Y. Dynamics of a mechanical frequency up-converted device for wave energy harvesting. J. Sound Vib. 2016, 367, 170–184. [Google Scholar] [CrossRef]
  24. Pozzi, M.; Zhu, M. Plucked piezoelectric bimorphs for knee-joint energy harvesting: Modelling and experimental validation. Smart Mater. Struct. 2011, 20, 055007. [Google Scholar] [CrossRef] [Green Version]
  25. Fu, X.; Liao, W.-H. Modeling and Analysis of Piezoelectric Energy Harvesting With Dynamic Plucking Mechanism. J. Vib. Acoust. 2019, 141, 031002. [Google Scholar] [CrossRef]
  26. Fang, S.; Fu, X.; Du, X.; Liao, W.-H. A music-box-like extended rotational plucking energy harvester with multiple piezoelectric cantilevers. Appl. Phys. Lett. 2019, 114, 233902. [Google Scholar] [CrossRef]
  27. Priya, S. Modeling of electric energy harvesting using piezoelectric windmill. Appl. Phys. Lett. 2005, 87, 184101. [Google Scholar] [CrossRef]
  28. Erturk, A.; Inman, D.J. A Distributed Parameter Electromechanical Model for Cantilevered Piezoelectric Energy Harvesters. J. Vib. Acoust. 2008, 130, 041002. [Google Scholar] [CrossRef]
  29. Chen, S.-E.; Yang, R.-Y.; Wu, G.-K.; Wu, C.-C. A Piezoelectric Wave-Energy Converter Equipped with a Geared-Linkage-Based Frequency Up-Conversion Mechanism. Sensors 2020, 21, 204. [Google Scholar] [CrossRef]
  30. Erturk, A.; Inman, D.J. On Mechanical Modeling of Cantilevered Piezoelectric Vibration Energy Harvesters. J. Intell. Mater. Syst. Struct. 2008, 19, 1311–1325. [Google Scholar] [CrossRef]
Figure 1. Schematic diagrams of Piezoelectric Wave Energy Harvester. (a) Plucking-driven Piezoelectric Wave Energy Harvester. (b) Gear train frequency up-conversion mechanism and an array of piezoelectric cantilever beams.
Energies 14 08441 g001
Figure 2. The piezoelectric composite cantilever beam. (a) Dimension diagram. (b) The material of each layer.
Energies 14 08441 g002
Figure 3. Schematic diagrams of the electromechanical model of the piezoelectric composite cantilever beam.
Energies 14 08441 g003
Figure 4. The schematic of the output electrical circuit model.
Energies 14 08441 g004
Figure 5. The cross-section of the piezoelectric composite cantilever beam.
Energies 14 08441 g005
Figure 6. The analytic result for the thickness of the PZT layer vs. frequency.
Energies 14 08441 g006
Figure 7. The analytic result for the thickness of the PZT layer vs. output voltage in an open circuit.
Energies 14 08441 g007
Figure 8. The simulation result for the thickness of the PZT layer vs. maximum stress.
Energies 14 08441 g008
Figure 9. Experimental setup of the PDPWEH in the wave flume.
Energies 14 08441 g009
Figure 10. Image of the experimental devices. (a) Wave generator (b) capacitive wave height meter (c) PDPWEH.
Energies 14 08441 g010
Figure 11. The result of the piezoelectric composite film. (a) The piezoelectric composite beam; (b) The morphology of the PZT film; (c) The SEM image of the cross-section; (d) the Capacitance test.
Energies 14 08441 g011
Figure 12. Wave height and the buoy displacement.
Energies 14 08441 g012
Figure 13. The response amplitude operator (RAO) of the buoy.
Energies 14 08441 g013
Figure 14. Measured open circuit output voltage of the PDPWEH in each case.
Energies 14 08441 g014
Table 1. The material properties of the PZT layer and the silicon substrate.
Design ParameterSymbolValue (Unit)
The density of PZT layerρp7800 kg/m3
The Young’s module of PZT layerYp67 GPa
The piezoelectric constantd31−30 × 10−12 m/V
The permittivity constant at 1 kHzε1.53 × 10⁻⁸
The density of silicon substrateρs2300 kg/m3
The Young’s module of PZT layerYs179 GPa
Table 2. Wave-period and wave-height-parameter generated by the wave machine.
Wave Height (mm)10075
Period (1 sec)Case 01Case 02
Period (1.5 sec)Case 03Case 04
Period (2.0 sec)Case 05Case 06
Table 3. Electrical output in each case.
Case 01Case 02Case 03Case 04Case 05Case 06
Maximum voltage of open circuit (V)12.411.211.89.610.58.4
RMS voltage of open circuit (V)5.014.184.843.84.042.62
Average power of open circuit (μw)125.587.4117.172.281.634.3
RMS voltage with FDR filter circuit (V)0.910.740.890.630.590.46
Average power with FDR filter circuit (μw)4.142.753.961.971.761.07
Publisher’s Note: MDPI stays neutral with regard to jurisdictional claims in published maps and institutional affiliations.

