1. Introduction
A lane-change manoeuvre is part of a day-to-day commute. However, if the manoeuvre is part of a crash scenario (either in the form of crash avoidance or if the crash happened during or before the manoeuvre execution), it is necessary to determine when and where the manoeuvre began to place it in the crash scenario timeline.
Although the pre-crash analysis could be done using EDR data currently, older vehicle models usually do not possess these data, which can be problematic considering the average age of personal vehicles in the Czech Republic exceeds 15 years. Furthermore, vehicle manufacturers in Europe are not yet required to provide access to EDR data. Therefore, a calculation of the time needed to execute the avoidance manoeuvre by other methods is necessary.
Analysis of vehicle lateral movement during lane change, overtaking, or crash avoidance presents a problem in traffic accident reconstruction. The lane-change manoeuvre is not used as often as braking for crash avoidance [
1,
2] (the mechanism of the manoeuvre is more complex compared to braking), and there is usually less evidence left by the vehicle used to identify the vehicle’s trajectory (such as yaw or skid marks). If a vehicle crash occurs on a wet road surface, a crash investigator must consider lowered adhesion while analyzing vehicle dynamics. Lane-change alteration by vehicle’s adaptive cruise control was explored in [
3]. As for the driving conditions, weather is one of the most common factors changing road surface conditions, especially rain, lowering tyre traction (adhesion) due to wet road surface [
4].
While modern accident reconstruction methods utilize various simulation programs with integrated mathematical models, there is no guarantee that the result reflects reality. There are several unknown input parameters (delay of the steering mechanism, steering speed, driver model, and others). Therefore, using an empirical calculation based on actual manoeuvre analysis data or the simulation basis seems to be a prudent approach.
1.1. Current Calculation Methods
Many current calculation methods use simplified calculation models based on Newton’s laws of motion or empirical models based on experimental measurements (driving tests). For lane-change manoeuvre, simple equations analyzing the motion of the material point can be used. These methods are described, e.g., in [
1,
2].
The input variables for these methods are the lateral distance, the maximum or utilized lateral adhesion (or lateral acceleration of the vehicle), and the vehicle speed. Lateral distance limits the vehicle trajectory, and lateral acceleration (or adhesion) represent and simplify vehicle (vehicle tyres) interaction with the road surface. Some variables have the same meaning across the presented formulas but differ slightly (mostly in indexes used). For unification, the variables in different formulas are defined as follows:
| ay | utilizable lateral acceleration (m/s2) |
| ay max | maximal lateral acceleration (m/s2) |
| t | manoeuvre time (duration) (s) |
| v | vehicle speed (m/s) |
| y | lateral distance (m) |
| y max | maximal lateral distance (m) |
| C | mathematical constant |
Runkel [
5] derived a model for a lane-change time based upon an assumption of constant acceleration inputs, resulting in a curve consisting of two circular arcs. A similar analysis was published by Jennings [
6]. This model, however, does not seem to apply in noncritical situations.
Sporrer et al. in their study [
7] mention that attempts were made to reflect the steering motion of a driver, which gave values of K varying from 2.51 to 2.83. Sporrer’s paper then investigated the steering manoeuvre by way of driving trials. The trials showed that the manoeuvre was only symmetrical for an abrupt lane change. The results indicated that the average acceleration would not give a realistic time for the manoeuvre for a routine lane change.
In [
8,
9,
10], almost identical Equation (2) is shown to be used for the theoretical calculation of the duration of the vehicle avoidance manoeuvre (
tsin), assuming the lateral acceleration of the vehicle is of sinusoidal shape and one-period duration.
In the case of the actual manoeuvre, the curve of the lateral acceleration does not correspond fully with one period of the sine function. Therefore, the theoretical assumption for the deduction of the Equation (2) is not met.
Practical calculation of the manoeuvre duration (
trpac) was done using the so-called Kovařík formula, described in [
1] and given as Equation (3). In this formula, the mathematical constant of 2.51 was recalculated using data from experimental testing, accommodating other influences (such as delay in the steering mechanism, tyre elasticity, and others) in the overall manoeuvre duration calculation.
A more recent form of practical calculation is the Weiss formula (Equation (4)), where K coefficient is expressed as function
K (
ay,
v,
y) using Equation (5), with an approximate value of 2.67, as shown in [
9,
11].
The manoeuvre duration expressed by the Equations (3) and (4) is always considered to last longer than the calculated theoretical value, which is (among other things) the result of delays in the steering caused by steering wheel plays and the rigidity of the steering mechanism and elasticity of tyres.
1.2. Motivation
Most of the investigated calculation methods of lane-change duration are based on experiments carried out more than ten years ago. In contrast, the newer experiments were carried out mainly on a dry road surface. Therefore, it is necessary to explore if (and how) modern vehicle construction, vehicle stability systems, and lowered adhesion conditions affect these methods and their applicability, i.e., whether it is necessary to change the approach in the manoeuvre duration calculation or whether the empirical models used currently are still viable.
1.3. Hypothesis
The duration of the lane-change manoeuvre is conditioned by its intensity, that is, the intensity of lateral acceleration and the lateral distance. Modern electronic devices allow precise measuring of parameters relevant for the analyses of lane-change manoeuvres, that is, speed, time, lateral distance, lateral acceleration, and others. In this way, with an adequate concept of experimental test track, it is possible to analyze the influence of the intensity of lateral acceleration and the lateral distance to the time necessary for obstacle avoidance by lane-change manoeuvre.
The goal of this research is also to obtain the latest and more precise experimentally gained results of lane-change manoeuvre duration convenient for theoretical clarification and description of manoeuvre, social relevance, and legal certainty impact of participants in terms of road accident analysis
2. Methodology
The main idea of this paper is to explore the applicability of current empirical Equations (1) and (2) used for the manoeuvre duration calculation, and it was necessary to obtain all the relevant variables used in the calculations (
Table 1).
For this purpose, four series of driving tests were carried out between the years 2016 and 2020 in various conditions (both dry and wet road surfaces). To repeat the experiment under the same conditions, the test track for vehicle lane-change manoeuvre was based on the procedure described in standard ISO 3888-2, Passenger cars—Test track for a severe lane-change manoeuvre, Part 2 Obstacle avoidance (or its modifications) [
12].
In all test series, the drivers were always experienced males, between 30 and 35 years old, with 10 to 15 years of driving experience. The drivers always had several practice runs before testing to become better acquainted with both the test track and the tested vehicles (thus, the influence of the driver on the driving manoeuvre was eliminated).
All relevant data of the lane-change manoeuvre were documented using GPS Data Logger V-BOX Video HD 2 and Racelogic PERFORMANCEBOX with receiver antennas placed on the roof, roughly at the center of gravity of each vehicle tested. These instruments record data at a frequency of 10 Hz, which was proven sufficient in [
13] for trajectory documentation using a similar device (Performance Box Sport).
The driver’s input was monitored using a VBOX Video HD2 camera located inside the vehicle. The vehicle position was documented using the same equipment and was observed by cameras, placed around the test track.
A wide variety of vehicles was used throughout the individual test series, ranging from the supermini vehicle class to crossover SUV (see
Table 2).
The first two test series (2016 and 2017) were carried out following standard ISO 3888-2, Passenger cars—Test track for a severe lane-change manoeuvre, Part 2 Obstacle avoidance.
The 2016 test series was carried out on a landing strip with a dry asphalt surface, with temperatures ranging from 14 to 18 °C. The 2017 test series was carried out on an area with an asphalt surface used for truck testing. During the 2017 testing, permanent rain was present, with temperatures ranging from 7 to 15 °C.
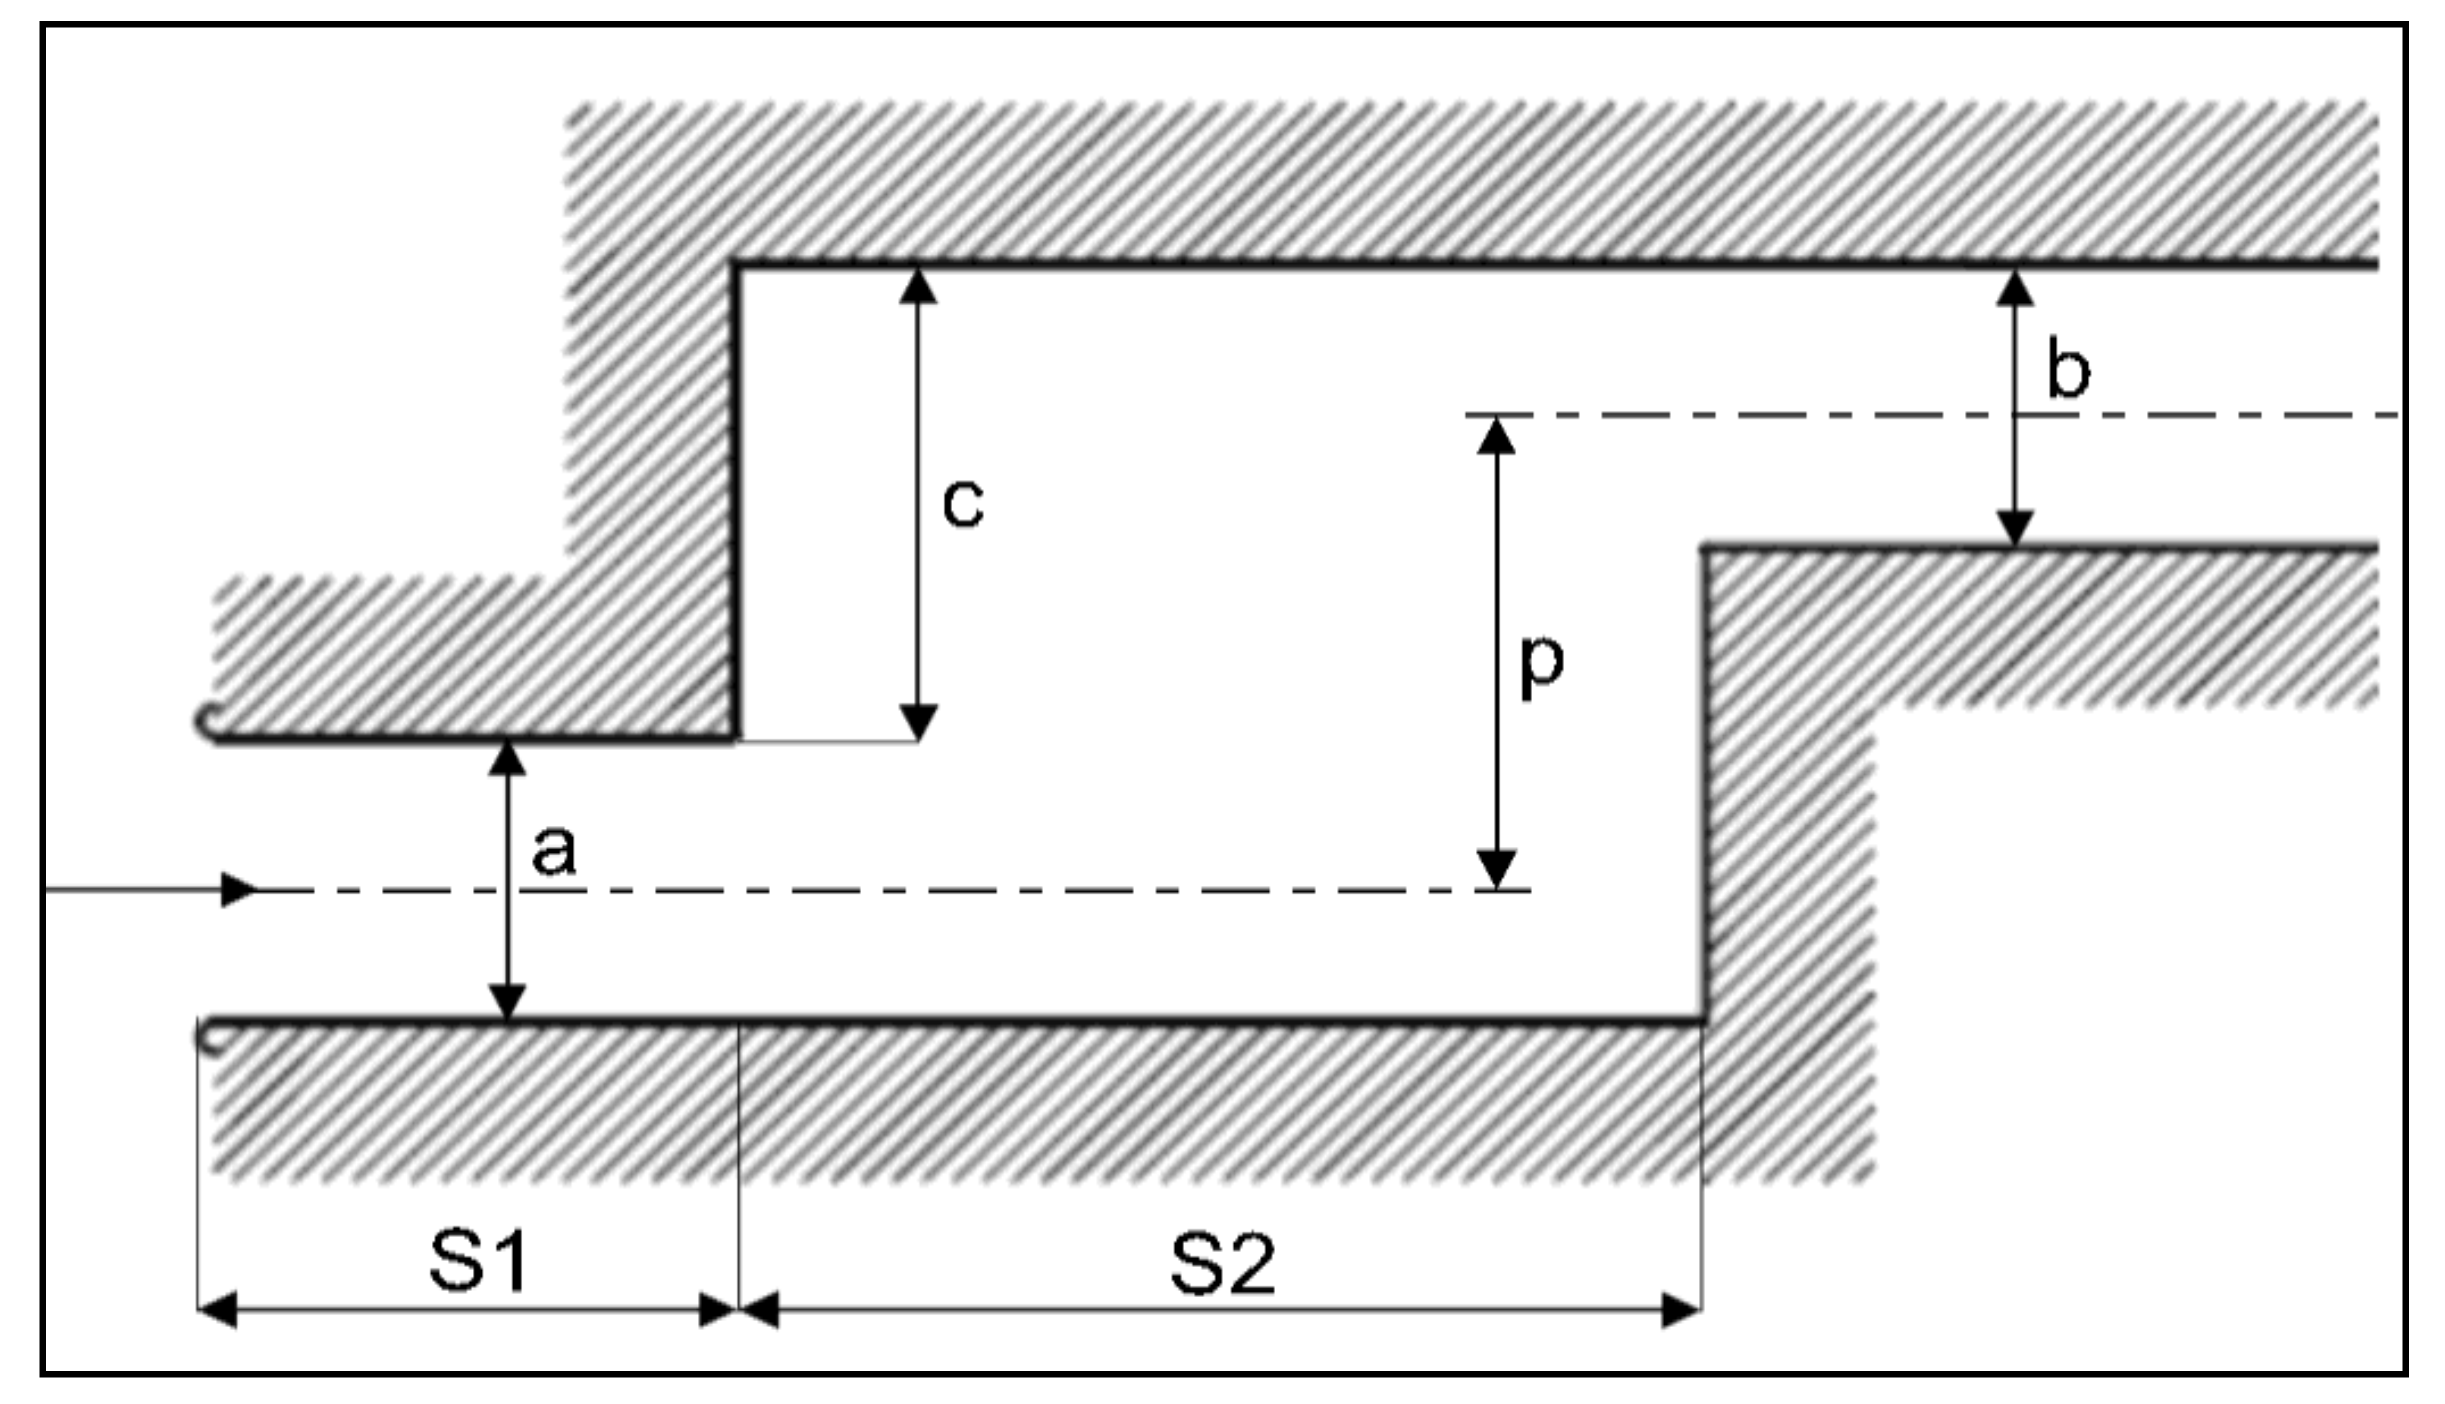
The track was modified for the next two test series (2019 and 2020) but still based on standard ISO 3888-2. The track widths (a and b) remained following the standard; the length of the track segment used for lane change (S2) was variable and shortened compared to the ISO standard to lengths of 13.5, 11.0, and 8.5 m, and the offset (p) of the exit gate to entry gate was variable as well—offsets of 1.5, 2.5, and 3.5 m were used (the diagram of a modified test track is presented in
Figure 1).
In all the test series, the goal was to achieve maximal vehicle speed without stability loss or exceeding the test track boundaries.
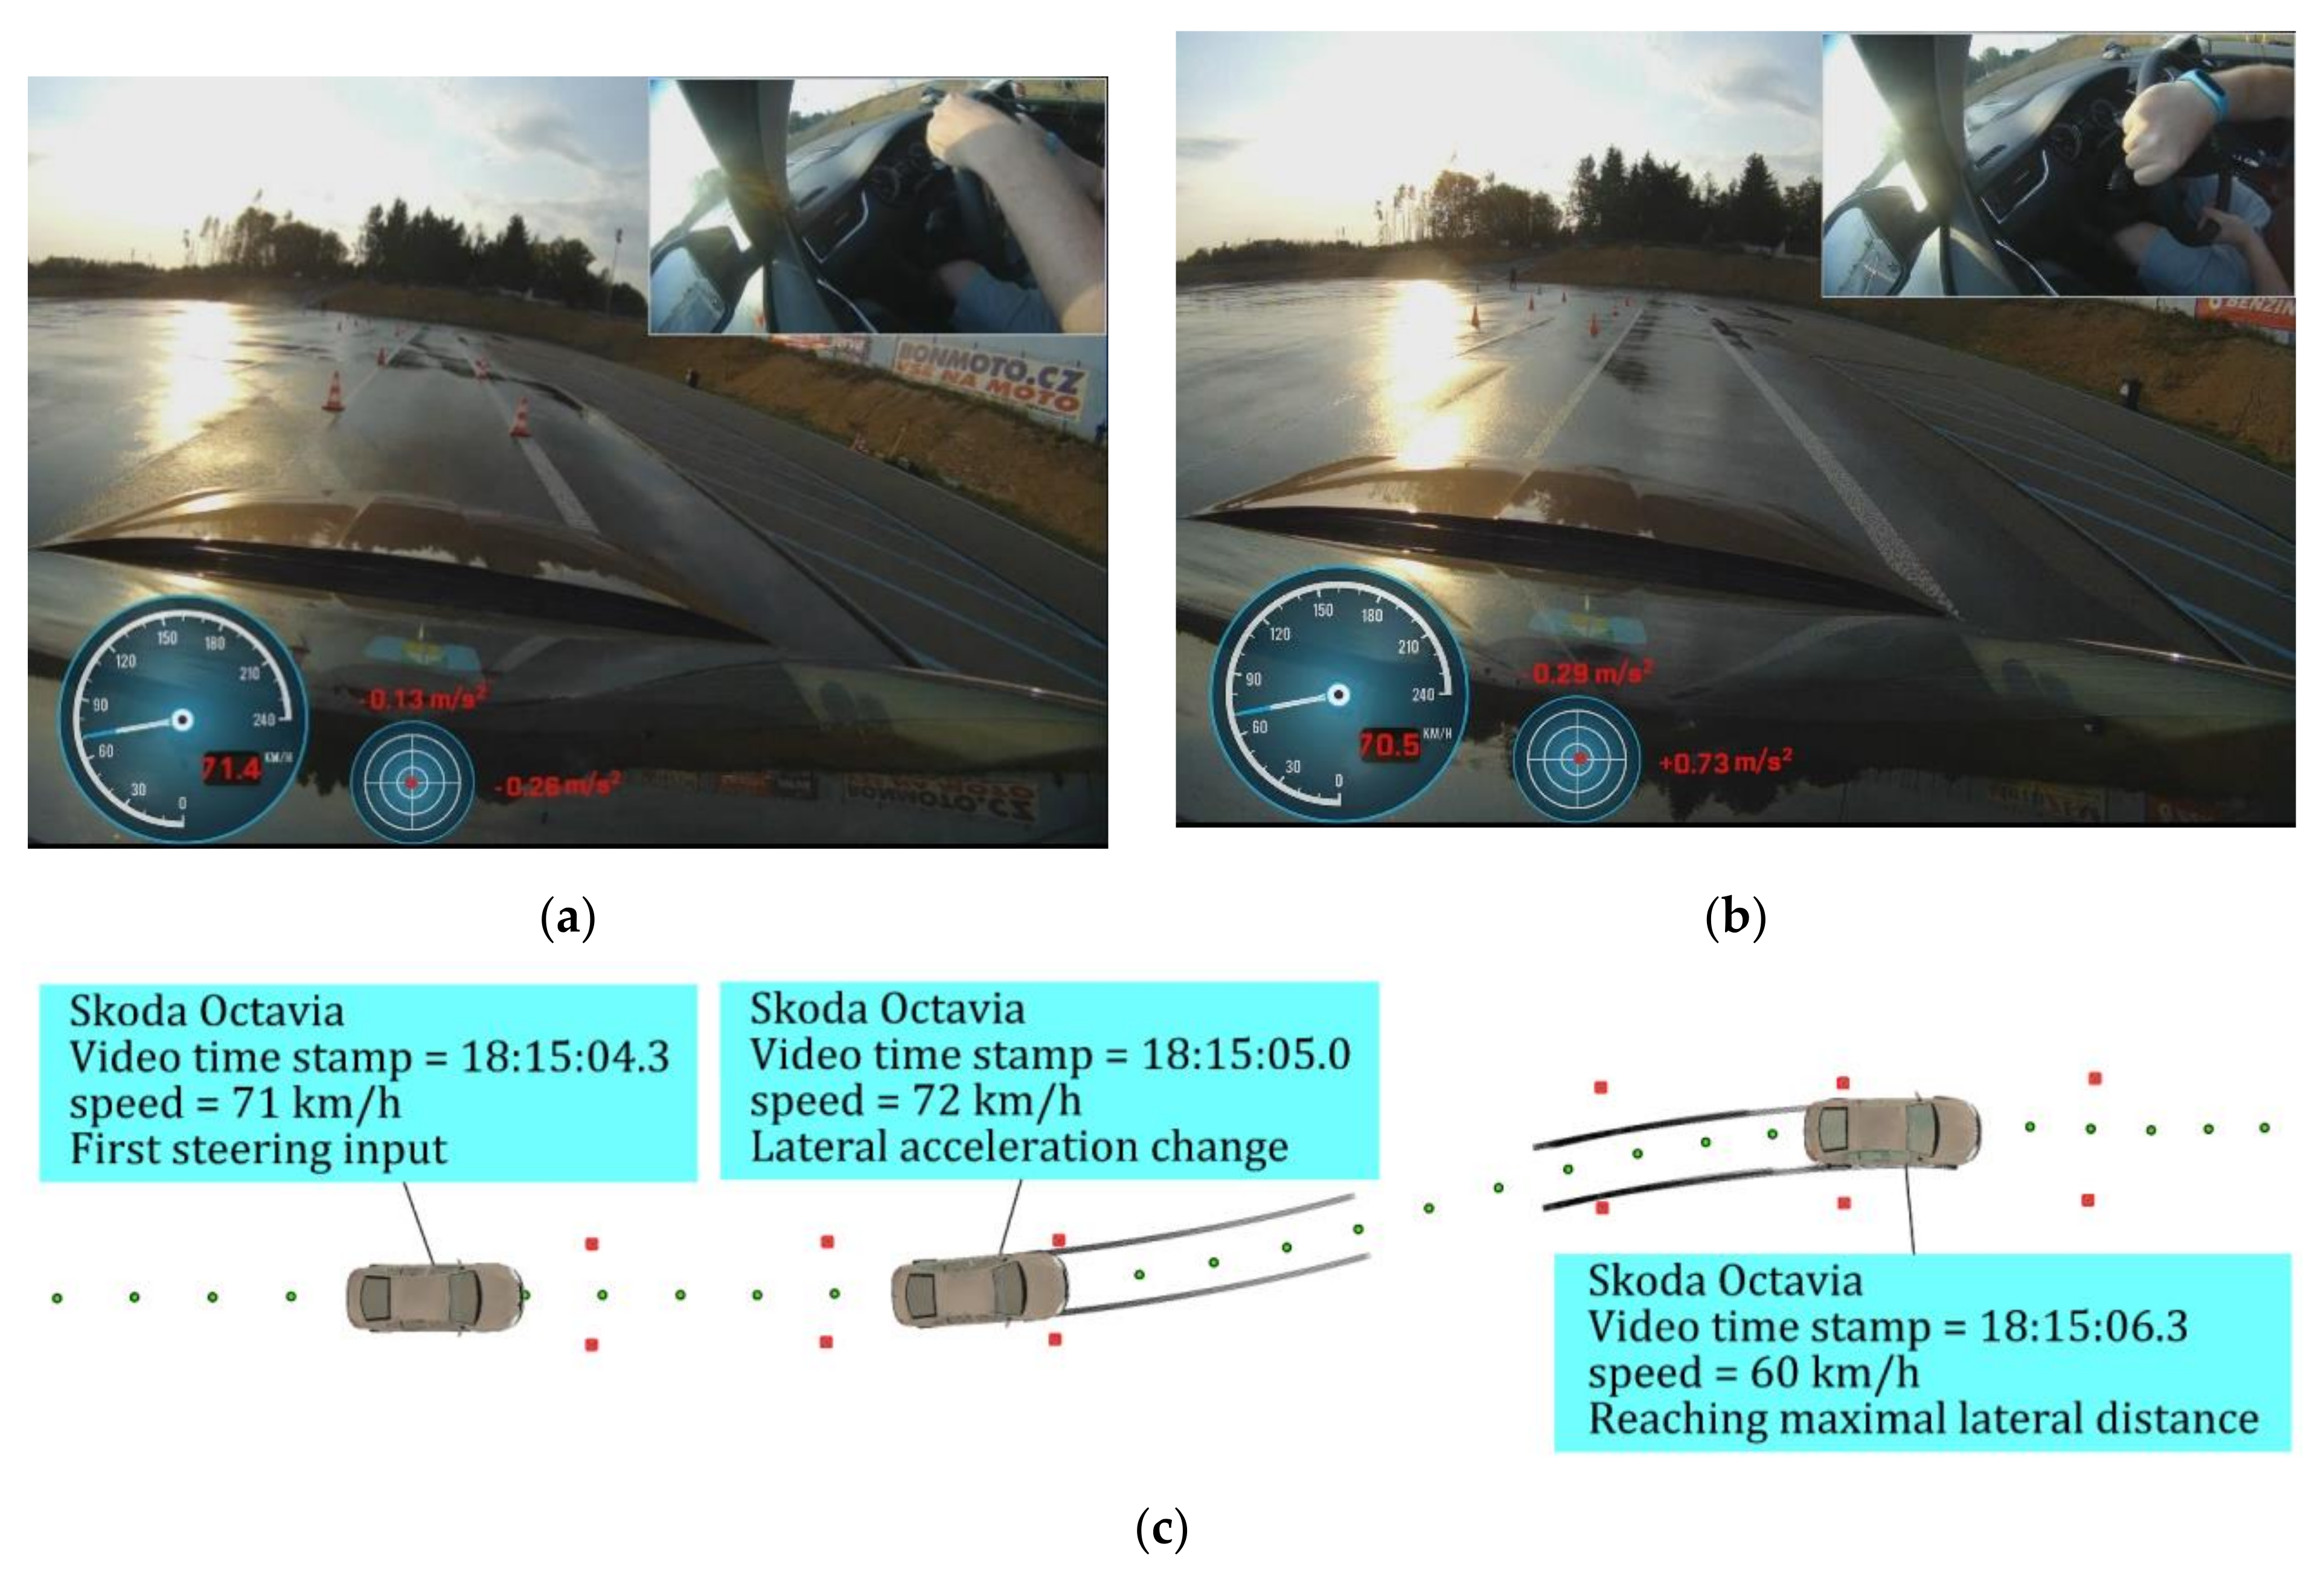
In this study, the driver’s first steering intervention is regarded as the beginning of the lane-change manoeuvre and reaching maximal lateral distance (at this point, the vehicle has avoided the obstacle and changed lane at a certain width, taking a position similar to the initial one), regarded as the end of the manoeuvre, similar to [
14] and as seen in
Figure 2.
3. Lane-Change Manoeuvre Duration Calculation
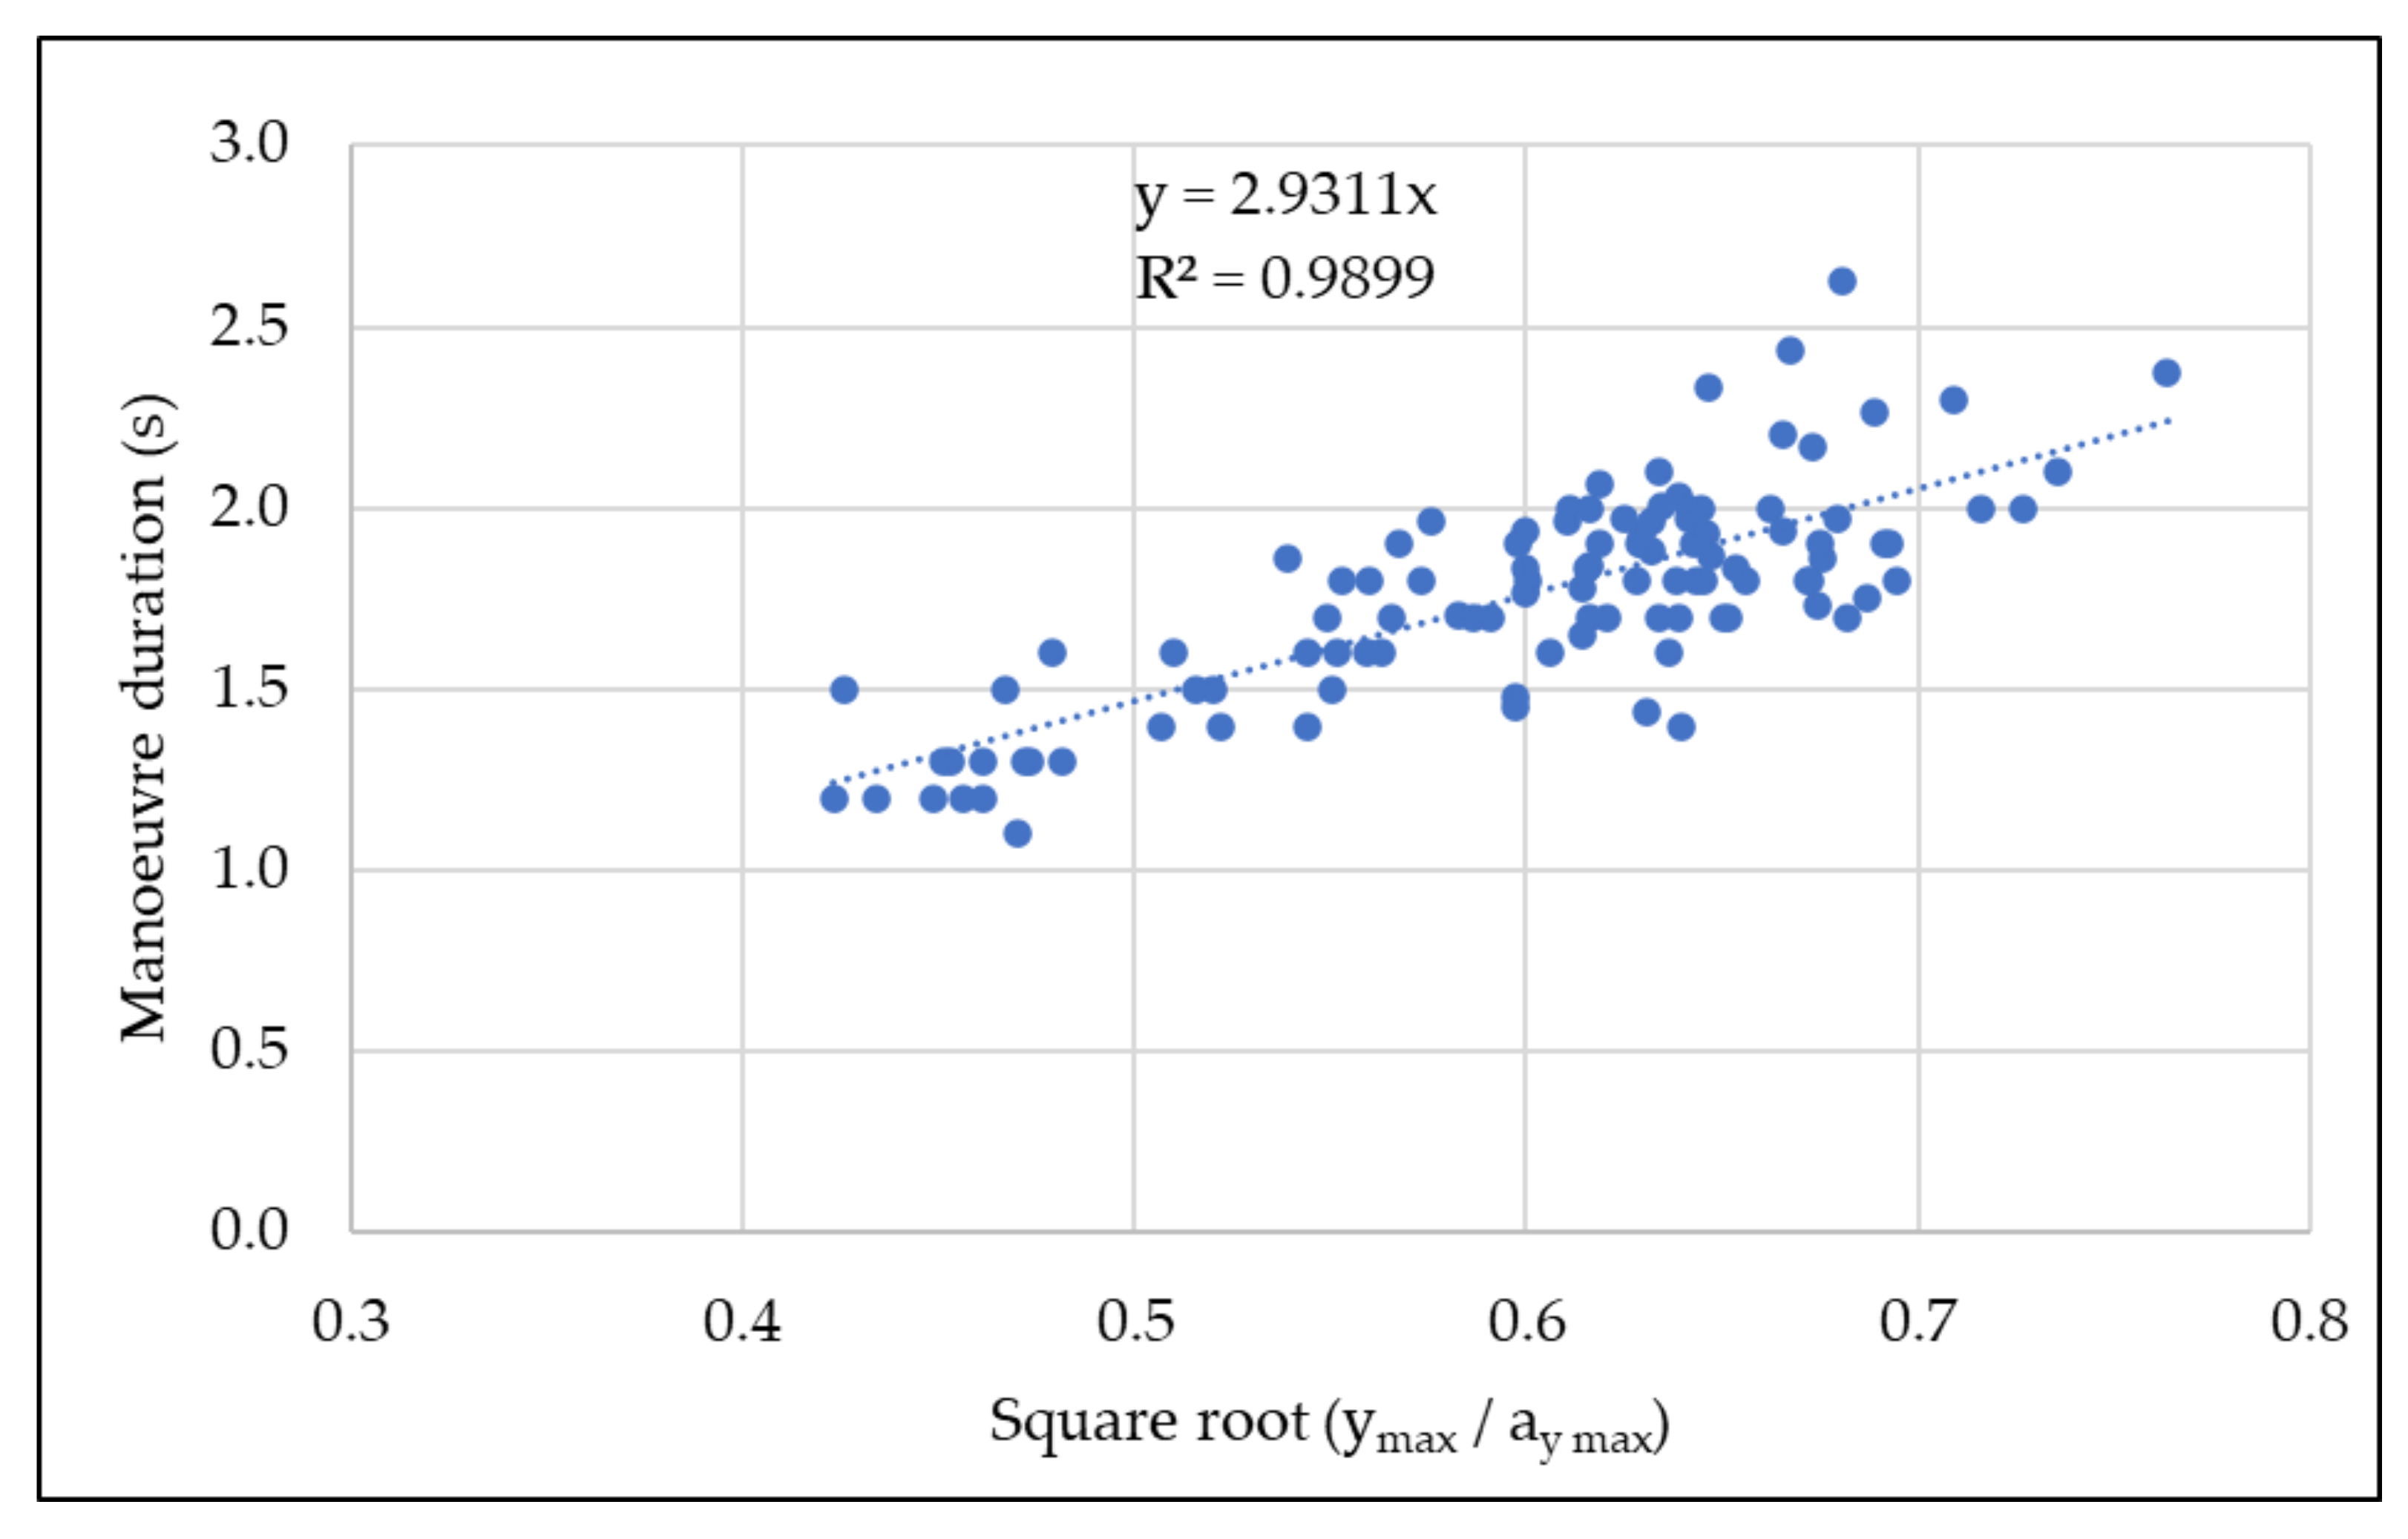
Based on the methodology chosen for the manoeuvre duration calculation, the analysis of the Kovařík and Weiss Equations (3) and (4) was carried out. Since both of these formulas were almost identical (or could be simplified into the same form), analysis of the mathematical constant C was done by using the data from 108 successfully performed manoeuvres (out of 193 manoeuvres performed in total).
A linear regression analysis was carried out. The square root value of the ratio of the maximal lateral distance y
max and the maximum lateral acceleration a
y max achieved in the individual driving manoeuvres is plotted directly on the
x-axis. The duration of the manoeuvres was again plotted on the
y-axis, see
Figure 3.
Based on 108 measurements from all test series and the linear regression (with correlation coefficient of 0.9899), the mathematical constant of the equation was adjusted with a value of 2.93.
4. Results
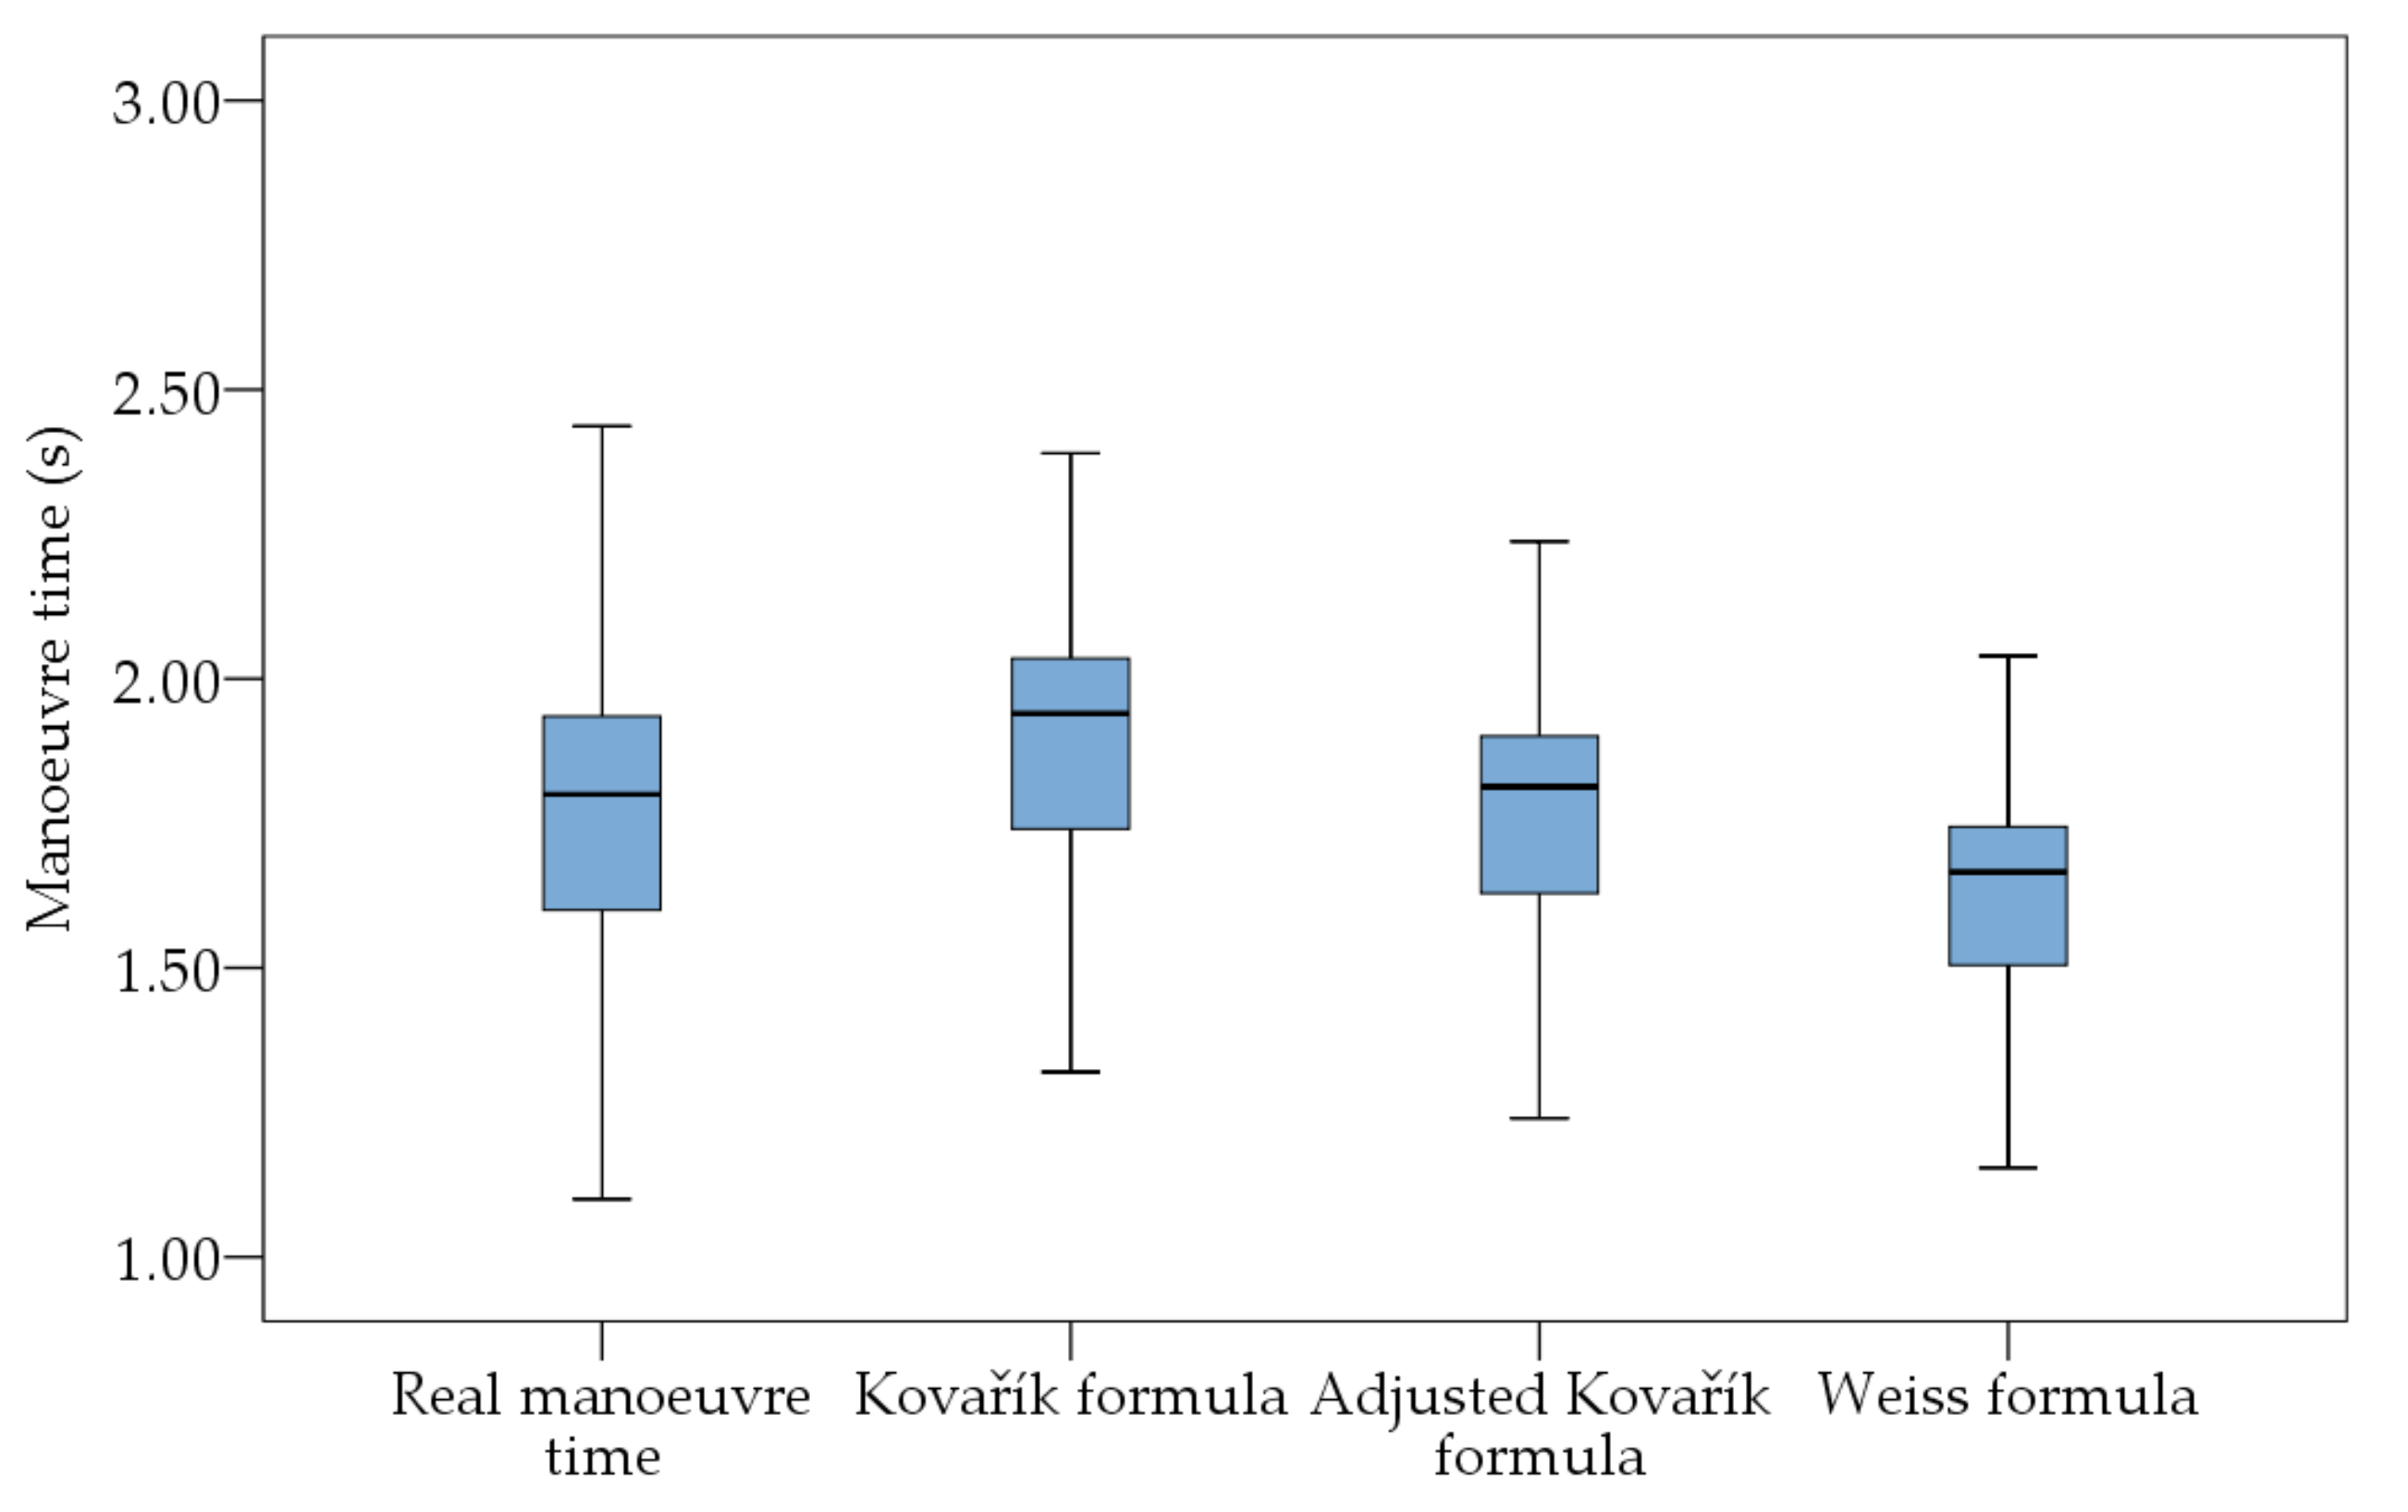
As the primary motivation of this study is to present lane-change manoeuvre duration calculation, a comparison was made between actual manoeuvre times (durations), documented during all the test series, and durations calculated based on the values of maximal lateral acceleration and lateral distance by using the original Kovařík Equation (3), the Weiss Equation (4), and the adjusted Kovařík Equation (6). An example of the calculation of manoeuvre durations using individual equations is provided in
Table 3.
The manoeuvre durations calculated using the methods presented are compared by the box diagrams shown in
Figure 4.
Using SPSS Statistics software, the Kolmogorov–Smirnov test was carried out, verifying that the data set did not have a normal distribution. The results of the test are listed in
Table 4.
As the data did not have a normal distribution, the Mann–Whitney nonparametric test was used for comparing the equations.
Table 5 and
Table 6 compare the results of actual manoeuvre durations, calculated by using Equation (6).
The result of this analysis indicated no statistically significant difference between manoeuvre duration (p-value 0.846), calculated by the adjusted Kovařík Equation (6) and actual documented times.
By using the Mann–Whitney test to compare other calculation methods with actual manoeuvre durations, it was found there was a difference between the manoeuvre durations, calculated by the original Kovařík Equation (3) and Weiss Equation (4) compared to actual documented times, with p-values 0.000 and 0.000, respectively.
5. Discussion
Several mathematical methods of lane-change manoeuvre duration calculation were explored. These methods assume vehicle movement in a curve consisting of two circular arcs or that the vehicle’s lateral acceleration is of sinusoidal shape and one-period duration. Driver’s reaction time needed to perform the steering manoeuvre is not taken into consideration, nor is the response time of the steering mechanism to turning of the steering wheel.
The calculation of the manoeuvre duration presented was based on the results of experimental research carried out with a wide range of vehicles (from supermini vehicles to crossover SUVs) and in various road conditions (from dry to wet road surface). The calculation base includes only the manoeuvres that were successfully performed without vehicle stability loss or exceeding the test track borders.
Exploration of the lane-change duration calculation was introduced in [
15]. Based on experimental testing with modern vehicles on a dry road surface (also described in [
16]), the constant value was recalculated to 2.6.
Research determining lane-change distance during obstacle avoidance based on experimental measurements was introduced in [
13]. This research has similar characteristics to the present study; however, the main goal was to present the calculation of longitudinal lane-change distance (i.e., not the overall distance travelled by the vehicle).
Table 7 lists the ranges of vehicle approach speeds and maximal documented lateral acceleration in the individual test series.
The first step in the manoeuvre time calculation was to define the beginning and the end of the manoeuvre. In this paper, the driver’s first steering intervention is regarded as the beginning of the lane-change manoeuvre and reaching the maximal lateral distance is considered to be the end of the manoeuvre, similar to [
14]. An argument can be made that the end of the manoeuvre should include complete stabilization at the end of the manoeuvre—this, however, seems difficult to apply in actual cases, as keeping control over the vehicle depends largely on the driver’s skills, vehicle speed, and severity of the manoeuvre.
The impact of tyre pressure on achievable lateral acceleration was observed during 2016 test series 1. From what was observed while testing both vehicles, when tyre pressure was set to 30% over its nominal value, the maximal achievable lateral acceleration values increased on average by 0.5 m/s2. When the tyre pressure was set 30% below its nominal value, the maximal achievable lateral acceleration was decreased on average by 0.8 m/s2.
A positive effect of electronic stability systems on crash occurrence was explored in numerous studies, such as [
17,
18,
19]. After all, the generally accepted positive effects of these driving assistants are seen through mandatory equipment for this feature in all newly manufactured vehicles, given by the European Commission since 2014.
Compared to the older calculation methods, the method presented is based on tests of modern vehicles currently used on European roads. The proposed method also clearly defines the manoeuvre’s beginning and end.
The statistical analysis found a new mathematical constant value C, adjusting the Kovařík Equation (3). This way, it is possible to apply lane-change manoeuvre time (duration) calculation with only adjustment to its mathematical constant to 2.93, giving it the form of the Equation (6).
The calculation presented is based on several simplifications; mainly, the complex interaction of the vehicle and vehicle tyres with the road surface is represented only by lateral acceleration. This simplification should not be seen as a disadvantage since, in many crash reconstruction cases, many of the variables are unknown (such as slip angle, yaw motion, and others) and cannot be precisely determined, e.g., due to the analyzed vehicle’s destruction. Determination of the maximal lateral acceleration thus depends on crash the reconstructionist, who can base this value on road surface condition, vehicle technical state, and vigour of the manoeuvre. The only other unknown variable in the equation is lateral distance, based on either on-road marks or estimated vehicle trajectory.
It is important to note that all the measurements were done in a testing (safe) environment. Thus, it was possible to reach the vehicles’ driving limits. To use this calculation for the driver’s avoidance option calculation (as a viable option, e.g., to prevent collision with an object in the driver’s lane), it is recommended to use lower values of lateral acceleration, as an “average driver” is not necessarily able to execute this manoeuvre while driving at the vehicle’s stability limit (either due to fear of slipping or due to lack of driving experience). The lane-change manoeuvre is not used as often as braking for crash avoidance, as seen in [
20,
21] as the manoeuvring mechanism is more complex than braking.
Thus, a guideline is proposed, similar to the one used for braking on the wet road surface, using only half of the maximal achievable acceleration on the given surface.
While modern vehicles can reach a lateral acceleration of up to 10.0 m/s2 during the lane-change manoeuvre even on the wet surface, it is the limit of the vehicle and not necessarily of the vehicle’s driver.
Furthermore, it is important to note that requiring an evasive manoeuvre from the driver as possible collision prevention is complicated by manoeuvre complexity and the necessity to check not only the road ahead of the driver, but also whichever direction the driver chooses to evade, and also the immediate vicinity of the vehicle, to ensure the safety of the manoeuvre. This naturally increases the driver’s reaction time (compared to “simple” braking).
6. Conclusions
Based on the analysis of the older calculation methods, it was determined that these methods were based on theory and, in some cases, outdated data.
For this reason, the applicability of these calculation methods was explored. Four series of driving tests were carried out using a wide variety of modern vehicles on the test track in dry and wet conditions. To ensure repeatability of the experiments, the research was performed according to the procedure prescribed by ISO 3888-2 standard, which defines the conditions and procedure of the obstacle avoidance manoeuvre. This procedure was later modified in the sense of variation of lateral distances.
Considering the calculation methods presented, it was concluded that the most prudent approach is to explore the value of the mathematical constant C. Based on a statistical analysis of the research results on a sample of 108 test drives, a new mathematical constant was presented, providing the most reliable results (there was no statistically discernible difference between the measured manoeuvre duration and the manoeuvre duration calculated by the modified formula).
The manoeuvre duration calculated by this formula represents the period between the driver’s first steering input and reaching the vehicle’s maximal lateral distance during the manoeuvre (without considering possible slight adjustments to steering in case of vigorous manoeuvring at the end of the manoeuvre).
One of the main components of the calculation is the value of maximal lateral acceleration, which encompasses both the road conditions (i.e., adhesion) and intensity of the manoeuvre, and its value should be carefully evaluated.
Future research should focus on adjusting the mathematical constant based on new data obtained by testing modern vehicles (regarding vehicle development) or providing a range of mathematical constants best suited either for different types of vehicles or for various road surfaces. Future research could also focus on developing more detailed mathematical models that would include additional parameters (such as tyre–road friction coefficient, vehicle mass, vehicle lateral stiffness) as data in this paper were insufficient for such detailed analysis.


 ,
, 


