Article

Advanced Exergy, Exergoeconomic, and Exergoenvironmental Analyses of Integrated Solar-Assisted Gasification Cycle for Producing Power and Steam from Heavy Refinery Fuels

by
Esmaeil Jadidi
1,2,
Mohammad Hasan Khoshgoftar Manesh
1,2,*,
Mostafa Delpisheh
1 and
Viviani Caroline Onishi
3,*
1
Energy, Environmental and Biological Systems Research Lab (EEBRlab), Division of Thermal Sciences and Energy Systems, Department of Mechanical Engineering, Faculty of Technology & Engineering, University of Qom, Qom 3716146611, Iran
2
Center of Environmental Research, Qom 3716146611, Iran
3
School of Engineering and the Built Environment, Edinburgh Napier University, Merchiston Campus, 10 Colinton Road, Edinburgh EH10 5DT, UK
*
Authors to whom correspondence should be addressed.
Energies 2021, 14(24), 8409; https://doi.org/10.3390/en14248409
Submission received: 15 November 2021 / Revised: 7 December 2021 / Accepted: 9 December 2021 / Published: 13 December 2021

Abstract

:
Integrated solar-assisted gasification cycles (ISGC) have emerged as a more flexible and environmentally friendly solution for producing power, steam, and other high-valued by-products from low-cost opportunity fuels. In this light, this paper investigates a new ISGC system for converting heavy refineries fuels into power and steam utilities while enhancing energy efficiency and economic and environmental performance indicators. In this approach, a solar energy field and a two-pressure heat recovery steam generator were integrated into the ISGC system to improve overall economic and environmental plant viability. The ISGC system was modelled in MATLAB software, and the results were validated using Thermoflex software. Conventional and advanced energy, exergy, exergoeconomic, and exergoenvironmental (4E) analyses were implemented to assess the main performance parameters and identify potential system improvements. The ISGC system produced 319.92 MW of power by feeding on 15.5 kg/s of heavy refinery fuel, with a thermal efficiency of 50% and exergy efficiency of 54%. The results also revealed an investment cost of $466 million, evaluated at a system cost rate of 446 $/min and an environmental impact rate of 72,796 pts/min. The conventional and advanced 4E analyses unveiled the process economic and environmental feasibilities, particularly for oil-rich countries with high availability of solar resources.

1. Introduction

Integrated gasification combined cycles (IGCC) have received increased interest over the past few years as a more sustainable solution for the co-generation of power, steam, and other valuable by-products from heavy refinery residues. The high flexibility of IGCC systems on the input feed makes them very attractive for employment in various applications subjected to fuel availability and costs. In this way, a wide range of solid and liquid wastes can be used as base input fuel, including coal, municipal wastes, heavy liquid refinery residues (heavy oil), solid refinery waste (petroleum coke), and biomass, among others [1]. IGCC power systems provide improved economic viability to existing and new processing plants owing to their ability to generate power from syngas and additional high-valued utilities and feedstock chemical co-products (e.g., ammonia, methanol, etc.) from low-cost fuels [2,3]. Additional advantages include low production costs and the potential to meet tighter pollutant emissions standards on SOx, NOx, and particulates. IGCC systems also offer the possibility of reducing CO2 emissions via pre-combustion gas purification, carbon capture and storage (CCS) [4], and gas switching combustion (GSC) technology [5]. Even though recent advances in gasification, syngas cleanup, air separation, and gas turbine technologies have driven process costs down and increased system performance, challenges remain in further enhancing energy and environmental performance requirements. In this context, the integration of renewable energy (particularly solar energy) into IGCC systems emerges as an attractive alternative.
IGCC power systems are composed of three main sections, namely, gasification, clean-up, and combined cycle [6]. The construction, operation, and maintenance of IGCC plants are generally more demanding than conventional power systems, eliciting an increase in capital investment and maintenance expenses and a reduction in reliability and availability [7]. Typically, IGCCs allow obtaining higher thermal efficiency over conventional coal-fired power plants (up to 60% when fueled with natural gas [2,8]), while the carbon emissions are lower than traditional power plants [7]. Another important benefit of IGCCs is the reduction of other pollutants. This is because the cycle allows the syngas to be purified after leaving the gasification reactor while a substantial amount of hydrogen sulphide and carbon dioxide is separated during the process [9]. In some cycles, the latter can be done via humidification, with the advantage of optimizing the amount of hydrogen produced in the syngas stream [10]. In an IGCC plant, oxygen blow technology can also be used in the gasification reactor to prevent nitrogen gas from interfering in the gasification process, by prompting a binding effect in reducing the toxic NOx pollutant [11].
Nag et al. [12] performed energy and exergy analyses of a combined cycle with a fixed bed gasifier. Their results showed that the gasification reactor unit displayed the highest energy loss among other cycle components. Moreover, their exergy analysis results revealed that the temperature ratio did not influence the highest exergy destruction of the gasification process, whereas the pressure ratio had also a low effect. The authors concluded that the exergy destruction in the combustor can be reduced by increasing temperature and pressure ratios. Emun et al. [13] simulated an IGCC system employing a Texaco gasifier using Aspen Plus® software. The system was operated via gasification using slurry based on a coal–water mixture (35.5% w/w water). Their results showed that the proposed process can achieve up to 45% thermal efficiency with a substantial decrement in SOx and CO2 emissions, reaching 0.15 kg/MWh and 698 kg/MWh, respectively.
Domenichini et al. [14] investigated hydrogen and power generation through a system fueled by refinery waste via pinch analysis. Their proposed approach was based on oxygen blow-entrained bed gasification, which was sized to produce a considerable hydrogen amount and feed gas turbines of the combined cycle unit. The authors focused on the heat integration among syngas cooling and sections of the combined cycle and reported a cost of 34 €/t for avoiding CO2 emissions. Additionally, they concluded that the cost of electricity was attractive, with a hydrogen price of 9.5 cents/Nm3, highlighting the advantage of the combined production. Morini et al. [15] simulated an IGCC cycle with a 650-MW gasification unit. In addition, the authors considered an air-cooled driven gas turbine, in which the inlet air cooling was achieved using liquid nitrogen spray. They also accounted for actual temperature profiles of various locations for an entire year in the modelling formulation. Their findings indicated that the system presented the highest performance for Johannesburg, when compared to conventional inlet air cooling schemes.
Zhang and Ahn [16] investigated the prospects of two IGCCs in China for achieving near-zero emissions. Their proposed system was based on a pre-combustion gasification process with carbon dioxide adsorbent and sour and sweet shifts. The authors reported that the sweet shift required 4.6-fold more shift steam than the sour one due to the low amount of steam in the syngas after the removal of H2S. Khoshgoftar Manesh and Jadidi [17] assessed the performance of a biomass-based IGCC fueled with olive pits by applying energy, exergy, exergy-economic, and exergy-environmental (4E) analyses. Their results indicated an output power of the IGCC of approximately 387.3 MW, with a cost of 5.23 US$/s and pollutants emissions of 41.72 mpts/s. Moreover, their results demonstrated that the gasifier had the largest exergy destruction rate, which accounted for a 24% share. The authors also showed that the gasifier and combustion chamber units had the highest avoidable exergy destructions, while the scrubber presented the lowest one. Szima et al. [5] implemented a techno-economic analysis of hydrogen and power production from the IGCC plant. The authors employed the gas switching combustion (GSC) for carbon capture, whereas membrane-assisted water gas shift (MAWGS) reactors were used for hydrogen production. Table 1 displays a brief overview of the most recent literature regarding applications, methodologies, and practices related to IGCCs.
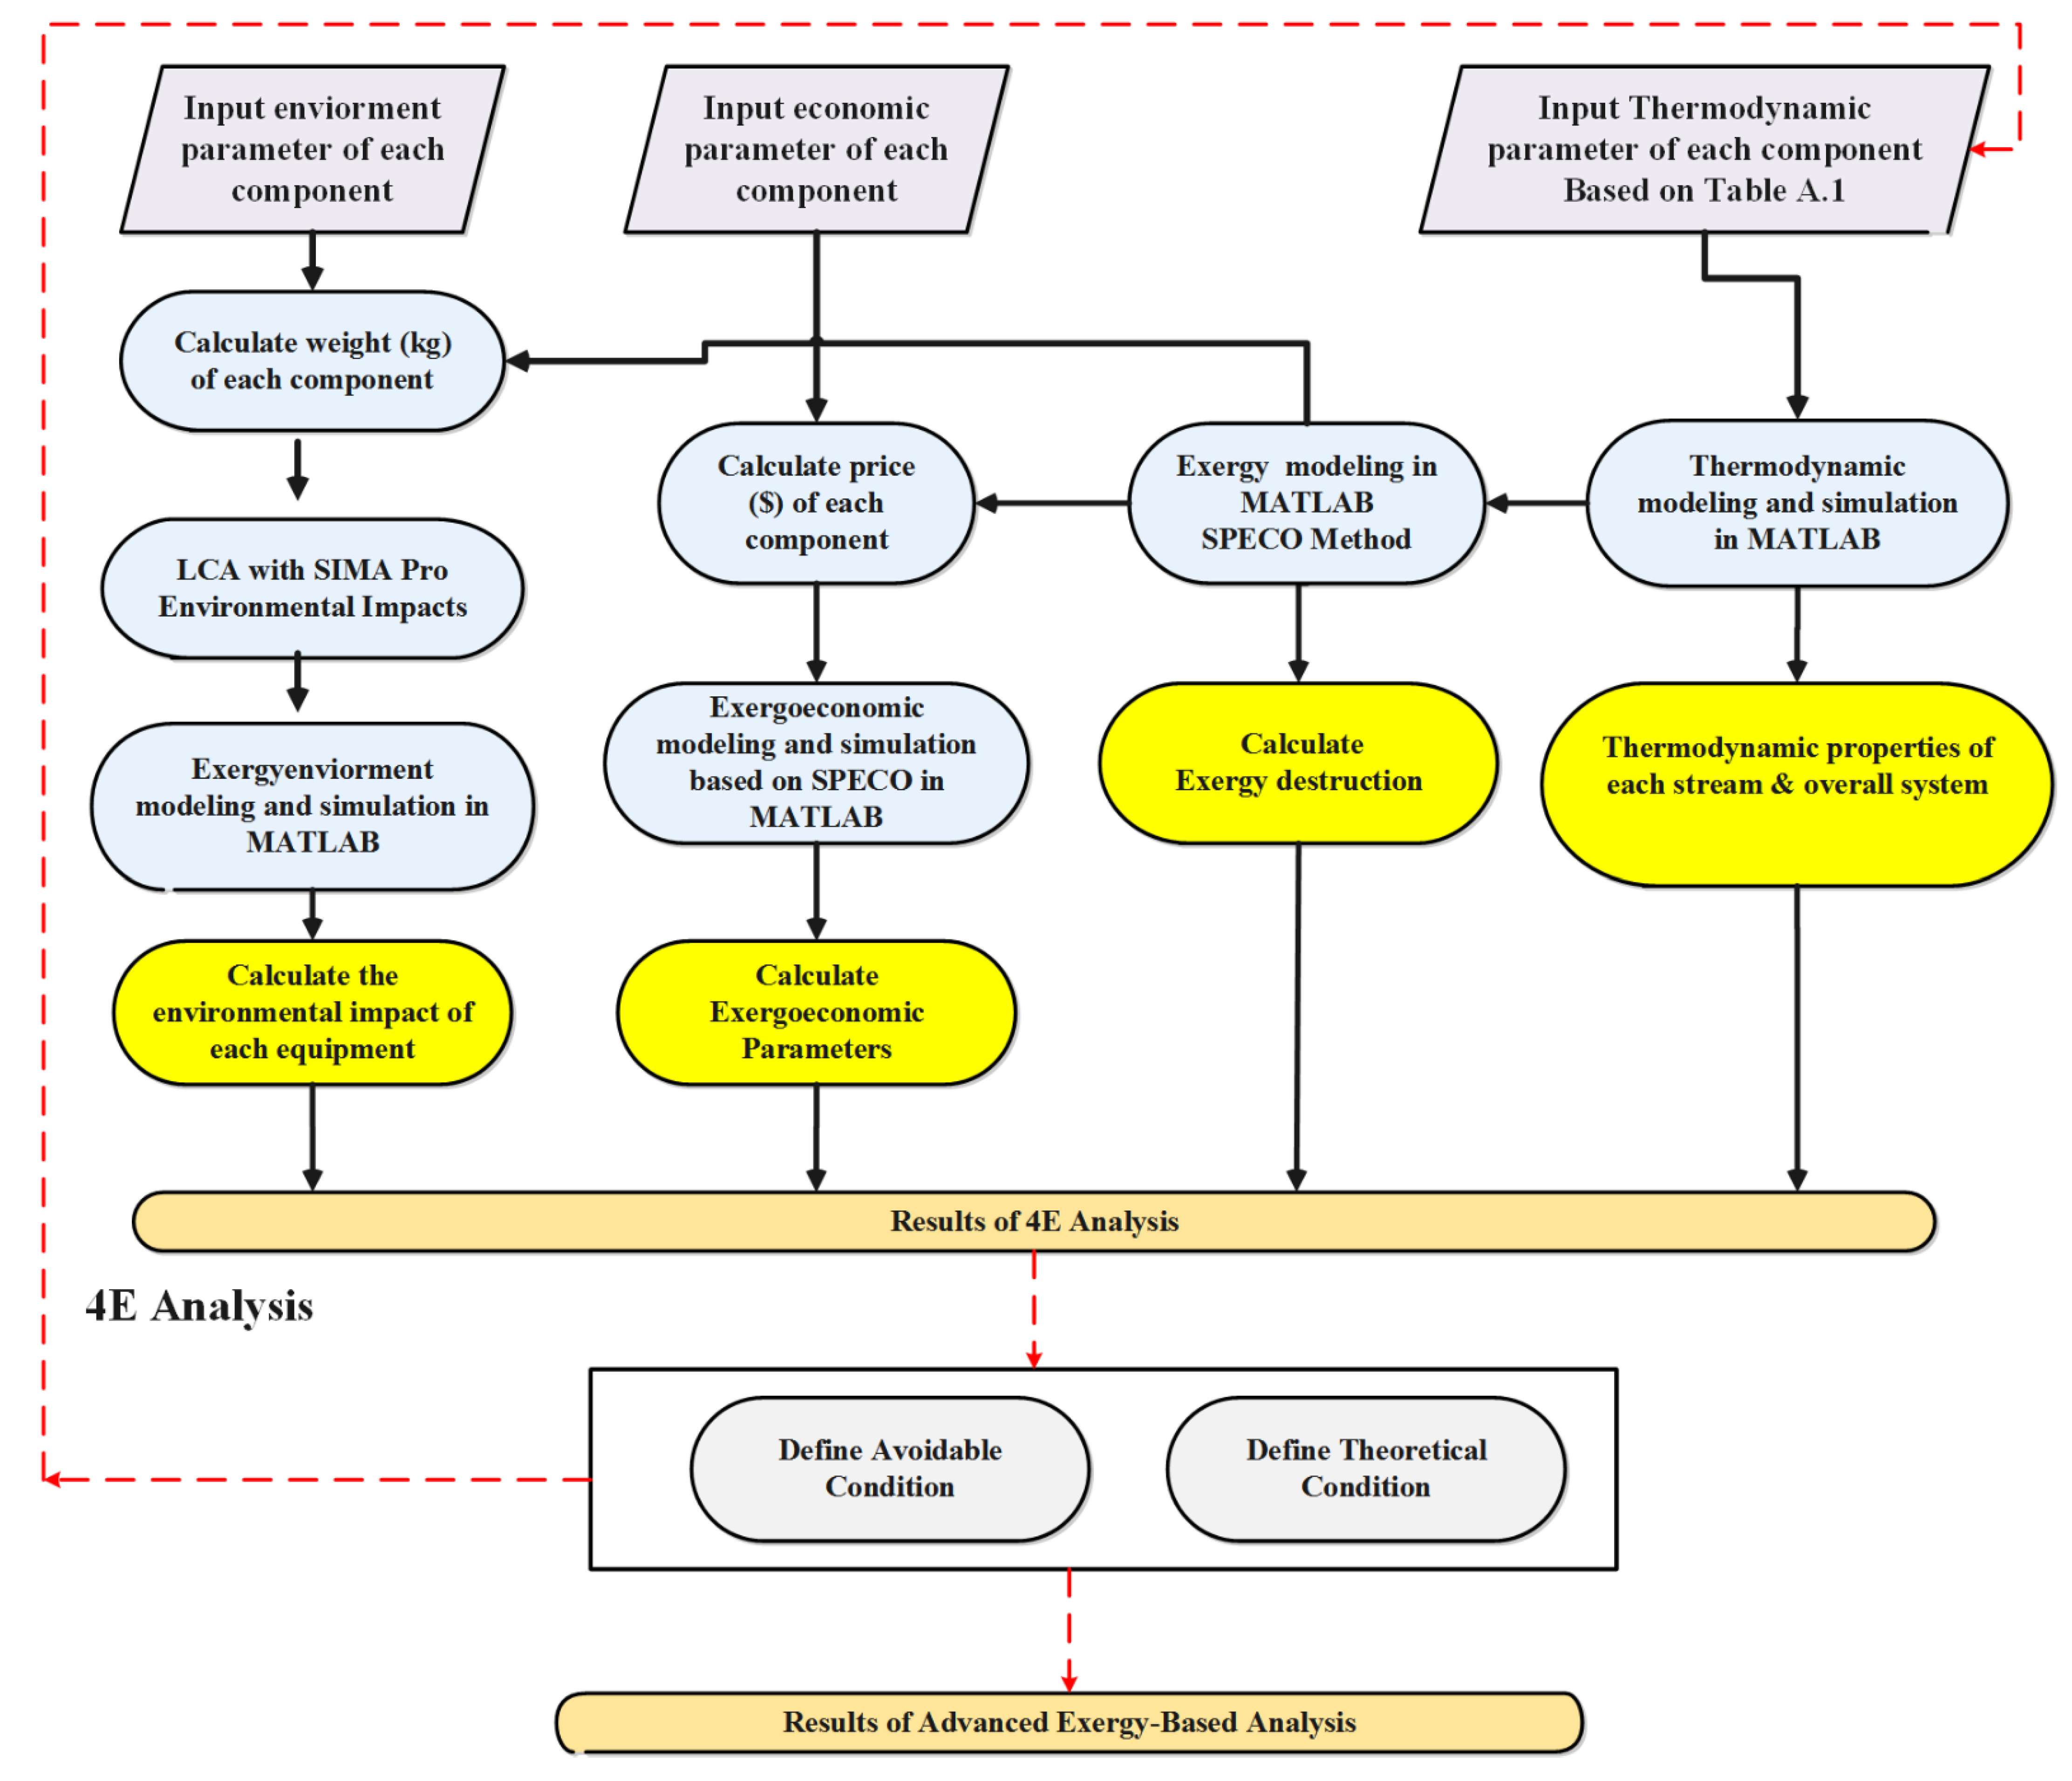
Although previous studies constitute important contributions to the area, none considered energy, environmental, and economic analyses of integrated solar-aided gasification cycles for enhancing energy recovery from low-cost opportunity fuels. It should be noted that solar-aided IGCC systems are among the most efficient and cleanest methods for converting solid wastes and refinery residues into valuable power and heat utilities and other high-value chemical by-products needed by the refineries. For surpassing limitations on preceding research, this paper investigates a new integrated solar-assisted gasification cycle (ISGC) for producing steam and power from heavy refinery fuels while enhancing energy efficiency, economic, and environmental performance indicators. In the proposed cycle, the syngas from the gasifier enters the turbine to produce power after purification and separation of pollutants, and then it is sent to the steam section for thermal energy recovery. In addition, a solar energy field, a two-pressure heat recovery steam generator (HRSG), and CO2 capture unit are integrated into the plant to enhance the overall system efficiency while reducing carbon emissions. The ISGC system was modelled and simulated in MATLAB software, and the results were validated using Thermoflex software. Conventional and advanced 4E analyses were implemented to assess energy, economic, and environmental ISGC system performances. The 4E analyses allows examining system units with an increased level of detail and thereby prioritize these equipment pieces for future optimization and improvement. Hence, the new approach provides a novel avenue towards dealing with heavy refinery fuels and turning an environmental issue into an opportunity, especially for oil-rich countries that enjoy high solar global irradiances. Major contributions and innovative features introduced by this study are highlighted as follows.
(1)
Combined heat and power co-generation from gasification of low-cost heavy refinery fuels for achieving enhanced energy recovery.
(2)
Solar-assisted energy generation via parabolic trough collectors to improve the overall system efficiency while reducing environmental impacts.
(3)
Integration of CO2 absorber technology for further reducing pollutant emissions.
(4)
Comprehensive conventional and advanced energy, exergy, exergoeconomic, and exergoenvironmental analyses to evaluate main performance parameters and identify potential system improvements.

2. System Description

The integrated solar-gasification cycle is based on the IGCC cycles proposed by Zhang et al. [29] and Khoshgoftar Manesh and Jadidi [
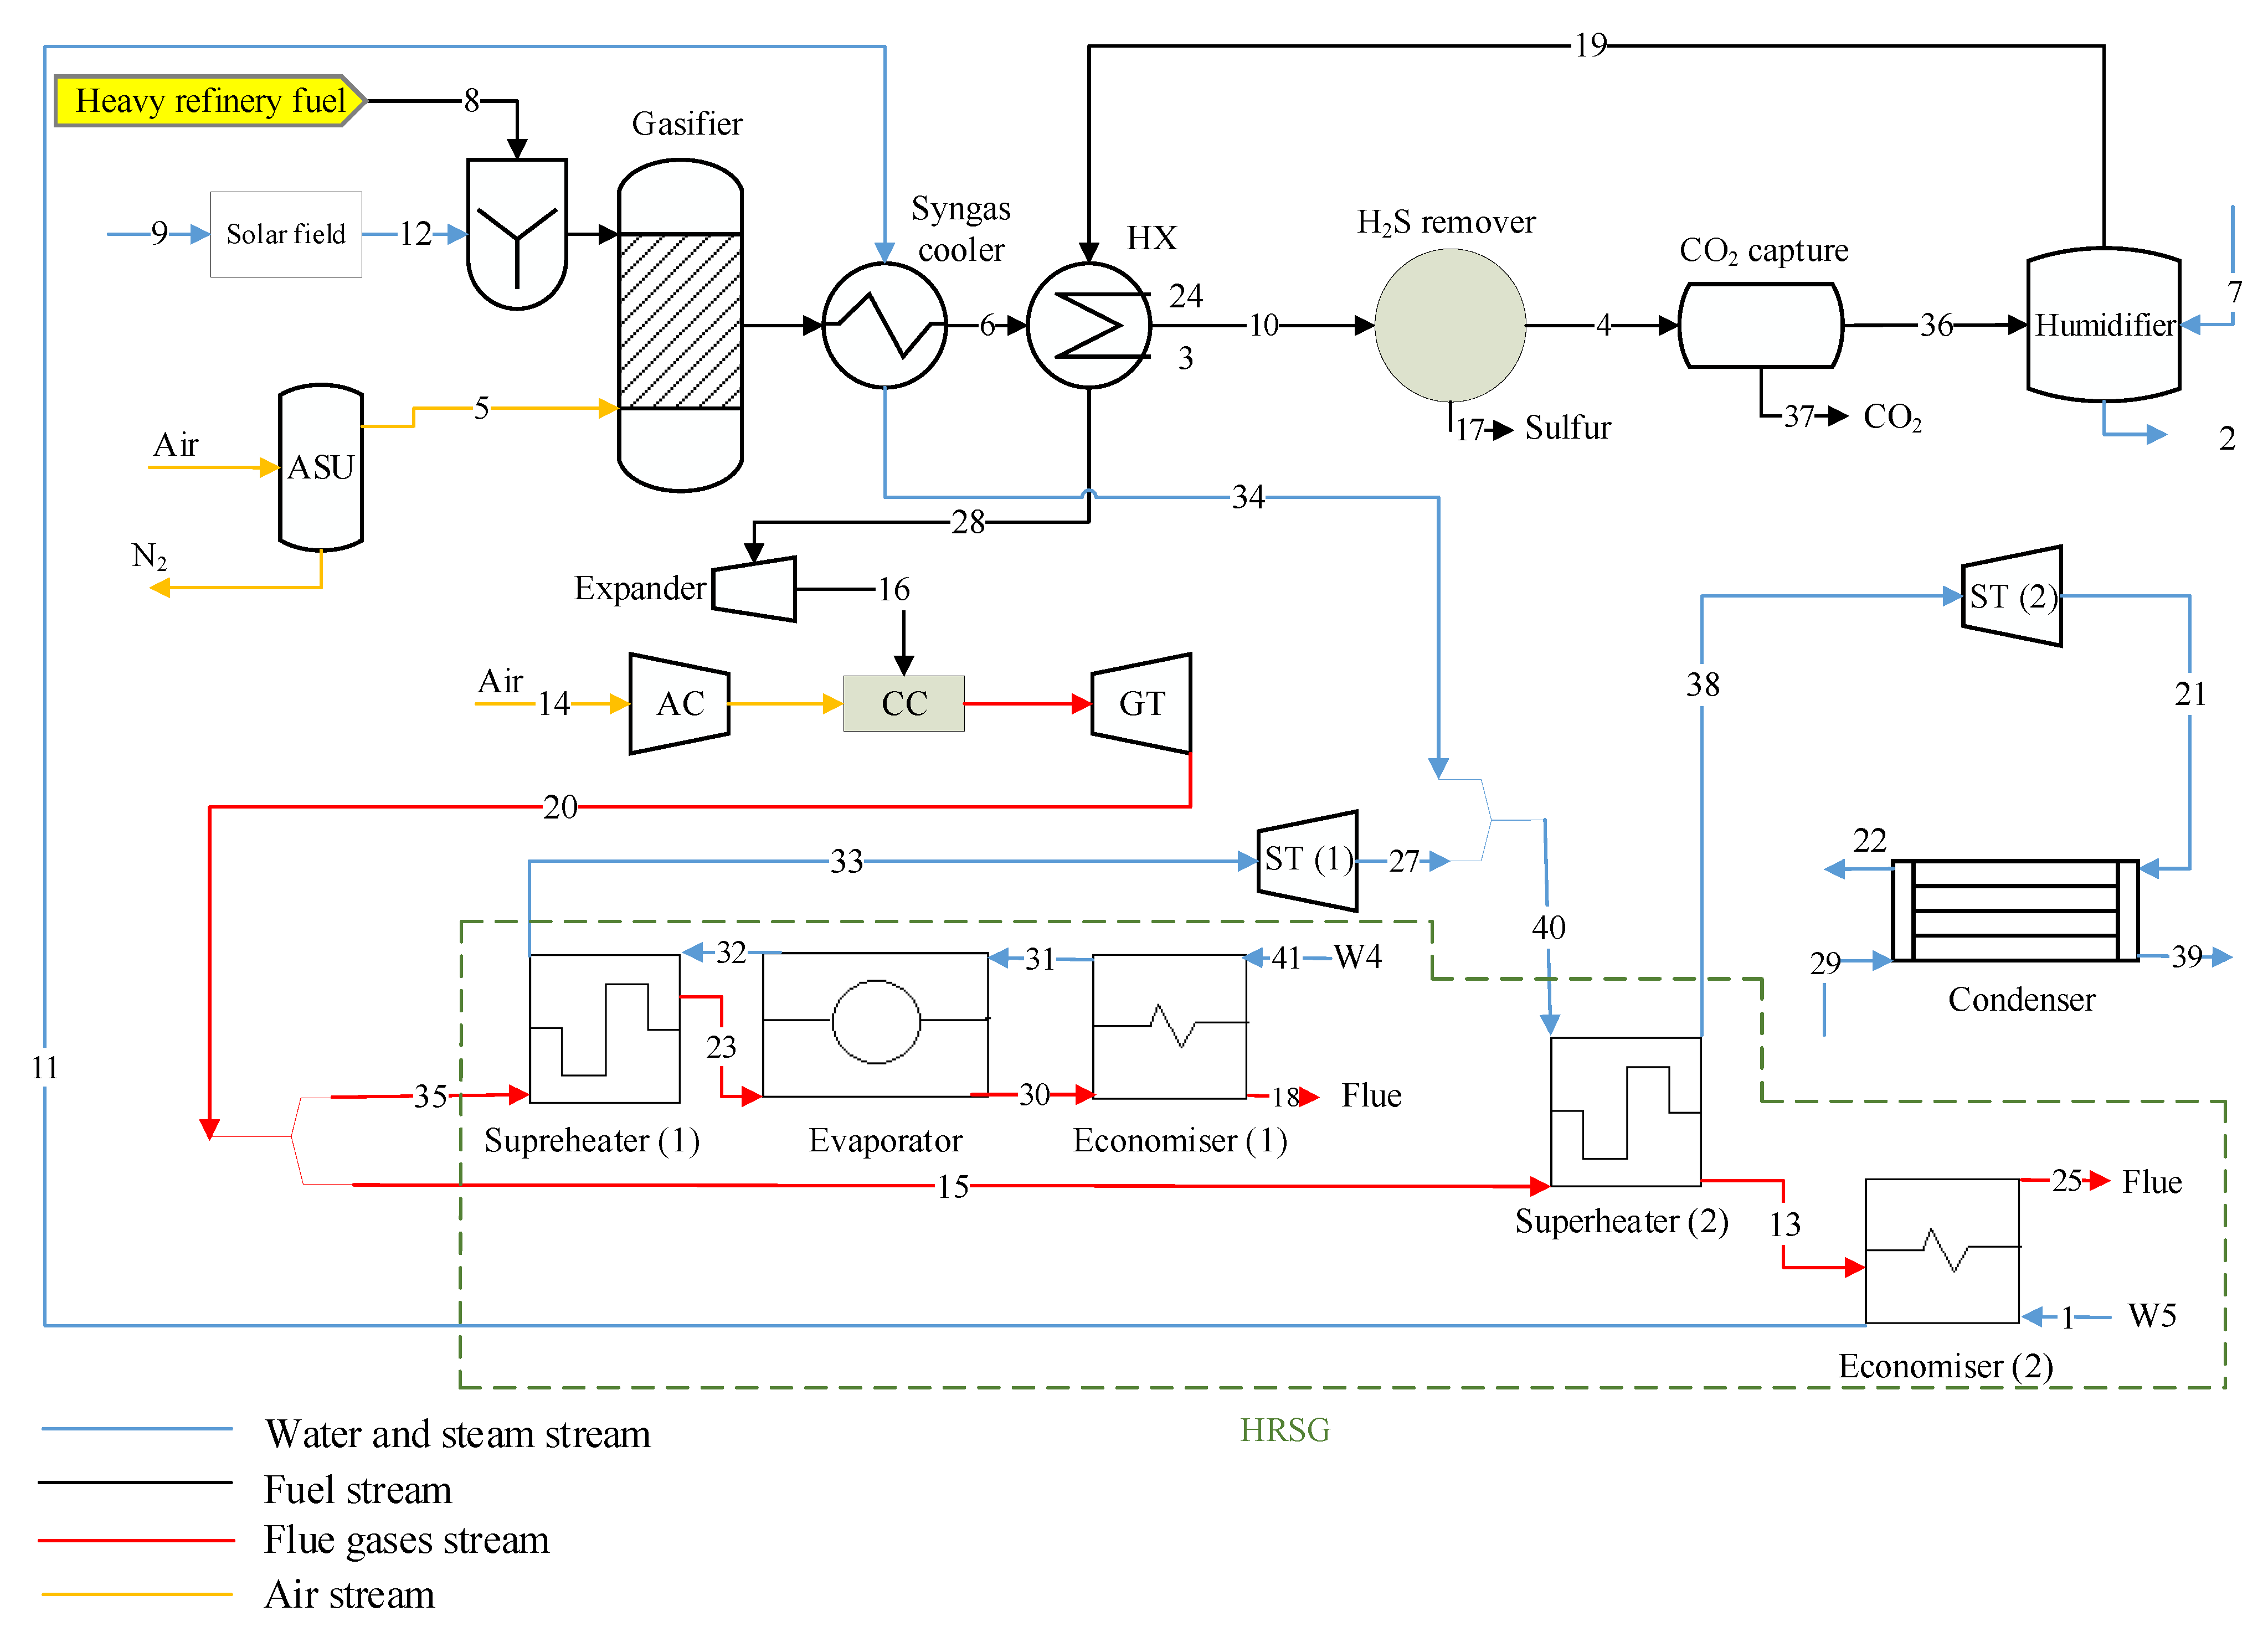
17], which provide a suitable base combined-cycle configuration. Yet, the proposed new ISGC system encompasses a partial gasification cycle under oxygen blowing with a pre-combustion chamber, together with a solar energy field (parabolic through collectors), two-pressure heat recovery steam generator (HRSG) and a CO2 absorber, as depicted in Figure 1. It should also be noted that the study by Zhang et al. [29] used coal, and Khoshgoftar Manesh and Jadidi [17] employed biomass as feed for the IGCC power system. In contrast, the proposed ISGC plant is targeted at using heavy refinery fuel to take advantage of low-cost heavy refinery residues. Furthermore, conventional and advanced exergy, exergoeconomic, and exergoenvironmental evaluation are implemented to better shed light on the ISGC power system. Table A1 provides the operating conditions assumed for the different ISGC system units.
In the proposed ISGC system, the air first goes to the air separation unit (ASU), where the pure oxygen product stream (5) enters the gasifier. The superheated water vapor by the solar field is mixed with the heavy refinery fuel stream before entering the gasifier. In the syngas cooler, the heat from the syngas stream is utilized to saturate the water in the steam turbine. It should be observed that the fuel and syngas streams are represented by black lines in the schematic diagram in Figure 1, whilst the water and steam streams are depicted in blue, the flue products in red, and the air stream by red lines. The syngas enters the heat exchanger as stream (6), which is responsible for increasing the temperature of the humidified syngas. In the next section, the syngas goes to the H2S remover unit in stream (10). Then, the syngas stream enters this unit as stream (4) to capture CO2. After entering the humidification section, the temperature of the syngas in the mentioned heat exchanger increases. Thereafter, the syngas pressure needs to be synchronized with the compressor outlet pressure. Hence, the syngas pressure is reduced by half of its initial value via an expander and produced energy. Herein, the syngas entered the combustion chamber (CC) as stream number (16). Finally, the combustion gases are sent to the gas turbine (GT) to provide electrical power.
In the HRSG unit, water enters the first cycle economizer as stream (42), and, after being saturated in the evaporator as stream (32), it goes to the first superheater to exchange heat with the flue gases to become superheated. Afterwards, this superheated steam enters the first turbine as stream (33). An additional water stream (1) entered the second economizer, before entering the syngas cooler as stream (11) to change phase from saturated liquid to saturated steam. It is then mixed with stream (27) and enters the second superheater. Here, superheated steam is sent to the second steam turbine (ST) with the stream (38). After power generation, this stream goes to the condenser, and, after condensation, it finally leaves it as a saturated liquid stream (22).

3. Methodology

The integrated solar-gasification cycle (ISGC) system was modelled in MATLAB software, and the thermodynamic results were validated via simulations using the Thermoflex software environment. Accordingly, the thermodynamic system modelling was performed in Thermoflex to obtain the streams pressure, temperature, and enthalpy. The developed code was based on the thermodynamic relations, input parameters (process operating conditions), and calculation of the unknown parameters, as indicated in Table A1 of Appendix A. Figure A1 shows the schematic of the computational procedure for the 4E analyses. The following sections outline the thermodynamic, economic, and environmental formulation used to assess the proposed ISGC system.

3.1. Thermodynamic Analysis

Assuming a steady-state condition, the first law of thermodynamics was applied to all system components. Thus, the following mass balance was required for each equipment k in the system.
  m ˙ i n , k =   m ˙ o u t , k
Equation (2) states the energy balance used for modelling each equipment k in the system:
Q ˙ k W ˙ k =   m ˙ o u t , k h o u t , k   m ˙ i n , k h i n , k
where m ˙ , Q ˙ , W ˙ , and h denote the mass flow rate, heat transfer rate, power, and specific enthalpy, respectively.
For performing the thermodynamic analysis, the following assumptions were considered:
(1)
Pressure drops were disregarded in heat exchangers and pipe network.
(2)
Heat losses were neglected in the equipment.
(3)
Turbines and pumps had isentropic efficiencies.
(4)
Kinetic and potential energy and exergy changes were disregarded.
Additionally, the following assumptions were needed to model the gasifier [29]:
(1)
Heat dissipation was neglected.
(2)
The reactor was fed with heavy refinery fuel.
(3)
The reactor type was an oxygen blower.
(4)
The reactor included a syngas cooling heat exchanger.
(5)
The air separation system was based on a membrane separation process.

3.2. Conventional Exergy Analysis

The aim of the conventional exergy analysis is to determine the exergy destruction and exergy efficiency of each component to better understand the irreversibilities of the system. In this study, exergy was divided into physical and chemical exergy, as given by Equation (3) and Equation (4), respectively:
e P H = h h 0 T 0 ( S S 0 )
e C H =   x i e i 0 + R T 0   x i l n x i γ i
Herein, h is enthalpy, T is temperature, and S denotes entropy. Additionally, x i is the mole fraction, γ i is component i activity coefficients, and e i 0 is the standard chemical exergy, addressed in Ref. [30]. The exergy rate of the i-th stream is obtained by the multiplication of the specific exergy rate by the corresponding mass flow rate:
E ˙ i = m ˙ i × e i
Exergy destruction is one of the critical parameters of the exergy analysis since it determined the system irreversibility rate. Ideal reversible systems present equal total inlet and outlet exergy flows. However, real systems are characterized by several sources of irreversibilities, including friction losses, transient heating, and chemical reactions, among others. As a result, the total exergy of output flows was lower than the one of the input flows to the system, which is expressed as the system exergy destruction. The Specific Exergy Costing (SPECO) [31] methodology was employed to measure the components’ exergy destruction rate ( E ˙ D , k ), as expressed by Equation (6). The method allowed stratifying exergy rates into fuel ( E ˙ F , k ) and product ( E ˙ P , k ) for each component (as given in Table A2). It should be noted that, unlike other methodologies, the SPECO approach accounts for fuel and product definitions and auxiliary cost equations at the component level, even in the most complex cases involving several exergy components. As a result, these definitions are independent of the entire system setup.
E ˙ D , k = E ˙ F , k E ˙ P , k
The exergy efficiency is defined by:
ε k = E ˙ x P , k E ˙ x F , k
It is noteworthy that the chemical exergy of the fuel contributes to a larger share of the system input exergy:
e x C H = β × L H V f u e l
where β is the ratio of the exergy of the fuel over its low heating value (LHV), calculated by:
β = 1.044 + 0.16 H C 0.34493 O C ( 1 + 0.0531 H C ) 1 0.4142 O C
where H / C and O / C are the atomic ratios of the fuel. The formulation used for obtaining the exergy destruction and efficiency of system components is listed in Table A2 of Appendix A.

3.3. Conventional Exergoeconomic Analysis

By combining the exergy analysis with economic principles, such as investment, maintenance, and repair costs, the final cost of the exergy destruction can be evaluated for each system component. In this study, the flow costs based on exergoeconomic analysis included the investment cost rate, exergy destruction cost rate of each equipment, and the cost of fuel used in the system. The sum of these input costs represents the total cost of the entire system. Hence, the component cost rate is calculated by Equation (10).
Z ˙ k = Φ k × P E C k × C R F 3600 × N
where Φ k is the maintenance factor (taken as 1.06), N is the annual operating hours (8000 h) [32,33], and CRF is the capital recovery factor given by Equation (11) [33].
C R F = i × ( 1 + i ) n ( 1 + i ) n 1
where i is the fractional interest rate per year and n is the plant lifetime (25 years) [32,33]. In addition, P E C k is the purchase equipment cost for each system component, as defined in Table A3 (see Appendix A).
After computing each component cost rate, the exergoeconomic balance was considered by solving the matrix balance equation for each component:
C ˙ P , k = C ˙ F , k C ˙ L , k + Z ˙ k
e C ˙ e , k + C ˙ w , k = i C ˙ i , k + C ˙ q , k + Z ˙ k
The cost of each stream was obtained by multiplying the specific cost by its exergy rate, as shown in Equation (14).
C ˙ i = c i · E ˙ i
where C ˙ F , k and C ˙ P , k are the fuel stream and product stream cost rates, respectively. Additionally, the component exergy destruction cost rate was determined by Equation (15):
C ˙ D , k = c F , k . E ˙ D , k
Finally, the exergoeconomic factor is expressed as [33,34]:
f k = Z ˙ k Z ˙ k + c f , k E ˙ D , k
The exergoeconomic balance equations of the different ISGC system components are presented in Table A4 of Appendix A.

3.4. Conventional Exergoenvironmental Analysis

The life cycle assessment (LCA) is an environmental analysis methodology broadly used for products, processes, and services. The LCA can be carried out after technical and economic analyses. In this study, LCA was implemented within the exergoenvironmental analysis. In this way, the exergoenvironmental analysis was performed via three phases: (1) exergy analysis of each process stream; (2) estimation of environmental impacts related to the manufacturing process of each system component; and, finally, (3) the exergoenvironmental formulation was used to estimate the environmental impacts of streams based on the exergy analysis. The exergoenvironmental analysis was carried out via the following equations.
The relationship between exergy and environmental impact for each stream i is provided by Equation (17).
B ˙ i = b i   E ˙ i
where B ˙ i is the environmental impact rate (given in pts/s), b i is the exergoenvironmental impact (pts/kJ), and E ˙ i the stream exergy rate (kW). Similarly to the exergoeconomic analysis, the following balance is required for the exergoenvironmental analysis:
  B ˙ i n , k   B ˙ o u t , k + Y ˙ k = 0
where Y ˙ k is the k-th component environmental impact rate, defined through ECO-Indicator 99 [35]. This parameter is obtained by Equation (19) [36].
Y ˙ k = b m k · w k
where b m k and w k are the per weight environmental impact (mpts/kg) and the kth component weight (tons), respectively. The latter is given in Table A5 of Appendix A for the different system components.
The environmental impact associated with the exergy destruction of the k-th component is written as:
B ˙ D , k = E ˙ D , k b F , k
The cumulative environmental impact rate ( B ˙ T , k ) for the k-th component is denoted as [37]:
B ˙ T , k = B ˙ D , k + Y ˙ k
The corresponding balance equations for the environmental impact rate of system components are listed in Table A6 (see Appendix A).
The exergoenvironmental factor shown in Equation (22) is an important criterion that expresses the ratio of the equipment component-related environmental impact to the sum of the component-related and operational-related environmental impact. An exergoenvironmental factor value around 1 indicates that the component environmental effects are greater than the operational-related environmental impact.
f b , k = Y ˙ k Y ˙ k + b f , k E ˙ x D , k

3.5. Advanced Exergy Analysis

Advanced exergy analysis can be used to evaluate the exergy destruction sources, thereby leading to potential improvements in the system. In advanced exergy analysis, the equipment irreversibilities are evaluated within two different viewpoints: (1) source of irreversibility and (2) ability to eliminate such irreversibility. From the source perspective, equipment unit irreversibilities are divided into endogenous and exogenous. From the ability to eliminate standpoint, the irreversibility of each system component is categorized as avoidable and unavoidable [38,39]. The former stratification is grounded on theoretical methods, while the latter is calculated grounded on the maximum energy-efficient system commercially available.

3.5.1. Avoidable and Unavoidable Exergy Destruction

Unavoidable exergy destruction in system components relates to the limitations imposed by the thermodynamic and physical conditions and technological and economic constraints. In most cases, unavoidable exergy destruction is determined by the authors’ knowledge and experience on potentially unavoidable system irreversibilities. The avoidable exergy destruction can be obtained from the unavoidable one by the following equation.
E ˙ D , k = E ˙ U N D , k + E ˙ A V D , k

3.5.2. Endogenous and Exogenous Exergy Destruction

Endogenous exergy destruction of system components is associated to the irreversibility of each unit itself. The exogenous exergy destruction is given by the difference between the exergy destruction of the system operating at actual conditions and the endogenous exergy destruction as expressed as follows.
E ˙ D , k = E ˙ E N D , k + E ˙ E X D , k
The engineering approach proposed by Kelly et al. [40] was used in this study, which can be implemented for the equipment that performs chemical reactions, including combustion chambers and gasifiers. Thus, Equation (25) is implemented to obtain endogenous and exogenous exergy destruction.
E ˙ D , t o t = E ˙ D , k E N + E ˙ D , k E X + E ˙ D , o t h e r s
where E ˙ D , o t h e r s is the summation of the exergy destruction in the system components other than the k-th component under analysis.

4. Results and Discussion

The results obtained from the conventional and advanced thermodynamics, exergy, exergoeconomic, and exergoenvironmental analyses are presented in the following sections.

4.1. Validation of Thermodynamic Modelling Results

This section compares the modelling results for mass flow rate, temperature, and pressure of process streams obtained from MATLAB to those from the simulations performed in Thermoflex software, which are based on real plant data information. The results comparison is shown in Table 2. For all streams, the simulated results showed an error lower than 1%, presenting an appropriate agreement with each other.
Table 3 displays the output parameters for the power and heat transfer rates of the different system components obtained from Thermoflex (based on real plant data information) and MATLAB simulations. In all cases, the simulated results presented an error lower than 4.5% and, therefore, an appropriate agreement with each other.
Table 4 exhibits the main results of the proposed ISGC modelling approach compared to those found by Zhang et al. [29], including the exergy input to the system, exergy destruction, net output power, thermal efficiency, and the ratio of exergy destruction to total input exergy. The results showed a similar thermal efficiency of around 50% for both studies. Even though the pre-combustion chamber was omitted in the present system (compared to Zhang et al. [29]), the ratio of exergy destruction to total input exergy was decreased by 4.8% (from 56.7% to 53.98%). Therefore, in the output power scale of the cycle, this configuration also reduced the investment cost. It should be noted that the main goal in the study was to increase exergoeconomic efficiency; therefore, expressing the increase in thermal efficiency from 49.5% to 50% indicated that replacing the coal fuel feed with heavy refinery fuel in cycle did not reduce the relative thermal efficiency but also caused a slight improvement. Furthermore, the system produced 319.92 MW of power by feeding on 15.5 kg/s of heavy refinery fuel. This occurred at a thermal efficiency of 50.01% and exergy efficiency of 53.98%.

4.2. Conventional Exergy-Based Analyses

Table 5 shows the results obtained for the conventional exergy, exergoeconomic, and exergoenvironmental analyses for each process stream through system simulations using MATLAB software environment.
Table 6 displays the exergy, exergoeconomic, and exergoenvironmental analyses’ results for each equipment piece in the cycle. The results show that the exergy efficiency of the solar field and the condenser was approximately 20% and 43%, respectively. One reason for such exergy efficiency values is the relatively low efficiency in the air separation unit (38%). The latter value was owed to using a membrane-based oxygen separation system, which required high-power-consuming compressors.
In addition, the results revealed that the combustion chamber had the highest exergy destruction cost. The combustion chamber also presented higher cost and environmental impacts of the exergy destruction when compared to other equipment units. Therefore, its performance should be improved to mitigate its exergy destruction. Heat recovery equipment had the lowest exergoenvironmental coefficient, which indicated that the exergy destruction of this equipment had high adverse effects on the environment. This is affected by thermodynamic factors and other reasons, for instance, the equipment weight, which means that it should be optimally designed from thermodynamic and structure to prevent adverse environmental effects. A practical suggestion to reduce these effects in the heat recovery equipment could be to couple them to a solar energy field to increase the temperature of the water entering the system. In the investment cost section, the highest amount was related to the gas turbines, and the lowest was presented by the condenser.
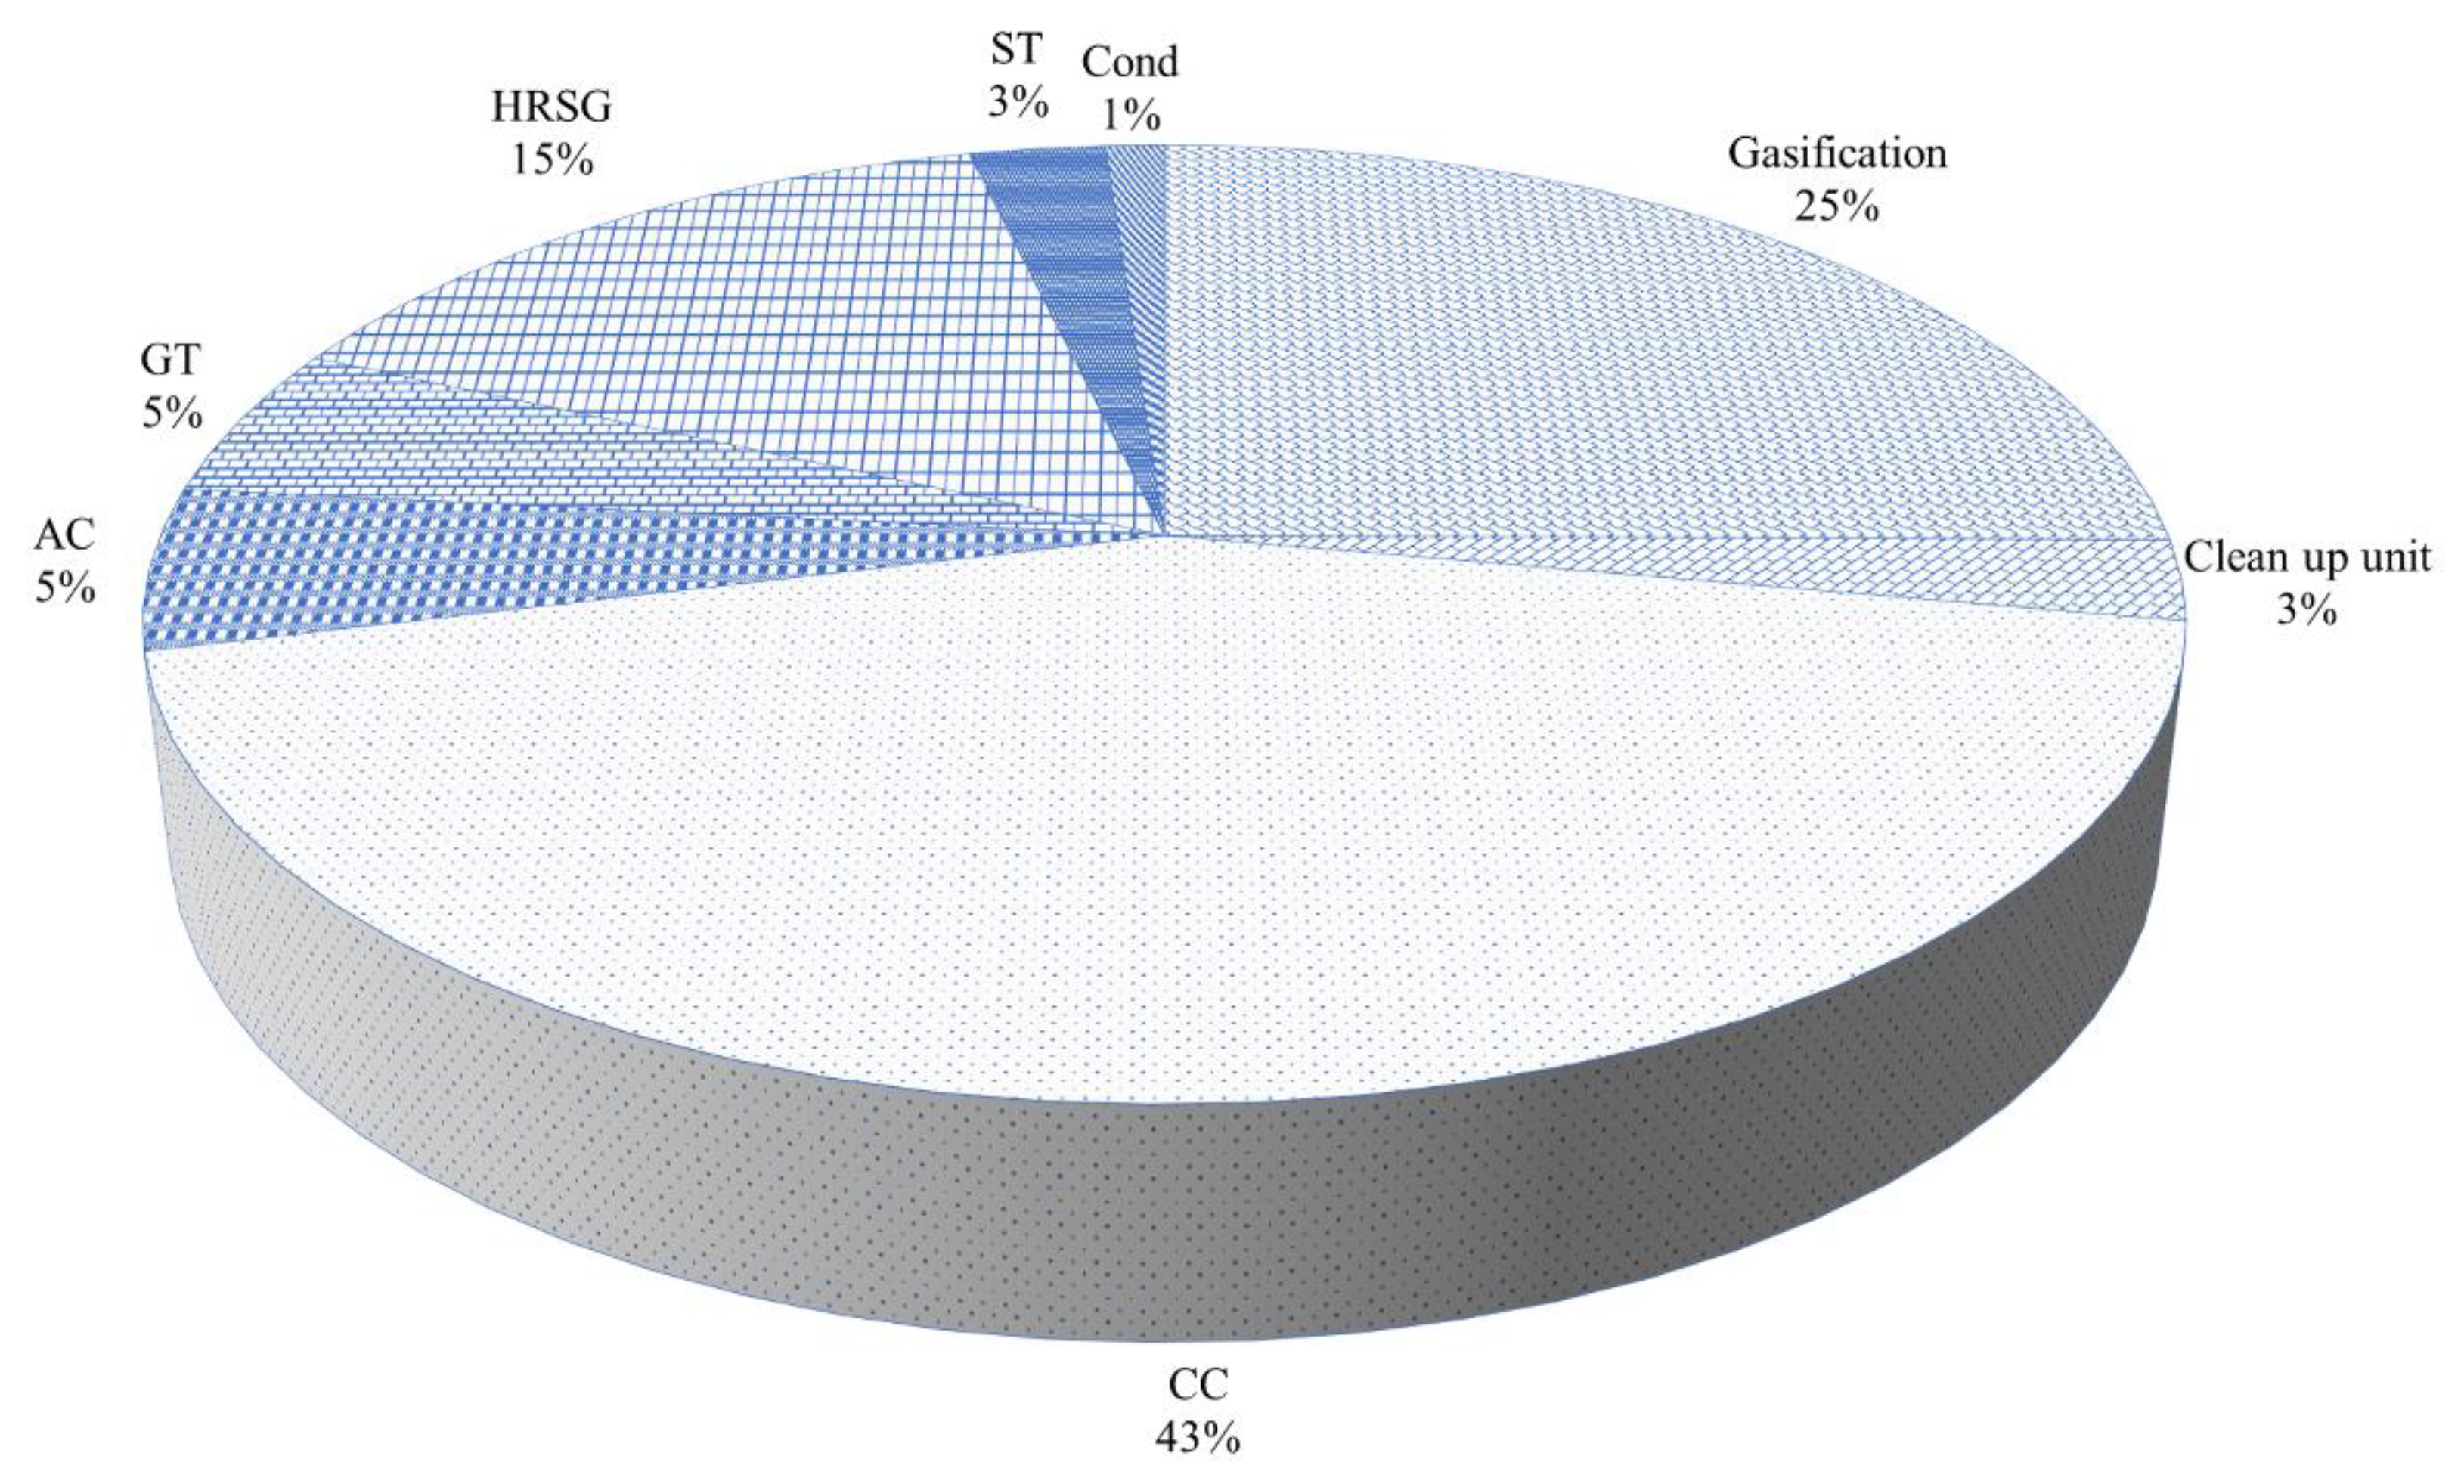
To better understand the critical parameters of the system, the share of exergy destruction in the system components is depicted in Figure 2. Hence, the combustion chamber, the gasifier, and the HRSG unit had the highest share of exergy destruction. The rate of exergy destruction in the combustion chamber was 43%, which can be reduced by implementing an optimal design approach. Compared to other similar cycles, a noteworthy point in the present system is the relatively low exergy destruction share of the gasifier (25%), which was due to the employment of the air separation unit and, thereby, the injection of pure oxygen.
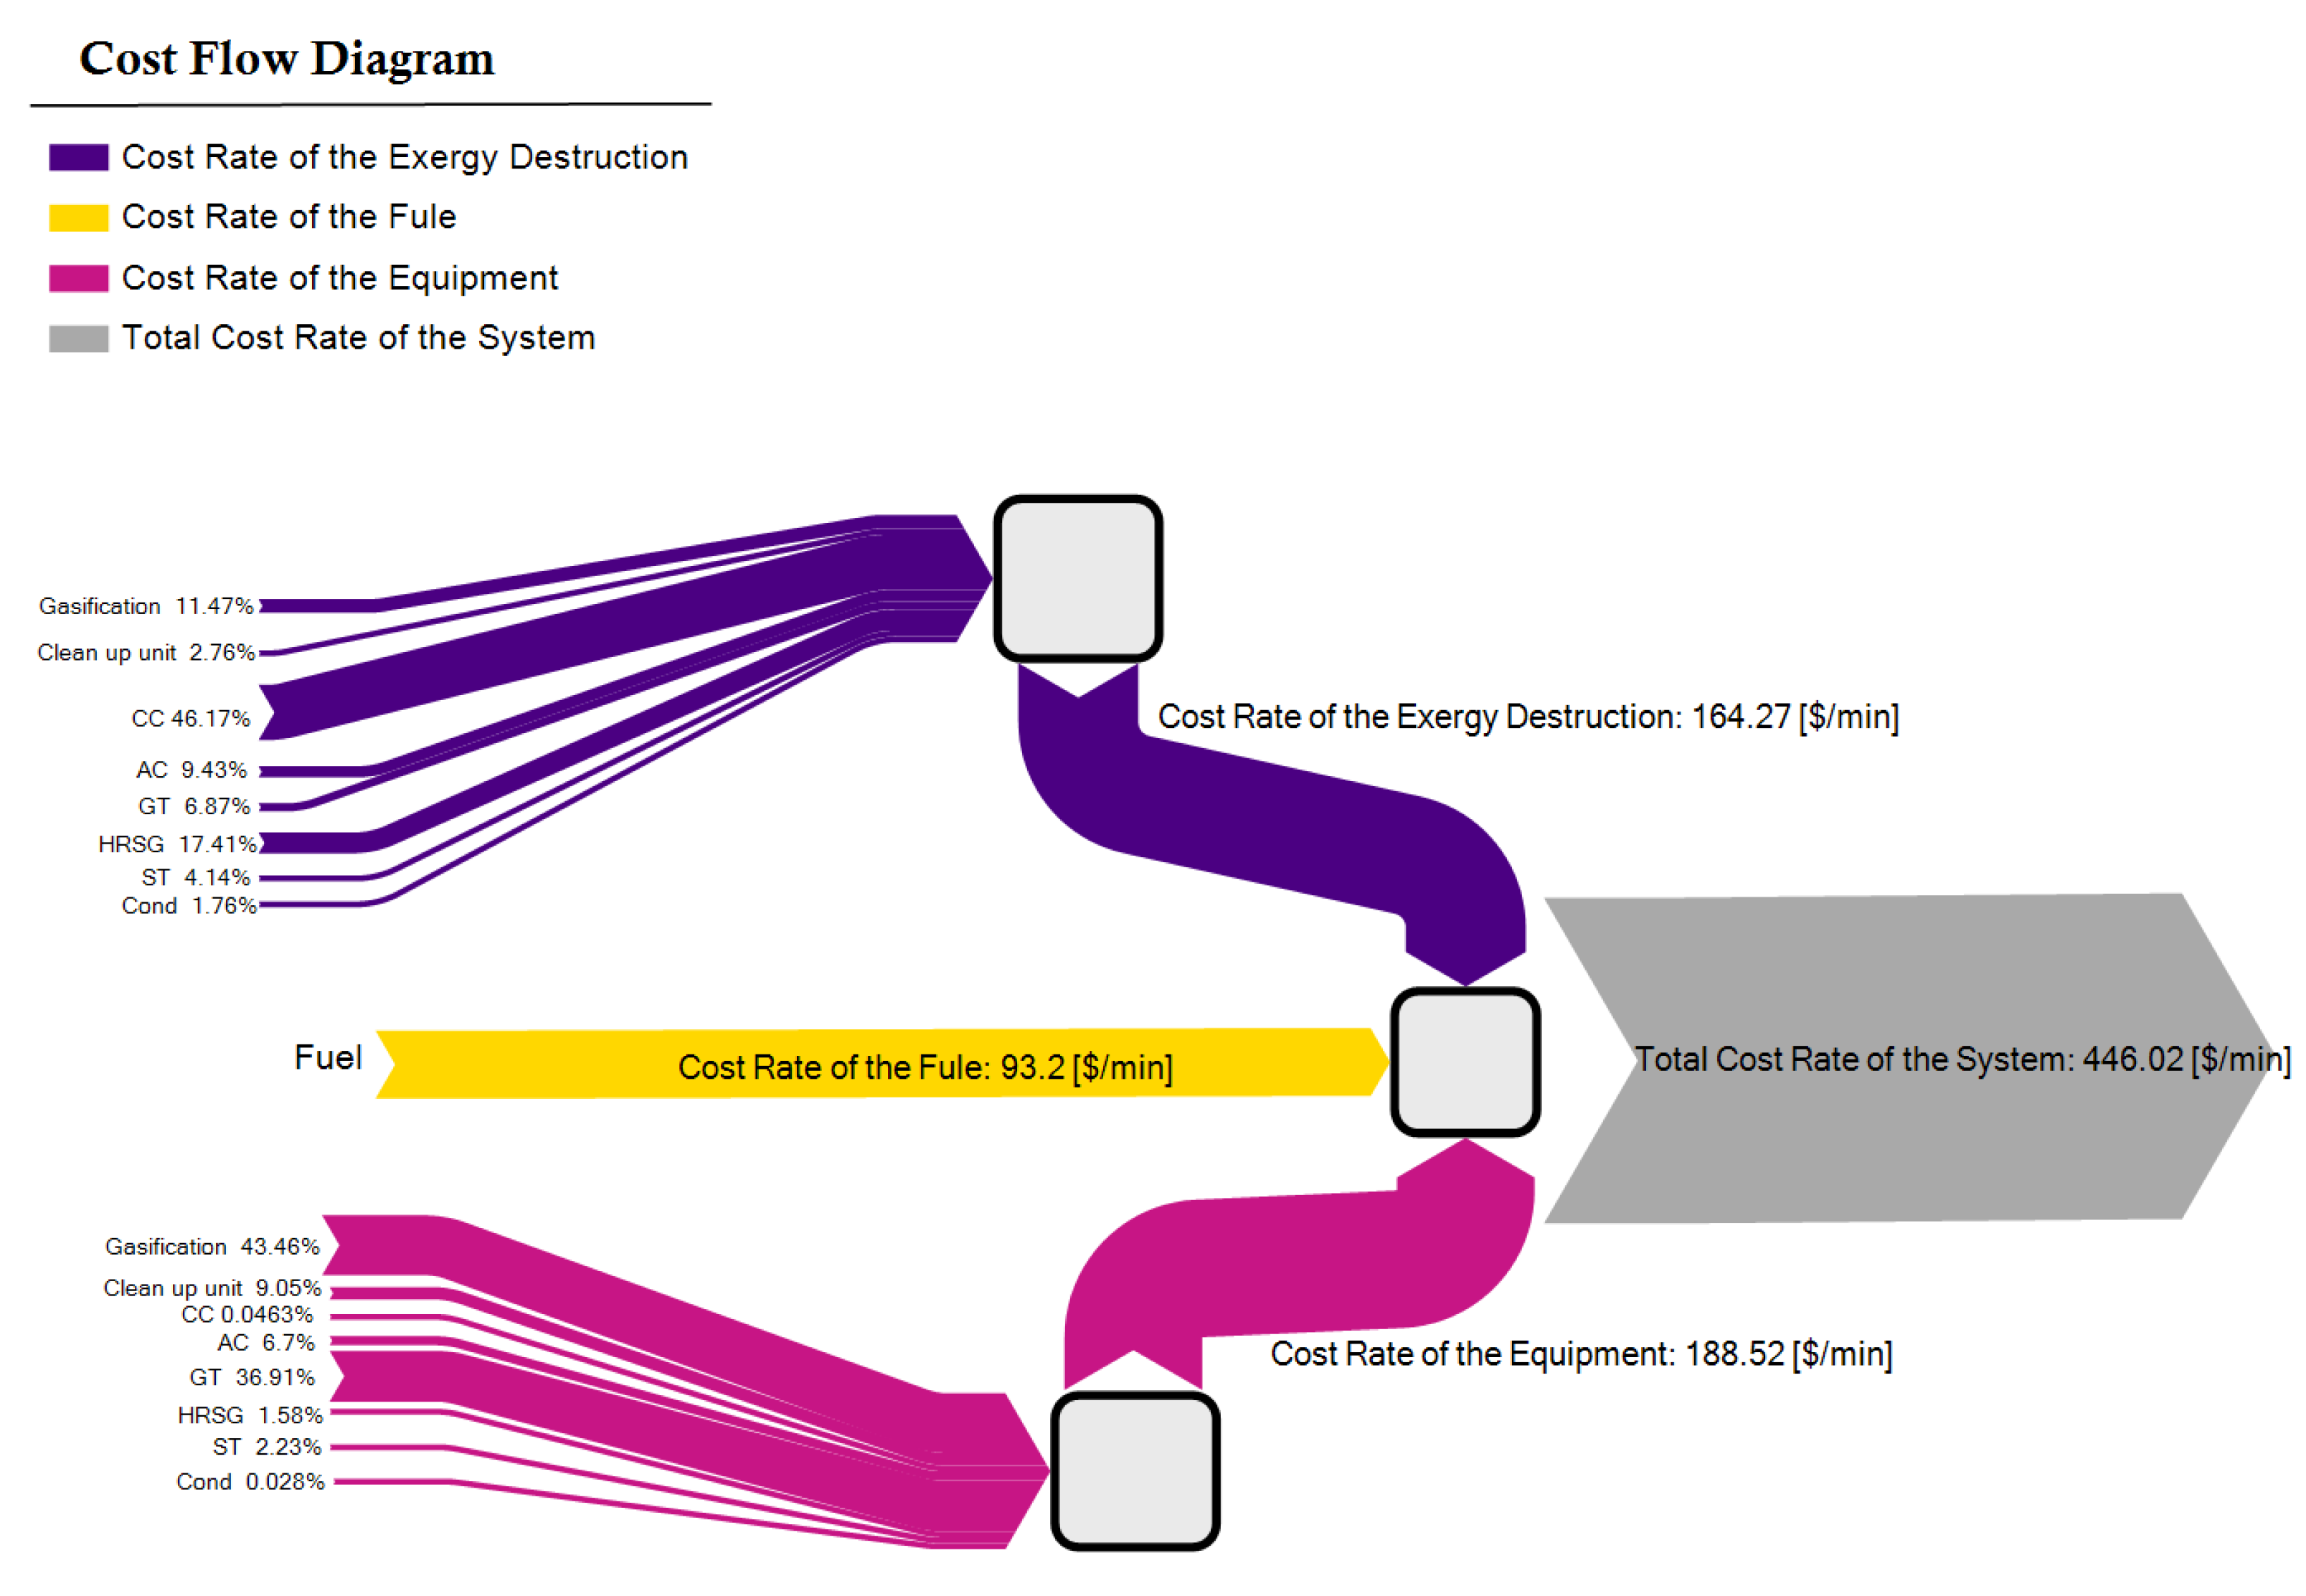
Figure 3 displays the cost flow diagram of the proposed system. As observed, the amount of exergoeconomic destruction of the combustion chamber, HRSG, and gasifier was higher than other equipment. Moreover, in terms of equipment cost rate, the highest cost was related to the gasifier, followed by the gas turbine. The remarkable point in this figure that distinguishes this system from other conventional cycles is that the total exergy destruction costs were lower than the total equipment costs. This is owed to the inexpensiveness of the fuel employed in this system, which was a direct function of the exergoeconomic destruction of the equipment.
The total cost of exergy destruction was equal to 164.27 US$/min, whereby the highest rate was related to the combustion chamber with 46.17% share, followed by the HRSG with 17.41%. Besides, in the equipment cost rate section, out of the total 188.52 $/min, the highest, with 43.46%, was related to the gasifier, followed by the purifying section at 9.05%. The sum of these costs caused the rate of total cycle exergy destruction at 446.02 $/min.
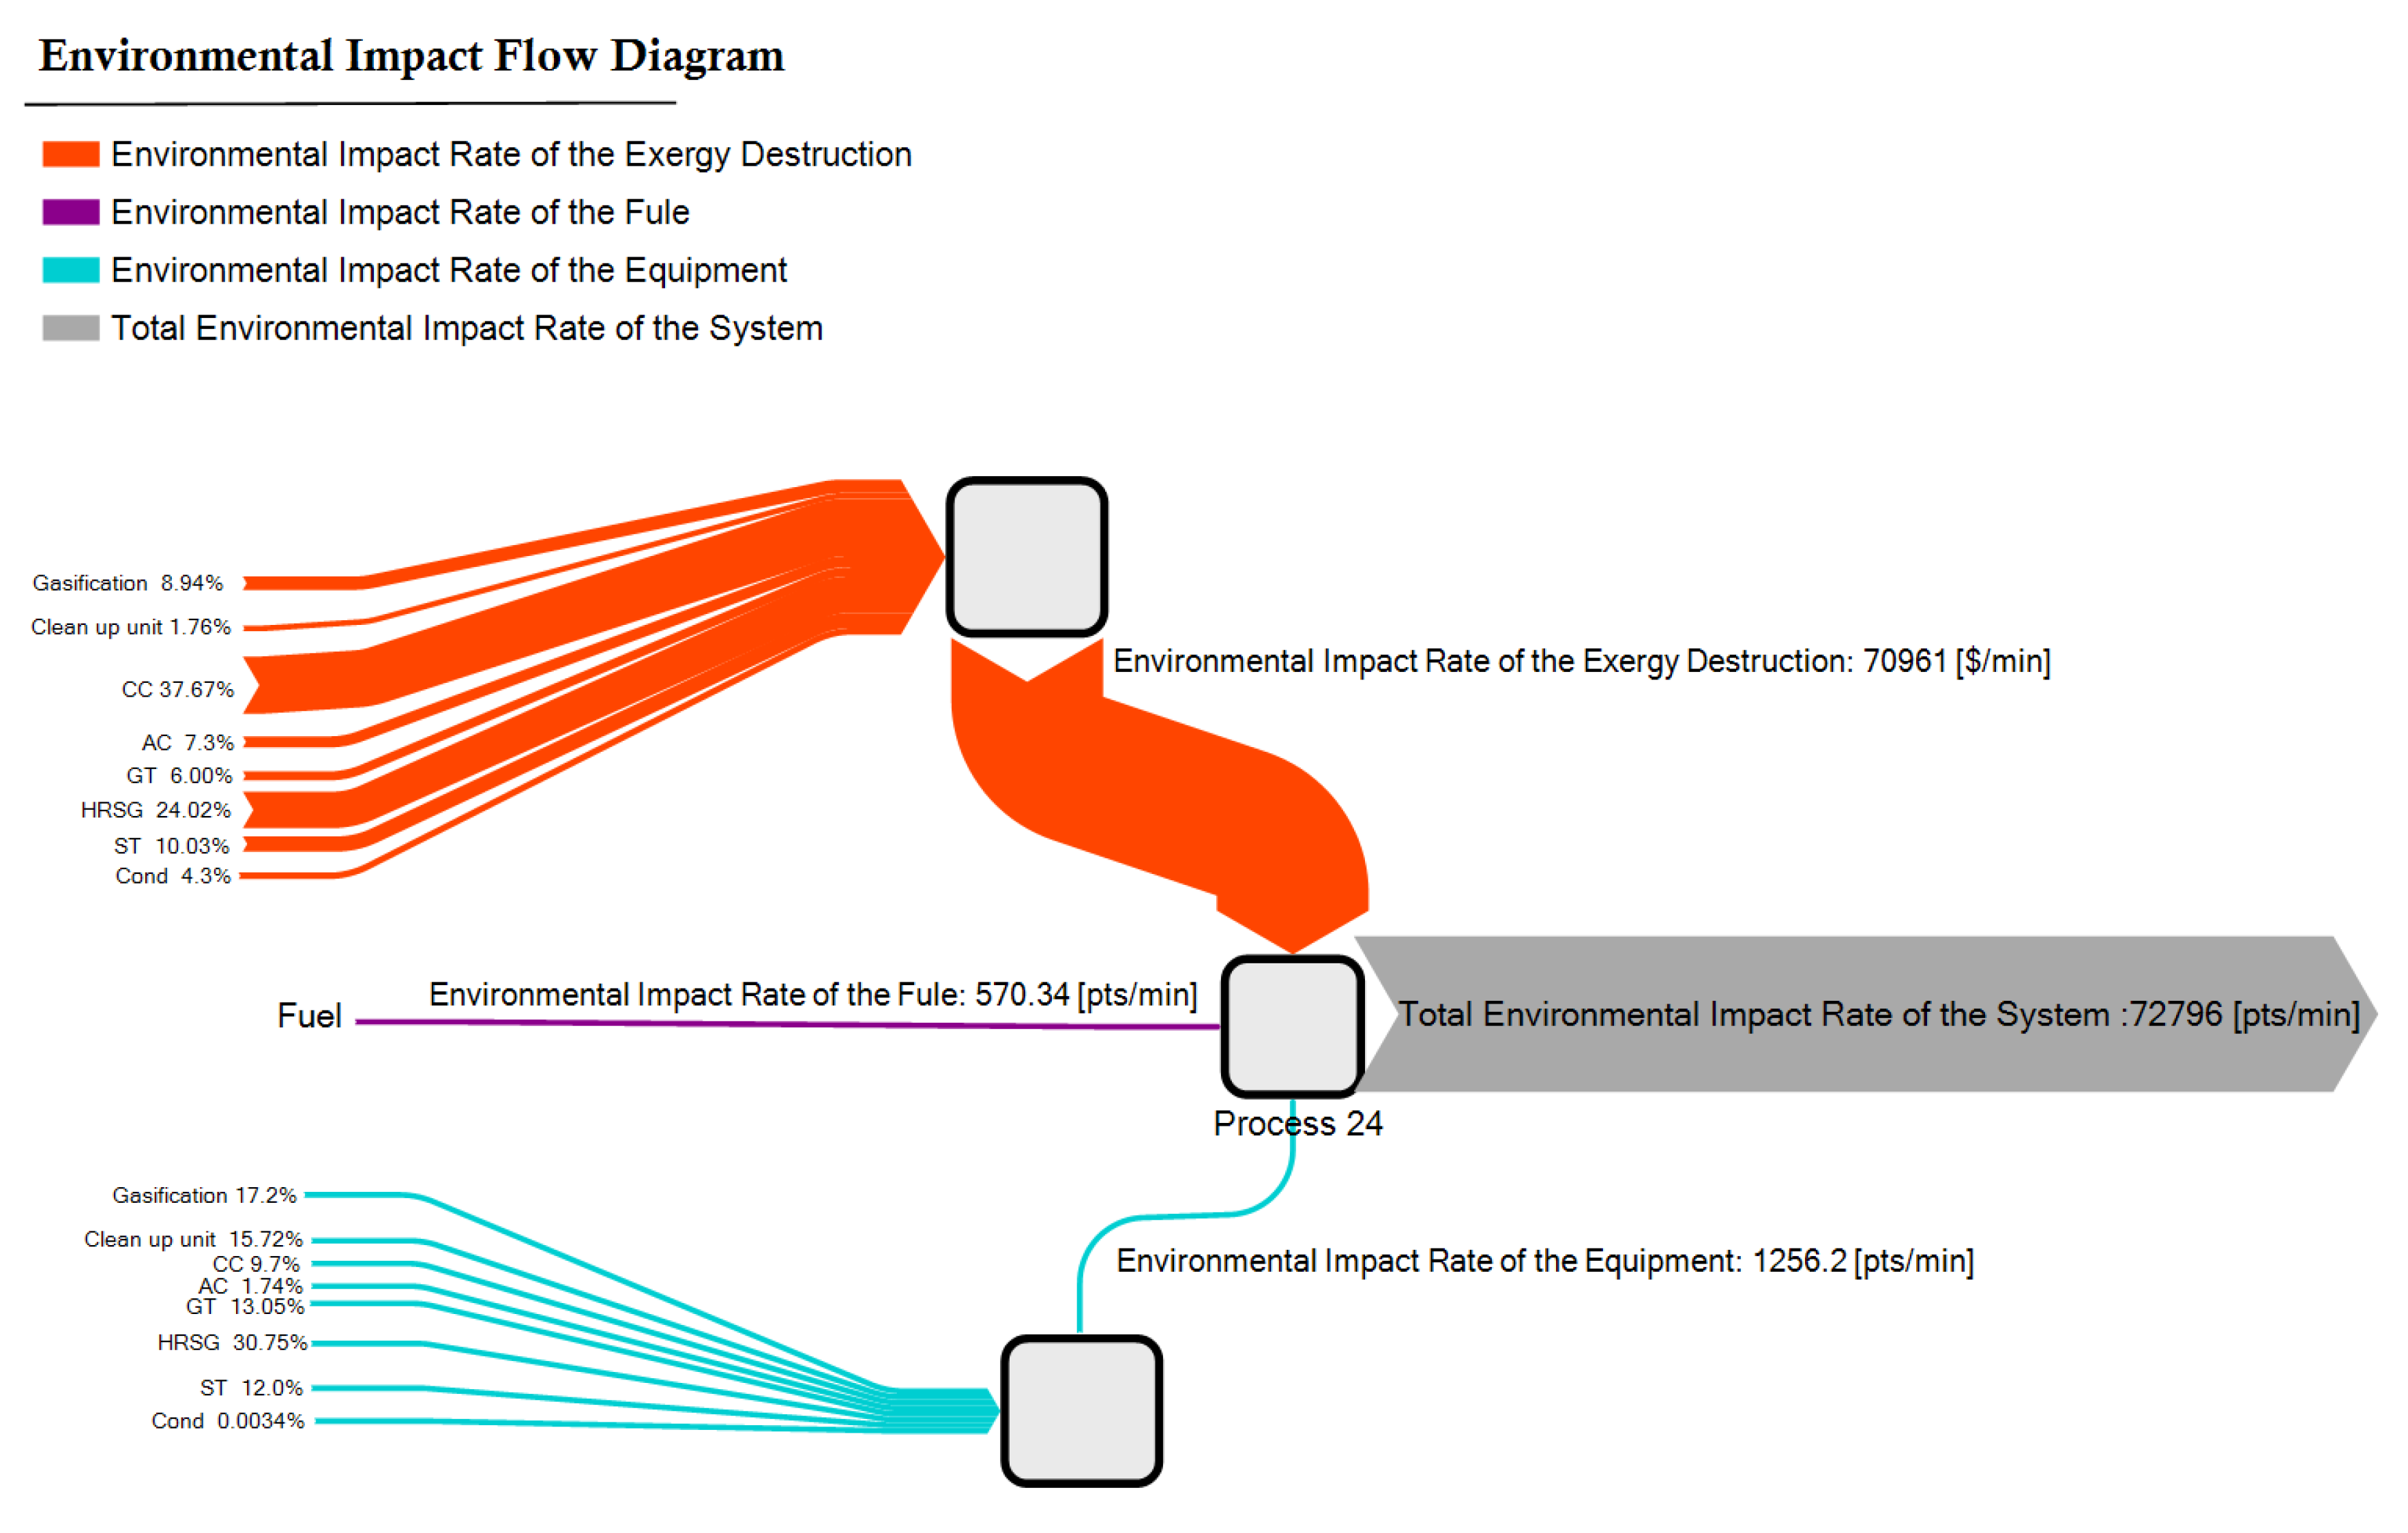
The system environmental impacts, including the environmental impact rate of the equipment, exergy destruction, and the fuel entering the cycle, are displayed in Figure 4. The summation of these effects led to the total environmental impact rate of the system. As observed in this figure, the environmental impact rate of exergy destruction of the combustion chamber, HRSG, and the gasifier was higher when compared to other equipment pieces in the system. It is noteworthy that the total environmental impact rate of exergy destruction of each piece of equipment was less than the environmental impact rates of the equipment. The reason behind this is the high calorific value of the fuel used in this system, which was a direct function of the exergoenvironmental exergy destruction of the equipment.
The total rate of environmental exergy destruction effects was 70,961 pts/min, in which the highest rate was related to the combustion chamber, with a 37.67% share, followed by the HRSG unit, with 24.02%. The total equipment environmental impact rate amounted to 22.2 pts/min, among which the HRSG had the highest cost rate, with a 30.75% share, followed by the gasifier, with 17.2%. The sum of these environmental effects led to the total cycle environmental impact rate of 72,796 pts/min.

4.3. Advanced Exergy-Dased Analyses

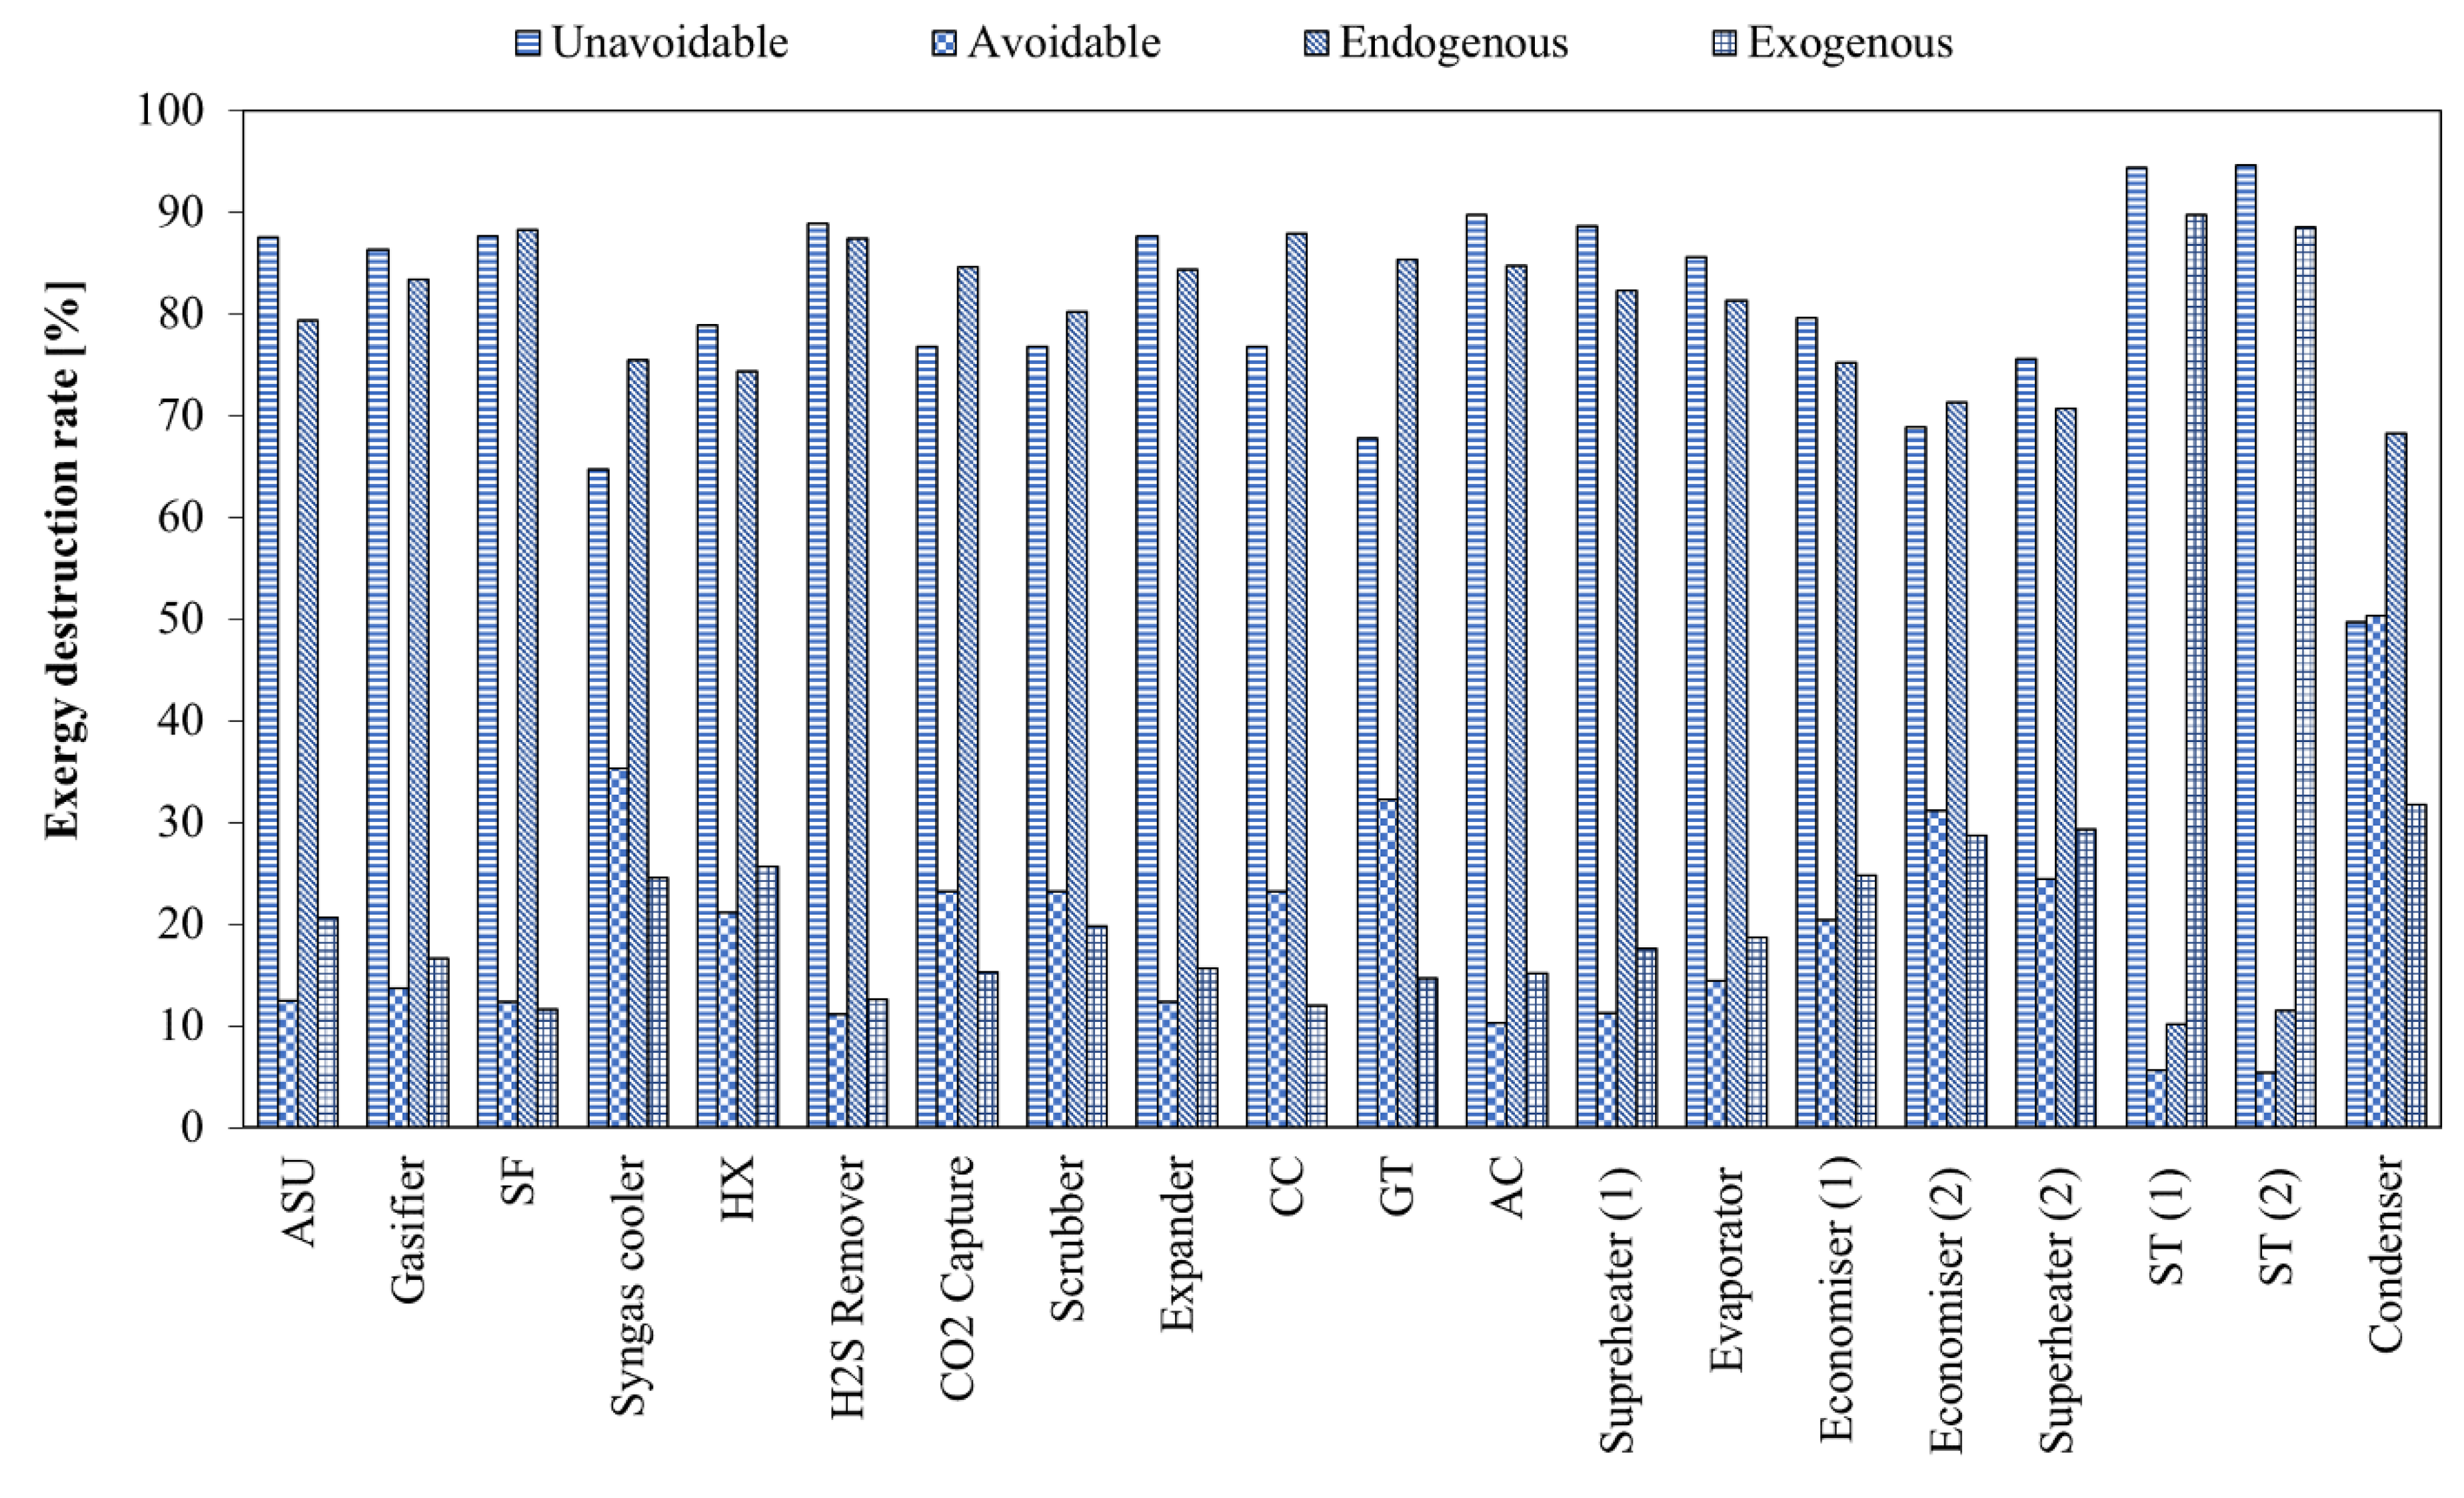
Figure 5 displays the advanced exergy analysis, namely, avoidable, unavoidable, endogenous, and exogenous exergy destruction in each system equipment. The highest avoidable exergy destruction was related to the condenser, followed by the syngas cooler and the gas turbine. Moreover, the highest endogenous exergy destruction was associated with the solar field, followed by the combustion chamber and the CO2 capture unit. To increase the exergy efficiency, system components with high avoidable exergy destruction such as the condenser, syngas heat exchanger, and gas turbine can be prioritized for modifications. Based on avoidable exergy destruction, the steam turbines 1 and 2, air compressor, and CO2 capture unit had the minimum potential for improvement. Hence, these components do not require any modifications or improvement. In addition, steam turbines 1 and 2 and condenser had minimum endogenous exergy destruction.
Figure 6 depicts the advanced exergoeconomic destruction share of each system equipment. As shown, the condenser also had the highest avoidable exergoeconomic destruction share, while the steam turbines had the lowest. Therefore, components with high avoidable exergy destruction such as the condenser can be prioritized for modification to increase the exergoeconomic efficiency. This modification can include changing the type of equipment used, regardless of the cost of exergy destruction. In addition, the syngas cooler, gas turbine, economizer, scrubber, and CO2 capture are in the following priority for improvement. However, steam turbines 1 and 2 presented minimum potential for improvement based on the avoidable parameter. Based on the endogenous parts of the cost of exergy destruction, the combustion chamber, gas turbine, air separation unit, H2S removal, and CO2 capture had the highest rates.
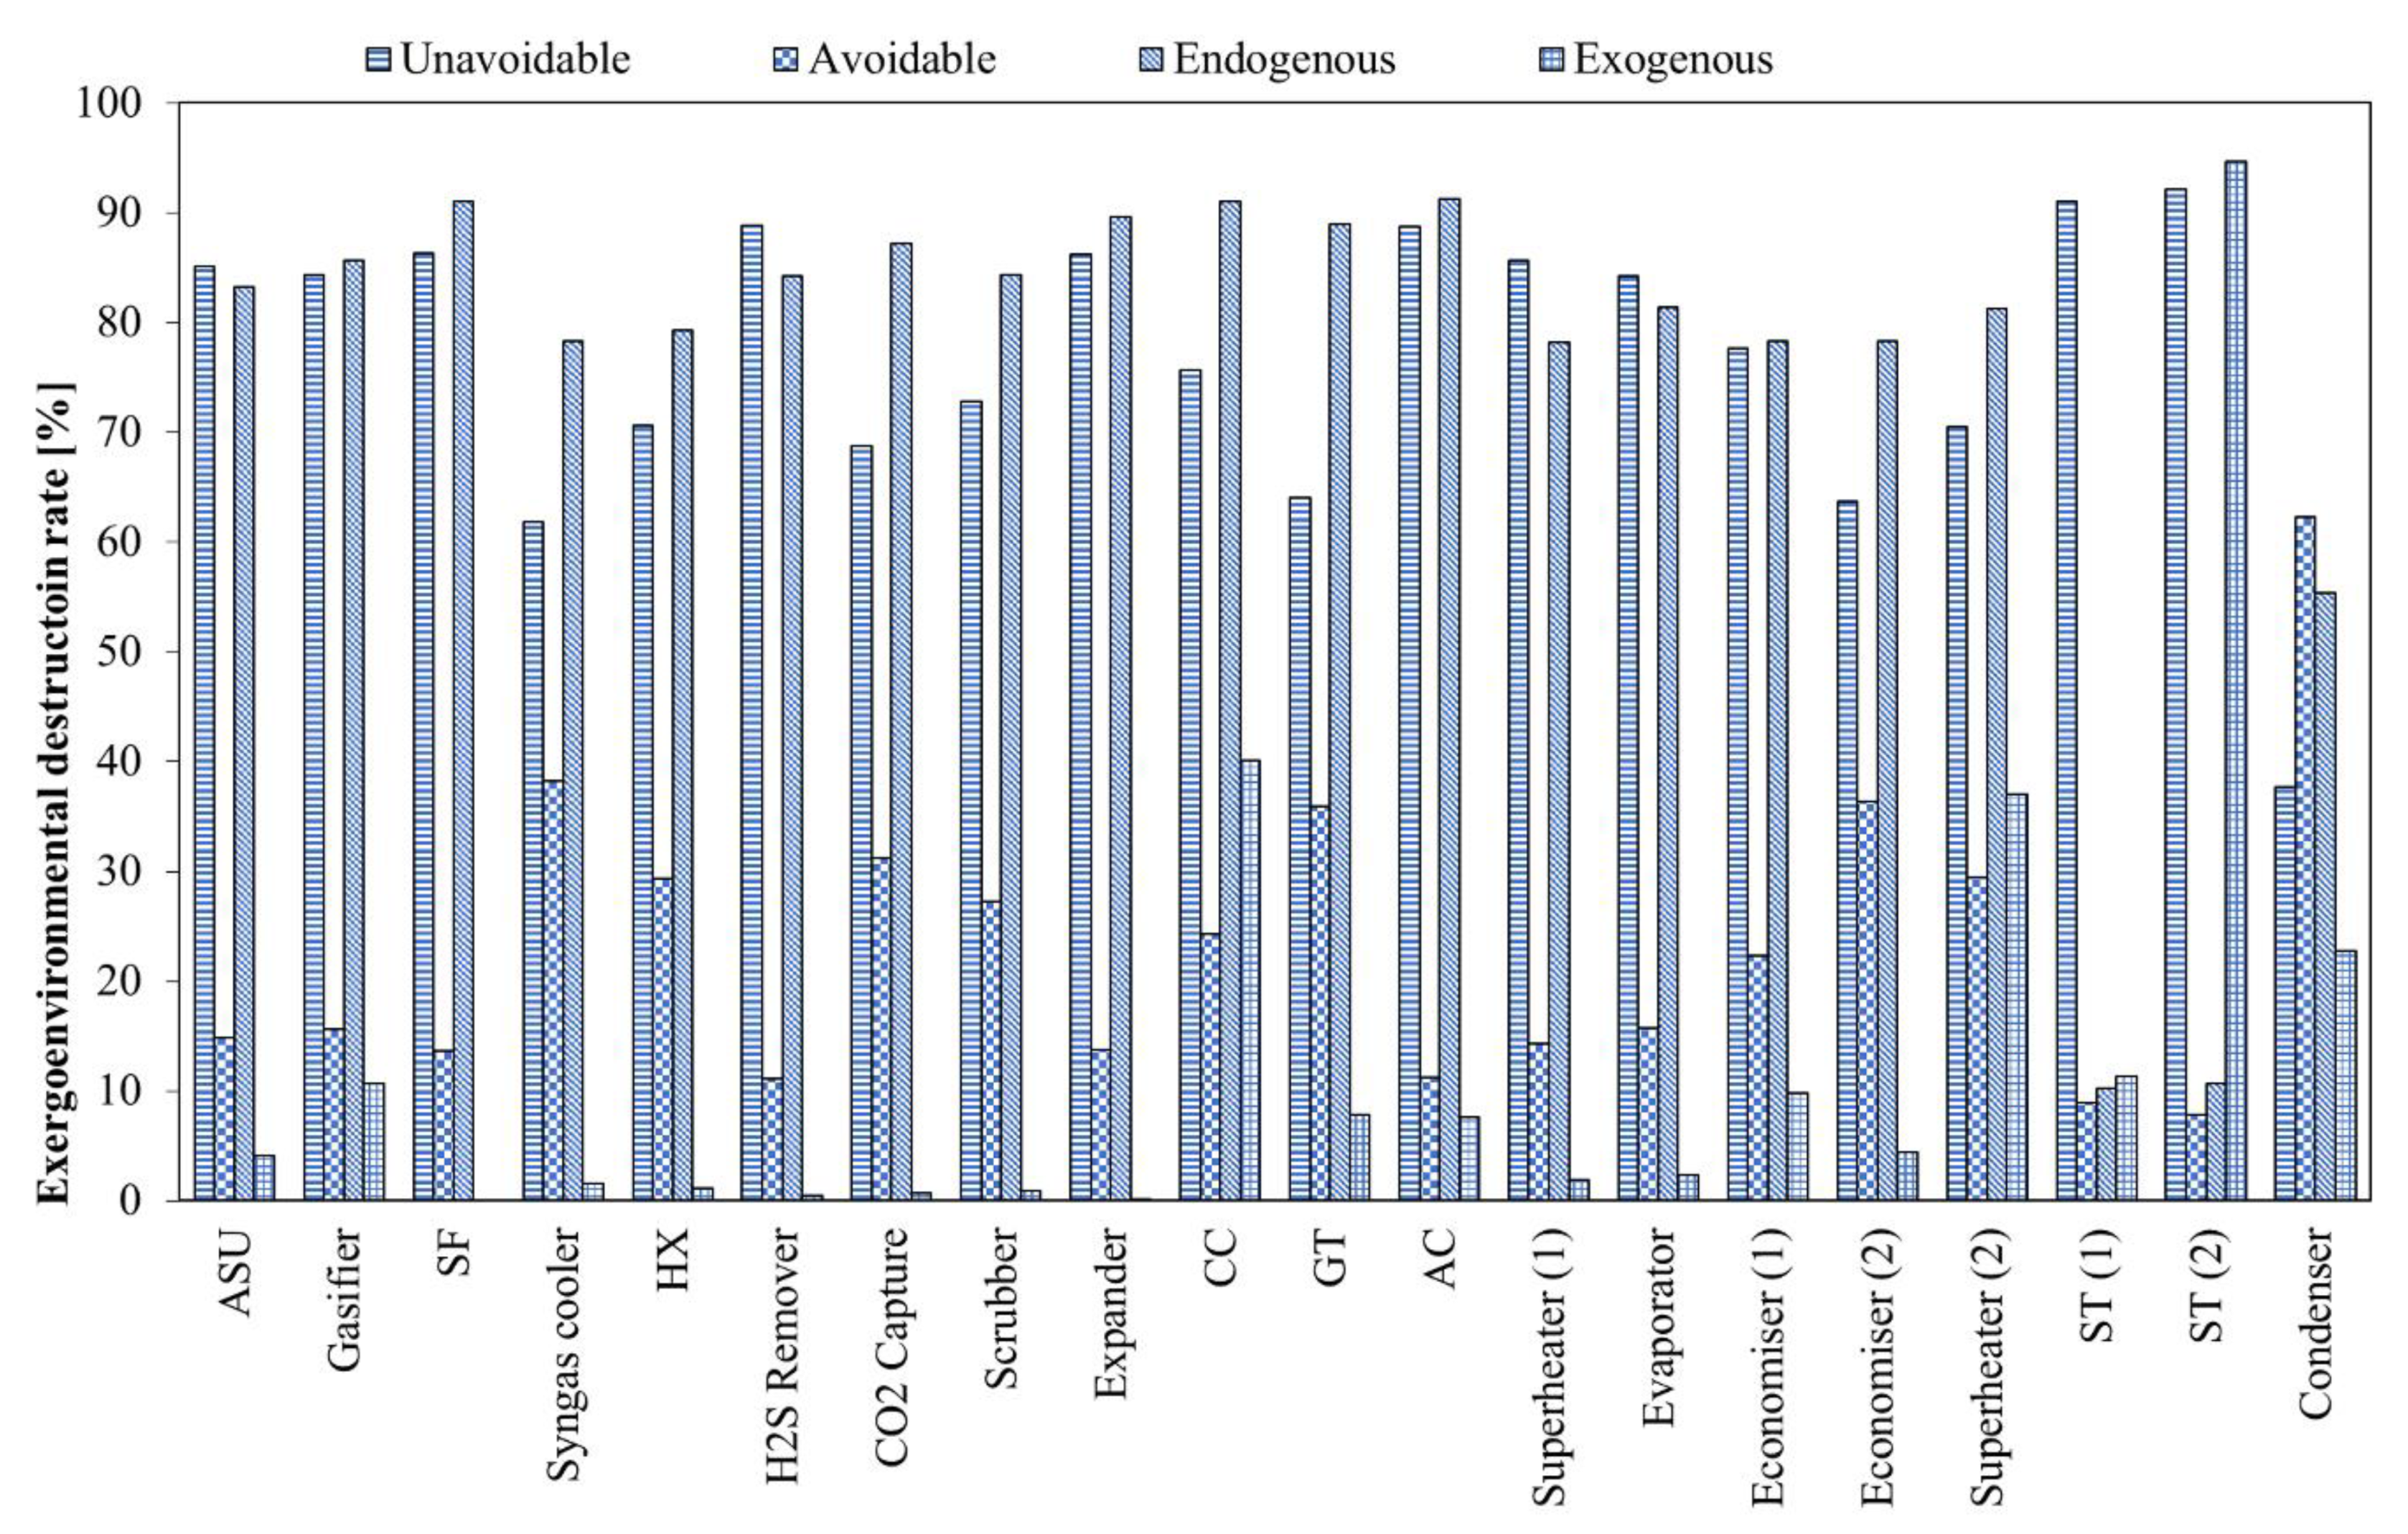
The advanced exergoenvironmental destruction share of equipment is shown in Figure 7. Similarly to the previous results, the condenser had the highest avoidable exergoenvironmental destruction share among the equipment units. Moreover, it is noticeable that the components unavoidable exergoenvironmental destruction share in all equipment was higher than avoidable (except for the condenser). In addition, components with high avoidable exergy destruction such as the condenser, syngas cooler, Economizer 2, and GT can be prioritized for modification to increase the exergoenvironmental efficiency. In this case, this modification can be grounded on the type of equipment used in terms of manufacturing processes and lower weight.
Table 7 presents the ranking of the impact of exergy, exergoeconomic, and exergoenvironmental destruction rate parameters in the conventional and advanced analyses for each equipment used in the ISGC system. This table helps determine the distribution and extent of the maximum exergy destructions and identify the effects in the cost and environmental sections to minimize the exergy losses in the optimization step in terms of the least amount of time and cost.
As shown in the conventional results in Table 7, the highest exergy destruction was related to the CO2 capture unit, while the lowest rate was associated with the syngas cooler and combustion chamber, simultaneously. Regarding the exergoeconomic destruction rate, the highest value was associated with the solar field (20 MW) and the lowest with the combustion chamber (1 MW). For the sum of exergoeconomic destruction and investment cost, the highest amount was related to the expander (20 MW), whereas the lowest one was to the gas turbine (1 MW). For exergoenvironmental impact rate, the solar field had the highest value (20 MW), while the combustion chamber (1 MW) presented the lowest. Finally, for the sum of component and operational exergoenvironmental impact rate, the highest and lowest values were pertinent to the combustion chamber and solar field, respectively. The highest and lowest values herein indicate the strengths and weaknesses of the present cycle that can be used for optimization and future work, where equipment pieces with lower exergy efficiency can be the focal point for future optimization analysis.
In the advanced analysis section, the highest amount of avoidable exergy destruction was associated with the steam turbine 2 (20 MW), while the lowest was attributed to the condenser (1 MW). The steam turbine 1 (20 MW) had the highest endogenous exergy destruction, whereas the solar energy field showed the lowest one. In addition, the highest rate of endogenous exergoeconomic destruction was related to the steam turbine 2 (20 MW), whereas the combustion chamber (1 MW) presented the lowest rate. The highest avoidable exergoenvironmental impact rate was related to the steam turbine 2 (20 MW), while the lowest was associated with the condenser (1 MW). Finally, the highest rate of endogenous exergoenvironmental impact rate was related to the steam turbine 2 (20 MW), whereas the lowest one was to the combustion chamber.

5. Conclusions

This paper investigates a new integrated solar-assisted gasification cycle (ISGC) for producing steam and power utilities from low-cost heavy refinery fuels while enhancing energy efficiency and economic and environmental performance indicators. In the proposed ISGC system, syngas from the gasifier enters the turbine to produce power after purification and separation of pollutants. Then, it is sent to the steam section for thermal energy recovery. In addition, a solar energy field and a two-pressure heat recovery steam generator (HRSG) are integrated into the plant to enhance the overall economic and environmental plant viability. In this new study, the ISGC system was modelled in MATLAB software, and the results were validated using Thermoflex software. Conventional and advanced energy, exergy, exergy-economic, and exergy-environmental (4E) analyses were implemented to evaluate the economic and environmental system performance. In addition, the 4E analyses allowed for the detailed examination of the different system units and the determination of a prioritization order for future optimization and improvement.
The results obtained from the 4E analyses revealed that replacing the coal fuel feed with heavy refinery fuel allows for a slight improvement in the thermal efficiency, from 49.5% to 50%. Moreover, the ratio of exergy destruction to total input exergy was decreased by 4.8% compared to results for the conventional cycle in the literature. The latter result indicated that the proposed ISGC configuration can also reduce the plant investment cost. Besides, the system produced 319.92 MW of power by feeding on 15.5 kg/s of heavy refinery fuel, at a thermal efficiency of 50.01% and exergy efficiency of 53.98%. The results also showed an investment cost of $466 million, gauged at a system cost rate of 446 $/min and an environmental impact rate of 72,796 pts/min. To sum up, these results demonstrate that the proposed ISGC is theoretically viable for converting heavy refinery fuels into syngas and producing power. Therefore, the new approach provides a feasible solution towards reducing environmental impacts related to heavy refinery fuels, particularly for oil-rich countries with high availability of solar resources.
The thermodynamic simulation results show that the computer code developed in MATLAB has high accuracy compared with the Thermoflex software (with overall errors lower than 4.5%). This verification of results is acceptable for steady-state conditions, and high-accuracy is achieved. However, for dynamic and transient analyses, these assumptions are not enough. In this case, the kinetic model must be considered for the gasifier. Additionally, part-load conditions for turbines and compressors should be implemented.
Some recommendations for future research include adding a set of solar collectors to the entrance of the HRSG unit for preheating the inlet water, which could further improve energy efficiency; using pure oxygen produced in the high-pressure air separation unit to feed the combustion chamber (instead of atmospheric air) while eliminating the air compressor since this alternative could lead to higher combustion efficiency and a decrease in investment costs; using different carbon capture technologies; optimizing main design and operating parameters; using a gasifier system with higher temperature and pressure tolerance; and, finally, comprehensive footprint assessment can be performed for improving environmental analysis of a proposed system.

Author Contributions

Conceptualization, M.H.K.M.; methodology, E.J. and M.H.K.M.; software and computer code development, E.J. and M.H.K.M.; validation, E.J.; formal analysis, E.J., M.H.K.M., M.D., and V.C.O.; investigation, E.J., M.H.K.M., and M.D.; resources, M.H.K.M.; data curation, E.J.; writing—original draft preparation, M.D.; writing—review and editing, V.C.O.; visualization, V.C.O.; supervision, M.H.K.M.; project administration, V.C.O.; funding acquisition, V.C.O. All authors have read and agreed to the published version of the manuscript.

Funding

This research received no external funding.

Institutional Review Board Statement

Not applicable.

Informed Consent Statement

Not applicable.

Data Availability Statement

Not applicable.

Conflicts of Interest

The authors declare no conflict of interest.

Nomenclature

Aarea
ACair compressor
ASUAir separation unit
b i exergoenvironmental impact
Benvironmental impact
B ˙ environmental coefficient
bmenvironmental coefficient (per mass)
Cexergy destruction cost rate
CCcombustion chamber
CCHPcombined cooling heat and power
CHPcombined heat and power
C ˙ cost rate
CONDcondenser
Cpspecific heat capacity
CRFcapital recovery factor
E ˙ exergy rate
Erexpansion ratio
Exspecific exergy
EXPexpander
E ˙ x exergy rate
Feconomic factor
Fbexergoeconomic factor
GASIgasifier
GTgas turbine
Henthalpy
HRSGheat recovery steam generator
HXheat exchanger
IGCCintegrated gasification combined cycle
ISGCintegrated solar-gasification cycle
LCAlife cycle assessment
LHVlow heating value
Nsystem lifetime
m ˙ mass flow rate
Ppressure
PECpurchase equipment cost
SFsolar field
Ttemperature
TITturbine inlet temperature
Ttemperature
TECthermo-ecological cost
Wwork
w k weight
x molar ratio
Xhumidity ratio
Yenvironmental coefficient
Y ˙ component environmental impact rate
Z ˙ investment cost rate
Greek letters
β fuel exergy over LHV
Δdifference
ε exergy efficiency
ρdensity
Φ maintenance factor
Subscripts
0ambient conditions
Condcondenser
EXPexpander
Ffuel
iith stream
kkth equipment
GASIgasifier
GCgasification cycle
GTgas turbine
Lloss
Pproduct
SHsuperheater
yenvironmental coefficient
Superscripts
AVavoidable
CHChemical
ENendogenous
EXexogenous
ninterest rate
PHPhysical
UNunavoidable

Appendix A

Table A1. Thermodynamic relations: process operating conditions and unknown parameters used for modelling the different ISGC system components.
Comp.RelationsProcess ConditionsUnknown Parameters
ASU W A S U a i r = m ˙ a i r ( h o u t h i n ) h o u t = h i n + v i n ( P o u t P i n ) W A S U , O 2 = m ˙ O 2 ( h o u t h i n ) h o u t = h i n + v i n ( P o u t P i n ) T i n = 15 ° C , P i n = 1.013   bar m a i r = 121.3   kg / s T o u t = 129.1   ° C ,   P o u t = 39   bar W ˙ A S U
Gasifier i n ω i n × m ˙ i n = o u t ω o u t × m ˙ o u t Q i n + i n m ˙ h = Q o u t + o u t m ˙ h η G = L H V s y n g a s × m ˙ s y n g a s L H V f u e l × m ˙ f u e l i n m ˙ = 79.6   kg / s L H V f u e l = 22,054.8   kJ / kg L H V s y n g a s = 9549.7   kJ / kg η G m ˙ s y n g a s
Humidifier i n φ i n × m ˙ i n = o u t φ o u t × m ˙ o u t φ = m ˙ v m ˙ a m ˙ i n = 124.73   kg / s φ i n = 0.862 m ˙ o u t ω o u t
Sulfur Remover i n φ i n × m ˙ i n = o u t φ o u t × m ˙ o u t λ = m ˙ H 2 S m ˙ s y n g a s m ˙ i n = 67.15   kg / s λ i n = 0.0025 m ˙ o u t λ o u t
CO2 Capture m ˙ C O 2. i n = x C O 2 M C O 2 x C O 2 M C O 2 + x O 2 M O 2 + x H 2 O M H 2 O + x N 2 M N 2 × m f g m ˙ C O 2. o u t = η C O 2 C a p t u r e m ˙ C O 2. i n Q i n , C O 2 C a p t u r e = 4.02 × ( η C O 2 C a p t u r e × 100 0.00179 ) E L C O 2 C a p t u r e = 46.99 + 0.492 × η C O 2 C a p t u r e × 100 W C O 2 C a p t u r e = 0.44 × ( η C O 2 C a p t u r e × 100 0.000179 ) T 36 = T 4 = T 37 P 36 = P 4 T 4 ,   P 4 η C O 2 C a p t u r e m ˙ C O 2 . i n m ˙ C O 2 . o u t Q i n , C O 2 C a p t u r e E L C O 2 C a p t u r e W C O 2 C a p t u r e
Solar Field P 12 = P 9 ( 1 d p S F ) Q S F = m 9 ( h 12 h 9 ) A S F = Q ˙ S F η S F × G T S = ( T 9 + T 12 ) / 2 d p S F η S F Q S F P 12 A S F T S
Air Compressor W A C = m ˙ a i r ( h o u t h i n ) P o u t = P i n × r p , A C h i n = h a i r @ T i n , h o u = h a i r @ T o u t T o u t = T i n × ( 1 + 1 η A C ( r p , A C γ a i r 1 γ a i r 1 ) ) T i n = 25 ° C   , P i n = 1.013   bar r p , A C = 15.22 c a i r = 1.005   kJ / kg · k γ a i r = 1.4 η A C = 0.87 W A C P 2
Combustion Chamber m ˙ a i r h a i r + m ˙ s y n g a s L H V s y n g a s η C C m ˙ f g h f g = 0 m ˙ a i r + m ˙ s y n g a s m ˙ f g = 0 P o u t = P i n ( 1 Δ P C C ) L H V s y n g a s = 8976.8   kJ / kg T i n = 396.9 ° C , P i n = 15.426   bar Δ P C C = 0.04 m ˙ a i r = 492   kg / s η C C = 95 % T o u t , P o u t m ˙ s y n g a s , m ˙ f g
Gas Turbine W G T = m ˙ f g ( h i n h o u t ) T o u t = T i n × ( 1 η G T ( 1 r p , G T 1 γ a i r γ a i r ) ) P o u t = P i n +   Δ P H R S G , f g W n e t , g c = W G T W A C T 3 = 1300 ° C , P 3 = 14.833   bar m ˙ f g = 563.1   kg / s η G T = 88 % r p , G T = 14.52 W G T T 20
Superheater 1 m ˙ f g ( h 35 h 23 ) + m ˙ h p ( h 33 h 32 ) = 0 P 23 = P 35 Δ P H P S H , f g P 33 = P 32 Δ P H P S H , s Q H P S H = m ˙ h p ( h 33 h 32 ) h 32 = h w a t e r @ T 32 , P 32 Δ P H P S H , f g = 2.491   millibar Δ P H P S H , s = 2.41   millibar T H P S H = 535 ° C T 32 = 326.2 ° C P 32 = 122.4   bar Q H P S H T 23 , P 23 T 33 , P 33 m ˙ h p
Superheater 2 m ˙ f g ( h 15 h 13 ) + m ˙ h p ( h 38 h 40 ) = 0 P 38 = P 40 Δ P H P S H , f g P 13 = P 15 Δ P H P S H , s Q H P S H = m ˙ h p ( h 38 h 40 ) T 15 = 608 ° C , P 15 = 0.88   bar Δ P H P S H , f g = 2.491   millibar Δ P H P S H , s = 2.41   millibar T 40 = 351.28   ° C P 40 = 39.78   bar Q H P S H T 13 , P 13 T 38 , P 38 m ˙ h p 2
Evaporator m ˙ f g ( h 23 h 30 ) + m ˙ h p ( h 32 h 31 ) = 0 P 30 = P 23 Δ P H P E V , f g P 32 = P 31 Δ P H P E V , s Q H P E V = m ˙ h p ( h 32 h 31 ) T 20 = 556.8 ° C , P 20 = 1.0205   bar Δ P H P E C , f g = 2.4911   millibar Δ P H P E C , s = 2.4481   milli T 24 = 260 ° C , P 24 = 122.4   bar Δ P H P E V , f g = 4.9811   millibar Q H P E V T 23 , P 23
Economizer 1 m ˙ f g ( h 30 h 18 ) + m ˙ h p ( h 31 h 41 ) = 0 P 18 = P 30 Δ P H P E C 2 , f g P 41 = P 31 Δ P H P E C 2 , s T 26 = T s a t @ P 26 Q H P E C 2 = m ˙ h p ( h 24 h 26 ) T 41 = 340.5 ° C , P 6 = 1.0155   bar Δ P H P E C , f g = 2.4911   millibar Δ P H P E C , s = 2.4481   millibar T 30 = 366.8 ° C , P 28 = 0.88   bar Q H P E C 2 T 41 , P 41 T 18 , P 18
Economizer 2 m ˙ f g ( h 13 h 25 ) + m ˙ h p ( h 11 h 1 ) = 0 T 1 = T s a t @ P 1 Q H P E C 2 = m ˙ h p ( h 11 h 1 ) P 31 = 122.4   bar T 31 = 310.4   ° C Δ P H P E C , f g = 2.4911   millibar Δ P H P E C , s = 2.4481   millibar Q H P E C 2 T 11 ,   P 11 T 25 , P 25
Steam Turbine 1 m ˙ 33 h 33 m ˙ 27 h 27 W S T 1 = 0 h 27 = h 33 η S T ( h 33 h 27 ) m ˙ 33 m ˙ 27 = 0 η S T = 88 % W S T 1 T 27 , P 27
Steam Turbine 2 m ˙ 38 h 38 m ˙ 21 h 21 W S T 2 = 0 h 21 = h 38 η S T ( h 38 h 21 s ) m ˙ 38 m ˙ 21 = 0 η S T = 88 % W S T 2 T 21 , P 21
Condenser m ˙ f w ( h 21 h 22 ) + m ˙ c w ( h 39 h 29 ) = 0 Q c o n d = m ˙ f w ( h 21 h 22 ) T 39 = T 29 + Δ T C W P 39 = P 29 Δ P c o n d T 21 = 38.74 ° C ,     P 21 = 0.07   bar T 29 = 25 ° C , P 29 = 1.023   bar Δ T C W = 15.5 ° C Q c o n d m ˙ c w T 21 , P 21 T 39 , P 39
Expander W E X = m × c p × ( T 28 T 16 ) m = 28.29   kg / s T 28 = 519.05 ° C C P = 1.62   kJ / kg · K W E X T 16
Figure A1. Schematic of computational procedure for 4E and advanced exergy-based analyses.
Energies 14 08409 g0a1
Table A2. Exergy destruction and exergy efficiency formulation [17].
ComponentExergy DestructionExergy Efficiency
Air separation unit E x 14 E x 5 + W A S U E x 5 E x 14 W A S U
Solar field E x 9 E x 12 + E x S F E x 12 E x 9 E x S F
Gasifier E x 5 + E x 12 + E x 8 E x g a s i E x g a s i E x 5 + E x 12 + E x 8
Syngas cooler E x g a s i + E x 11 E x 6 E x 34 E x 34 E x 11 E x g a s i E x 6
Heat exchanger E x 6 + E x 19 E x 10 E x 28 E x 28 E x 19 E x 6 E x 10
H2S remover E x 10 E x 17 E x 4 E x 17 E x 10 E x 4
CO2 capture E x 4 E x 37 E x 36 E x 37 E x 4 E x 36
Humidifier E x 36 + E x 7 E x 19 E x H u m i d i f i e r E x s c r _ o u t + E x 19 E x 7 + E x 36
Expander E x 28 E x 16 W e x p W E x p E x 28 E x 16
Combustion chamber E x a c o u t E x c c o u t + E x 16 E x c c o u t E x a c o u t + E x 16
Air compressor E x 14 E x a c o u t + W A C E x a c o u t E x 14 W A C
Gas turbine E x c c o u t E x 20 W G T W G T E x c c o u t E x 20
Superheater E x 35 + E x 32 E x 23 E x 33 E x 33 E x 32 E x 35 E x 23
Evaporator E x 23 + E x 31 E x 30 E x 32 E x 32 E x 31 E x 23 E x 30
HRSG E x 42 + E x 30 E x 18 E x 31 E x 31 E x 42 E x 30 E x 18
Steam turbine E x 33 E x 27 W S T W S T E x 33 E x 27
Condenser E x 29 + E x 21 E x 39 E x 22 E x 39 E x 29 E x 21 E x 22
HRSG: Heat recovery steam generator.
Table A3. Purchase equipment cost for the different ISGC system components [17].
ComponentPurchase Equipment Cost Relations
ASU P E C A S U = ( R e f   C o s t ) × ( S i z e R e f   S i z e ) S c a l l i n g   E x p o n e n t × ( O v e r a l   I n s t a l l a t i o n   F a c t o r ) S c a l l i n g   E x p o n e n t = 0.5 , O v e r a l   I n s t a l l a t i o n   F a c t o r = 1 R e f   C o s t = 141 M i l l i o n   U S $ R e f   S i z e = 52 kg   O 2 / s
Solar field P E C S o l a r f i e l d = 355   $ / m 2
Gasifier P E C G A S I = ( R e f   C o s t )   × ( S i z e R e f   S i z e ) S c a l l i n g   E x p o n e n t × ( O v e r a l   I n s t a l l a t i o n   F a c t o r ) S c a l l i n g   E x p o n e n t = 0.7 , O v e r a l   I n s t a l l a t i o n   F a c t o r = 1 R e f   C o s t = 395 M i l l i o n   U S $ , R e f   S i z e = 68.5 kg   feed / s
Syngas cooler P E C S y n _ c o o l e r = 12,000 ( A 100 ) 0.6
Heat exchanger P E C H X = 12,000 ( A 100 ) 0.6
H2S/CO2 remover P E C Cleaner = ( R e f   C o s t )   × ( S i z e R e f   S i z e ) S c a l l i n g   E x p o n e n t × ( O v e r a l   I n s t a l l a t i o n   F a c t o r ) S c a l l i n g   E x p o n e n t = 0.63 , O v e r a l   I n s t a l l a t i o n   F a c t o r = 1.55 R e f   C o s t = 28.8 M i l l i o n   U S $ , R e f   S i z e = 2.48 k m o l e   feed / s
Expansion turbine P E C E x p a n d e r = W T u r b ( 1318.5 98.328   l n ( W T u r b ) )
Combustion chamber P E C C C = 28.98 m a 0.995 p o u t p i n . ( 1 + e ( 0.015 ( T o u t 1540 ) ) )
Air compressor P E C C o m p r e s s o r = 44.71 m a . r p , A C . ln ( r p , A C ) . 1 0.95 η A C
Gas turbine P E C G T = 479.34 m f g 0.93 η G T . ln ( r p , G T ) . ( 1 + e ( 0.036 T i n 54 . 4 ) )
HRSG P E C H R S G = 6570 [ ( Q E C Δ T E C ) 0.8 + ( Q E V Δ T E V ) 0.8 + ( Q S H Δ T S H ) 0.8 ] + 21,276 m w + 1184.4 m f g 1.2
Steam turbine P E C S T = 2210 . W ˙ 0.7
Condenser P E C C o n d = 1773 . m ˙
HRSG: Heat recovery steam generator.
Table A4. Exergoeconomic formulation for the different ISGC system components [17].
ComponentExergoeconomic Balance
Air separation unit Z ˙ A S U = C 5 × E x 5 C G T × W A S U
Solar field Z ˙ Q S F = C 12 × E x 12
Gasifier Z ˙ G A S I + C 8 × E x 8 = C G A S I × E x G A S I C 5 × E x 5 C 12 × E x 12
Syngas cooler Z ˙ s y n c o o l e r + C G A S I ( E x G A S I E x 6 ) = C 34 × E x 34
Heat exchanger Z ˙ H X = C G A S I ( E x 10 E x 4 ) C 19 × E x 19 + C 28 × E x 28
H2S remover Z ˙ H 2 S _ Re m o v e r = C G A S I ( E x 17 E x 10 ) + C 4 × E x 4
CO2 capture Z ˙ C O 2 _ C a p t u r e = C 4 ( E x 37 E x 4 ) + C 36 × E x 36
Humidifier Z ˙ S C R = C 19 × E x 19 C 36 × E x 36
Expander Z ˙ E X P = C 28 ( E x 16 E x 28 ) + C E X P × W E X P
Combustion chamber Z ˙ C C = C c c o u t × E x c c o u t C 28 × E x 16 C a c o u t × E x a c o u t
Air compressor Z ˙ A C = C a c o u t × E x a c o u t C G T × W A C
Gas turbine Z ˙ G T = C c c o u t ( E x 20 E x c c o u t ) + C G T × W G T
Superheater Z ˙ S H + C 20 ( E x 35 E x 23 ) = C 33 × E x 33 C 32 × E x 32
Evaporator Z ˙ E V + C 20 ( E x 23 E x 30 ) = C 32 × E x 32 C 31 × E x 31
HRSG Z ˙ E c o + C 20 × E x 30 = C 31 × E x 31
Steam turbine Z ˙ S T = C 33 ( E x 27 E x 31 ) + C S T × W S T
Condenser Z ˙ C o n d = C 38 ( E x 22 E x 21 ) + C 39 × E x 39
HRSG: Heat recovery steam generator.
Table A5. Weight of different system components [36,41].
ComponentWeight (tons)
Air separation unit W A S U = 0.0061 × W ˙ ASU Total 0.95   ; W ˙   in   kw
Solar field W c o l l = 0.0626 .   L ( l e n g t h )   ; L   in   m
Gasifier W G a s i f i e r = 100 × P e × d G a s i f i e r × F S G a s i f i e r 2 × σ G a s i f i e r FS G a s i f i e r = 2 :   safety   factor of   G a s i f i e r σ G a s i f i e r = 45 :   rupturing   stress   of   G a s i f i e r in   MPa d Gasifier : diameter   considering m ˙   and   velocity = 6.2   m / s
Syngas cooler W syn _ cooler = 13.91 ( Q syn _ cooler / 1000 ) 0 . 68 ;
Heat exchanger W H X = 2.989 × Q ˙ H X 0.97 ; Q ˙ in MW
H2S/CO2 remover W remover = 2 . 49 × m s y n 0.7
Expander W E X P = 100 × P e × d E X P × F S E X P 2 × σ E X P FS E X P = 2 :   safety   factor   of   E X P σ E X P = 6 :   rupturing   stress   of   E X P   in   MPa d EXP : diameter   considering m ˙   and   velocity = 13   m / s
Combustion chamber W C C = 100 × P e × d C C × F S C C 2 × σ C C FS C C = 2 :   safety   factor   of   CC σ C C = 45 :   rupturing   stress   of   CC   in   MPa d CC : diameter   considering m ˙   and   velocity = 6.2   m / s
Air compressor W A C = 100 × P e × d A C × F S A C 2 × σ A C FS A C = 2 :   safety   factor   of   AC σ A C = 16 :   rupturing   stress   of   AC   in   MPa d AC : diameter   considering m ˙   and   velocity = 15   m / s
Gas turbine W G T = 100 × P e × d G T × F S G T 2 × σ G T FS G T = 2 :   safety   factor   of   GT σ G T = 6 :   rupturing   stress   of   GT   in   MPa d GT : diameter   considering m ˙   and   velocity = 13   m / s
Superheater W S H = 8.424 × Q ˙ S H 0.87 ; Q ˙ in MW
Evaporator W E V = 13.91 × Q ˙ E V 0.68 ; Q ˙ in MW
HRSG W E C = 2.989 × Q ˙ E C 0.97 ; Q ˙ in MW
Steam turbine W S T = 4.9 × W ˙ S T 0.73
Condenser W cond = 0.073 × Q ˙ 0.99 ; Q ˙ in MW
HRSG: Heat recovery steam generator.
Table A6. Environmental impact rate formulation for the different ISGC system components [17].
ComponentEnvironmental Impact Rate Balances
Air separation unit W A S U = b 5 × E x 5 b G T × W ˙ A S U
Solar field W S o l a r F i e l d = b 12 × E x 12
Gasifier W G A S I + b 8 × E x 8 = b G A S I × E x G A S I b 5 × E x 5 b 12 × E x 12
Syngas cooler W s y n c o o l e r + b G A S I ( E x G A S I E x 6 ) = b 34 × E x 34
Heat exchanger W H X = b G A S I ( E x 10 E x 4 ) b 19 × E x 19 + b 28 × E x 28
H2S remover W H 2 S _ Re m o v e r = b G A S I ( E x 17 E x 10 ) + b 4 × E x 4
CO2 capture W C O 2 _ C a p t u r e = b 4 ( E x 37 E x 4 ) + b 36 × E x 36
Humidifier W S C R = b 19 × E x 19 b 36 × E x 36
Expander W E X P = b 28 ( E x 16 E x 28 ) + b E X P × W ˙ E X P
Combustion chamber W C C = b c c o u t × E x c c o u t b 28 × E x 16 b a c o u t × E x a c o u t
Air compressor W A C = b a c o u t × E x a c o u t b G T × W ˙ A C
Gas turbine W G T = b c c o u t ( E x 20 E x c c o u t ) + b G T × W ˙ G T
Superheater W S H + b 20 ( E x 35 E x 23 ) = b 33 × E x 33 b 32 × E x 32
Evaporator W E V + b 20 ( E x 23 E x 30 ) = b 32 × E x 32 b 31 × E x 31
HRSG W E c o + b 20 × E x 30 = b 31 × E x 31
Steam turbine W S T = b 33 ( E x 27 E x 31 ) + b S T × W ˙ S T
Condenser W C o n d = b 38 ( E x 22 E x 21 ) + b 39 × E x 39
HRSG: Heat recovery steam generator.

References

  1. Kamińska-Pietrzak, N.; Smoliński, A. Selected environmental aspects of gasification and co-gasification of various types of waste. J. Sustain. Min. 2013, 12, 6–13. [Google Scholar] [CrossRef] [Green Version]
  2. Bany Ata, A.; Seufert, P.M.; Heinze, C.; Alobaid, F.; Epple, B. Optimization of integrated gasification combined-cycle power plant for polygeneration of power and chemicals. Energies 2021, 14, 7285. [Google Scholar] [CrossRef]
  3. Muhammad, A.; Muhammad, Z.; Ullah, A.; Muhammad, R.; Ramzan, N. Thermo-economic analysis of integrated gasification combined cycle co-generation system with carbon capture and integrated with absorption refrigeration system. Energy Convers. Manag. 2021, 248, 114782. [Google Scholar] [CrossRef]
  4. Ren, S.; Feng, X.; Wang, Y. Emergy evaluation of the integrated gasification combined cycle power generation systems with a carbon capture system. Renew. Sustain. Energy Rev. 2021, 147, 111208. [Google Scholar] [CrossRef]
  5. Szima, S.; Arnaiz del Pozo, C.; Cloete, S.; Chiesa, P.; Jiménez Alvaro, Á.; Cormos, A.M.; Amini, S. Finding synergy between renewables and coal: Flexible power and hydrogen production from advanced IGCC plants with integrated CO2 capture. Energy Convers. Manag. 2021, 231, 113866. [Google Scholar] [CrossRef]
  6. Liu, K.; Song, C.; Subramani, V. Hydrogen and syngas production and purification technologies. Hydrog. Syngas Prod. Purif. Technol. 2009, 1, 1–533. [Google Scholar] [CrossRef]
  7. Wang, T.; Stiegel, G. Integrated Gasification Combined Cycle (IGCC) Technologies; Elsevier: Amsterdam, The Netherlands, 2016. ISBN 978008100 1851.
  8. Hoang, T.-D.; Pawluskiewicz, D.K. The efficiency analysis of different combined cycle power plants based on the impact of selected parameters. Int. J. Smart Grid Clean Energy 2016, 5, 77–85. [Google Scholar] [CrossRef]
  9. Hamour, N.; Bidarian, A.; Sandall, O.C. Simultaneous absorption of H2s and CO2 into Aqueous Methyldiethanolamine. Sep. Sci. Technol. 2012, 22, 921–947. [Google Scholar] [CrossRef]
  10. Marcantonio, V.; Bocci, E.; Ouweltjes, J.P.; Del Zotto, L.; Monarca, D. Evaluation of sorbents for high temperature removal of tars, hydrogen sulphide, hydrogen chloride and ammonia from biomass-derived syngas by using Aspen Plus. Int. J. Hydrog. Energy 2020, 45, 6651–6662. [Google Scholar] [CrossRef]
  11. Hasegawa, T.; Sato, M.; Katsuki, Y.; Hisamatsu, T. Study of medium-btu fueled gas turbine combustion technology for reducing both fuel-nox and thermal-nox emissions in oxygen-blown IGCC. ASME. Int. Gas Turbine Inst. 2009, 1, 239–256. [Google Scholar] [CrossRef]
  12. Nag, P.K.; De, S. Study of thermodynamic performance of an integrated gasification combined cycle power plant. PIME J. Power Energy 1998, 212, 89–95. [Google Scholar] [CrossRef]
  13. Emun, F.; Gadalla, M.; Jiménez, L. Integrated Gasification Combined Cycle (IGCC) Process Simulation and Optimization. In Computer Aided Chemical Engineering; Elsevier: Amsterdam, The Netherlands, 2008; pp. 1059–1064. [Google Scholar]
  14. Domenichini, R.; Gallio, M.; Lazzaretto, A. Combined production of hydrogen and power from heavy oil gasification: Pinch analysis, thermodynamic and economic evaluations. Energy 2010, 35, 2184–2193. [Google Scholar] [CrossRef]
  15. Morini, M.; Pinelli, M.; Spina, P.R.; Vaccari, A.; Venturini, M. Feasibility analysis of gas turbine inlet air cooling by means of liquid nitrogen evaporation for IGCC power augmentation. Appl. Therm. Eng. 2015, 80, 168–177. [Google Scholar] [CrossRef]
  16. Zhang, Y.; Ahn, H. The implications of choice between sour and sweet shift on process design and operation of an IGCC power plant integrated with a dual-stage selexol unit. Energy 2019, 173, 1273–1284. [Google Scholar] [CrossRef] [Green Version]
  17. Khoshgoftar Manesh, M.H.; Jadidi, E. Conventional and Advanced Exergy, Exergoeconomic and Exergoenvironmental Analysis of a Biomass Integrated Gasification Combined Cycle Plant. In Energy Sources, Part A Recovery Utilization and Environmental. Effects; Taylor and Francis Ltd.: London, UK, 2020; pp. 1–22. [Google Scholar] [CrossRef]
  18. Jia, J.; Abudula, A.; Wei, L.; Sun, B.; Shi, Y. Thermodynamic modeling of an integrated biomass gasification and solid oxide fuel cell system. Renew. Energy 2015, 81, 400–410. [Google Scholar] [CrossRef]
  19. Doherty, W.; Reynolds, A.; Kennedy, D. Process simulation of biomass gasification integrated with a solid oxide fuel cell stack. J. Power Sources 2015, 277, 292–303. [Google Scholar] [CrossRef] [Green Version]
  20. Chen, S.; Lior, N.; Xiang, W. Coal gasification integration with solid oxide fuel cell and chemical looping combustion for high-efficiency power generation with inherent CO2 capture. Appl. Energy 2015, 146, 298–312. [Google Scholar] [CrossRef]
  21. Wang, J.-J.; Yang, K.; Xu, Z.-L.; Fu, C. Energy and exergy analyses of an integrated CCHP system with biomass air gasification. Appl. Energy 2015, 142, 317–327. [Google Scholar] [CrossRef]
  22. Athari, H.; Soltani, S.; Bölükbaşi, A.; Rosen, M.A.; Morosuk, T. Comparative exergoeconomic analyses of the integration of biomass gasification and a gas turbine power plant with and without fogging inlet cooling. Renew. Energy 2015, 76, 394–400. [Google Scholar] [CrossRef]
  23. Perna, A.; Minutillo, M.; Jannelli, E. Hydrogen from intermittent renewable energy sources as gasification medium in integrated waste gasification combined cycle power plants: A performance comparison. Energy 2016, 94, 457–465. [Google Scholar] [CrossRef]
  24. Yari, M.; Mehr, A.S.; Mahmoudi, S.M.S.; Santarelli, M. A comparative study of two SOFC based cogeneration systems fed by municipal solid waste by means of either the gasifier or digester. Energy 2016, 114, 586–602. [Google Scholar] [CrossRef]
  25. Lv, X.; Liu, X.; Gu, C.; Weng, Y. Determination of safe operation zone for an intermediate-temperature solid oxide fuel cell and gas turbine hybrid system. Energy 2016, 99, 91–102. [Google Scholar] [CrossRef] [Green Version]
  26. Thattai, A.T.; Oldenbroek, V.; Schoenmakers, L.; Woudstra, T.; Aravind, P.V. Experimental model validation and thermodynamic assessment on high percentage (up to 70%) biomass co-gasification at the 253 MW integrated gasification combined cycle power plant in Buggenum, The Netherlands. Appl. Energy 2016, 168, 381–393. [Google Scholar] [CrossRef] [Green Version]
  27. Khani, L.; Mahmoudi, S.M.S.; Chitsaz, A.; Rosen, M.A. Energy and exergoeconomic evaluation of a new power/cooling cogeneration system based on a solid oxide fuel cell. Energy 2016, 94, 64–77. [Google Scholar] [CrossRef]
  28. Park, S.; Kim, J.; Yoon, M.; Rhim, D.; Yeom, C. Thermodynamic and economic investigation of coal-fired power plant combined with various supercritical CO2 Brayton power cycle. Appl. Therm. Eng. 2018, 130, 611–623. [Google Scholar] [CrossRef]
  29. Zhang, G.; Yang, Y.; Jin, H.; Xu, G.; Zhang, K. Proposed combined-cycle power system based on oxygen-blown coal partial gasification. Appl. Energy 2013, 102, 735–745. [Google Scholar] [CrossRef]
  30. Gharagheizi, F.; Mehrpooya, M. Prediction of standard chemical exergy by a three descriptors QSPR model. Energy Convers. Manag. 2007, 48, 2453–2460. [Google Scholar] [CrossRef]
  31. Lazzaretto, A.; Tsatsaronis, G. SPECO: A systematic and general methodology for calculating efficiencies and costs in thermal systems. Energy 2006, 31, 1257–1289. [Google Scholar] [CrossRef]
  32. Dincer, I.; Rosen, M.A.; Ahmadi, P. Optimization of Energy Systems; Wiley: New York, NY, USA, 2017. [Google Scholar]
  33. Bejan, A.; Tsatsaronis, G.; Moran, M.J. Thermal Design and Optimization; Wiley: New York, NY, USA, 1996. [Google Scholar]
  34. Cao, Y.; Dhahad, H.A.; Sun, Y.-L.; Abdollahi Haghghi, M.; Delpisheh, M.; Athari, H.; Farouk, N. The role of input gas species to the cathode in the oxygen-ion conducting and proton conducting solid oxide fuel cells and their applications: Comparative 4E analysis. Int. J. Hydrog. Energy 2021. [Google Scholar] [CrossRef]
  35. Goedkoop, M.; Spriensma, R.; Effting, S.; Collignon, M. The Eco-Indicator 99: A Damage Oriented Method for Life-Cycle Impact Assessment: Methodology Report, 3rd ed.; PRé Consultants: Amersfoort, The Netherlands, 2001. [Google Scholar]
  36. Cavalcanti, E.J.C. Exergoeconomic and exergoenvironmental analyses of an integrated solar combined cycle system. Renew. Sustain. Energy Rev. 2017, 67, 507–519. [Google Scholar] [CrossRef]
  37. Razi, F.; Dincer, I.; Gabriel, K. Exergoenvironmental analysis of the integrated copper-chlorine cycle for hydrogen production. Energy 2021, 226, 120426. [Google Scholar] [CrossRef]
  38. Mehrpooya, M.; Raeesi, M.; Pourfayaz, F.; Delpisheh, M. Investigation of a hybrid solar thermochemical water-splitting hydrogen production cycle and coal-fueled molten carbonate fuel cell power plant. Sustain. Energy Technol. Assess. 2021, 47, 101458. [Google Scholar] [CrossRef]
  39. Tsatsaronis, G. Recent developments in exergy analysis and exergoeconomics. Int. J. Exergy 2008, 5, 489–499. [Google Scholar] [CrossRef]
  40. Kelly, S.; Tsatsaronis, G.; Morosuk, T. Advanced exergetic analysis: Approaches for splitting the exergy destruction into endogenous and exogenous parts. Energy 2009, 34, 384–391. [Google Scholar] [CrossRef]
  41. Boyano, A.; Morosuk, T.; Blanco-Marigorta, A.M.; Tsatsaronis, G. Conventional and advanced exergoenvironmental analysis of a steam methane reforming reactor for hydrogen production. J. Clean. Prod. 2012, 20, 152–160. [Google Scholar] [CrossRef]
Figure 1. Schematic diagram of the proposed integrated solar-gasification cycle (ISGC) system (this diagram is adapted from Ref. [17]). AC: Air compressor; CC: Combustion chamber; HRSG: Heat recovery steam generator; GT: Gas turbine; ST: steam turbine.
Energies 14 08409 g001
Figure 2. Share of exergy destruction for the different ISGC system components. AC: Air compressor; Cond: Condenser; CC: Combustion chamber; GT: Gas turbine; HRSG: heat recovery steam generator; ST: steam turbine.
Energies 14 08409 g002
Figure 3. Cost flow diagram of the proposed integrated solar-gasification cycle (ISGC) system. AC: Air compressor; Cond: Condenser; CC: Combustion chamber; GT: Gas turbine; HRSG: heat recovery steam generator; ST: steam turbine.
Energies 14 08409 g003
Figure 4. Environmental impact flow diagram of the proposed integrated solar-gasification cycle (ISGC) system. AC: Air compressor; CC: Combustion chamber; Cond: Condenser; GT: Gas turbine; HRSG: heat recovery steam generator; ST: steam turbine.
Energies 14 08409 g004
Figure 5. Advanced exergy analysis results obtained for the proposed integrated solar-gasification cycle (ISGC) system. ASU: Air separation unit; CC: Combustion chamber; GT: Gas turbine; HX: heat exchanger; SF: Solar field; ST: Steam turbine.
Energies 14 08409 g005
Figure 6. Advanced exergoeconomic analysis results obtained for the proposed integrated solar-gasification cycle (ISGC) system. ASU: Air separation unit; CC: Combustion chamber; GT: Gas turbine; HX: heat exchanger; SF: Solar field; ST: Steam turbine.
Energies 14 08409 g006
Figure 7. Advanced exergoenvironmental analysis results obtained for the proposed integrated solar-gasification cycle (ISGC) system. ASU: Air separation unit; CC: Combustion chamber; GT: Gas turbine; HX: heat exchanger; SF: Solar field; ST: Steam turbine.
Energies 14 08409 g007
Table 1. A brief review of the most recent literature on the applications, methods, and practices related to integrated gasification combined cycles (IGCCs).
YearAuthorsStudy Summary
2015Morini et al. [15]Simulation of a combined cycle with a 650-MW gasification unit.
2015Jia et al. [18]Simulation of a gasifier system with atmospheric solid oxide fuel cell, and investigation of the fuel cell electrical efficiency using two types of gasifiers: air and oxygen blower.
2015Doherty et al. [19]Simulation of a fuel cell cycle with biomass feed and evaluation of the effect of syngas temperature on the system performance, under four different scenarios.
2015Chen et al. [20]Investigation of a coal gasification cycle combined with a fuel cell via exergy destruction evaluation in equipment.
2015Wang et al. [21]Investigation of a combined cooling, heating, and power (CCHP) system with a biogas feed gasification system, which uses an absorption chiller system. The largest share of exergy destruction is related to the gasification unit.
2015Athari et al. [22]Investigation of a gas turbine cycle with fog cooling and biomass gasification.
2016Perna et al. [23]Investigation of combined biomass and solar energy sources in a gasification cycle for hydrogen production.
2016Yari et al. [24]Simulation of a solid oxide fuel cell at atmospheric pressure using a heat recovery system, which used a gasification system with biomass feed to produce fuels.
2016Lv et al. [25]Assessment of the efficiency of an integrated system with gas turbine and fuel cell-based biomass gasification.
2016Thattai et al. [26]Feasibility study on combining up to 70% of biomass resources with a coal feed in a 253-MW cycle.
2016Khani et al. [27]Simulation and optimization of a fuel cell and gas turbine using a genetic algorithm.
2018Park et al. [28]Modelling and simulation of a gasification cycle under different economic scenarios.
2019Zhang and Ahn [16]Investigation of the prospects of gasification power plants in China with near-zero emissions, using pre-combustion gasification with carbon dioxide adsorbent.
2020Khoshgoftar Manesh and Jadidi [17]Assessment of biomass-based IGCC with olive pits as feed and implemented 4E analyses.
2021Szima et al. [5]Techno-economic analysis of hydrogen and power production from the IGCC plant with the gas switching combustion (GSC) for carbon capture and membrane-assisted water gas shift (MAWGS) reactors to produce hydrogen.
2021Bany Ata et al. [2]Heat integration optimization and sensitivity analysis of an IGCC system based on lignite co-gasification and refuse-derived fuels for co-generating methanol and electricity.
2021Muhammad et al. [3]Thermodynamic and economic analysis of IGCC system for producing electricity, methane, and ammonia.
Table 2. Stream data obtained from simulations in MATLAB and Thermoflex software.
m   ˙ [ k g / s ] T   [ ° C ] P   [ bar ]
StreamMATLABThermoflexError [%]MATLABThermoflexError [%]MATLABThermoflexError [%]
19.359.35102525040.5840.580
20.140.14010010001.0131.01350
3182.11820.05353500.920.92140
428.1128.110.01400400035.6135.610
58.018.010142.5142.5039390
628.5328.530718.947002.6337.0537.050
717.417.40100100040400
815.515.502525037.9237.920
95.165.160252501.0141.0140
1028.5328.530400400036.3236.320
119.359.350250250039.7839.780
125.165.16015015000.9210.92180.01
13110.29110.30.01353.9353.550.10.880.880
14523.2523.20252500.870.870
15110.3110.30608.9608.900.880.880
1628.328.290.03473.95474.10.0124.1124.120.04
170.4160.4130.7240040001.0131.0130
18441.19444.20.002171.42169.61.060.870.870
1928.328.290.03206.73205.20.7435.4335.430
20551.48551.50.01608.9608.900.880.880.01
2174.35174.350.0138.7438.7400.0680.0680
2274.35174.350.0138.738.740.10.0680.0680
23441.19441.20.01512.47512.90.080.880.880.01
241821820252501.0131.0130
25110.29110.30.01278.16278.20.010. 870.870
2633.3633.360252500.870.870
2765650368.6368.6039.7839.780
2828.2928.290.02519.055220.1834.7334.740.03
293238.53238.50252501.0131.0130
30441.19441.20.01346.08344.60.420.880.880
31656503103100122.4122.40.01
3265650326.19326.20.01122.4122.40.01
33656505355350119.951200.04
349.3519.3510250.032500.0139.7839.780.01
35441.19441.20.01608.9608.900.880.880.01
3627.2427.250.03400400035.4335.430
370.8650.8670.23400395.11.220.870.870
3874.3574.350.01536.8536.8038.98390.05
393238.53238.5037.0837.0800.660.660.7
4074.3574.350.01351.28351.20.0239.7839.780
426565025250124.85124.850
Table 3. Power and heat transfer rates for different components obtained from simulations in MATLAB and Thermoflex software.
ParameterMATLABThermoflexError [%]
W G T   P a c k   [ MW ] 229.55229.550.00
W A C   [ MW ] 219.66213.552.78
W G T   [ MW ] 458.86444.733.07
Q S H 1   [ MW ] 49.1649.200.085
Q E V   [ MW ] 82.5083.551.27
Q E C 1   [ MW ] 82.6983.340.78
Q S H 2   [ MW ] 32.0132.050.12
Q E C 2   [ MW ] 9.079.130.74
W A S U   [ MW ] 9.129.130.08
W E X P   [ kW ] 2.672.794.37
W S T 1 19.7019.481.15
W S T 2 87.3087.040.29
Table 4. Comparison between the obtained ISGC modelling results with those from Zhang et al. [29].
ParameterPresent StudyZhang et al. [29]
Exergy input (MW)678.99861.06
Exergy destruction (MW)366.57488.81
Net output power (MW)319.92389.77
Thermal efficiency (%)50.0149.94
E X D / E X i n p u t ( % ) 53.9856.7
Table 5. Stream specifications obtained from conventional exergy-based analyses.
Stream m ˙   [ k g / s ] T   [ ° C ] P   [ bar ] E x   ˙ [ MW ] c   [ $ / G J ] C ˙   [ $ / h ] b   [ p t s / G J ] B   [ p t s / h ]
19.3525.0040.580.0370.0000.0000.000.000
20.14100.001.0130.0000.0000.0000.000.000
3182.135.000.920.0000.0000.0000.000.000
428.11400.0035.61587.255.2111,027.181,6003,382,571.52
58.01142.539.003.48140.831766.3422,200278,361.36
628.53718.9437.05601.894.9410,721.3415003,250,206
717.40100.0040.000.650.000.0000.0000.000
815.5025.0037.92678.992.285592.7014.0034,221.09
95.1625.001.0140.0000.000.000.0000.000
1028.53400.0036.32589.384.949623.6315003,182,652
119.35250.0039.782.4051.50446.3129,400254,756.88
125.16150.000.9212.5816.92157.28241,4002,243,861.28
13110.29353.900.8812.119.97434.793,800165,719.52
14523.225.000.870.000.000.000.0000.000
15110.3608.90.8830.409.971091.263800415,926.72
1628.30473.9524.11589.115.4911,644.231,8003,499,313.4
170.41400.001.0130.0690.000.000.0000.000
18441.19171.420.8712.080.000.000.0000.000
1928.30206.7335.43583.375.4611,473.0217003,570,224.4
20551.48608.90.88152.299.975465.993,8002,083,327.2
2174.3538.740.0687.2611.85309.7112,500326.7
2274.3538.700.0680.0811.853.7912,5004,000.5
23441.19512.470.8891.809.973295.063,8001,255,892.4
24182.0025.001.0130.000.000.000.0000.000
25110.29278.160.877.810.000.000.0000.000
2633.3625.000.870.000.000.000.0000.000
2765.00368.639.7875.3013.063542.7512,5003,388,770
2828.29519.0534.73592.295.4911,706.0118003,838,039.2
293,238.525.001.0130.0430.000.000.0000.000
30441.19346.080.8846.659.971674.463,800638,213.04
3165.00310.00122.4026.4818.001721.9414,8001,411,120.8
3265.00326.19122.4068.3213.783390.8412,3003,025,342.44
3365.00535.00119.9596.0213.084523.5512,5004,320,990
349.35250.0339.789.306.312211.4611,800395,318.88
35441.19608.90.88121.839.9704,372.7238001,666,634.4
3627.24400.0035.43587.095.42711,470.0716003,381,638.4
370.86400.000.870.1270.0000.000.0000.000
3874.35536.838.98103.0211.854394.8312,5004,635,900
393,238.537.080.663.15627.20309.0832,100364,707.36
4074.35351.2839.7884.466.982124.8471002,158,899.84
4165.0025.00124.850.8050.000.000.0000.000
Table 6. Results obtained from conventional exergy, exergoeconomic, and exergoenvironmental analyses for the different system components.
Equipment Z   ˙ [ $ / h ] f   [ % ] r   [ % ] C ˙ D   [ U S $ / h ] Y   ˙ [ p t s / h ] f b [ % ] r b [ % ] B ˙ D [ p t s / h ] ε   [ % ]
ASU1,341.7283.66991.04262.08415.080.48162.7187,654.638.18
Solar field157.32100-01190.52100-020.09
Gasifier340.9281.2662.35786.611,100.243.9812.17267,465.689.54
Syngas cooler6.847.7672.0981.72211.6800.8367.0525,31860.06
Heat exchanger9.3612.746.1664.08110.1600.5540.5319,833.471.28
H2S remover529.293.535.4136.7259.760.5300.3511,34599.65
CO2 capture445.6883.55150.0487.8459.760.3224.4618,383.480.2
Humidifier3.965.160.6873.4457.960.2600.6521,995.299.36
Expander35.2877.9585.3710.0811,642.478.4187.173205.884.16
Combustion chamber5.40.1225.234550.47364.160.4625.321,603,906.979.87
Air compressor756.3644.8818.17929.161319.040.4210.06310,37590.9
Gas turbine4174.9286.0529.46677.169908.283.744.27255,06096.05
Superheater (1)48.960.0913.3183.5213,113.3629.4211.931,462.999.25
Evaporator28.8736.8811.14118.8644.761.428.0344,80792.66
Economizer (1)47.529.9238.45430.92499.320.3134.74162,280.874.28
Superheater (2)23.042.5339.15888.129,027.721.2538.64710,71272.38
Economizer (2)11.525.6586.02194.7658.680.07981.2473,389.655.2
Steam turbine (1)71.6460.2212.8547.5213,113.364.815.3745,46895.14
Steam turbine (2)180.7233.3614.54360.726807.961.759.86381,52891.17
Condenser3.191.81132.81173.1626.281.81130.42183,06043.4
ASU: air separation unit.
Table 7. Ranking of equipment obtained from conventional and advanced exergy analyses.
Conventional (MW)Advanced (MW)
Equipment E ˙ D , k C ˙ D , k C ˙ D , k + Z ˙ k B ˙ D , k B ˙ T , k E ˙ D , k A V E ˙ D , k E N C ˙ D , k E N B ˙ D , k A V B ˙ D , k E N
Air separation unit985991312121412
Solar field6201420201512152
Gasifier 243551288117
Syngas cooler11317141421315215
Heat exchanger131519161691413913
H2S remover1617718191763163
CO2 capture201291717173584
Humidifier1215181515611779
Expander1919201918145101310
Combustion chamber1121182161
Air compressor424441876186
Gas turbine5516634435
Superheater (1)1513151313169111711
Evaporator141113121211109128
Economizer (1)7610881015141014
Superheater (2)3362251717517
Economizer (2)17911101041616416
Steam turbine (1)18181611111920191919
Steam turbine (2)878332019202020
Condenser1110127711818118
Publisher’s Note: MDPI stays neutral with regard to jurisdictional claims in published maps and institutional affiliations.

