1. Introduction
In recent years, research on hydrogen use, production methods, and economics has increased as countries have begun attempting to reduce their carbon footprints. As a power source, hydrogen offers flexible electricity generation, with the potential to serve as the load following or peaking power units. Hydrogen could also be used to shift electricity demand to off-peak hours, acting as a large-scale demand response or energy storage medium. Producing hydrogen via nuclear power and using it as a flexible load resource is being investigated by numerous organizations [
1,
2,
3]. Several of these nuclear hydrogen configurations are also currently in development.
These nuclear integrated energy systems (IES) could provide economic benefits to nuclear power plants (NPPs). Competing with cheap fossil resources and declining renewable energy costs has left NPPs at an economic disadvantage [
4]. Hydrogen production allows NPPs to diversify their revenue streams and has potential to increase NPP profitability [
5].
In Japan, fossil fuel import requirements have led to high electricity prices and investigations into methods of producing electricity cheaply and locally [
6]. Nuclear power could be advantageous in decreasing our dependence on fossil fuels, since uranium is much more energy dense, requires less frequent imports, and can be stored onsite for future use. Furthermore, following their initial installation, sources of renewable energy do not require any additional imports. Combining these technologies in a way that also reduces carbon emissions while maintaining low electricity prices is important for the future of Japan’s electricity system. An IES that enables NPPs to sell a secondary commodity instead of losing money on electricity sales could help boost overall system profitability.
Besides addressing cost and security concerns, hydrogen produced via nuclear energy could help in meeting the greenhouse gas reduction goals set by Japan’s Ministry of Economy, Trade, and Industry (METI). METI has also set cost-reduction goals for hydrogen produced via low- or zero-emission sources [
7]. With sufficient infrastructure, this clean hydrogen could be used to aid in decarbonizing Japan’s industry or transport sections. Currently in Japan, hydrogen is sold at a wholesale price of ~100 JPY/Nm
3. METI’s goal is to reduce this price to 30 JPY/Nm
3 by 2030, and to 20 JPY/Nm
3 by approximately 2050 [
7].
Government and research entities in Japan have also achieved expertise in nuclear high-temperature gas cooled reactors (HTGRs) and the applications thereof. The operating high-temperature engineering test reactor (HTTR) has aided in acquiring HTGR experimental and operational experience. The HTTR is a 30-MWt, helium-cooled reactor that uses graphite moderated prismatic fuel assemblies. The outlet temperature is 950 °C—high enough to integrate different process applications (e.g., hydrogen production) for testing purposes [
8].
The iodine–sulfur (IS) cycle for hydrogen production appears to be a strong candidate for pairing with an HTGR [
9]. The IS cycle utilizes a Bunsen reaction to convert water, I
2, and SO
2 into HI and H
2SO
4. The HI is then split up into its hydrogen and iodine components. A side reaction converts the H
2SO
4 into SO
2, water, and oxygen, thus completing the cycle. The reactions are listed in
Table 1.
Several difficulties have inhibited the deployment of IS cycles, such as heat input and material requirements. This cycle requires high quality heat at upwards of 800 °C for the H
2SO
4 decomposition reaction, meaning that coupling with the current fleet of light-water reactors is difficult because they output steam at approximately 300 °C [
10]. Additionally, material challenges associated with catalyst, reactant and container interactions or highly corrosive environments require special materials, such as Hastelloy C-276 [
11], zirconium alloys [
12], or special design features that isolate highly acidic environments from metals to avoid acidic oxidation.
Because of the unique positioning with an operating high temperature reactor, the Japan Atomic Energy Agency (JAEA) has emphasized the development of the IS cycle for hydrogen production [
11], going so far as to design an HTTR and IS cycle cogeneration facility known as the HTTR-GT/H
2.
The HTTR-GT/H
2 is a design for coupling the HTTR with an IS cycle in order to demonstrate hydrogen–HTGR coupling capabilities. The process diagramed in [
12] adds an intermediate heat exchange system to the HTTR in order to send heat to the nuclear-IS. A turbine for generating electricity is also planned. Thus, the demonstration could entail the choice of whether to dispatch and sell hydrogen or electricity, depending on regional electricity prices, hydrogen agreements, or other economic incentives.
While the technical development of the HTTR-GT/H2 has been detailed in previous studies, this report focuses on developing a techno-economic model to flexibly dispatch the HTTR-GT/H2 for electricity and/or hydrogen cogeneration. The goal is to investigate the potential impacts of different input assumptions or real-world conditions on the profitability of such a system. This work seeks to improve our understanding of the assumptions necessary for eventually making investment decisions pertaining to commercial hydrogen systems.
The HTTR-GT/H2 system was chosen for this economic model due to its simple design and the availability of process modeling data. Compared to commercial-scale systems, the HTTR-GT/H2 is relatively small, both in terms of nuclear plant size and hydrogen production. The small size means that electricity price feedback to the operation changes of the HTTR-GT/H2 would be minimal. The HTTR-GT/H2 has undergone detailed process modeling and has developed operation modes. Knowing the operating conditions for both the electricity sale and hydrogen sale modes makes the economic dispatch easier to model, and the smaller nature of this system helps further simplify the problem, since the system would participate in fewer electricity markets and have less of an impact on the electricity and hydrogen markets at large. This makes the impact of certain inputted data (e.g., electricity price data) more readily apparent. These effects and assumptions should be known prior to expanding this modeling methodology to larger, commercial systems as part of a broader study.
The HTTR-GT/H
2 dispatch model acts as a price-taker model. Electricity is sold when regional electricity prices exceed the HTTR’s operating costs and hydrogen is produced when the electricity price falls below HTTR-GT/H
2 electricity production costs. The hydrogen is produced via the co-located IS cycle, as detailed in [
13]. The price-taker assumption means that the model does not have any feedback between the changing load from the nuclear-IS cycle and grid electricity prices. This assumption is generally made for small generators and loads, such as the HTTR-GT/H
2.
The goal of the dispatch model is to determine the price at which the system can sell hydrogen while breaking even economically. This price, also known as the levelized cost of hydrogen (LCOH), is the point at which sufficient money is made to justify building the hydrogen facility and dispatching energy to hydrogen production instead of selling only electricity.
The dispatch model was developed using the Risk Analysis Virtual Environment (RAVEN) model, developed at Idaho National Laboratory [
14]. Two RAVEN plugins, the Holistic Energy Resource Optimization Network (HERON) and the Tool for Economic Analysis (TEAL)—also developed at Idaho National Laboratory—were used for creating the dispatch algorithm and tracking the economic parameters within the model [
15].
2. HTTR-GT/H2 Dispatch Model Methodology
The HTTR-GT/H2 dispatch model was developed to generate insights into the optimal dispatch of nuclear IES and how different factors can affect that dispatch. As such, this model demonstrates how the HTTR-GT/H2 might best be dispatched in response to fluctuating hourly electricity prices throughout the year. The model also allows for the investigation of different input assumptions and their effects on the stochastic optimization of decisions to dispatch hydrogen or electricity.
2.1. Modeling Framework
The RAVEN framework is a multi-purpose optimization, data analysis, and uncertainty quantification code. It can be used in conjunction with the HERON plugin to develop economic dispatch models.
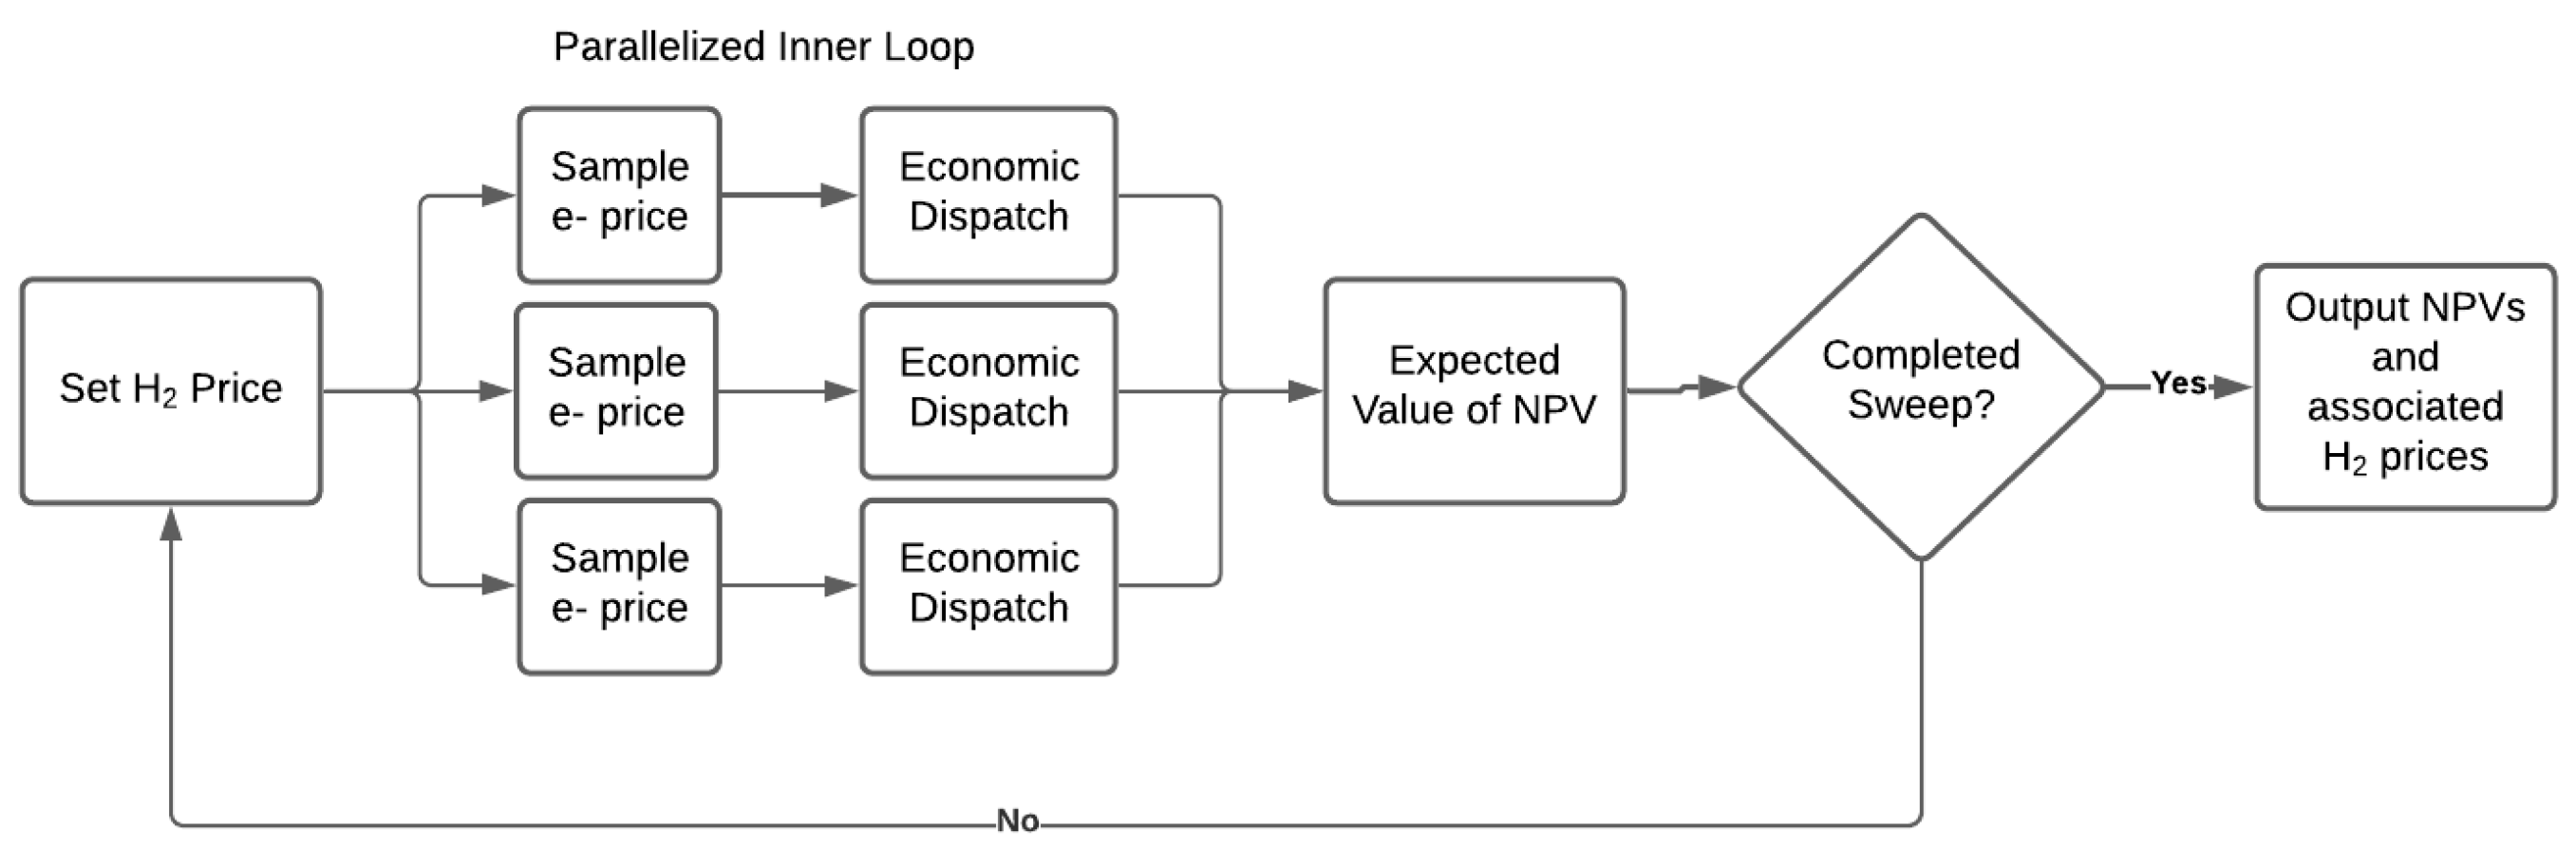
HERON creates a two-loop dispatch algorithm that incorporates RAVEN’s optimization and synthetic time history generation abilities. The general structure of the stochastic dispatch model is given in
Figure 1. The outer loop optimizes some grid parameter(s) (e.g., generator capacity), while the inner loop samples synthetic time histories, performs the economic dispatch, and tracks discounted cash flows via the TEAL plugin.
The HERON plugin was used to build the HTTR-GT/H2 dispatch model in RAVEN. HERON simplified the creation of this model, which might otherwise have proven complicated for typical RAVEN users. HERON enables users to quickly develop inputs based on technology prices, commodities such as electricity or hydrogen, and the hydrogen and electricity markets. HERON then translates these user-friendly inputs into RAVEN scripts that utilize RAVEN’s sampling, data transfer, and stochastic optimization capabilities to perform the dispatch.
Figure 2 shows the decision process for the HTTR-GT/H
2 dispatch model. This specific dispatch model utilizes an inner loop to perform the hydrogen/electricity (e- in
Figure 2) dispatch and an outer loop to track hydrogen prices.
2.2. Synthetic Time History Production
For the dispatch model to perform the stochastic optimization, a method of producing synthetic data was required. An autoregressive moving average (ARMA) model coupled with a Fourier series detrending model, known as a FARMA model, was used to produce synthetic electricity-price time histories. RAVEN’s capabilities allow users to train a FARMA on historical, time-dependent datasets, then sample that model to create synthetic time histories. The FARMA model takes an input time history and uses a Fourier series decomposition to extract the trends that occur due to temporal variations. For example, in a load profile, there are variations that occur due to seasonal weather variations or weekly use patterns. These trends are not noise and should be quantified and extracted prior to the ARMA producing synthetic noise. A Fourier fast transform was used to extract the time scales of these correlations. This process is detailed in depth in [
16]. The Fourier detrending equation, used on the time scales found from the fast Fourier transform, is given in Equation (1), as taken from [
16]:
After the Fourier detrending, the ARMA statistically quantifies the noise and allows for stochastic reproduction in future samples. The Fourier detrend pulls out all the strong, time-dependent trends in the dataset, leaving the noise. An ARMA algorithm can be used to model that noise. Equation (2) describes the ARMA process:
where
is the output vector for a given dimension
n, the input vectors,
and
, are
n by
n matrices, and
is the error term. The variables
and
are the autoregressive and moving average terms, respectively. When parameter
is zero, only the moving average is used. When
is zero, the process is exclusively autoregressive.
The dispatch model can then sample the FARMA model and produce large numbers of synthetic time histories for stochastic optimization purposes. As a price-taker model, its dispatch is based on economic decisions dependent on the electricity prices from trained FARMA.
Historical electricity prices for the HTTR operating region (i.e., the Tokyo region of Japan’s electricity system) were used for training the FARMA model. The HTTR-GT/H2 was assumed ineligible for the non-fossil or baseload markets due to its status as a small-scale test reactor. Larger commercial reactors could likely participate in the spot and intraday markets in addition to the baseload and non-fossil markets. The input data were separated into 30 min increments covering a 1-year period. Prices reflect 2018 historical prices.
RAVEN’s advanced clustering methods were leveraged to improve the accuracy of the synthetic price data [
17]. While Fourier detrending is useful for capturing seasonal effects, the clustering takes it a step further by isolating those segments with major differences.
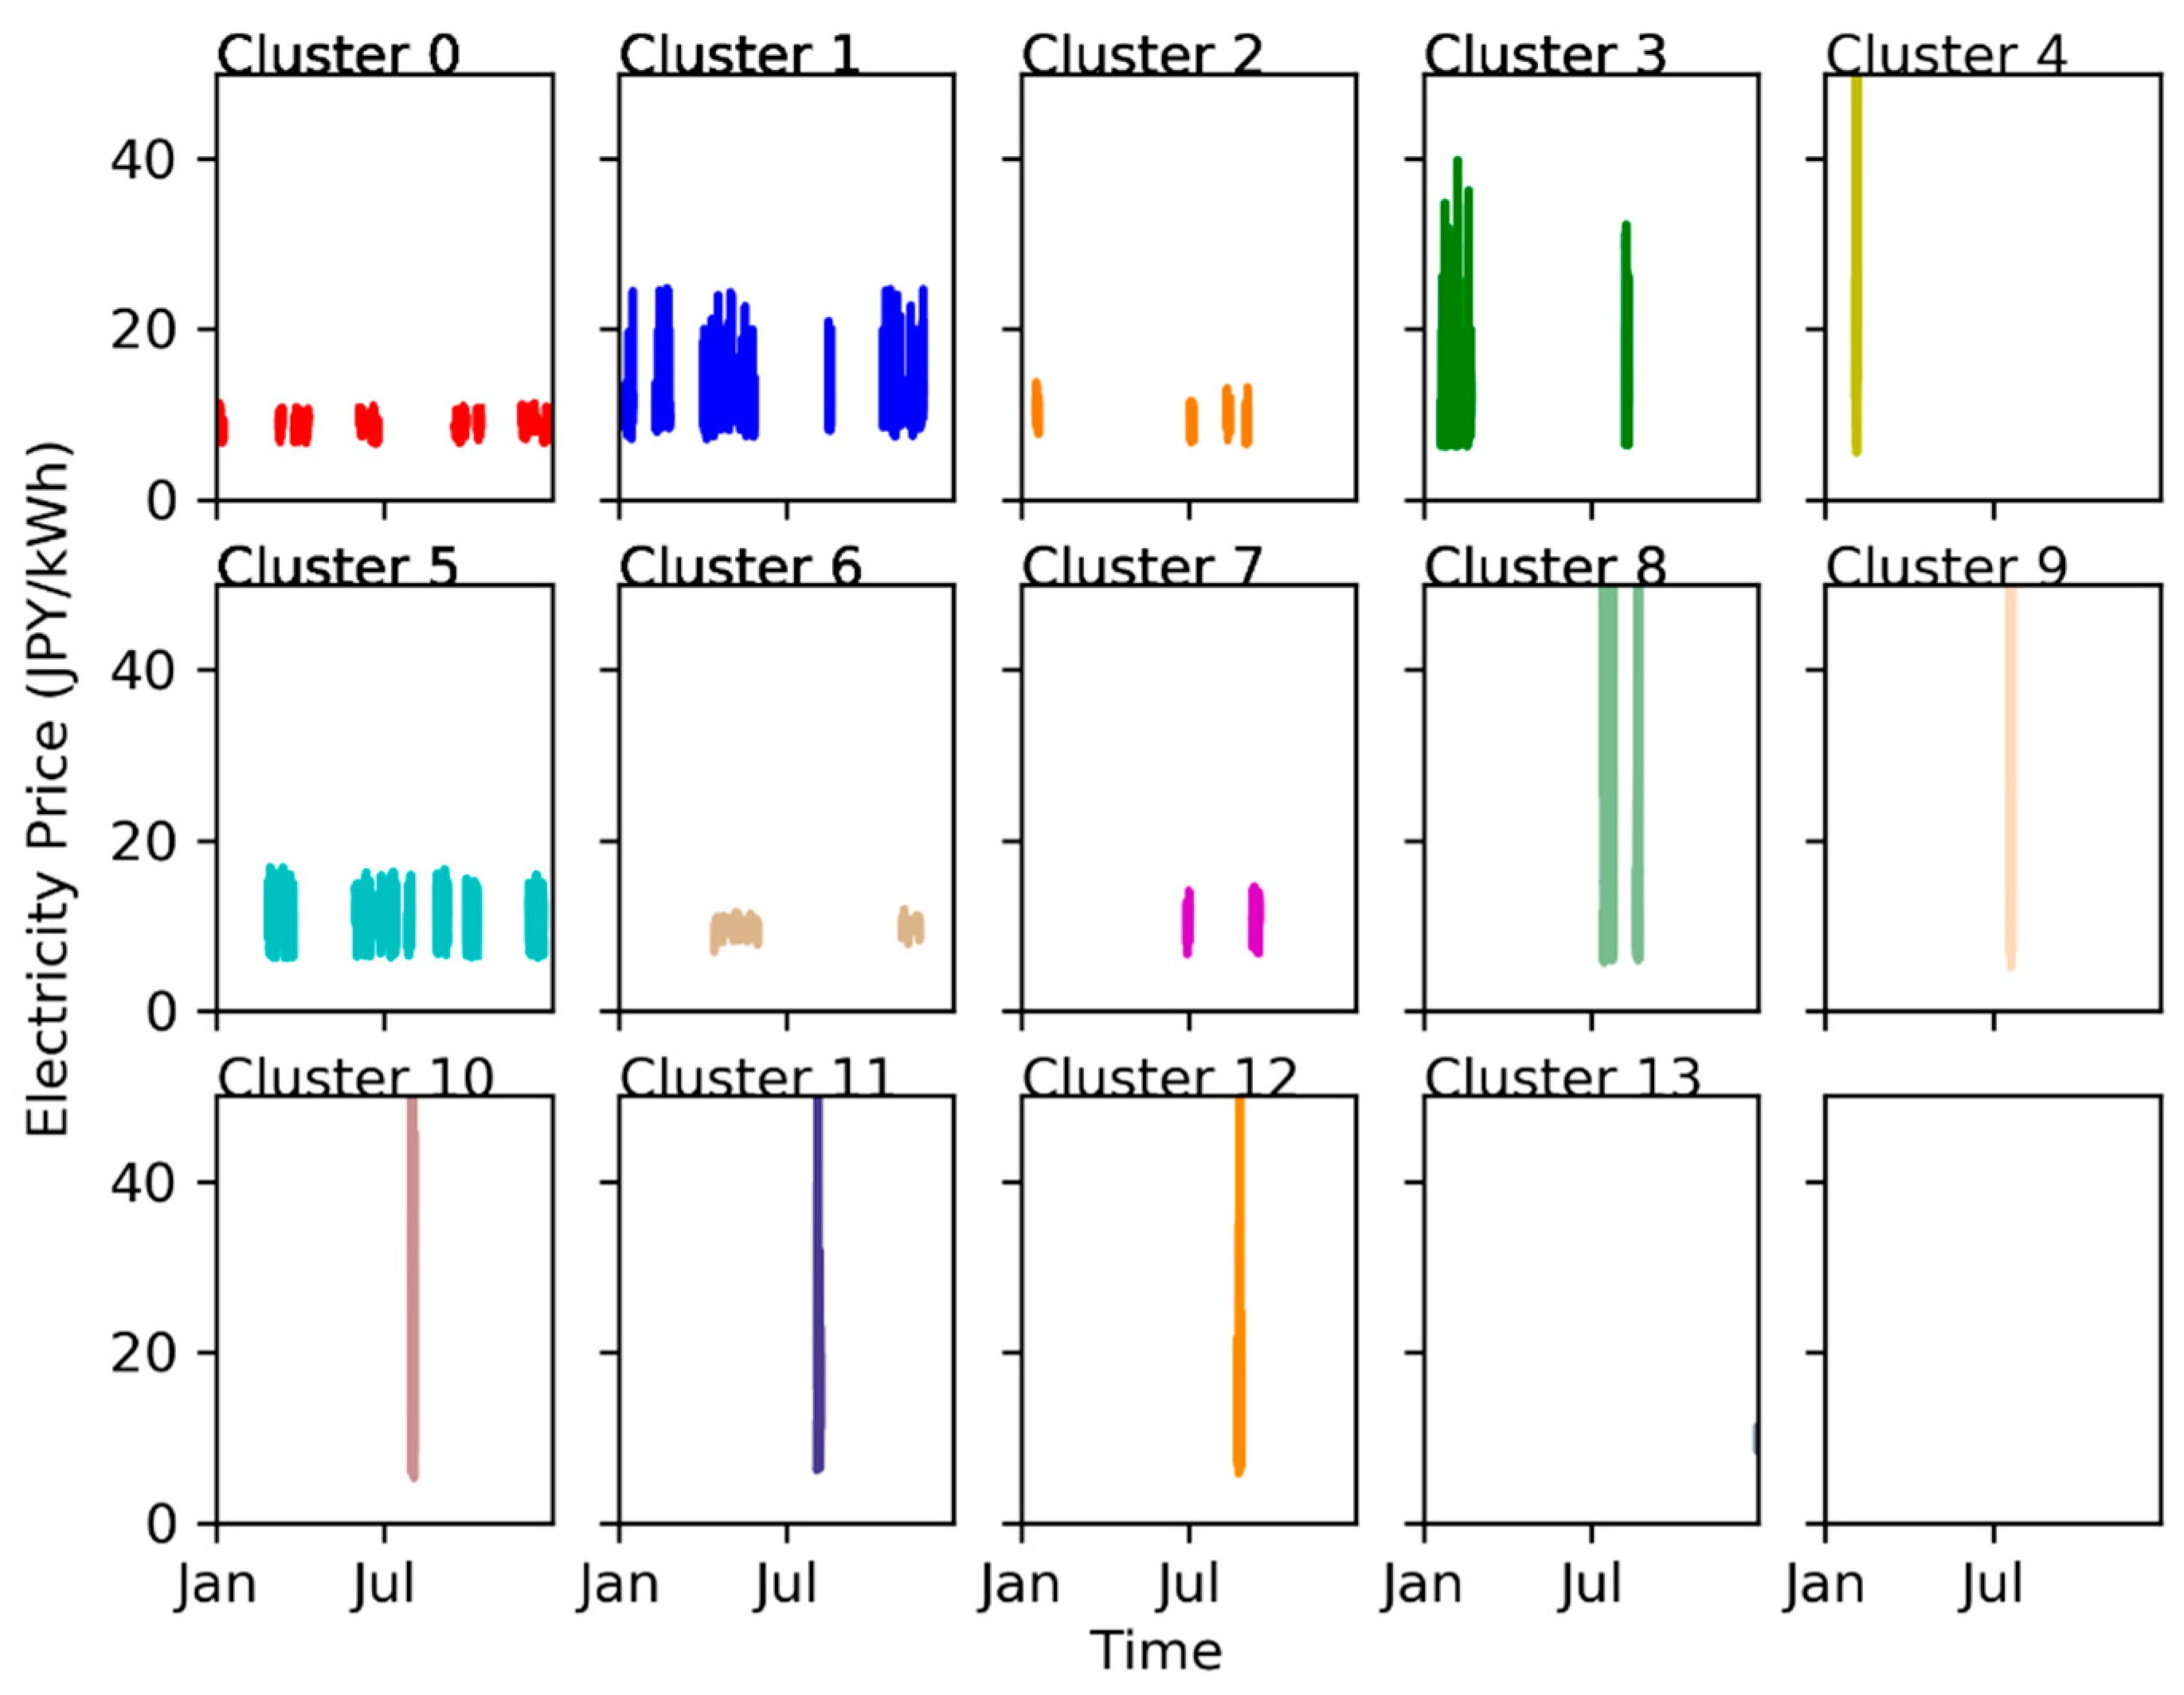
RAVEN clustered the data set into representative four-day periods. Each representative four-day period is known as a cluster, and each cluster was trained as an individual FARMA. By training these individual four-day clusters—as opposed to a single FARMA—over the year, RAVEN can achieve improved accuracy by further isolating the effects of long-term seasonal trends. Each specific four-day window, or segment, is then assigned to the cluster that best represents it. The clustering algorithm offers improved accuracy compared to overtraining the FARMA over the entire year.
Figure 3 shows each cluster and the time at which it occurred in the year. Each panel shows the four-day periods that are similar to each other and are thus representable by a single FARMA model. Note that the four-day periods in the shoulder months (usually in the spring and fall) tend to be similar. Additionally, the summer or winter peaks may have only a few four-day segments in their cluster. This is a feature of the clustering algorithm: by training a different FARMA for each representative window, the peak price events will not impact the production of synthetic data for the more typical shoulder months.
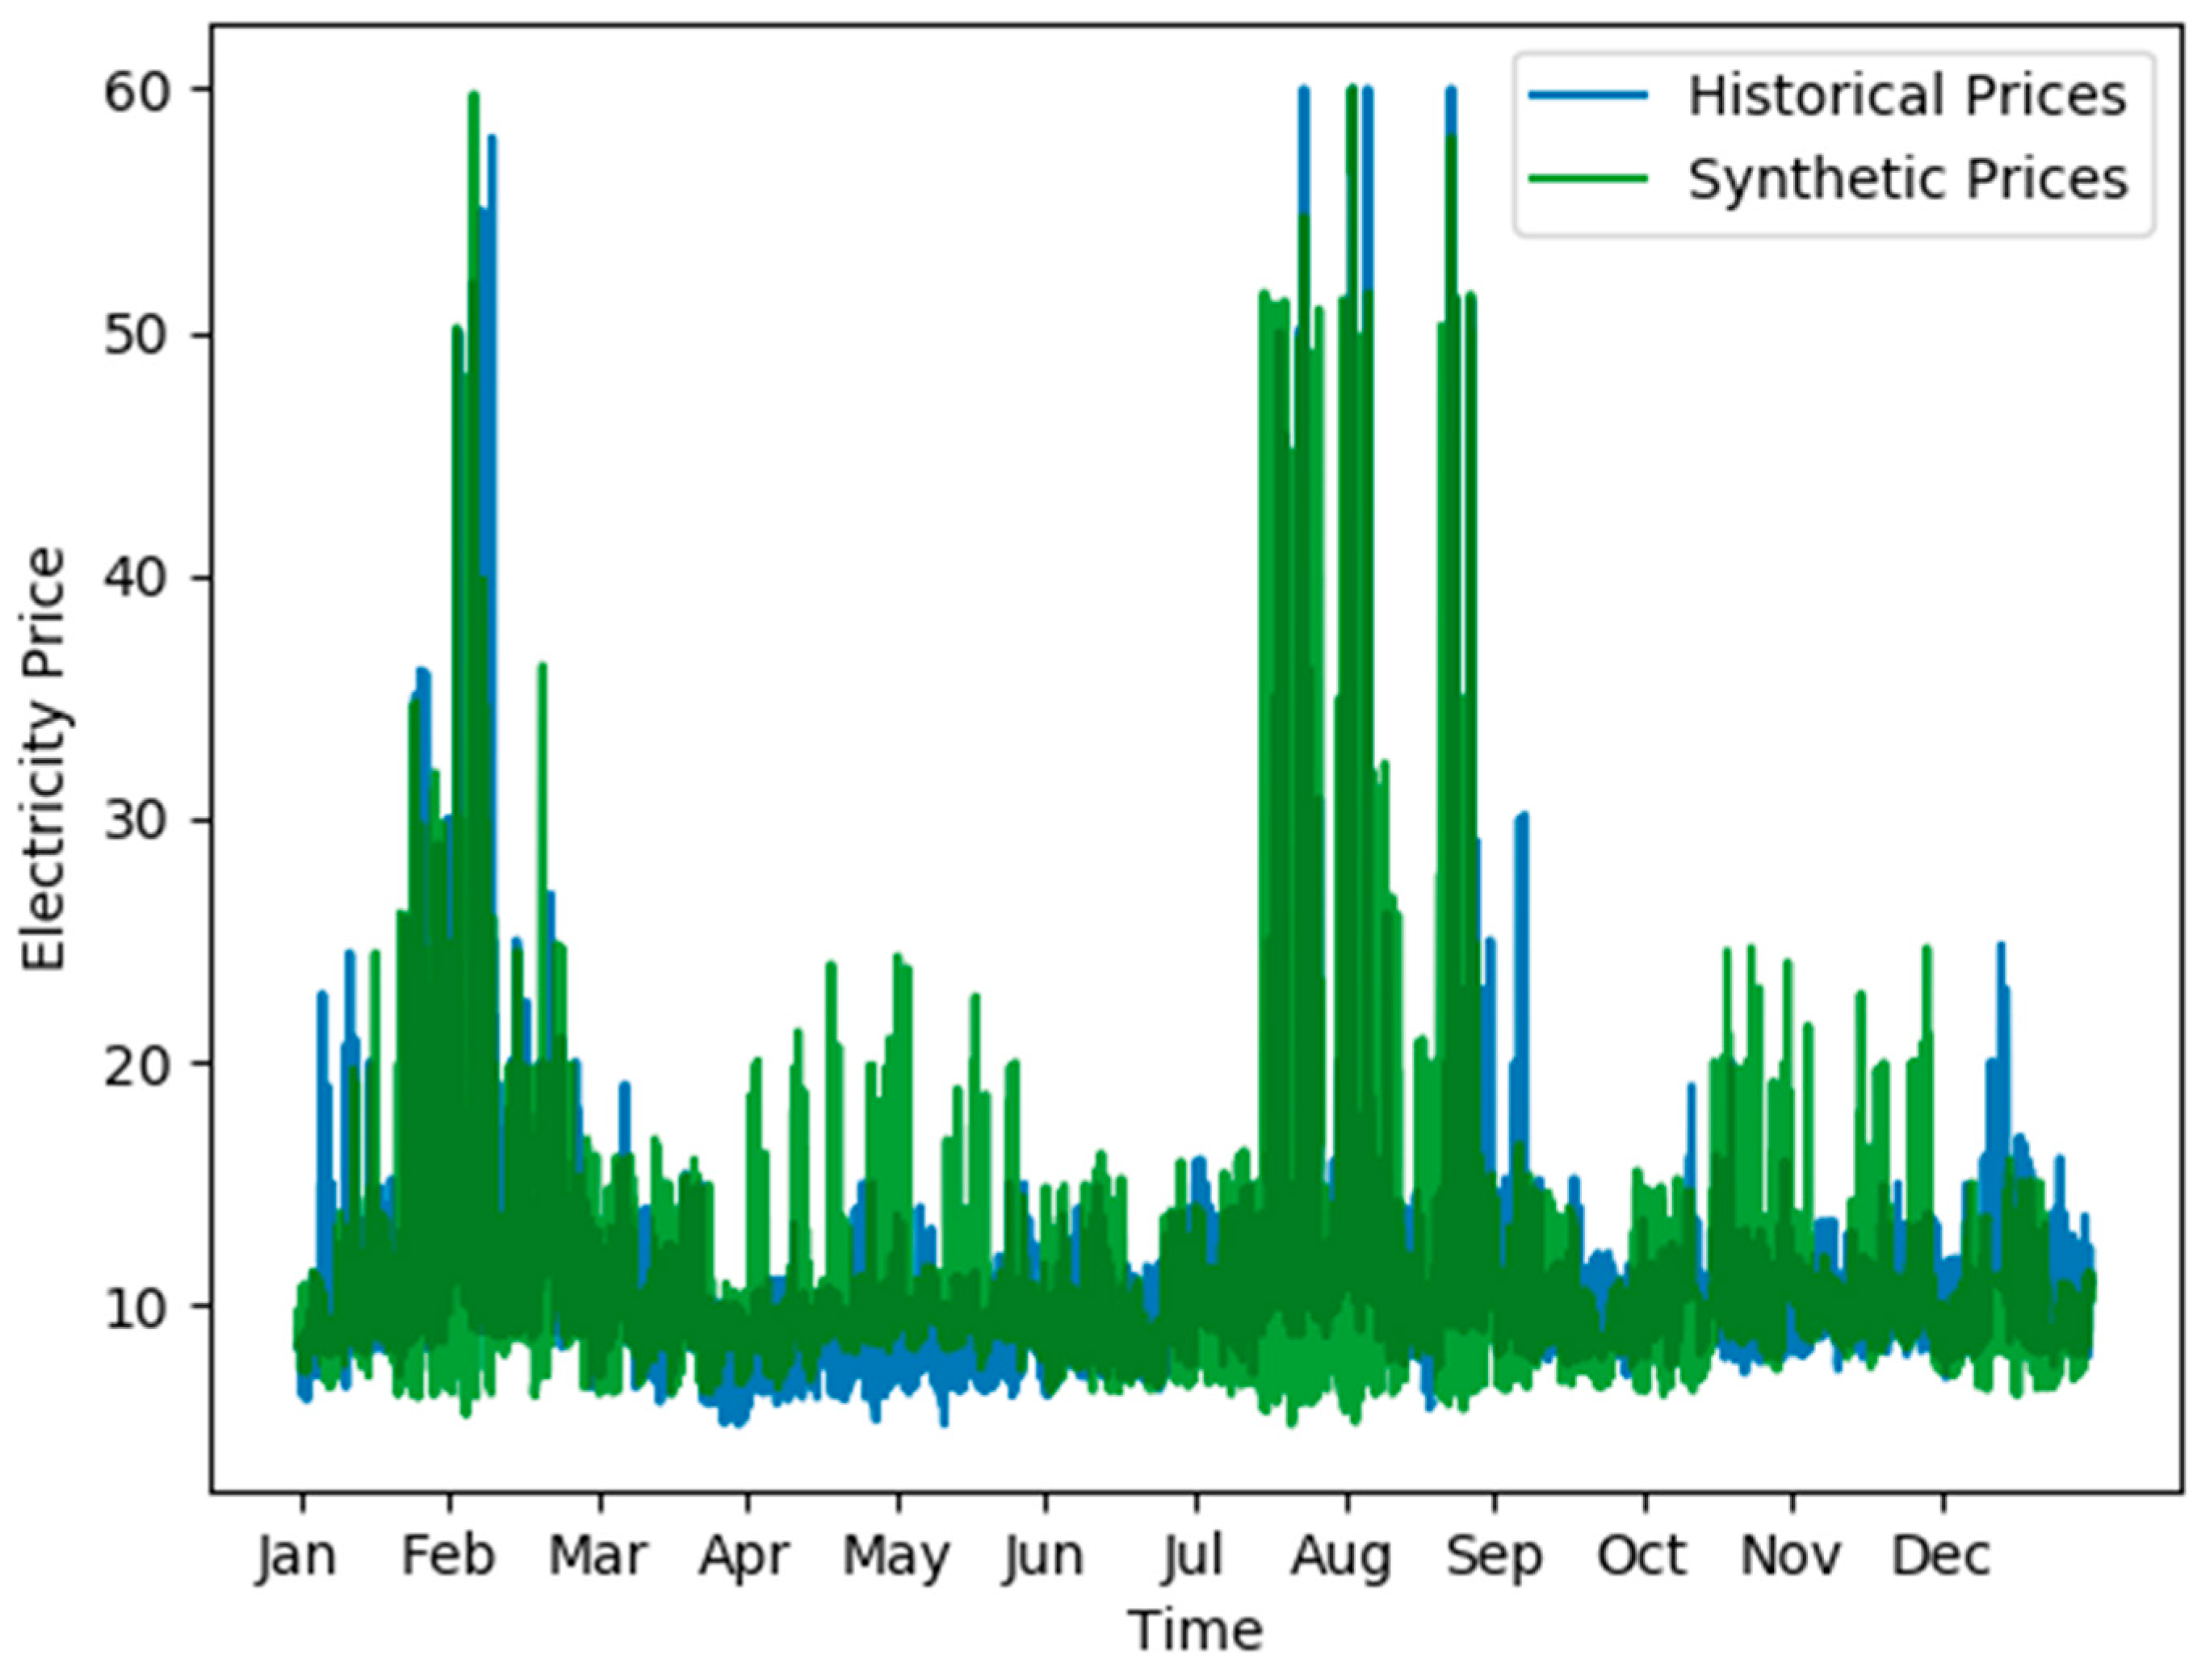
In
Figure 4, a complete synthetic time history is plotted against the original data. This synthetic history reflects a possible time history of electricity prices that is statistically similar to the original input data. The FARMA can be sampled many times over to produce a broad range of synthetic time histories statistically similar to the input price profile.
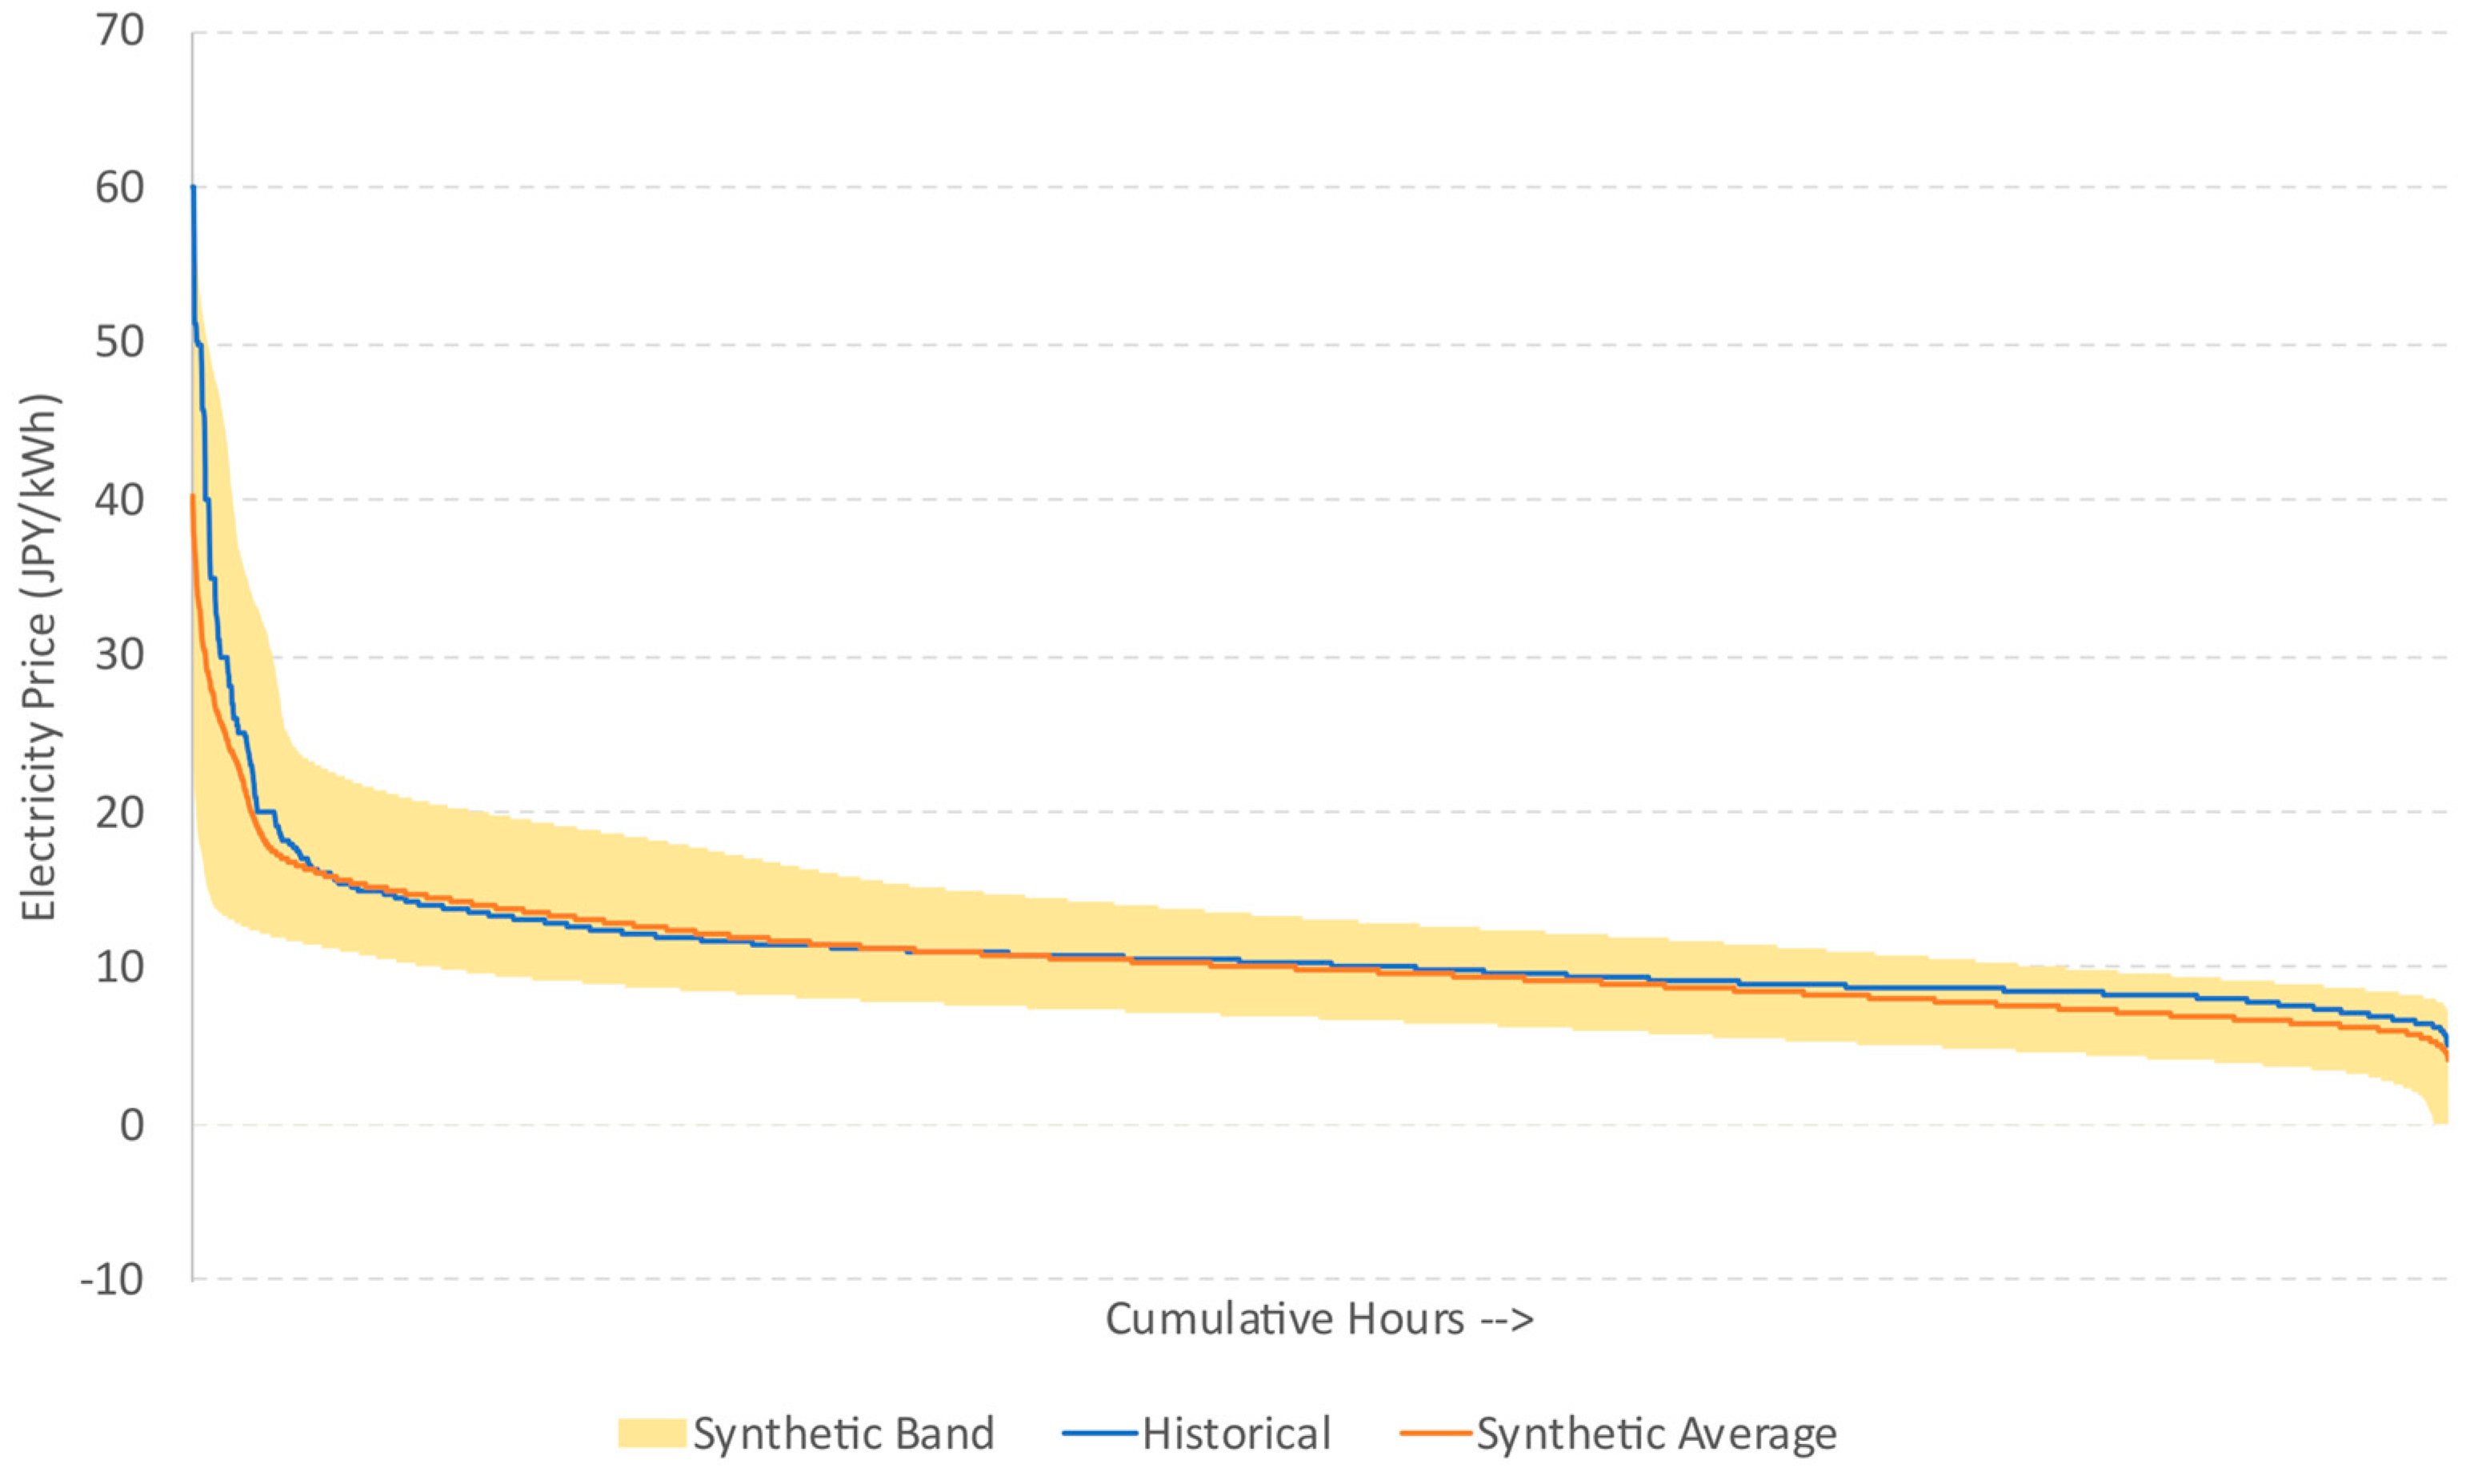
For each model run, the FARMA was sampled 100 times to reduce the modeling uncertainties in the input electricity prices. The price duration curve (PDC) is shown in
Figure 5.
The historical PDC is largely identical to the average synthetic PDC, except when comparing the 100 or so highest electricity price hours.
This dispatch model will be used to investigate the impact of the PDC discrepancy found in the 100 or so highest electricity price hours. Therefore, the model was run in two modes: one using 100 synthetic price histories and returning the expected breakeven sale price of hydrogen, and the other using the historical PDC to determine the expected breakeven sale price of hydrogen.
2.3. HTTR-GT/H2 Dispatch Dynamics
After sampling the FARMA to produce a synthetic dataset, the model dispatches either electricity or hydrogen depending on the electricity price at each time step. When the electricity price exceeds the cost of producing electricity, electricity is produced and sold. When the electricity price falls below the cost of producing electricity, hydrogen is produced and sold. In this manner, the model chooses the most economically advantageous commodity to produce and sell during each hour.
The dispatch algorithm assumes that the HTTR-GT/H
2 operates in one of two modes, as put forth by Yan et al. [
13]. These modes are the electricity and hydrogen mode in
Table 2. The dispatch algorithm decides between dispatching electricity in accordance with electricity operation mode or dispatching hydrogen in accordance with hydrogen mode. The system is assumed to be flexible enough to switch back and forth between modes within the 30-min time steps allotted. Note that these configurations are based on proposed test designs for the HTTR-GT/H
2, which may not necessarily utilize the HTTR’s entire 30-MWt heat for hydrogen/electricity production.
The IS cycle design developed by JAEA is sized to provide 29.5 Nm
3/h of hydrogen, as per the design in [
13].
The amount of hydrogen delivered during each hour (
is represented in Equation (3). When the price of electricity (
) falls below the electricity production cost (
), the system dispatches hydrogen in accordance with the previously defined operation modes. When electricity price is higher than the cost of producing electricity, hydrogen is not produced; instead, the power is used to make electricity.
2.4. Cash Flow Analysis
Once the dispatch is complete, the model collects economic data to produce a system net present value (NPV). These cash flows include the capital cost, operating and maintenance costs of the IS cycle, and an assumed hydrogen storage cost. Revenue comes from the sale of hydrogen and electricity.
The NPVs in this report represent a differential NPV, shown in Equation (4). NPV
ref is the NPV of the HTTR-GT/H
2 when only electricity is sold and no hydrogen process has been built. NPV
ref serves as a baseline against which NPV
cogen is compared. When ∆NPV is positive, the cogeneration system is more profitable than only selling electricity. When ∆NPV is negative, the system would be more profitable focusing on electricity and not building the IS unit. Thus, when ∆NPV is 0, the profitability of the cogeneration system equals that of only generating electricity. This is the breakeven point, at which the hydrogen price represents the LCOH for this system.
Using ∆NPV means that only cash flows that differ between reference and cogeneration cases need to be tracked. Expenditures such as fixed HTTR costs and capital investments associated with the nuclear reactor can be disregarded, as they are equivalent in both the reference case and cogeneration cases. The limitation of this method is that ∆NPV only reflects the nuclear-IS profitability relative to the reference case rather than determining its absolute profitability. More information on the economics of the HTTR-GT/H2 are required before an analysis of total system profitability can be conducted.
Equation (5) gives the mathematical basis for disregarding equivalent cash flows that appear in both the reference and cogeneration NPVs.
The NPVs are calculated by summing the discounted cash flows associated with each case. Equation (6) details the NPV calculation. For this analysis, the discount rate,
r, is 8%.
The cash flows accounted for in the cogeneration case are (1) cost of electricity generation from HTTR-GT/H2, (2) IS capital and operating cost, (3) hydrogen storage, (4) revenue from electricity sale, and (5) revenue from hydrogen sale. Only the cost of electricity generation and revenue from electricity sale are tabulated in the reference case. The simulation is run for 1 year and used for every year of the project’s 30-year lifetime.
The output for this model is the breakeven cost of hydrogen. Hydrogen prices exceeding the LCOH would make building the nuclear-IS system and strategically dispatching hydrogen more profitable than just selling electricity. Prices below the LCOH mean that the system would lose money relative to only selling electricity. The model allows for investigating the uncertainty that certain model inputs (e.g., electricity price data) impose on the LCOH.
To find the LCOH, the hydrogen price was varied, and the point at which ∆NPV equaled zero was found. This can either be achieved via optimization or by sweeping the solution space on a grid and locating the zero point. For this analysis, the grid sweep was used since the only variable being perturbed was the hydrogen price.
2.5. Economic Parameters
The cost of hydrogen production from the nuclear-IS system is given in
Table 3, as estimated by JAEA in [
18]. The capital cost is driven by the capacity of the IS cycle. For example, the provided capital cost of 3.4 JPY/m
3 was multiplied by the IS cycle capacity of 29.5 m
3/h and the 8760 h in the year. The loss of chemicals during operation of the IS was treated as a variable operating cost.
The dispatch model also assumes a hydrogen storage cost for a tank sized to hold 4 h of production from the IS cycle. Storage flexing and hydrogen overproduction is not included in this analysis. The storage acts as a simple addition to the capital cost. A price of
$600/kg was used [
5], equivalent to 5326.5 JPY/Nm
3 at an exchange rate of 106 JPY = 1 USD.
3. Results
Two scenarios were run: dispatch using synthetic price histories and dispatch using the historical PDC. For the synthetic case, each dispatch instance was run with 100 synthetically generated electricity price time histories to produce a more stochastic optimization. The historical case used the 2018 historical electricity prices as inputs. The outer loop varied hydrogen prices from 0 to 120 JPY/Nm3.
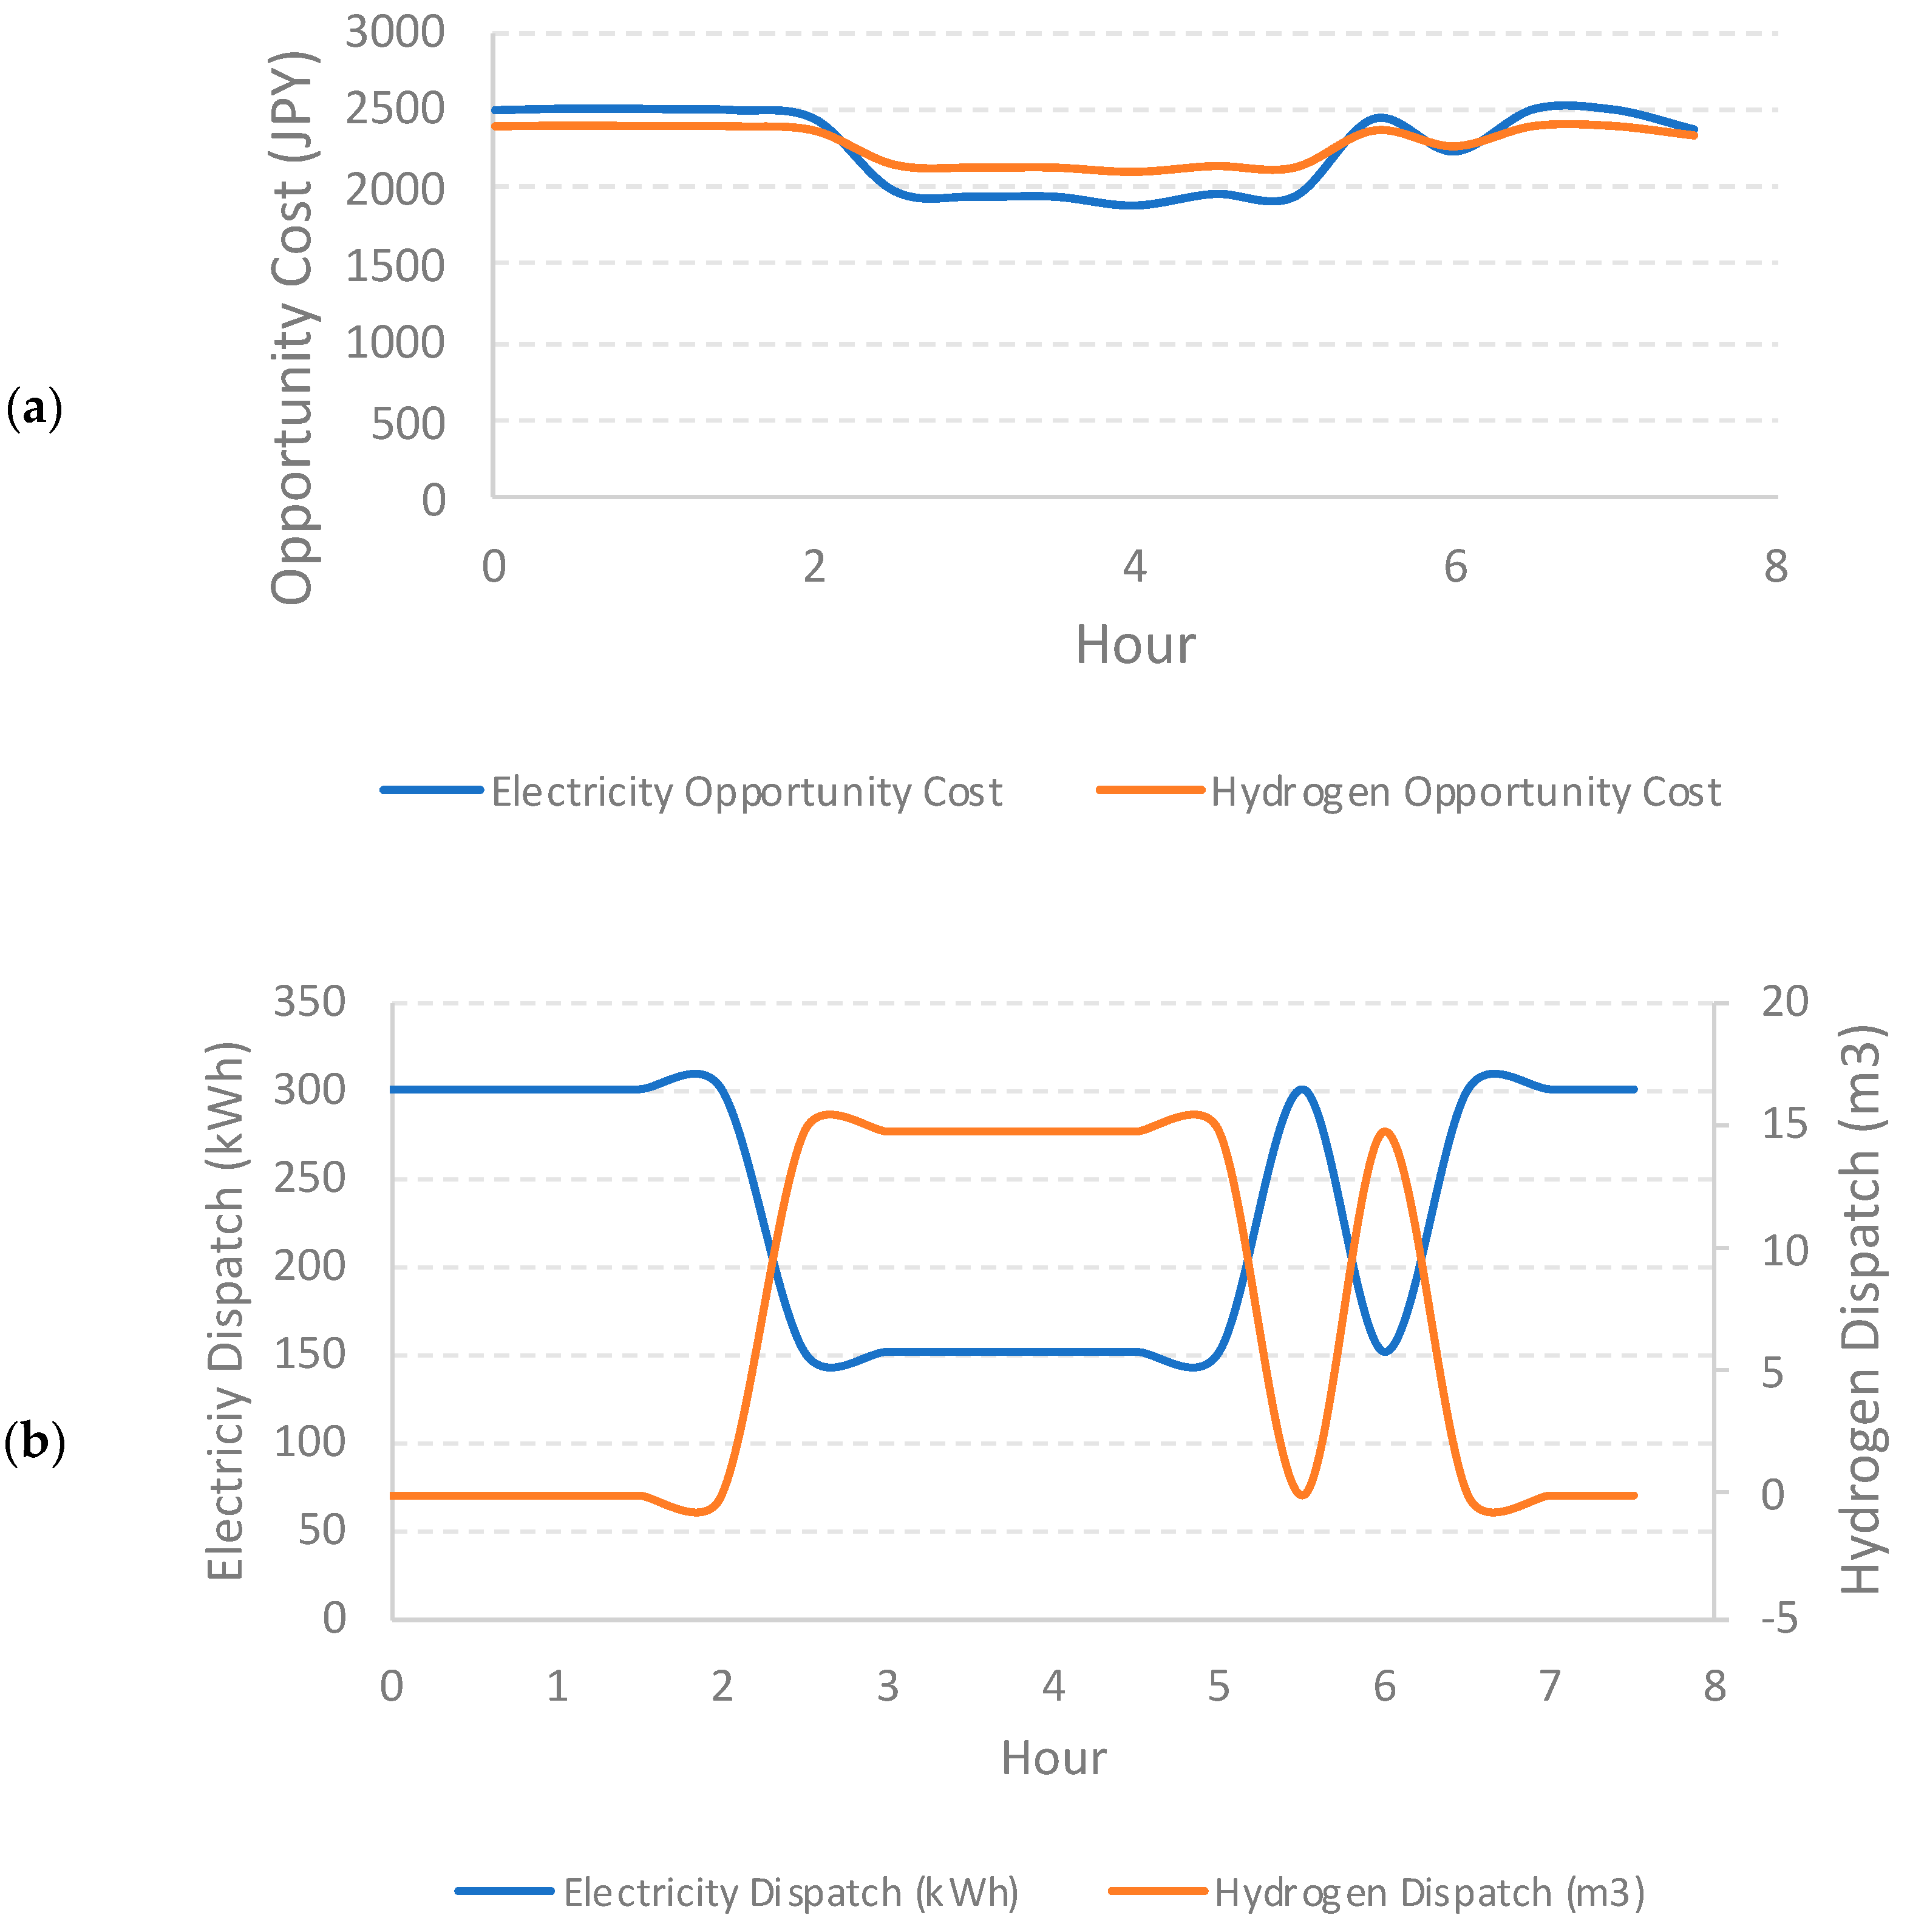
A sample 8 h dispatch window is shown in
Figure 6. The amount of revenue that the system would generate during each hour is calculated for hydrogen and electricity sales while operating in hydrogen production mode and electricity production mode, respectively, as shown in
Figure 6a. Hydrogen or electricity is then produced, depending on which opportunity cost is greater (see
Figure 6b).
3.1. Stochastic Optimization of LCOH
The stochastic optimization case performed economic dispatch on 100 different synthetic price time histories generated by sampling the trained electricity-price FARMA. The individual economic parameters were gathered for each of these runs, and the model returned the expected ∆NPV.
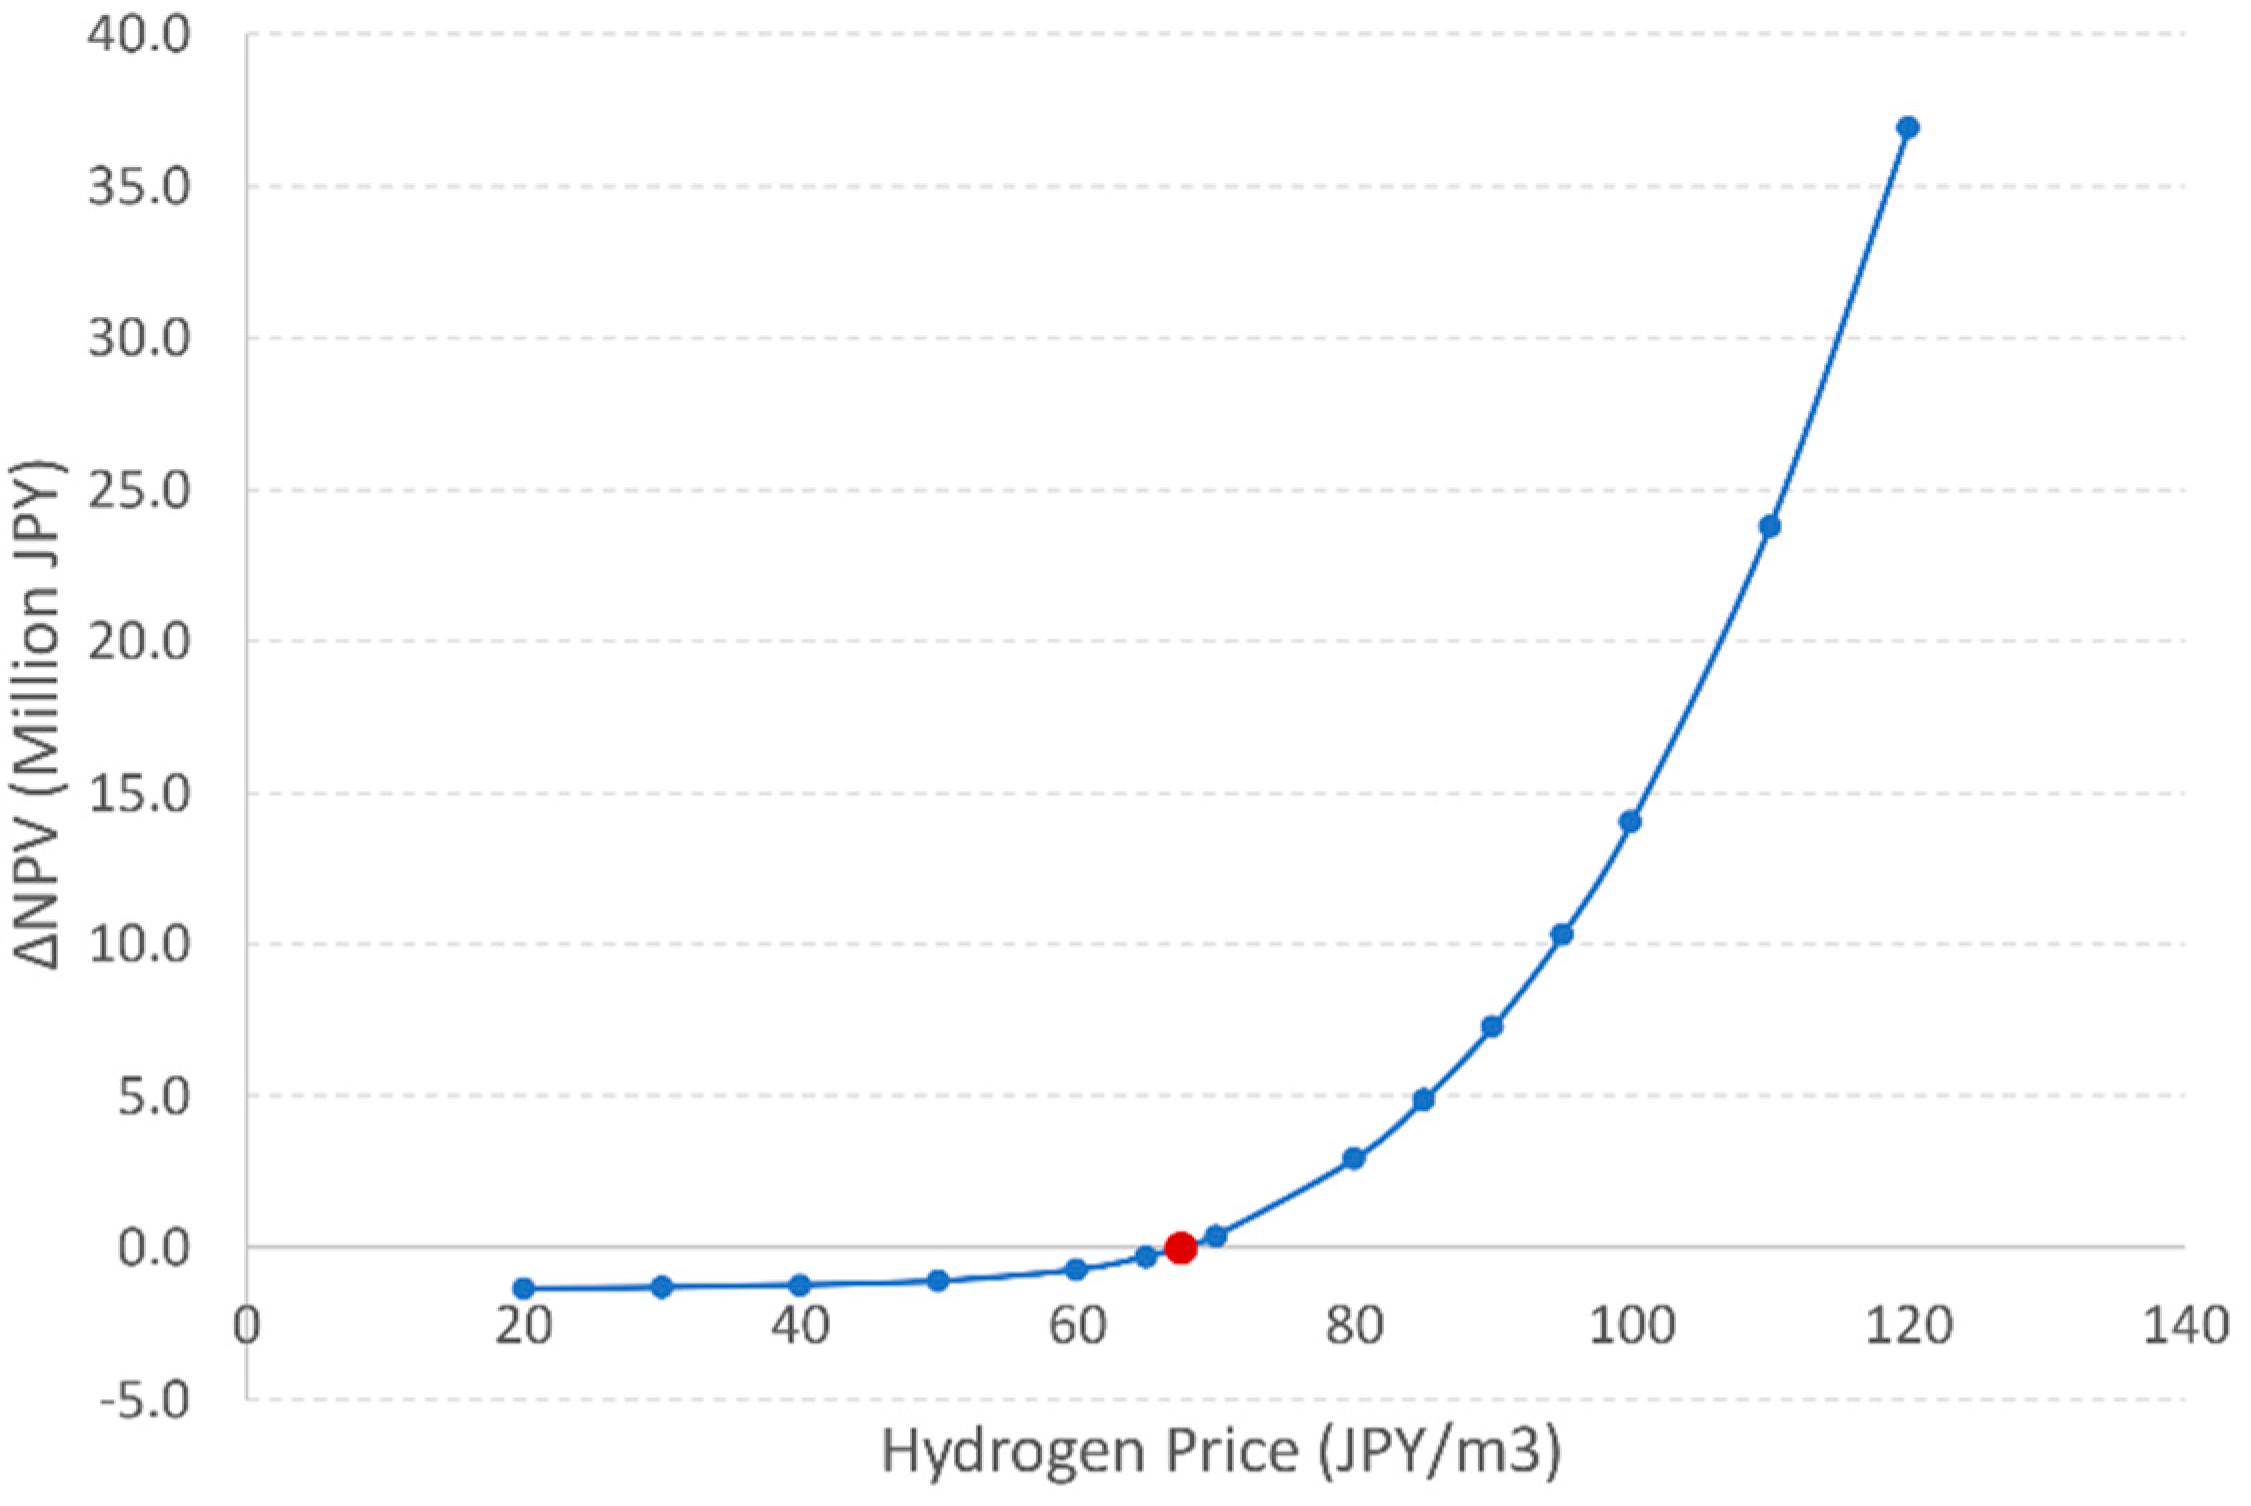
Figure 7 shows the relationship between hydrogen price and ∆NPV. Breakeven LCOH occurs at 67.5 JPY/m
3, when the ∆NPV is zero. Hydrogen prices were evaluated in increments of 10 JPY/m
3 (from 20 to 120 JPY/m
3), with higher resolution around the breakeven price of hydrogen.
Hydrogen prices above and below the LCOH offer insight into the system dynamics. With the IS cycle dispatched while hydrogen prices are less than the LCOH, too few hydrogen-producing hours exist to recover the capital expenditure incurred from building the IS unit. With hydrogen prices greater than the LCOH, hydrogen sale becomes economically advantageous in ample time, ultimately recovering—even exceeding—the capital cost.
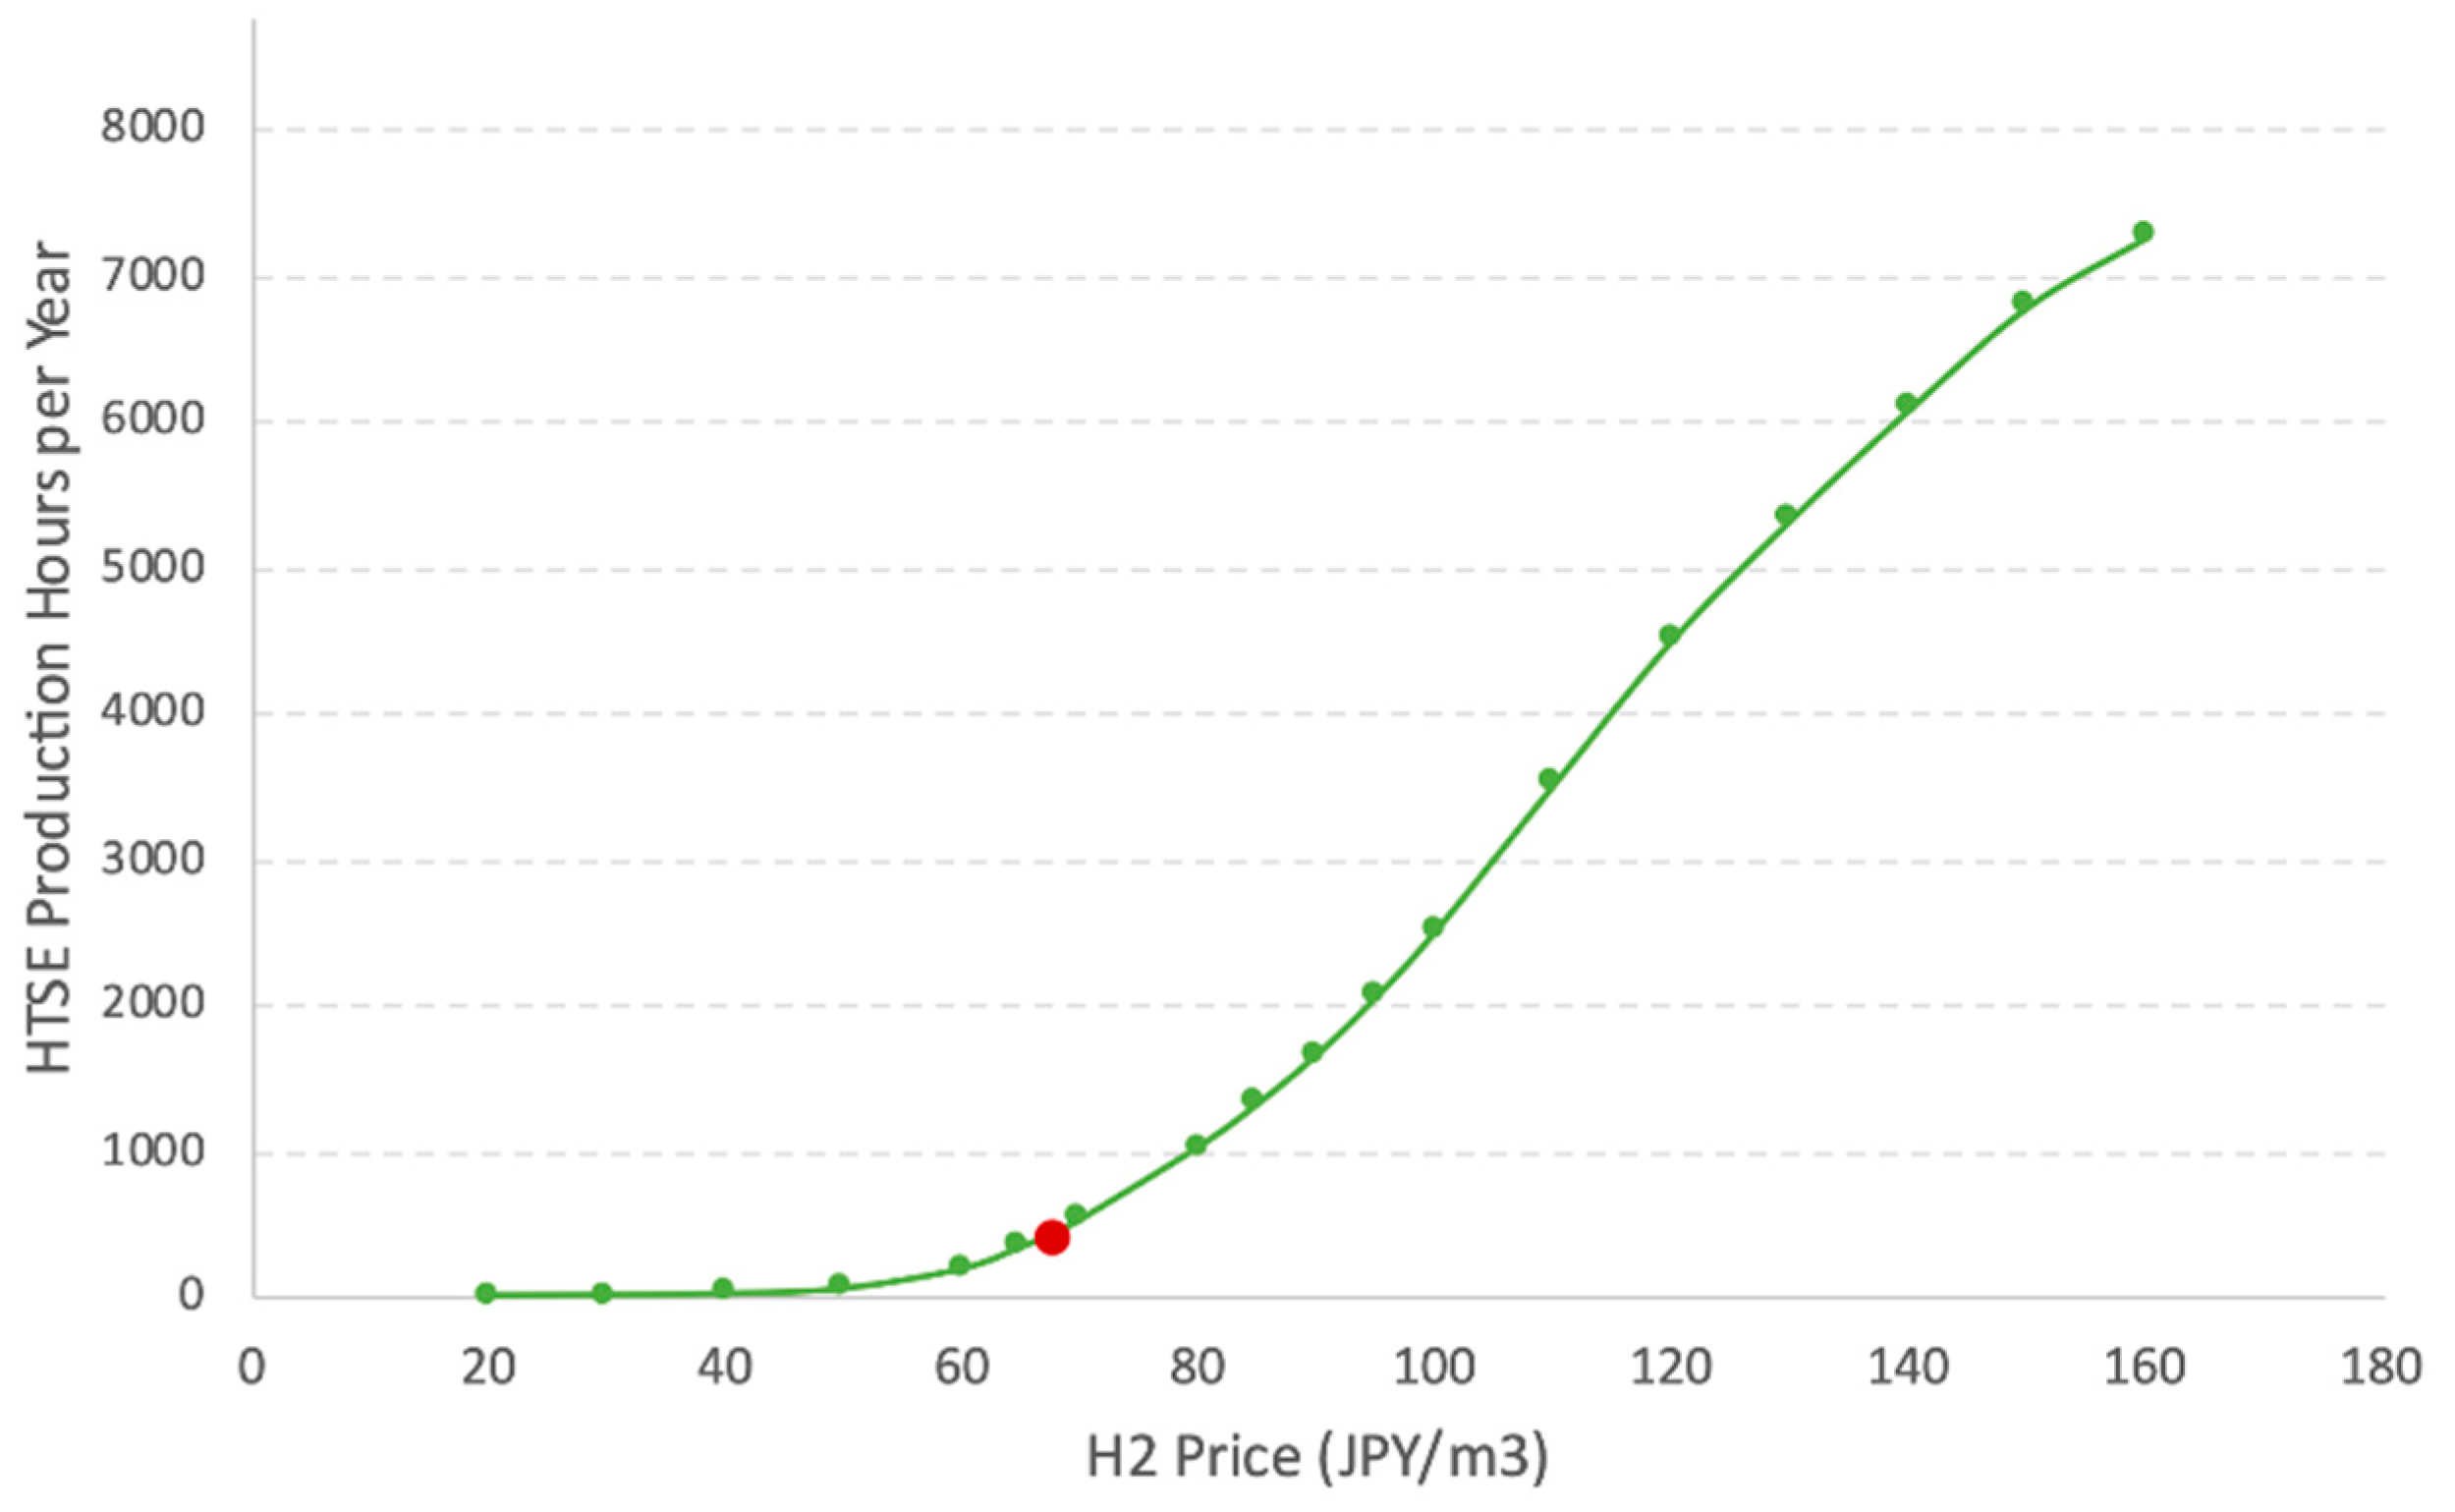
Figure 8 shows the number of hours per year during which the IS cycle dispatches hydrogen. At 40 JPY/m
3 or less, the hydrogen price is so low that the IS unit is never economically advantageous to dispatch. An LCOH of 67.5 JPY/m
3 equates to 431 expected hours of hydrogen production per year. Price increases result in boosting the number of hours in which hydrogen production is economically advantageous. At a high enough hydrogen price, the system would choose to dispatch hydrogen exclusively.
Table 4 summarizes the expected parameters for dispatch at the LCOH of 67.5 JPY/m
3 using synthetic price inputs.
3.2. LCOH with Historical Price Duration Curve
Comparing the stochastically optimized LCOH to one optimized using historical PDC data is useful for understanding the implications of the distribution tails on cost. The stochastic optimization case outputs the expected LCOH under a wide range of possible synthetic PDC. LCOH optimization using the historical dataset gives an example of the LCOH found on a PDC that is slightly skewed to higher prices.
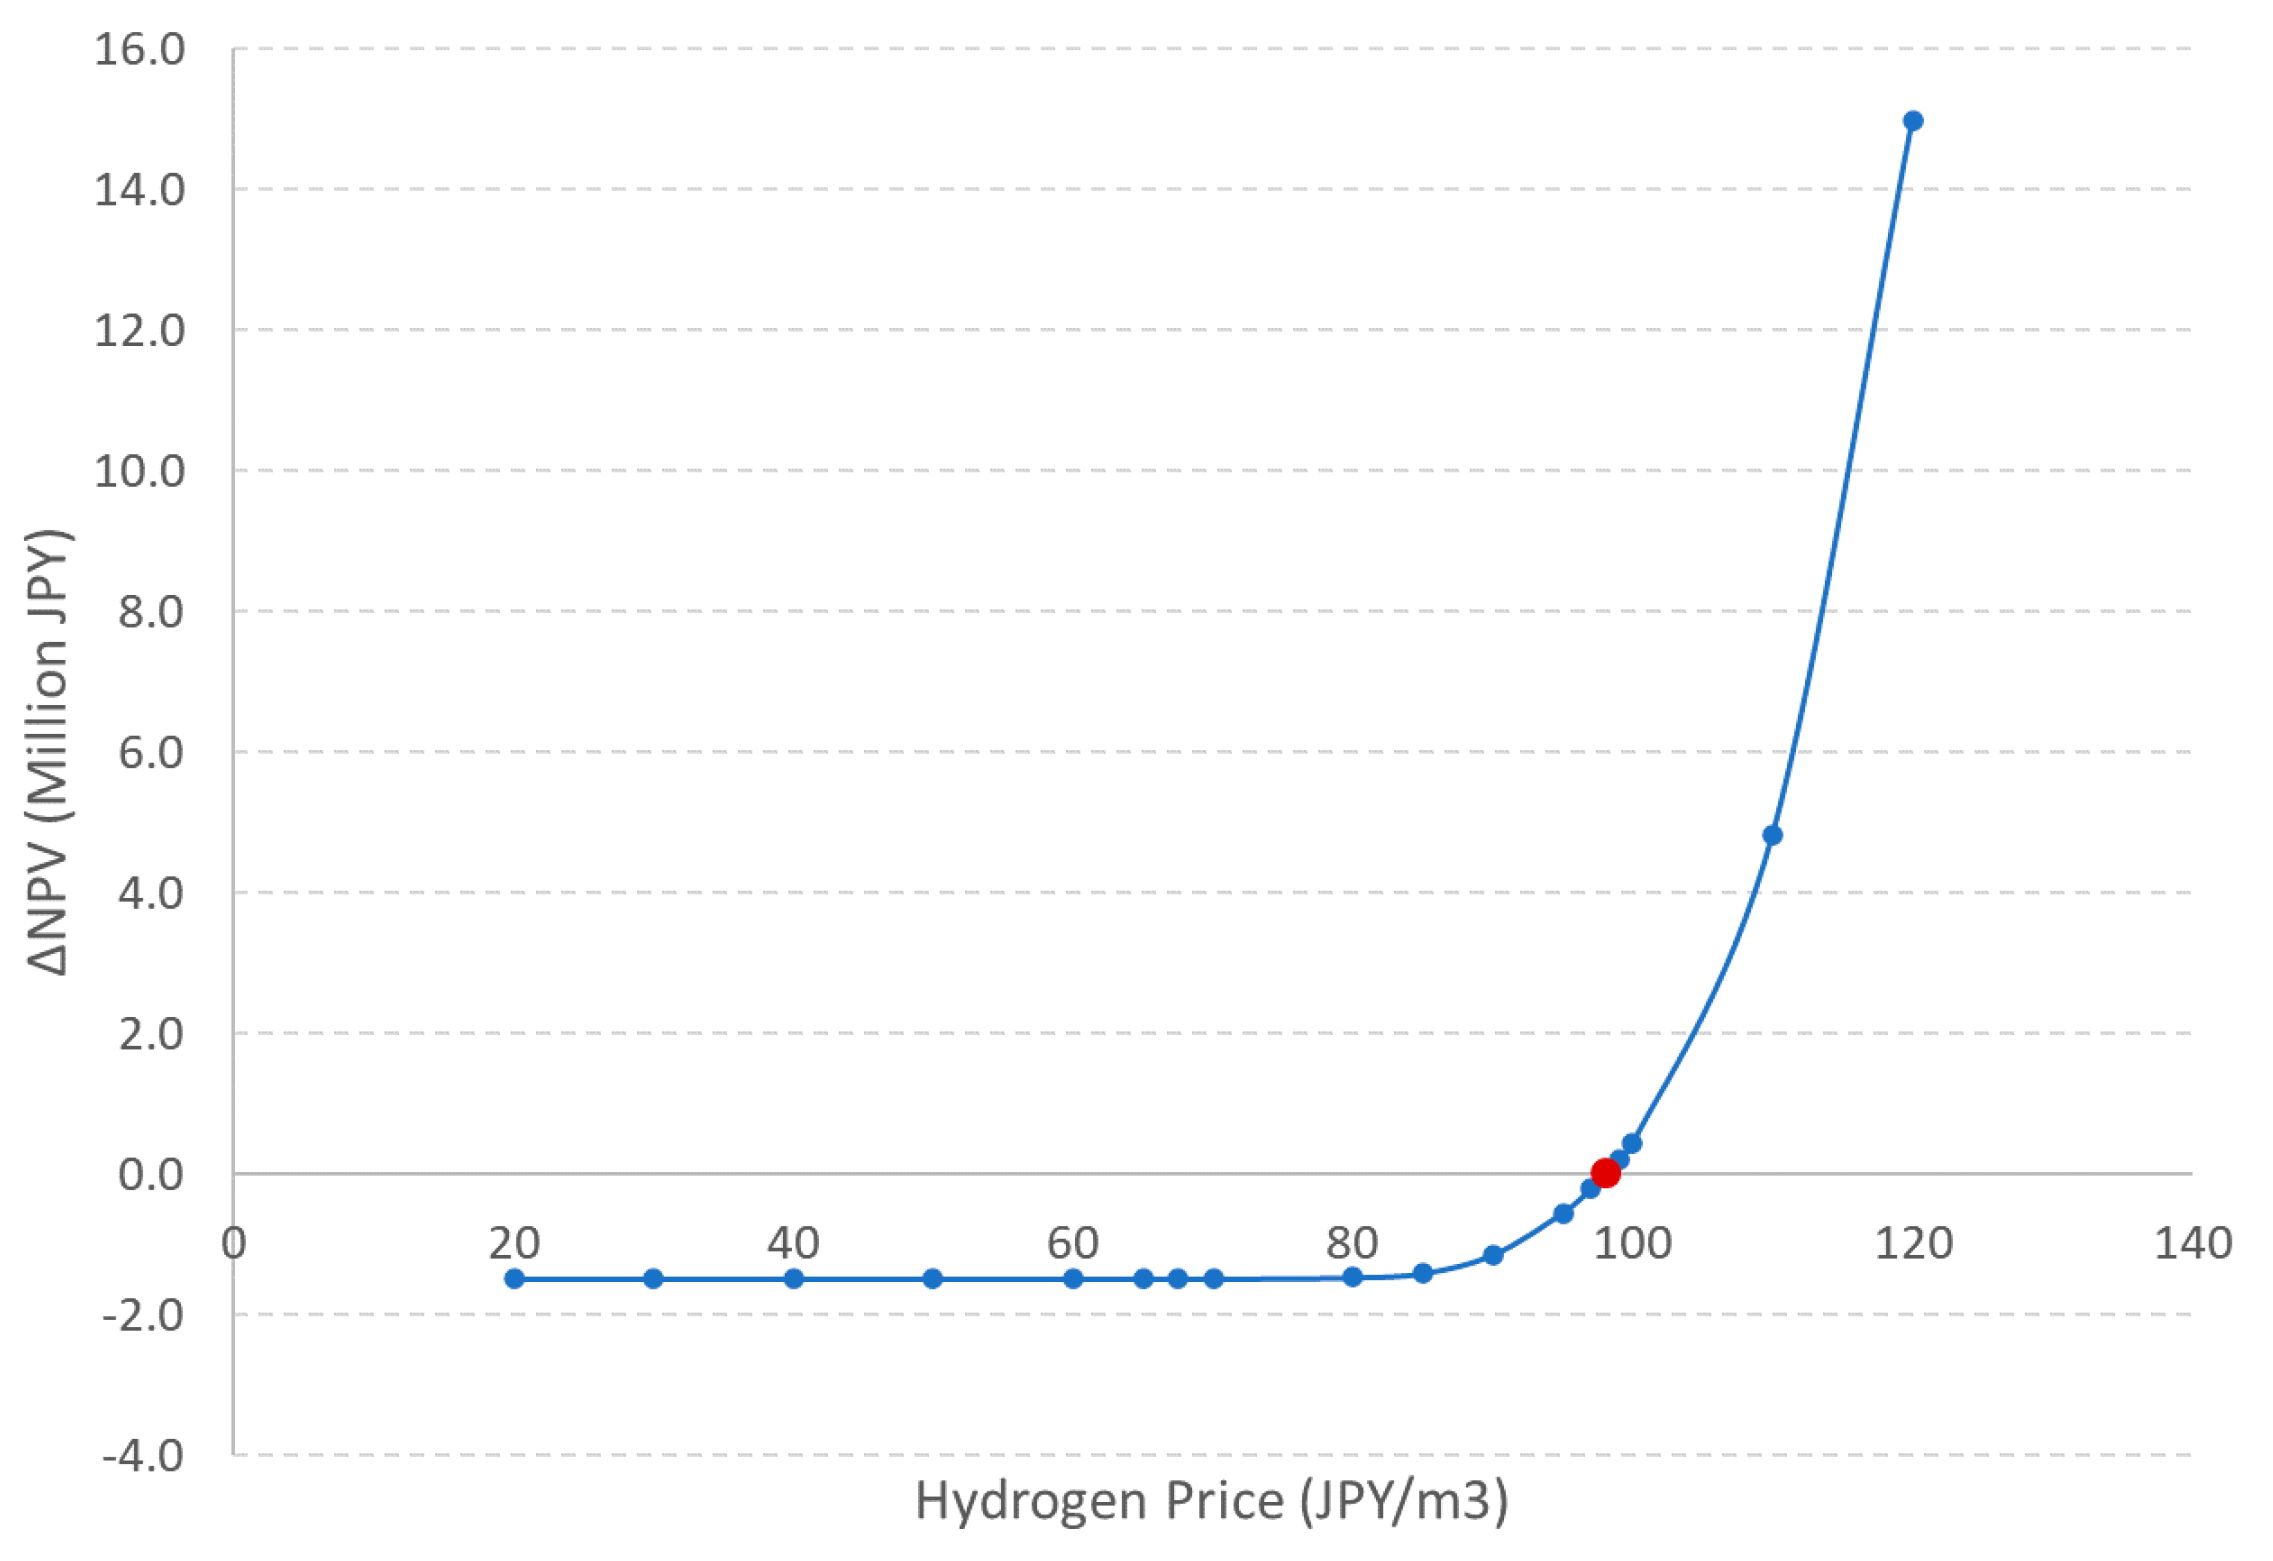
As with the stochastic case,
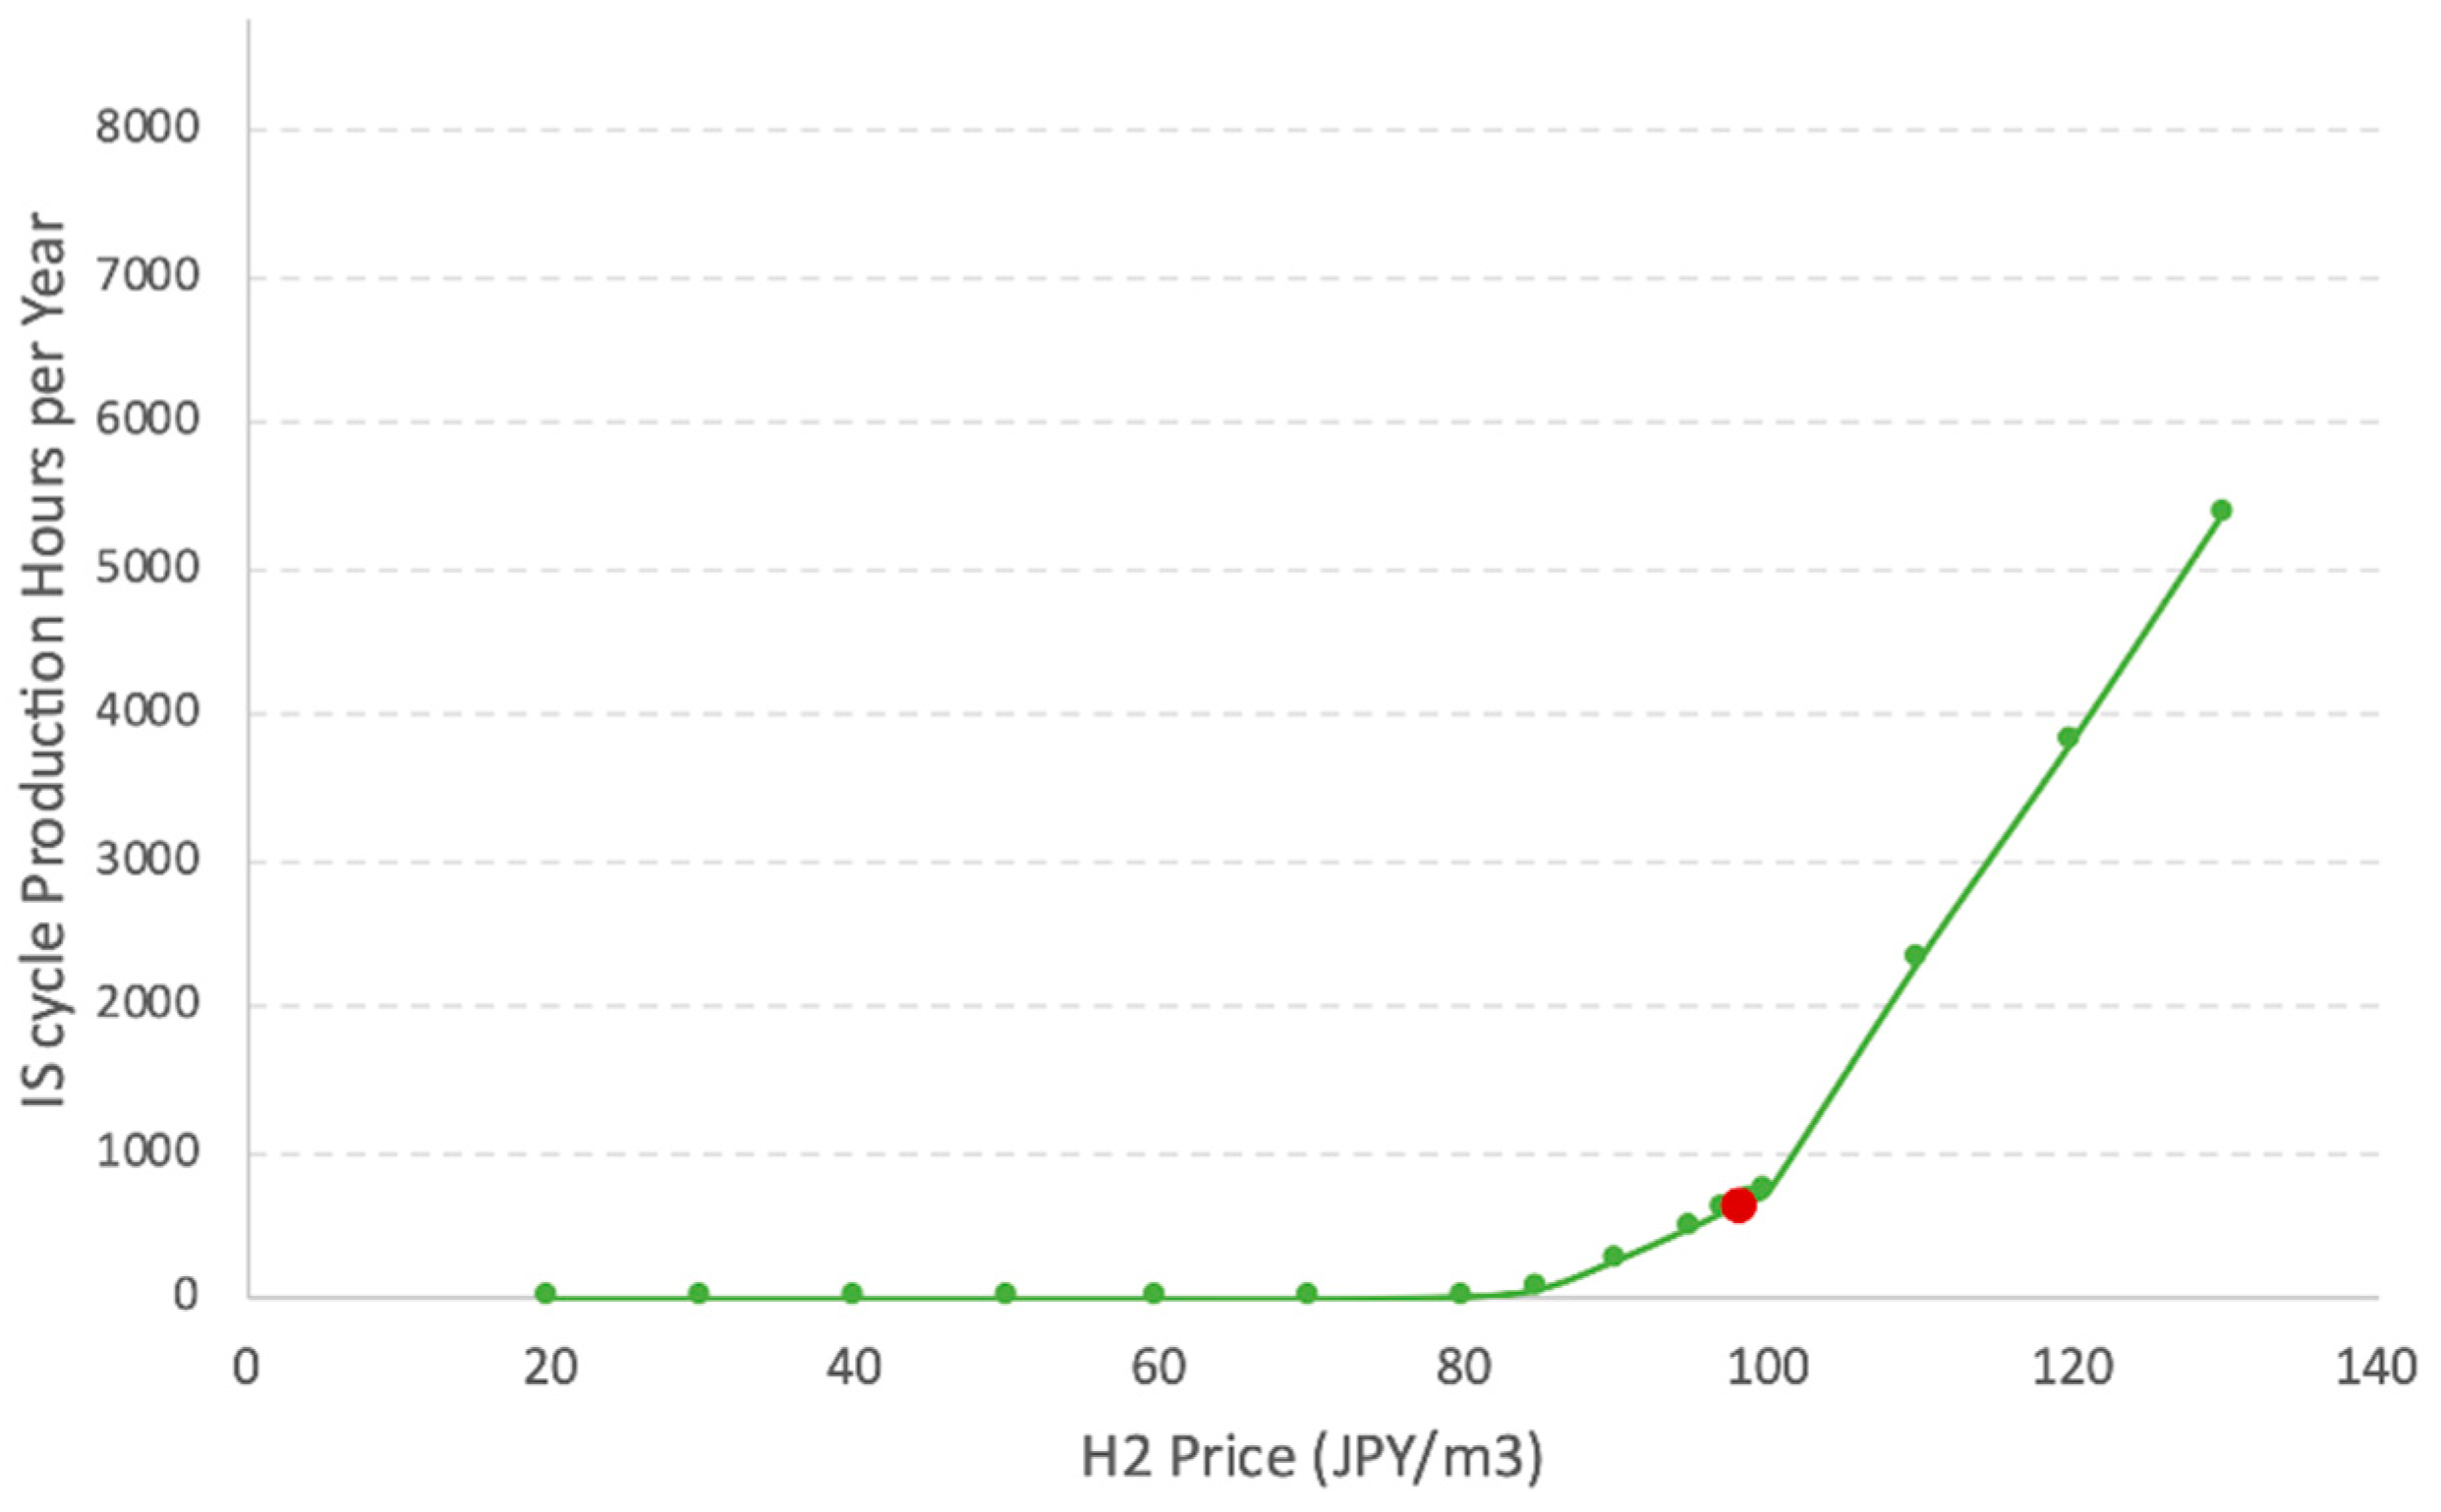
Figure 9 shows that hydrogen is not dispatched at low hydrogen prices and that there is a range in which a small amount of energy is dispatched for hydrogen production despite the inability to recover the IS capital cost. In this case, when hydrogen prices fall below approximately 80 JPY/m
3, the system does not dispatch hydrogen. At 80–98 JPY/m
3, a small amount of hydrogen is dispatched. At 98.1 JPY/m
3, the ∆NPV equals zero, thus representing the LCOH.
Figure 10 shows the IS unit’s utilization rate plotted against the hydrogen price. The utilization rate is zero hours when the hydrogen price is low. At an LCOH of 98.1 JPY/m
3, the IS unit produces hydrogen for 637 h.
Figure 10 shows the utilization rate of the IS under different hydrogen price conditions.
Table 5 summarizes the dispatch parameters found at an LCOH of 98.1 JPY/m
3 using historical price inputs.
4. Discussion
The reported LCOH values should not be relied on as a basis for making investment decisions. Rather, they help us understand the implications of different inputs so that when economic competitiveness is evaluated, the correct breadth of input data can be applied.
The effects of price distribution can be viewed by comparing the stochastic optimization case to the historical PDC case. The hydrogen dispatch is driven by two factors: the hours having the lowest electricity prices and the price of hydrogen. By raising the price of hydrogen, selling hydrogen becomes more profitable during more hours. Lower electricity prices and more incidences of low electricity prices also make hydrogen more economically advantageous than electricity.
The lowest-priced hours of the electricity price distribution are what dictate system profitability, since the capacity is fixed and the hydrogen price varied. The stochastic optimization case uses synthetic price histories in an attempt to produce the expected LCOH. On average, the synthetic histories showed lower electricity prices at the tail than did the historical price distribution. This led to a lower LCOH than in the historical case.
This lowest-priced hour distribution phenomenon is illustrated in
Table 6. The lowest 500 h of electricity prices from the year are averaged and compared with the LCOHs for several different synthetic histories. The average electricity price over the year is also provided. The LCOH shares a stronger correlation with the bottom-hour average than with the total yearly price average. By way of comparison, the LCOH at the stochastic mean and historical points are
$0.64/m
3 and
$0.78/m
3, respectively at an exchange rate of 106 JPY/USD.
Synthetic data produced using the ARMA method outputted cheaper bottom-500 h price averages, as well as overall average prices that were lower than the historical averages. This meant that the distribution of PDCs was slightly more favorable to hydrogen dispatch than the historical PDC. As such, the LCOH was lower in the stochastic case than in the historical case.
This analysis demonstrates that careful consideration should be taken when applying PDCs to this type of economic dispatch problem. The breakeven price of hydrogen highly depends on the PDC input. Stochastic optimization helps reduce uncertainty, but care should still be taken to produce PDCs that are meaningful with regard to the chosen timeframe of analysis. For example, using a 2020 PDC to predict the 2030 LCOH would be inappropriate. A projection of 2030 prices would be acceptable, but the best practice would be to use a host of projected possibilities to produce an expected LCOH.
The results from this study also show that lower overall electricity prices and more incidences of low prices would provide greater economic incentives for hydrogen production. This means that NPPs in locations with depressed electricity prices due to factors such as zero- or negative-bid renewable energies, mild climates, or low electricity demand could provide hydrogen at a lower price yet still break even or potentially turn a profit.
Several other pathways exist for reducing the LCOH. Reducing capital expenditure would depress the LCOH. The effects and sizes of potential storage options could be explored in more detail. Additional cashflows generated by the NPP’s ability to participate in other areas of the electricity market would lower the ∆NPV and thus the LCOH, as well. Before investment decisions are made, each of these sensitivities should be investigated to better understand their feedback.
5. Conclusions
This analysis explored the economics of dispatching a nuclear-IS cogeneration unit. The results demonstrate the economic potential of such a system when compared to only selling electricity. These results highly depend on input assumptions, specifically the magnitude and distribution of electricity prices. Historical input electricity price data model runs show that a 98.1 JPY/m3 LCOH was needed to break even under the specified conditions. Model runs with synthetically produced electricity price data for stochastic optimization found that an LCOH of 67.5 JPY/m3 was required.
The LCOH in this report should not be taken as a final value for the HTTR-GT/H2’s profitability, but as an exploration of the impacts of input assumptions on the final answer. Special care should be taken in this type of dispatch analysis to produce a host of meaningful electricity price time histories that represent possibilities for the evaluation years. In this regard, the FARMA approach shows great potential.
This study also serves as another indicator that dispatching hydrogen and electricity could be more economically advantageous than just selling electricity under the right conditions. Much of the nuclear hydrogen production and dispatch work focuses on light water reactors and U.S. electricity markets while focusing on electrolysis hydrogen production technology. This study performs the economic dispatch on a unique reactor, hydrogen production system, and electricity market and shows the breakeven price of hydrogen. Performing this analysis at different locations and with different technologies is important for understanding the economic competitiveness of producing hydrogen from nuclear energy.
Efforts to further this research could include running a larger stochastic optimization case aimed at optimizing the size of the IS unit on a commercial reactor or at optimizing different sensitivities (e.g., capital cost).


