Abstract
The annual waste heat available from industry in the European Union is more than 2700 PJ. Consequently, the utilization of the unexploited thermal energy will decisively contribute to a reduced overall power consumption and lower greenhouse gas emissions. In the present investigation, a cycle layout, based on supercritical carbon dioxide (sCO2), was applied for a certain waste heat source, a gas compressor station. The boundary conditions determined by the cycle were used by the numerical code ANSYS CFX to design a pre-cooler. Subsequently, this printed circuit heat exchanger was examined for sCO2 mass fluxes between 100 kg/m²s and 900 kg/m²s. The heat transfer and pressure drop increase as the flow channel diameter is reduced. As the pressure drop of the coolant channel is more sensitive to the diameter, a larger coolant channel diameter is selected to maintain a reasonably low pressure drop. The optimum pre-cooler design consists of a 0.5 mm and 0.8 mm channel diameter for the sCO2 and coolant channel. Based on these results, internal fins were applied and optimized, to improve the heat transfer performance. An internal fin height of 4 mm was found to achieve the optimum thermal-flow performance for the pre-cooler.
1. Introduction
Enhanced energy utilization is an looming requirement in many industrial processes in order to reduce energy consumption while maintaining economic prosperity [1]. One of the highest energy demands occurs in the industrial sector. A considerable amount of the consumed energy is however rejected and lost to the environment as waste heat. Thus, the recovery of the waste heat is essential to improve the overall energy utilization, to enhance process efficiency and to reduce the carbon footprint of industrial applications. Existing technologies for waste heat recovery aim to reconvert the waste heat into mechanical energy and thus into more electrical power. The supercritical carbon dioxide (sCO2) power cycle represents an attractive alternative to established power cycles. These power cycles offer a variety of advantages, such as a high conversion efficiency and a turbomachinery with high power density. An essential component in a sCO2 power cycle is the pre-cooler. This heat exchanger cools the CO2 close to its critical point, in order to achieve optimal compressor inlet conditions and thus minimize the compression work. The design of the pre-cooler may be a challenging task due to the complex heat transfer behavior [2].
Thus, Liao and Zhao [3] experimentally investigated the heat transfer of carbon dioxide under cooling conditions in horizontal tubes of 0.5 mm to 2.16 mm diameter. The influences of mass flux, inlet temperature, and pressure were investigated. The results showed a significant influence of buoyancy on the heat transfer coefficient (HTC) up to a Reynolds number of 105. The influence became weaker with decreasing tube diameter and increasing Reynolds number. Dang and Hihara [4] investigated the heat transfer and pressure drop of CO2 in horizontal tubes with diameters between 1 mm and 6 mm. In that study, the heat transfer coefficient increased with the mass flux and reduced tube diameter. Ngo et al. [5] performed experiments with zigzag and s-shaped fins on micro-channel heat exchangers. The s-shaped fins showed slightly smaller heat transfer, but significantly less pressure drop compared to the zigzag channel configuration. Li et al. [6] performed experimental investigations on the heat transfer of CO2 in printed circuit heat exchangers under heating and cooling conditions. The heat transfer coefficient reaches a maximum when the temperature approaches the pseudo-critical point (the pseudo-critical point is defined as the temperature, for a given pressure, at which the specific heat exhibits a maximum). In the numerical work of Pitla et al. [7] the turbulent heat transfer of sCO2 under cooling conditions was studied. A validation of the numerical model by experimental data was done. Van Abel et al. [8] applied numerical methods to investigate a printed circuit heat exchanger with zigzag channels regarding heat transfer and pressure drop. The zigzag channels achieved great heat transfer compared to the straight channel layout. Serrano et al. [9] developed mathematical models based on empirical correlations for the heat transfer of printed circuit heat exchangers. Based on these model optimized sizing and performance of heat exchangers for fusion power plants were proposed. Xu et al. [10] studied airfoil-shaped fins in a printed circuit heat exchanger. It was found that the staggered fin arrangement is more suitable than a parallel fin arrangement. Baik et al. [11] investigated the performance of wavy-channel printed circuit heat exchangers and found a significant enhancement compared to straight channels. Furthermore, an increase of wave amplitude or decrease of wave period improves the heat exchanger performance. In the numerical model of Wang et al. [12] the turbulent heat transfer of cooled sCO2 in horizontal tubes was studied. A wide range of different operation condition was analyzed and heat transfer correlations were proposed. The heat transfer increases with mass flux, tube diameter and close to the pseudo-critical point.
From the literature survey it can be seen that several studies have analyzed the heat transfer behavior of sCO2 under cooling conditions by experimental and numerical methods. Some authors investigate novel channel geometries and flow paths such as airfoil-shape and zigzag channels. The present study aims to propose a pre-cooler for a sCO2 power cycle which recovers industrial waste heat. Based on the boundary conditions, determined by a power cycle layout, the channel diameters for both fluids, sCO2 and water as the coolant, will be numerical optimized. For the optimum design an internal fin geometry will be introduced and studied.
2. Analysis of Industrial Waste Heat Sources
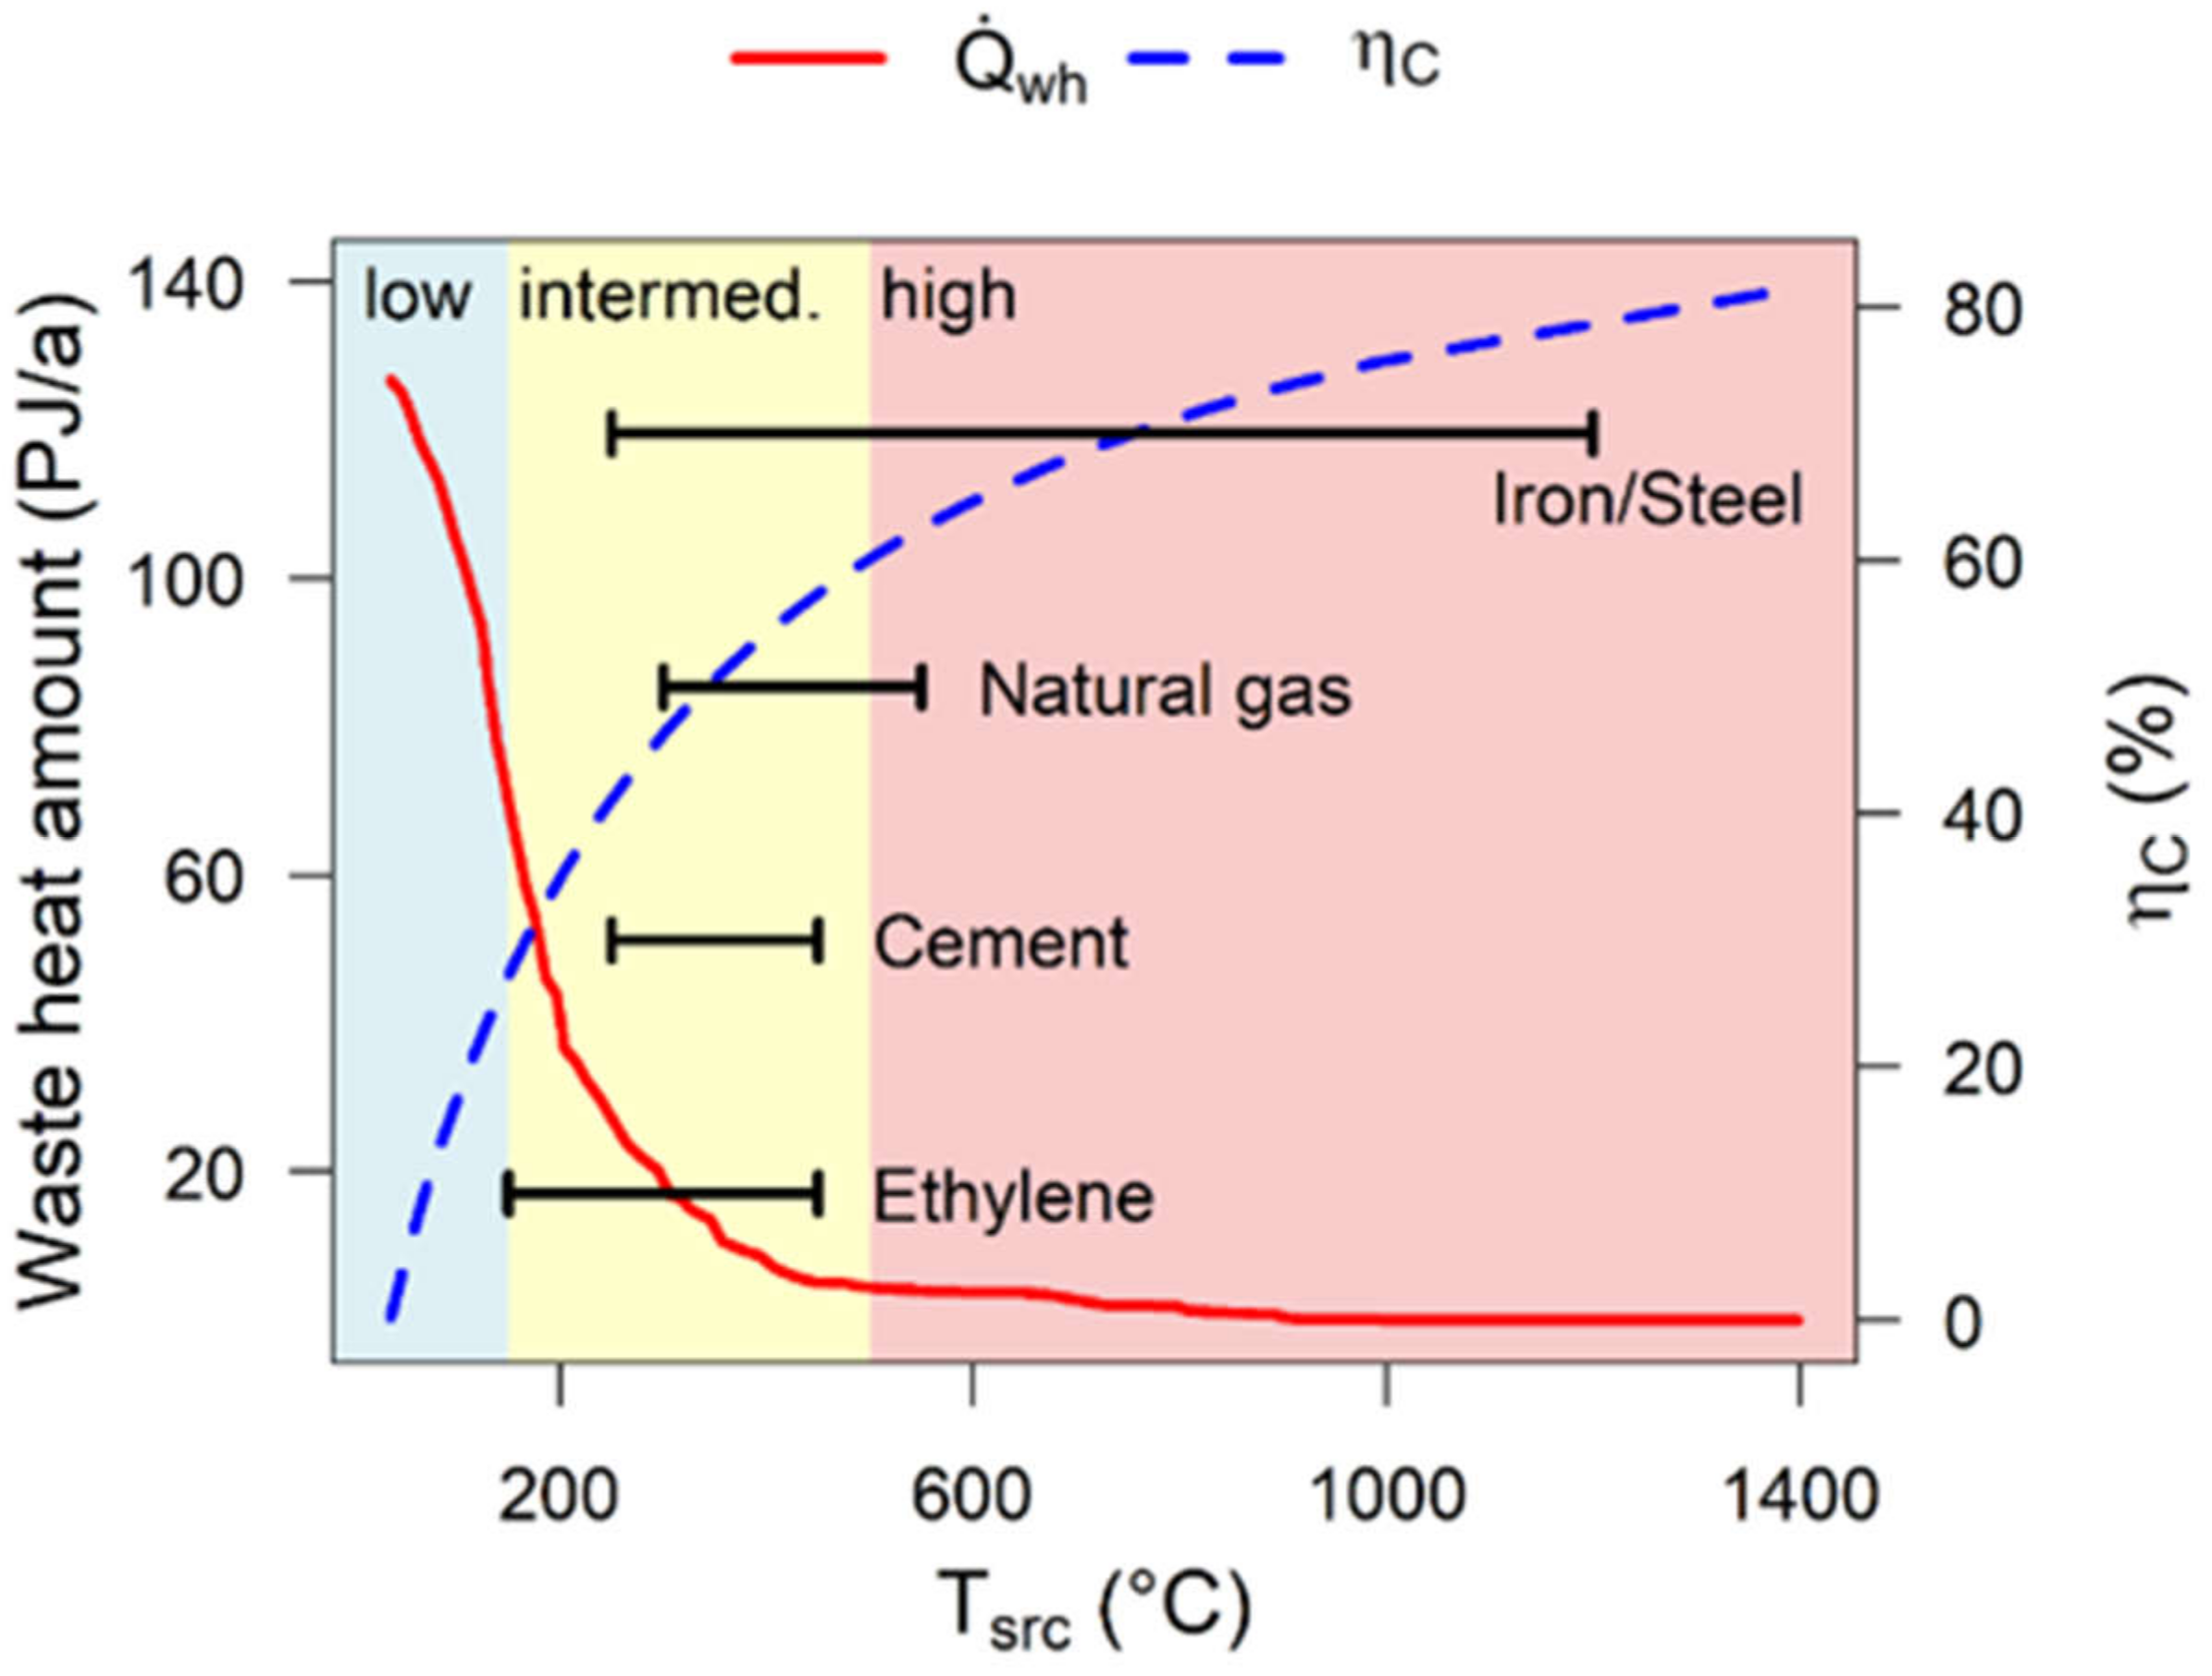
2.1. Waste Heat Scource
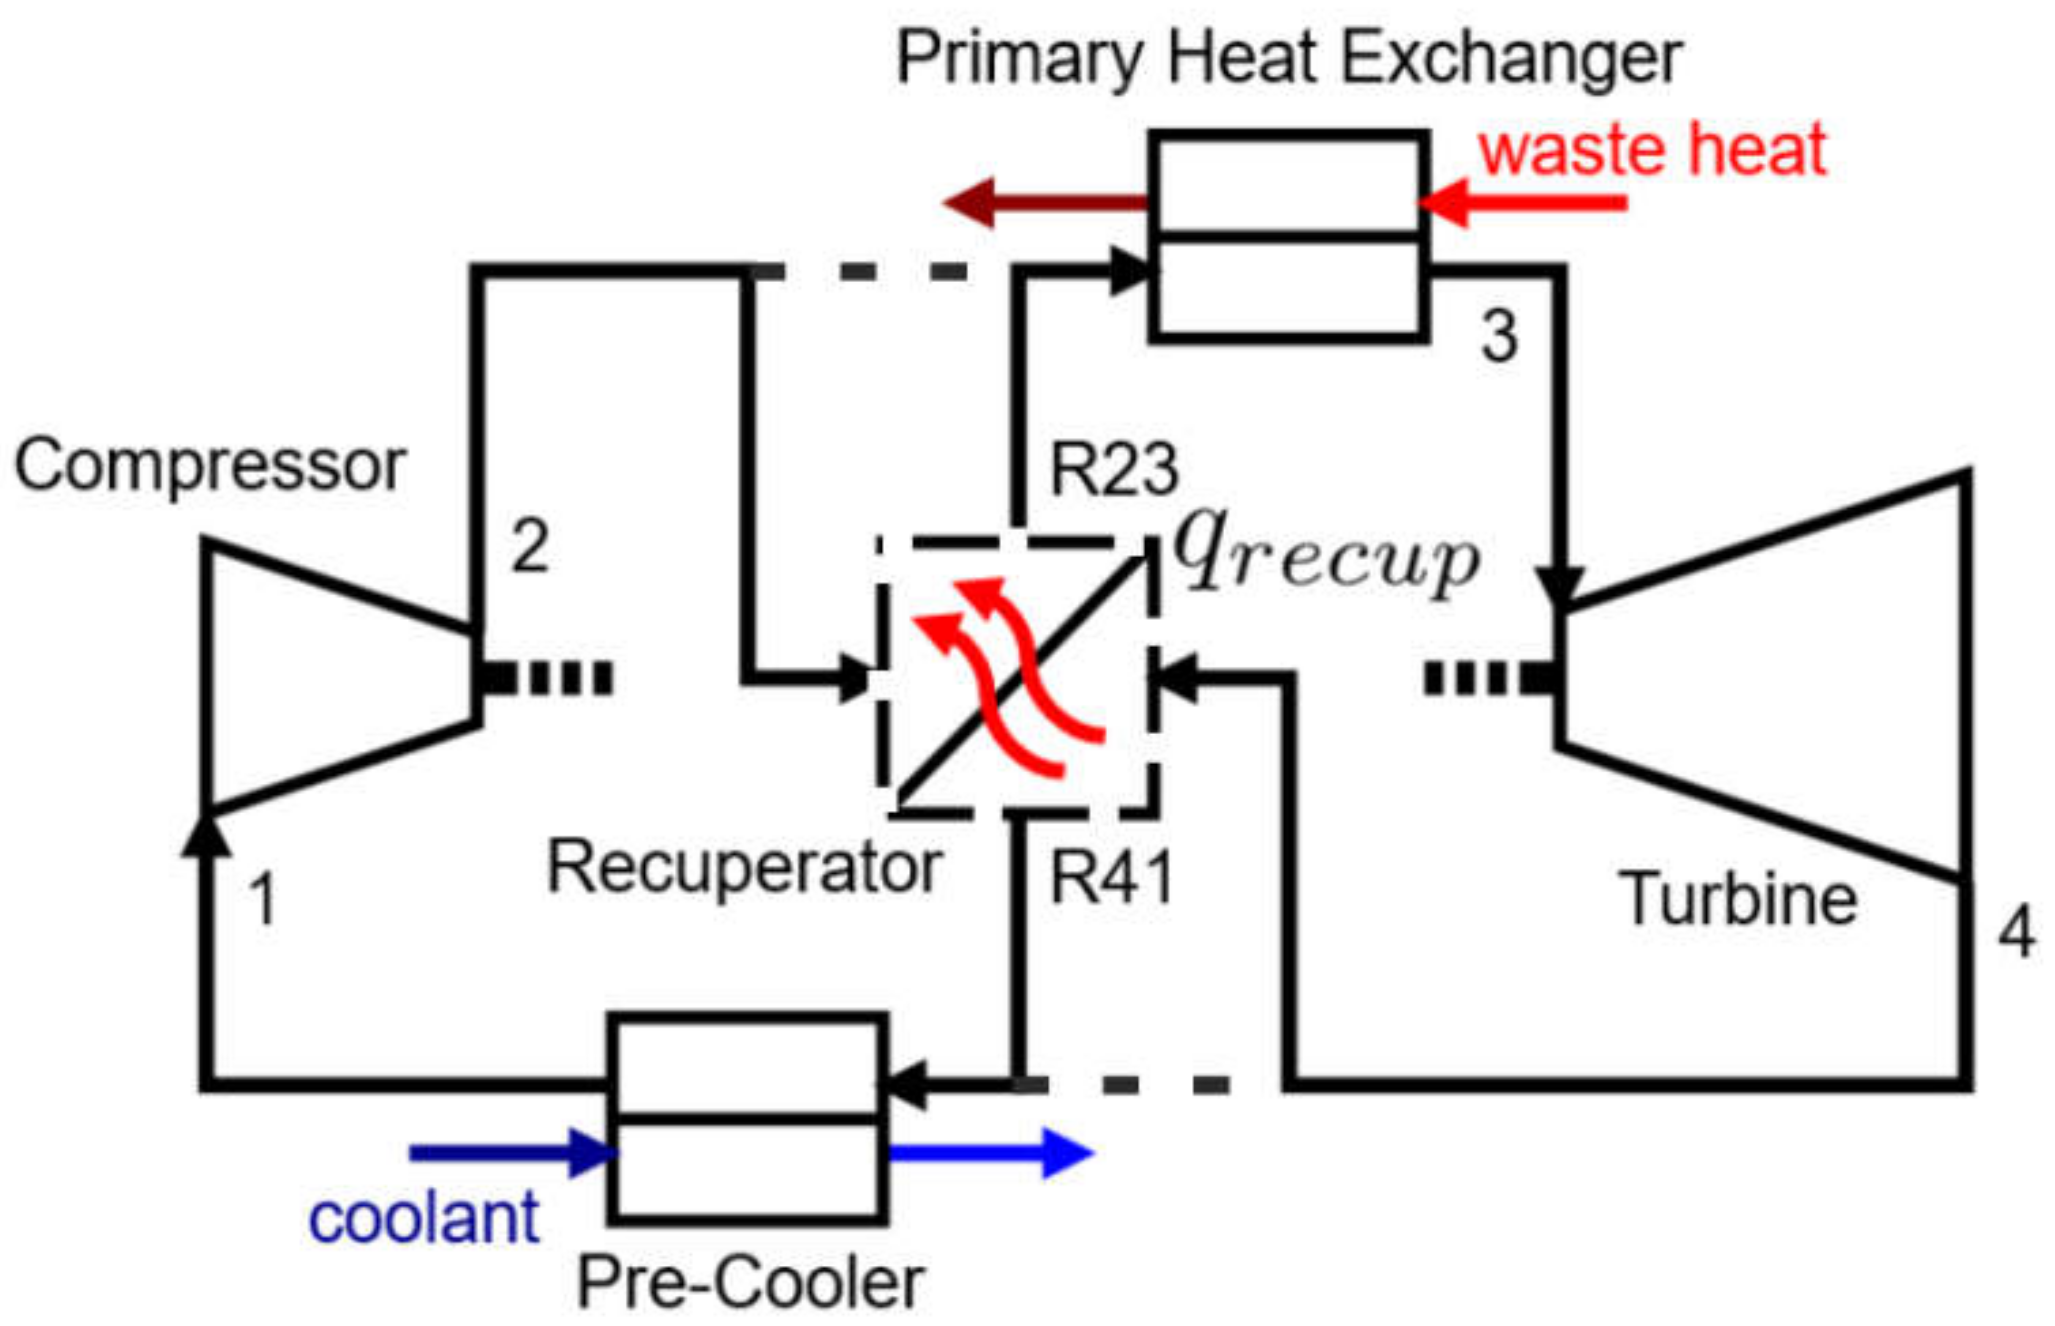
Industrial waste heat is heat which arises in industrial processes as an undesired byproduct due to inefficiencies and thermodynamic limitations of the equipment and processes. This section aims to give an overview on the current status of the recovery of industrial waste heat in the European Union. In the present study the sources will be analyzed based on heat quantity and heat quality. In the end of the section, a possible industrial waste heat source will be selected for the subsequent investigation.
The project “Heat Roadmap Europe” aims to analyse the heating and cooling sector in Europe in order to identify their potential for sustainable heating and decarbonization [13]. In the study of Connolly et al. [14] the industrial waste heat amounts of 27 individual countries in the European Union were presented. In another study, Persson et al. used the European Pollutant Release and Transfer Register in combination with sector-specific standard efficiencies to determine the waste heat potential [15]. The distribution of the potential waste heat amount of the individual different European countries can be found in both studies.
Brückner [16,17] estimated the lower limit of waste heat from exhaust gas for Germany from the emission law database. A lower reference temperature of 35 °C was assumed as a standardized value to evaluate the waste heat potential. The cumulative industrial waste heat amount of Germany is shown in Figure 1 for different temperature , Carnot efficiency and amounts of waste heat . The most relevant industry sectors for utilizing waste heat are the cement industry, ceramic industry, iron and steel industry, aluminum and copper industry, glass industry, chemical industry, gas transmission and storage, paper and pulp industry as well as the food industry. Higher temperatures offer higher efficiency and thus greater potential to utilizes the thermal energy and generate electricity. However, at higher temperatures the waste heat amount is less and that leaves only a few industry sectors. Nevertheless, a reasonable order to exploit the industrial waste heat would utilize the high temperature sources first and gradually applies the lower temperature sources.
Figure 1.
Cumulative industrial waste heat amount of Germany with respect to temperature and Carnot efficiency, adaption based on [17].
It is evident that the extraction and transport of natural gas has a considerable waste heat potential. For the present study, a specific industry is selected as an example for waste heat recovery. In this context, the exemplary waste heat utilization of a gas compressor station was selected as a reference for this study. In this case, the main component delivering the mechanical energy for the compression usually is a gas turbine, fueled by the natural gas branched from the pipelines with an air-fuel equivalence of λ = 5. The waste heat of this turbine remains unused in many cases and was therefore considered as a heat source for the present investigation. The parameters were oriented at the MAN 1304-12N [18]. The mass flow rate is , the stream flow temperature is and the waste heat flow rate is . A steady-state operation of the waste heat source was assumed for the subsequent calculations.
2.2. Cycle Layout
There are several sCO2 power cycle layouts to convert thermal power into mechanical power. A mathematical model of the power cycle was developed in MATLAB (The MathWorks, Inc., Natick, MA, USA) and two scenarios were analyzed. As shown in Figure 2 these are a simple layout including compressor, primary heat exchanger, turbine and pre-cooler, as well as the same layout including a recuperator.
Figure 2.
sCO2 power cycle for waste heat recovery.
Both designs were calculated for a minimum pressure of 75 bar, a minimum temperature of 35 °C, a terminal temperature difference of 5 K, an efficiency of the turbine of 90%, an efficiency of the compressor of 85% and an efficiency of the recuperator of 90%.
As one can see from Figure 3 the net power output of the recuperated cycle is only 5% higher compared to the power cycle without recuperator. Since the heat exchanger inlet temperature is higher in case of a recuperated cycle, the heat flow of the waste heat stream can only be utilized to this lower temperature. As a consequence, waste heat stream temperature leaves the primary heat exchanger at higher temperature and a considerable amount of thermal energy will not been used. In future studies the utilization of the remaining heat will be investigated. Based on this result, a pre-cooler was selected operating at an inlet pressure of 7.5 MPa, a mass flow rate of 85.6 kg/s and temperature up to 352 °C.
Figure 3.
Net power and heat duties of the sCO2 power cycle.
3. Numerical Model
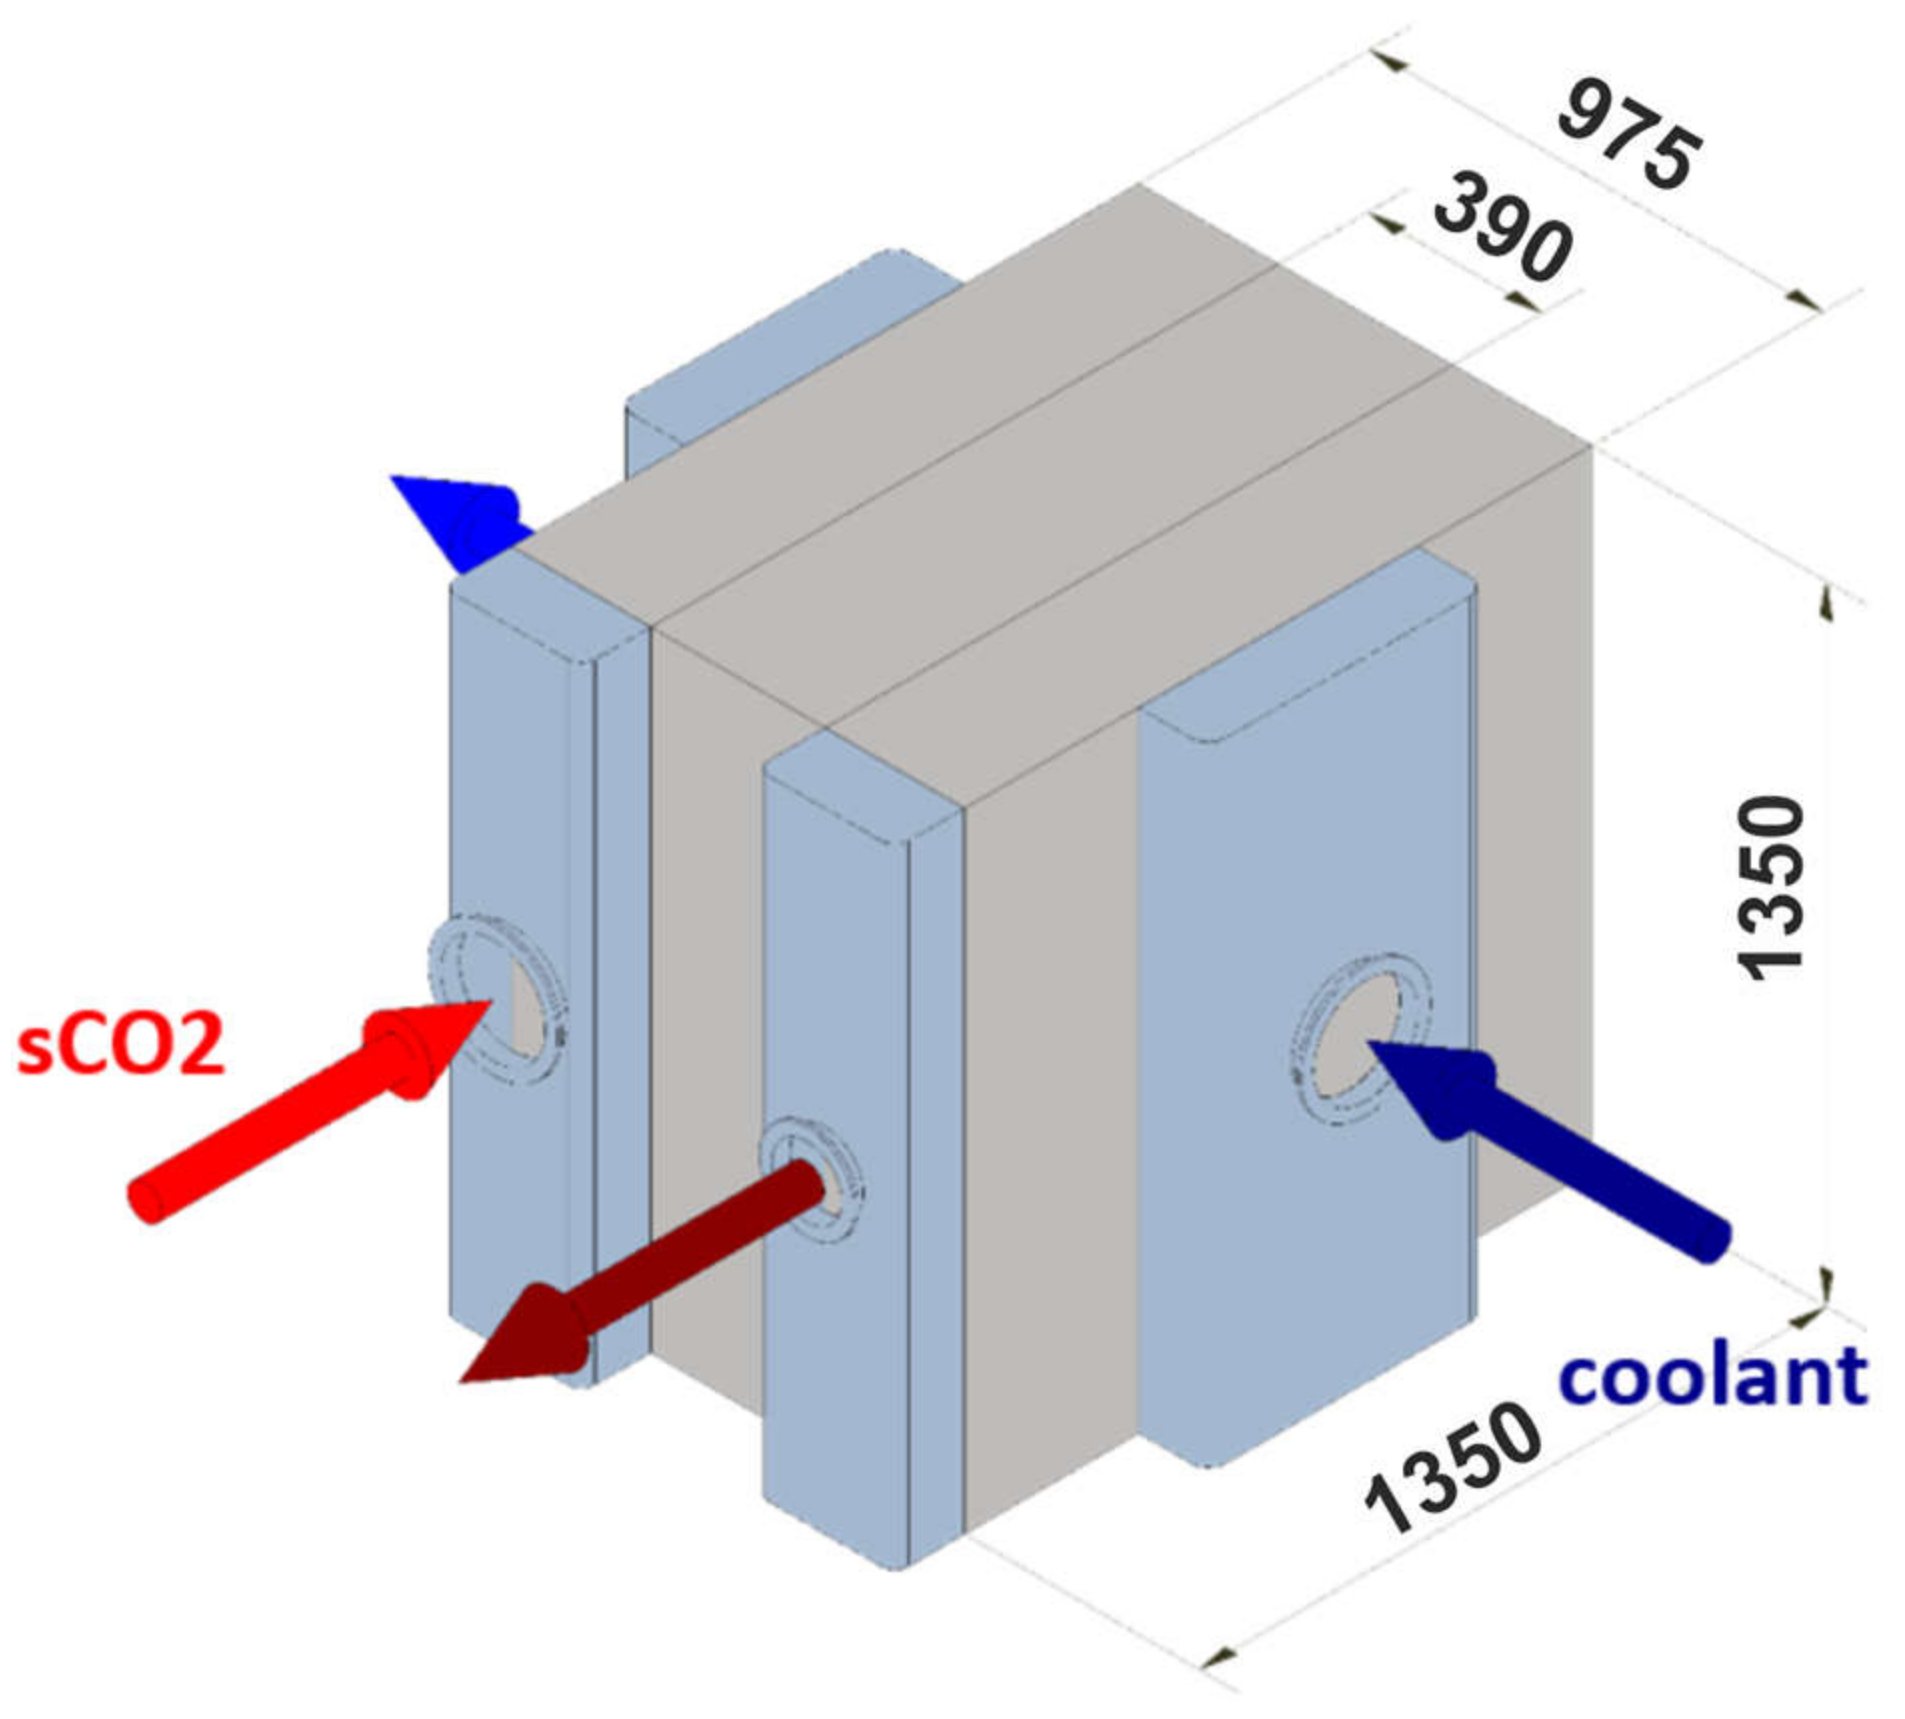
3.1. Boundary Conditions and Geometry
The commercial fluid dynamic code ANSYS CFX (Ansys, Inc. Canonsburg, PA, USA) was applied to simulate the pre-cooler. The geometry of the printed circuit heat exchanger consists of a semi-circular sCO2 channel, a semi-circular coolant channel and a heat exchanger body. Both channels are divided into an entrance section, a heat exchanger section and an exit section as one can see in Figure 4. The inlet temperature and pressure of the coolant channel were 35 °C and 1 bar, respectively. The entrance sections were considered to achieve a fully developed flow in the heat transfer area, in order to have comparable flow conditions. However, in a real application the fluid flows into the individual channels from a header (distributer) and may not be fully developed. The top and bottom part of the solid body uses periodic boundaries, the side of the domains were defined as symmetry and between the channels and the solid body, heat transfer conjugation was used. The solid material was assumed to be 316 L with a thermal conductivity of 16.2 W/m K. The numerical simulation was used to study the effect of channel diameter for both fluids between 0.5 mm and 1.1 mm.
Figure 4.
Domains, boundary conditions and geometry of the pre-cooler model.
3.2. Governing Equations
In this investigation the fluid properties of sCO2 were taken from the CoolProp library (Available online: http://coolprop.org/fluid_properties/index.html). The used conservation equations for mass, momentum and energy, also known as Navier-Stokes equations are:
These partial differential equations are discretized and the velocity vector field and scalar temperature filed were solved numerically. The turbulent Prandtl number has been set to as suggested by Yuan [19] and the turbulent viscosity was calculated by:
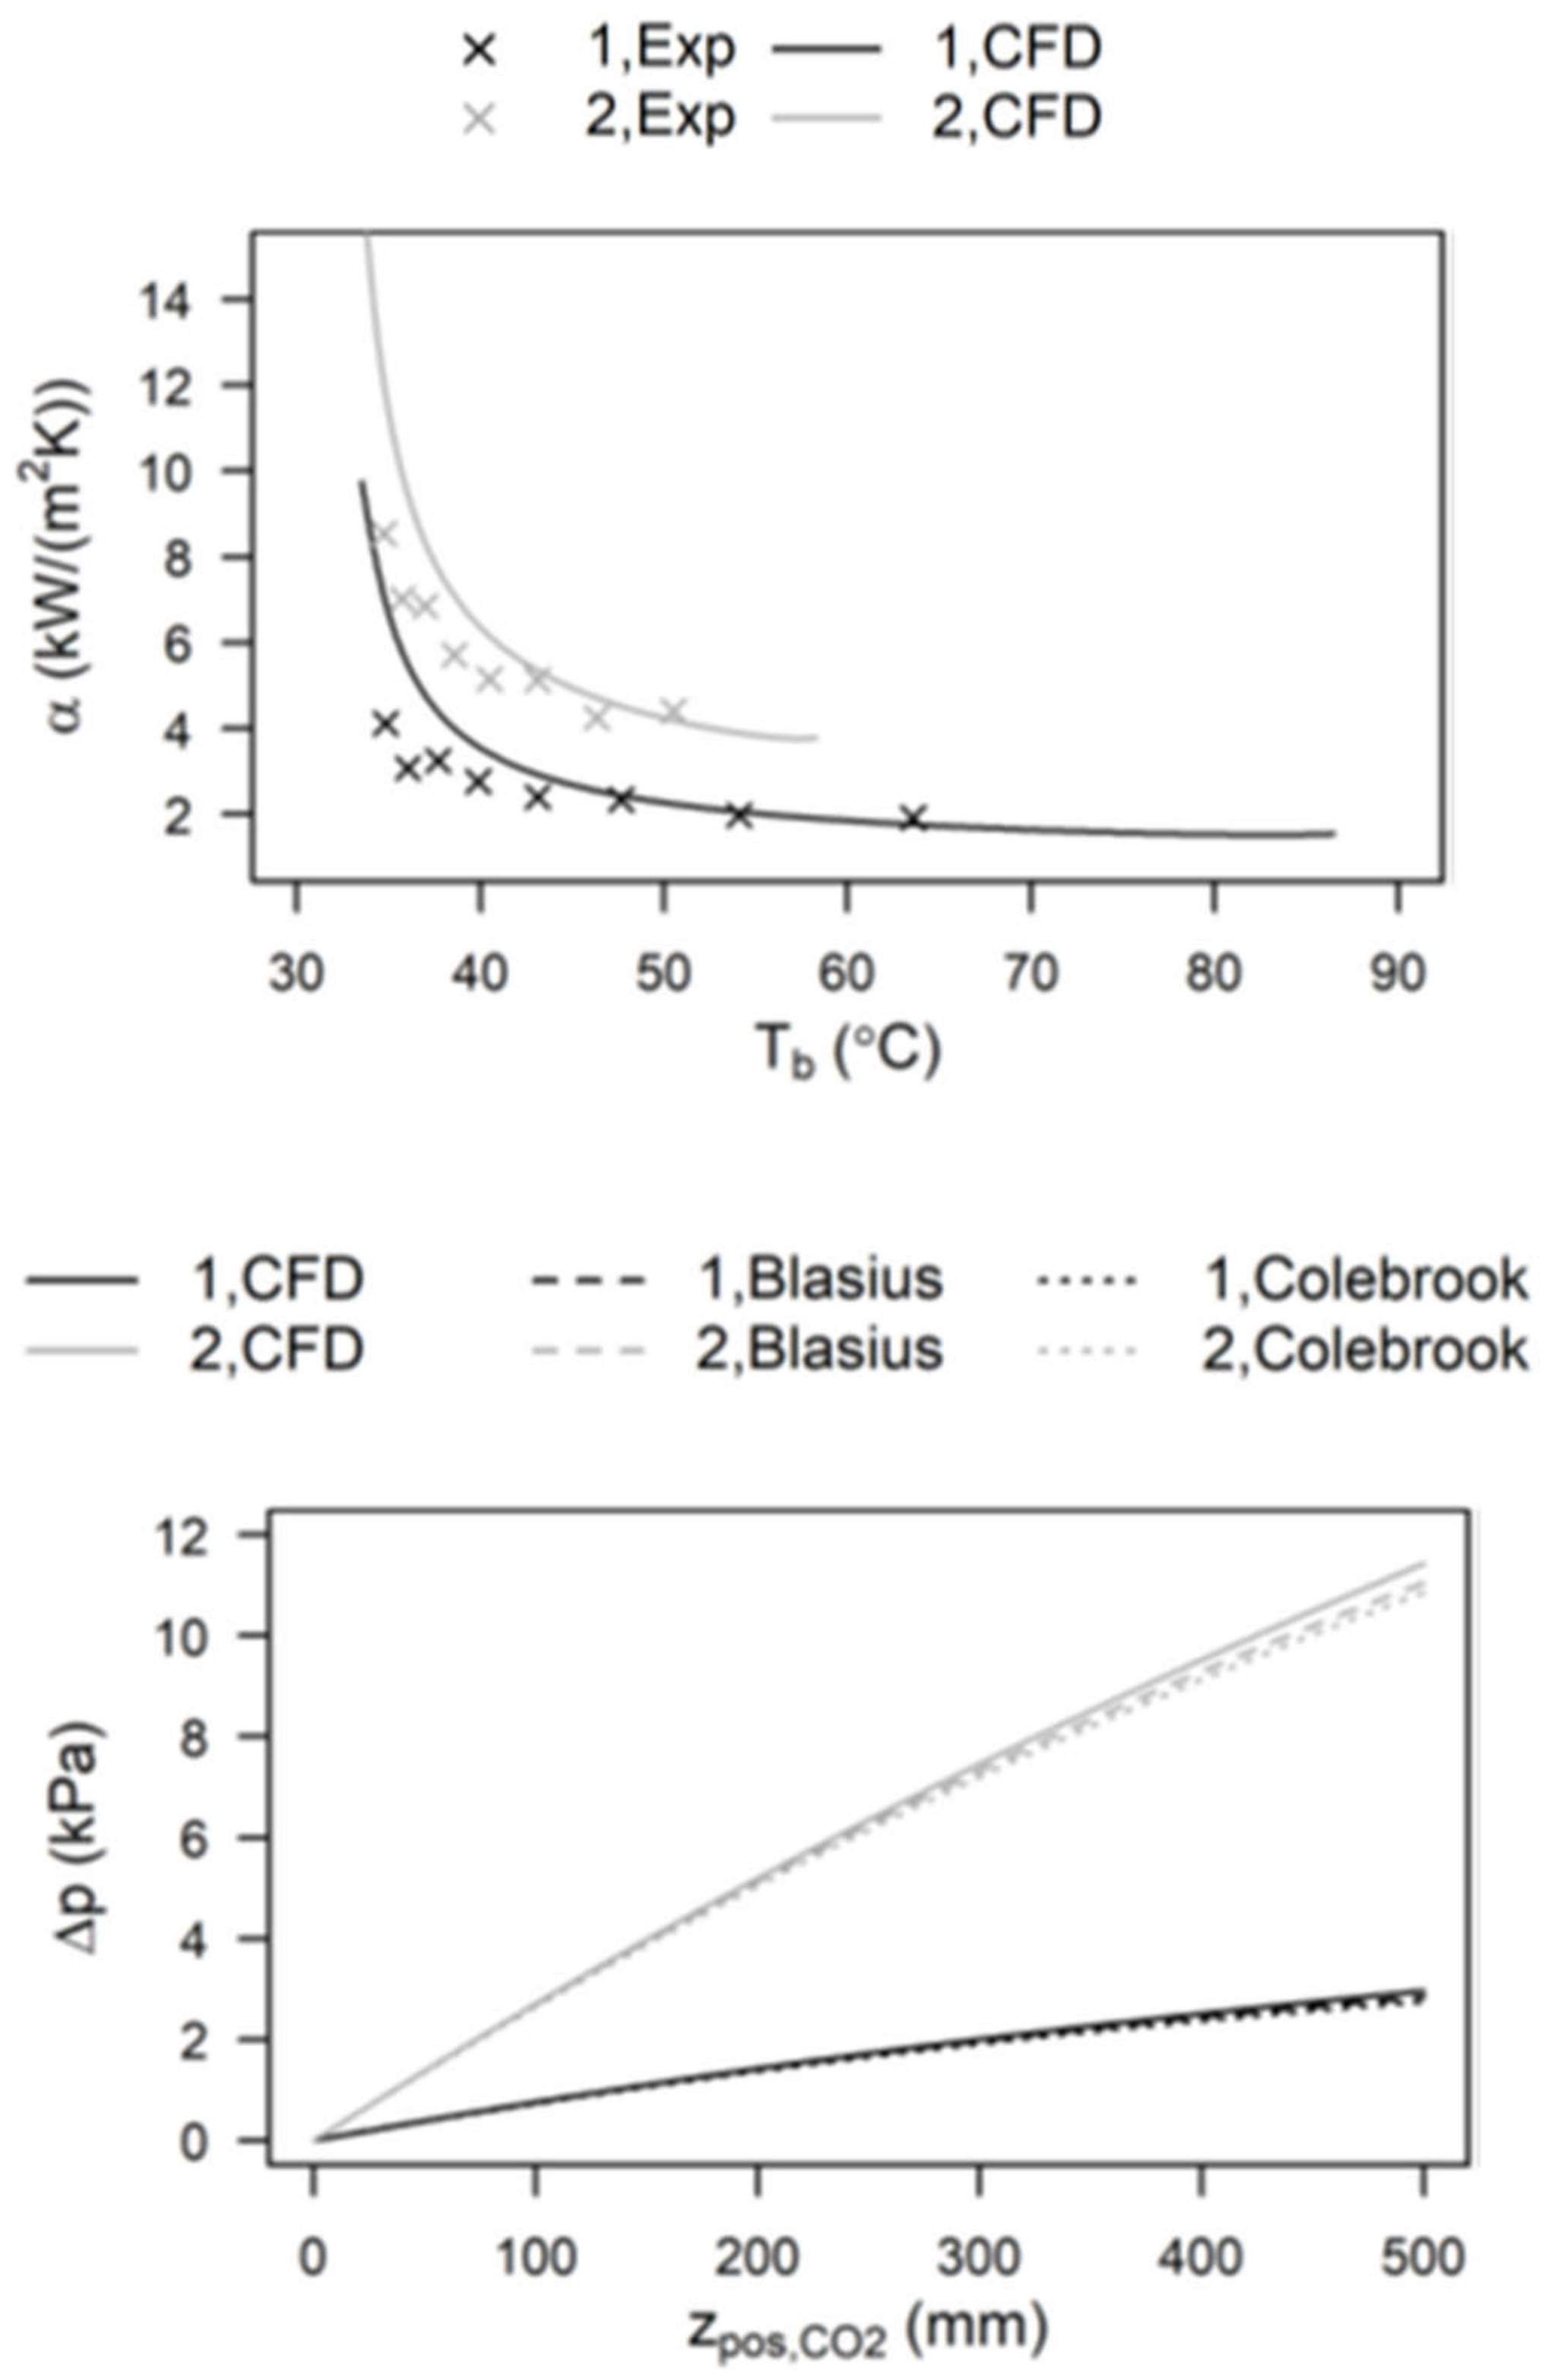
3.3. Validation and Mesh Independency
The Reynolds number of the coolant channel is approximately at 450 and thus the flow was modeled as laminar. Since the Reynolds number varies between 7000 and 14,000 for the sCO2 channel in the present study, the Shear Stress Transport (SST) model was applied for the transient and turbulent region, to calculate the turbulence kinetic energy and the turbulence frequency. Furthermore, the experimental results of Kruizenga et al. [20] as well as the pressure drop correlation of Blasius [21] and Colebrook [22] were used to validate the numerical model for two different operating conditions, which is a mass flux of 326 kg/(m2s) and 762 kg/(m2s) for a channel diameter of 1.9 mm. This comparison is shown in Figure 5 for the local heat transfer and for the pressure drop. The local heat transfer can be predicted with sufficient accuracy and the pressure drop is very well represented.
Figure 5.
Validation of the local heat transfer and pressure drop of the CFD model by experiments from literature.
In order to validate the independency of the numerical results from the applied mesh, eight different meshes of different grid density were studied. A hexahedral dominant grid was applied, inflation layer was used on the boundary between fluid and solid, and the element size was controlled along the flow channels. In Figure 6 the local heat transfer coefficient and the pressure drop along both channels from the finest mesh 1 to the coarsest mesh 8 are shown. The mesh 2 having 2.5 million nodes was used for further analysis, since there is no improvement to the mesh 1. Additionally, the boundary layer can be well resolved for a dimensionless wall distance of y+ < 1.
Figure 6.
Local heat transfer and pressure drop results of the mesh independency study.
3.4. Data Processing
For the assessment of the pre-cooler, the volumetric heat flux and the pressure drop were used. Here, the volumetric heat flux represents the heat flow per volume of the heat exchanger. Shah et al. [23] determined the compactness of a heat exchanger by the ratio of heat transfer surface to heat exchanger volume:
where A is the heat transfer surface area and is the enveloped volume of the heat exchanger. The heat flow divided by the volume of the heat exchanger was defined by the volumetric heat transfer density in the present study:
Moreover, the global performance criterion evaluates the ratio of total heat flow of the printed circuit heat exchanger to the consumed flow power and is defined as in [24]
where is the volumetric flow rate.
4. Simulation Results
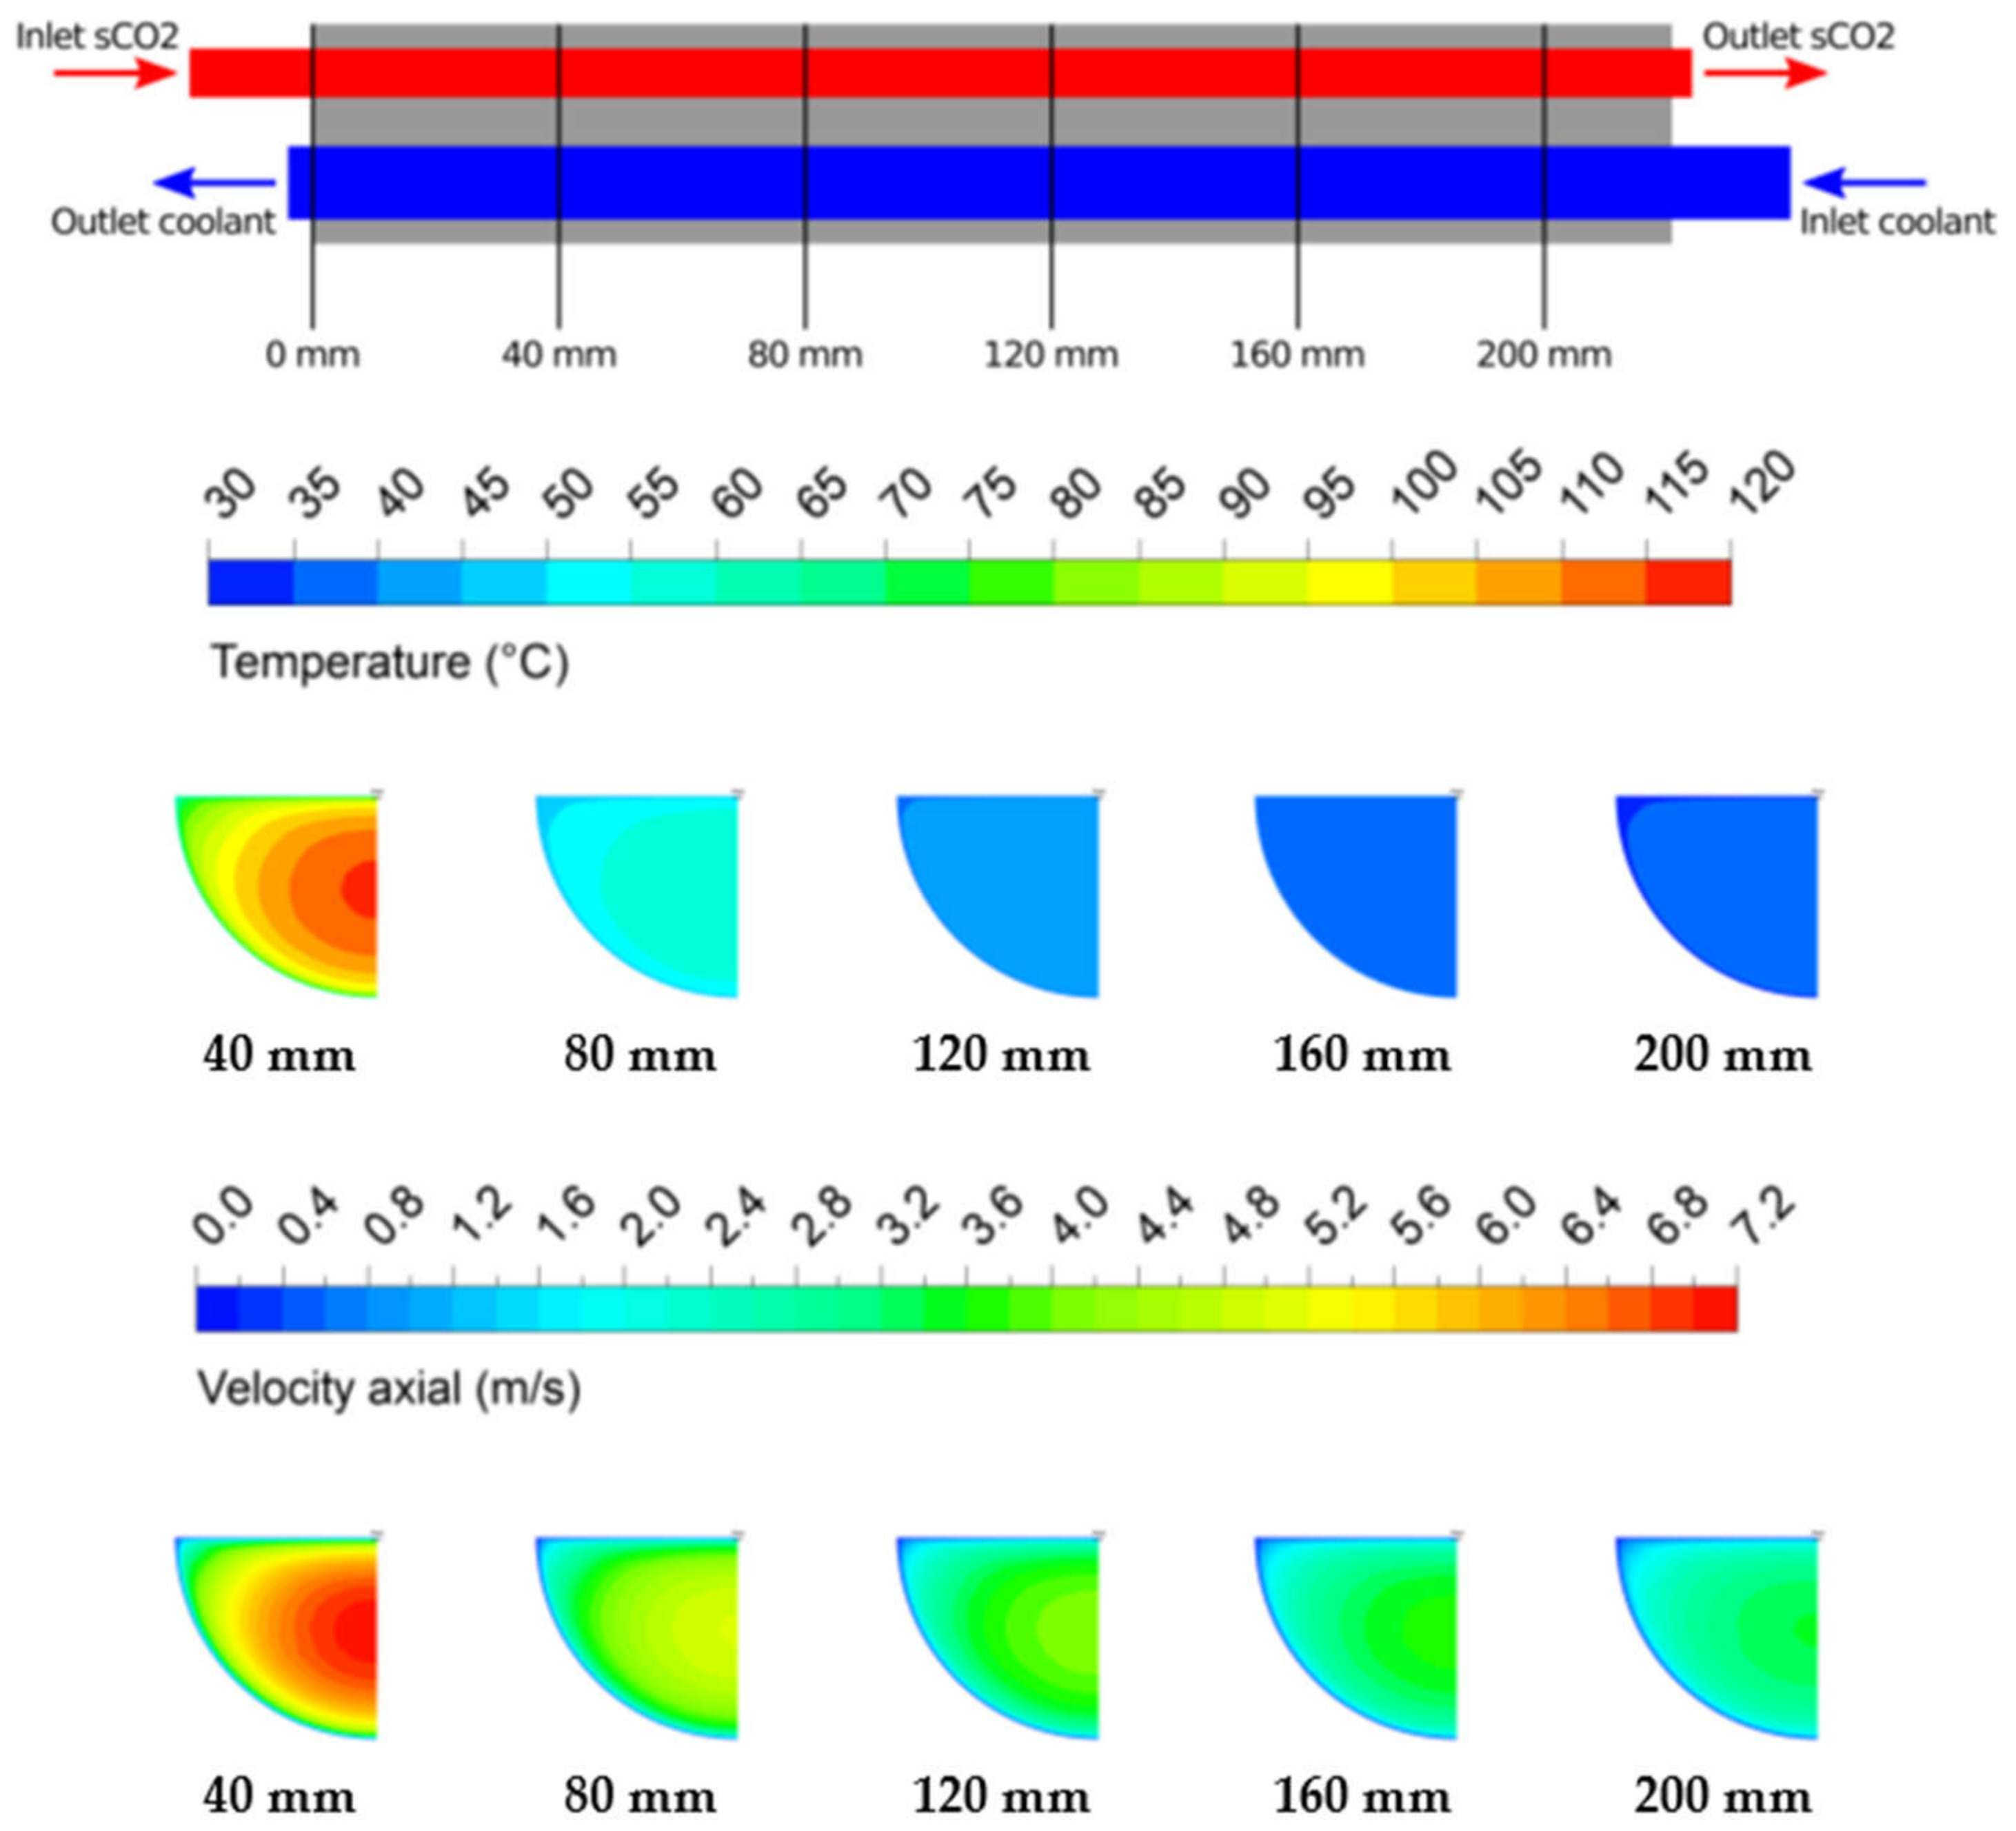
4.1. Heat Transfer and Flow Characteristics for Various Channel Diameters
Figure 7 shows the numerical results for different axial positions along the sCO2 channel for a 0.5 mm sCO2 channel, a 0.8 mm coolant channel and a sCO2 mass flux density of 700 kg/(m2s). It can be seen, that at the 40 mm position the temperature and velocity distribution are still inhomogeneous, while from 80 mm on, both distributions become more homogeneous and nearly become equal.
Figure 7.
Temperature and velocity distribution of the sCO2 channel at different axial positions.
In the present investigation, the diameter of the coolant channel was changed from 0.5 mm to 0.8 mm and to 1.1 mm, and the diameter of the sCO2 channel was changed between 0.5 mm and 0.8 mm. The heat transfer results of different combinations of the channel dimensions are shown in Figure 8 for different mass fluxes. In this and the following plots, the combination of sCO2 channel to coolant channel diameter are expressed as sCO2-coolant, e.g., 5–11 represents a 0.5 mm sCO2 channel and a 1.1 mm coolant channel diameter. As expected the heat transfer increases with the mass flux, due to higher convection. Furthermore, the smallest channel diameter achieves the greatest heat transfer performance. This is, due to the high compactness of the heat exchanger as the channel diameter reduces. Furthermore, smaller channel diameter result in more heat transfer area per cross sectional area of the flow channel, which becomes clearer by considering the ratio of heat transfer area to cross sectional area of 4 L/d and consequently the heat transfer increases. It is worth to mention, that the greatest and lowest heat transfer performance occurs both for the sCO2 channel diameter of 0.5 mm for different coolant channel diameter. When the sCO2 channel diameter increases, the impact of the coolant channel diameter on the heat flux density reduces. This may be, due to the limitation of the convective heat transfer on the sCO2 channel.
Figure 8.
Heat flux density results obtained numerically for different channel diameter.
The pressure drop characteristics of both channels is shown in Figure 9 for varying mass fluxes. Similar to the heat transfer the pressure drop increases for both channels as the mass flux rises. The pressure drop of the sCO2 channel changes only little with geometry. In fact, only for the 8–5 configuration the pressure loss increases, due to a decrease of heat transfer surface area and consequently longer channel length. The pressure drop in the coolant channel increases as the channel diameter reduces. In fact, the highest pressure drop occur for the 0.5 mm channel diameter. One reason may be the reduced friction surface area at lower channel diameter. As the coolant channel diameter increases, the pressure drop strongly reduces, due to less friction surface compare to the cross-sectional area. The pressure drop of the 8–5 configuration is very high, since the required mass flux for a given heat transfer from is higher.
Figure 9.
Pressure drop results of the CO2 and coolant channel obtained numerically at different channel diameter.
As the heat transfer as well as the pressure drop are both influenced by the channel diameter, a more comparative parameter needs to be applied. In order to determine a beneficial configuration, the global performance of the pre-cooler for the sCO2 flow path will be calculated. The global performance criterion represents the ratio of heat flow to the required pumping power due to pressure drop and is shown in Figure 10. The global performance reduces as the mass flux density increases, due to the strong increase in pressure drop. As the mass flux exceeds 300 kg/(m2s) the global performance criterion is almost independent of the channel diameter for the sCO2 channel. However, the global performance related to the coolant channel is strongly influenced by the channel diameter. It can be seen, that a higher diameter results in a superior performance. Hence, a high coolant channel dimeter and a small sCO2 channel diameter was chosen and used for further analysis. In fact, the configuration 5–8 achieves the greatest performance at a mass flux of approximately 700 kg/(m2s). At this parameter a compactness of 627 m2/m3 can be achieved.
Figure 10.
Global performance criterion results of the CO2 obtained numerically for different channel diameter.
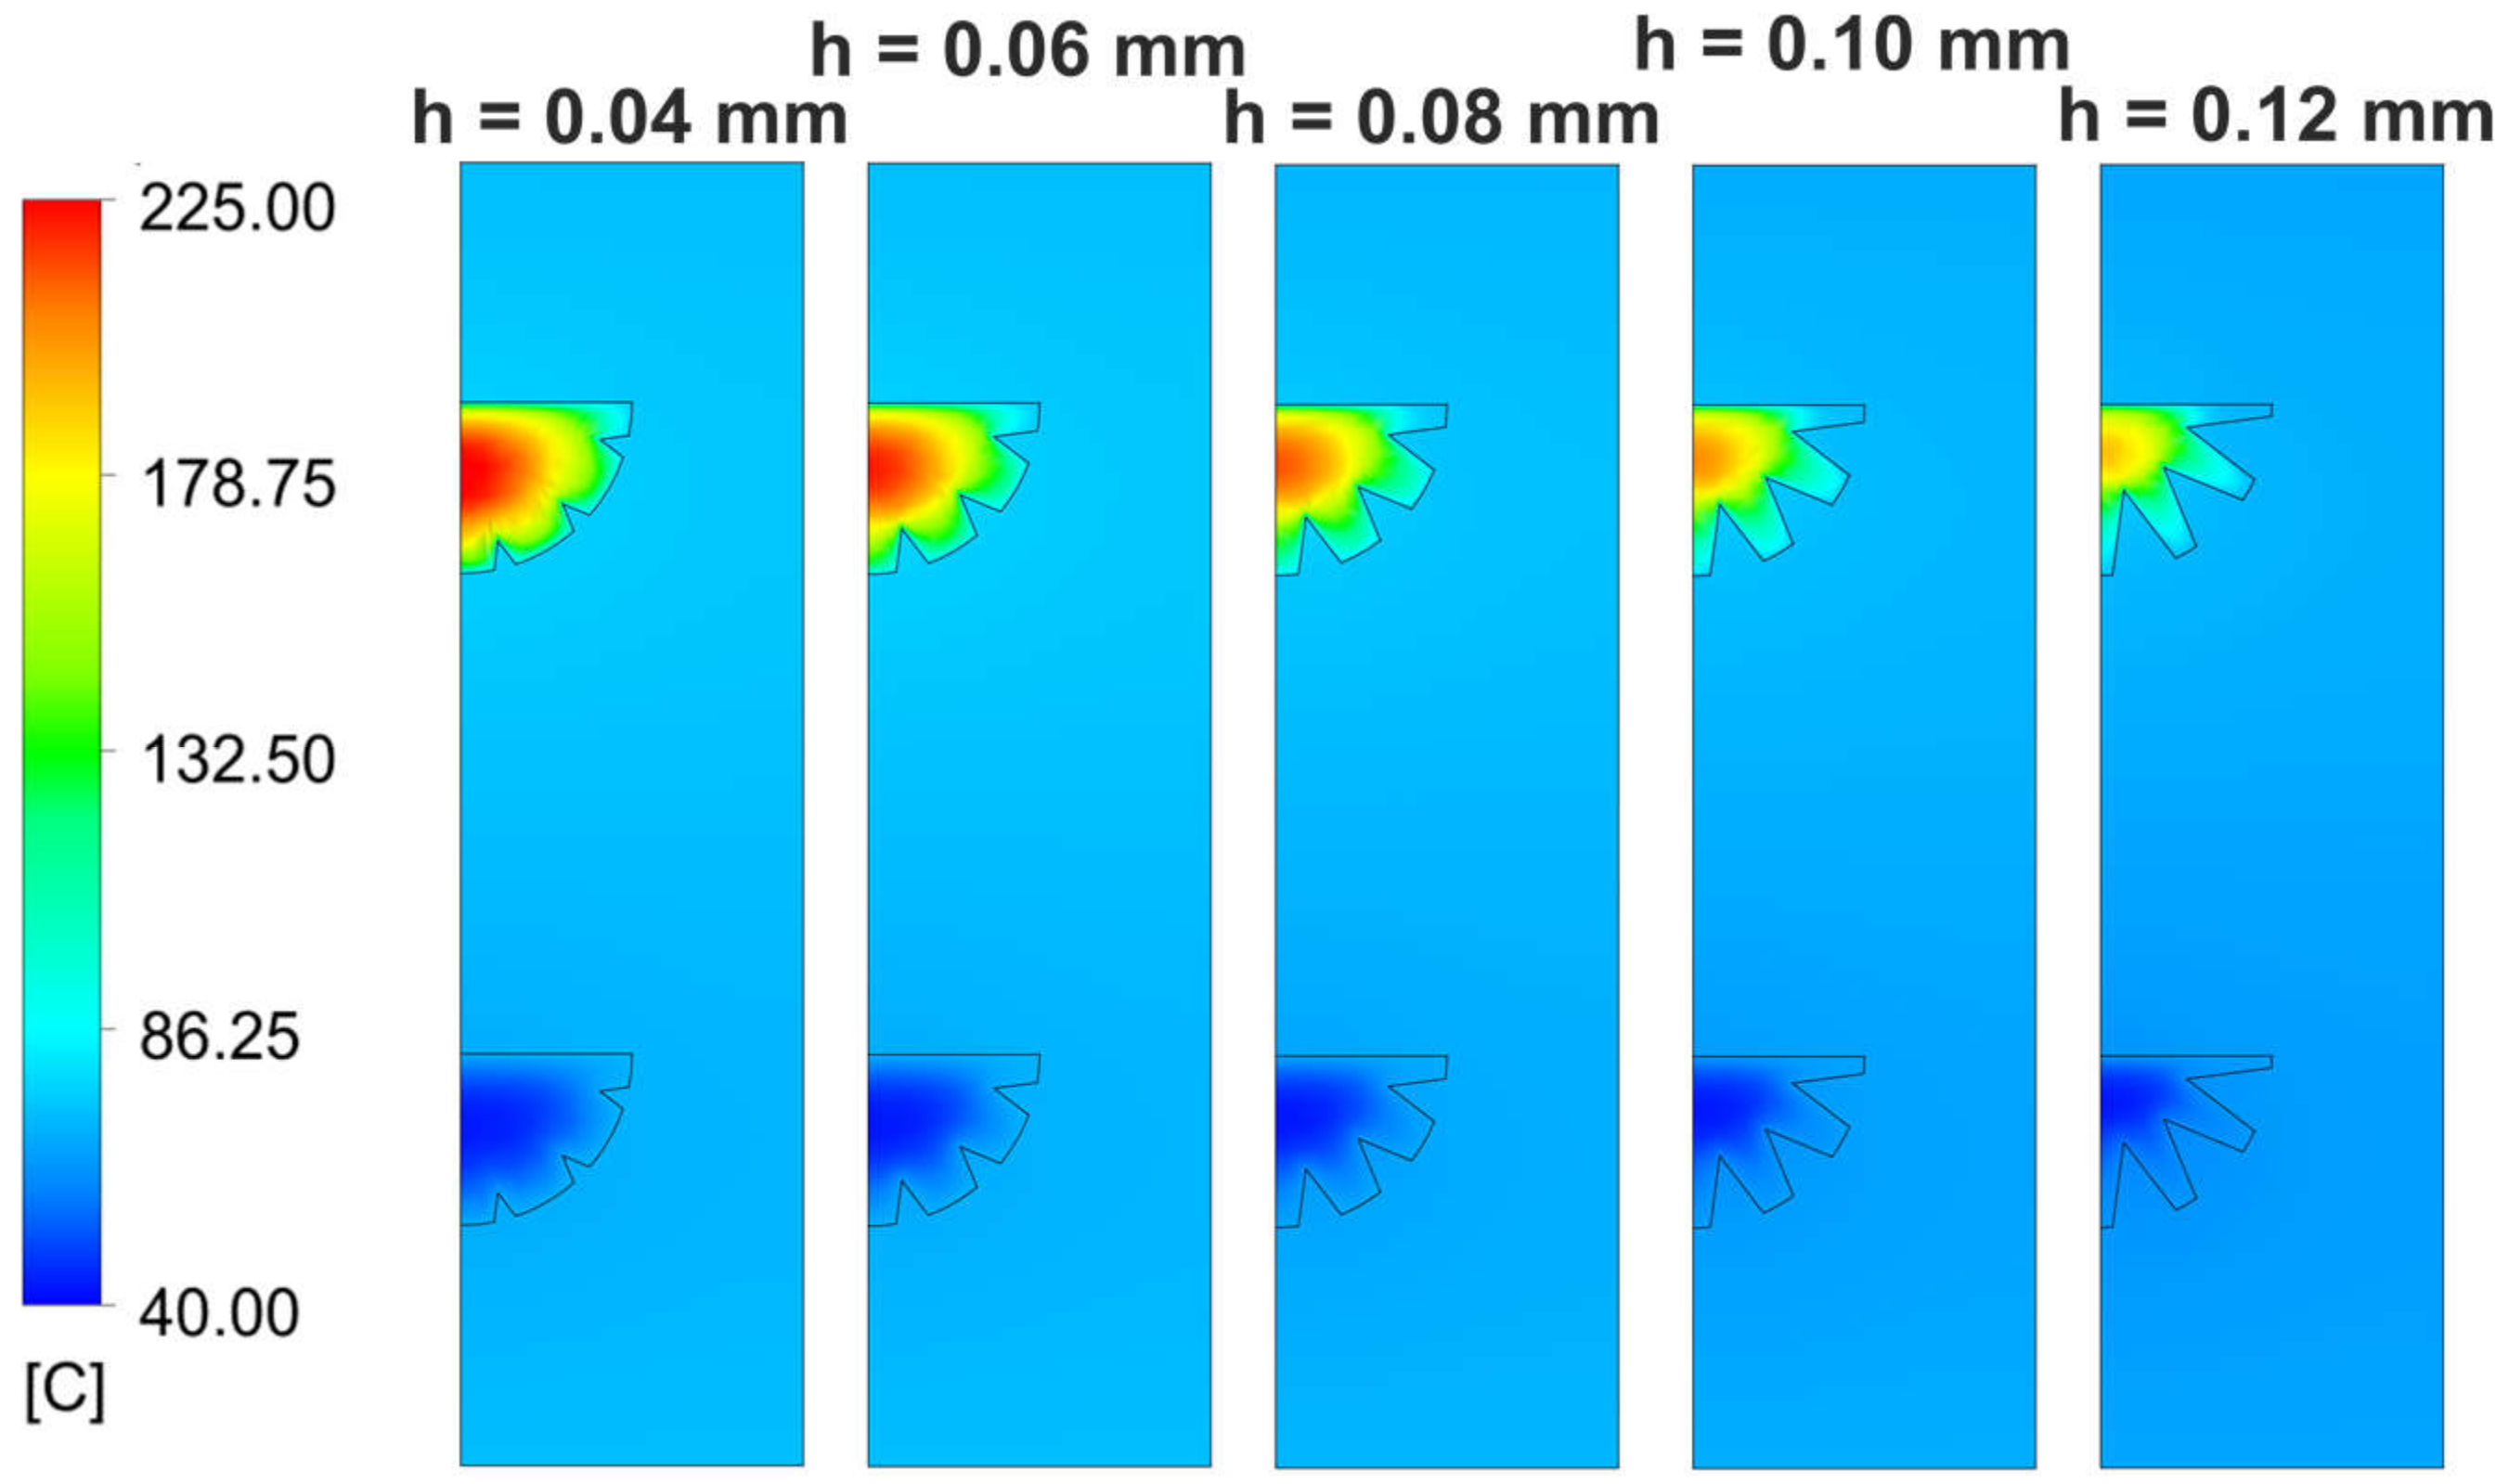
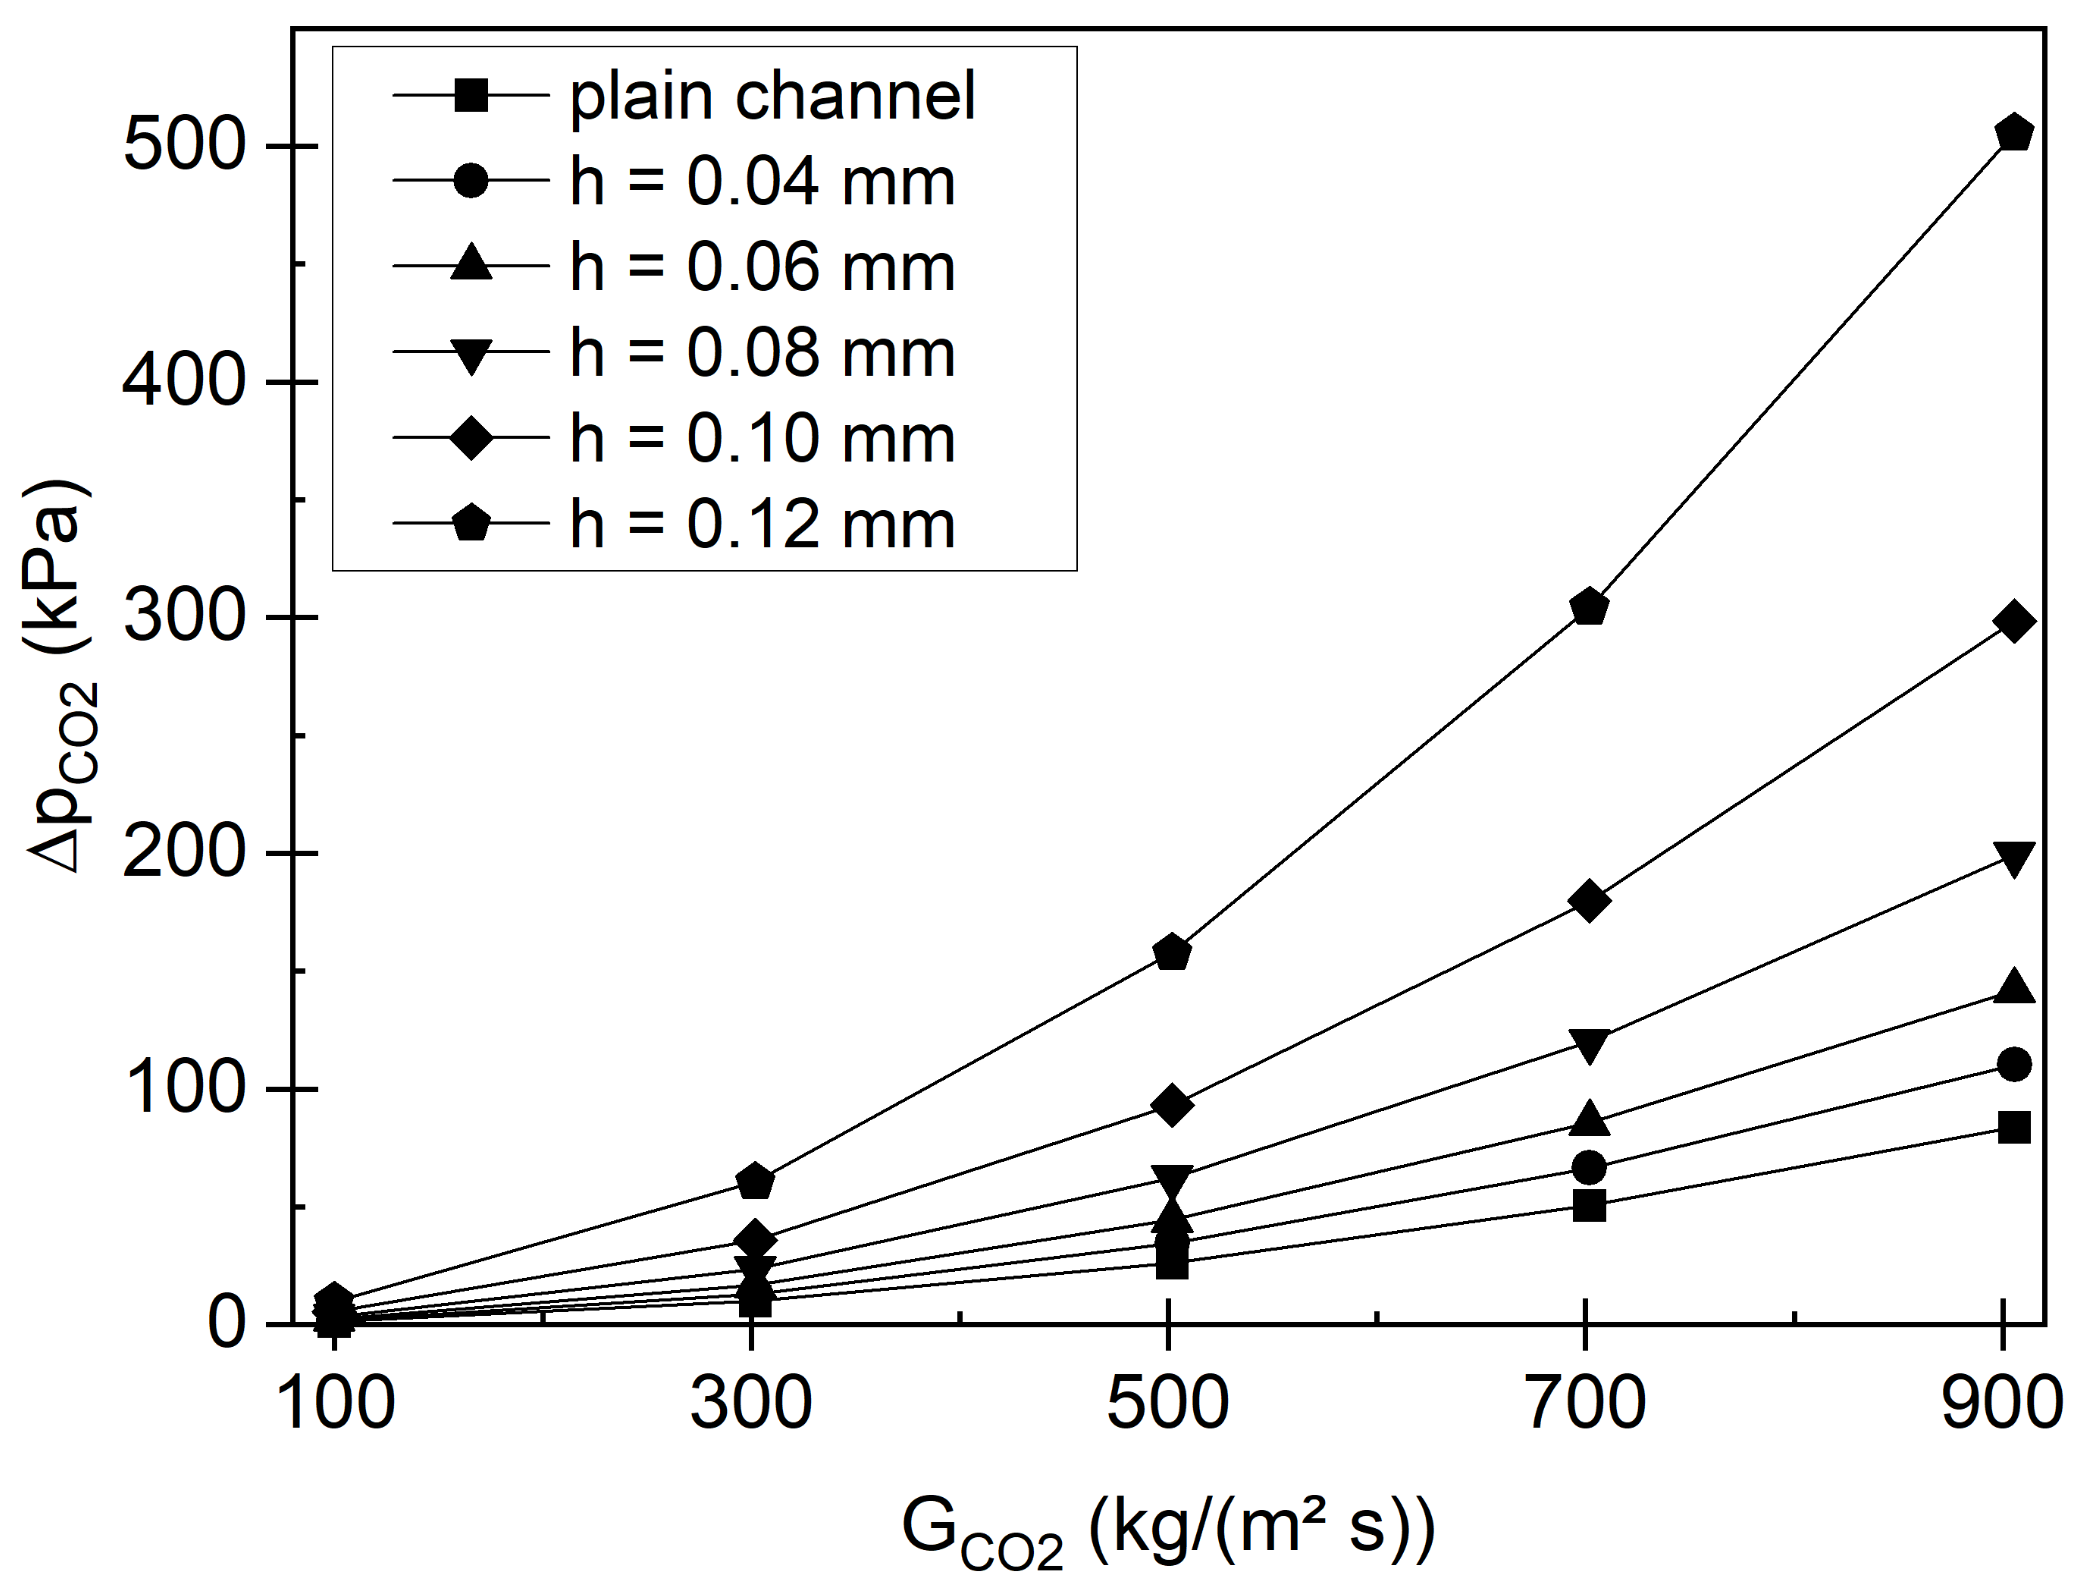
4.2. Heat Transfer and Flow Characteristics of Internal Finned Channels
Based on this optimization an internal fin structure of the channels was investigated. For this different internal fin heights were modelled and numerical simulated by the CFD code. The fin height was varied between 0.04 mm and 0.12 mm. The heat transfer and pressure drop were calculated from the numerical results. The fin design and the temperature distribution of both channels is shown in Figure 11 for the different fins. It can be seen that the temperature differences are lower for higher fins in the shown cross section of the sCO2 channel. This is because the integrated fins penetrate the bulk sCO2 flow and heat transfer occurs more towards the center. Moreover, the temperature in the central bulk flow is lower in the sCO2 channel, since the heat transfer is greater for higher fins. Consequently, the cooling effect increases as the fin height is higher.
Figure 11.
Temperature distribution of both channels for different fin heights.
In Figure 12 the volumetric heat flux and in Figure 13 the pressure drop are shown as a function of the mass flux density for different internal fin heights. As one can see, the heat transfer increases as the fin height increases, since the turbulence increases and the heat conduction of the fins allow higher temperatures in the bulk flow of the sCO2 channel. In fact, the volumetric heat flux increases for a mass flux of 500 kg/m²s for fin height of 0.06 mm and 0.12 mm by 11.1% and 27.6% compared to the plain channel. Nevertheless, the pressure drop along the flow channel rises as the fin height increases. Reason for that is the additional friction surface due to the fins. Especially for higher fins, the pressure drop strongly increases. Thus, at a mass flux of 500 kg/m²s and for the fin height of 0.06 mm the pressure drop increases by 69.1% and for the fin height of 0.12 mm the pressure drop is five times higher compared to the plain channel. Similar to the channel diameter a tradeoff between heat transfer and pressure drop needs to be found.
Figure 12.
Heat flux density results obtained numerically for different internal fins in the channel.
Figure 13.
Pressure drop results obtained numerically for different internal fins in the channel.
In order to determine the optimum fin configuration, the ratio of heat transfer to pressure drop will be evaluated by the global performance criterion. In Figure 14 the global performance is shown for different mass fluxes and fin heights. It can be seen that the fin height of 0.04 mm achieves the greatest global performance followed by the 0.06 mm fins. For fin heights greater than 0.06 mm the higher pressure drop, giving higher pumping power, is dominant over the heat transfer enhancement. Hence, the global performance is lower compared to the plain channel. To be more precise, the global performance increases by 25.5% for a fin height of 0.04 mm and reduces by 35.9% for the fin height of 0.12 mm compared to the plain channel at a mass flux of 500 kg/m2s. Therefore, a finned channel applying 0.4 mm fin height is recommended for the pre-cooler.
Figure 14.
Global performance criterion results obtained numerically for different internal fins in the channel.
The optimized pre-cooler design of the sCO2 power cycle as well as the corresponding dimensions of the heat exchanger are shown in Figure 15 as a 3D model.
Figure 15.
3D model of the optimized pre-cooler design.
5. Conclusions
In the present investigation, the design of a pre-cooler for a waste heat driven sCO2 power cycle was analyzed. The waste heat recovery potential was studied and categorized depending on the quantity and the quality of available heat sources. As a reference case, the exhaust gas stream of a turbine of a gas compressor station was used. For this waste heat source, a simple power cycle layout was calculated and the boundary conditions, such as temperature, pressure and mass flow rate, of the liquid cooler were determined. On this base the pre-cooler was calculated numerical by using the commercial fluid dynamic code ANSYS CFX. Different channel diameters of the printed circuit heat exchanger were investigated to determine the optimum heat exchanger design. It was found, that the heat transfer and pressure drop increases for smaller channel diameter. However, the influence of the sCO2 channel diameter on the pressure drop was small. The global performance criterion was used to determine the optimum design for both channel diameter considering heat transfer as well as pressure drop. For the optimum configuration of 0.5 mm sCO2 channel diameter and 0.8 mm coolant channel diameter an internal fin structure was introduced and the fin height was analyzed. The heat transfer and the pressure drop increase with fin height, due to the increases flow mixing and the additional heat transfer surface. In order to determine the best trade-off between heat transfer and pressure drop, the global performance was used. For fin heights greater than 0.06 mm the impact of pressure drop dominates over the heat transfer enhancement and the global performance reduces. The greatest performance was found for a fin height of 0.04 mm, which can be recommended for the design of a pre-cooler.
Author Contributions
Conceptualization, S.U.; methodology, S.U.; validation, J.M. and S.U.; formal analysis, S.U., J.M., M.B.M. and S.R.; investigation J.M., M.B.M. and S.R.; resources, S.U. and S.R.; data curation, J.M. and M.B.M.; writing—original draft preparation, S.U.; writing—review and editing, U.H.; visualization, S.U.; supervision, S.U. and U.H.; project administration, S.U. and U.H.; funding acquisition, S.U. and U.H. All authors have read and agreed to the published version of the manuscript.
Funding
This research is part of the project CARBOSOLA funded by the German Federal Ministry of Economic Affairs and Energy (BMWi) under the grant number 03EE5001D. Responsibility if the content of this publication lies with the authors.
Institutional Review Board Statement
Not applicable.
Informed Consent Statement
Not applicable.
Data Availability Statement
The simulation data of the present study can be found here https://doi.org/10.14278/rodare.1085.
Conflicts of Interest
The authors declare no conflict of interest. The funders had no role in the design of the study; in the collection, analyses, or interpretation of data; in the writing of the manuscript, or in the decision to publish the results.
Abbreviations
| A | total heat transfer surface area, m² |
| dCO2 | diameter of the CO2 channel |
| dH2O | diameter of the coolant channel |
| GCO2 | mass flux of the CO2 channel, kg/(m²s) |
| GPCCO2 | global performance criteria of the CO2 channel, - |
| h | internal fin height, m |
| mass flow rate of the CO2 stream, kg/s | |
| mass flow rate of the waste heat stream, kg/s | |
| Pnet | net power output, W |
| Δp | pressure difference, Pa |
| heat flow rate, W | |
| heat flow rate of the waste heat stream, W | |
| volumetric heat flux density, W/m³ | |
| Twh | temperature of the waste heat stream, °C |
| Va | volumetric flow rate, m³/s |
| VHX | Volume of the enveloped installation space of a heat exchanger, m³ |
| zpos | longitudinal positions along the channel, m |
| Greek symbols | |
| α | heat transfer coefficient, W/mK |
| Carnot efficiency, % |
References
- Federal Ministry for Environment. Klimaschutzplan 2050; Federal Ministry for Environment: Bonn, Germany, 2016; pp. 1–96. [Google Scholar]
- Brun, K.; Friedman, P.; Dennis, R. Fundamentals and Applications of Supercritical Carbon Dioxide (sCO₂) Based Power Cycles; Woodhead Publishing: Sawston, UK, 2017. [Google Scholar]
- Liao, S.M.; Zhao, T.S. Measurements of heat transfer coefficients from supercritical carbon dioxide flowing in horizontal mini/micro channels. J. Heat Transf. 2002, 124, 413–420. [Google Scholar] [CrossRef]
- Dang, C.; Hihara, E. In-tube cooling heat transfer of supercritical carbon dioxide. Part 1. Experimental measurement. Int. J. Refrig. 2004, 27, 736–747. [Google Scholar] [CrossRef]
- Ngo, T.L.; Kato, Y.; Nikitin, K.; Ishizuka, T. Heat transfer and pressure drop correlations of microchannel heat exchangers with S-shaped and zigzag fins for carbon dioxide cycles. Exp. Therm. Fluid Sci. 2007, 32, 560–570. [Google Scholar] [CrossRef]
- Li, H.; Kruizenga, A.; Anderson, M.; Corradini, M.; Luo, Y.; Wang, H.; Li, H. Development of a new forced convection heat transfer correlation for CO2 in both heating and cooling modes at supercritical pressures. Int. J. Therm. Sci. 2011, 50, 2430–2442. [Google Scholar] [CrossRef]
- Pitla, S.S.; Groll, E.A.; Ramadhyani, S. New correlation to predict the heat transfer coefficient during in-tube cooling of turbulent supercritical CO2. Int. J. Refrig. 2002, 25, 887–895. [Google Scholar] [CrossRef]
- Van Abel, E.; Anderson, M.; Mark, H.; Corradini, M. Numerical investigation of pressure drop and local heat transfer of supercritical CO2 in printed circuit heat exchangers. In Proceedings of the Supercritical CO2 Power Cycles Symposium, Boulder, CO, USA, 24–25 May 2011. [Google Scholar]
- Serrano, I.P.; Cantizano, A.; Linares, J.I.; Moratilla, B.Y. Modeling and sizing of the heat exchangers of a new supercritical CO2 Brayton power cycle for energy conversion for fusion reactors. Fusion Eng. Des. 2014, 89, 1905–1908. [Google Scholar] [CrossRef]
- Xu, X.; Ma, T.; Li, L.; Zeng, M.; Chen, Y.; Huang, Y.; Wang, Q. Optimization of fin arrangement and channel configuration in an airfoil fin PCHE for supercritical CO2 cycle. Appl. Therm. Eng. 2014, 70, 867–875. [Google Scholar] [CrossRef]
- Baik, Y.J.; Jeon, S.; Kim, B.; Jeon, D.; Byon, C. Heat transfer performance of wavy-channeled PCHEs and the effects of waviness factors. Int. J. Heat Mass Transf. 2017, 114, 809–815. [Google Scholar] [CrossRef]
- Wang, J.; Guan, Z.; Gurgenci, H.; Veeraragavan, A.; Kang, X.; Hooman, K. A computationally derived heat transfer correlation for in-tube cooling turbulent supercritical CO2. Int. J. Therm. Sci. 2019, 138, 190–205. [Google Scholar] [CrossRef]
- Vad Mathiesen, B. Heat Roadmap Europe. Available online: https://heatroadmap.eu/wp-content/uploads/2019/02/HRE_Final-Brochure_web.pdfhttps://heatroadmap.eu.
- Connolly, D. Heat Roadmap Europe 2050. Second Pre-Study for the EU27; Aalborg University: Aalborg Øst, Denmark, 2010. [Google Scholar]
- Persson, U.; Möller, B.; Werner, S. Heat roadmap Europe: Identifying strategic heat synergy regions. Energy Policy 2014, 74, 663–681. [Google Scholar] [CrossRef]
- Brückner, S.; Liu, S.; Miró, L.; Radspieler, M.; Cabeza, L.F.; Lävemann, E. Industrial waste heat recovery technologies: An economic analysis of heat transformation technologies. Appl. Energy 2015, 151, 157–167. [Google Scholar] [CrossRef]
- Brückner, S.; Arbter, R.; Pehnt, M.; Laevemann, E. Industrial waste heat potential in Germany—A bottom-up analysis. Energy Effic. 2017, 10, 513–525. [Google Scholar] [CrossRef]
- MAN Diesel & Turbo. THM Gas Turbines. Available online: https://www.man-es.com/oil-gas/products/gas-turbines (accessed on 1 November 2021).
- Yuan, Z.X. Numerical study of periodically turbulent flow and heat transfer in a channel with transverse fin arrays. Int. J. Numer. Methods Heat Fluid Flow 2000, 10, 842–861. [Google Scholar] [CrossRef]
- Kruizenga, A.; Anderson, M.; Fatima, R.; Corradini, M.; Towne, A.; Ranjan, D. Heat transfer of supercritical carbon dioxide in printed circuit heat exchanger geometries. J. Therm. Sci. Eng. Appl. 2011, 3, 031002. [Google Scholar] [CrossRef]
- Blasius, H. Grenzschichten in Flüssigkeiten mit Kleiner Reibung. Zeitschrift für Angewandte Mathematik und Physik 1908, 56, 1–37. [Google Scholar]
- Colebrook, C.F.; White, C.M. Experiments with fluid friction in roughened pipes. Proc. R. Soc. London Ser. A Math. Phys. Sci. 1937, 161, 367–381. [Google Scholar] [CrossRef]
- Shah, R.K.; Sekulic, D.P. Fundamentals of Heat Exchanger Design; John Wiley & Sons, Ltd.: Hoboken, NJ, USA, 2003. [Google Scholar]
- Kong, Y.Q.; Yang, L.J.; Du, X.Z.; Yang, Y.P. Impacts of geometric structures on thermo-flow performances of plate fin-tube bundles. Int. J. Therm. Sci. 2016, 107, 161–178. [Google Scholar] [CrossRef]
Publisher’s Note: MDPI stays neutral with regard to jurisdictional claims in published maps and institutional affiliations. |
© 2021 by the authors. Licensee MDPI, Basel, Switzerland. This article is an open access article distributed under the terms and conditions of the Creative Commons Attribution (CC BY) license (https://creativecommons.org/licenses/by/4.0/).