Article

Solar Power and Energy Storage for Decarbonization of Land Transport in India

Centre for Renewable Energy Systems Technology, School of Mechanical, Electrical and Manufacturing Engineering, Loughborough University, Epinal Way, Loughborough LE11 3TU, Leicestershire, UK
*
Author to whom correspondence should be addressed.
Energies 2021, 14(24), 8277; https://doi.org/10.3390/en14248277
Submission received: 29 October 2021 / Revised: 23 November 2021 / Accepted: 30 November 2021 / Published: 8 December 2021

Abstract

:
By considering the weight penalty of batteries on payload and total vehicle weight, this paper shows that almost all forms of land-based transport may be served by battery electric vehicles (BEV) with acceptable cost and driving range. Only long-distance road freight is unsuitable for battery electrification. The paper models the future Indian electricity grid supplied entirely by low-carbon forms of generation to quantify the additional solar PV power required to supply energy for transport. Hydrogen produced by water electrolysis for use as a fuel for road freight provides an inter-seasonal energy store that accommodates variations in renewable energy supply. The advantages and disadvantages are considered of midday electric vehicle charging vs. overnight charging considering the temporal variations in supply of renewable energy and demand for transport services. There appears to be little to choose between these two options in terms of total system costs. The result is an energy scenario for decarbonized surface transport in India, based on renewable energy, that is possible, realistically achievable, and affordable in a time frame of year 2050.

1. Introduction

Demand for transport in India has grown rapidly over the last few decades [1], and will continue to do so over the next three decades with increasing economic development [2,3]. India is already the country with third largest greenhouse gas emissions (GHGs) behind China and the USA, and its emissions are growing rapidly year on year [4,5,6,7]. Emissions from transport are just 9% of India’s GHGs but are growing as a percentage of the total. Of more local and immediate concern is air quality in India, especially within cities that are amongst the most polluted in the world [2,6,8]. Poor air quality is adversely affecting human health and therefore strategies have been proposed, and are being implemented, to reduce emissions of CO, NOX, sulfur compounds and particulates [9,10,11]. These previous strategies propose cleaner burning engines, cleaner burning fuels such as compressed natural gas (CNG) and liquid petroleum gas (LPG), and promotion of public transport.
In the longer term, to further improve air quality, to reduce India’s dependence on imported liquid fuels, and to achieve the much deeper reductions of GHGs necessary to prevent damaging climate change, the use of other, carbon-neutral transport fuels will become necessary including electricity, hydrogen, and biofuels [3,12,13,14]. However, to realize the benefits of electrification of transport, the electricity generation mix must also be decarbonized, especially to reduce the use of coal-fired generation [12,13,15]. India has ambitious renewable energy targets (450 GW by 2030) [16] but remains highly dependent on coal-fired generation, even under the most ambitious current targets of decarbonization in every sector [17]. In order to limit global warming to 1.5 °C, India, along with all countries, must achieve net-zero greenhouse gas emissions by around year 2050 [18].
There are at least four ways of powering transport with zero net carbon emissions: direct electrification, battery electric vehicles (BEVs), hydrogen and liquid biofuels. The Government of India already recognizes the benefit of BEVs for road transport and many states are promoting them with incentives [19]. Direct electrification by conductive transfer of power, i.e., overhead lines or third rail, is suitable for some railway systems, but the electrified fraction of India’s rail network is currently still small. Direct electrification may one day be used throughout India’s rail network but as this paper will show, battery electrification is also a viable option, confirming the findings of other recent research [20]. The difference between direct electrification and the use of batteries in the rail system will have only a small effect on the overall pattern of energy use, because the energy use in railways is relatively small.
Biofuels are a significant and useful energy resource, but are limited by the feedstock available. Global sustainable bio-energy is estimated at about 100 EJ per year [21] and the biogas resource alone within India is estimated at 12.8 EJ [22]. All available liquid biofuels in India are likely to be used up in sectors that are hard to decarbonize in any other way. Globally, the aviation sector alone could use three to four times more fuel in 2050 as it did in year 2000 if it resumes its pre-pandemic growth rate, resulting in an estimated 766 million tonnes of fuel burned or 32 EJ per year [23,24].
Hydrogen can be used in internal combustion engines, gas turbines or fuel cells, but hydrogen fuel cell vehicles (FCV) have superior efficiency and eliminate the emission of oxides of nitrogen.
Other sectors of transport, for example shipping, inland water navigation and military uses, are also outside the scope of this paper. This study will focus on BEVs and FCVs for road and rail transport in India. Globally, BEV sales are beginning to grow rapidly due to reducing costs of batteries, and models with longer ranges and lower cost of ownership than fossil fueled vehicles [25,26,27]. BEV sales are also growing in India [28], especially in the two- and three-wheeler markets [29]. FCVs have lower grid-to-wheel efficiencies than BEVs [27,30]. The cost of electrolysers and hydrogen refuelers are greater than the cost of BEV charging infrastructure, and FCVs cost more than BEVs [27]. Therefore, this study first considers the suitability of each form of transport to be served by BEVs, with the remainder served by FCVs.
The paper then considers predicted growth rates of each of these technologies and the extent to which transport energy can be reduced over the coming decades compared to the fossil-fueled case. The paper considers the electricity grid, the balance of supply and demand in that grid, and the costs of providing electric vehicle charging infrastructure. This includes the cost of grid reinforcement both locally to charging points and regionally.
Four low-carbon transport technologies are considered but two are dismissed, leaving just BEVs and FCVs.
Finally, the paper considers grid balancing: hydrogen, energy storage, and the question of whether it is better to charge BEVs during the daytime using rapid chargers or overnight using slower chargers.

2. Method

This paper uses a variety of published technical and economic data from academic, commercial, and journalistic sources to consider the technologies available to decarbonize each form of transport at point-of-use; the necessary investments needed to generate low carbon energy for transport; the analysis of the effect of transport energy on the temporal balance of supply and demand of electricity; and evaluation of the optimal time of day for recharging BEVs including the economics of recharging infrastructure.

2.1. Feasibility of Battery-Electric Vehicles (BEVs)

Where an existing form of transport is powered by liquid or gaseous fossil fuels in an internal combustion engine (ICE), an electric motor of equivalent power rating is compact and usually no heavier. However, the battery to supply energy to that motor adds both volume, and crucially, a great deal of weight compared to the fuel tank that it replaces. The energy density of petrol (gasoline) is very high at 46.4 MJ/kg [31] but the energy density of lithium batteries is much lower. For the purposes of this study, a practical lithium-ion battery has been chosen [32] with an energy density 0.806 MJ/kg. The battery-to-wheel efficiency of BEVs at 70% is much higher than the tank-to-wheel efficiency of an ICE vehicle, 20% [27] but this only reduces the volume penalty of batteries to a factor of six and the weight penalty to a factor of 16.
This study considers distance travelled, unladen (curb) weight, maximum vehicle weight, and energy consumption to assess the mass of battery needed in a BEV providing the same service; Table 1.
The distance travelled between charges can be up to a whole day’s worth. In all cases, a reserve charge or capacity factor was applied to the size of the battery to allow for variability in daily driving range. Trains operate almost continuously with little variation in daily range, and therefore their capacity factor is a modest 1.5. In the case of delivery vans, the daily range is much more variable and a capacity safety factor of 3 was applied to the average daily range. In other cases, the capacity factor was 2. In the case of cars and taxis, the calculated average daily range was that driven by taxis. Privately owned cars drive much shorter distances on most days, but are used for longer journeys on rare occasions, for which a longer battery range is required, similar to that of taxis.
The specific energy consumption is based on maximum laden vehicle weight in metric tonnes. This study includes an improvement in drivetrain efficiency and regenerative braking experienced in BEVs but with some penalty for the extra weight. For simplicity, a factor of 4.75 is applied to the ratio of petrol energy to electrical energy consumed per distance traveled [33,34], and a factor of 3.02 is applied to the ratio of diesel energy to electrical energy consumed per distance travelled [35], based on real-world experience and the differences in drive train efficiency. This is based on the electrical energy available in the battery, i.e., its discharge storage capacity, excluding energy lost in its round-trip efficiency.
Table 1 shows the characteristics of each type of vehicle, including the weight of the battery required. These numbers are used to calculate the suitability of each for replacement by a BEV, Section 3.1. Just for illustration, long-haul aviation is included in Table 1 and the weight of batteries required is clearly prohibitive. In land-based transport, however, the weight of batteries is less than the total vehicle weight.

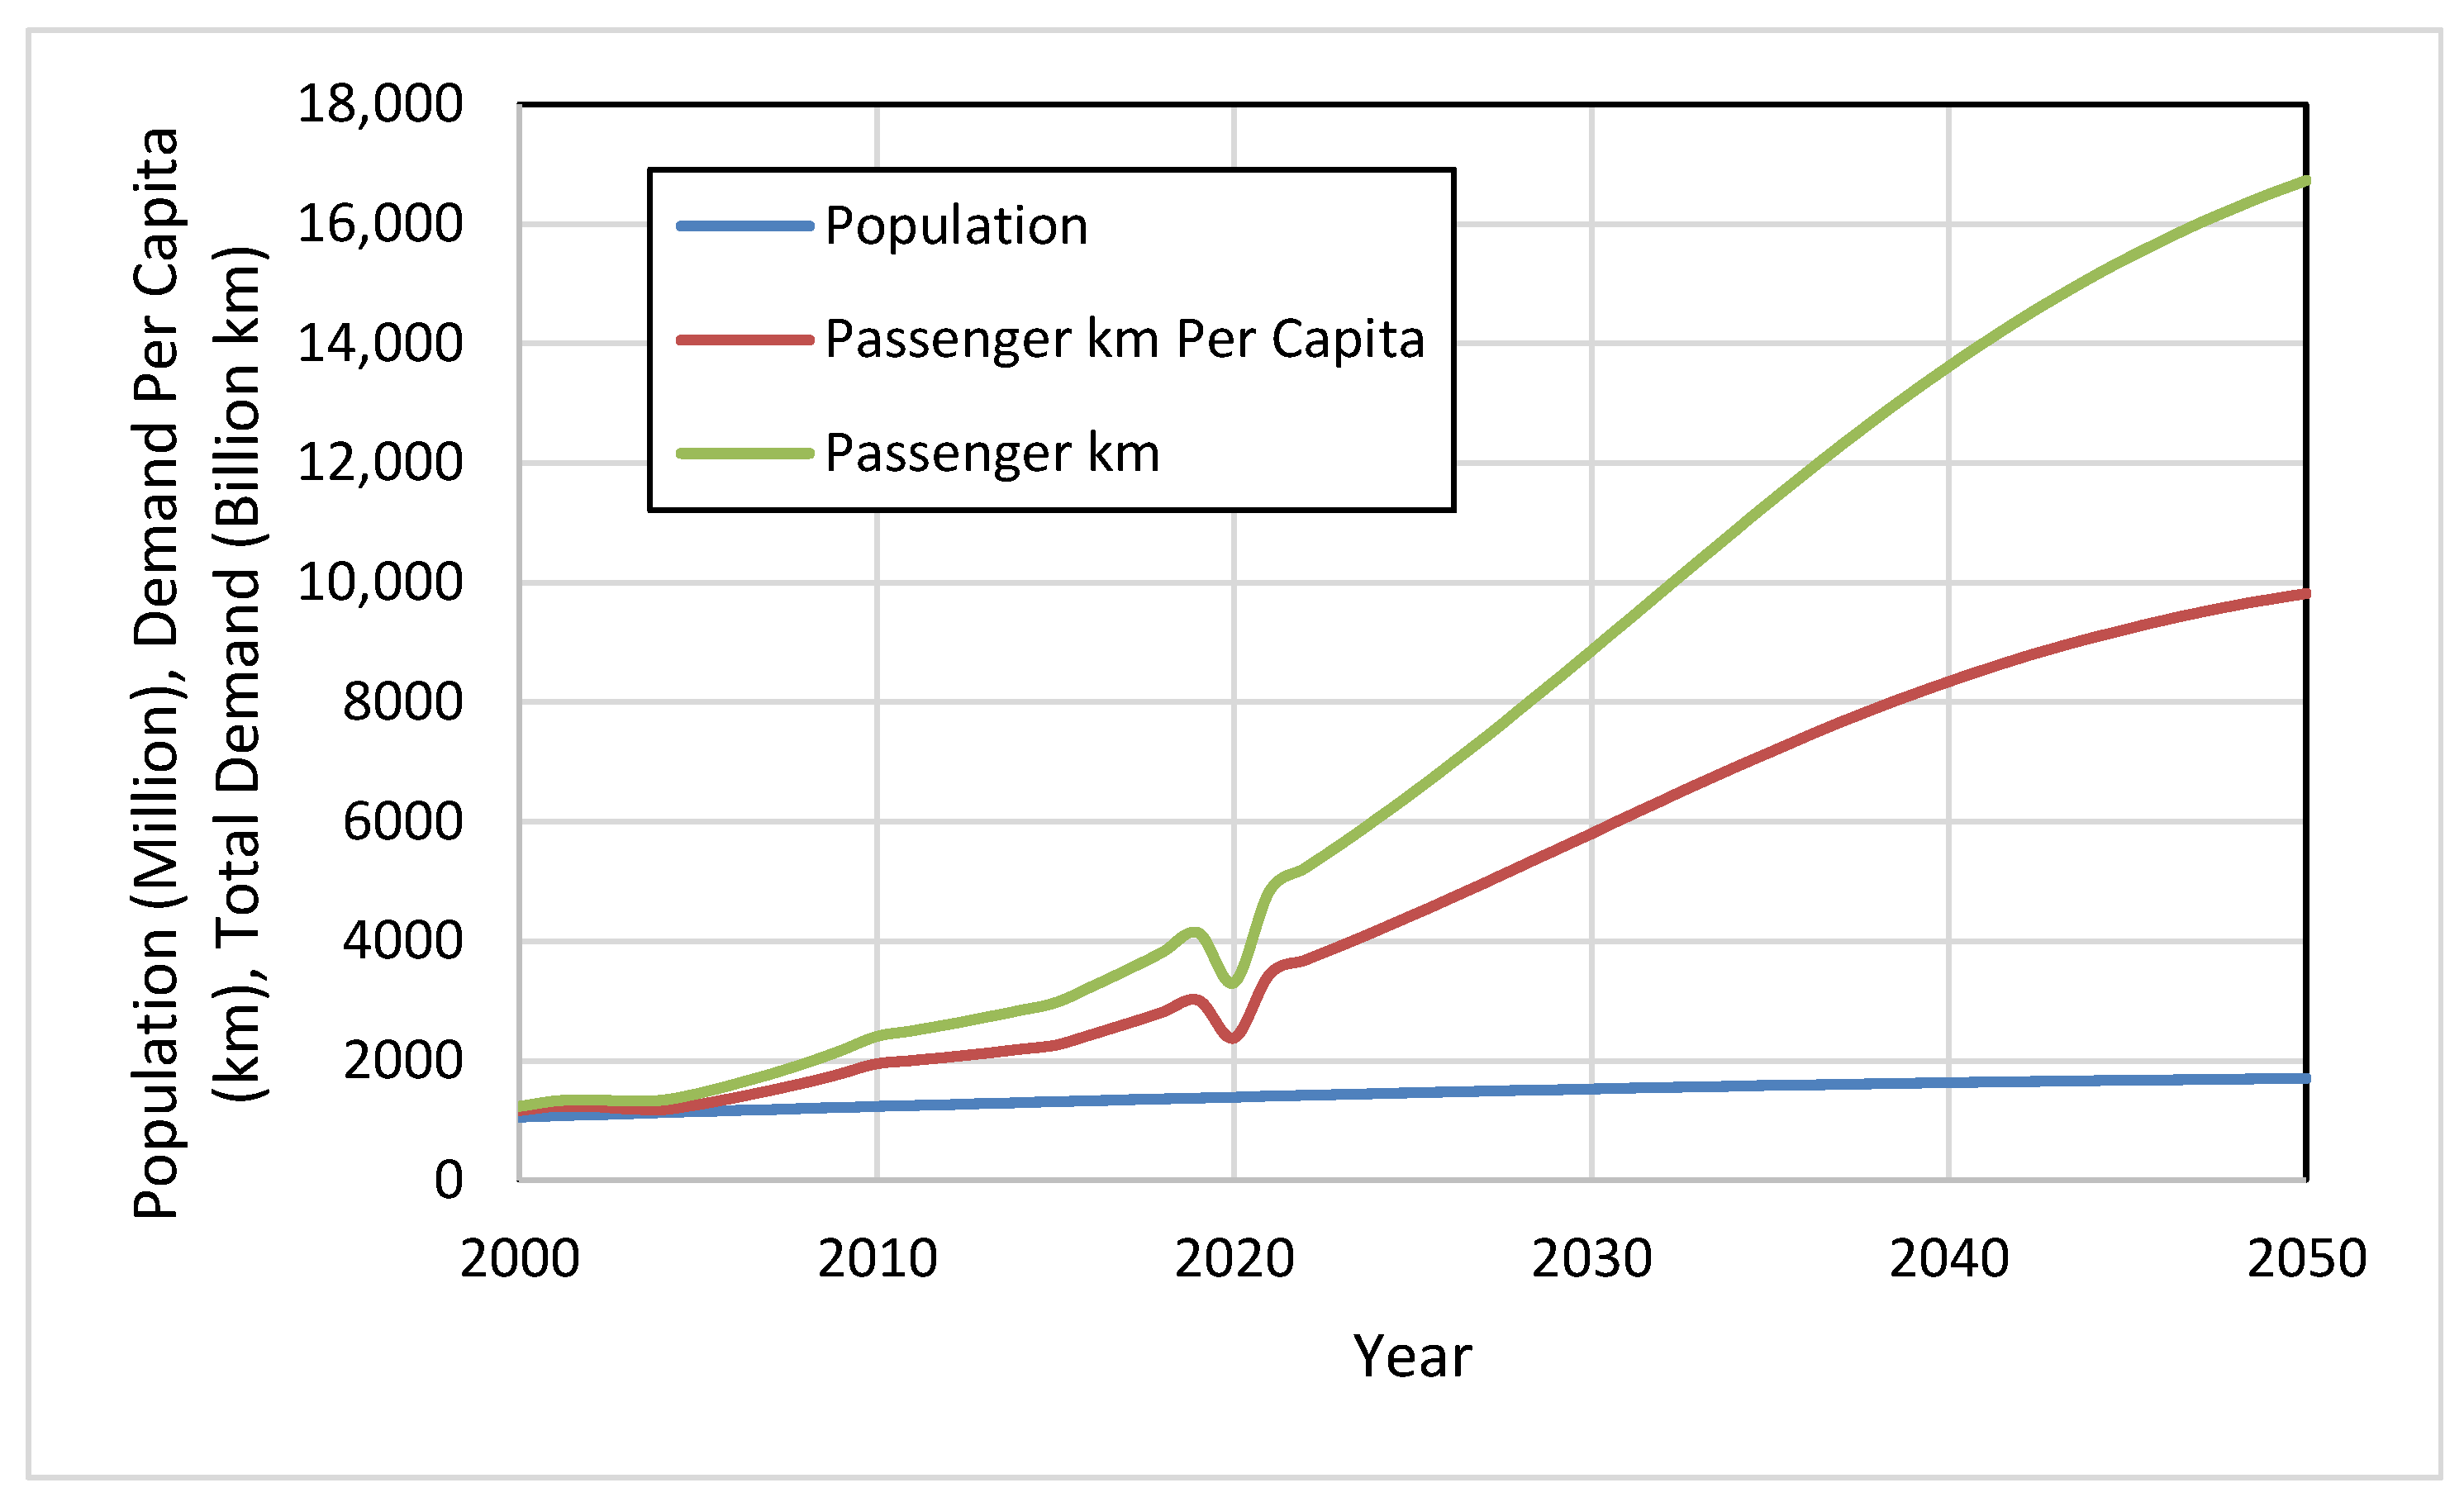
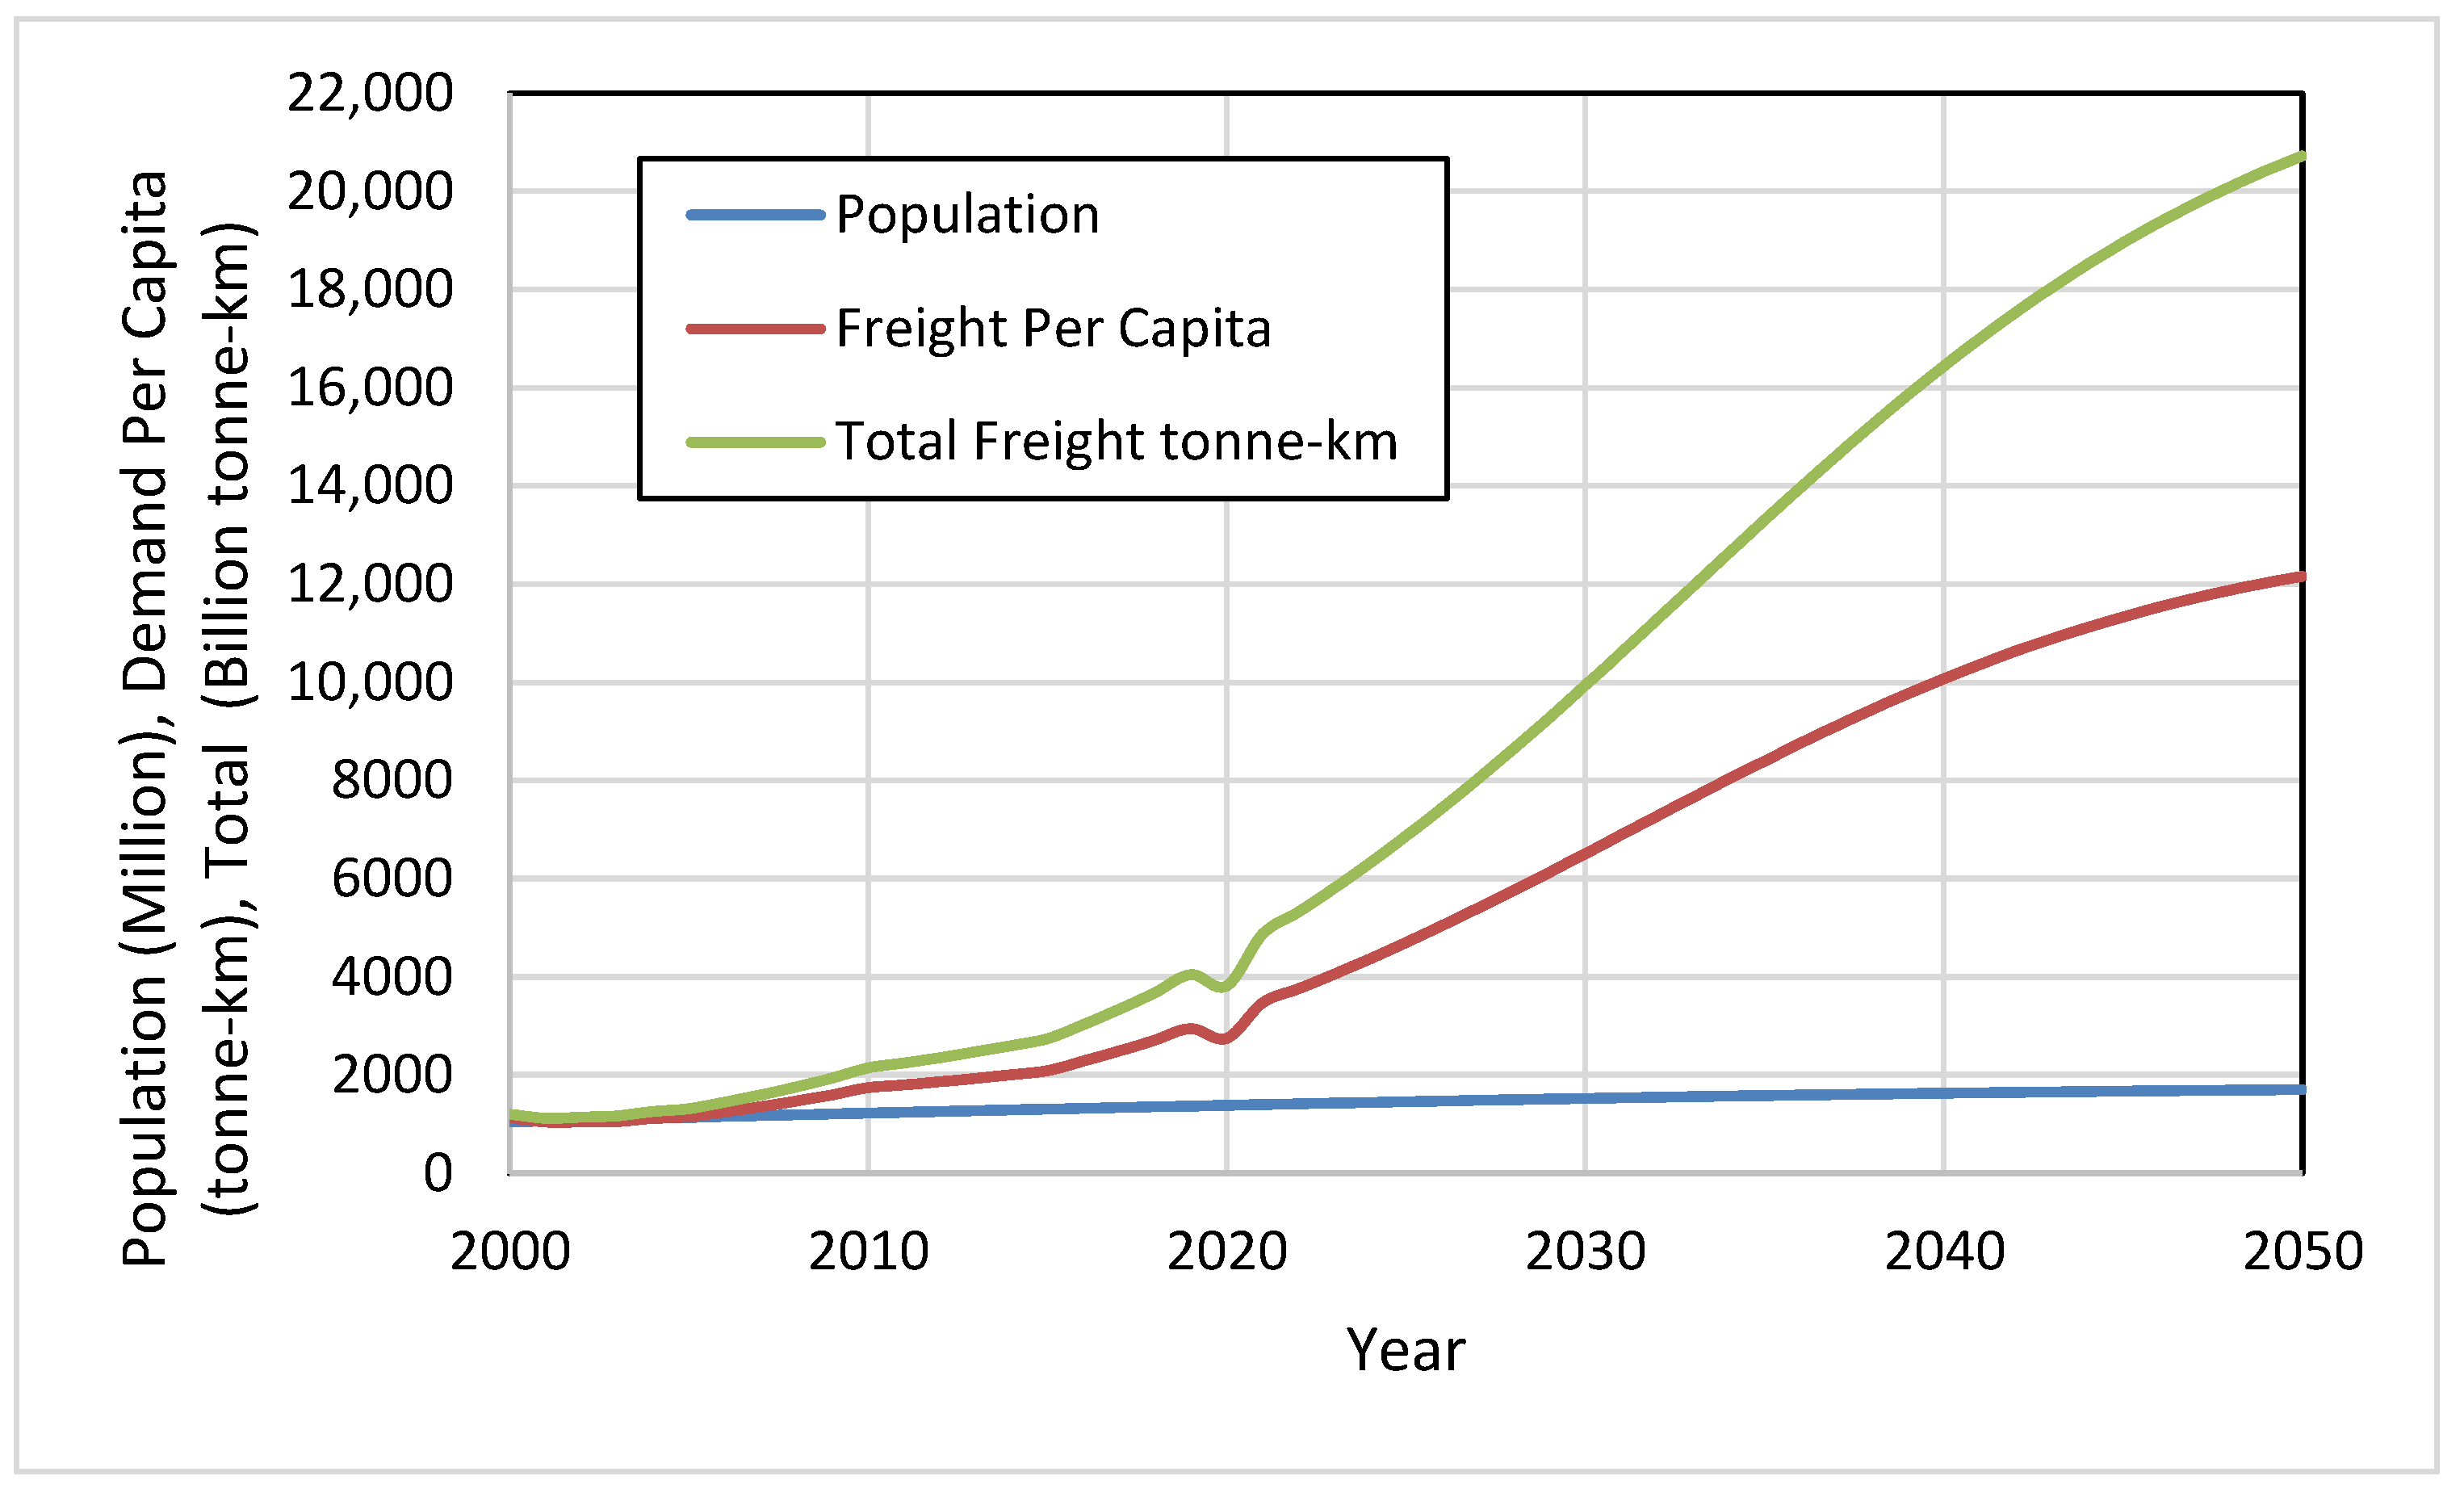
2.2. Growth of Demand for Transport and Transition to Clean Energy

Demand for transport services grew slowly but steadily between 1980 and 2004, with an average annual growth rate for petrol use of 8% per year and a growth rate for diesel use of 5% per year [36]. These growth rates continued until 2020 [37]. India has one of the fastest growing economies in the world and it is therefore assumed that demand for transport services, both passenger and freight, will grow until they attain the levels experienced by a fully developed Western economy, for example the UK in 2017 [38]. These three sources of data are disaggregated by vehicle type and fuel, with information on passenger-km travelled and freight-tonnes transported. Together with historical [39] and predicted population growth [40], they have been used to create a model of growth of demand for transport energy in India to 2050. This growth follows an S-shaped logistic curve with the rate of growth slowing in later years, as shown in Section 3.2.
A transition model was created (Section 3.3) to show the magnitude and rate of the required technology changes, and to inform government policy making and investment by industry. Demand for low-carbon transport in India was already worth USD 5 billion in 2020 [41]. The transition to clean transport energy is also modeled as a logistic curve. The initial growth rate in the use of BEVs is based on current market growth rates but the achievement of zero-carbon transport by year 2050 depends on rapid growth in both BEVs and FCVs. An assumption of vehicle lifetime of approximately 16 years [42] is used to estimate the transition in vehicle manufacture that must precede the transition in energy use.
Several assumptions were used to create a scenario of transport energy use in India at the end of this transition, nominally in 2050:
  • Transport demand and use is the same per capita as the UK in 2017 in terms of passenger-km and tonne-km travelled.
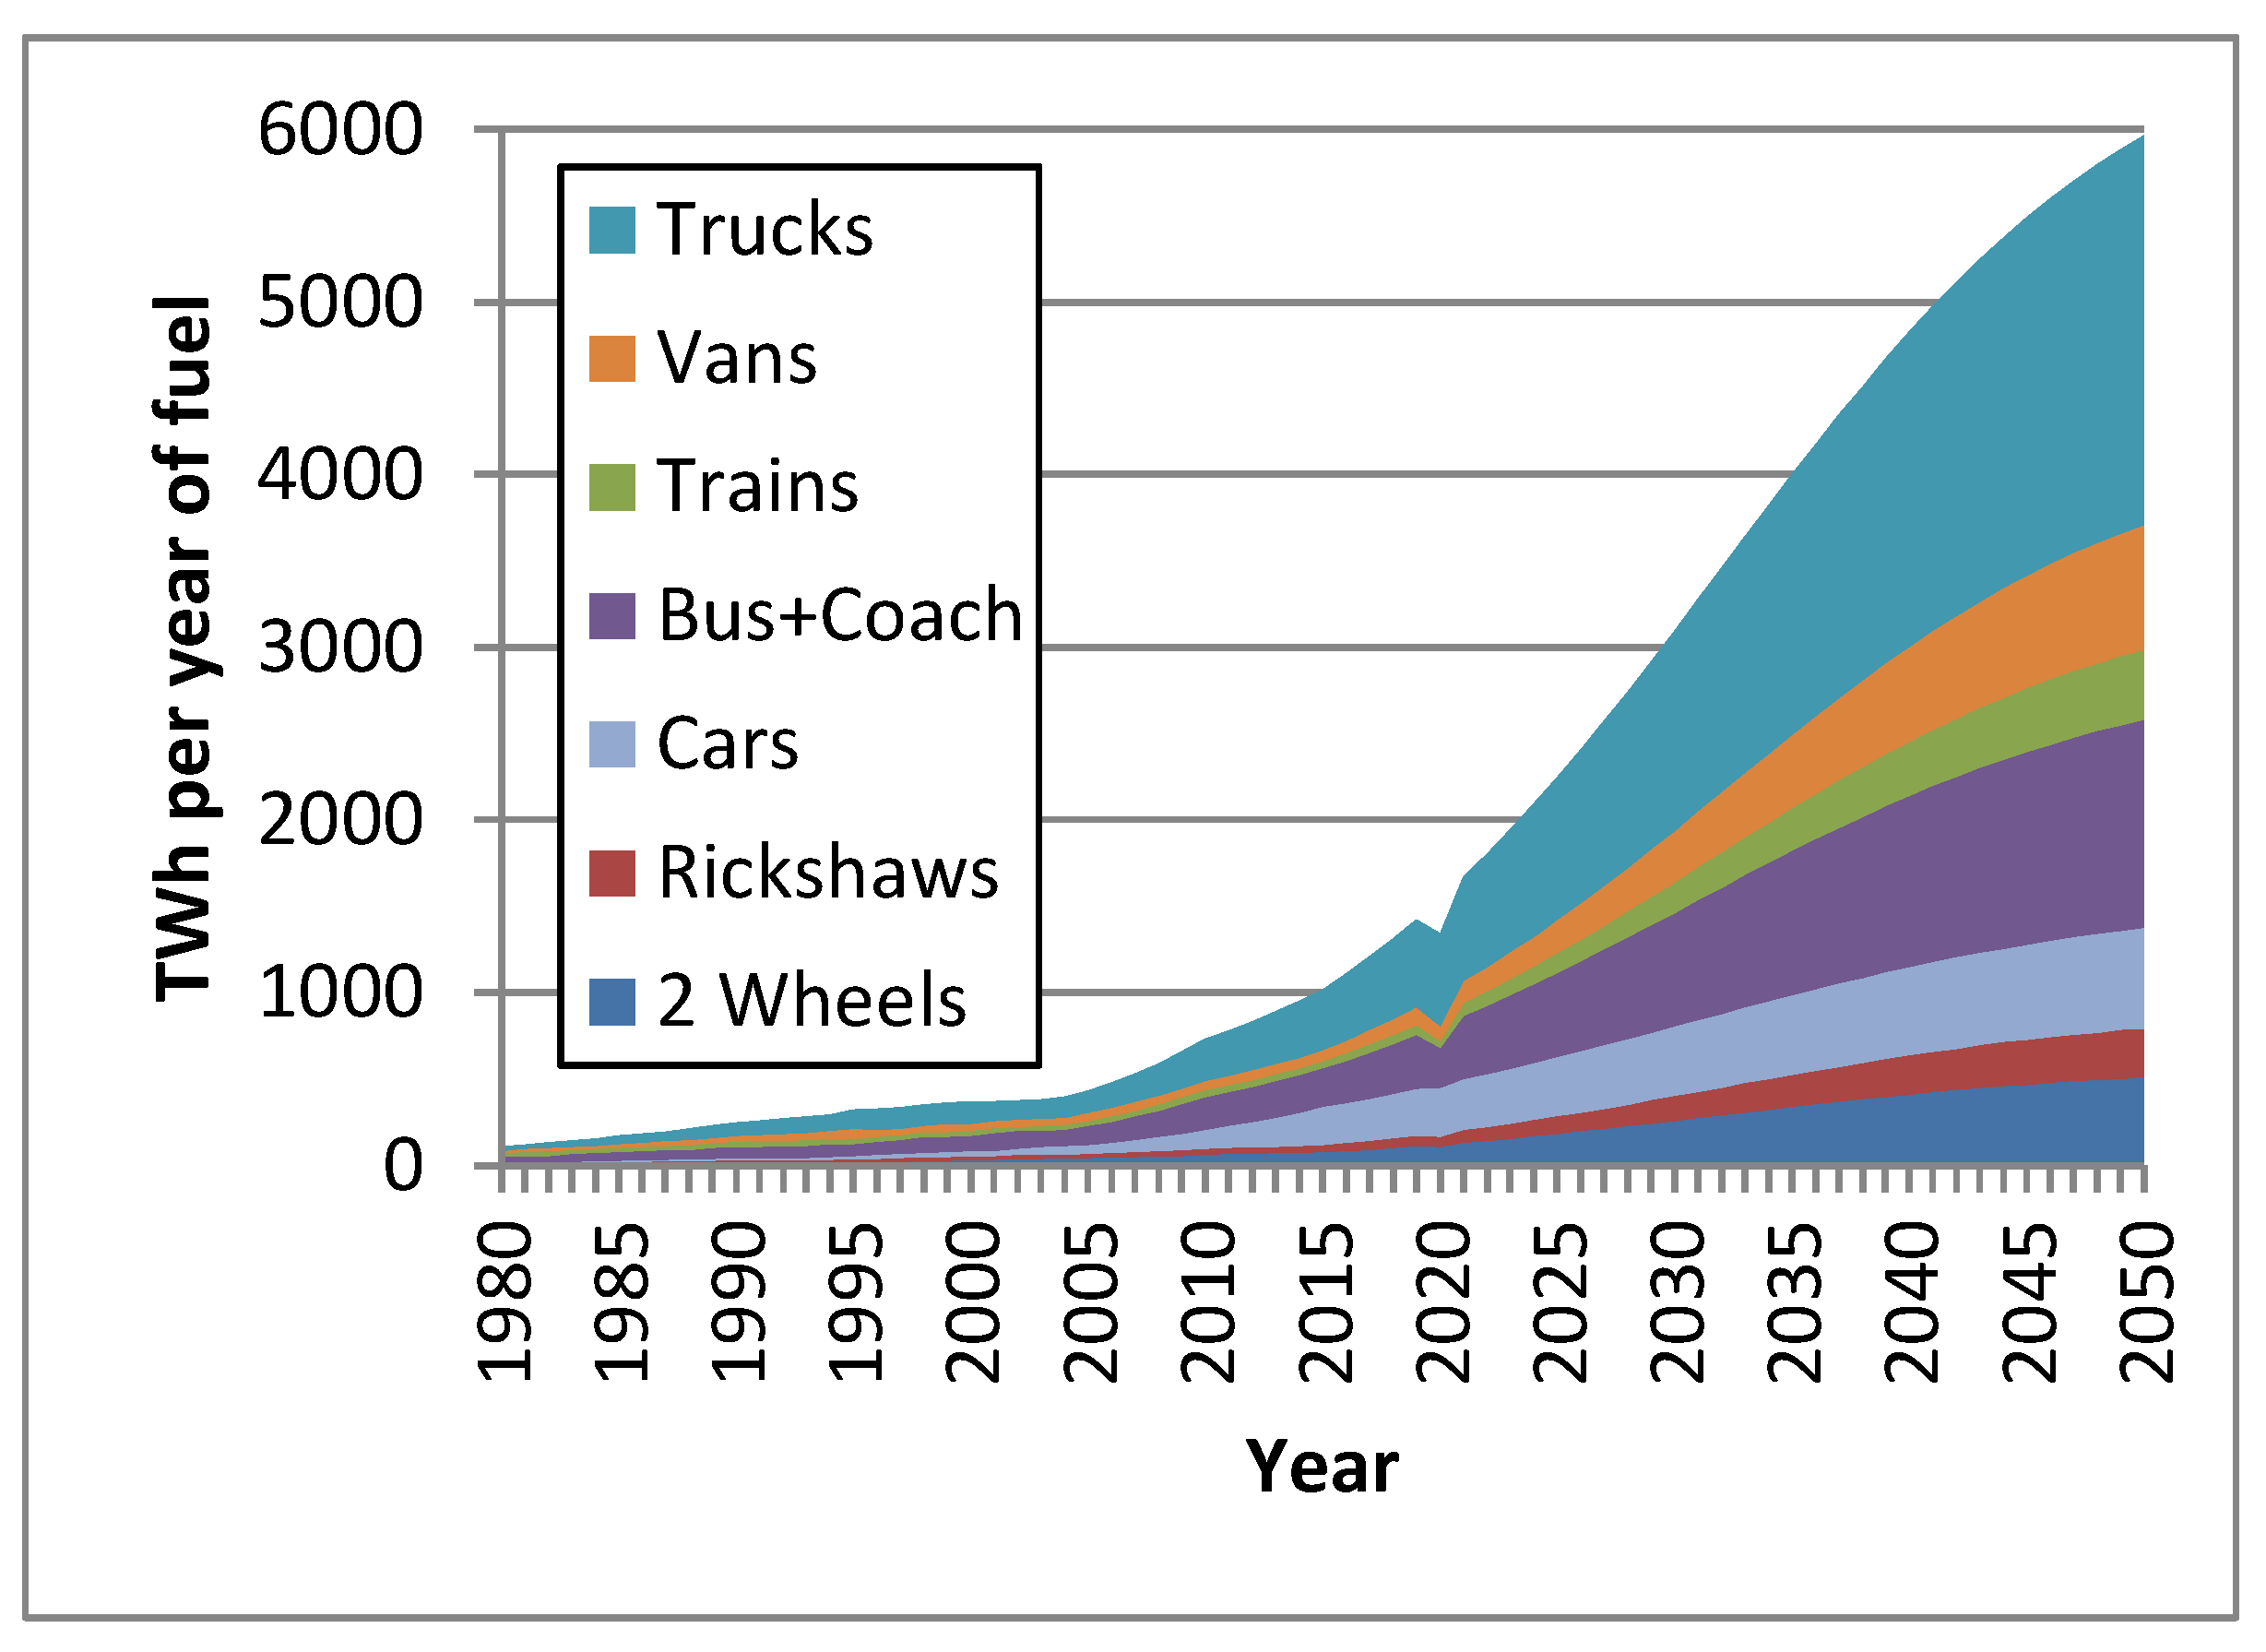
  • Modal differences compared to the UK: More autorickshaws, more two-wheelers, more buses, more trains, but fewer private cars.
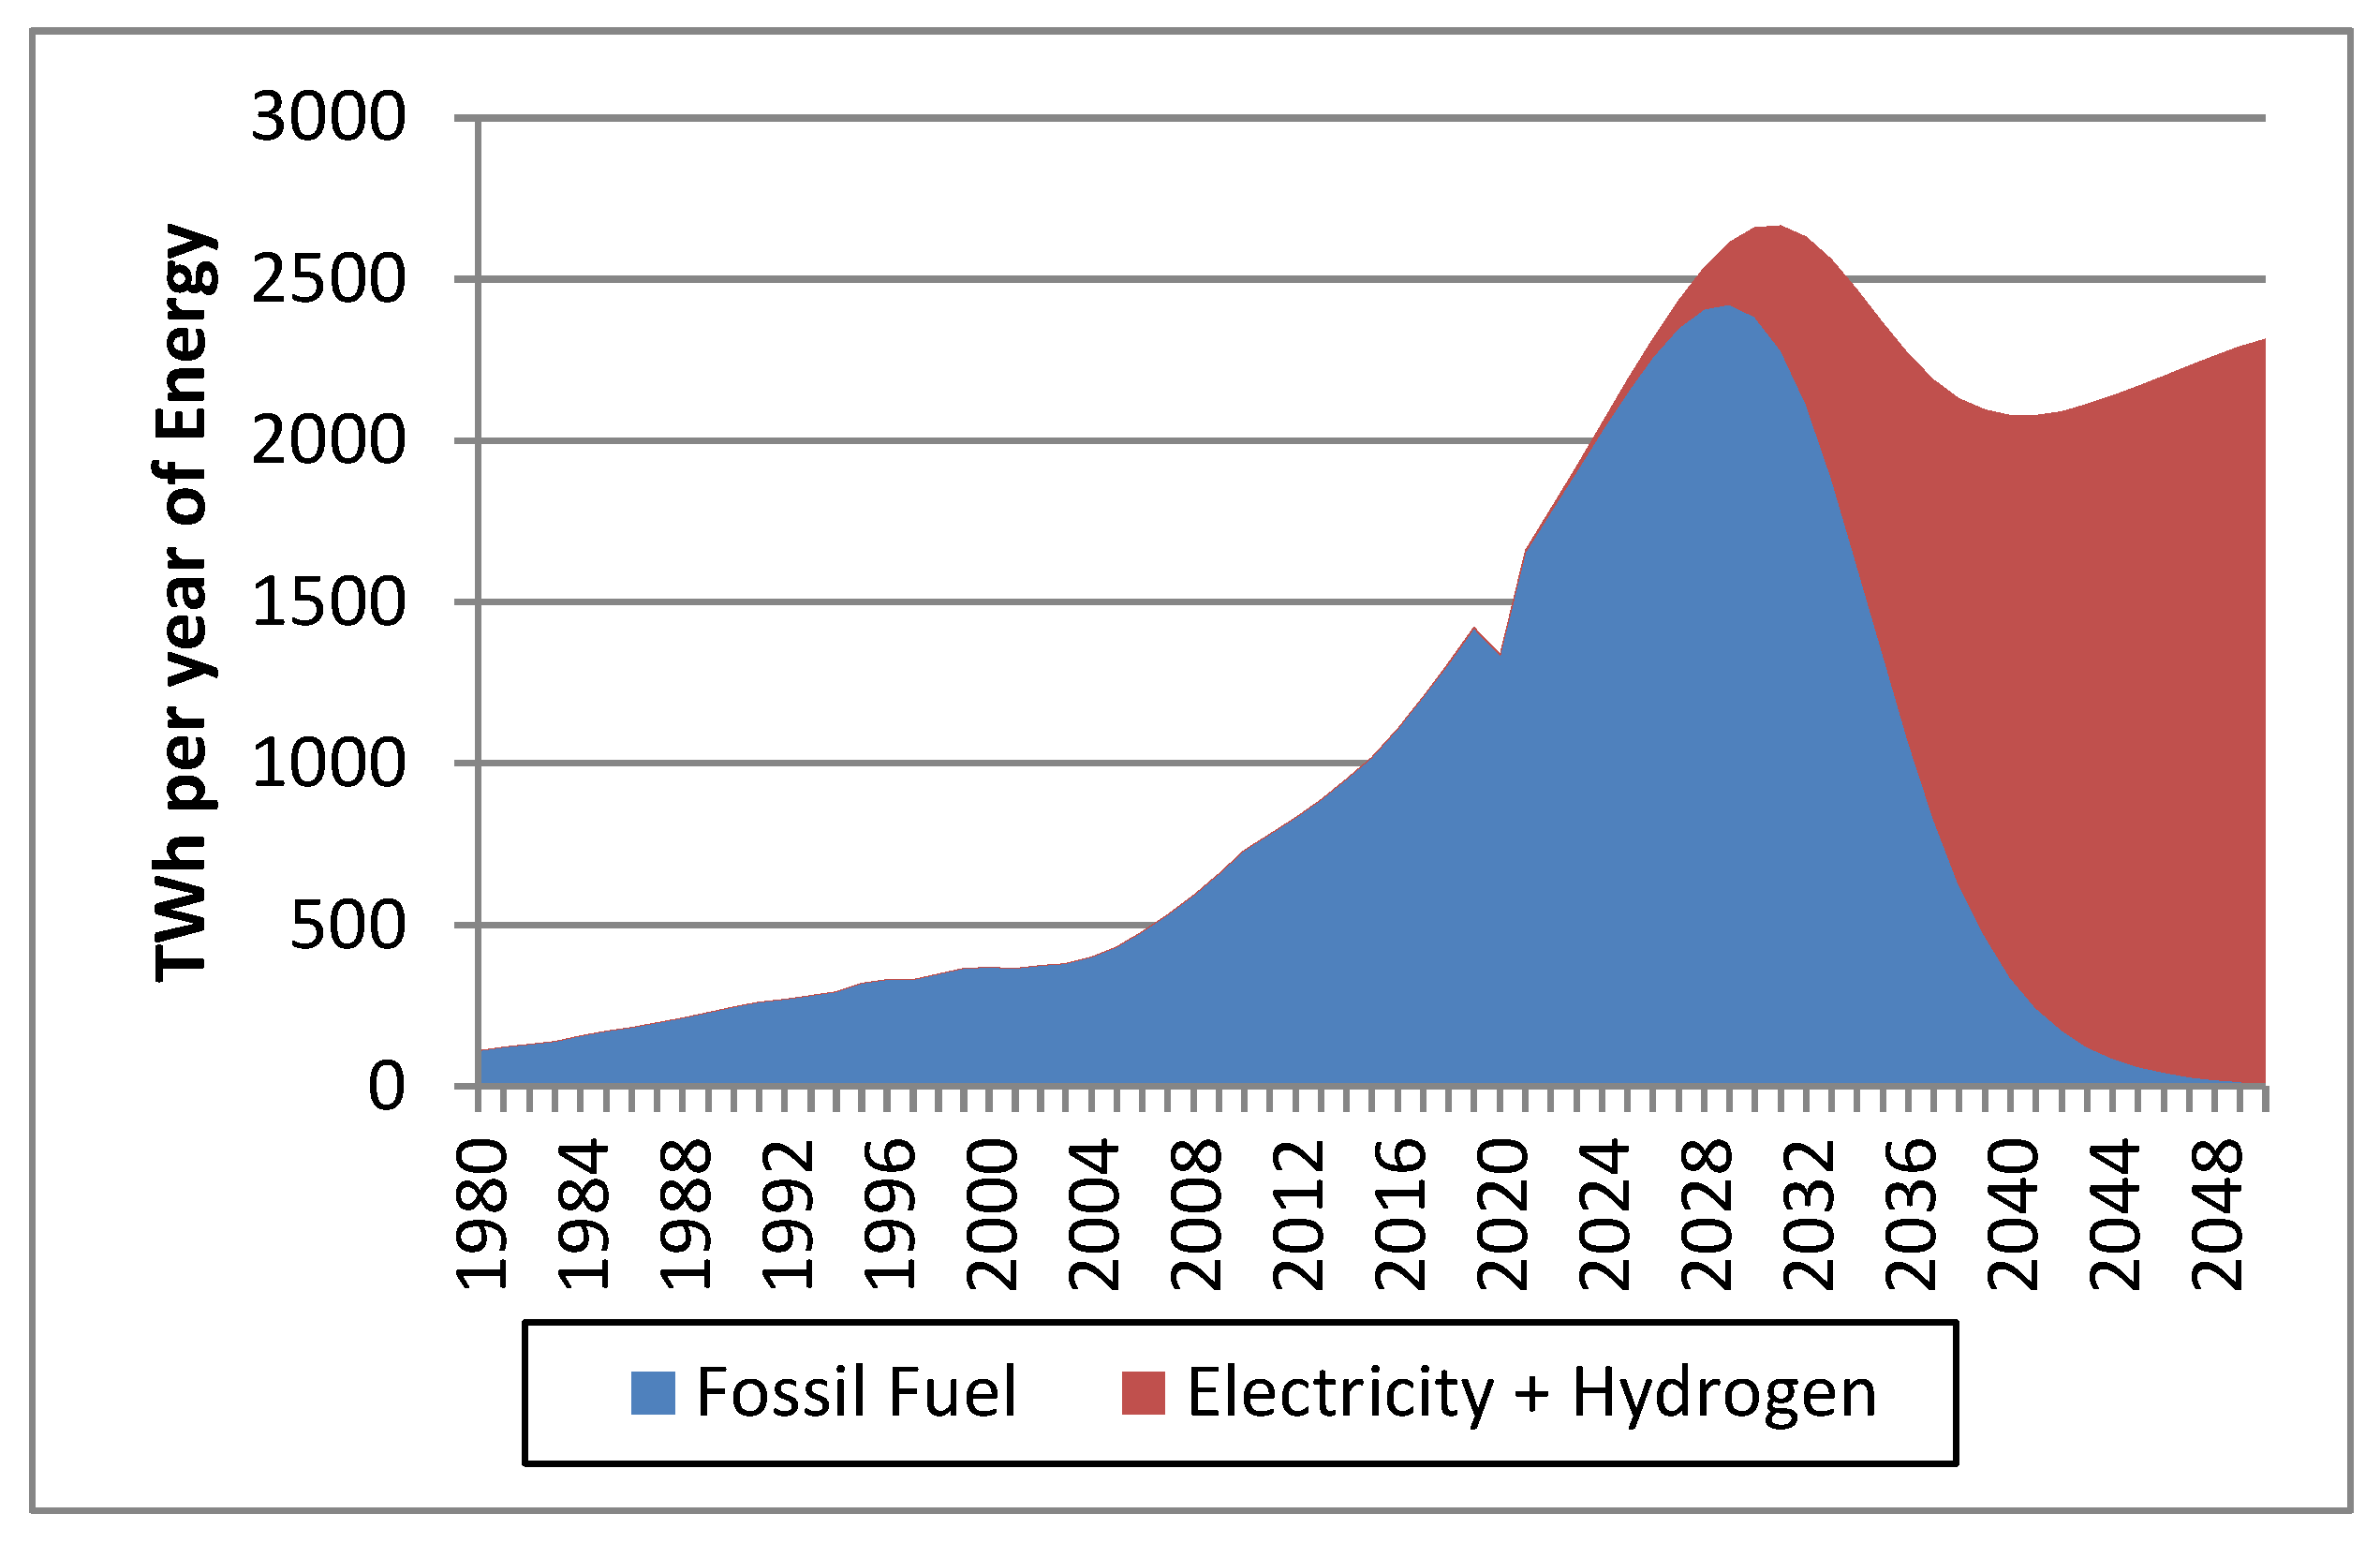
  • Land-based forms of transport will use BEVs where possible, with an improvement in efficiency, consistent with electric motors compared to petrol engines or diesel engines.
  • Forms of transport not suitable for battery electrification will use compressed hydrogen gas. The improvement in energy efficiency results from the use of fuel cells compared to diesel engines.
Petrol and electric car efficiency data was taken from the Idaho National Laboratory of the USA [34]. Central values of 3 miles per kWh of electricity and 22 miles per US gallon and a calorific value of 9.5 kWh/liter for petrol were used to calculate an efficiency improvement factor of 4.9.
The energy consumption of electric buses was calculated using the performance of the BYD K9 electric bus [26], and the performance of both diesel and electric buses and their relative efficiencies were taken from [35], giving a relative energy efficiency improvement factor of 3.0. The energy performance of fuel cell vehicles came from a study of the Toyota Mirai [43] and result in an efficiency improvement ratio relative to diesel engines of 1.82. Using projections for population growth [40] and the above assumptions, the energy used in India by transport was predicted until 2050, with and without a transition to BEVs and FCVs, as shown in Section 3.3.
When converting from passenger transport demand to maximum payload weight of passenger vehicles and vice versa, a single conversion factor of 235 kg/passenger was used, accounting for luggage and average occupancy being less than maximum occupancy [44].

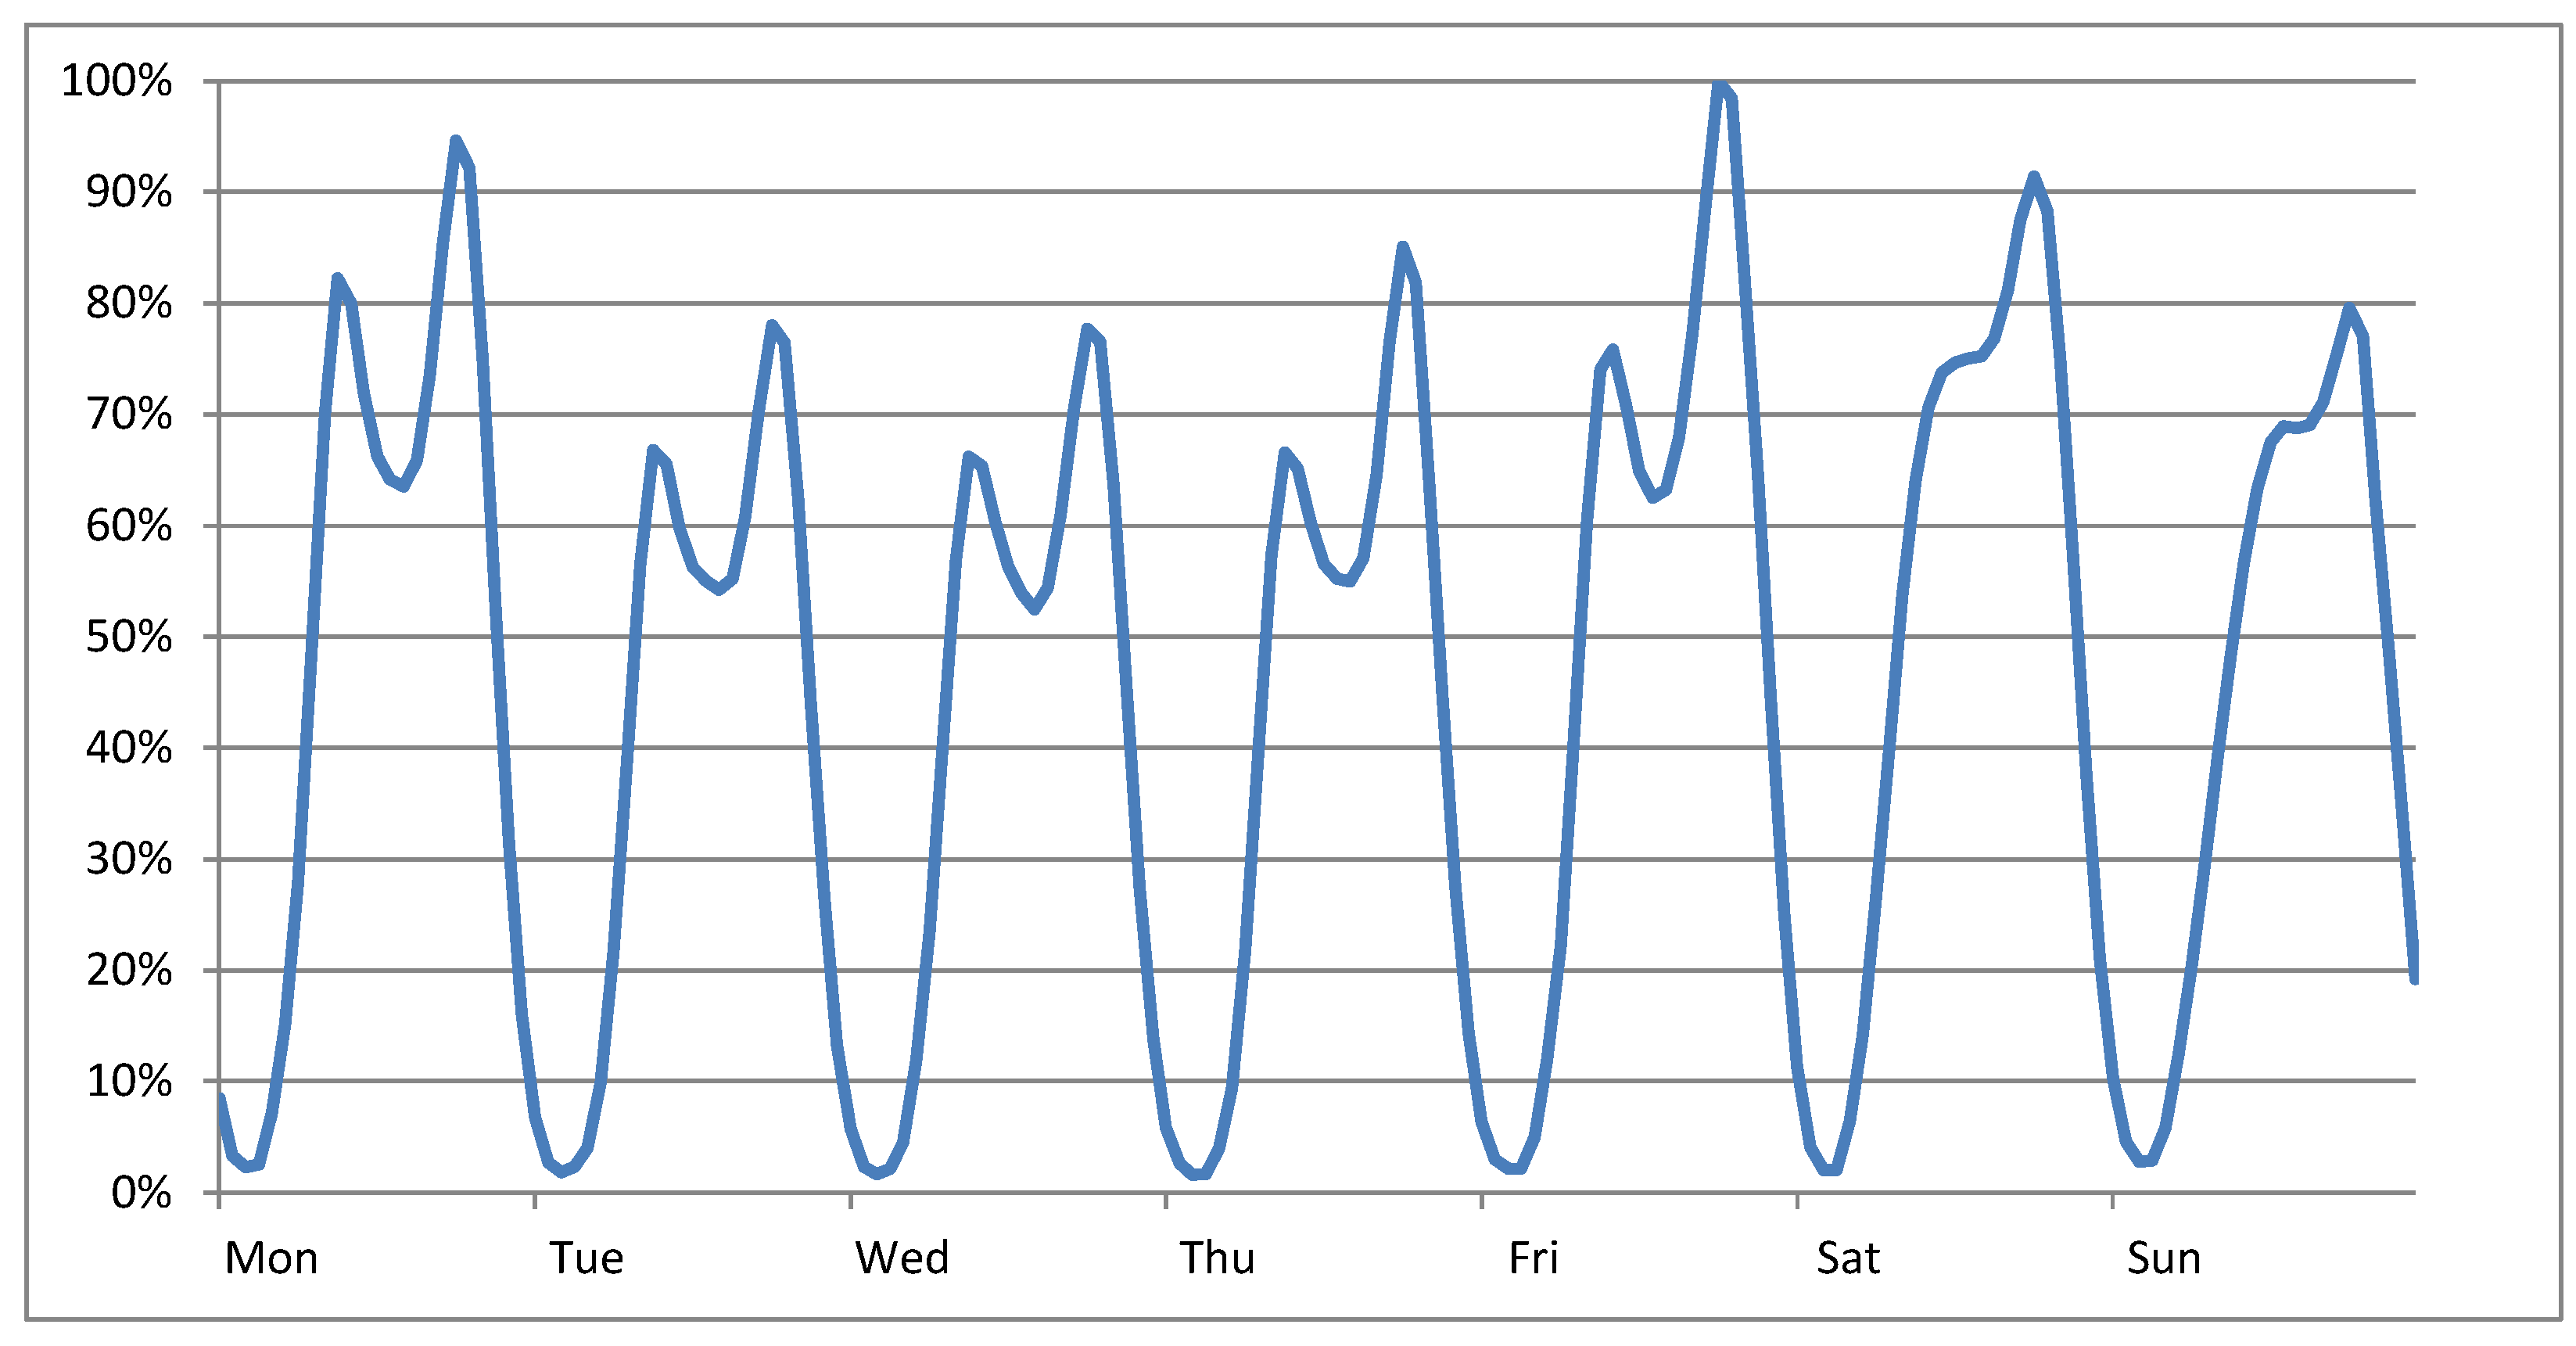
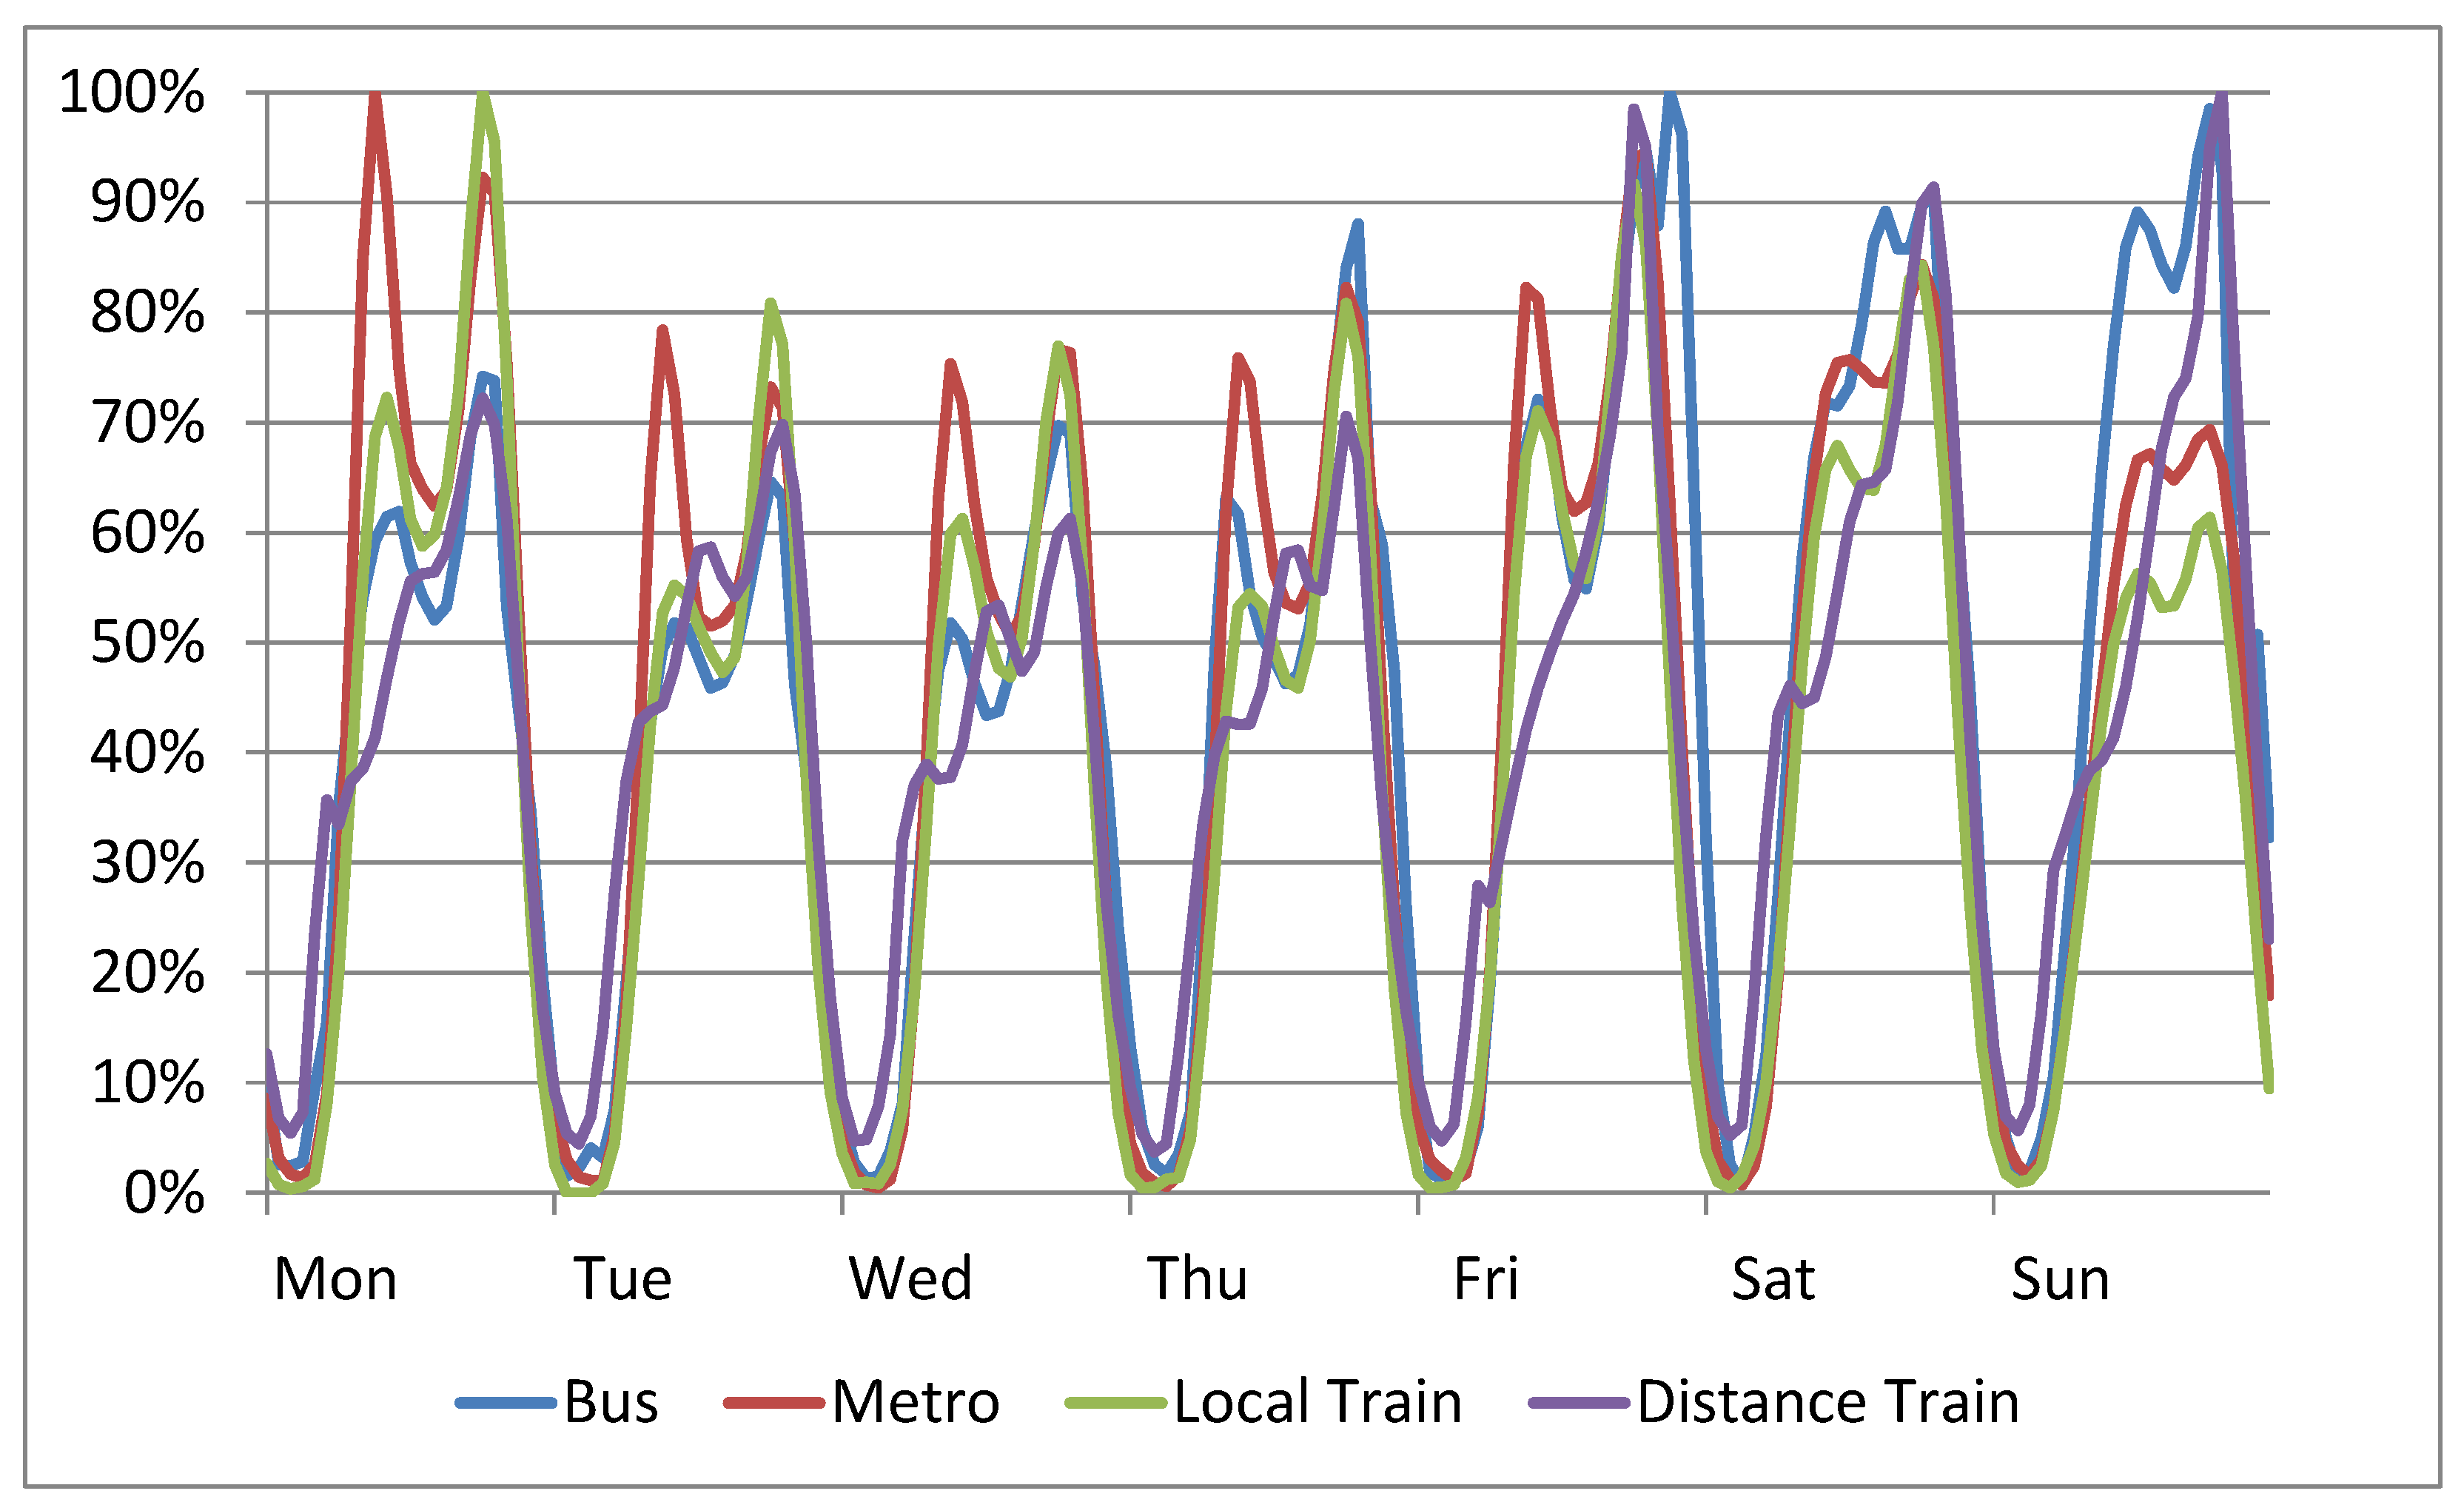
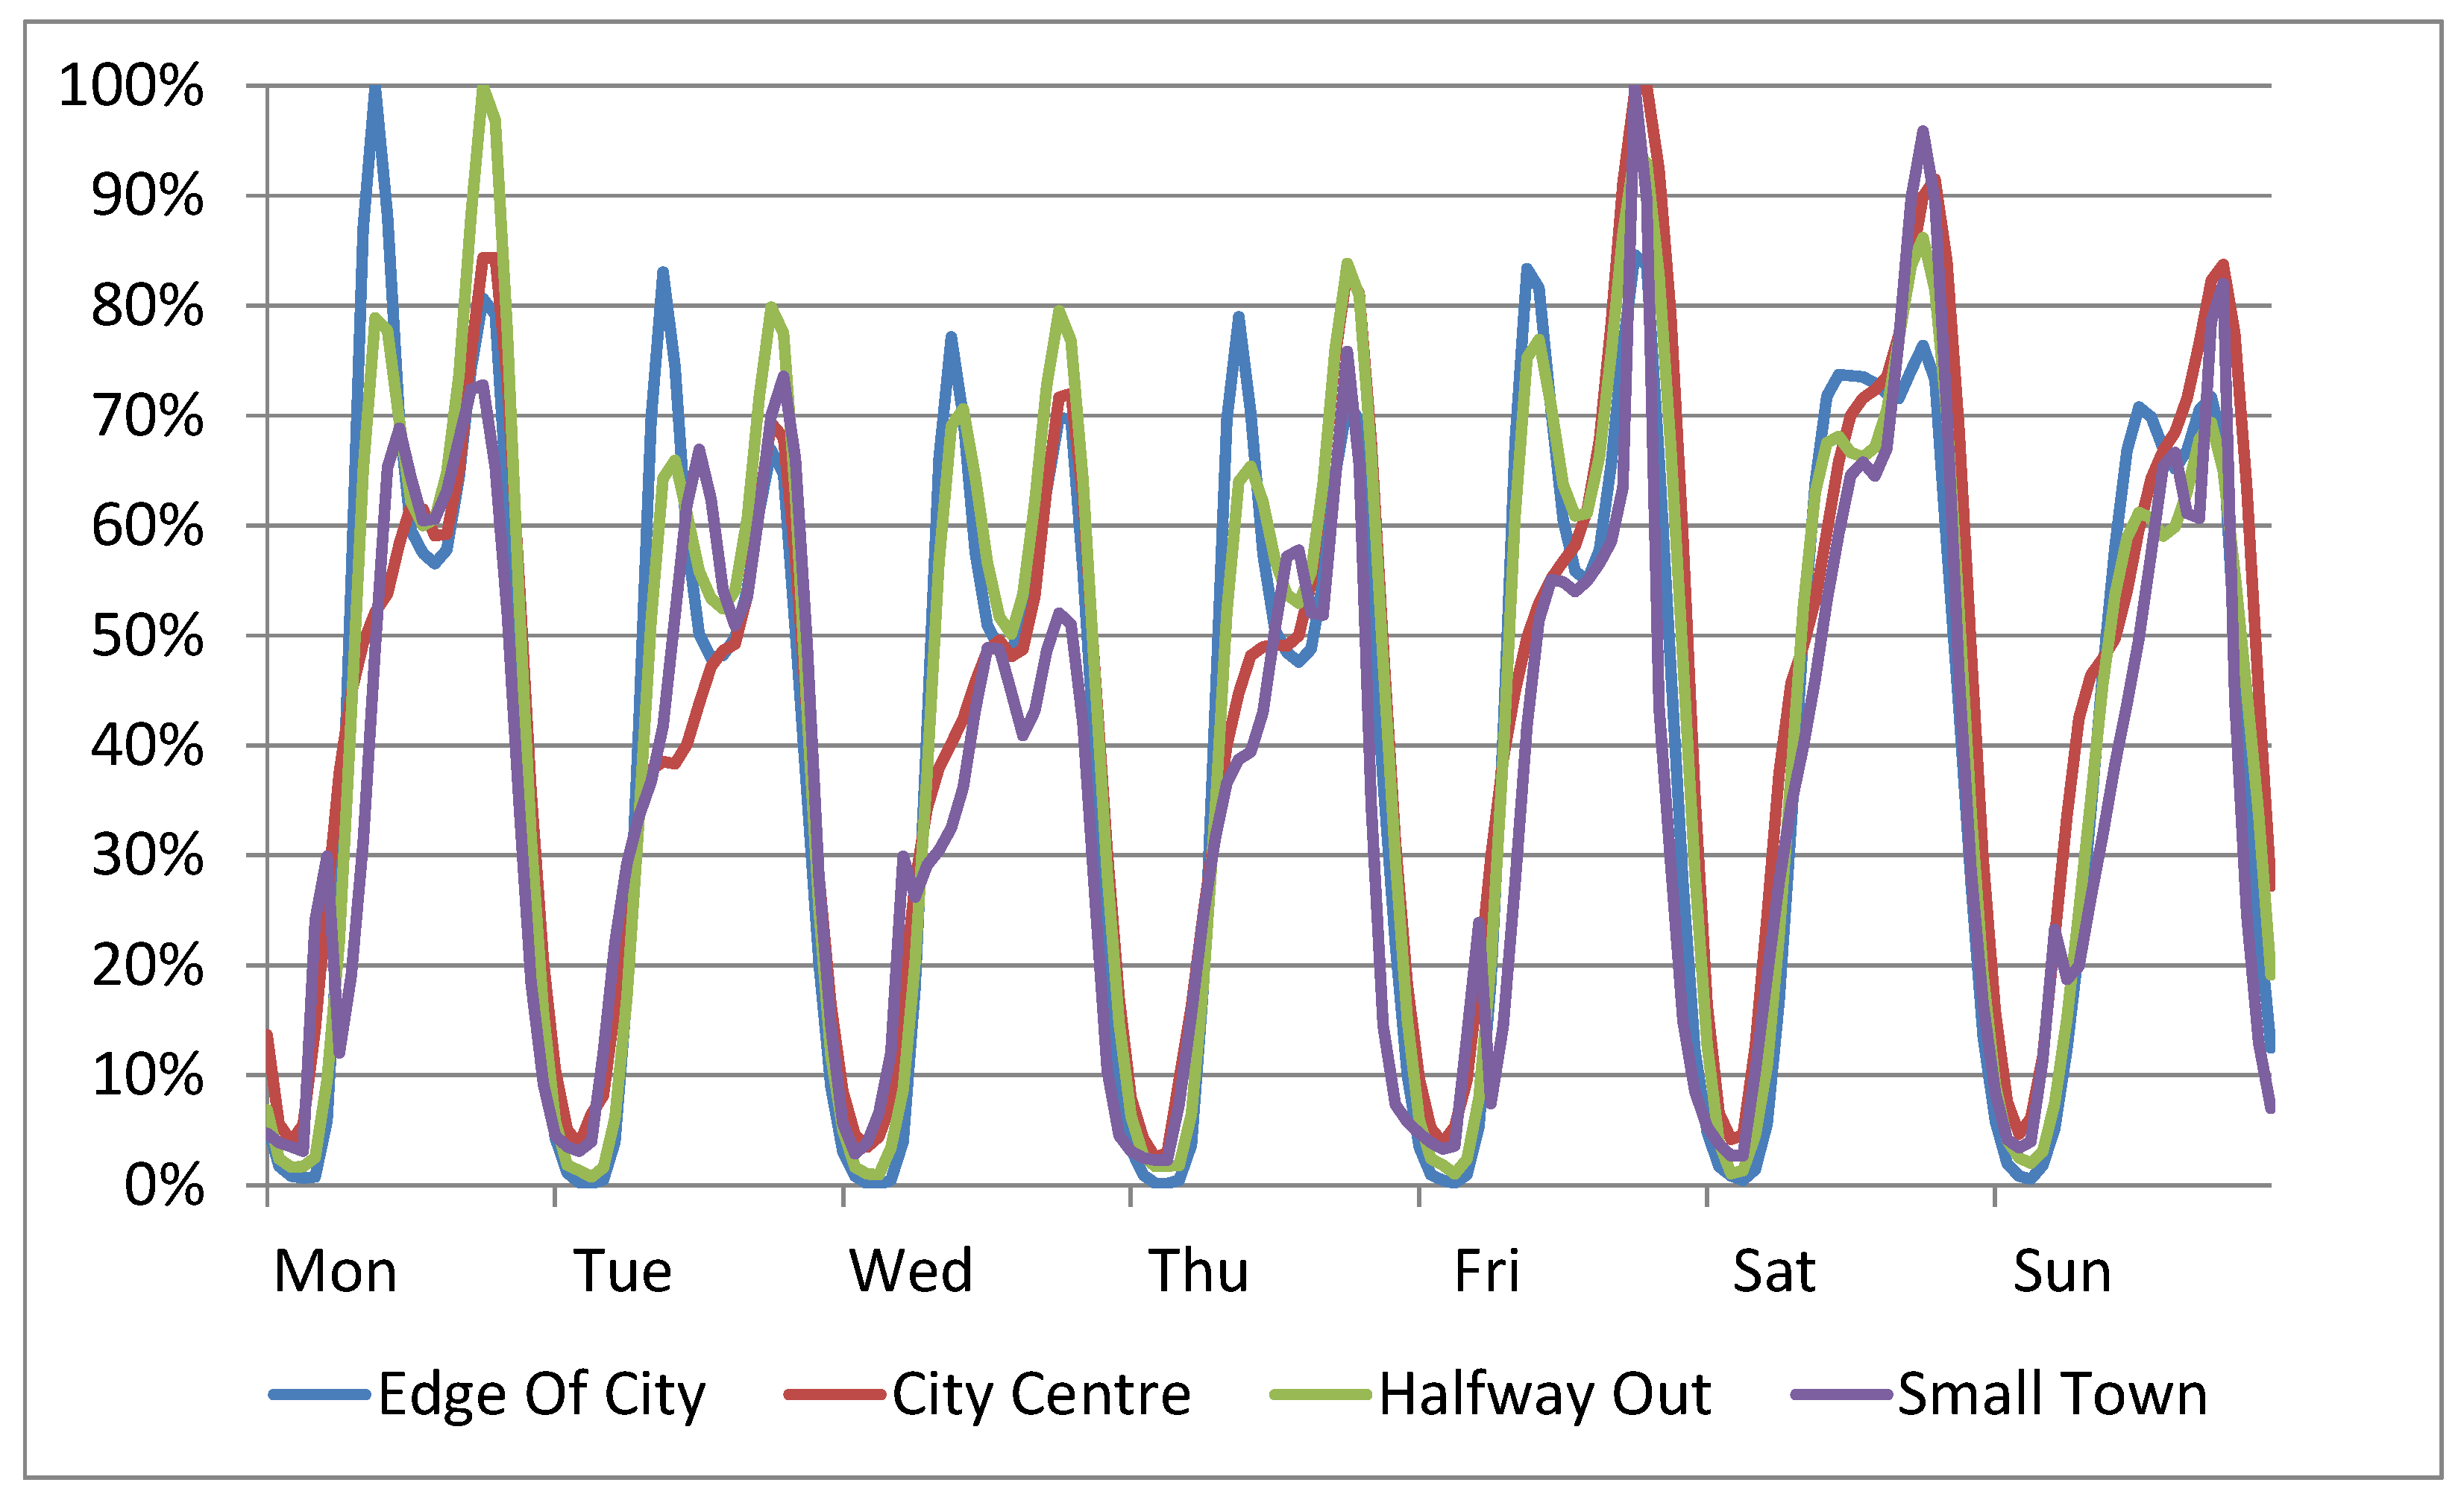
2.3. Temporal Variation in Public Transport Use

As part of their wider marketing activities and as a service to other businesses and their customers, Google publishes ‘Google Popular Times’ or busyness data for many locations around the world [45]. The data is sourced from mobile phones that have Google location history turned on. In this paper we use web scraping, within Google’s terms and conditions of reasonable use, to gather this data to quantify the number of people waiting for various forms of public transport. This paper uses the data as a proxy for demand for transportation. This is not the first time that Google Popular Times has been used to study human behavior in academic research [46] but examples appear to be rare.
Section 3.4 uses Google Popular Times data from 50 locations around India as described in the Appendix A. The locations include city-center, half-way out of a city, edge-of-city, and rural/small town. The forms of transport include bus, metro, local train, and long-distance train. Data includes all hours of the week and weekend. All data was normalized and averaged over all 50 locations to create an average profile of transport use. Although it is difficult to prove that this weighted average is representative of the nation-wide average transport use, or even less the average energy used in transport, the diversity of locations captures most patterns of commuting and journey type.

2.4. Renewable Energy Scenario for India including Transport Energy

The decarbonization of transport is modeled in the context of a low-carbon energy system, recognizing that the electricity and hydrogen used in BEVs and FCVs must come from zero-carbon sources for the transport to have no associated carbon emissions. Previous examples of very low carbon energy scenarios for India are very few; here we use one example that excludes all coal and nuclear baseload generation but includes an hourly time step model of generation and demand [47,48,49]. This scenario uses data from the Internet of Energy modeling and visualization tool that is part of the Neo-Carbon Energy Project [50] and derives from the same research group and same methods as the previous papers by Gulagi et al. Time step data was downloaded from this scenario and reanalyzed using MATLAB and Microsoft Excel to calculate the total supply and demand of electricity and flows of energy to and from storage in each hour of a typical meteorological year.
The scenario includes all energy used in stationary applications. Industrial uses of fuel were converted to use electricity or synthetic fuels manufactured from biomass or synthetic fuels made using hydrogen produced using water electrolysis. The total electricity demand is increased substantially from year 2020 levels to represent the electrification of stationary uses of energy, increased demand for space cooling, reverse osmosis desalination, and a general increase in demand with population growth and economic development.
Transport energy was largely excluded from the Internet of Energy scenario. This new scenario model therefore adds in transport energy to show how transport can also be decarbonized using renewable energy. All the additional energy is provided by fixed-tilt solar PV because it is an abundant and ubiquitous resource.
This paper presents an energy supply from 100% renewable energy using mostly wind power and solar photovoltaics (PV). Although nuclear power remains a much lower carbon source of generation than fossil fueled generation, India generates just 3% of its electricity using nuclear power, with only slow growth [51,52]. Concentrating solar thermal power (CSP) offers some advantages over PV in some circumstances [53] but generates only a small fraction of India’s electricity and its cost remains very high. Neither nuclear power nor CSP are needed to achieve a zero-carbon electricity supply. The associated time-step model shows how grid balancing is achieved in each hour of the typical meteorological year. There are two versions of the time-step model, representing different BEV charging strategies, as described in Section 2.5.

2.5. Electric Vehicle Charging Options

The energy and power required to recharge an electric bus is considerably greater than that required for a car or small delivery van. [54]. Therefore, different types of charging points will be needed for different types of vehicles. Leou and Hung also present a strong economic case for off-peak charging. However, there is flexibility as to the location and power rating of charging infrastructure and time-of-day that BEVs are recharged. When most electricity is generated by solar power, there is a strong counter-argument for daytime BEV charging to minimize the grid balancing challenge.
Section 3.5 and Section 3.6 evaluate the relative economic benefits and costs of daytime vs. overnight BEV charging. The advantages and disadvantages are outlined in Table 2.
As the model is a single-point, time step model with no spatial disaggregation, it is unable to compare the merits of charge point location within the grid (the final advantage of daytime charging in Table 2), or the logistics of shared charge points, but can evaluate the other advantages and disadvantages.
For the purposes of the model, daytime charging is ‘smart charging’ in the sense that the rate is modulated to match the surplus solar power available. The technical details, contractual arrangements, and unit pricing of smart charging are outside the scope of this paper.
Conversely, overnight charging, also described as off-peak, is treated as inflexible demand whose time profile is an inversion of the total transport demand profile. The assumptions are that when transport demand is at its peak, all available BEVs are in use and that the number of BEVs in use is proportional to transport demand. BEVs are parked when not in use and are plugged in to charge when parked, which is mainly, but not entirely, in the late evening and early hours of the morning. Off-peak charging also involves a degree of smart charging to ensure that power draw is constant throughout the parking period, neither concentrated into the hours immediately after arriving at the parking location, nor concentrated into the hours immediately before departure.
Finally, in Section 3.7, an economic model of just three passenger vehicle types is used to evaluate the relative merits of the two BEV charging strategies, including impacts on the wider electricity system and charging infrastructure investments.

3. Results

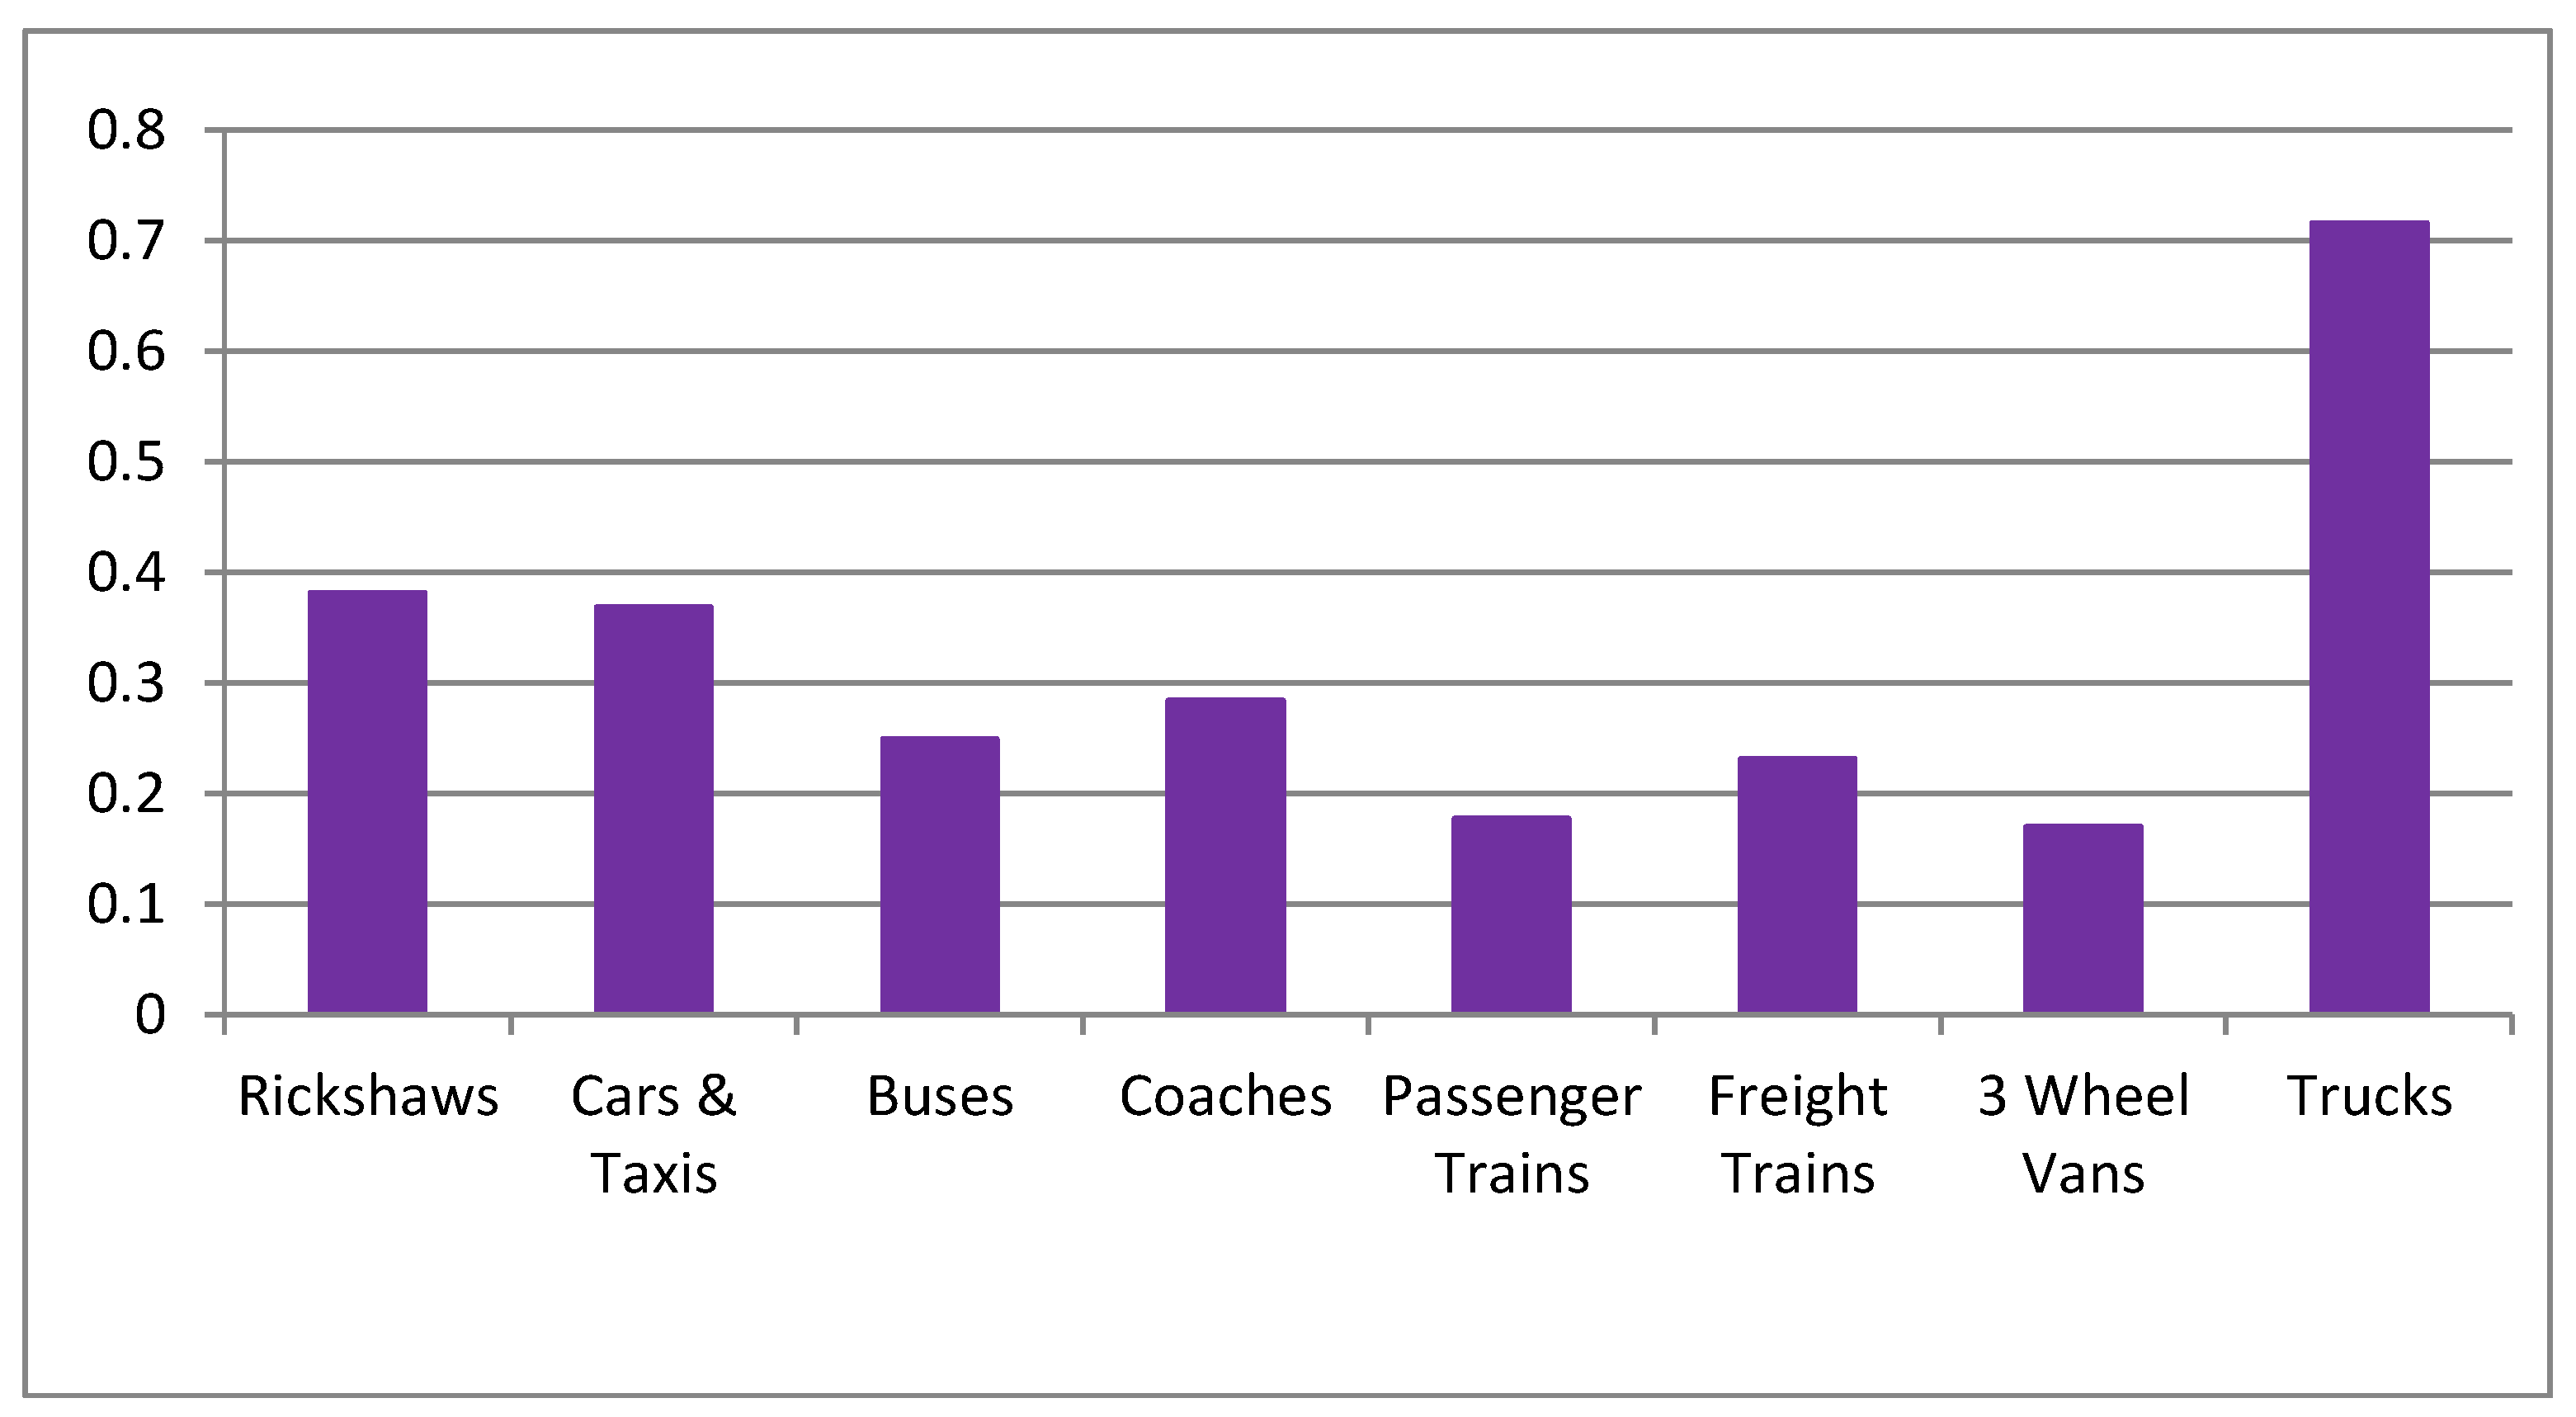
3.1. Batteries as a Proportion of Unladen Vehicle Mass

The data of Table 1 was used to calculate the mass of batteries required in each type of vehicle as a proportion of the unladen (curb) weight and is used as an indication of the suitability of battery technology for the decarbonization of that vehicle type, Figure 1.
Figure 1 shows that in percentage terms, batteries add the most weight to trucks. The challenge of added weight must be evaluated in the context of legal and practical weight constraints on the vehicle. Of all these vehicle types, trucks are also the only one whose laden weight is usually designed to be close to the legal maximum. Therefore, every kg of battery subtracts one kg of payload. In conclusion, the decarbonization of trucks may be better served by use of hydrogen fuel cells.

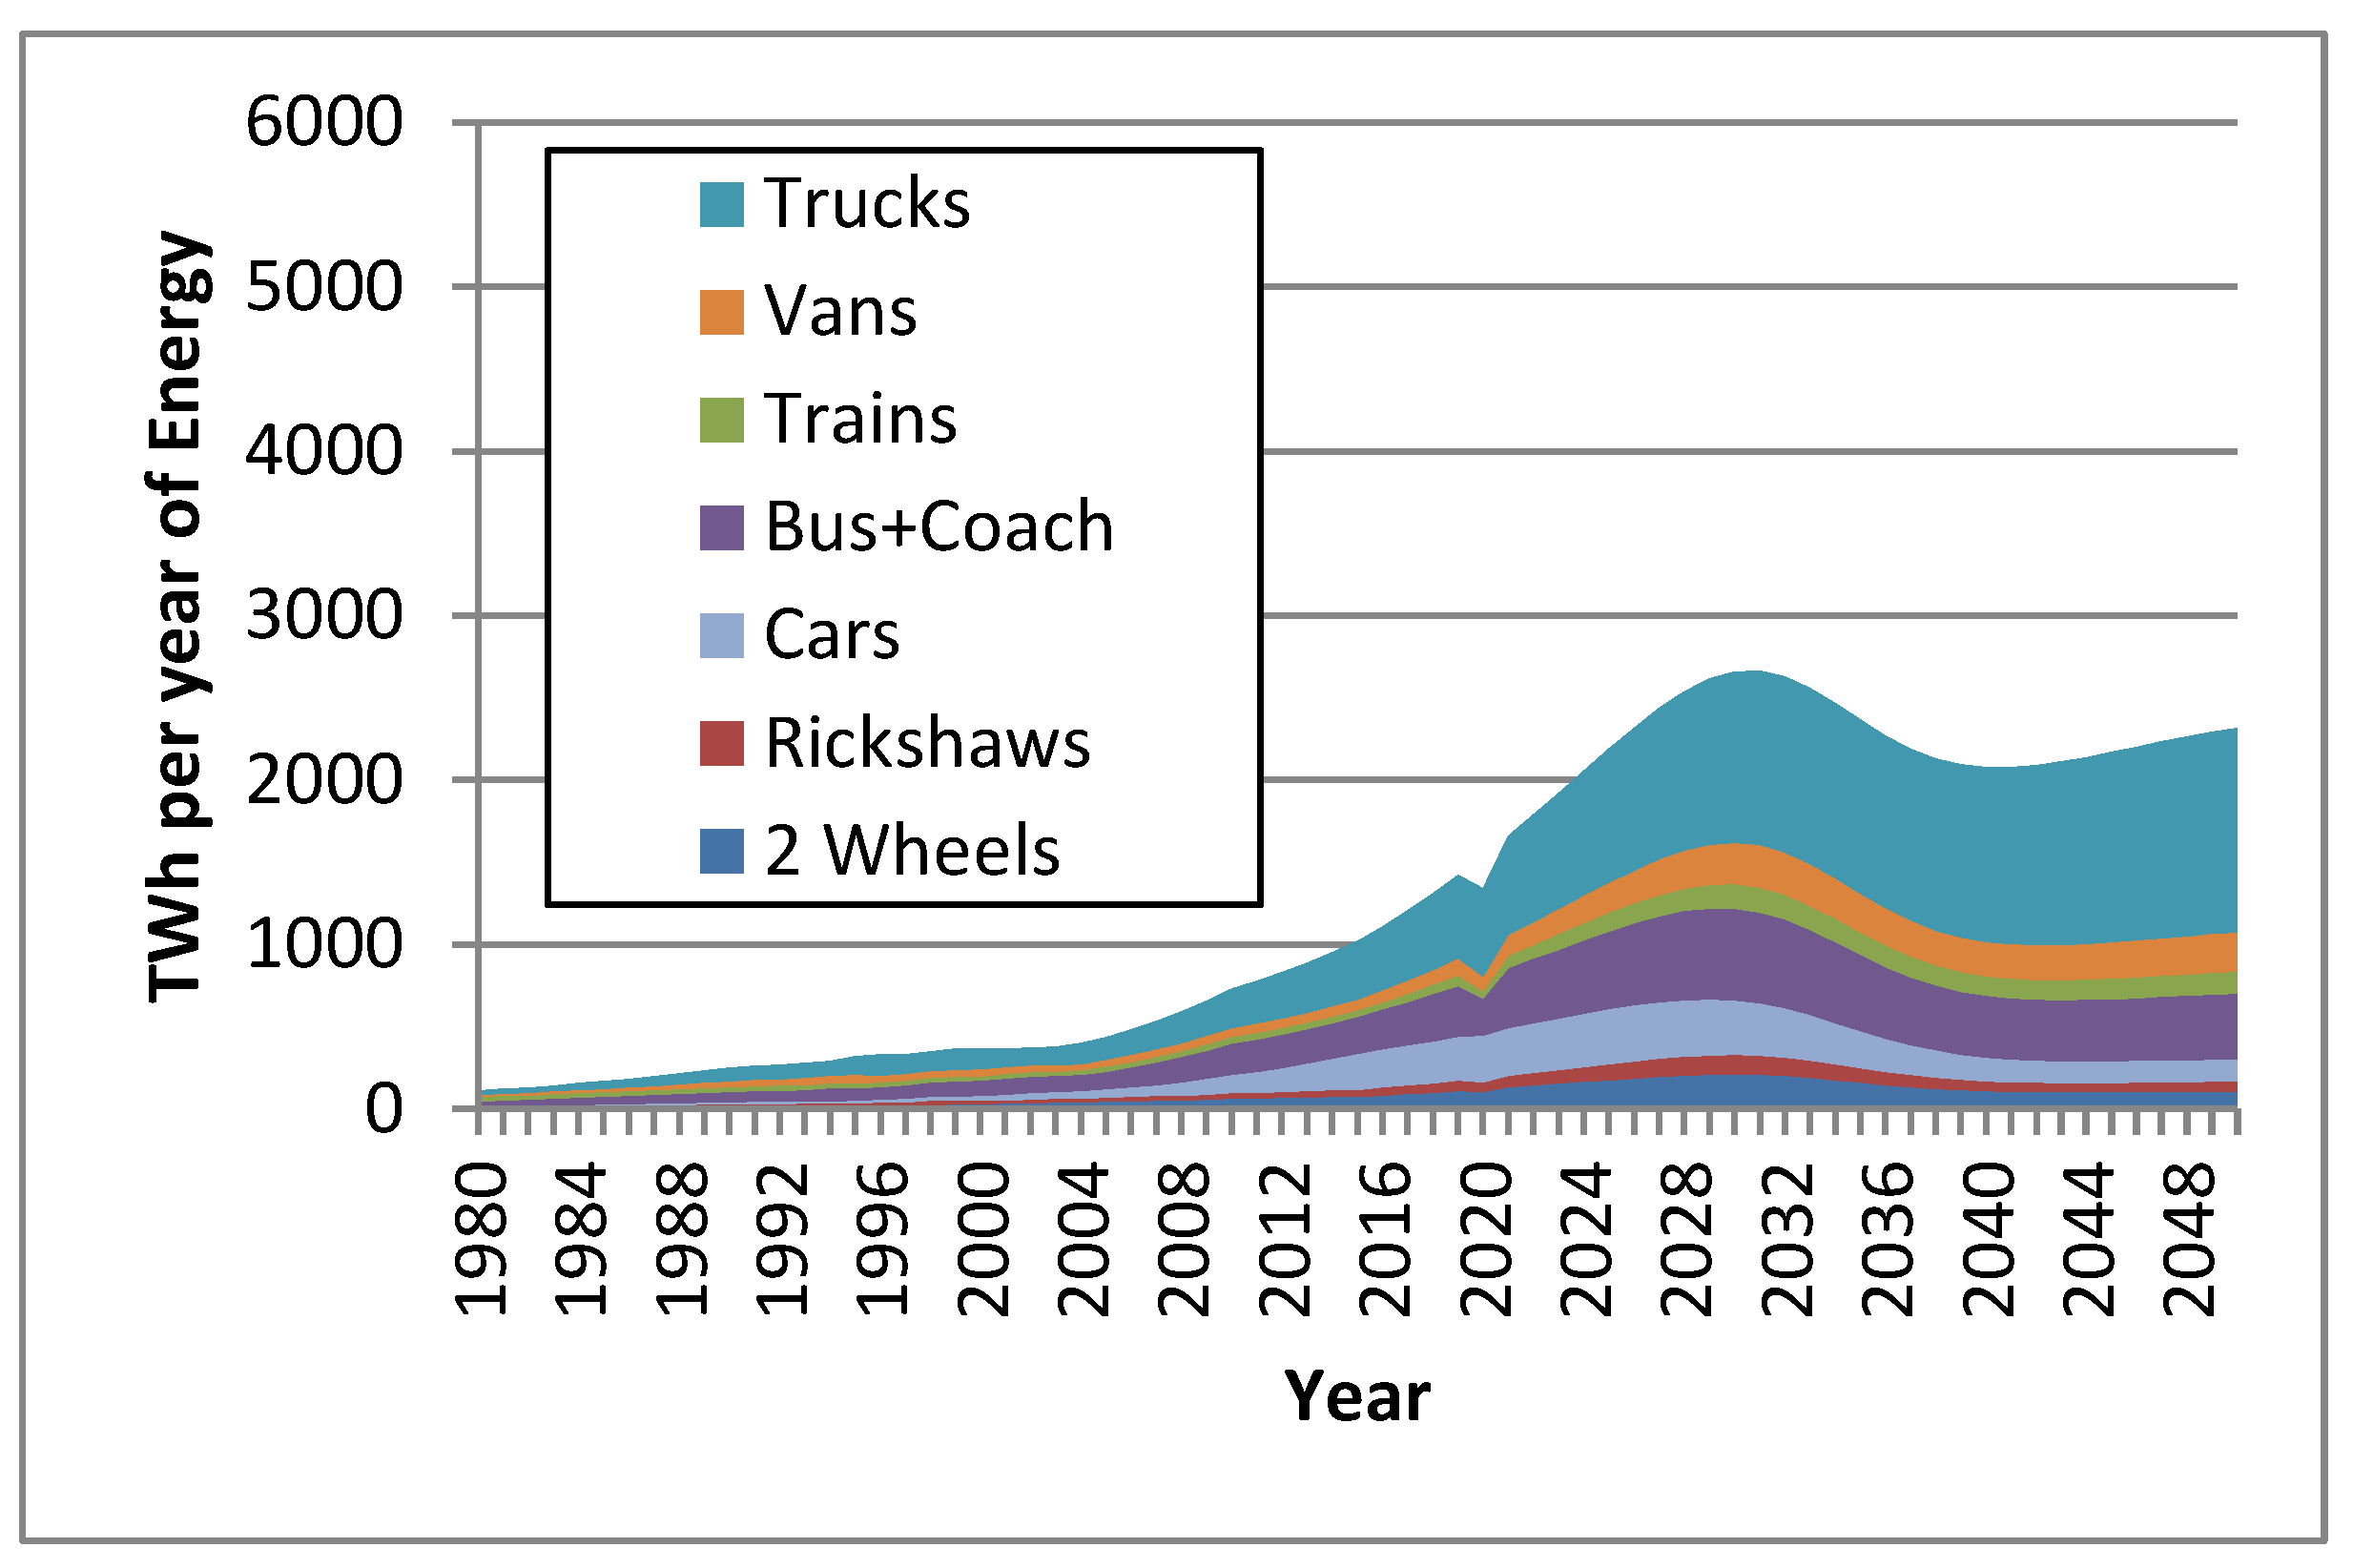
3.2. Growth in Demand for Transport and Transport Energy Demand Scenarios

The growth in transport energy demand was modeled as an S-shaped curve, initially growing at today’s year-on-year rate but attaining the same levels of demand per person by 2050 as the UK experienced in 2017; Figure 2 and Figure 3.
Figure 2 and Figure 3 show that transport demand has already grown by a factor of four between 2000 and 2020 (excepting the effect of the COVID-19 pandemic) and can be expected to grow by another factor of four or five by 2050 if Western levels of development are attained. Most of this growth is driven by economic growth, but some is also driven by population growth.
This growth in demand for transport services may lead to an even larger growth in transport energy use (Figure 4) if India were to adopt the same modes of transport as a Western nation, for example, the UK.
Indian passenger transport currently uses many two-wheelers, rickshaws, buses, and trains (column 1) and rail carries a greater proportion of freight than in the UK (column 2). If transport were to grow and shift modes to use as many private cars, vans, and trucks per capita as the UK in 2017 (columns 3 and 4), then the fuel used per person would grow by a factor of nine in the passenger sector and by a factor of five in the freight sectors. The use of cars constitutes almost all passenger transport energy in the UK. If, on the other hand, India grows its use of transport services to year 2050 while maintaining the same proportions of transport modes as in year 2004 (columns 5 and 6), then fuel used per person will grow only modestly. In the passenger transport sector, motorcycles, rickshaws, buses, coaches, and trains have substantially lower fuel use per passenger than cars, as recognized by India’s transport electrification policies [19]. In the freight sector, the greater use of rail transport reduces fuel use, as recognized by the Government of India [55]. Finally, a transition to electricity and hydrogen while maintaining the same modal shares of transport as in 2004 (columns 7 and 8) results in a substantial reduction in transport energy use compared to fossil fueled transport. The passenger transport sector (column 7) shows a very substantial reduction in energy use because all modes are modeled as using BEVs. The freight sector (column 8) shows a more modest reduction due to the more modest efficiency improvement of hydrogen in FCV trucks compared to diesel engines.
For comparison, the India Energy Security Scenarios Model [17] does allow users to model an even greater reduction in fuel use but the modal disaggregation of transport use is not clear and the majority of transport energy is still supplied by liquid fuels, even in the most ‘heroic’ level of effort to change. A more recent publication, [37], explores several scenarios to limit the growth in transport energy use and emissions through a modal shift to public transport and a transition to zero emission vehicles, but none of the scenarios achieve zero emissions. The scenarios presented in this paper do achieve zero carbon emissions by using a 100% renewable energy supply [48] but require a substantial increase in renewable energy supply to match the electricity used in BEV charging and in electrolysis to make hydrogen for FCVs.
Transport policy in the UK has been largely market driven and resulted in the dominance of cars for passenger transport and vans and trucks for freight. If India is to avoid going down the same route as it develops economically, then substantial policy measures will be required to discourage car use and to promote the use of smaller personal vehicles and public transport. Similarly, deliberate policy measures will be required to maintain or increase the use of rail freight, as the Indian government is already considering [55].

3.3. Transition to Low-Carbon Transport Technologies

The growth of future transport energy use in India was calculated without and with the transition to BEVs and FCVs (Figure 5 and Figure 6) but moving back to the same modal shares of transport technologies as in 2004. Thus, the year 2050 of Figure 5 corresponds to columns 5 and 6 of Figure 4; year 2050 in Figure 6 corresponds to columns 7 and 8 of Figure 4.
Figure 6 shows a logistic curve of growth in demand for both passenger and freight transport from 2015 to 2050. Year 2020 is recognized as having exceptionally low demand due to the COVID-19 pandemic, below the trend line, but the data displayed uses estimated data for that year [37]. Figure 7 shows the same logistic curve growth in demand but with a superimposed logistic transition from fossil fuels to BEVs and FCVs.
Expert views on the projected growth rate of BEVs in the 2020s range from 26% per annum [56], through 36% [28] to 44% [41]. The upper end of this range, 44% initial compound growth rate, is necessary in order to achieve India’s stated ambition of all new vehicles having zero emissions by 2032 [56,57]. The use of fossil fuels for transport then peaks in year 2029. However, legacy fossil fueled vehicles will remain on the road for a considerable time after 2032, [42,58] leading to a 20-year decline, Figure 7. It may be necessary to ban the few remaining fossil-fueled vehicles from the road at that point to achieve zero emissions by 2050.

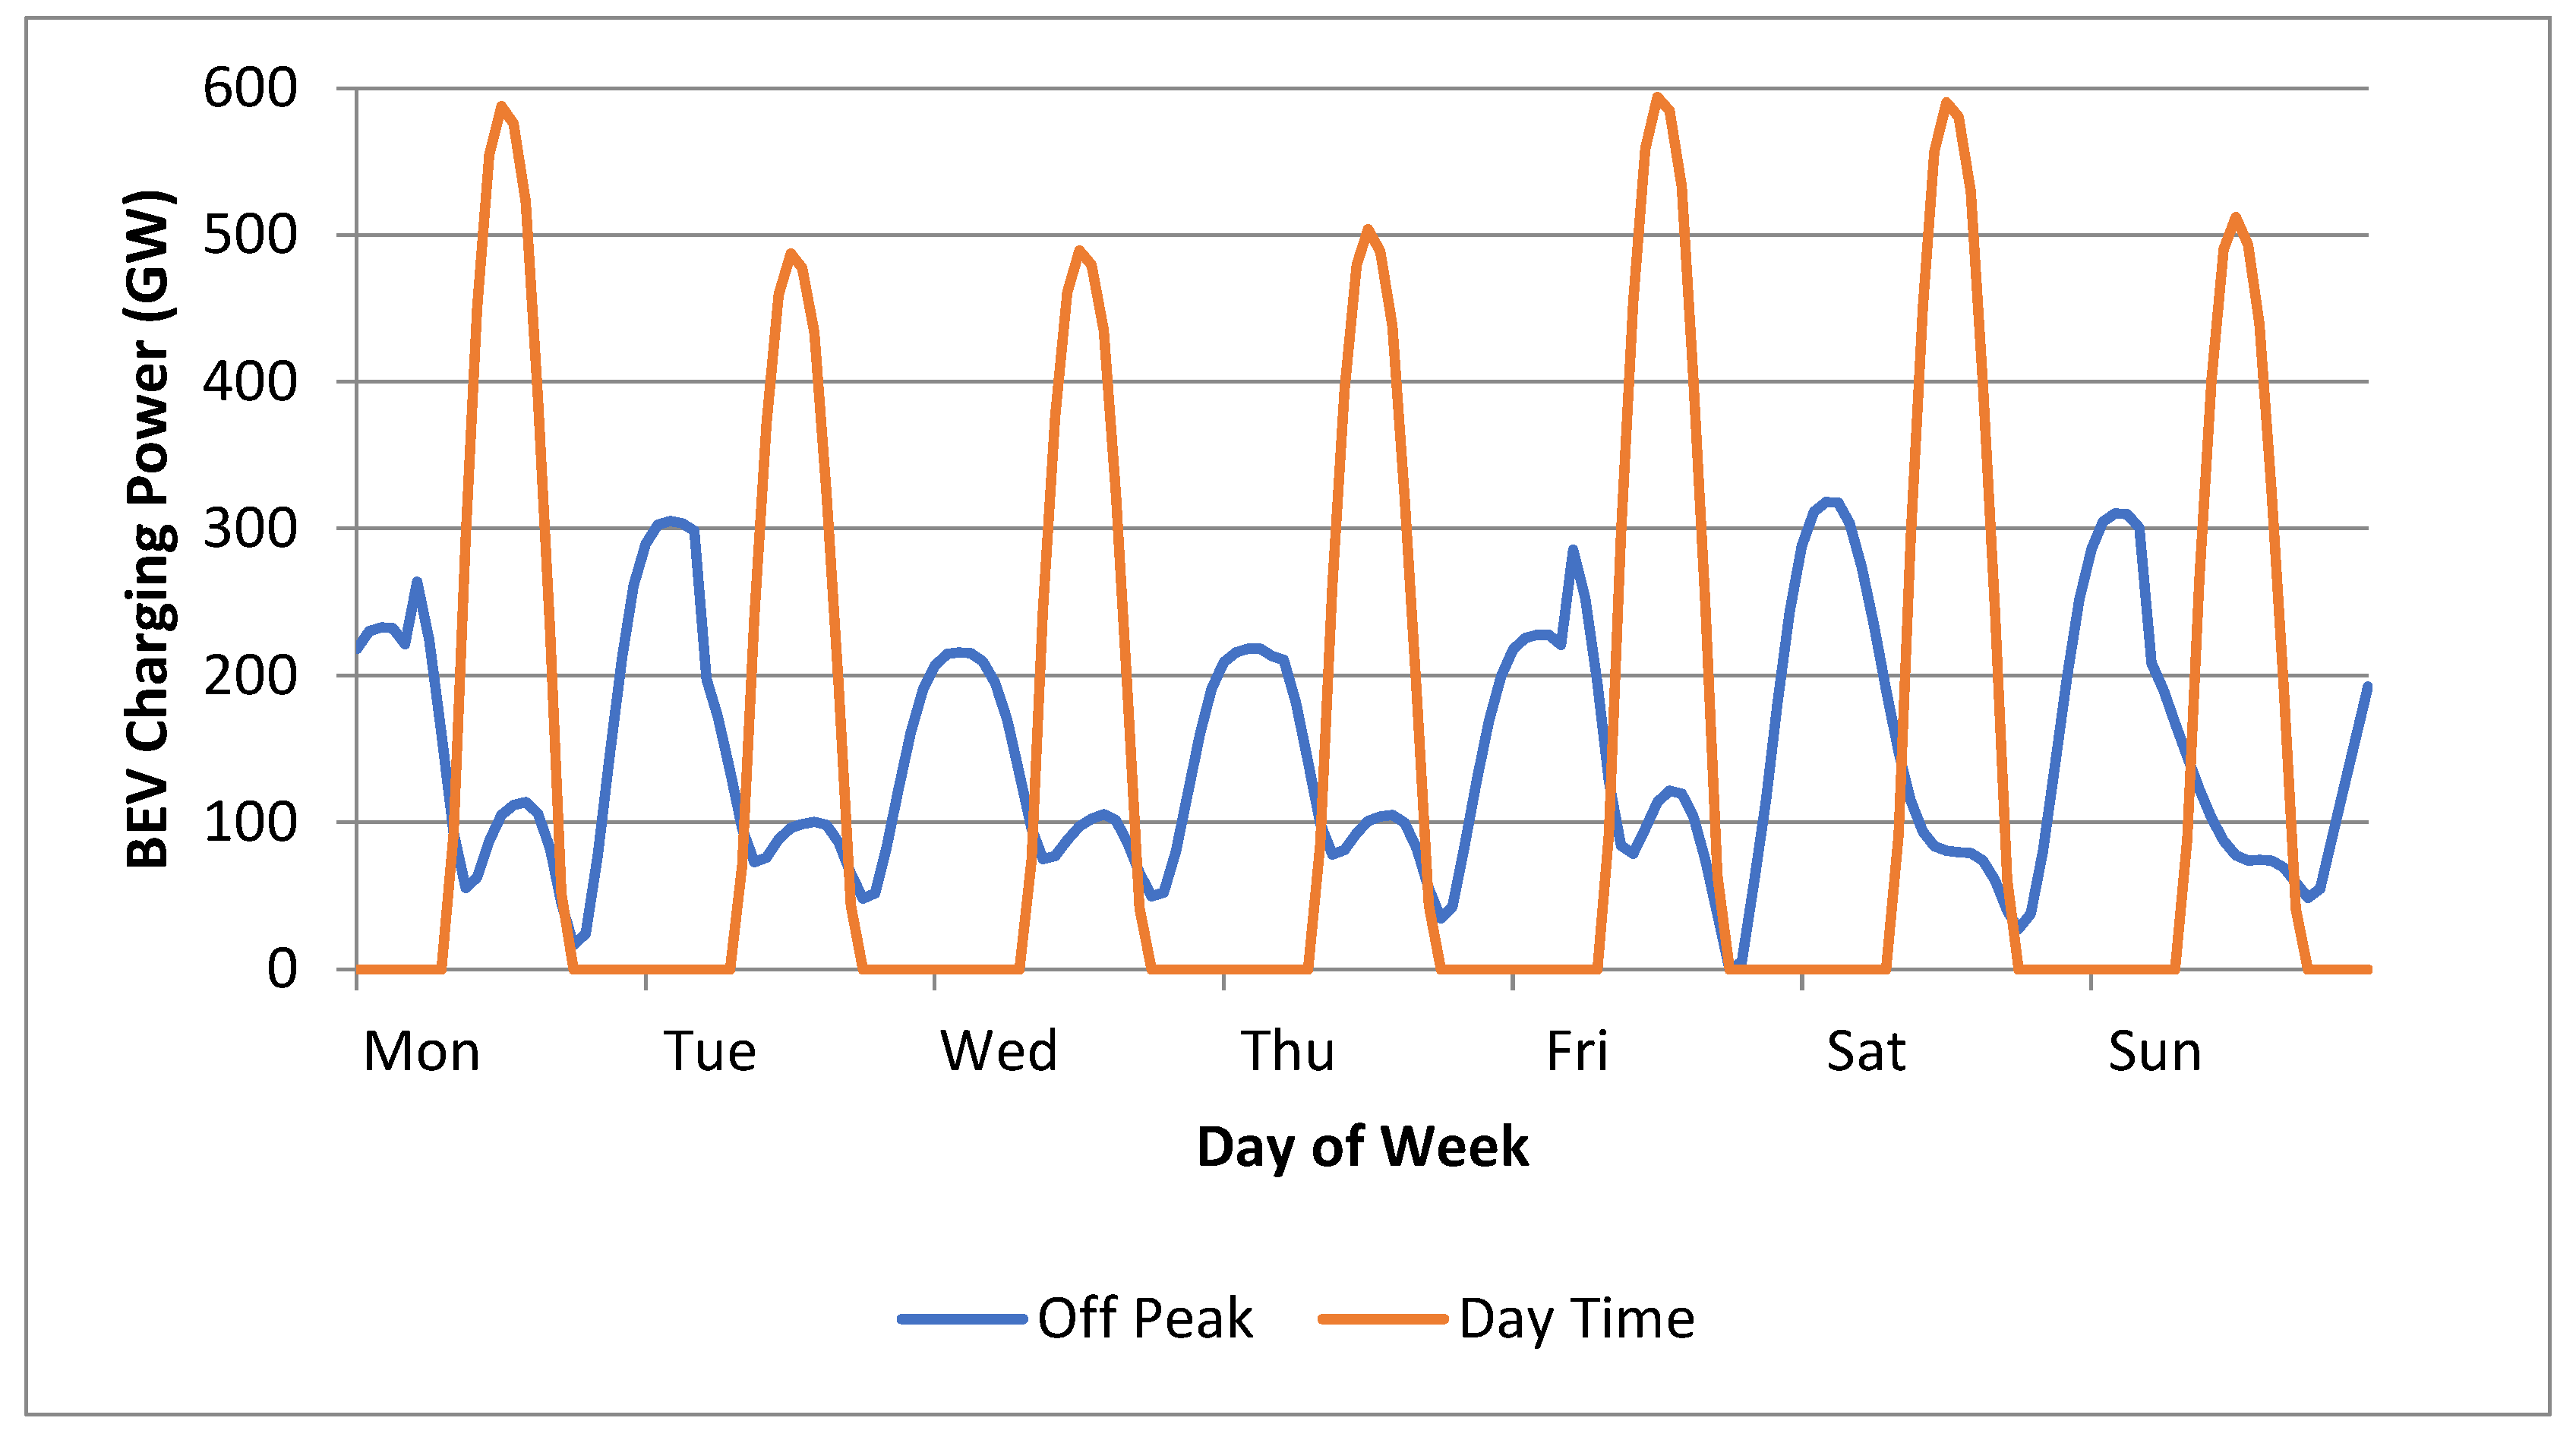
3.4. Time of Use of Pasenger Vehicles

The results of the Google Popular Times study show a remarkably similar pattern across modes of public transport; Figure 8. There appears to be more demand for long-distance trains in the evening and on weekends and more demand for metro systems on weekday mornings, especially on a Monday, but these differences are relatively small.
The location within a town or city also has a small effect. Not surprisingly, people tend to wait at edge-of-town locations in the morning for transport into city centers and tend to wait in town center locations in the early evening for transport out of city centers, Figure 9. Small towns and rural locations tend to be busier on weekend evenings, as do city centers.
For the purposes of the transport model, all locations were averaged together and used as a proxy for general level of demand for transport services; Figure 10.
Although the data represents use of public transport only, the patterns of road use are similar enough for cars, vans and trucks in the UK [59], with a difference that there are fewer trucks on the road on weekends. Data for general road use and congestion in Indian cities shows similar patterns [60]. Indian truck drivers may work longer hours than UK drivers but nevertheless tend to stop during the middle of the night [61].

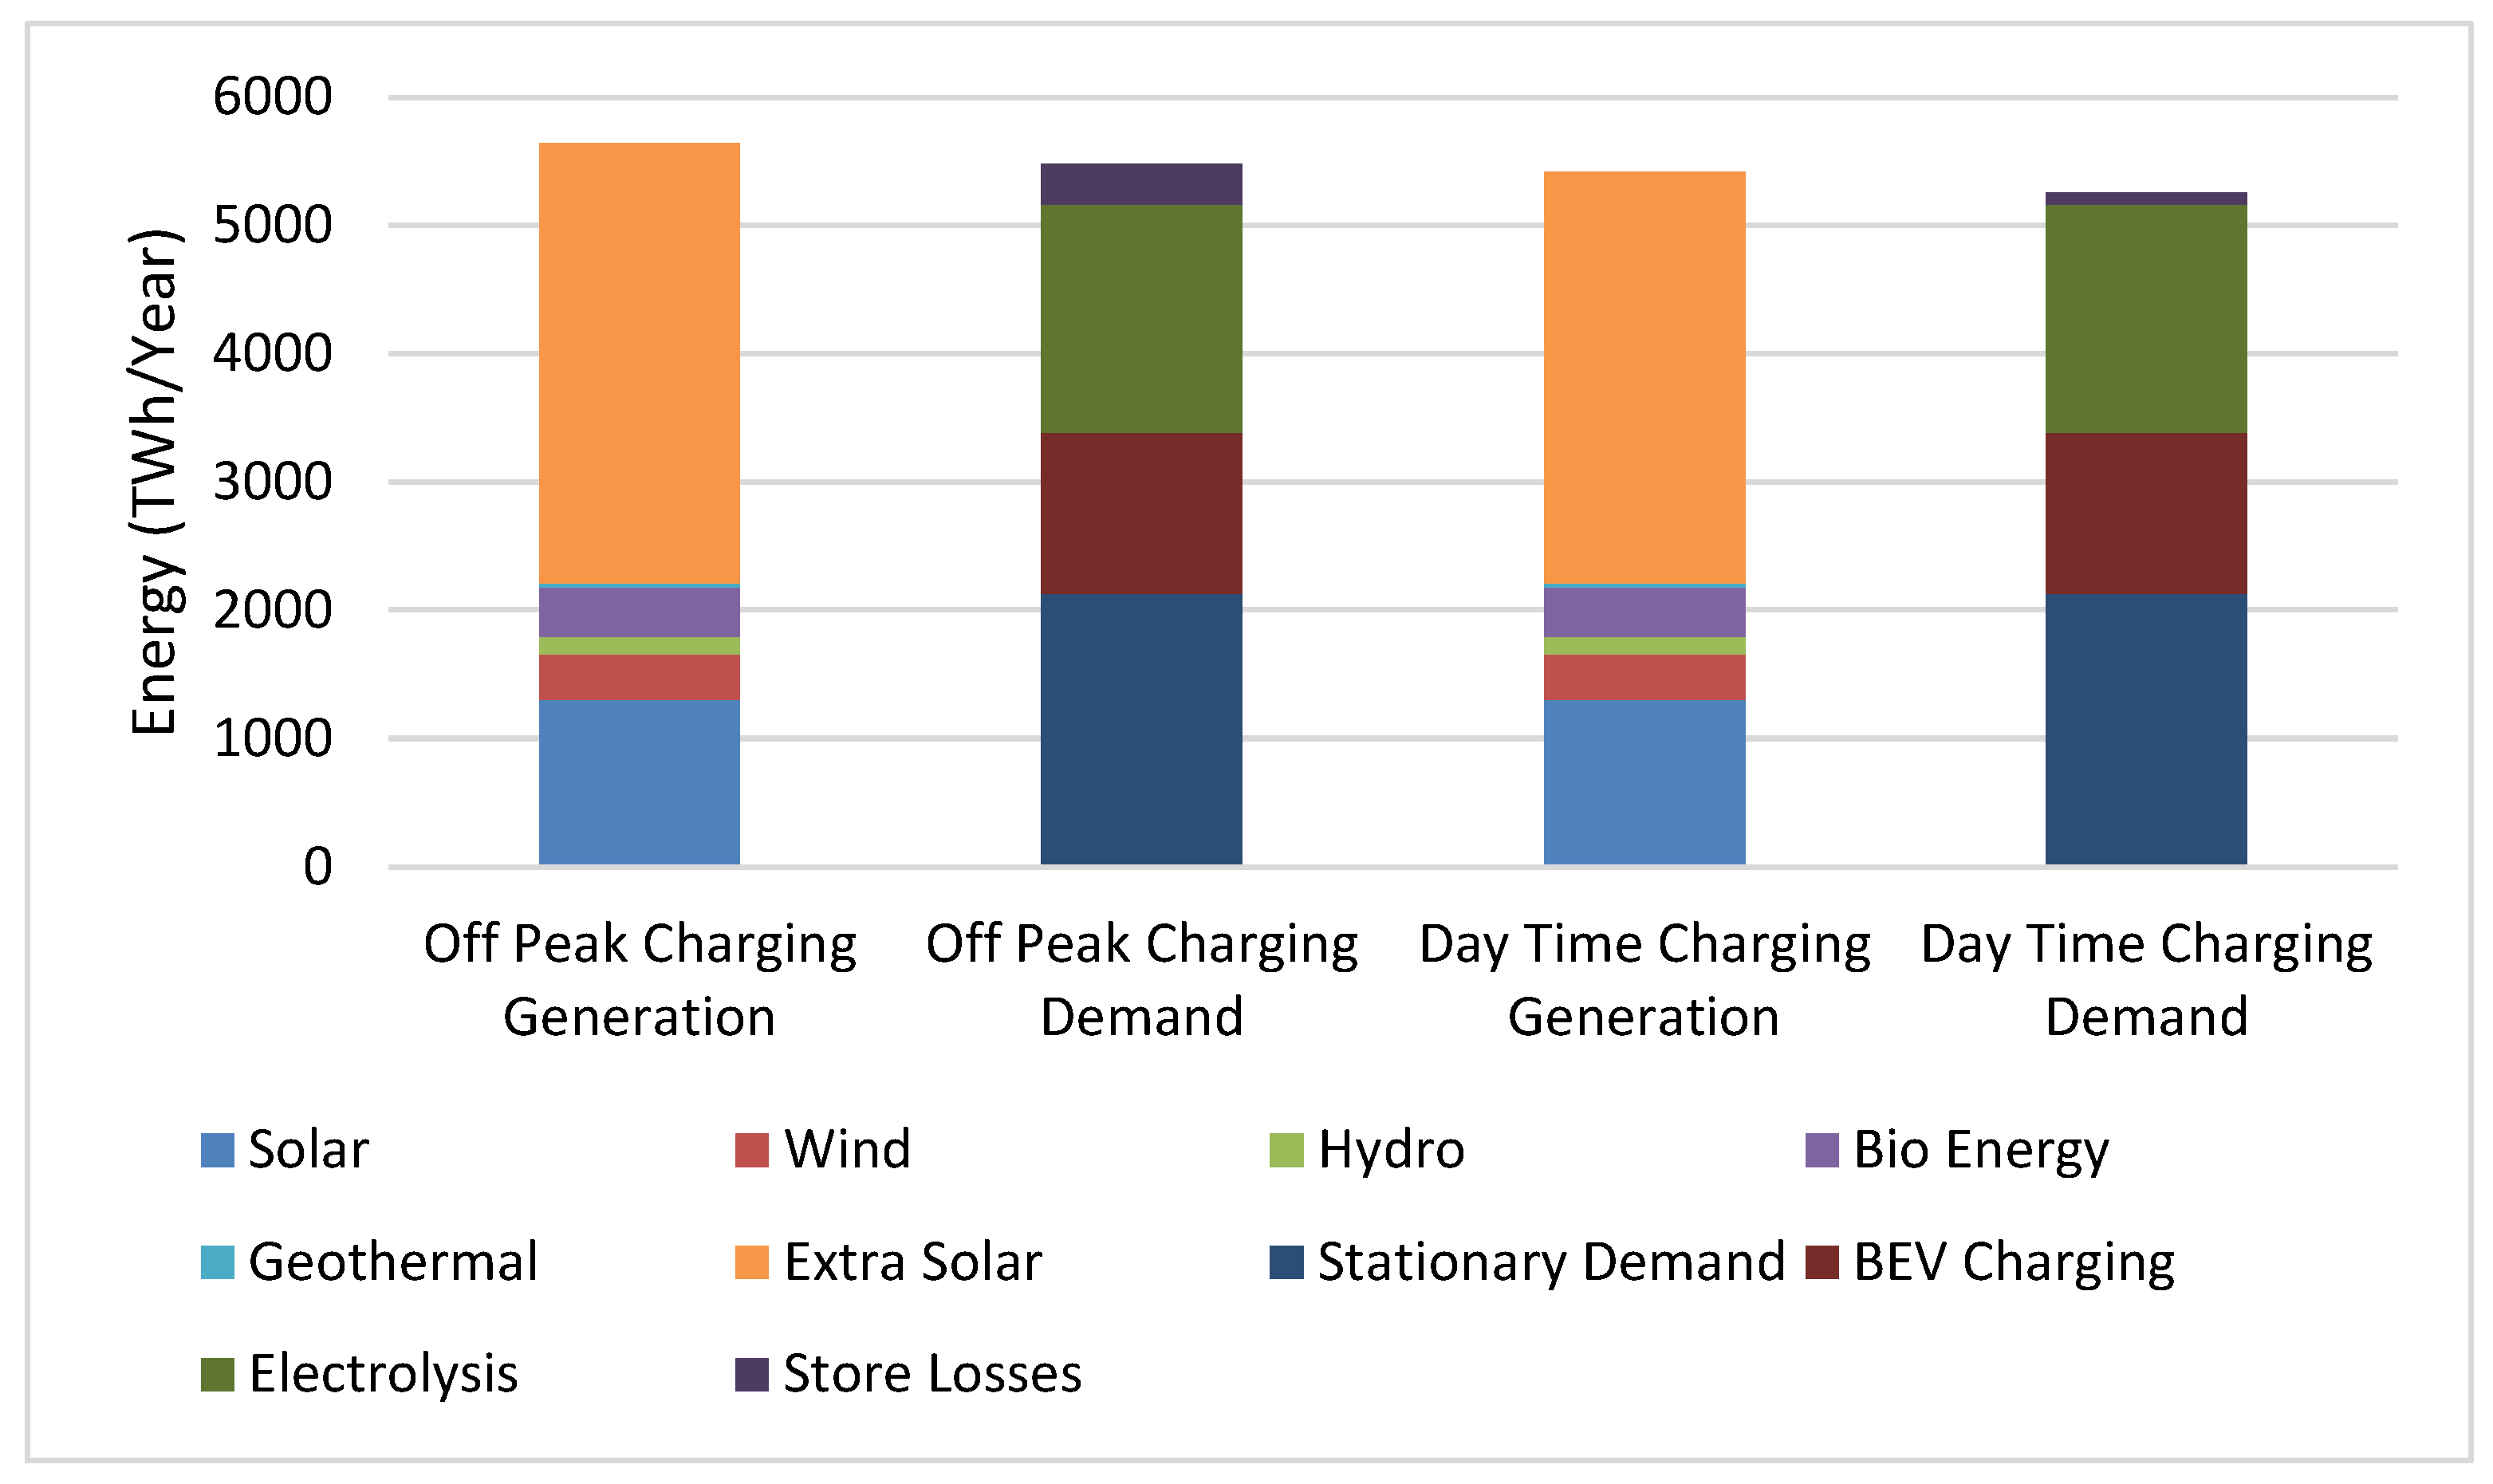
3.5. Renewable Energy Scenarios for India including Transport Energy

Electricity for BEVs and the production of hydrogen for FCVs will add substantial demand for electricity. Even if the more efficient forms of transport are used, the electrical energy required for transport will exceed that for stationary energy demand [50]. Fixed-tilt solar PV has abundant and ubiquitous resource availability and has been chosen to supply all the additional electricity in scenarios using 100% renewable electricity; Figure 11. Two slightly different scenarios were created using the two BEV charging strategies.
The time of day of BEV charging makes only a very modest difference to the total energy required. Off-peak charging requires most of its electricity overnight and therefore greater use of stationary energy storage. This results in greater store losses but the additional energy is not very significant in the scale of total energy used. The assumed round-trip efficiency of stationary storage was 80%, typical of vanadium redox batteries and pumped hydro [62], and is lower than the value used in the original 100% renewable electricity scenario [48].

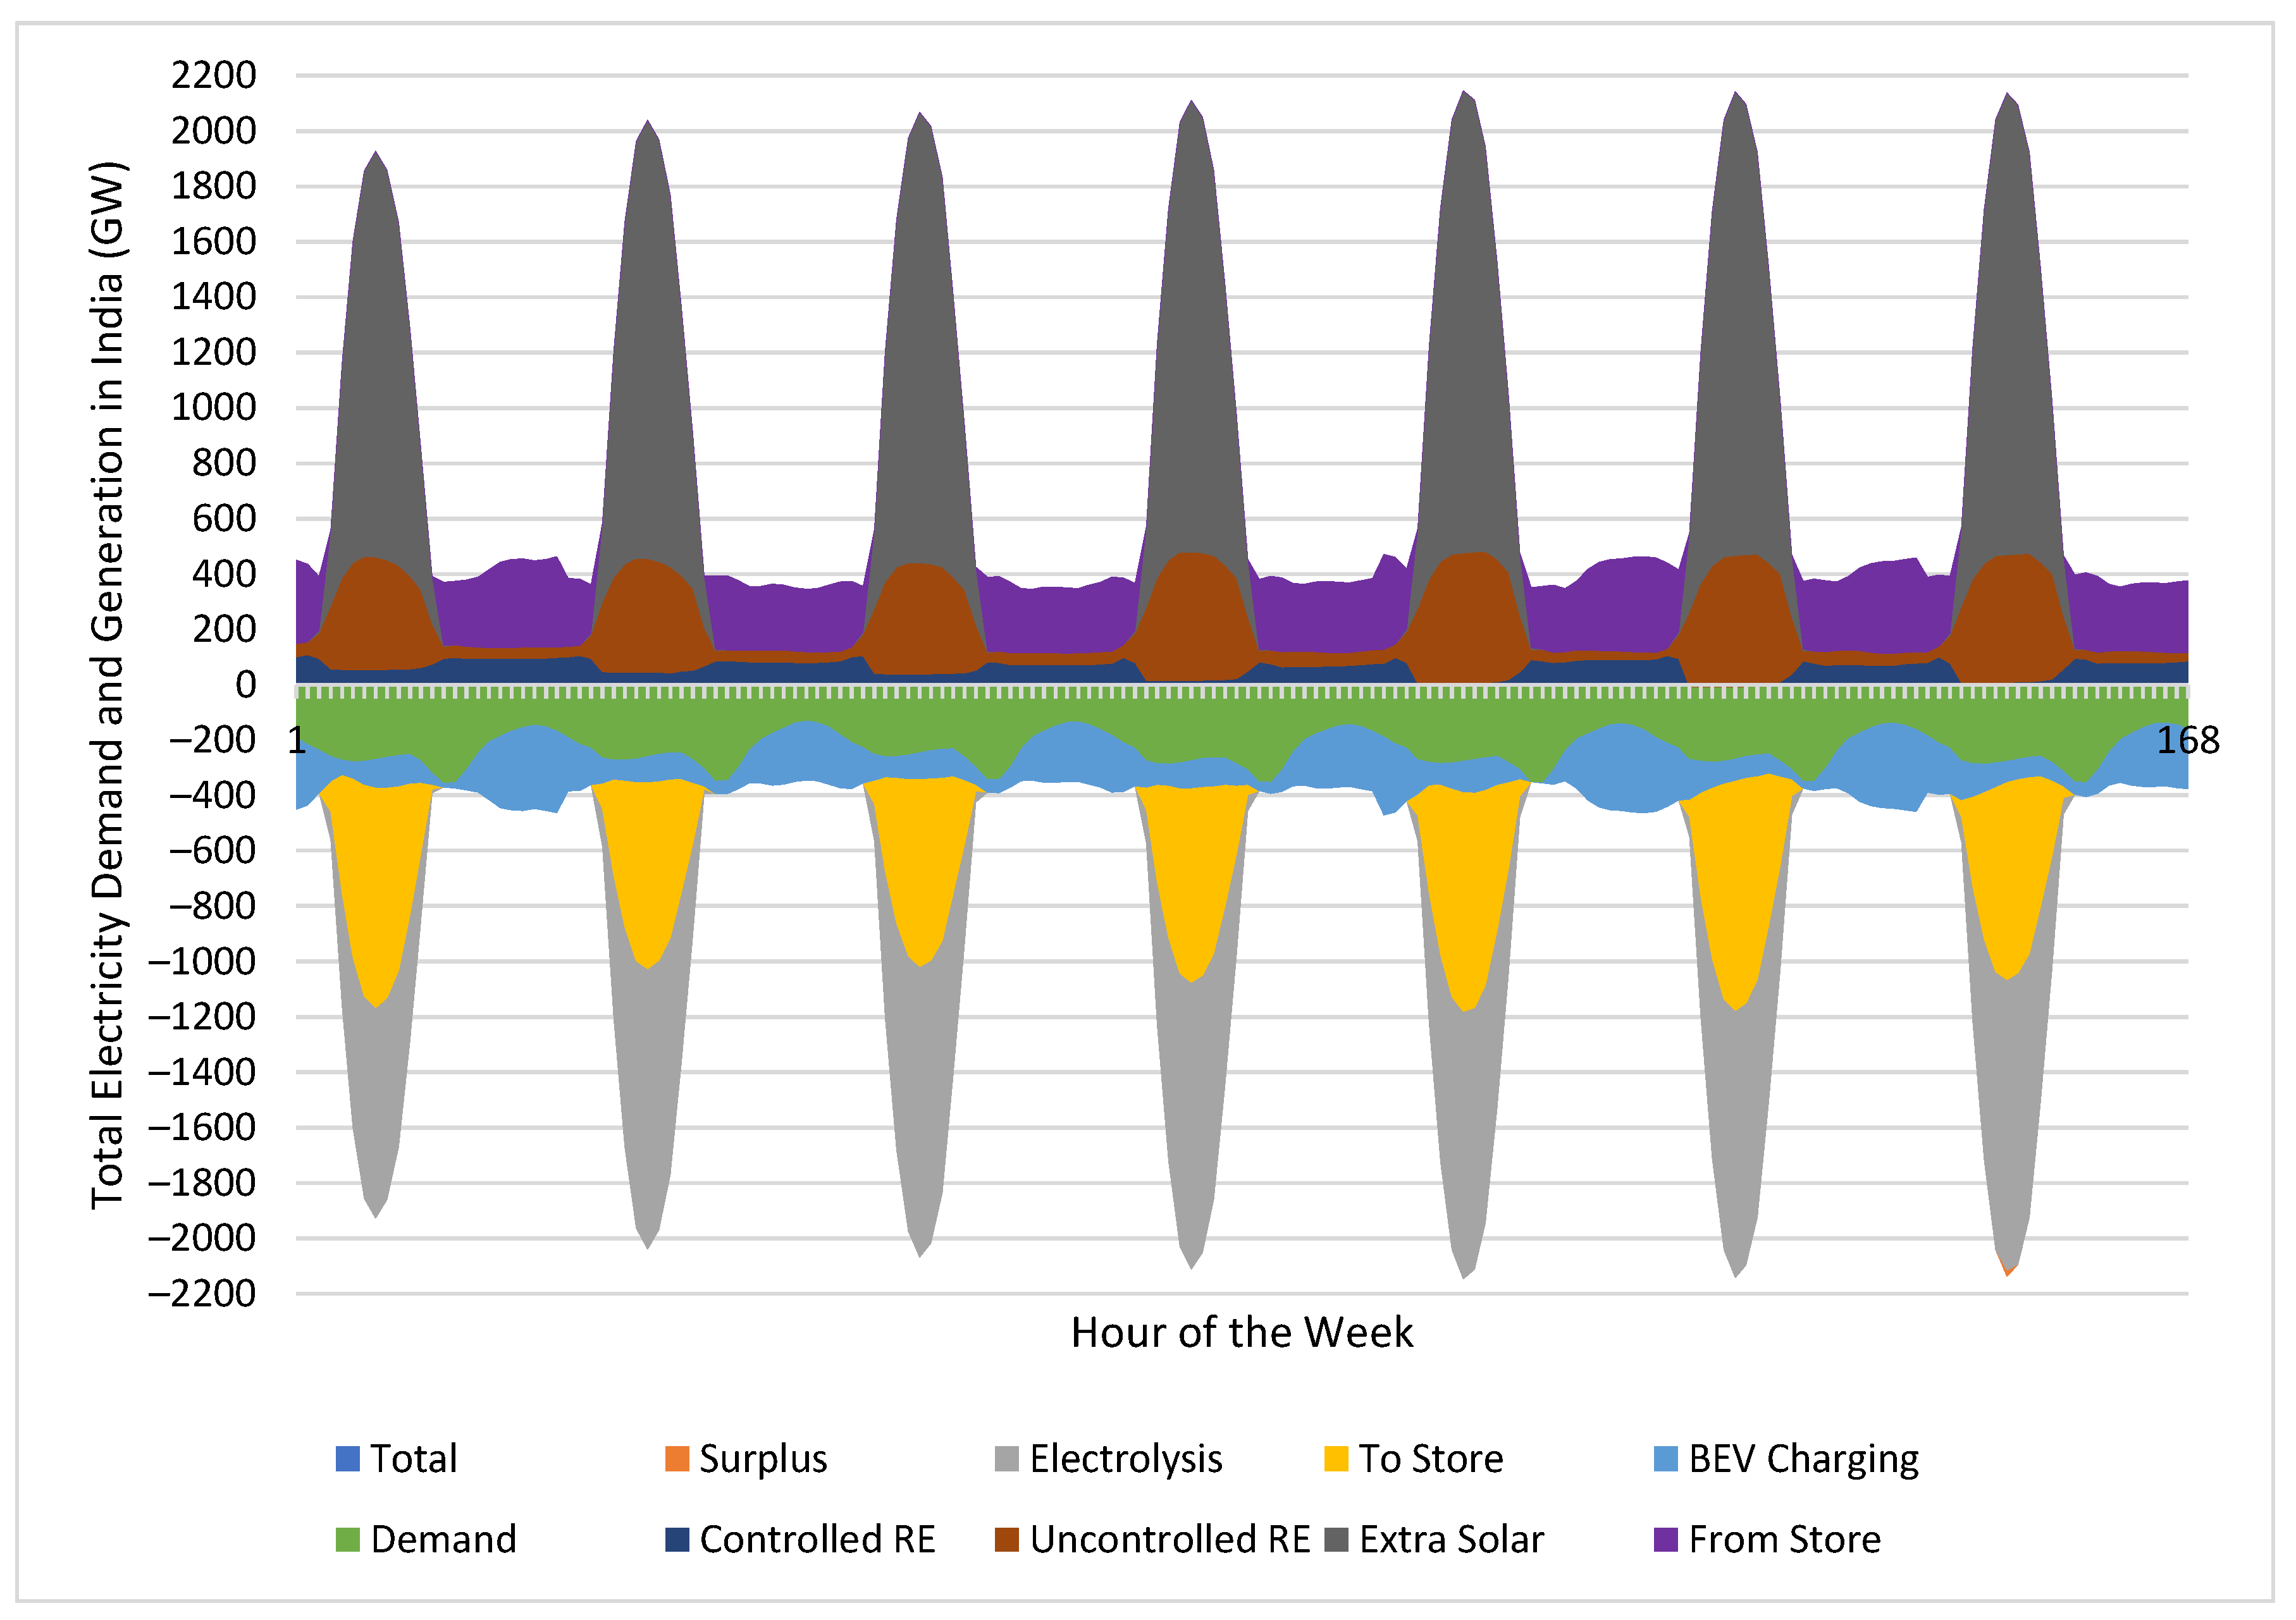
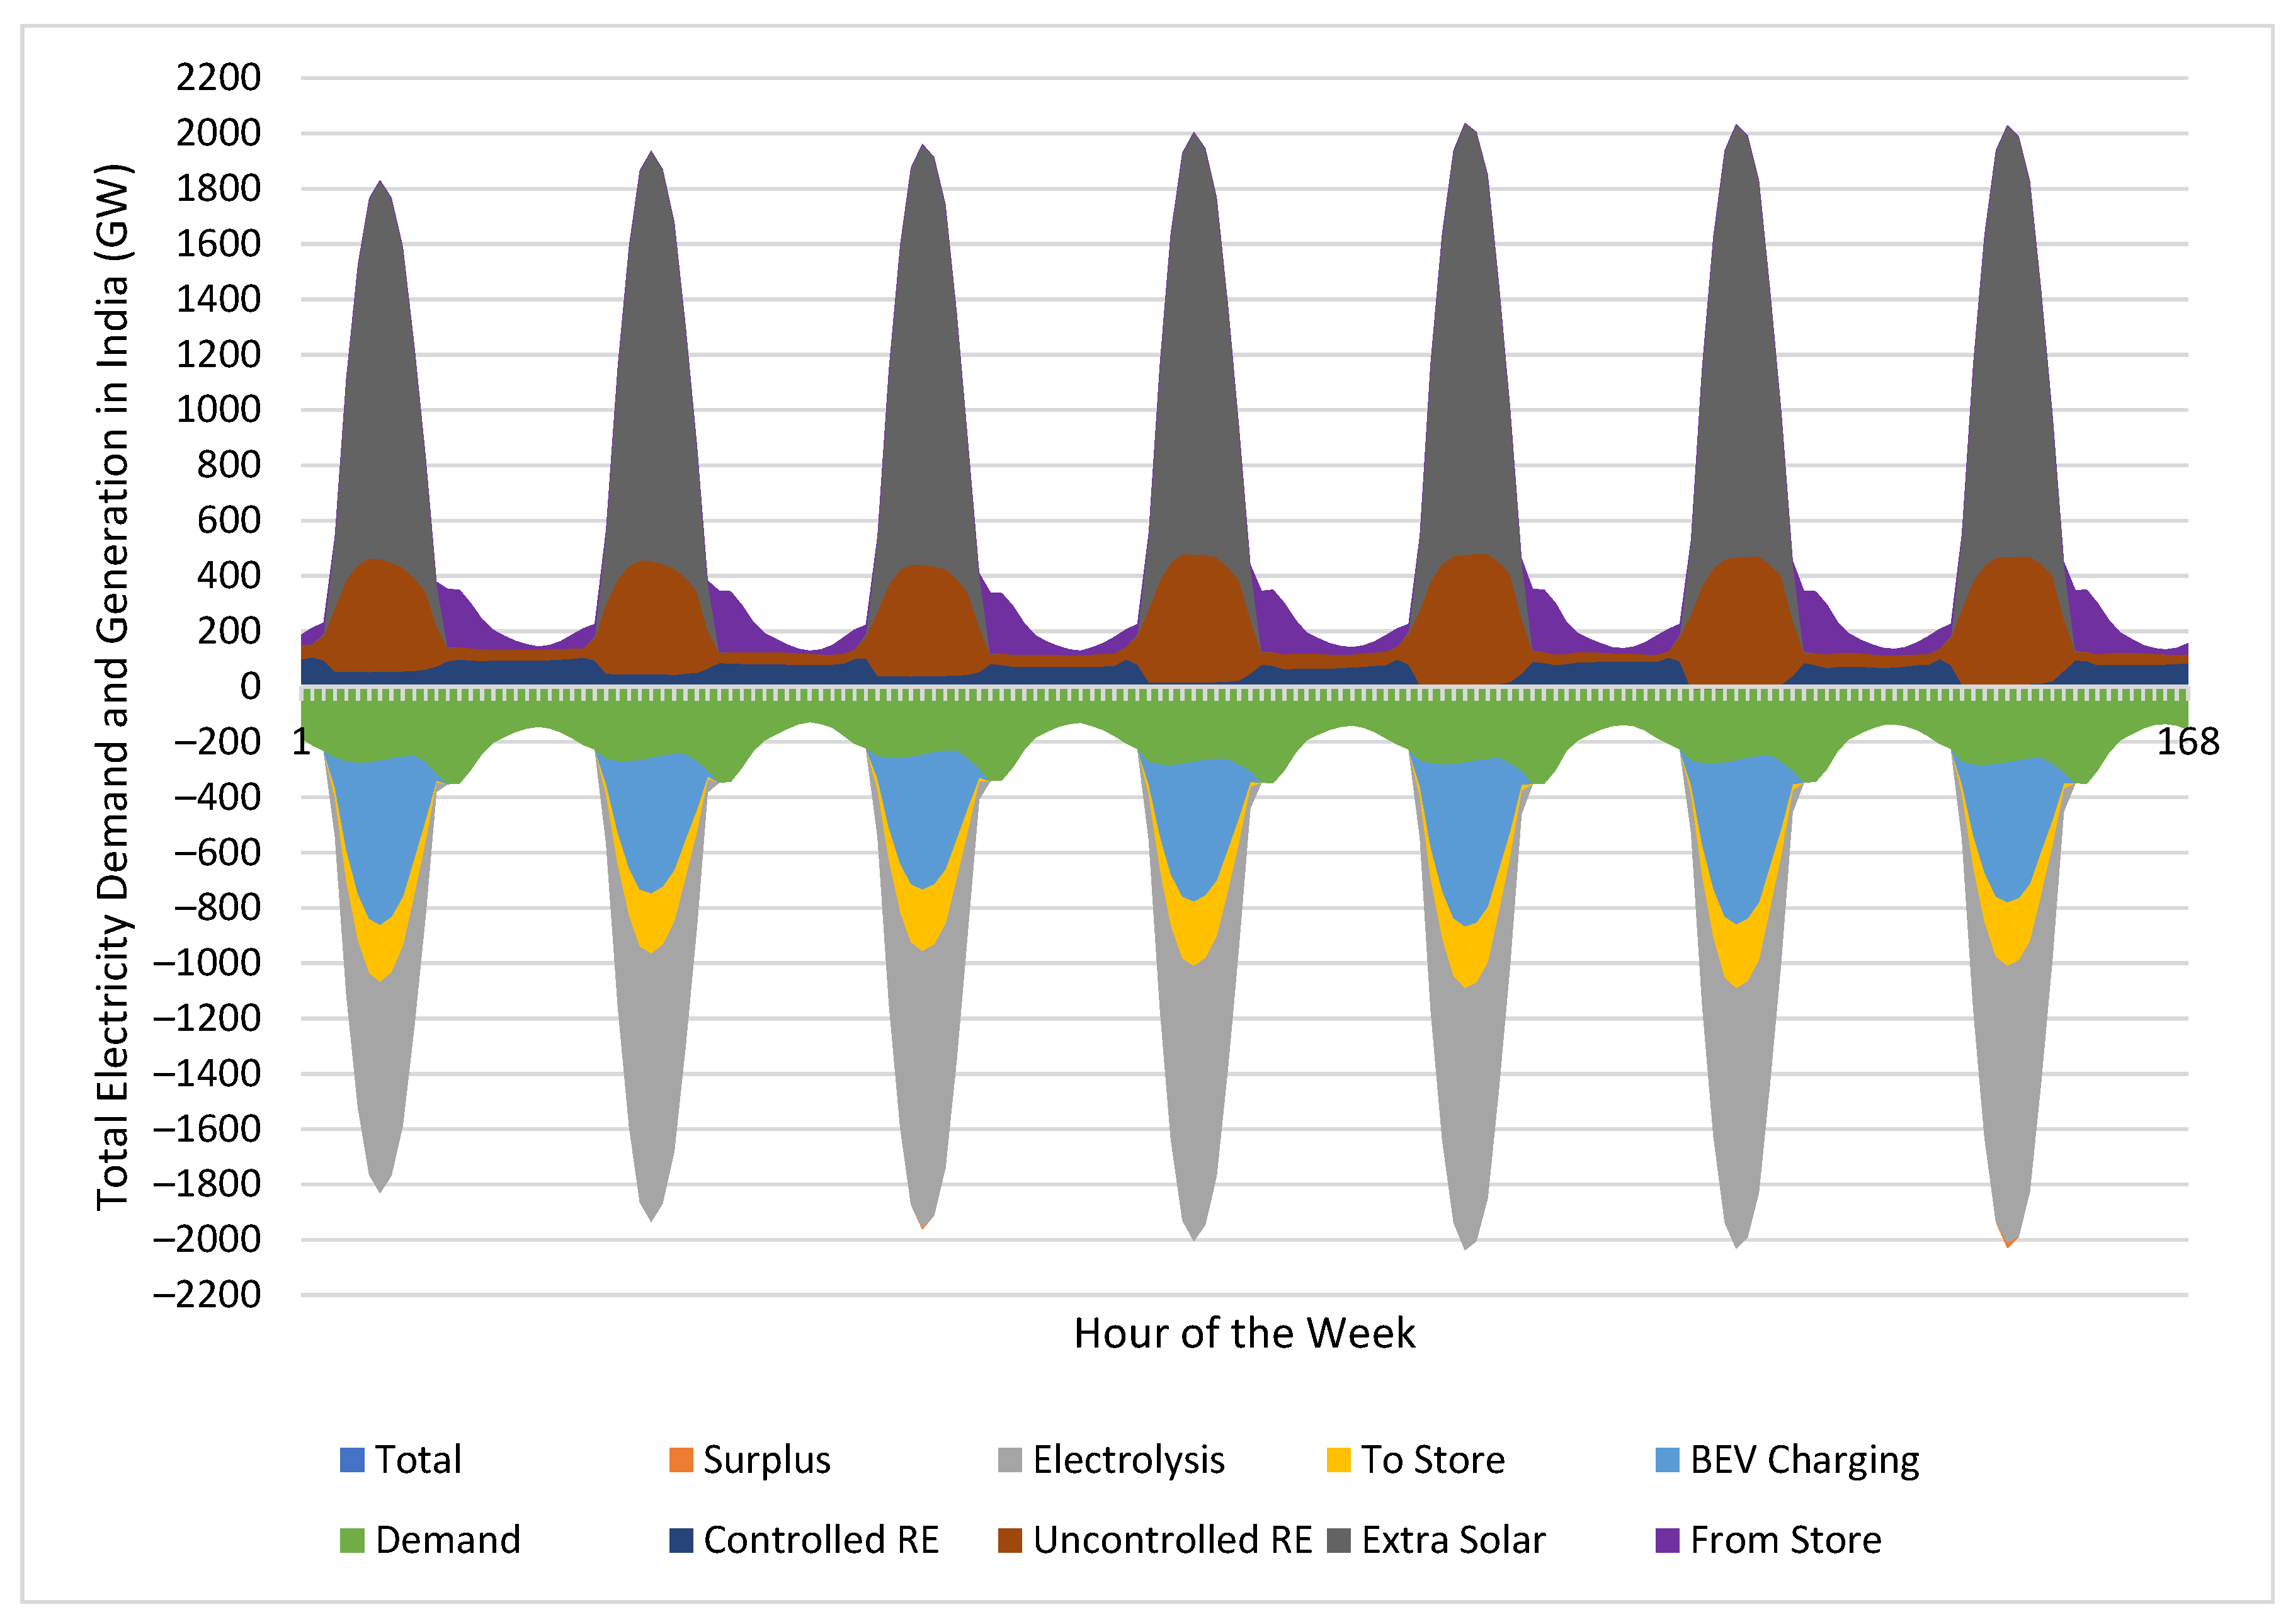
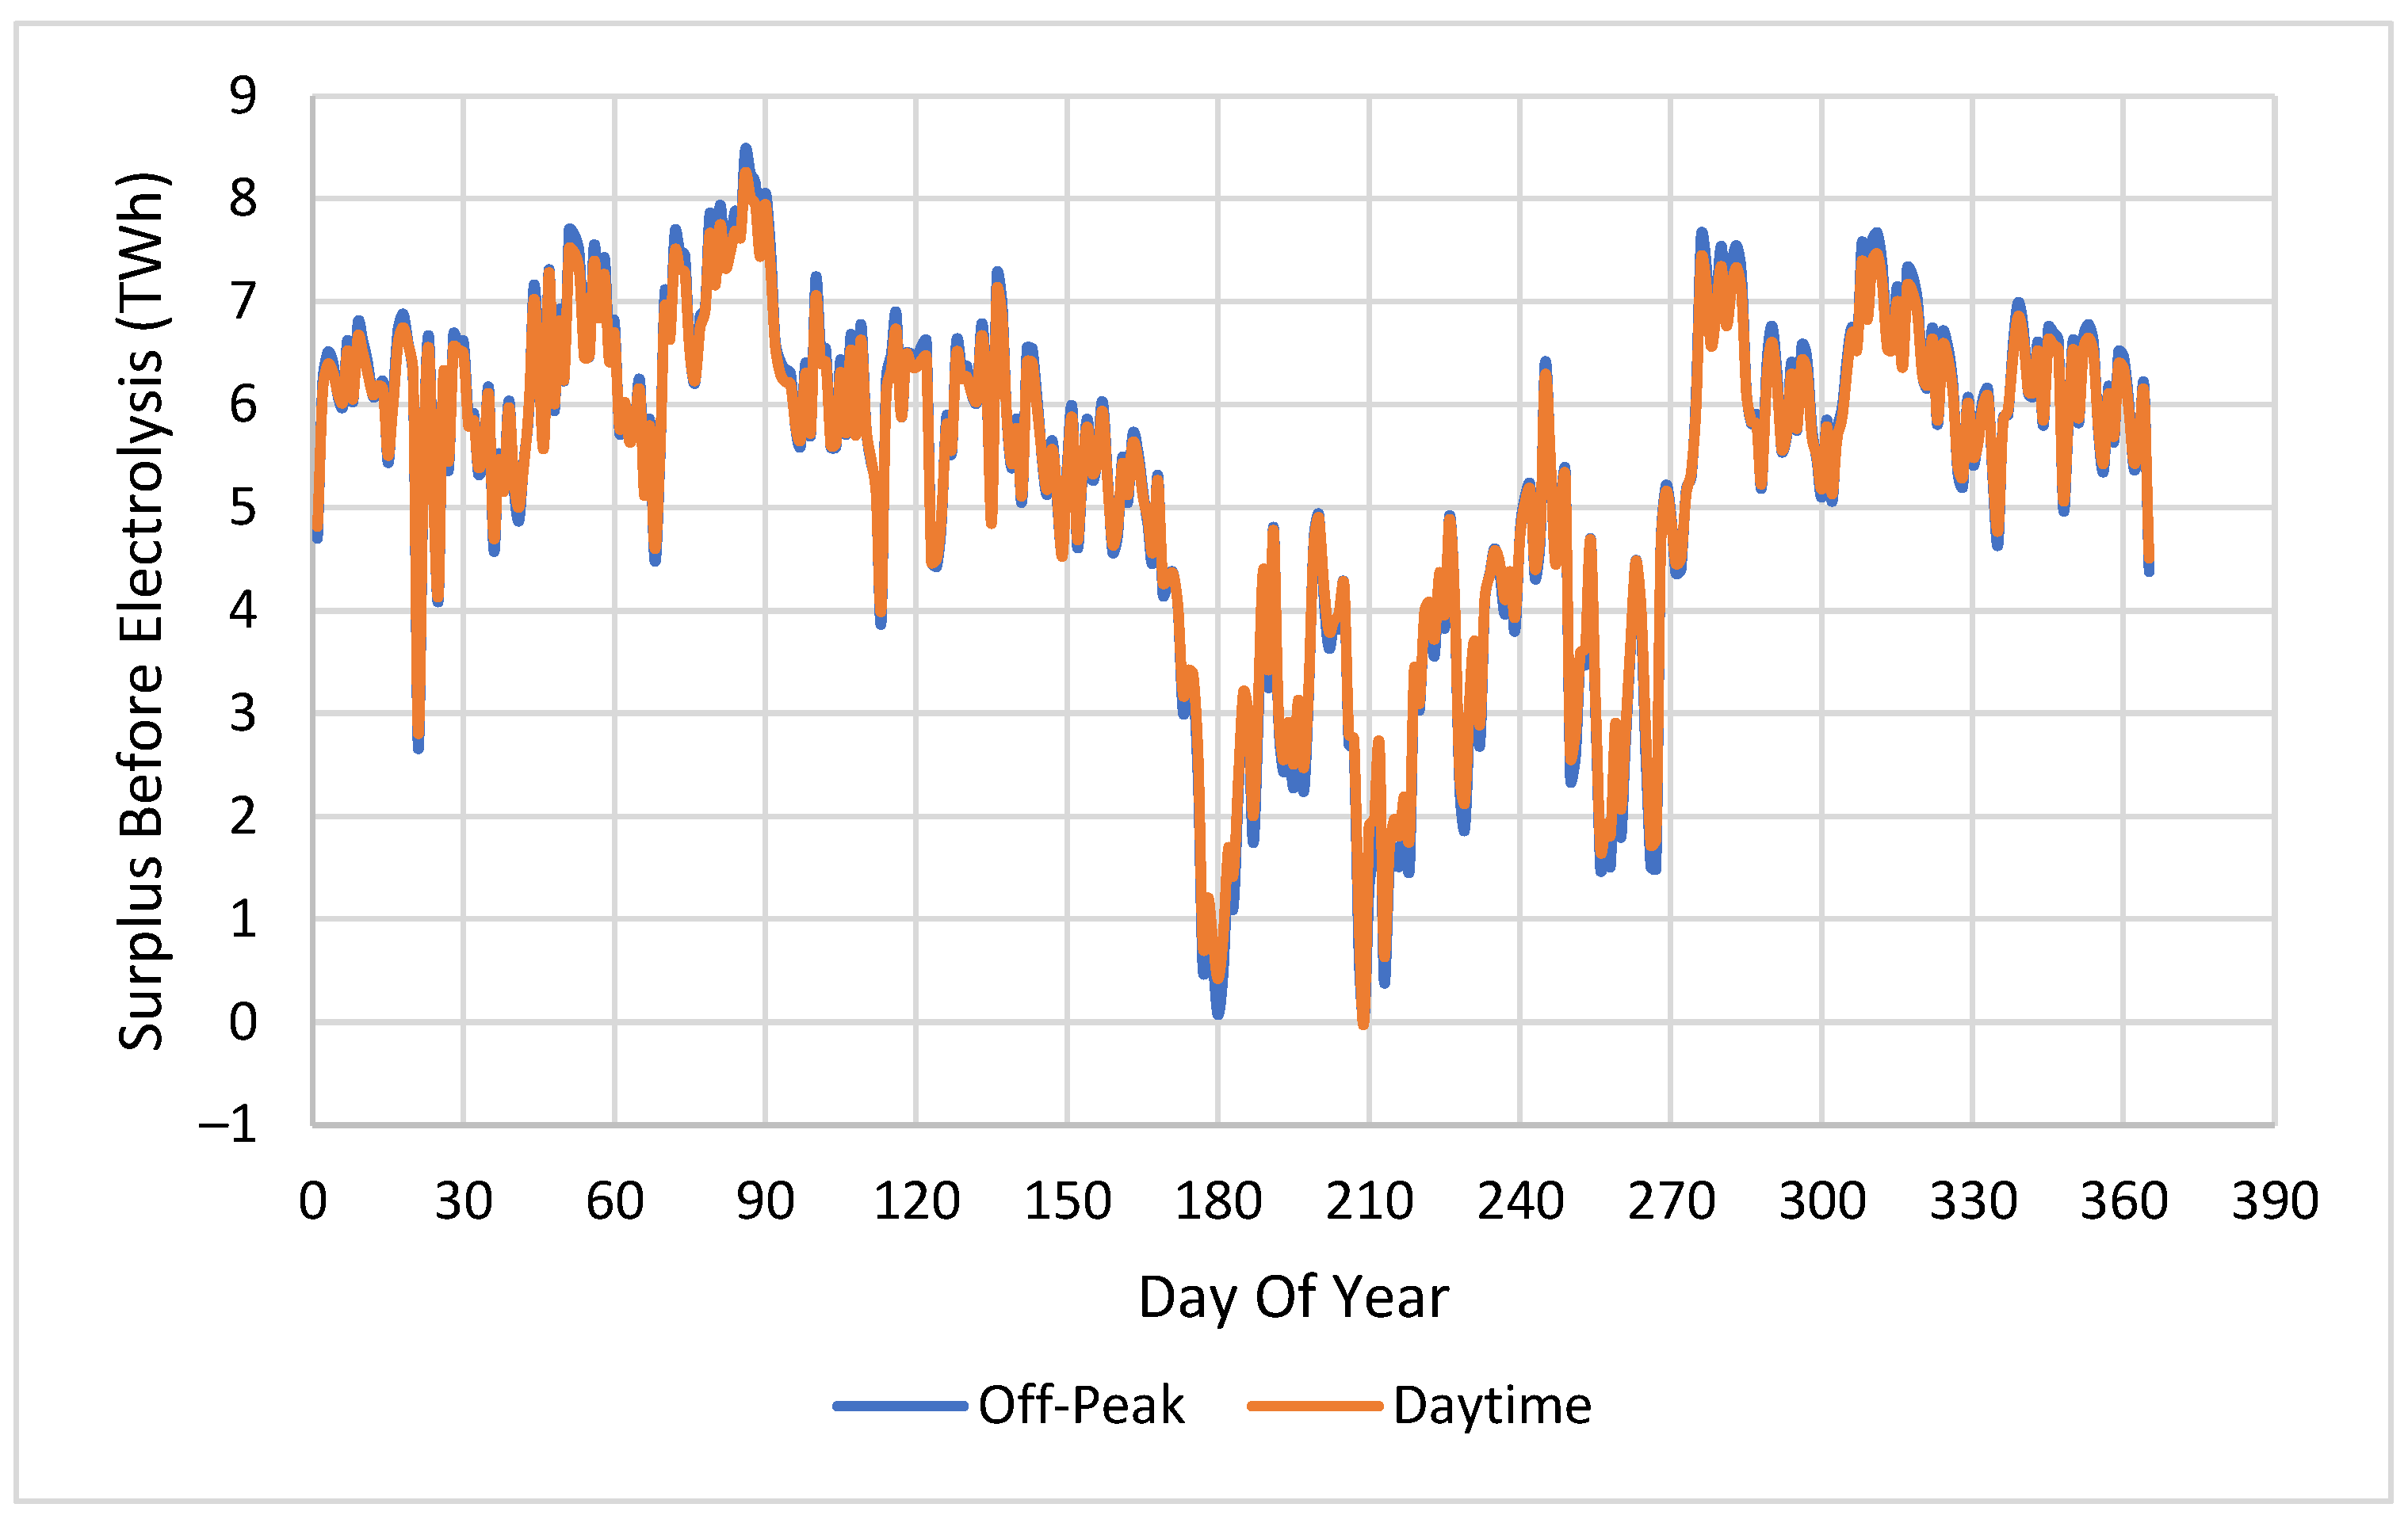
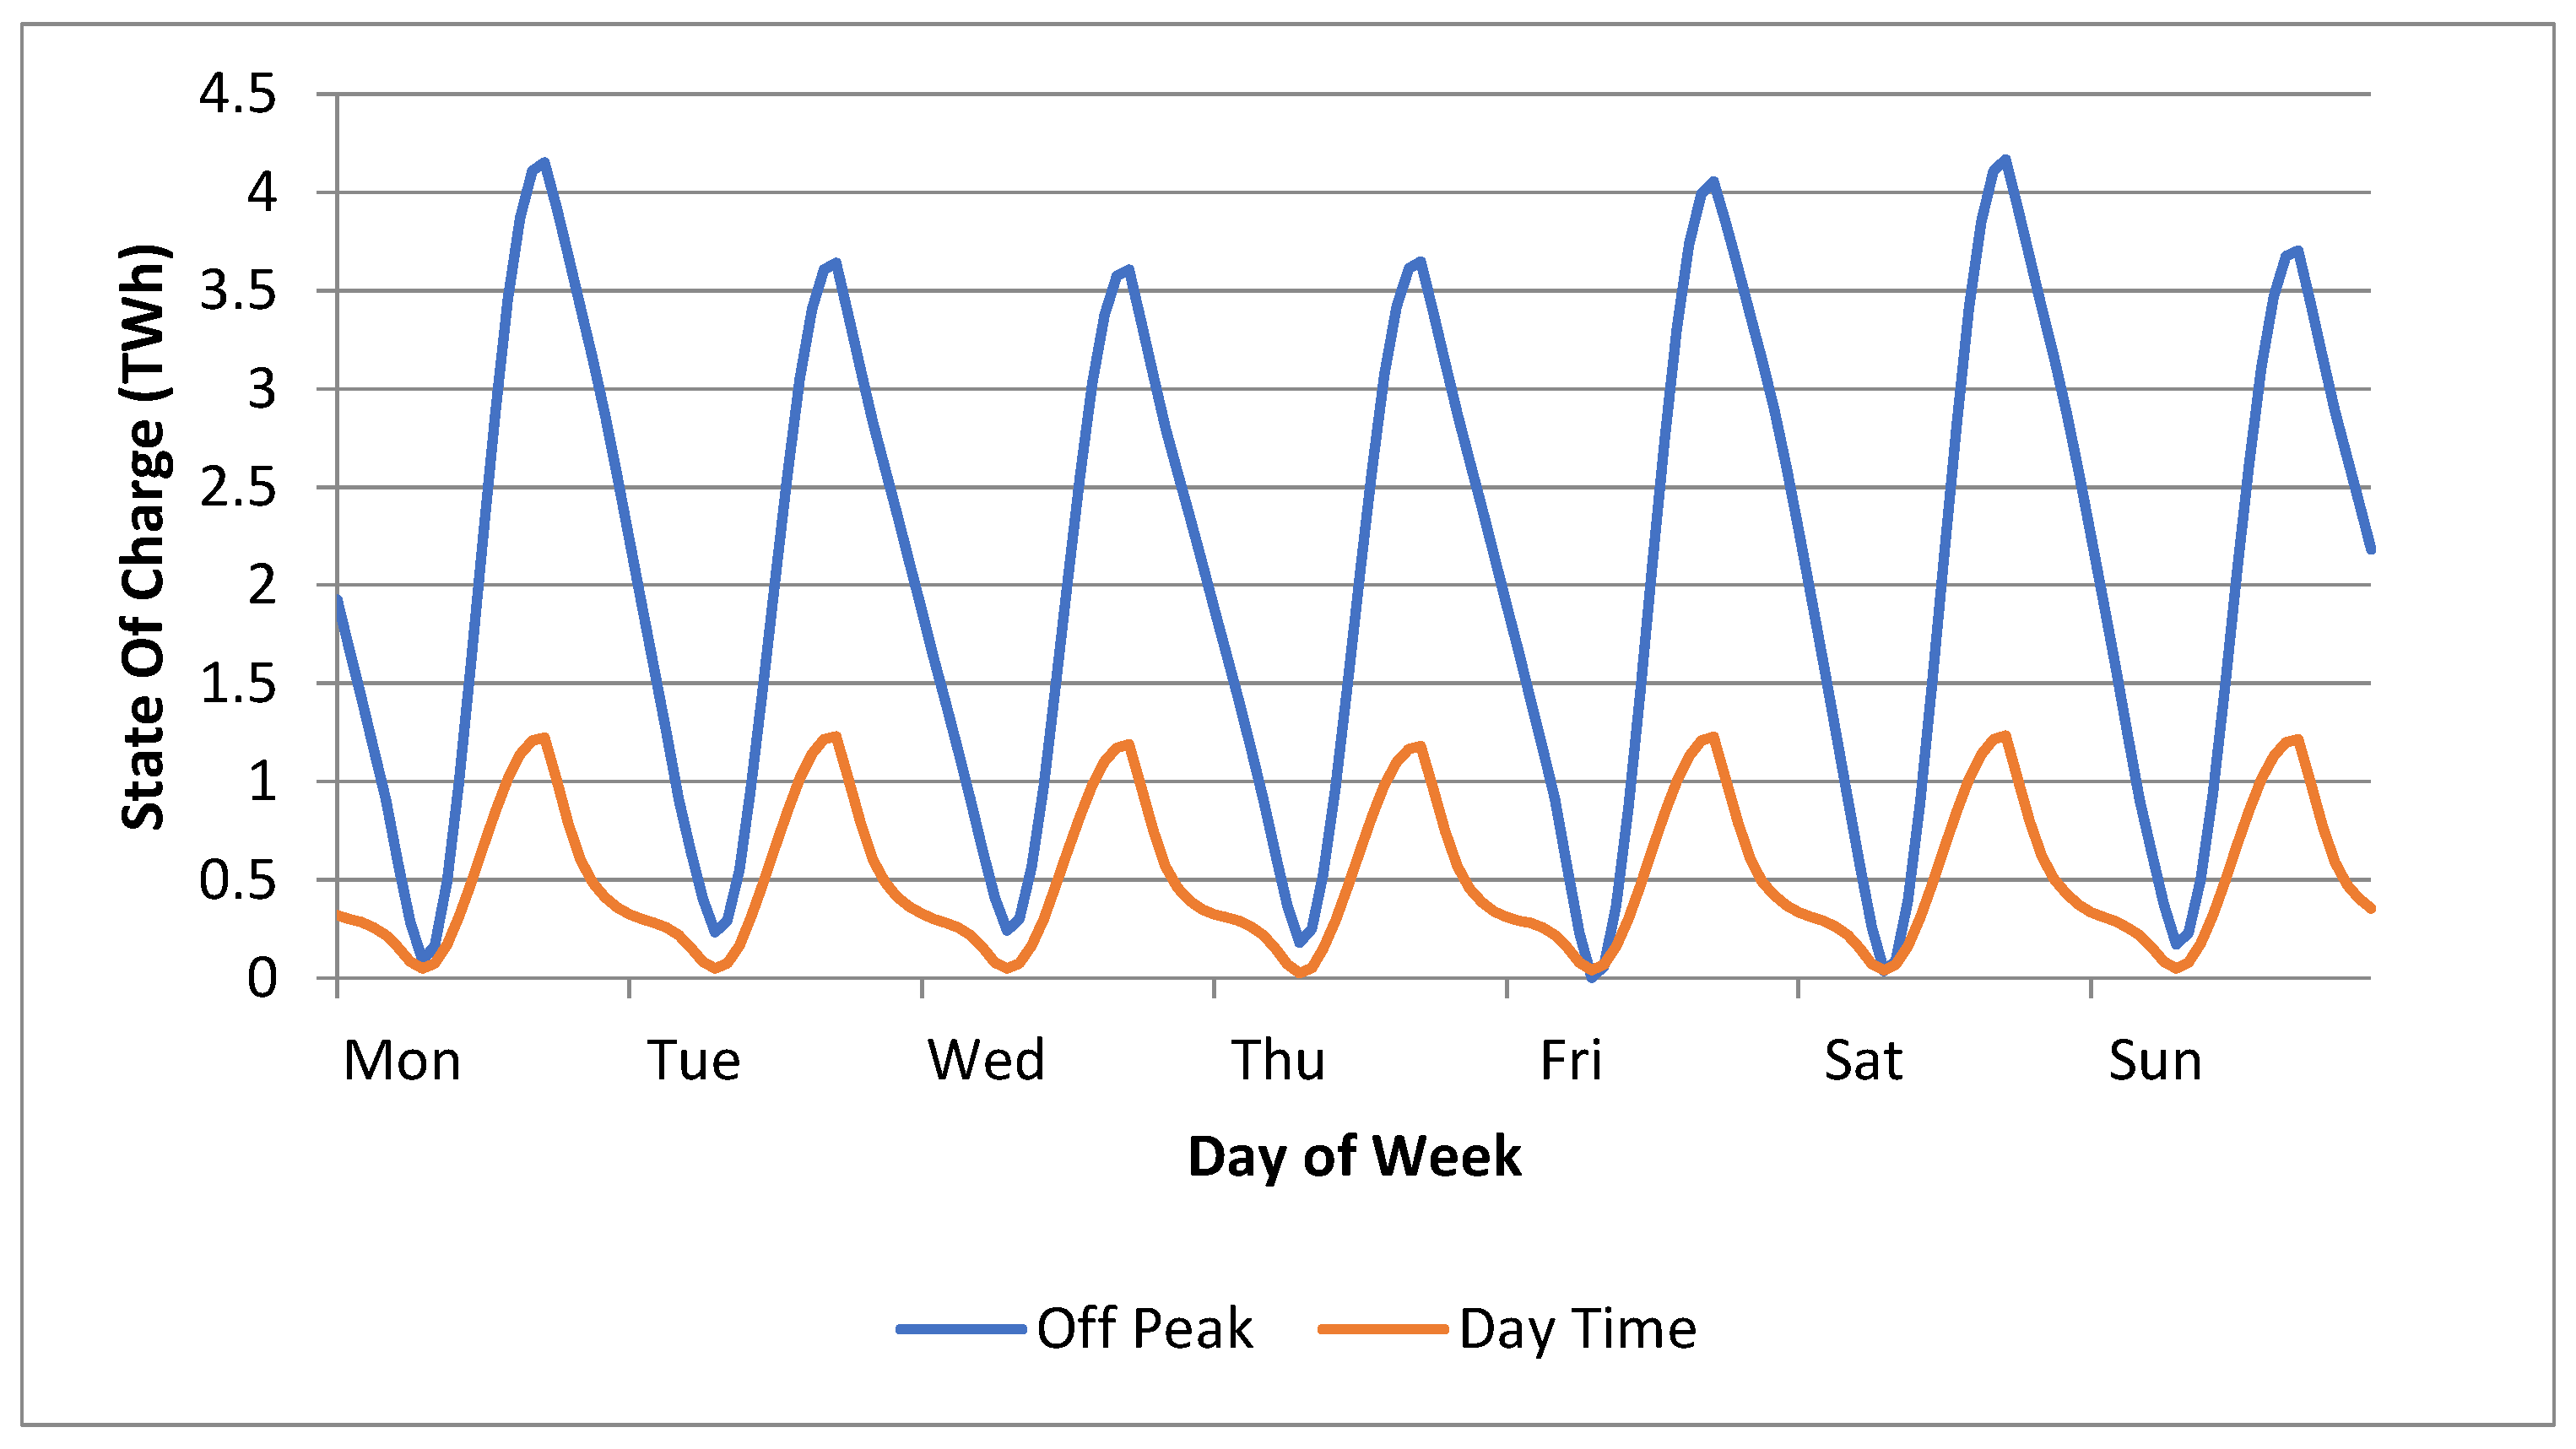
3.6. Grid Balancing and BEV Charging Options

The efficient and low-carbon transport scenario (columns 7 and 8 of Figure 4) were used in an hourly time-step model of the Indian electricity grid. The starting point for this model is the NeoCarbon 100% renewable energy scenario for India [50] from which all the non-transport electricity demand time series and renewable energy generation time series are re-used in this study. Demand for transport varies only slightly through the year, with a possible very slight reduction in the hot summer months [63,64]. For the purposes of this study, transport demand was assumed to be constant through the year. The dispatch priority order of the time step model is shown in Table 3.
The profile of transport use described above was used to model BEV charging, for which there are two options: off-peak and daytime. As described in Section 2.5, the off-peak charging profile is the inverse of the transport use profile, whereas the daytime charging profile is made to coincide with the surplus of solar PV power around midday; Figure 12. In each case, BEV charging and BEV energy use are balanced over each period of 24 h from 5 a.m. to the following 5 a.m., which results in some small discontinuities in the off-peak BEV charging profile.
The worst time of day for BEV charging would be the early evening, as it would coincide with the peak of other electricity demand [48]. By happy coincidence, the evening peak of electricity demand coincides with the evening peak of vehicle use and a period of relatively low solar power. Therefore, both the off-peak and daytime BEV charging profiles do not substantially add to electricity demand during the early evening. In practice, some degree of control or incentive would have to be implemented to discourage a peak of BEV charging as soon as BEVs are parked up in the early evening and both charging regimes rely on some degree of smart charging algorithm.
These two charging options have a big impact on national electricity balancing, as shown by the results of the grid balancing time step model; Figure 13 and Figure 14. In these figures, similar to the ones in the NeoCarbon Internet of Energy [48,50], all sources of electrical power are shown above the zero line, whereas all uses of electricity are shown below the line, exactly balancing the sources in each hour of the year.
The daytime BEV charging strategy uses electricity when it is available. Most of the midday peak of solar power is used for BEV charging and hydrogen production by electrolysis uses the remainder. Energy storage is also charged around midday but is discharged only to meet stationary energy demand, mainly during the evening peak of demand; Figure 13. Uses of electricity are shown below the x-axis and are balanced by sources shown above the x-axis. ‘Total’ is the total of all uses and is hidden behind the components of demand. ‘Demand’ is conventional (non-transport) demand including transmission losses, imports, and exports. ‘Controlled RE’ is biomass, energy-from-waste, biogas, and large hydro. ‘Uncontrolled RE’ is run-of-river hydro, wind power and solar power that was present in the original NeoCarbon model. ‘Extra solar’ is the additional fixed tilt PV added to provide transport energy. Figure 13 shows that the extra solar PV power is used for a combination of BEV charging, store charging and hydrogen production by electrolysis.
The off-peak BEV charging strategy results in greater use of stationary energy storage to accommodate the increased demand for electricity in the middle of the night; Figure 14. The energy losses caused by the charging and discharging of the store means that the extra solar PV power required is slightly larger than in the daytime BEV charging strategy.
When BEVs are charged off-peak, the peak of solar power in the middle of each day is used to charge the stationary energy storage and to make hydrogen with no increase in BEV charging.
Although both scenarios produce the same amount of hydrogen over the year (with 5% surplus compared to demand by FCVs), the off-peak charging scenario produces hydrogen in shorter periods of higher power. With daytime BEV charging, the electrolyser power rating is 1000 GW but with off-peak BEV charging, the electrolyser power rating is 1050 GW.
The supply of renewable energy is remarkably reliable and consistent over the year; Figure 15. In each scenario, the surplus varies between 0 and 8.5 TWh on a daily average energy throughflow of about 15 TWh. In only two days of the year is there a deficit of electricity requiring stationary storage of more than 24 h. Only during the rainy season, June to September, is the surplus consistently lower than average. This result shows that an approximately even split between BEVs and FCVs is close to optimum. BEVs have significantly higher generation-to-wheel efficiency but the use of hydrogen in FCVs avoids the need for long-term bulk electrical energy storage. The inefficient burning of hydrogen for electricity generation can also be avoided.
The choice between the two modes of BEV charging has a much larger effect on the requirement for stationary energy storage within each day, Figure 16. Off-peak BEV charging requires energy storage with greater energy capacity and power rating in both charging and discharging. The power ratings and capacities of energy storage are shown in Table 4, assuming perfect weather forecasting and no surplus required for extreme weather events. The pattern of charging and discharging are remarkably consistent from day to day, using almost the entire capacity of the store on most days of the year; Figure 16.

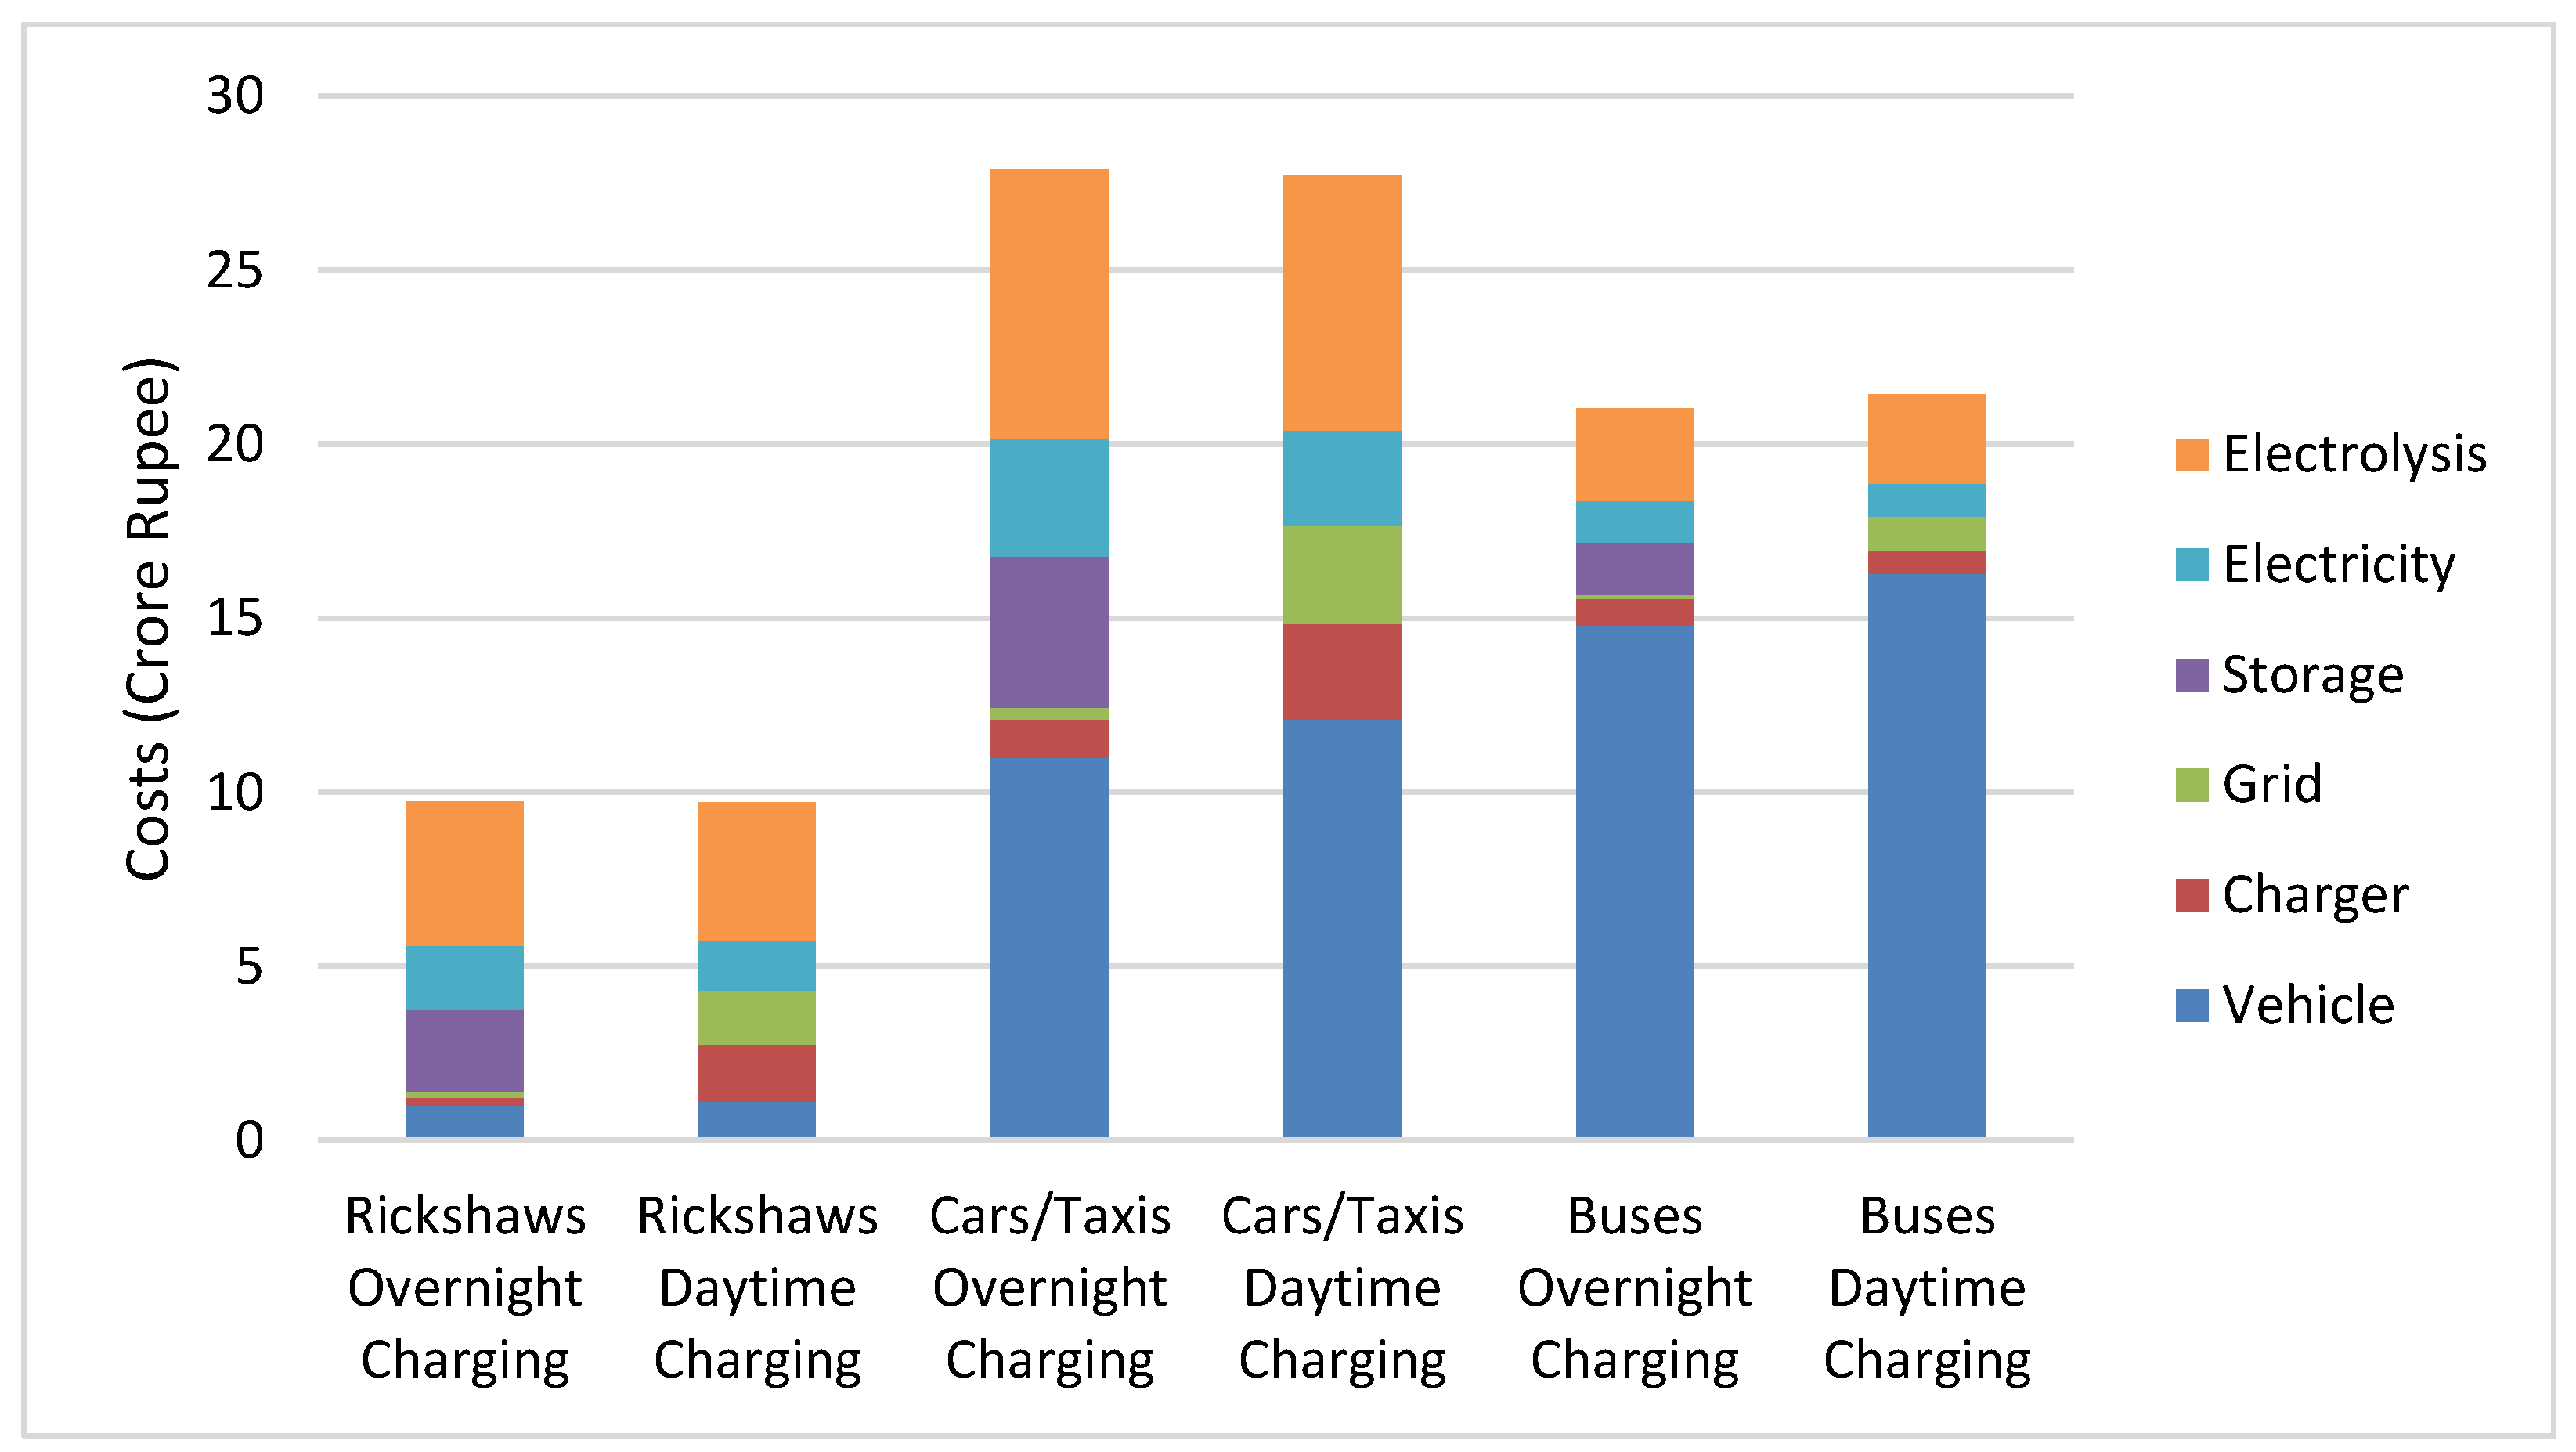
3.7. Economics of BEVs and Charging Strategy

A techno-economic model with specific limited scope was created to compare the merits of the two charging strategies. The transition to net-zero carbon transport technologies, together with the general expansion of transport services, will require enormous financial investments over the next few decades. These investments will be different in the two BEV charging strategies; Figure 17. In this analysis, just three forms of public transport—autorickshaws, taxis and buses—were modeled to compare off-peak vs. daytime charging considering the required investment of renewable energy generation, vehicles, charging infrastructure, energy conversion, and energy losses. In each case, the number of vehicles in the study provide approximately the same mobility: 100 rickshaws, 50 taxis or 5 buses. The input numbers to the model are rather approximate and subject to the following uncertainties and differences:
1.
Imported technology vs. indigenously manufactured;
2.
Economies of scale, learning rates and market maturation rates between now and year 2050;
3.
Availability of other infrastructure e.g., grid connection at overnight parking locations;
4.
Willingness of drivers to have routine disrupted by charging;
5.
Taxes, government incentives and regulations.
Nevertheless, this study indicates the important factors in the decision of the BEV charging strategy.
The capital cost (CAPEX) of the vehicles themselves shows that apparently, rickshaws are much better value for money than cars or buses. When charged during the day, vehicles are rendered unavailable for part of the day as they travel to a rapid charging point, queue up and charge. Consequently, it is estimated that 10% more of each vehicle type is needed with a daytime BEV charging strategy. The CAPEX of BEV charge-points is also greater with daytime BEV charging, partly because of the lower utilization factor. Higher power charge-points are also disproportionately expensive because they tend to deliver DC power at higher voltage, the components for which are more expensive. Daytime BEV charging requires the electricity grid to be upgraded to meet the large peak of demand around midday, in contrast to off-peak BEV charging in which stationary energy storge is collocated with solar farms and enables a more constant delivery of power from solar farms (mainly rural) to EV charging points (mainly urban). Because solar PV and charge-points are rarely co-located, the transmission and distribution grids must carry solar power from solar PV farms, mostly in rural or desert locations, to charge-points located in centers of population.
The remaining factors are all more expensive for off-peak BEV charging. For simplicity, it is assumed that electricity for off-peak charging must pass through stationary storage before delivery to charge-points. That extra storage increases the CAPEX of the system. The charging and discharging losses of the storage also increase the total electricity used, requiring more solar PV farms to be built. The electricity was costed on a 10-year project time/vehicle lifetime and the solar tender price of 2.68 INR/kWh [65]. In each scenario, electrolysers use surplus electricity when available, when not needed for charging BEVs or recharging stationary energy storage. Daytime BEV charging flattens peaks of supply and causes electrolysers to operate at a higher capacity factor than off-peak BEV charging. The required power rating and cost of electrolysers is inversely proportional to the capacity factor. Off-peak BEV charging therefore indirectly results in a higher CAPEX of electrolysers.
The net effect on total costs means that there is little to choose between off-peak and daytime BEV charging. In practice, the choice for each vehicle owner or driver will be one of convenience, local factors, day-to-day variability, and personal choice. It appears likely that a mixture of off-peak and daytime charging will be used, as they are today. Because investments can be made incrementally with the growth in BEVs and there is no requirement for a binary decision, there appears to be little danger of making the wrong decision or of creating stranded assets. It is much more important that total renewable generation and BEV charging infrastructure investment keeps pace with growth in the BEV market and that charging infrastructure is standardized [66,67].

4. Discussion of Future Research

The electrification of transport is already proceeding in India and many other countries, with some further ahead on the transition, notably Norway in electric cars [68], electric buses in China [26], and electric two-wheelers, electric-assisted bicycles, and micro-scooters led by China [69]. Lessons can be learned from these countries.
The 100% renewable electricity supply described in this paper relies heavily on extra solar PV power. However, the solar power resource is lower during the rainy season. An optimization of generation mix should be explored. If more wind power is available in the rainy season, it will seasonally complement the solar power [70]. A more constant and reliable electricity supply will reduce the need for energy storage, especially the need for hydrogen storage, and reduce the overall cost of energy supply.
The development of hydrogen as a transport fuel is slower and later than electrification. A few cities have some hydrogen-fueled buses, including India [71], but the number and range of FCVs on the market are still very limited. A great deal of work remains to develop a hydrogen transport industry, refueling infrastructure and standardization.
FCVs require hydrogen of very high purity, and green hydrogen (from electrolysis) is made at high purity. However, the storage of hydrogen at high purity is relatively expensive. Hydrogen may be stored at sufficient scale to provide a buffer to seasonal and weather-related variation in supply of renewable energy, but the lowest cost way to do this is in underground caverns and disused gas wells. Such underground storage facilities risk contamination and a reduction in hydrogen purity. Hydrogen fueled ICEs can use hydrogen of lower purity but run at lower efficiency and with emissions of some oxides of nitrogen. Research remains to be done to find the optimum solutions to these trade-offs of hydrogen purity, efficiency, hydrogen storage costs, and emissions.

5. Conclusions

This study shows that from a weight and distance perspective, most land-based vehicle types are suitable for electrification as BEVs. Only very long-distance and weight-constrained vehicles, such as large trucks, would be better served by hydrogen fuel cells.
If India can maintain high proportions of two-wheelers, auto-rickshaws, buses, and trains to meet its transport needs, then energy requirements will be much lower than if it follows a pattern of private car ownership and use. As demand for transport services grows, a high dependency on car use would dominate energy use in India, even with a switch to BEVs, and India would require three times as much extra solar PV to provide the electricity.
An initial compound growth rate of 44% in BEV production per year, higher growth rate of FCVs, and an almost complete move away from fossil fueled vehicles by 2032 appears to be necessary to achieve the complete and smooth decarbonization of transport by 2050.
From a cost point of view, it does not matter whether BEVs are charged in off-peak demand periods or in the middle of the day. A mixture of both strategies would be acceptable.
An approximately equal split between BEV charging and hydrogen production for FCVs would help the grid balancing. In such a scenario, stationary energy storage is only required for storage within each 24 h period. Hydrogen can be produced flexibly using surplus renewable electricity and used later in FCVs, if hydrogen can be affordably stored at large scale.
The transition to clean transport technologies must start now and grow rapidly to achieve net-zero carbon emissions by 2050.

Author Contributions

Conceptualization, J.P.B. and M.T.; methodology, J.P.B.; software, J.P.B. and M.T.; validation, J.P.B.; formal analysis, J.P.B.; investigation, J.P.B.; resources, M.T.; data curation, J.P.B.; writing-original draft preparation, J.P.B.; writing-review and editing, J.P.B. and M.T.; visualization, J.P.B.; supervision, M.T.; project administration, M.T.; funding acquisition, M.T.; All authors have read and agreed to the published version of the manuscript.

Funding

This work has been conducted as part of the research project ‘Joint UK-India Clean Energy Centre (JUICE)’ which is funded by the RCUK’s Energy Programme (contract no: EP/P003605/1). The projects funders were not directly involved in the writing of this article.

Institutional Review Board Statement

Not applicable.

Informed Consent Statement

Not applicable.

Data Availability Statement

Supporting data may be found at DOI:10.17028/rd.lboro.17129081.

Conflicts of Interest

The authors declare no conflict of interest.

Glossary

BEVBattery Electric Vehicle
CNGCompressed Natural Gas
COCarbon Monoxide
CSPConcentrating Solar Power
FCVFuel Cell Vehicle
GHGsGreenhouse Gases
ICEInternal Combustion Engine
LPGLiquid Petroleum Gas
NOxOxides of Nitrogen
PVSolar Photovoltaic

Appendix A

Table A1. Fifty locations around India where Google popular times were used as a proxy for demand for transport.
Location NameForm of TransportLocation in CityCity or Region
ChurchgateLocal TrainCentreMumbai
CSM TerminusDistance TrainCentreMumbai
JogeshwariLocal TrainHalfwayMumbai
VersovaMetroHalfwayMumbai
GhatkoparMetroHalfwayMumbai
GhatkoparLocal TrainHalfwayMumbai
Khandwa JunctionDistance TrainSmall TownMadhya Pradesh
New DelhiDistance TrainCentreNew Delhi
New DelhiMetroCentreNew Delhi
RohiniMetroOuterNew Delhi
RithalaMetroOuterNew Delhi
DwarkaMetroOuterNew Delhi
IndusIndMetroHalfwayNew Delhi
Sector 55–56MetroOuterNew Delhi
ShalimarMetroOuterNew Delhi
FaridabadLocal TrainHalfwayNew Delhi
Escorts MujesarMetroHalfwayNew Delhi
WaveMetroOuterNew Delhi
DainikMetroOuterNew Delhi
MundkaMetroOuterNew Delhi
Kirti NagarMetroHalfwayNew Delhi
InderlokMetroHalfwayNew Delhi
Kashmere GateMetroCentreNew Delhi
DilshadMetroOuterNew Delhi
Anand ViharBusHalfwayNew Delhi
KolkataDistance TrainCentreKolkata
TikiaparaLocal TrainHalfwayKolkata
NoaparaMetroOuterKolkata
UttarparaLocal TrainHalfwayKolkata
KamarkunduLocal TrainHalfwayKolkata
ThakurpukurBusOuterKolkata
BiratiBusOuterKolkata
CoonoorLocal TrainSmall TownTamil Nadu
KrantiviraDistance TrainCentreBengaluru
CityMetroCentreBengaluru
Mysuru RdMetroOuterBengaluru
BaiyappanahalliMetroHalfwayBengaluru
BaiyyappanahaliLocal TrainHalfwayBengaluru
NadaprabhuMetroCentreBengaluru
YelachenahalliMetroOuterBengaluru
NagasandraMetroOuterBengaluru
NadaprabhuBusCentreBengaluru
Electronic CityBusHalfwayBengaluru
Chennai BeachLocal TrainCentreChennai
WashermanpetLocal TrainHalfwayChennai
EnnoreLocal TrainHalfwayChennai
GumtoDistance TrainSmall TownArunchal
Harmuti JunctionDistance TrainSmall TownAssam
TezpurDistance TrainCentreTezpur
DekargaonDistance TrainHalfwayTezpur

References

  1. EBTC. Report on Transport and Energy in India. Turin Torino; 2013. Available online: http://ebtc.eu/pdf/130925_REP_Report-on-Transport-and-Energy-in-India_Web.pdf (accessed on 25 September 2013).
  2. Paladugula, A.L.; Kholod, N.; Chaturvedi, V.; Ghosh, P.P.; Pal, S.; Clarke, L.; Evans, M.; Kyle, P.; Koti, P.N.; Parikh, K.; et al. A multi-model assessment of energy and emissions for India’s transportation sector through 2050. Energy Policy 2018, 116, 10–18. [Google Scholar] [CrossRef]
  3. Dhar, S.; Pathak, M.; Shukla, P.R. Transformation of India’s transport sector under global warming of 2 °C and 1.5 °C scenario. J. Clean. Prod. 2018, 172, 417–427. [Google Scholar] [CrossRef] [Green Version]
  4. Karstensen, J.; Roy, J.; Deb Pal, B.; Peters, G.; Andrew, R. Key drivers of Indian greenhouse gas emissions. Econ. Polit. Wkly. 2020, 55, 46–53. [Google Scholar]
  5. Ge, M.; Friedrich, J. 4 Charts Explain Greenhouse Gas Emissions by Countries and Sectors; World Resources Institute: Washington, DC, USA, 2020; Available online: https://www.wri.org/insights/4-charts-explain-greenhouse-gas-emissions-countries-and-sectors (accessed on 26 May 2021).
  6. Singh, A.; Gangopadhyay, S.; Nanda, P.K.; Bhattacharya, S.; Sharma, C.; Bhan, C. Trends of greenhouse gas emissions from the road transport sector in India. Sci. Total Environ. 2008, 390, 124–131. [Google Scholar] [CrossRef] [PubMed]
  7. Ritchie, H.; Roser, M. CO2 and Greenhouse Gas Emissions. Our World in Data. 2020. Available online: https://ourworldindata.org/co2-and-other-greenhouse-gas-emissions# (accessed on 26 May 2021).
  8. Misra, P.; Takeuchi, W. Analysis of air quality in Indian cities using remote sensing and economic growth parameters. In Proceedings of the ACRS 2015—36th Asian Conference on Remote Sensing: Fostering Resilient Growth in Asia, Quezon City, Philippines, 24–28 October 2015. [Google Scholar]
  9. Gulia, S.; Nagendra, S.M.S.; Barnes, J.; Khare, M. Urban local air quality management framework for non-attainment areas in Indian cities. Sci. Total Environ. 2018, 619, 1308–1318. [Google Scholar] [CrossRef] [PubMed]
  10. Guttikunda, S.K.; Goel, R.; Pant, P. Nature of air pollution, emission sources, and management in the Indian cities. Atmos. Environ. 2014, 95, 501–510. [Google Scholar] [CrossRef]
  11. Shrivastava, R.; Neeta, S.; Geeta, G. Air pollution due to road transportation in India: A review on assessment and reduction strategies. J. Environ. Res. Dev. 2013, 8, 69. [Google Scholar]
  12. Dhar, S.; Shukla, P.R. Low carbon scenarios for transport in India: Co-benefits analysis. Energy Policy 2015, 81, 186–198. [Google Scholar] [CrossRef] [Green Version]
  13. Audoly, R.; Vogt-Schilb, A.; Guivarch, C.; Pfeiffer, A. Pathways toward zero-carbon electricity required for climate stabilization. Appl. Energy 2018, 225, 884–901. [Google Scholar] [CrossRef] [Green Version]
  14. SESEI. Study Report on Automotive “ITS and E-Mobility”; SESEI: Delhi, India, 2020; Available online: https://ebtc.eu/admin/images/posts/107/180402StudyonITSandEmobility.pdf (accessed on 17 August 2021).
  15. Shukla, P.R.; Chaturvedi, V. Low carbon and clean energy scenarios for India: Analysis of targets approach. Energy Econ. 2012, 34, S487–S495. [Google Scholar] [CrossRef]
  16. WRI. India Reaffirms Ambitious Renewable Energy Target at United Nations. 2021. Available online: https://www.wri.org/news/statement-india-reaffirms-ambitious-renewable-energy-target-united-nations (accessed on 6 December 2021).
  17. Government of India. India Energy Security Scenarios 2047. 2015. Available online: http://iess2047.gov.in/pathways/44404444444444440444444444014444404424444444404440444022222/primary_energy_chart (accessed on 13 August 2021).
  18. IPCC. IPCC Special Report Global Warming of 1.5 °C. 2018. Available online: https://www.ipcc.ch/sr15/ (accessed on 5 October 2021).
  19. NITI Aayog; RMI. India’s Electric Mobility Transformation: Progress to Date and Future Opportunities. 2019. Available online: http://niti.gov.in/writereaddata/files/document_publication/NITI-RMI-Report.pdf (accessed on 19 August 2021).
  20. Popovich, N.D.; Rajagopal, D.; Tasar, E.; Phadke, A. Economic, environmental and grid-resilience benefits of converting diesel trains to battery-electric. Nat. Energy 2021, 6, 1017–1025. Available online: https://www.nature.com/articles/s41560-021-00915-5.pdf (accessed on 26 November 2021). [CrossRef]
  21. Staples, M.D.; Malina, R.; Barrett, S.R.H. The limits of bioenergy for mitigating global life-cycle greenhouse gas emissions from fossil fuels. Nat. Energy 2017, 2, 16202. Available online: https://www.nature.com/articles/nenergy2016202.pdf (accessed on 24 August 2021). [CrossRef]
  22. Mittal, S.; Ahlgren, E.O.; Shukla, P.R. Future biogas resource potential in India: A bottom-up analysis. Renew. Energy 2019, 141, 379–389. Available online: https://www.sciencedirect.com/science/article/pii/S0960148119304549 (accessed on 24 August 2021). [CrossRef]
  23. Owen, B.; Lee, D.S.; Lim, L. Flying into the future: Aviation Emissions Scenarios to 2050. Environ. Sci. Technol. 2010, 44, 2255–2260. Available online: https://pubs.acs.org/doi/pdf/10.1021/es902530z (accessed on 24 August 2021). [CrossRef] [PubMed]
  24. Lee, D.S.; Fahey, D.W.; Forster, P.M.; Newton, P.J.; Wit, R.C.; Lim, L.L.; Owen, B.; Sausen, R. Aviation and global climate change in the 21st century. Atmos. Environ. 2009, 43, 3520–3537. Available online: https://www.sciencedirect.com/science/article/pii/S1352231009003574#fig3 (accessed on 24 August 2021). [CrossRef] [PubMed] [Green Version]
  25. Rowlatt, J. Why Electric Cars will Take over Sooner than You Think. BBC News. 24 August 2021. Available online: https://www.bbc.co.uk/news/business-57253947 (accessed on 24 August 2021).
  26. Khandekar, A.; Rajagopal, D.; Abhyankar, N.; Deorah, S.; Phadke, A. The Case for All New City Buses in India to Be Electric. 2018. Available online: https://escholarship.org/content/qt7d64m1cd/qt7d64m1cd_noSplash_ffa60ca3f169642318a55378994911ab.pdf?t=pjiibx (accessed on 17 September 2021).
  27. Ajanovic, A.; Haas, R. Economic and Environmental Prospects for Battery Electric- and Fuel Cell Vehicles: A Review. Fuel Cells 2019, 195, 515–529. [Google Scholar] [CrossRef] [Green Version]
  28. IESA. India Electric Vehicle Market Overview Report; IESA: Pune, India, 2020; Available online: https://indiaesa.info/media/downloadfiles/EV_Report_Brochure._234429529.pdf (accessed on 17 August 2021).
  29. Saxena, S.N. Two- and Three- Wheeler Electric Vehicles in India—Outlook 2019. Int. J. Electr. Eng. Technol. 2019, 9, 13. Available online: http://ripublication.com/ijeet19/ijeetv9n1_01.pdf (accessed on 24 August 2021).
  30. Ligen, Y.; Vrubel, H.; Girault, H.H. Mobility from Renewable Electricity: Infrastructure Comparison for Battery and hydrogen Fuel Cell Vehicles. World Electr. Veh. J. 2018, 9, 12. [Google Scholar] [CrossRef] [Green Version]
  31. IOR Energy. Engineering Conversion Factors. 2010. Available online: https://web.archive.org/web/20100825042309/http://www.ior.com.au/ecflist.html (accessed on 6 December 2021).
  32. PushEVs. 2018 Nissan Leaf Battery Real Specs. 2021. Available online: https://pushevs.com/2018/01/29/2018-nissan-leaf-battery-real-specs/ (accessed on 28 May 2021).
  33. Sibelga. How Much Power Does an Electric Car Use? All about Energy in Brussels. 2021. Available online: https://www.energuide.be/en/questions-answers/how-much-power-does-an-electric-car-use/212/ (accessed on 3 July 2018).
  34. Idaho National Laboratory. Comparing Energy Costs per Mile for Electric and Gasoline-Fueled Vehicles. Advanced Vehicle Testing Activity. 2011. Available online: https://avt.inl.gov/sites/default/files/pdf/fsev/costs.pdf (accessed on 3 December 2014).
  35. Gao, Z.; Lin, Z.; LaClair, T.J.; Liu, C.; Li, J.M.; Birky, A.K.; Ward, J. Battery capacity and recharging needs for electric buses in city transit service. Energy 2017, 122, 588–600. [Google Scholar] [CrossRef] [Green Version]
  36. Pinna, I.; Dalla Chiara, B.; Pant, K. Energy used by transport systems in India: The role of the urban population, sources, alternative modes and quantitative analyses. WIT Trans. Ecol. Environ. 2014, 190, 661–676. Available online: https://www.witpress.com/Secure/elibrary/papers/EQ14/EQ14063FU1.pdf (accessed on 16 August 2021).
  37. ITF. Decarbonising India’s Transport System. Charting the Way Forward. 2020. Available online: https://www.itf-oecd.org/decarbonising-india-transport-system (accessed on 27 July 2021).
  38. Clark, H.; Frankland, C. Digest of United Kingdom Energy Statistics 2018. Chapter 1, Electricity. 2018. Available online: https://assets.publishing.service.gov.uk/government/uploads/system/uploads/attachment_data/file/736148/DUKES_2018.pdf (accessed on 16 August 2021).
  39. Government of India. Census of India 2011. Houses, Household Amenities and Assets. Figures at a Glance. 2011. Available online: Censusindia.gov.in/2011census/hlo/Data_sheet/India/Figures_Glance.xls (accessed on 16 August 2021).
  40. United Nations. World Population Prospects. Volume I. 2019. Available online: https://population.un.org/wpp/Publications/Files/WPP2019_Volume-I_Comprehensive-Tables.pdf (accessed on 14 July 2021).
  41. Mordor Intelligence. India Electric Vehicle (EV) Market—Growth, Trends, COVID-19 Impact, and Forecasts (2021–2026). 2021. Available online: https://www.mordorintelligence.com/industry-reports/india-electric-vehicle-market (accessed on 17 August 2021).
  42. Nakamoto, Y.; Nishijima, D.; Kagawa, S. The role of vehicle lifetime extensions of countries on global CO2 emissions. J. Clean. Prod. 2019, 207, 1040–1046. [Google Scholar] [CrossRef]
  43. US Department of Energy Office of Energy Efficiency and Renewable Energy. Compare Fuel Cell Vehicles; Oak Ridge National Laboratory: Oak Ridge, TN, USA, 2016. Available online: https://www.fueleconomy.gov/feg/fcv_sbs.shtml (accessed on 13 July 2021).
  44. National Statistics. 2017 National Travel Survey. 2018. Available online: https://assets.publishing.service.gov.uk/government/uploads/system/uploads/attachment_data/file/729521/national-travel-survey-2017.pdf (accessed on 11 August 2021).
  45. Google. Popular Times, Wait Times, and Visit Duration. 2020. Available online: https://support.google.com/business/answer/6263531?hl=en-GB (accessed on 6 December 2021).
  46. Möhring, M.; Keller, B.; Schmidt, R.; Dacko, S. Google Popular Times: Towards a better understanding of tourist customer patronage behavior. Tour Rev. 2020, 76, 533–569. [Google Scholar] [CrossRef]
  47. Gulagi, A.; Bogdanov, D.; Breyer, C. The role of storage technologies in energy transition pathways towards achieving a fully sustainable energy system for India. J. Energy Storage 2018, 17, 525–539. [Google Scholar] [CrossRef]
  48. Gulagi, A.; Choudhary, P.; Bogdanov, D.; Breyer, C. Electricity system based on 100% renewable energy for India and SAARC. PLoS ONE 2017, 12, 1–27. Available online: https://journals.plos.org/plosone/article?id=10.1371/journal.pone.0180611 (accessed on 8 July 2021). [CrossRef] [PubMed] [Green Version]
  49. Gulagi, A.; Bogdanov, D.; Breyer, C. The Demand for Storage Technologies in Energy Transition Pathways Towards 100% Renewable Energy for India. Energy Procedia 2017, 135, 37–50. [Google Scholar] [CrossRef]
  50. Vainikka, P.; Breyer, C.; Heinonen, S. Emission-Free Future Now Available. 2017. Available online: Neocarbonenergy.fi (accessed on 9 July 2021).
  51. IEA. India. Countries. 2021. Available online: https://www.iea.org/countries/india (accessed on 25 August 2021).
  52. Lolla, A.; Yang, M.; Vats, G. India. EMBER Global Electricity Review 2021. 2021. Available online: https://ember-climate.org/global-electricity-review-2021/g20-profiles/india/ (accessed on 25 August 2021).
  53. Ahmadi, M.H.; Ghazvini, M.; Sadeghzadeh, M.; Alhuyi Nazari, M.; Kumar, R.; Naeimi, A.; Ming, T. Solar power technology for electricity generation: A critical review. Energy Sci. Eng. 2018, 6, 340–361. [Google Scholar] [CrossRef] [Green Version]
  54. Leou, R.C.; Hung, J.J. Optimal charging schedule planning and economic analysis for electric bus charging stations. Energies 2017, 10, 483. [Google Scholar] [CrossRef] [Green Version]
  55. RMI India; NITI Aayog. Fast Tracking Freight in India. 2021. Available online: https://www.niti.gov.in/sites/default/files/2021-06/FreightReportNationalLevel.pdf (accessed on 13 August 2021).
  56. Business Standard. India’s Electric Vehicle Sales to Grow at 26% in FY 21–23. 2021. Available online: https://www.business-standard.com/article/automobile/india-s-electric-vehicle-sales-to-grow-at-26-in-fy21-23-fitch-solutions-121062200431_1.html (accessed on 17 August 2021).
  57. Reuters. Narendra Modi government aiming to electrify all vehicles in country by 2032. India Today 2017, 7, 1. Available online: https://www.indiatoday.in/india/story/narendra-modi-government-electrify-all-vehicles-in-country-2032-975656-2017-05-07 (accessed on 17 August 2021).
  58. Oguchi, M.; Fuse, M. Regional and longitudinal estimation of product lifespan distribution: A case study for automobiles and a simplified estimation method. Environ. Sci. Technol. 2015, 49, 1738–1743. [Google Scholar] [CrossRef]
  59. Havaei-Ahary, B. Road Traffic Estimates: Great Britain 2019. Department for Transport. 2020. Available online: https://assets.publishing.service.gov.uk/government/uploads/system/uploads/attachment_data/file/916749/road-traffic-estimates-in-great-britain-2019.pdf (accessed on 19 August 2021).
  60. Tom Tom. New Delhi Traffic. 2021. Available online: https://www.tomtom.com/en_gb/traffic-index/new-delhi-traffic/ (accessed on 19 August 2021).
  61. Salve, P. Why Trucks Kill So Many on Indian Roads. 2020. Available online: https://www.bloombergquint.com/law-and-policy/why-trucks-kill-so-many-on-indian-roads (accessed on 19 August 2021).
  62. Hameer, S.; Van Niekerk, J.L. A review of large-scale electrical energy storage. Int. J. Energy Res. 2015, 39, 1179–1195. [Google Scholar] [CrossRef]
  63. Kale, U.; Sawant, P. Correlation between traffic congestion on seasonal variation of vehicles and RSPM levels at the traffic junctions of Mumbai. Tech. Technol. Educ. Manag. 2017, 12, 26–30. Available online: https://www.researchgate.net/profile/Jasmina-Lukic/publication/320466929_TECHNICS_TECHNOLOGIES_EDUCATION_MANAGEMENT_JOURNAL_OF_SOCIETY_FOR_DEVELOPMENT_OF_TEACHING_AND_BUSINESS_PROCESSES_IN_NEW_NET_ENVIRONMENT_IN_BH/links/59e7219c4585151e5465a67e/TECHNICS- (accessed on 14 October 2021).
  64. Nandakumar, R.; Mohan, M. Analysis of traffic growth on a rural highway: A case study from India. Eur. Transp. 2019, 74, 15. Available online: https://www.researchgate.net/publication/338371608 (accessed on 14 October 2021).
  65. Kondratieva, K. Cap on Solar Tariffs Could Dim Prospects for Future Auctions, Caution Developers. The Hindu Business Line. 2018. Available online: https://www.thehindubusinessline.com/news/cap-on-solar-tariffs-could-dim-prospects-for-future-auctions-caution-developers/article24874790.ece (accessed on 25 August 2021).
  66. Bakker, J.J. Contesting Range Anxiety the Role of Electric Vehicle Charging Infrastructure in the Transportation Transition; Eindhoven University of Technology: Eindhoven, The Netherlands, 2011; Available online: https://pure.tue.nl/ws/portalfiles/portal/47015026/716302-1.pdf (accessed on 14 October 2021).
  67. Brown, S.; Pyke, D.; Steenhof, P. Electric Vehicles: The Role and Importance of Standards in an Emerging Market. Energy Policy 2010, 3797–3806. Available online: https://www.sciencedirect.com/science/article/pii/S0301421510001631 (accessed on 14 October 2021). [CrossRef]
  68. Richter, F.; Statista. Which Countries Sell the Most Electric Cars? World Eonomic Forum. 2021. Available online: https://www.weforum.org/agenda/2021/02/electric-vehicles-europe-percentage-sales/ (accessed on 23 November 2021).
  69. Jamerson, F.E. History and Prospects for Electric Vehicles and Electric Bikes: Pathway to Sustainable Carbon Free Energy and Transportation. SAE Tech. Pap. 2020, 2020, 1–10. Available online: https://gmr-retiree.org/assets/1-sae-wcx-paper-as-published-14apr2020--2020-01-0974--copy-(1).pdf (accessed on 23 November 2021).
  70. Jung, C.; Schindler, D. The annual cycle and intra-annual variability of the global wind power distribution estimated by the system of wind speed distributions. Sustain. Energy Technol. Assess. 2020, 42, 100852. [Google Scholar] [CrossRef]
  71. Medisetty, V.M.; Kumar, R.; Ahmadi, M.H.; Vo, D.V.N.; Ochoa, A.A.V.; Solanki, R. Overview on the Current Status of Hydrogen Energy Research and Development in India. Chem. Eng. Technol. 2020, 43, 613–624. [Google Scholar] [CrossRef]
Figure 1. Weight of batteries as fraction of unladen vehicle.
Energies 14 08277 g001
Figure 2. Growth of passenger transport demand in India.
Energies 14 08277 g002
Figure 3. Growth of freight transport demand in India.
Energies 14 08277 g003
Figure 4. Transport energy disaggregated by mode and passenger/freight in each year, compared with the UK under different scenarios.
Energies 14 08277 g004
Figure 5. Fossil fuel expansion of transport in India.
Energies 14 08277 g005
Figure 6. Expansion of transport in India with transition to clean energy.
Energies 14 08277 g006
Figure 7. Modeled transition from fossil fuels to clean transport fuels in India.
Energies 14 08277 g007
Figure 8. Weekly popular times of people waiting for public transport by mode.
Energies 14 08277 g008
Figure 9. Weekly popular times of people waiting for public transport by location.
Energies 14 08277 g009
Figure 10. Average of busy time data for all public transport locations.
Energies 14 08277 g010
Figure 11. Additional renewable energy required to match electricity used in BEVs and FCVs.
Energies 14 08277 g011
Figure 12. BEV charging profiles using off-peak and solar powered midday charging strategies in the first full week of the year.
Energies 14 08277 g012
Figure 13. Generation and demand of electricity in the first week of the year with a daytime BEV charging strategy.
Energies 14 08277 g013
Figure 14. Generation and demand of electricity in the first week of the year with an off-peak BEV charging strategy.
Energies 14 08277 g014
Figure 15. Surpluses of electrical energy on each day of the typical meteorological year after stationary energy demand, BEV charging and stationary storage but before hydrogen production.
Energies 14 08277 g015
Figure 16. Variation in state-of-charge of stationary energy storage in the first full week of the year.
Energies 14 08277 g016
Figure 17. A comparison of direct and indirect costs of off-peak (overnight) and daytime charging of rickshaws, taxis, and buses.
Energies 14 08277 g017
Table 1. Vehicle parameters and battery size required in a BEV.
Vehicle TypeDaily Range Travelled (km)Specific Energy Consumption (kWh/km/Tonne)Vehicle Curb Weight (Tonnes)Maximum Laden Weight (Tonnes)Battery Weight (Tonnes)
Auto Rickshaw1050.860.2720.6100.104
Car or Taxi1990.710.8951.2700.336
Local Bus1250.225.3610.841.34
Coach4000.2215.2020.504.30
Passenger Train12000.05012241368217
Freight Train11520.02913943665323
Small Delivery Vans560.200.4200.9950.071
Trucks4410.148.8834.005.55
Aircraft10,4000.232776503800
Table 2. Daytime vs. overnight BEV charging.
Arguments for Daytime ChargingArguments for Overnight Charging
Uses electricity at the same time of day as solar generation. This minimizes grid imbalance and the cost of necessary stationary energy storage.Transport demand is much lower in the night-time hours than in the middle of the day. Therefore, the disruption to BEV operating schedules is minimal.
Simultaneous solar generation and BEV charging minimizes energy losses in charging and discharging stationary energy stores.BEVs tend to return to a home or depot location at night in which dedicated charging points can be located. Conflict and competition over shared charge points can be avoided.
The gap between morning and evening commuting creates a window of lower transport demand in which BEVs can be recharged.Charging takes place over more hours at lower power. The cost of each charge point is reduced, as is the cost of its grid connection.
Rapid (high power) charging minimizes the total number of charge points required.BEV charging takes place when other electricity loads are at their minimum. Grid reinforcement costs are minimized.
Rapid chargers can be collocated with solar farms for the use of long-distance transport. This reduces the need for grid reinforcement.
Table 3. Grid balancing dispatch algorithm in order of decreasing priority.
Components of GenerationComponents of Electricity Use
Uncontrolled generation (wind and solar), including extra solar PV to meet transport energy demandsConventional electricity demand, adjusted for imports and exports
Controlled generation (large hydro and biomass)
BEV Charging according to one of two profiles
Discharge stationary storage to meet immediate shortfall in electrical powerCharge stationary storage to fill the store. Store is sized to meet all shortfalls over the year
Remaining surplus used for electrolysis to make hydrogen
Remaining surplus above the power rating of the electrolysers is curtailed
Table 4. Power ratings and capacities of energy storage in each BEV charging scenario.
QuantityOff-Peak BEV ChargingDaytime BEV Charging
Energy Storage Capacity (GWh)42241319
Storage Max Charge Rate (GW)837240
Storage Max Discharge Rate (GW)383224
Electrolyser Power (GW)10501000
Publisher’s Note: MDPI stays neutral with regard to jurisdictional claims in published maps and institutional affiliations.

