1. Introduction
The physical properties of thin films are usually influenced by the presence of neighbor materials. This is often referred to as proximity effects, which are clearly seen in the onset of magnetic, superconducting and electrical properties of the thin films [
1,
2,
3]. The changes of physical properties are usually related to the influence of electronic structuretransformation and special physical properties arising from the composition. Understanding these effects is significant, not only for the fundamental studies, but also for their related technology applications. Hydrogen is one of the most technologically important energy carriers [
4]. Its storage is significant and has been extensively investigated in vanadium-based alloys [
5,
6]. Recently, it was found that the vanadium hydrides in the superlattices systems show a profound finite-size effect on the thermodynamic properties at only a few monolayers and has attracted people’s great attention [
5,
6]. The physical origin of the effect is argued to be the missing hydrogen neighbors in the interface of vanadium [
7]. The proximity effects, which may be related to the different composition in the neighbor layers through the electron transfers and other physical properties, are conceivable as well for the thermodynamic properties of hydrogen absorption. However, this is less explored so far. To optimize the hydrogen storage properties, it is interesting and important to completely understand the proximity effects from the neighbor materials on the thermodynamic properties of hydrogen absorption in materials.
Superlattices provide a unique possibility to explore the proximity effects since they can be grown with good crystal quality and with well-defined layer thickness as well as the composition [
8]. In the current work, Cr/V (001) superlattices are studied and compared to the previous results of Fe/V (001) superlattices [
5], in which the hydrogen prefers to reside in the vanadium layers. Cr and Fe have similar lattice parameters but different electron structure and magnetic properties [
9]. This provides a good model system for the study of proximity effects on hydrogen absorption, which can exclude the effect of lattice strain in the vanadium introduced by the adjacent layers.
The electrical properties of metal-hydrogen systems are of particular interest [
10,
11]. In principle, we treat a hydrogen atom as an impurity that can scatter electrons in e.g., vanadium hydride [
12]. Therefore, a resistiometric technique (a four-point probe technique) can be used to examine the thermodynamic properties of hydrogen in metals. Recently, this technique has been used to study the proximity effects on hydrogen absorption in nano-sized vanadium systems [
9]. However, the electrical properties in these systems are not only related to the hydrogen concentration, but also the hydrogen order or disorder states and the interface conditions. This thus brings challenges to the concentration determination and other related research for hydrogen in nano-sized systems. Light transmission can be used to measure the hydrogen content in nano-scale materials, which provides an opportunity for thermodynamic studies in these systems [
13]. This, combined with the four-point probe technique used to determine the electron scattering and hydrogen order or disorder states [
14], allows for clear clarification of proximity effects in the current superlattice systems. This would deepen our understanding of the influence of proximity effects on the hydrogen absorption in nano-sized metals and promote the application of metal hydrides as the hydrogen storage medial in industry.
2. Materials and Methods
Cr
n/V
7n (001) single crystal superlattices (n = 2, 3) are epitaxially grown on MgO at 620 K using D.C. magnetron sputtering at a base pressure of 3 × 10
−10 torr. The MgO is a polished single crystalline, with a size of 10 × 10 × 0.5 mm
3 in the current experiment. The lower-case numbers for Cr
n/V
7n superlattices represent the number of monolayers (ML) of each element. The number of repeats of the bilayers are 24 and 15 for Cr
2/V
14 (001) superlattices and Cr
3/V
21 (001) superlattices, assuring the same total thickness of the samples. They are capped with 5 nm thick palladium layers, which facilitate hydrogen dissociation and protect the sample from oxidation [
15]. The samples information can be found in the left upper corner of
Figure 1. The superlattices can be prepared with good quality in the lab [
9]. More detailed information about the sample growth and structure can be found in the reference [
16].
The experimental setup consists of an ultra-high vacuum chamber with two different pressure gauges (0–1 Torr and 1–1000 Torr). The samples are mounted on a ceramic holder inside the stainless-steel tube. The chamber has two quartz windows and is heated externally. Light transmission is used to detect the hydrogen content [
14], which can be converted from optical transmission using
, where
is the light transmission after hydrogenation while
is the light transmission before hydrogenation;
is the absorption coefficient that is calibrated through comparing the neutron characterization to light transmission on the same sample [
17]. A thermocouple is connected to the sample holder inside the chamber and is used to measure the sample temperature. The wavelength of the LED source is 639 nm and the electrical characterization is implemented with the four-point probe technique by a source meter. All these details can be found in
Figure 1. These conditions assure that the P-C-T and P-R-T isotherms of Cr
n/V
7n (001) superlattices (n = 2, 3) can be obtained accurately.
3. Results and Discussion
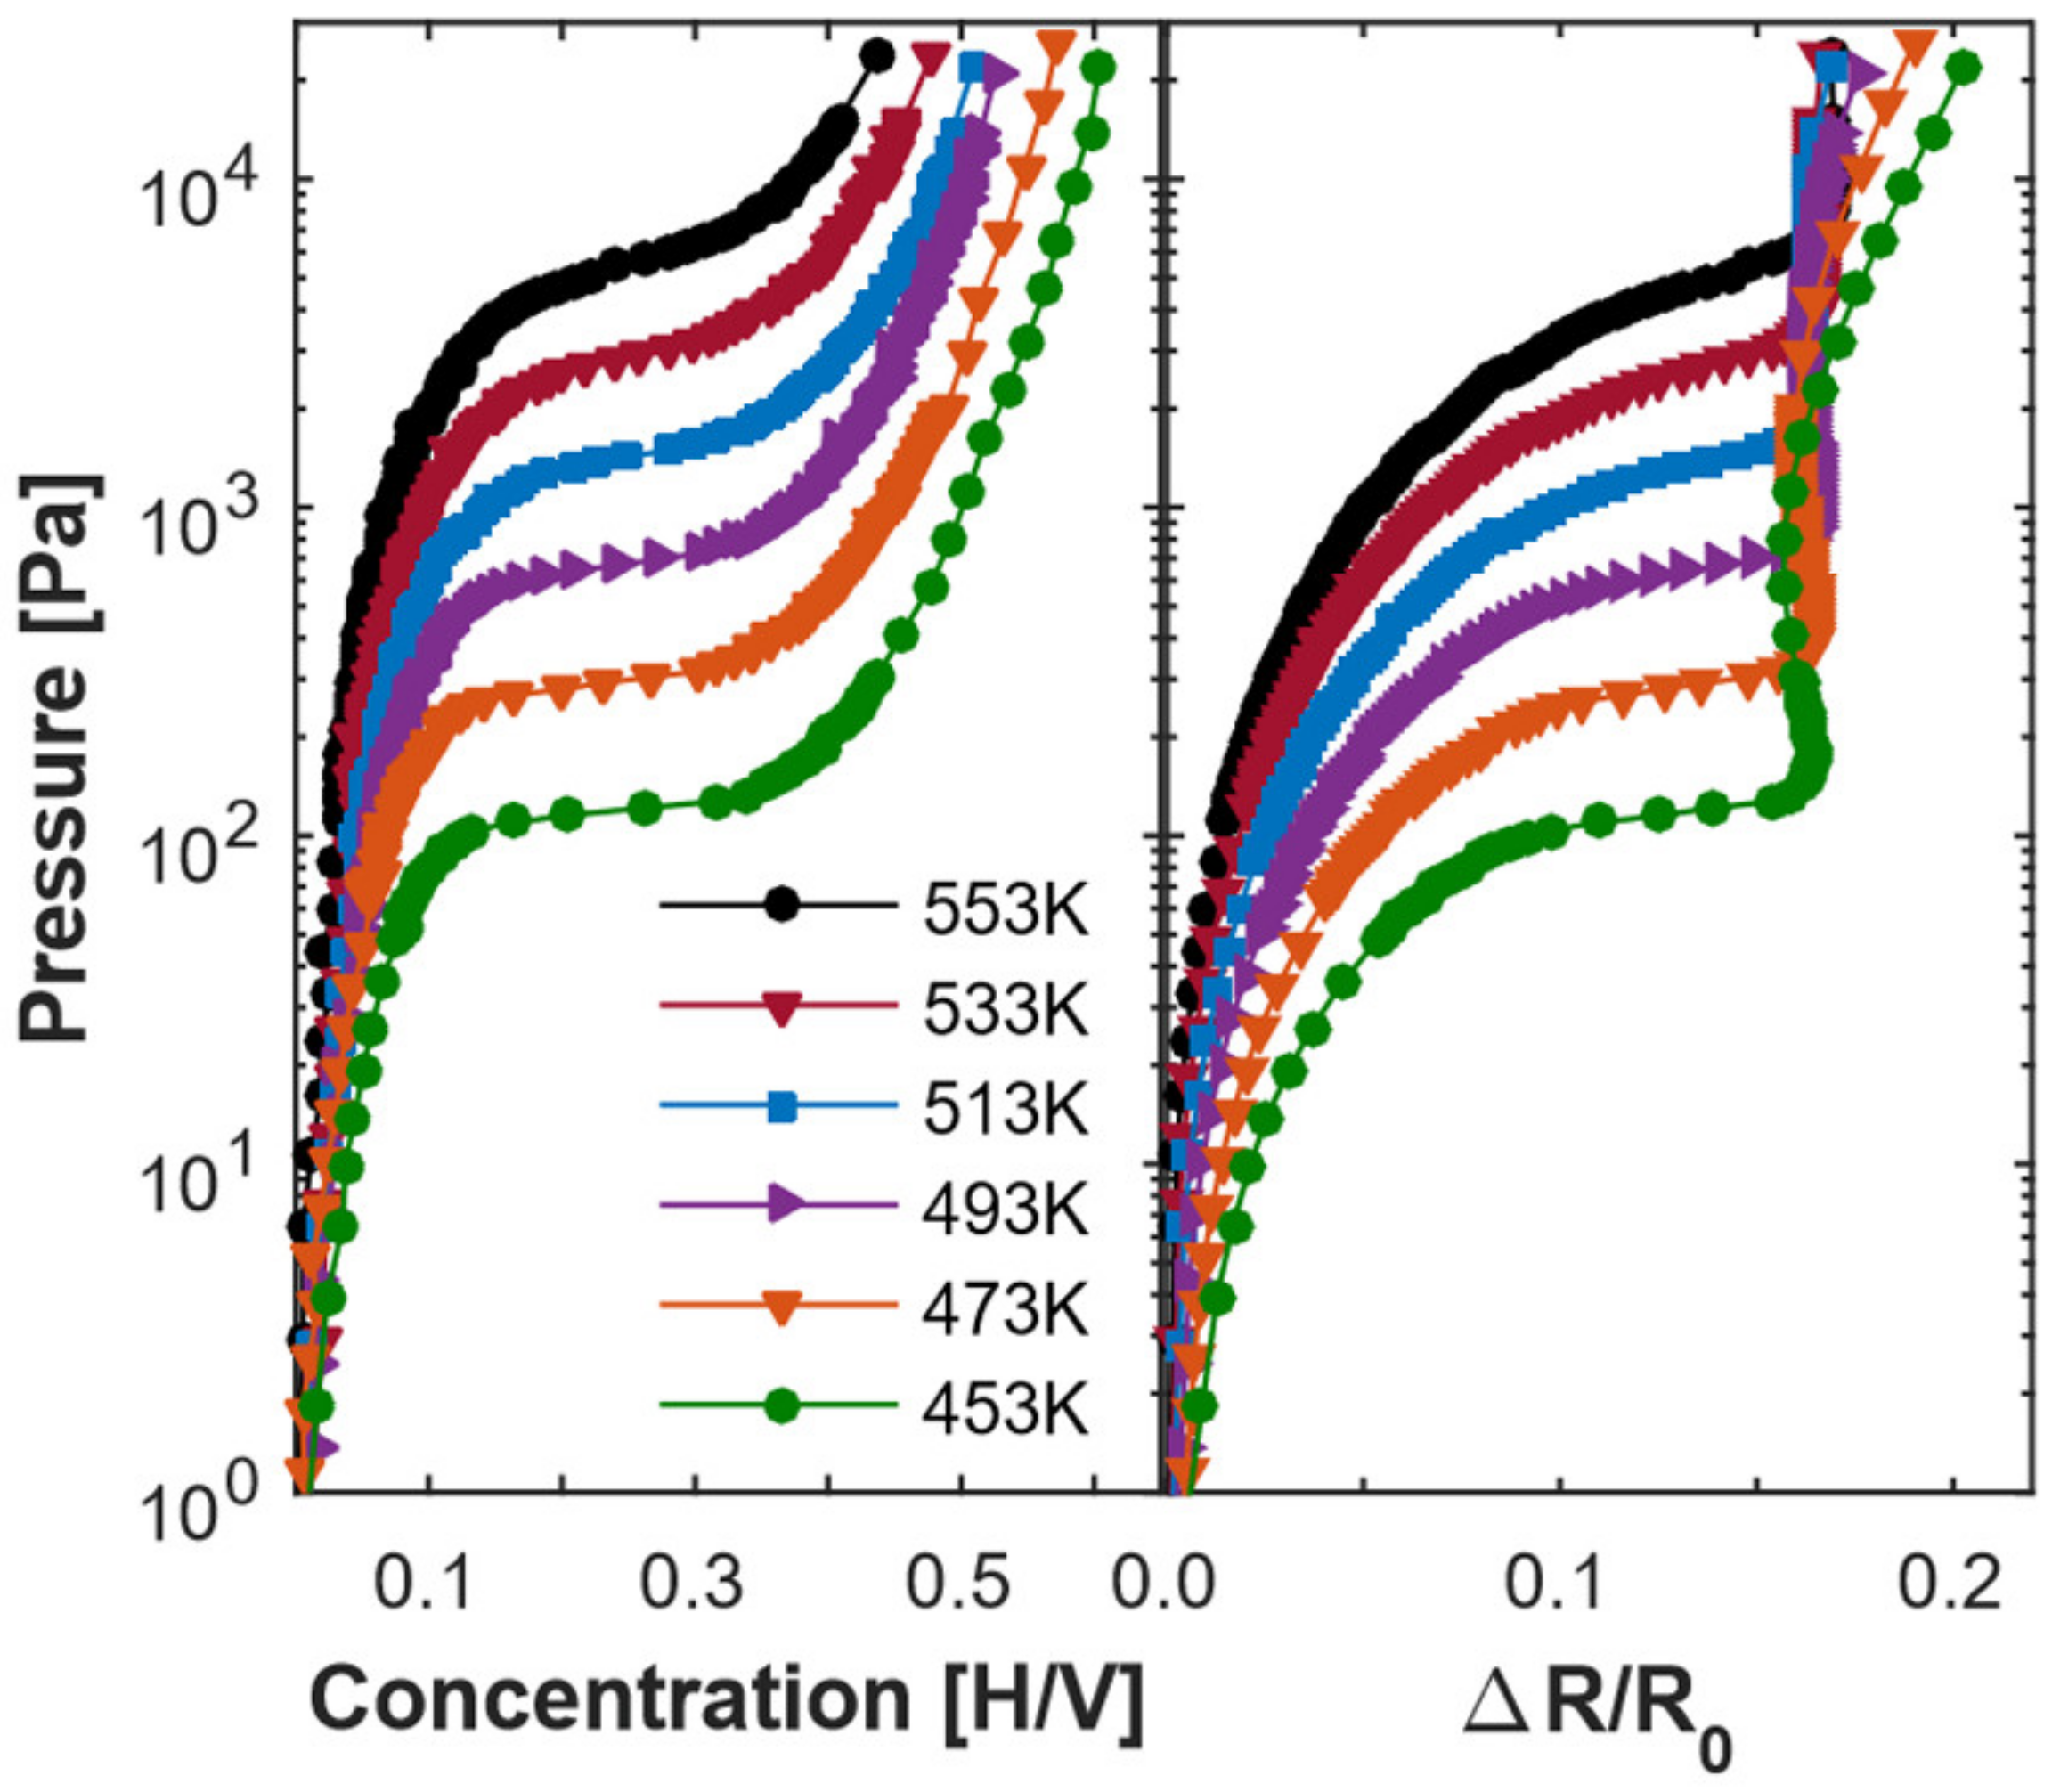
Figure 2 shows the isotherms of the Cr
3/V
21 superlattice. The measured temperature range for the isotherms is from 453 K to 553 K, which is above the phase transition temperatures and can avoid the crack of the samples. Each experimental data point is measured at chemical equilibrium and there is no hysteresis found, indicating that the loading and unloading are reversible [
18]. The chemical potentials
versus concentration at different temperatures are obtained through the equation
based on the interpolated P-C-T isotherms [
5], where
is a reference pressure of 1 bar.
Interpolation of the P-C-T isotherms are implemented by fitting the isotherms with a polynomial. The enthalpy
and entropy
are finally depicted for Cr
3/V
21 and Cr
2/V
14 superlattices through the Van’t Hoff method based on [
5]:
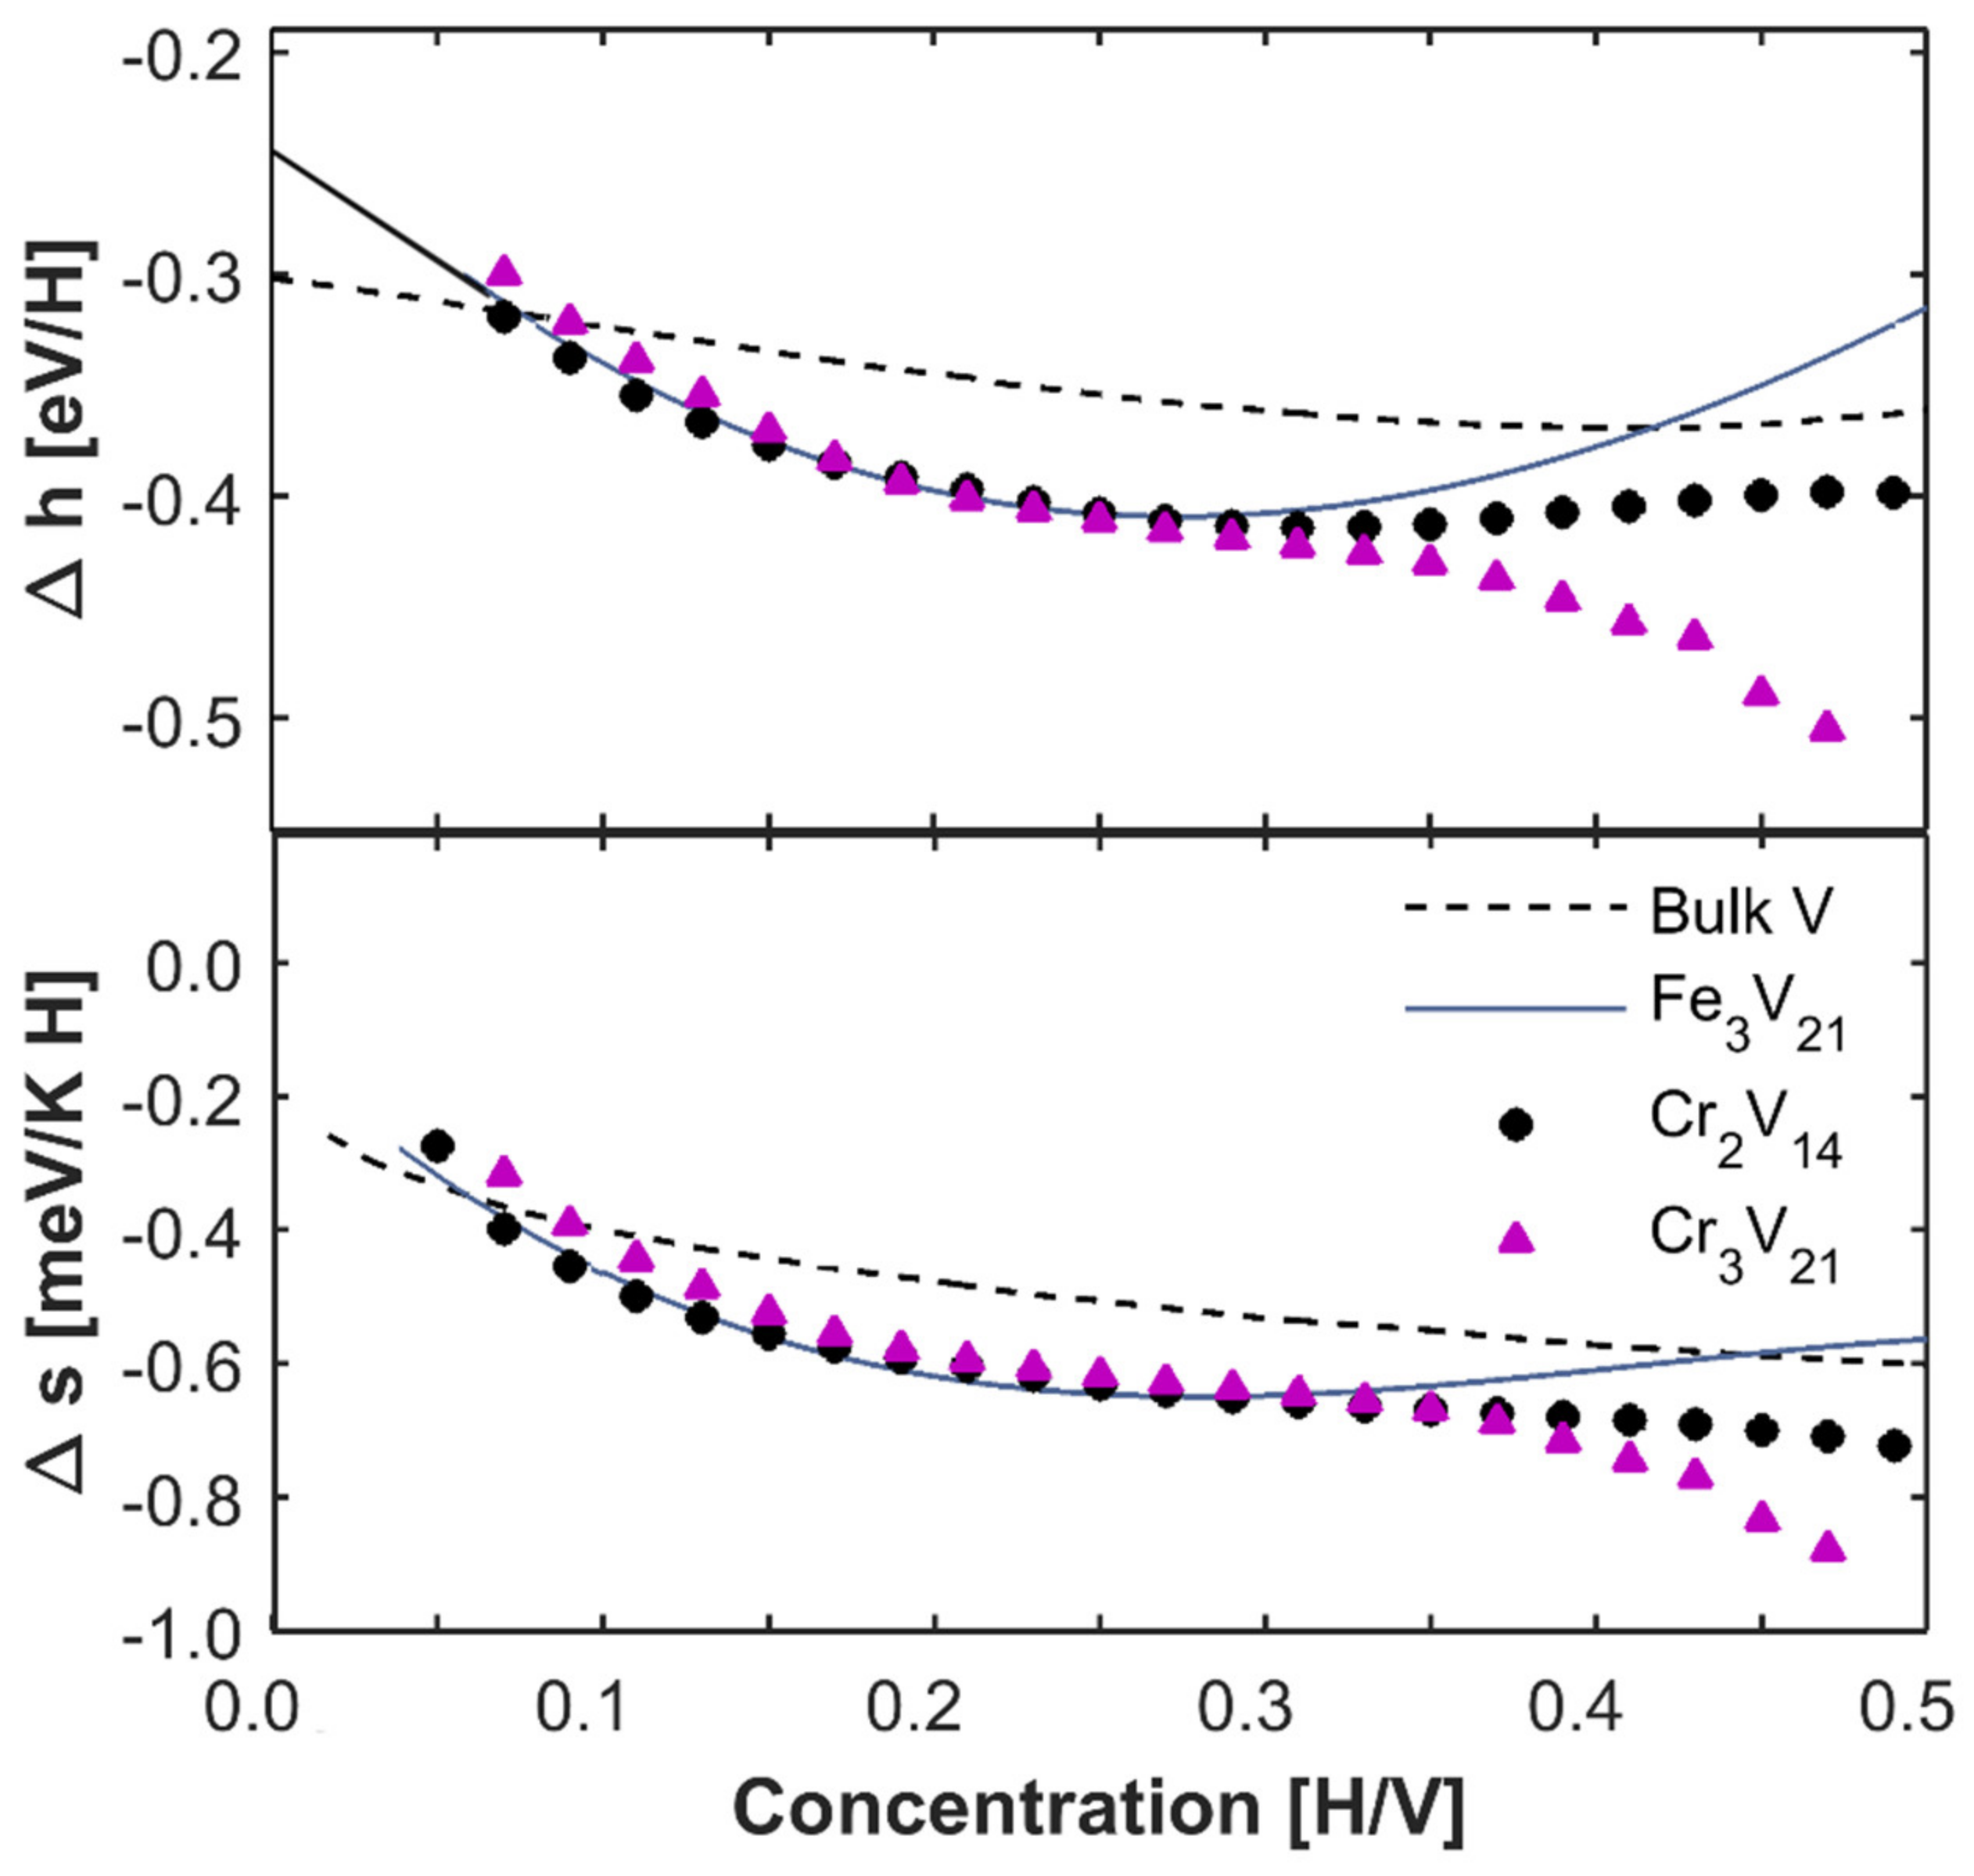
as can be shown in
Figure 3. Fe
3/V
21 superlattice and bulk vanadium results from the references are shown for comparison in the figure [
5,
19]. We can estimate the extrapolated binding energies of Fe/V and Cr/V superlattices are ~−0.24 eV from the figure if we make a linear extrapolation at low concentrations (black line) in
Figure 3. This value is consistent with the previous results [
5]. The binding energy is similar for both superlattices but smaller compared to the bulk vanadium (~−0.3 eV). This is expected since the superlattices are clamped to the substrate and compressed in the plane of the interface. The smaller lattice parameter of Fe (0.286 nm) and Cr (0.291 nm) compared to vanadium (0.303 nm) maintains in-plane stress throughout the whole thickness of the film. This results in an increased electron density of the vanadium and then reduces the binding energy according to the effective medium theory [
5,
20]. We should mention that lattice parameters of Cr and Fe are similar, leading to octahedral site occupancy and similar binding energies in both superlattices. Besides, the enthalpy and entropy of Cr/V (001) superlattices are negatively larger than Fe/V (001) superlattices at high concentrations, indicating different hydrogen-hydrogen interaction in these superlattices. Specifically, the interaction is attractive in Cr
3/V
21 superlattice while repulsive in Fe
3/V
21 superlattice at high concentrations.
Spinodal temperatures (
) are obtained when the derivatives of the chemical potential versus concentration (
) are extrapolated to be zero. In general, the achieved temperature range in the experiment is always larger than
. The aim is to avoid the instability near the phase transition region and prevent it from cracking or peeling off the substrate. The spinodal lines of
versus concentration for different superlattices are plotted in
Figure 4. It is clearly seen that the phase transition temperature changes with vanadium layer thickness as well as with the sample composition. The critical temperature can be determined at the point where:
This condition is fulfilled at the maxima of the black line symbolizing the spinodal temperatures in
Figure 4.
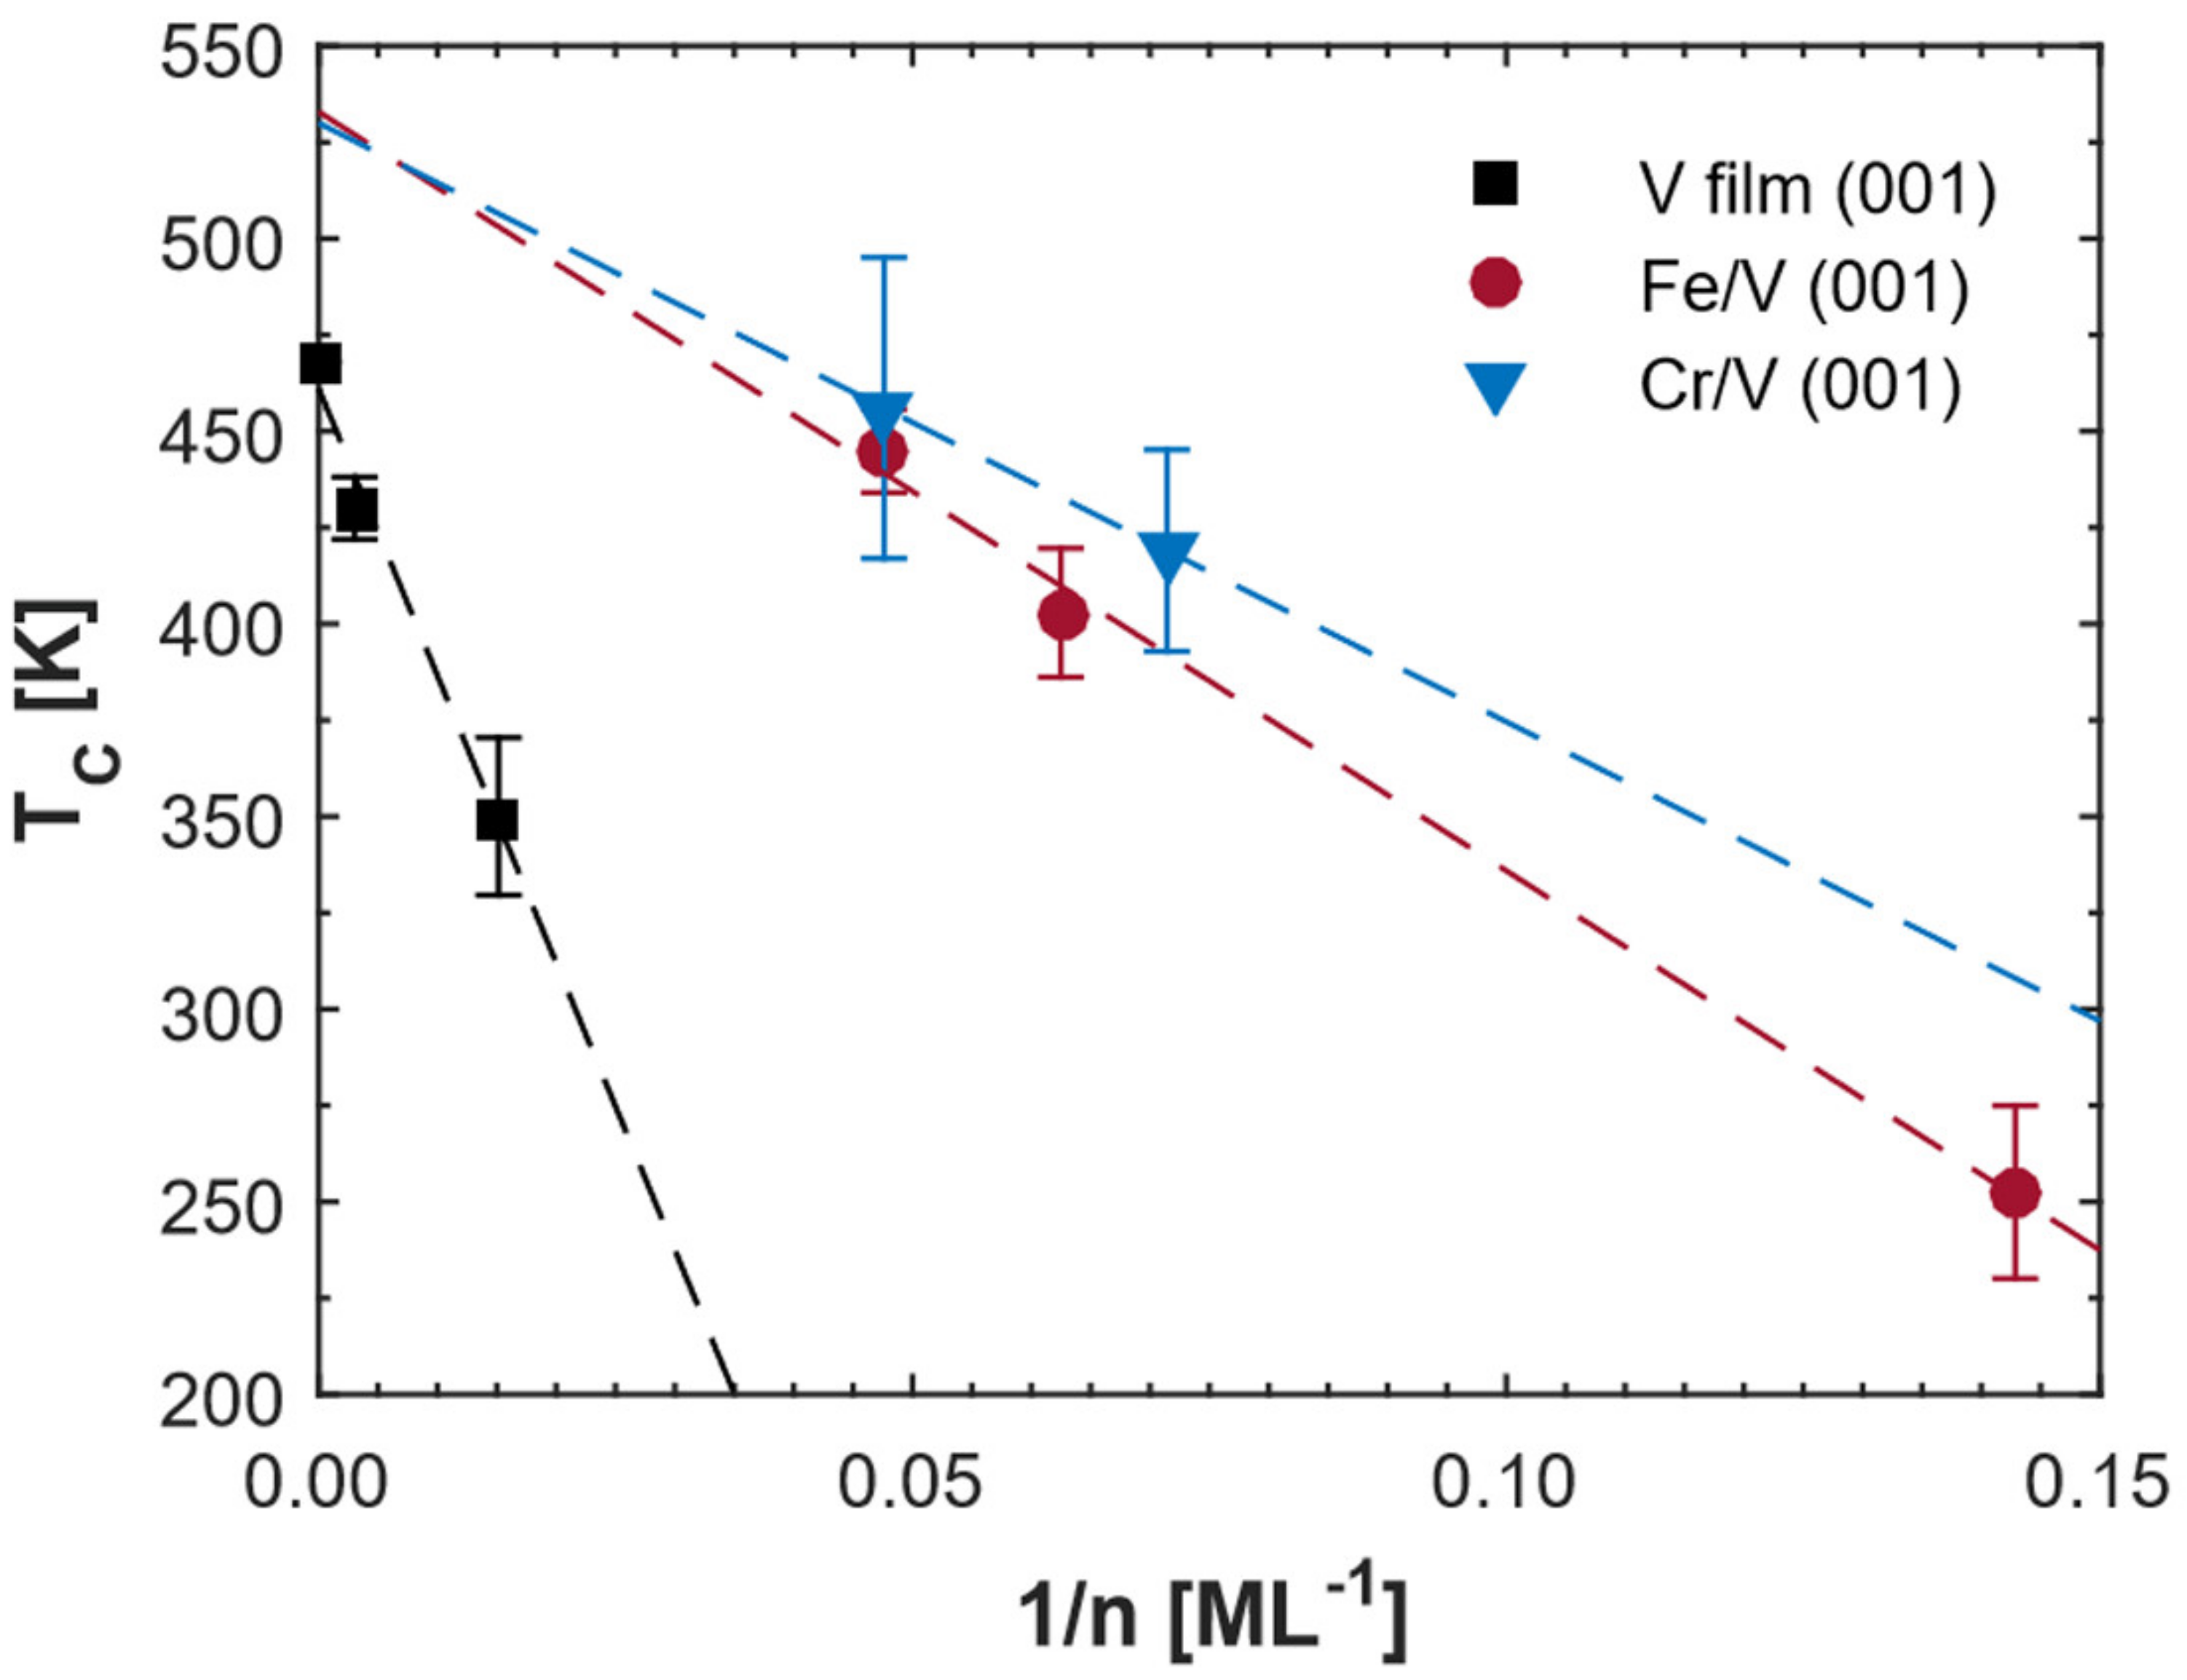
Figure 5 shows the obtained critical temperatures of the samples. Fe/V (001) superlattices and vanadium films results from the reference are shown for comparison [
5]. It is found that the critical temperature is lower for smaller atomic layers number (n) of vanadium (Cr
2V
14 superlattice) as compared to that in Cr
3V
21 superlattice. This phenomenon is the same as in the vanadium films and Fe/V superlattices, which is argued to be due to the missing hydrogen neighbors in vanadium layers, leading to the decrease in hydrogen-hydrogen interactions and critical temperatures versus
[
5]. Therefore, if we assume the critical temperatures follow
for Cr/V superlattices as well, the critical temperature extrapolated for infinite film thickness of vanadium is similar (~530 K) for Cr/V and Fe/V superlattices as can be seen in
Figure 5. This is understandable since they have similar strain states as discussed above in both samples. We would like to mention that one additional experiment for extracting the critical temperature is expected in the future to prove the linear relation of critical temperature versus
for the Cr/V superlattices.
The extrapolated critical temperature for infinite film thickness is different between superlattices and thin films (~461 K). The superlattices are clamped to the substrate and tetragonally distorted. This distortion results in an octahedral site occupancy of hydrogen [
21] and a polarized strain field or polaron, which leads to a difference in hydrogen-hydrogen interactions in these systems. In the superlattices, Cr and Fe have almost the same lattice parameters and as a result, the tetragonal distortion is almost the same. However, the slope of the critical temperature versus
for the Cr/V superlattices is smaller than that of Fe/V superlattices as shown in
Figure 5. This means that the critical temperature of the Cr/V superlattices is larger than the Fe/V superlattices when their number of atomic layers of vanadium is identical. We should mention that the hydrogen dead layers near the Fe or Cr interfaces need to be taken into account for the finite size effects on the critical temperature model and the width of the dead layers can be extracted through the linear fit in
Figure 5 when
is 0 K [
5]. The obtained numbers of dead layers are ~1.4 and ~1 respectively for the Fe/V superlattices and the Cr/V superlattices, respectively. We find thinner dead layers for the Cr/V superlattices, which is consistent with a larger critical temperature and larger hydrogen-hydrogen interaction in Cr/V (001) superlattices. Although the error bar for the dead layers of both samples is large (~0.8), the obtained result is consistent with the observation of a clear minimum (bright blue areas) region for the resistivity change for Cr
3/V
21 superlattice, indicating an order state. However, this is only observed for Fe
3/V
21 superlattice in very low-temperature ranges, which emphasizes the importance of proximity effects for controlling thermodynamic properties in vanadium-based alloy systems (shown in panels b and c of
Figure 4). This proximity effect could play the same role as the size effects hydrogen absorption, which could be verified through the absence of the minimum region (order state) for the resistivity changes in Cr/V (001) superlattices when the number of vanadium layers decreases from 21 to 14 from the contour map in
Figure 4.
The observed proximity effects could be related to the changes in the width of the dead layers at the interfaces. The dead layers in the superlattices were argued to be caused by the mechanical clamping of the rigid layers, implying high energy costs for lattice expansion at the interfaces of vanadium [
22]. However, the dead layer’s width of Cr/V superlattices is smaller than Fe/V superlattices, which is in contradiction with the fact that hardness of Cr is much greater than Fe [
23]. This means that screening of the interface layers for the volume expansion discussed in the work of Mirbt et al. [
22] can’t be used for explaining the existence of dead layers. Charge transfer was pointed out for explaining the hydrogen dead layers, due to the changes of the electron density at the interfaces [
24]. The work functions of Cr and Fe are both ~4.5 eV, which is higher than V (~4.3 eV) [
25]. This means that electrons would diffuse from V to Cr or Fe when the heterojunction is formed, leading to a decrease of electron density at the interfaces of vanadium, where hydrogen would then prefer to reside based on the effective medium theory. However, the experimental observation of the dead layers in the interfaces of vanadium was found [
7] and this indicates that charge transfer can’t explain this phenomenon. As is known to us, Fe has two more valence electrons than Cr and exhibits ferromagnetic properties in the bulk while Cr presents antiferromagnetism at room temperature. We argue that this difference may lead to stronger proximity effects and wider dead layers in Fe/V (001) superlattices. Future work is suggested to focus on examining the effect of spin polarization on the dead layer’s width of these systems from the calculation angles.
Apart from the effect of hydrogen-hydrogen interactions on the electrical properties discussed above, interface scattering could be considered in the understanding of electrical property changes in metal-hydrogen systems [
3]. The 50 nm film data shown in panel d of
Figure 4 shows a pronounced maximum resistivity area at concentrations around 0.3 [H/V]. This is very close to the bulk phase diagram. However, this seems to become suppressed for very thin films due to the finite size effects, which may be related to the changes of hydrogen-hydrogen interaction and interface scattering. As can be seen in
Figure 6, we compare the excess resistivity in Cr
3/V
21 and Fe
3/V
21 superlattices such as at temperatures 533 K and 523 K respectively. We observed that the excess resistivity of Fe
3/V
21 is larger than Cr
3/V
21 even though the temperature for Cr
3/V
21 is 10 K higher than that of Fe
3/V
21. The excess resistivity in the superlattices includes two terms [
3]:
where
is the hydrogen concentration,
the total resistivity of the superlattices with hydrogen,
the superlattices resistivity without hydrogen,
the resistivity induced by the hydrogen and
the resistivity contributed by interface scattering at different hydrogen concentrations. The temperatures of 523 K and 533 K are far away from the phase transition region for both samples. This means that the magnitudes of hydrogen order or disorder states could be excluded from the observed effects. Therefore, interface scattering from the proximity effects may play a main contribution to the observed difference in the excess resistivity. However, we should mention that it is difficult for the interface scattering to change the sign of the slope of resistivity versus the hydrogen concentration in the nano-size systems. Therefore, the electron scattering still can provide valuable information for the hydrogen order or disorder states by observing the sign of the resistivity changes in these systems.


