1. Introduction
Modern society has a strong sensitivity to and understanding of environmental issues in terms of the external environment, where the problems are visible. As for the indoor environment, however, the problems are not so noticeable and not alarming, although the quality of the indoor environment determines the comfort, performance, and health of the occupants [
1,
2,
3]. It is worth noting that in modern urban conditions, people spend 90% of their time indoors [
4,
5]: in their homes, in the office, in vehicles, in the theatre, etc.
People are the main reason for the deterioration of the quality of the indoor environment and, above all, indoor air quality (IAQ) [
6,
7]. They determine the presence of different pollutants in indoor air with their decisions regarding construction materials, interior products, and building systems: heating, ventilation and air conditioning (HVAC), electrical, and water supply. In addition to this, people deteriorate the air quality in the space they occupy (i.e., pollute the indoor air) by their presence due to the continuous physiological processes of metabolism in their bodies [
8].
Respiration, the process of gas exchange in the lungs, supports the metabolic process of converting nutrients within the body cells to energy. It is a type of heterotrophic metabolism, as respiration uses oxygen (O
2) and produces carbon dioxide (CO
2) due to cellular respiration [
9]. The reaction involves O
2 and glucose (C
6H
12O
6) from the ingested nutrients and leads to energy production in the form of adenosine triphosphate (ATP) [
10]:
Thirty-eight moles of energy (ATP) are produced from the oxidation of one mole of glucose, and this energy is used for all metabolic activities on a cellular level [
9]. Thus, respiration is one of the key ways the cell provides chemical energy to nourish cellular activity.
The human metabolic rate depends on many factors, including environmental conditions. The minimum metabolic rate of a dressed, fasting person at rest was established for an air temperature of 30 °C [
11]. With identical settings (dressed, resting person), the human metabolic rate at 18 °C was assessed to be 15% higher than at 28 °C [
11]. Therefore, it can be expected that the generation of metabolic CO
2 (or exhaled CO
2) at 18 °C would vary from the generation of metabolic CO
2 at 28 °C because of the temperature of the environment (though other conditions could influence it as well). It can also be supposed that the exhaled CO
2 at 28 °C will be higher than at 23 °C due to a higher metabolic rate.
However, the EN 16798-1:2019 standard [
12] for the energy performance of buildings stipulates that the operative temperature indoors may vary from 18 °C to 28 °C during the whole year, so the indoor environment to be assessed falls within Category IV (the worst category in the standard). The standard does not account for the difference in CO
2 generation due to human respiration within this temperature interval.
The effect of extreme air temperatures on human metabolism has been researched in several studies. Cold-induced changes in metabolism have been investigated in [
13,
14]. It was proven that the metabolic rate in a cold environment increased to boost heat production [
15]. The effect of a hot environment on human metabolism has also been a subject of research [
16,
17,
18]. However, the influence of the standard operative temperature (from 18 °C to 28 °C) prescribed by EN 16798-1:2019 on metabolic or exhaled CO
2 has not been studied. It should also be mentioned that the usual approaches for evaluation of the CO
2 emission rate by people, as stated in ISO 8996:2004 [
19] and ASTM D6245-2018 [
20], exclusively connect the human CO
2 emission rate to the human metabolic rate [
21].
The EN 16798-1:2019 standard specifies the requirements for the thermal environment in non-industrial buildings, where the air temperature has no extreme values. However, some differences exist in non-industrial environments, which should be pointed out in the light of the metabolic activity and CO2 generation of the occupants:
In working environments, people are exposed to both job and environmental stresses. Many workplaces are open, and the office workers are under continuous noise exposure and loss-of-privacy stress [
22].
In residential environments, people usually feel more comfortable than in any other place, even if the thermal environment does not correspond to the requirements of the standards. Apart from the fact that there are purely psychological reasons related to the reduction of stress and relaxation at home, a significant cause of this comfort is that the residents are free to take adaptive measures: to adjust their clothing, to drink cold or hot beverages, to open the windows or block the air infiltration through them, and to change their activity [
23,
24].
In learning environments, the stress-induced metabolic increment can be as high as in the working environment. The reason is that students are under the pressure of a highly competitive atmosphere with raised expectations and standards [
25,
26].
In healthcare environments, the interest in “patient-centred design” of facilities is constantly increasing [
27,
28]. In addition to case studies on hospitals’ thermal environments in different countries with specific outdoor environments [
29,
30,
31], a designer assessment method has been proposed [
32].
Our study presents results from the investigation of the influence of indoor air temperature on the concentration of exhaled CO2. Our literature survey showed a lack of a similar investigation till today. The investigation had two phases. The first phase involved a measurement in a university classroom of the Technical University of Sofia with an installed HVAC system during regular classes at two different air temperatures (23 °C and 27 °C). After the results from the first phase, a second phase was performed: a measurement in a specially designed small climate chamber at the Technical University of Sofia, where the time variation of the CO2 concentration, together with some physiological parameters, were measured at the same air temperatures (23 °C and 27 °C).
In the next section, the overall methodology of the two phases of the study is introduced. The results from the measurements are graphically presented, and the respective statistical analyses and additional data processing are summarized in
Section 3. The results, the importance of the findings, and possible limitations of the methodology in the performed study are commented on in
Section 4. Finally, concluding remarks, future directions for research, and the list of personal contributions of the authors are given.
2. Methods
This section describes the experimental phases and the testing enclosures—the case study classroom and the climate chamber. The testing instruments used in the measurements are described. The measuring protocol, followed in the two phases of the study, is presented in detail to allow repeatability of the experiments. The statistical analysis tools are also described.
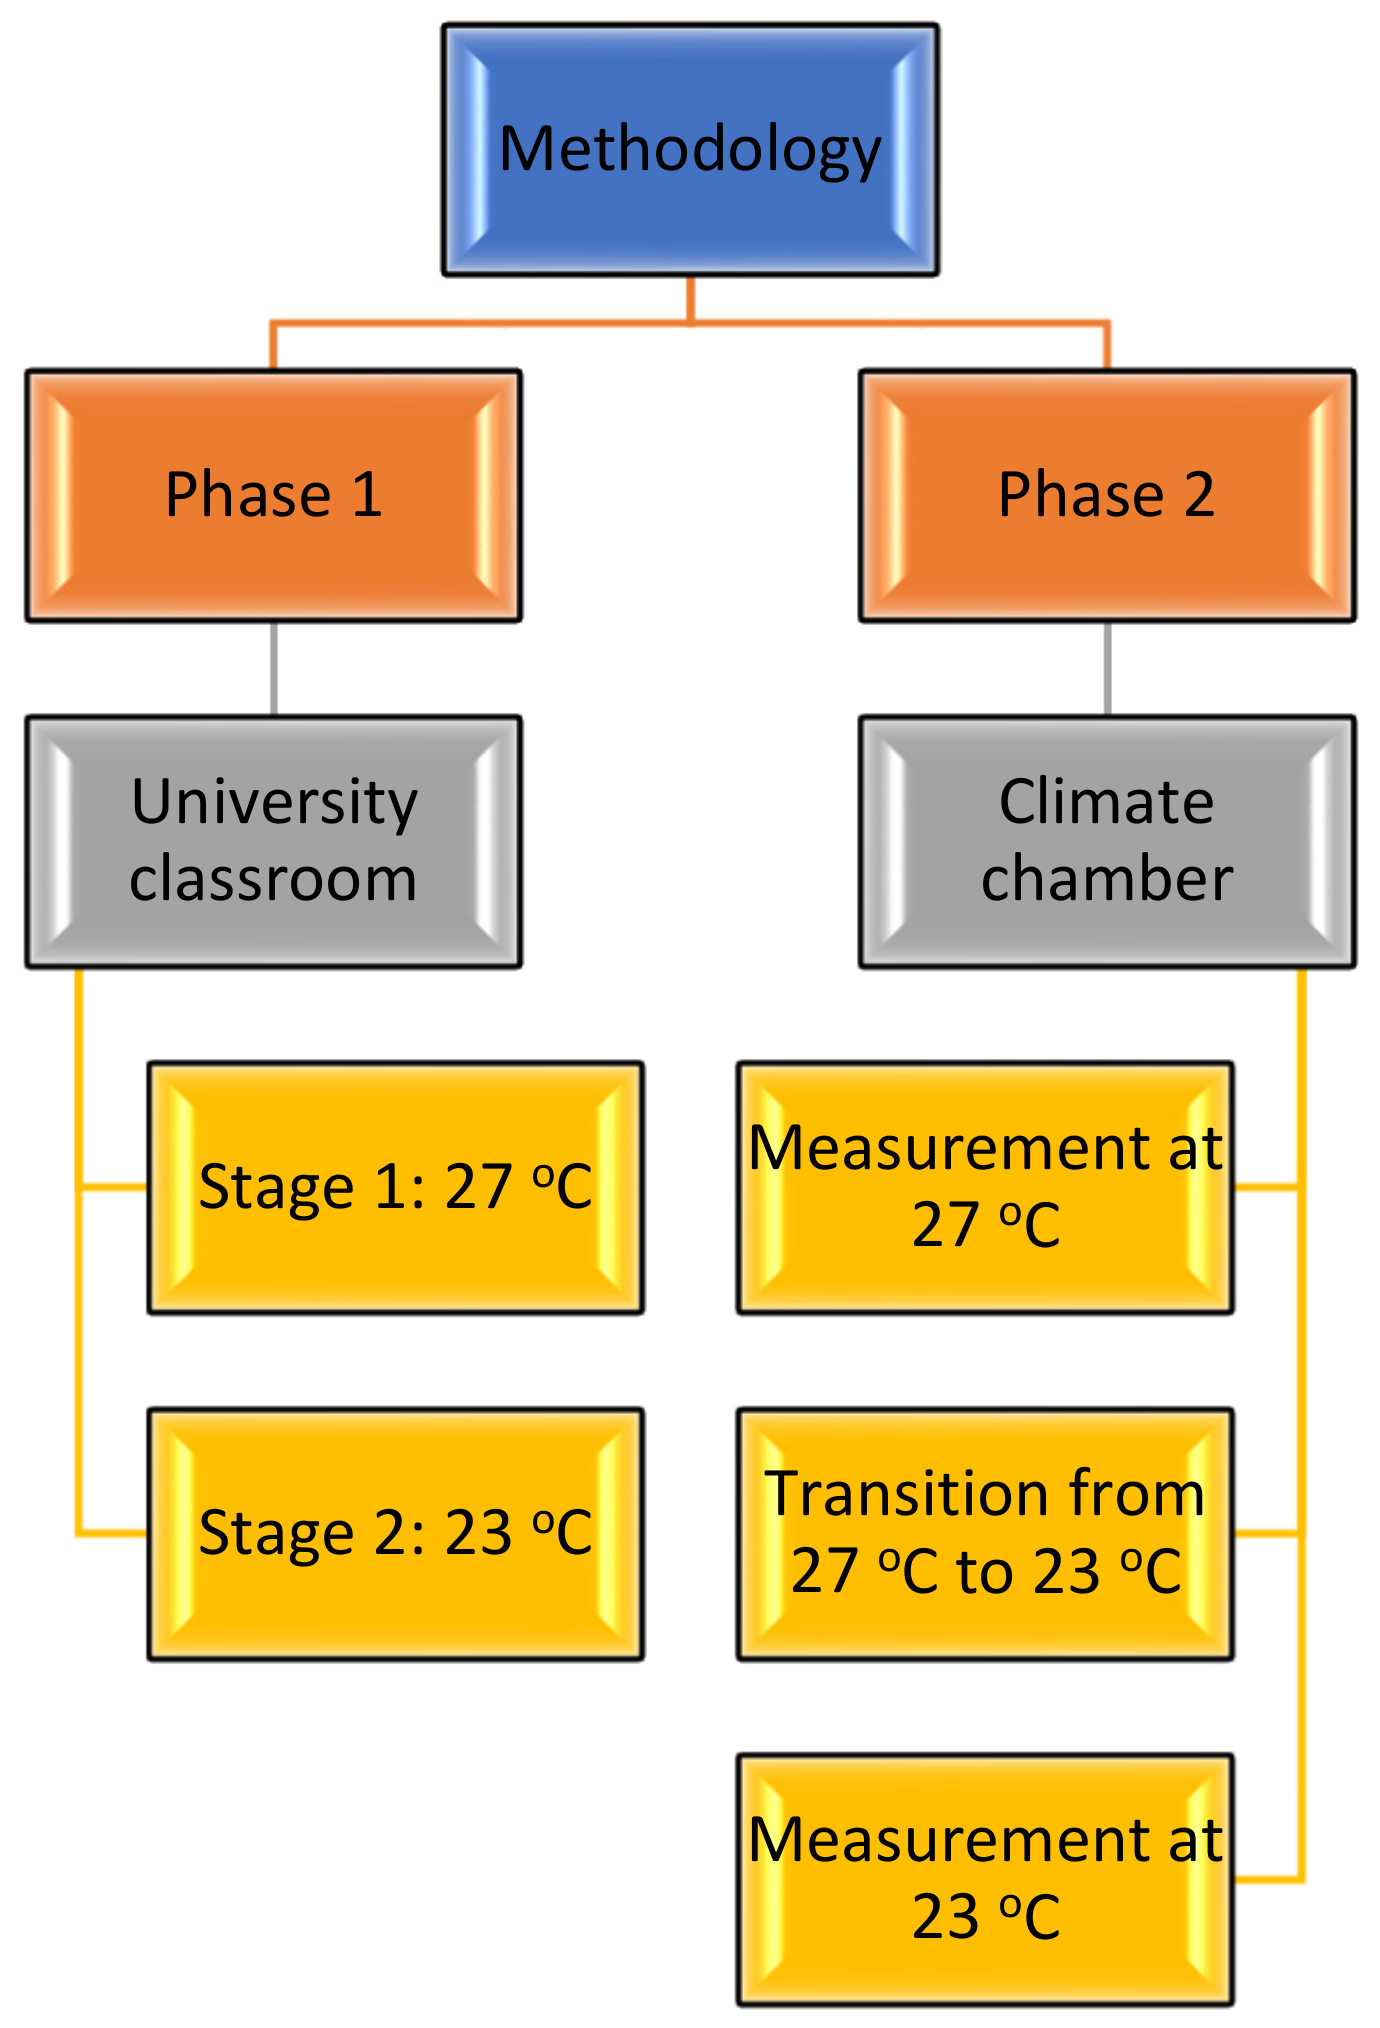
Our investigation involved two phases, as described in
Figure 1. The first phase was performed in a university classroom with an installed HVAC system. Having the results from the first phase, which showed the effect of the temperature on the accumulation of CO
2 in the classroom, we decided to perform more sophisticated measurement on the exhaled CO
2 of a single person, under the same temperature conditions. Thus, the second phase involved measurements in a small climate chamber. Two room air temperatures were investigated: 23 °C and 27 °C. The reasons for the selection of these values were the suggestions for room air temperature in heating and cooling mode in [
33,
34], also recently commented on in [
35].
2.1. Testing Enclosures
2.1.1. Classroom
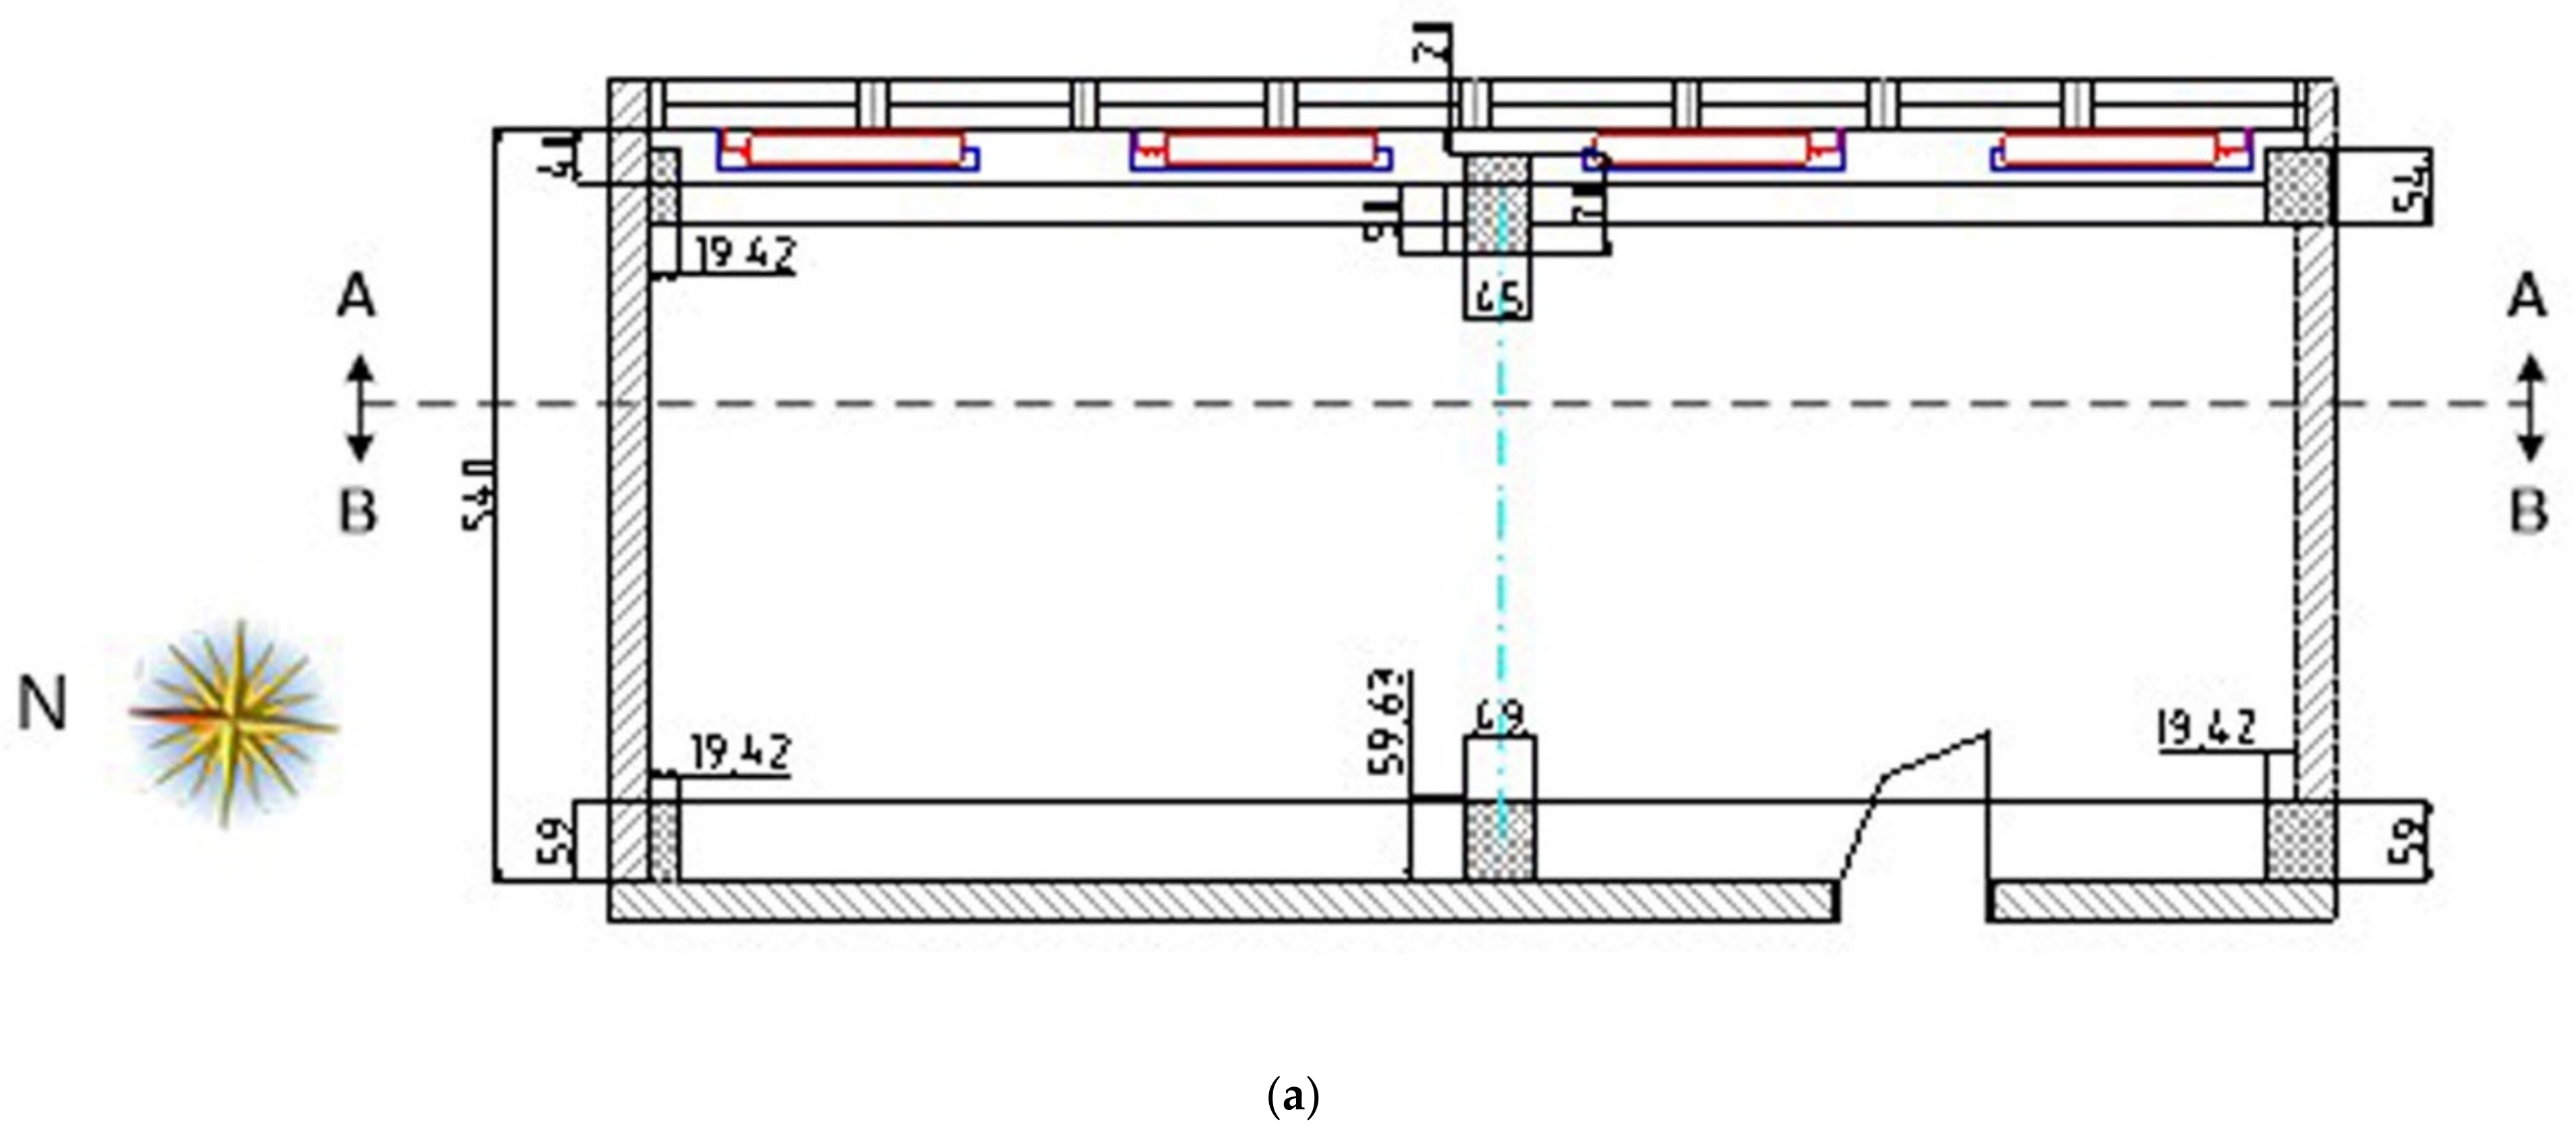
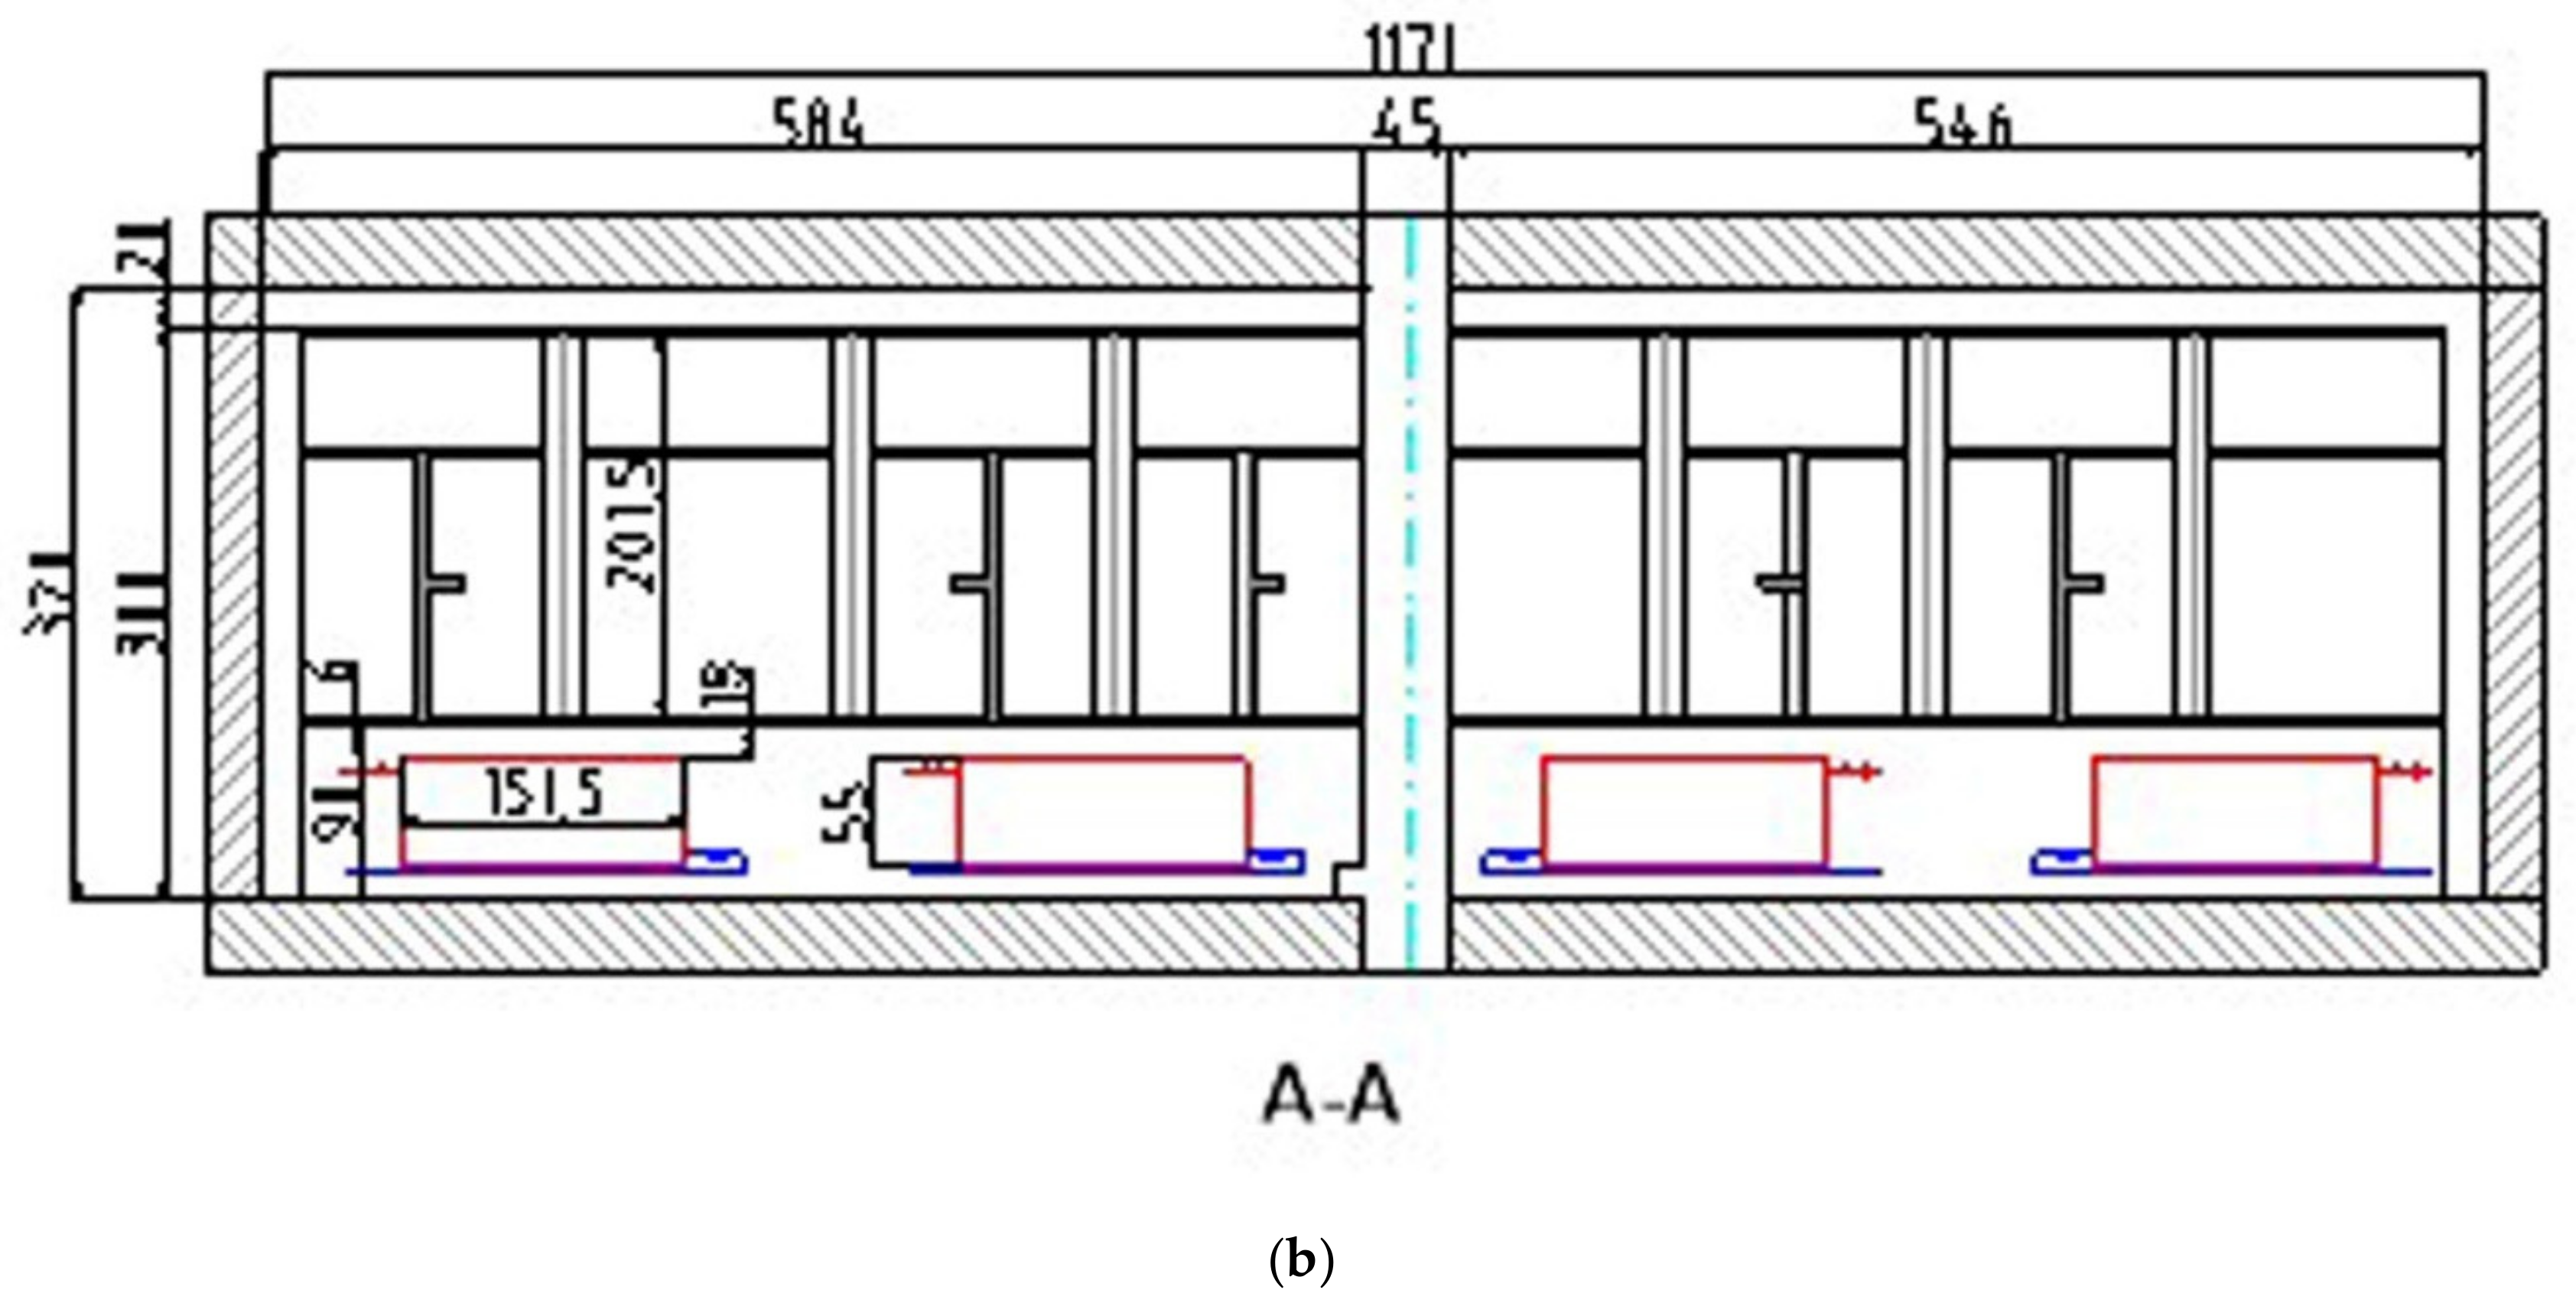
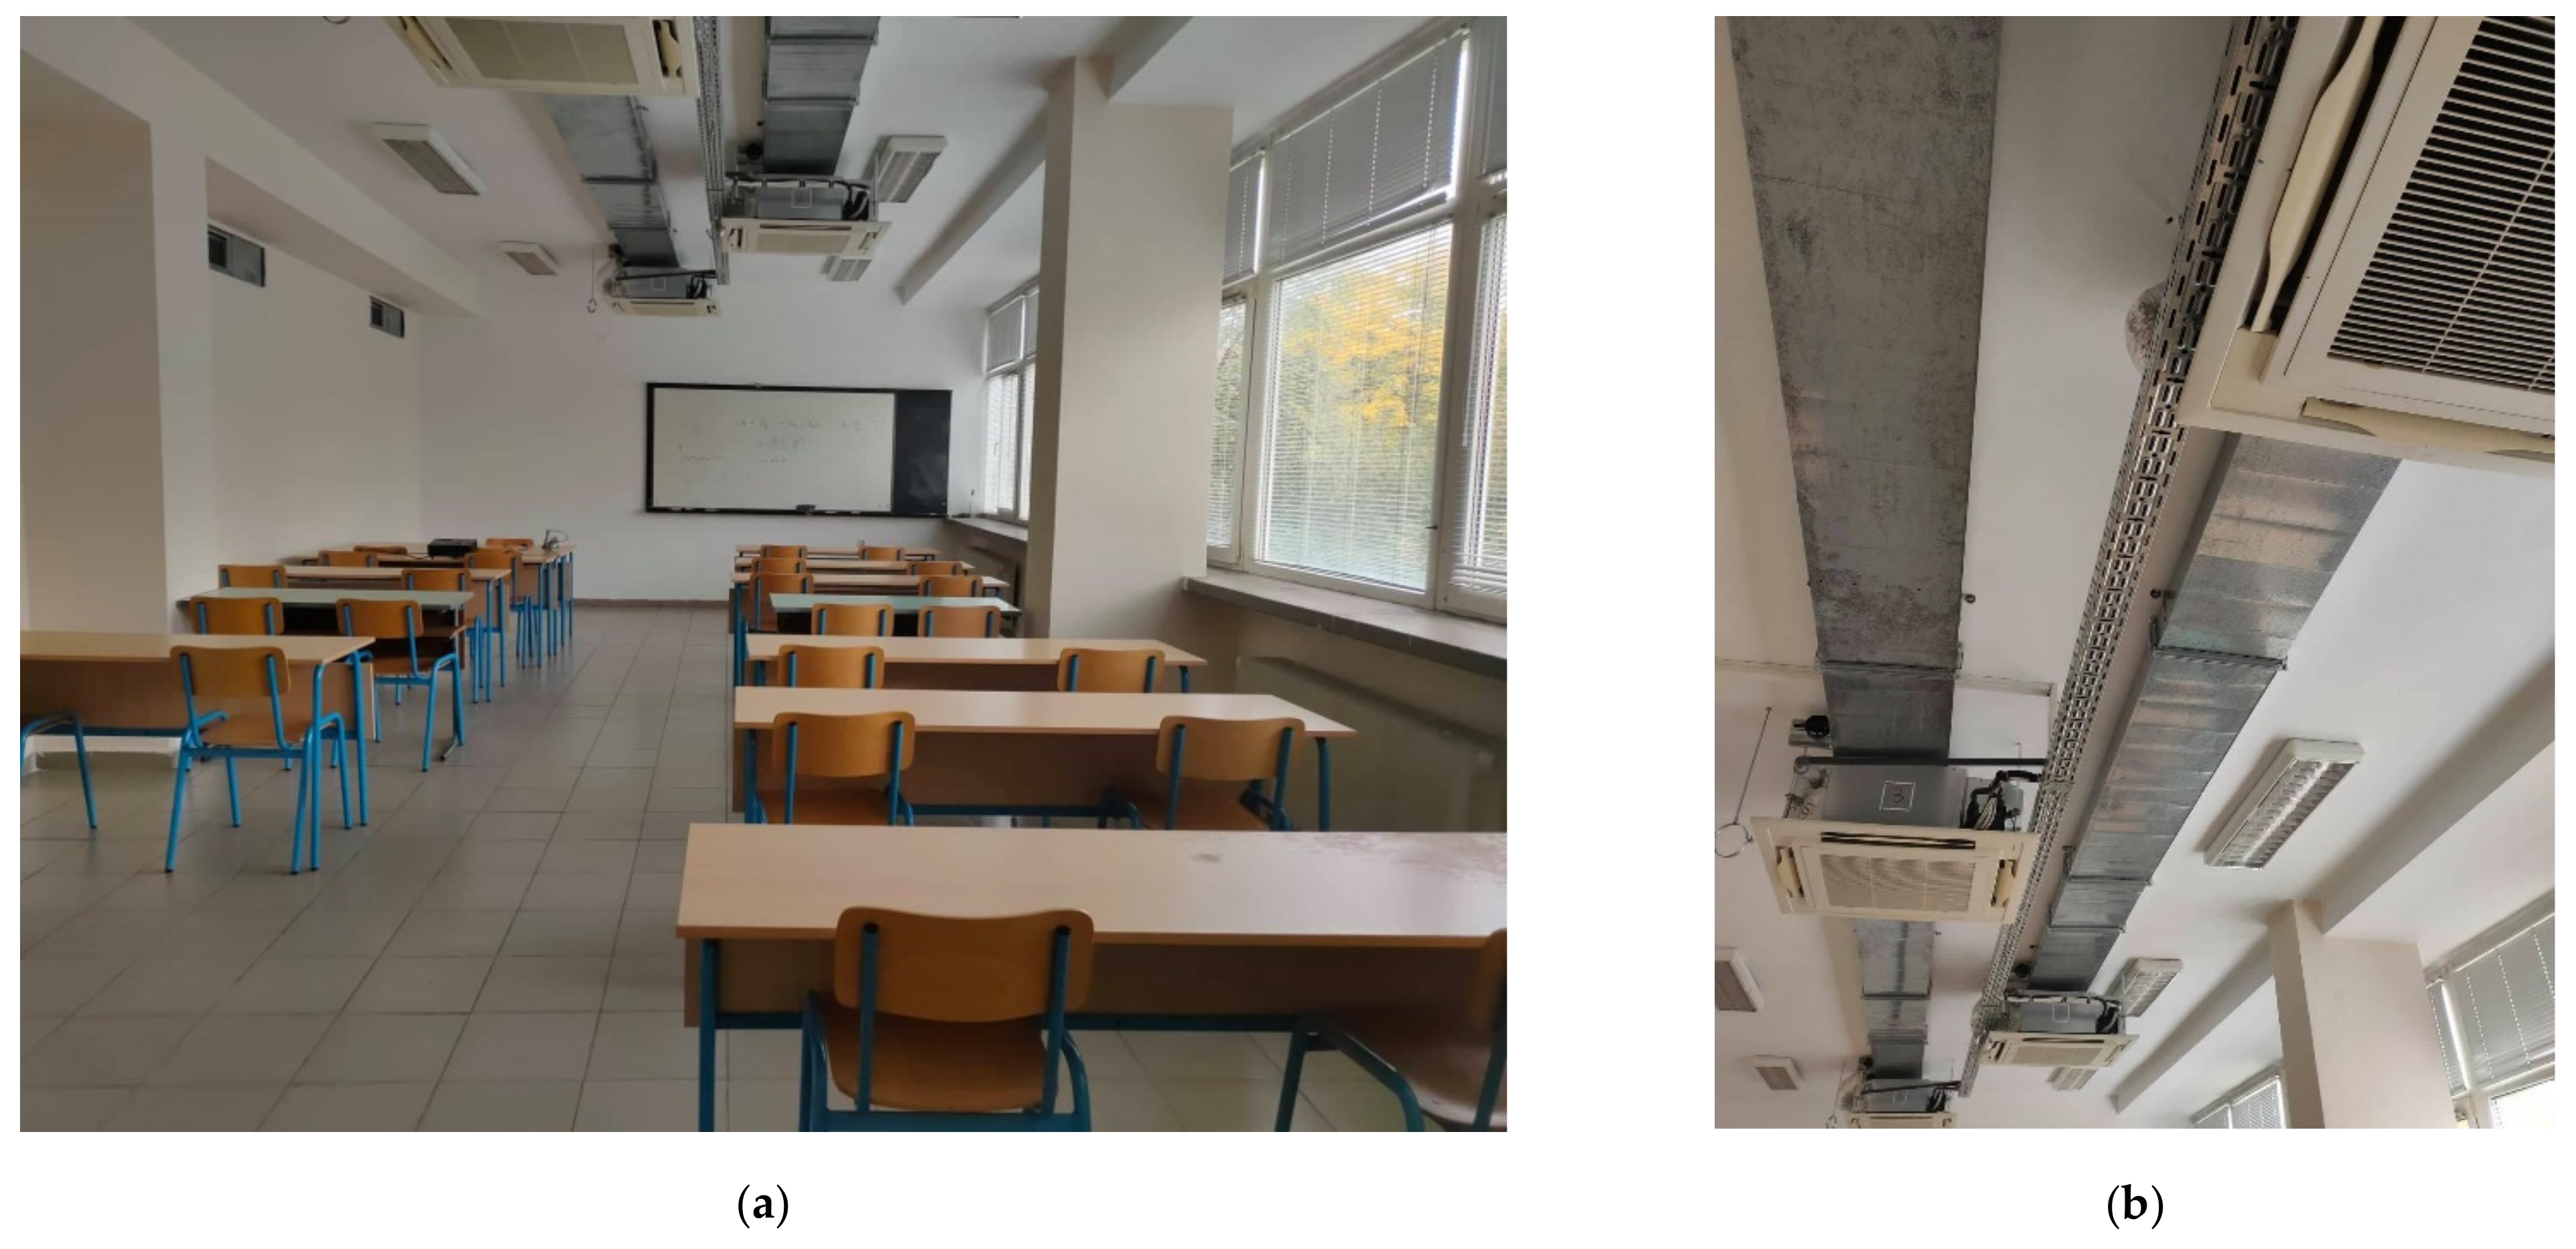
The case study classroom’s geometry is shown in
Figure 2. The volume of the classroom is 204 m
3 (11.8 × 5.4 × 3.2 m). The classroom is in Building 2 of the Technical University of Sofia. The outer wall of the building is 30 cm thick, covered with 6 cm of thermal insulation.
Figure 3 presents the installed HVAC system in the classroom. Four recirculation convectors, type TOSHIBA MMU-AP0092H (4-way cassette-type air conditioner), are used to maintain the parameters of the indoor environment.
2.1.2. Climate Chamber
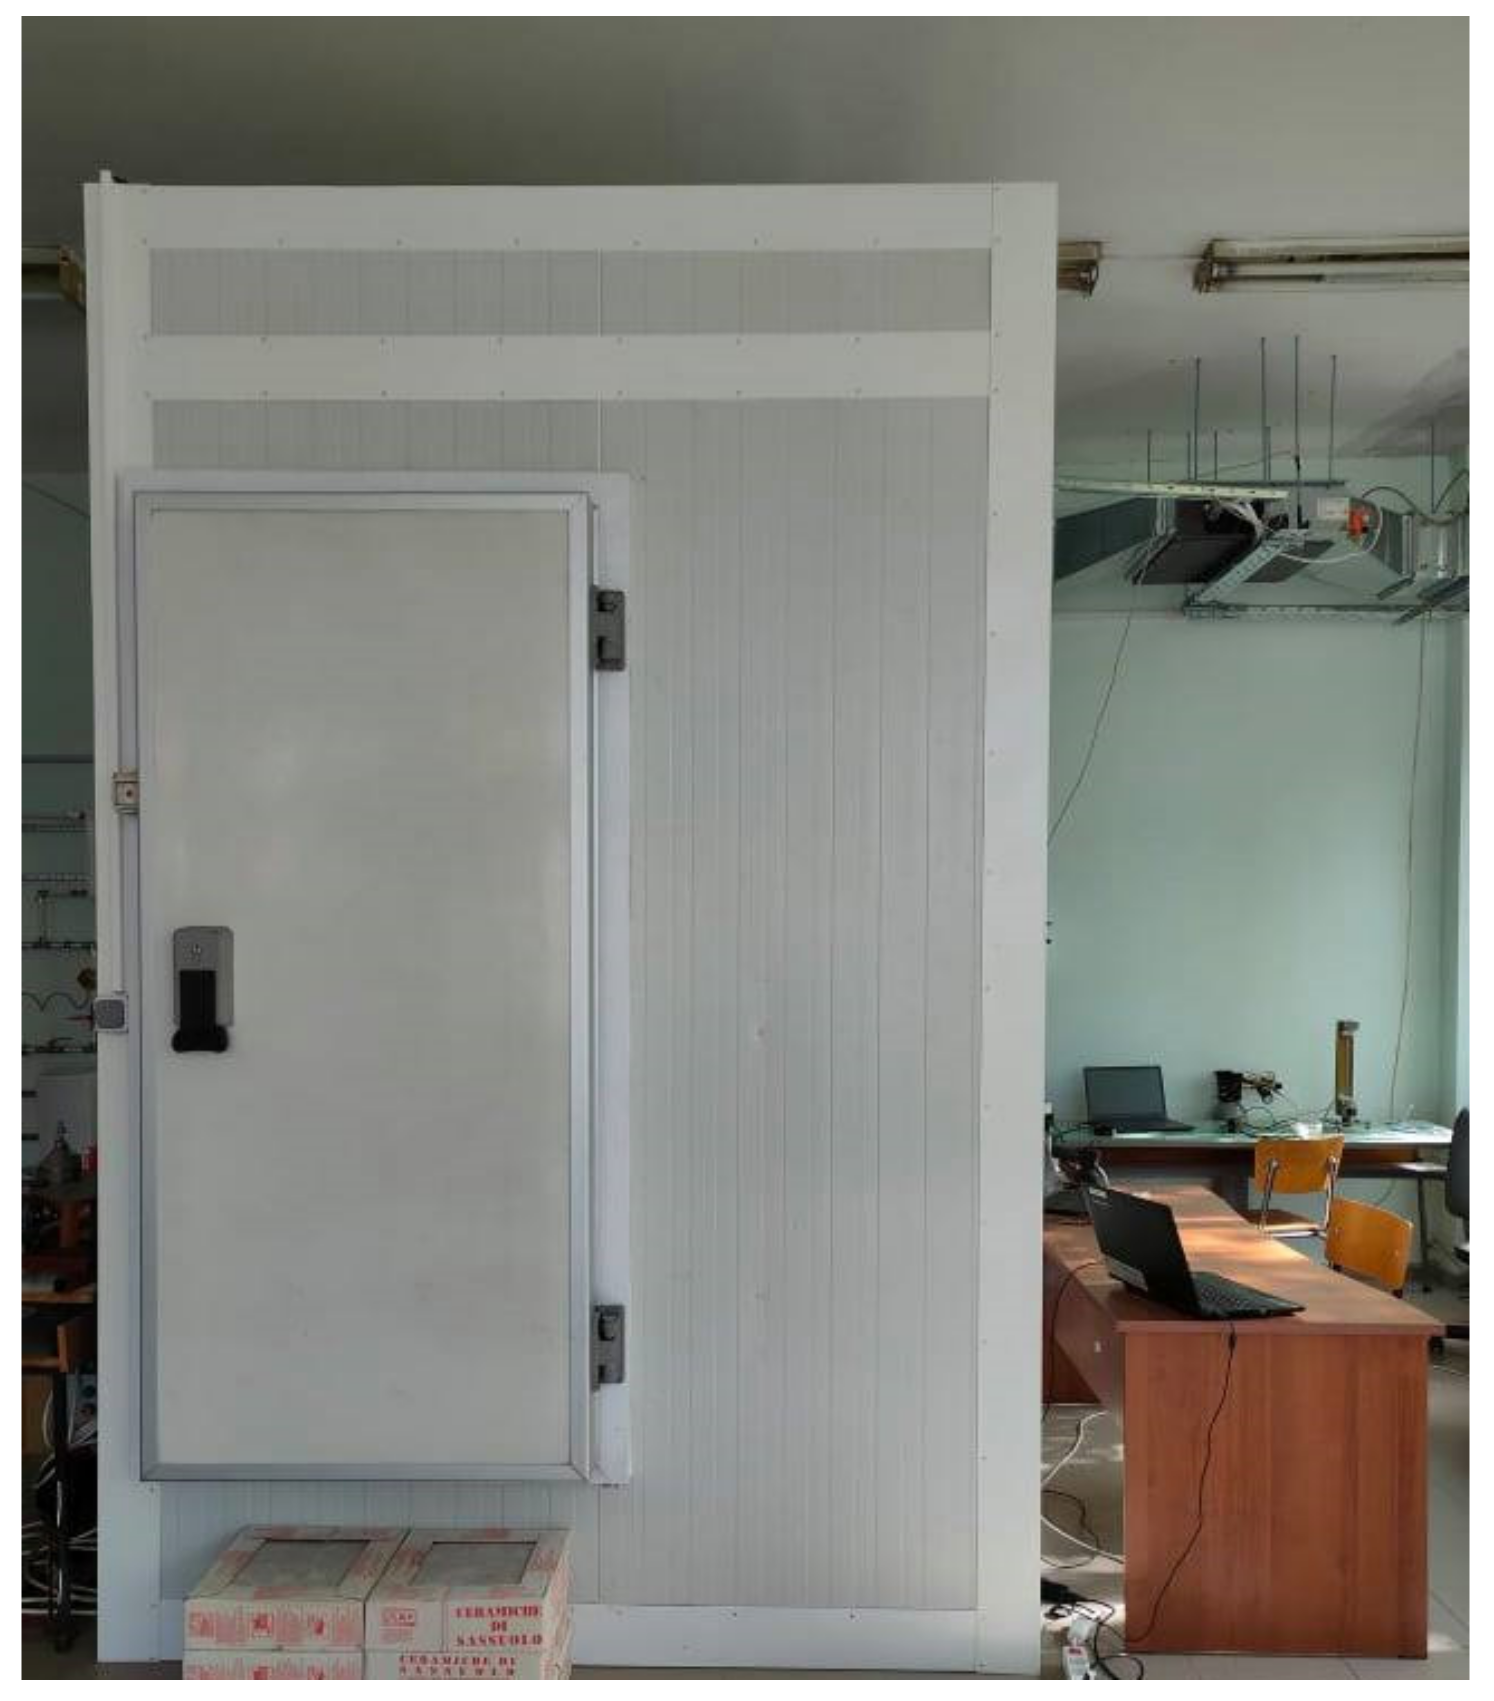
The climate chamber has been specially designed to measure CO
2 concentration in the air exhaled during human breathing. It has a thermally insulated, environmentally closed volume, in which another volume, an exposure chamber (EC), is placed. The inside dimensions of the climate chamber are 1.9 m ×1.9 m × 2.99 m, with a total volume of 10.79 m
3 (
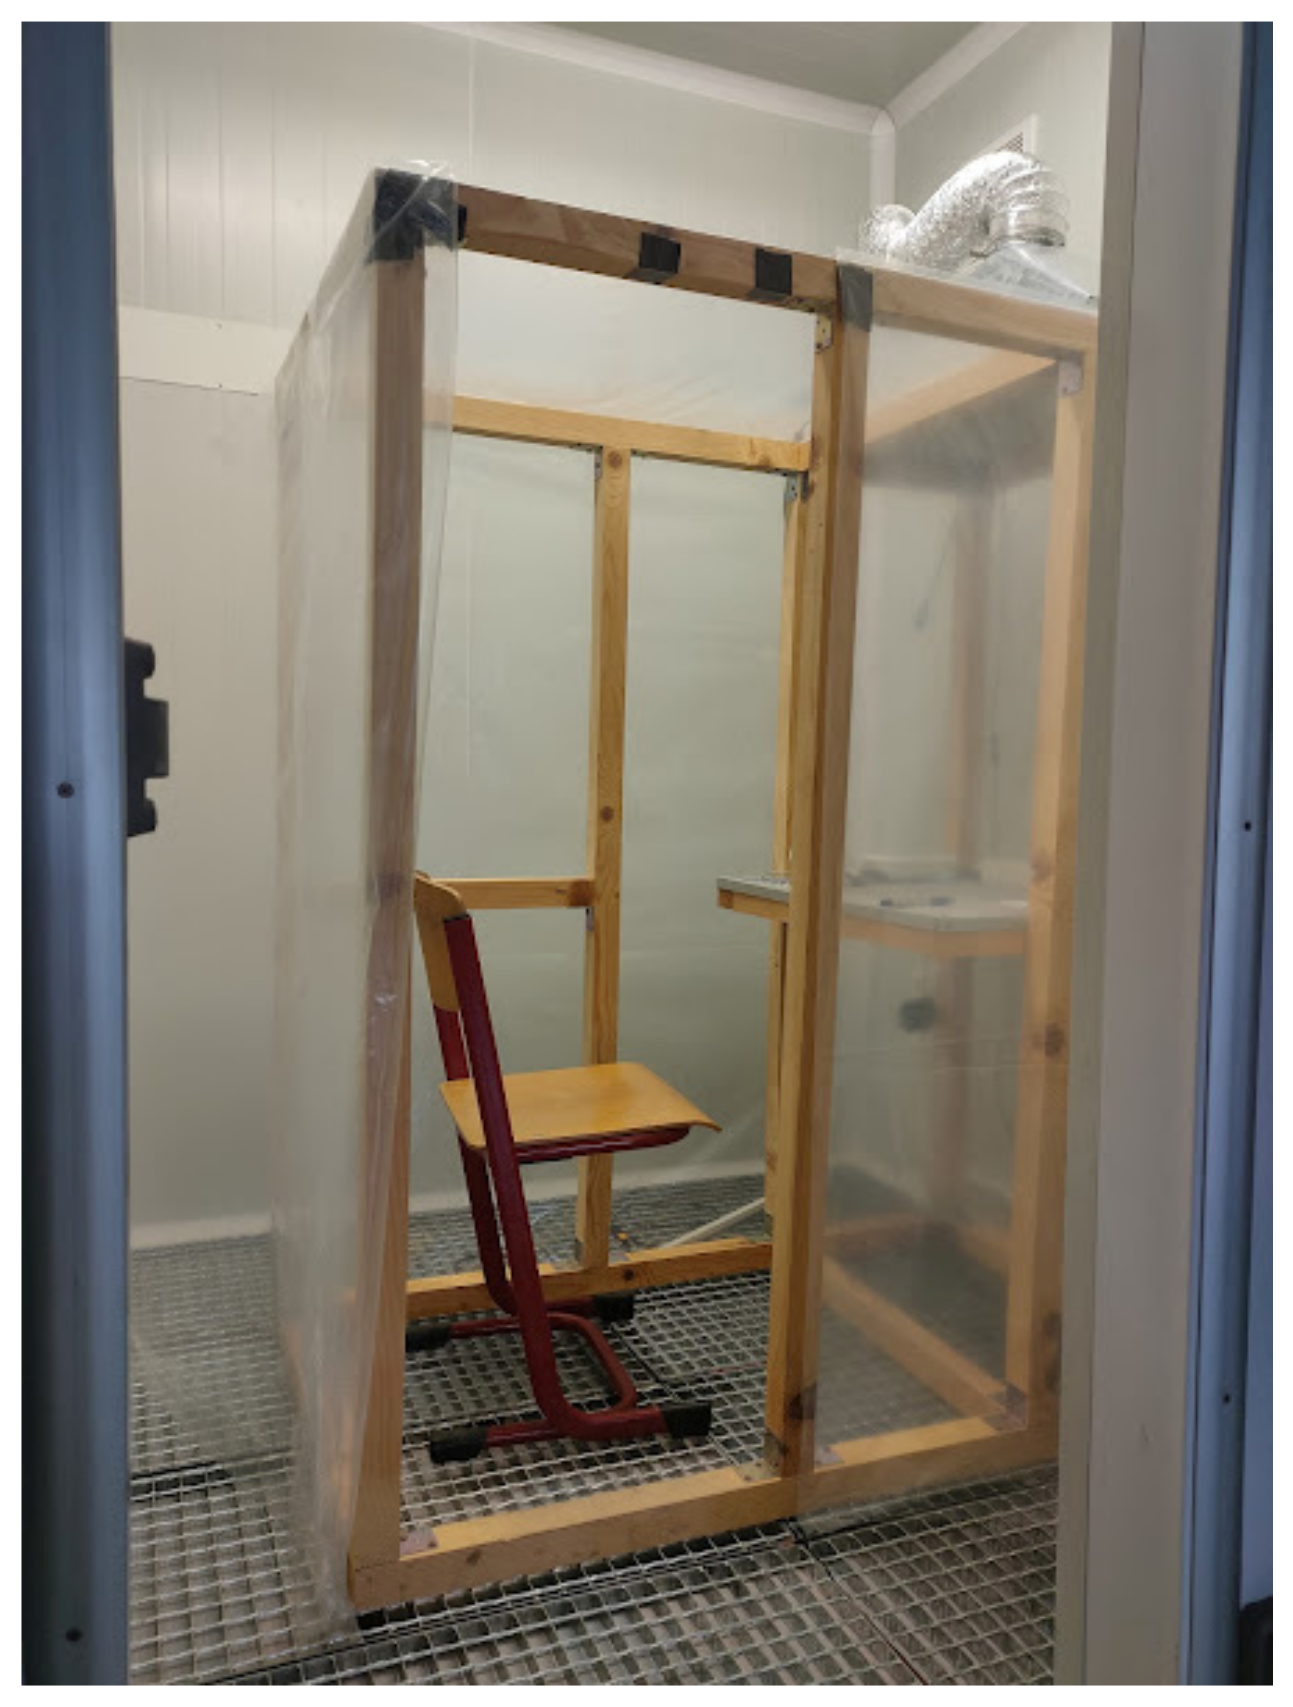
Figure 4). The dimensions of the EC are 1.4 m × 0.8 m × 1.6 m (
Figure 5). It is built with pine beams that support walls and ceiling of transparent polyethene with a thickness of 100 μm.
The EC splits the air in the climate chamber into two zones: occupied zone (inside the EC) and outside zone (the rest of the volume of the climate chamber). The air in the two zones does not mix, maintaining different air compositions.
The air temperature on both sides of the polyethene barrier of the EC and the temperatures of the inner surfaces of the climate chamber are equal. Thus, the operative temperature in the occupied zone (determined by the temperature of enclosures and air temperature) is identical to the air temperature in the outside zone. Similarly, the temperature of the surfaces in contact with the occupant’s body is equal to the air temperature in the occupied zone.
The floor of the climate chamber is a metal mesh from which the air is fed, following the scheme “diffuse floor”. A suction umbrella is mounted on the EC’s ceiling (0.35 m × 0.70 m). A net is mounted on it to turbulize the flow and ensure complete mixing between the exhaled air and ventilation air. A table from a metal mesh is mounted (0.65 m × 0.70 m) in the EC to create comfortable conditions for the sedentary work of the occupant.
The climate chamber and the EC were designed using Computational Fluid Dynamics (CFD); the different regimes and results from the numerical simulations were reported in [
36,
37].
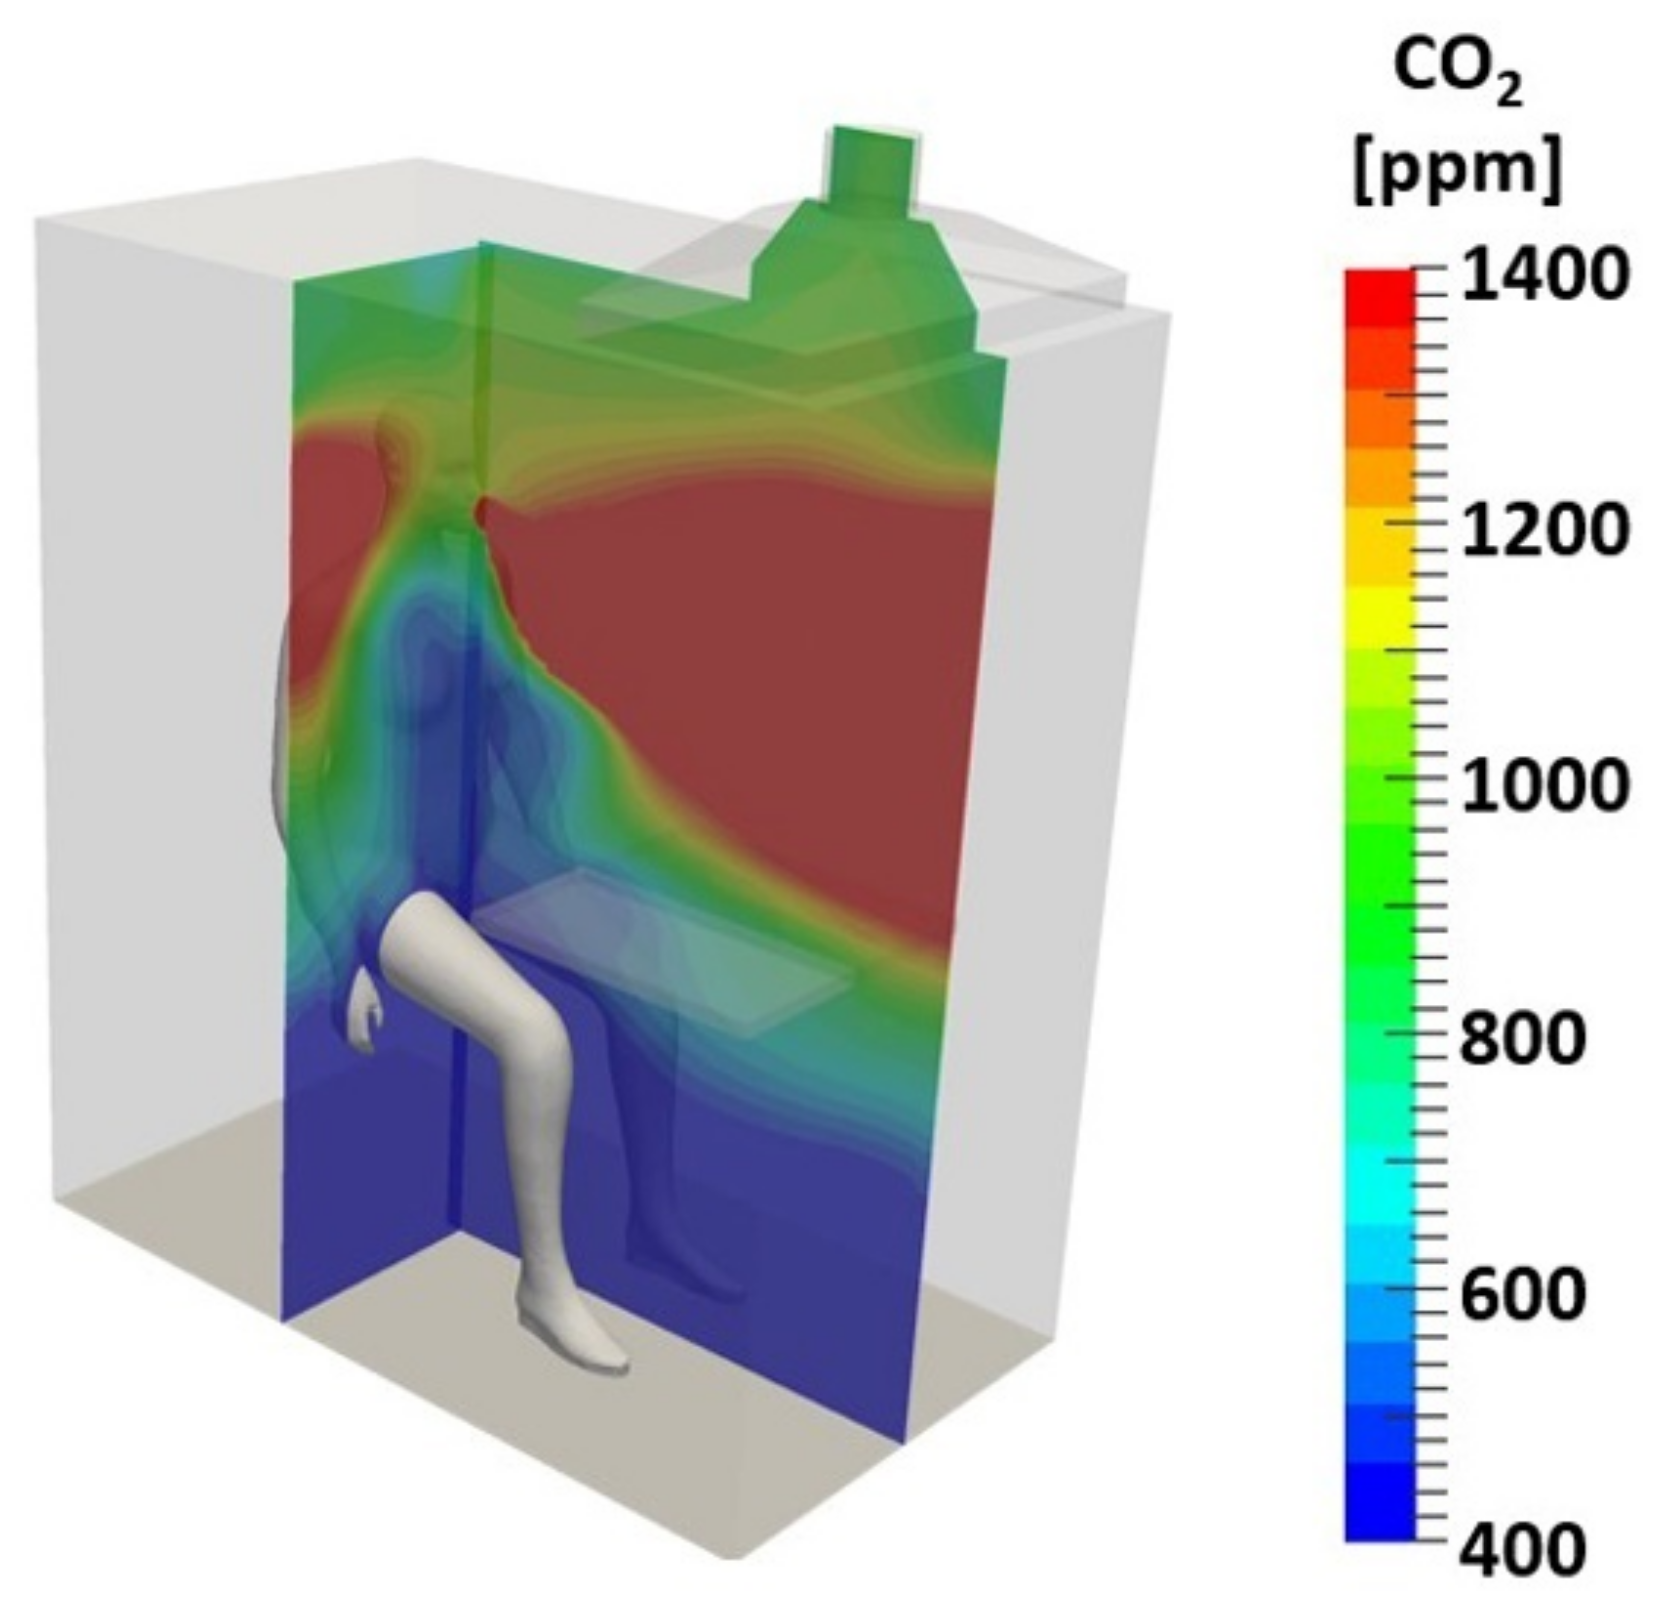
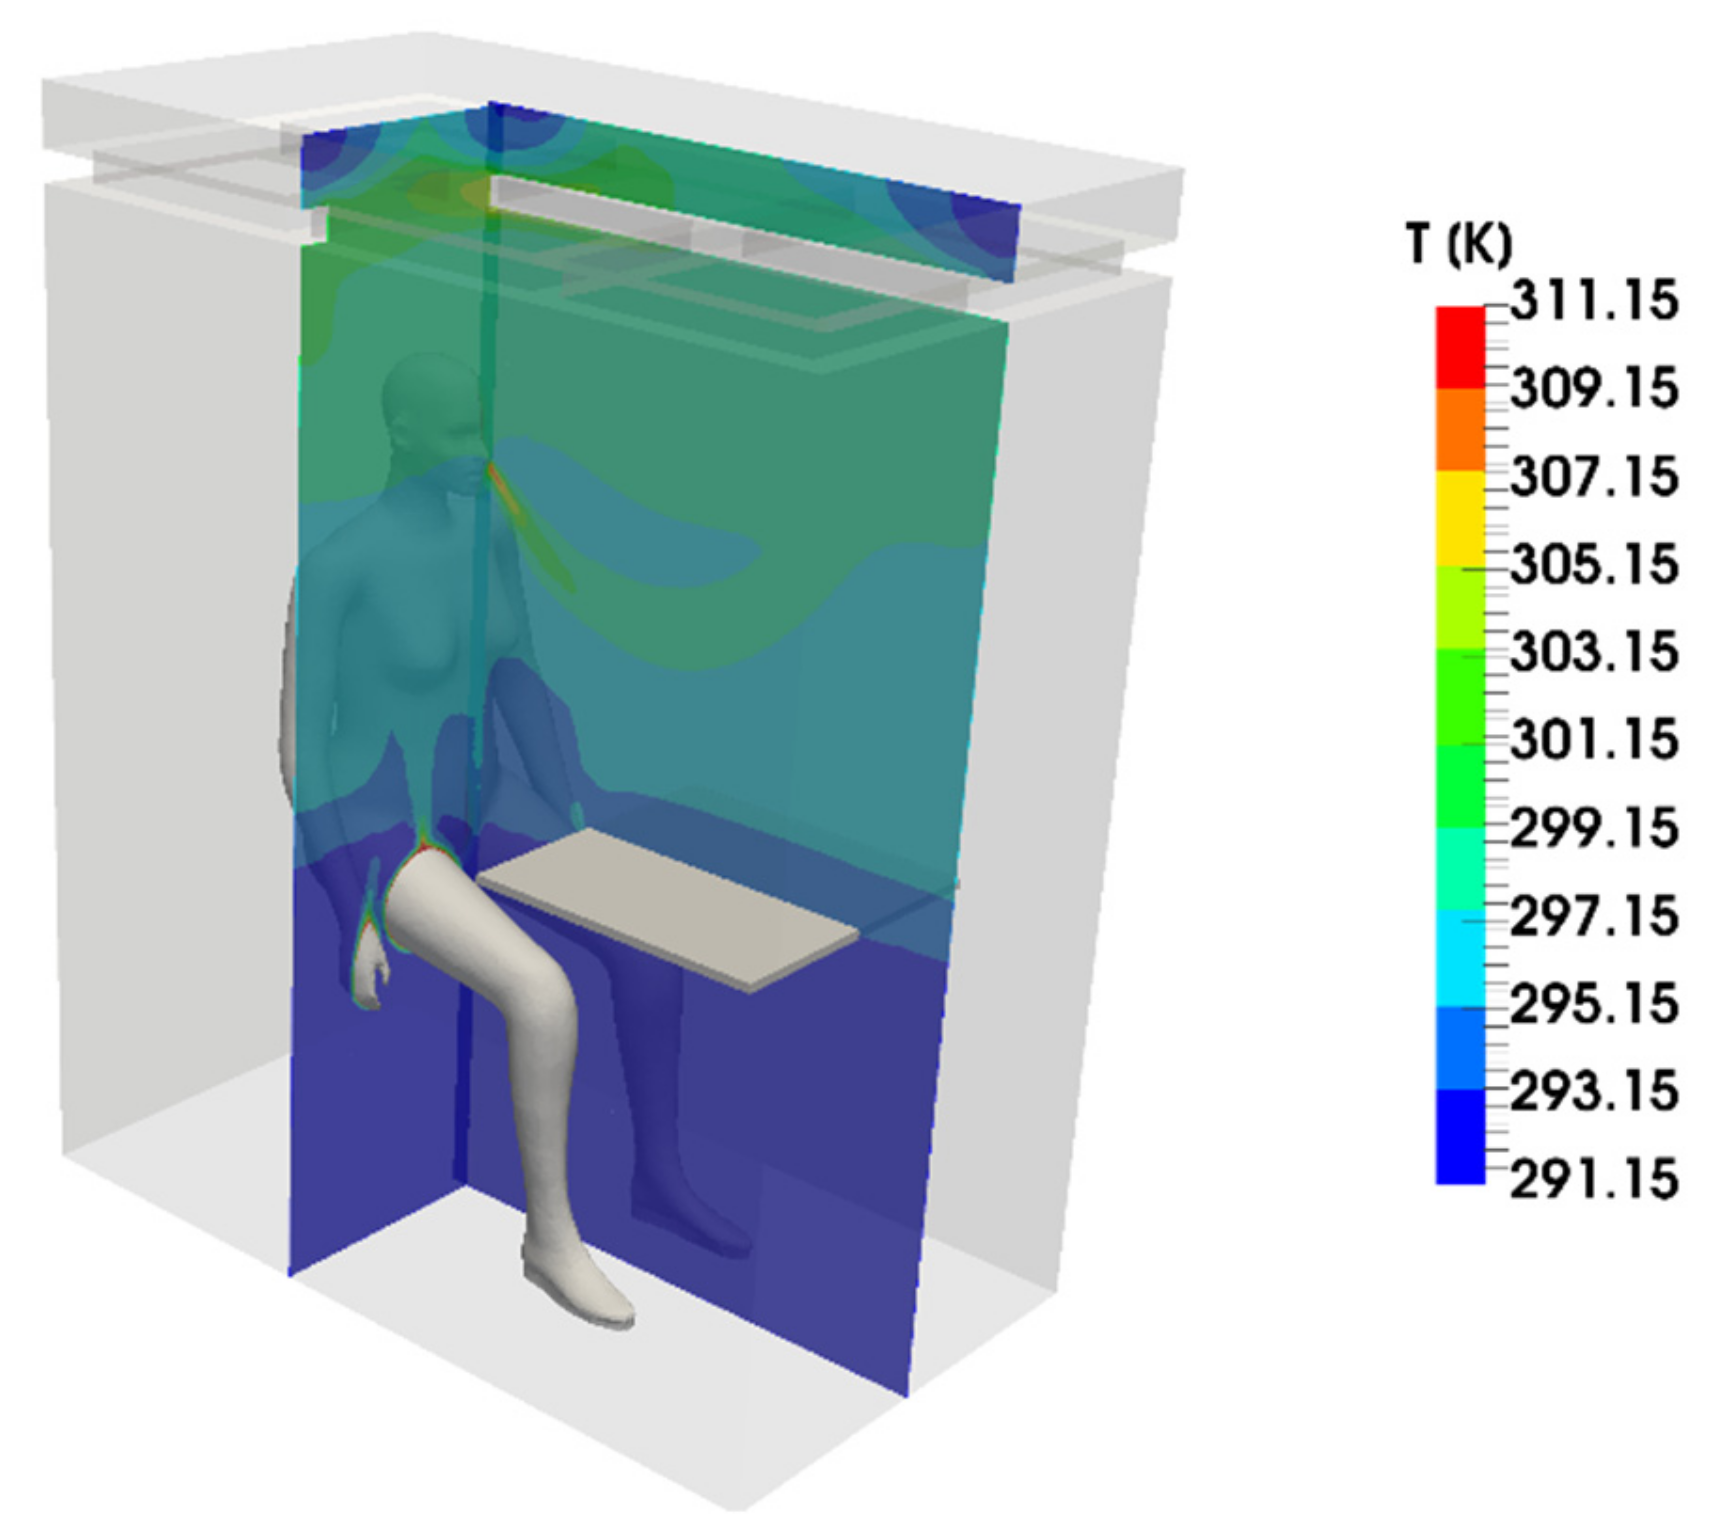
Figure 6,
Figure 7 and
Figure 8 present the numerical results for the best case of the EC, which were applied for the climate chamber construction (
Figure 5): diffuse floor arrangement, a permeable table in the front part of the EC, and exhaust air suction from the ceiling above the table.
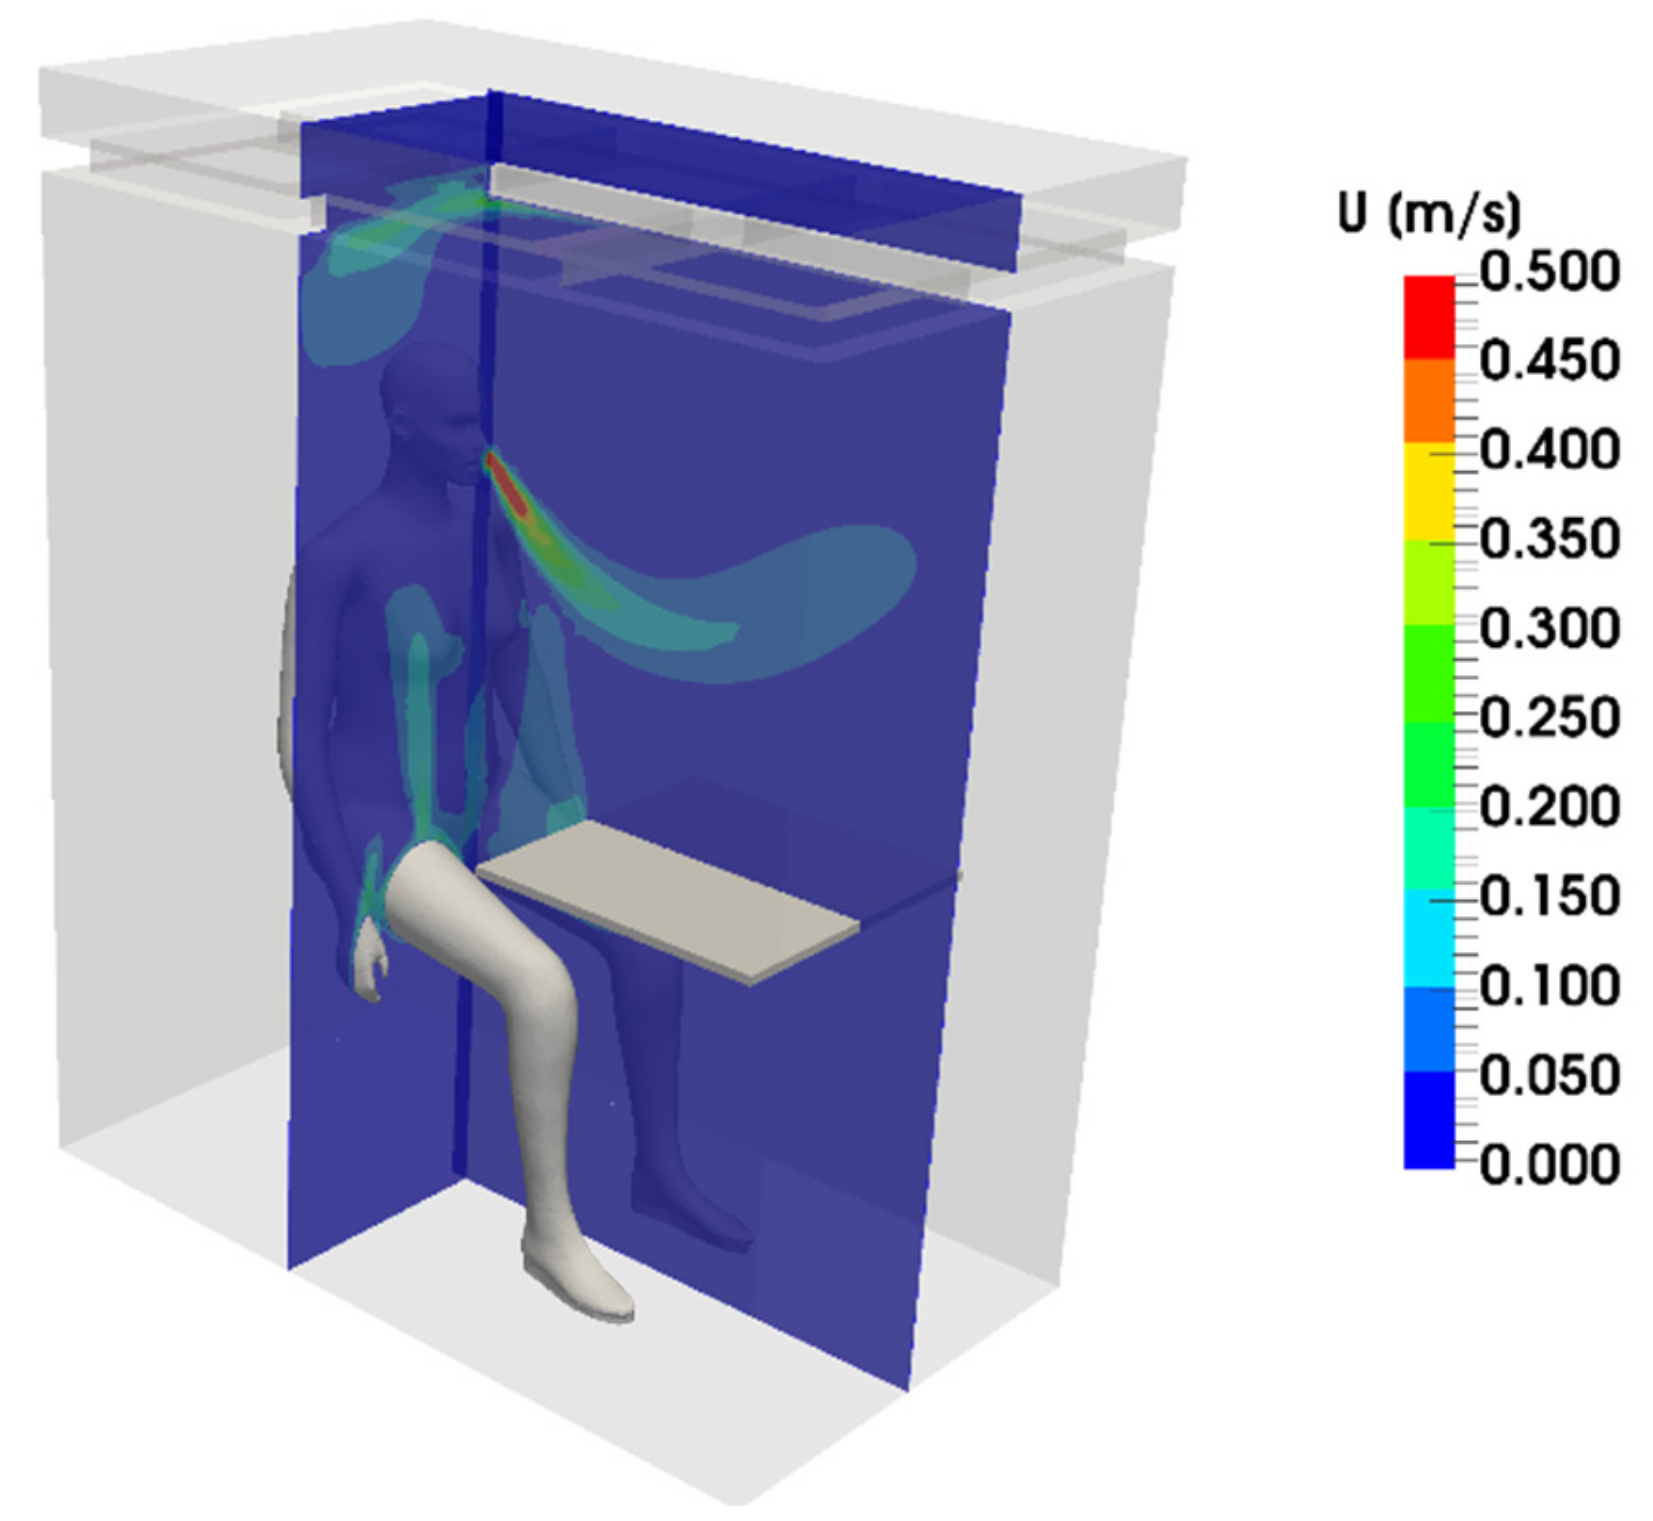
Figure 6 shows the even distribution of the temperature in the EC. The effect of breathing on the air velocity in the EC is simulated in
Figure 7. It proves that the selected design of EC creates conditions for perfect mixing of the air above the breathing zone. Furthermore, it confirms that the velocity of the ventilation air and the turbulent intensity are low, ensuring the lack of a sensible draught. The simulation of the CO
2 concentration above outdoor CO
2 concentration (
Figure 8) visualises that the particular design ensures the inhaled air has a concentration equal to the concentration of CO
2 in the ventilation air.
The air volume in the exposure chamber is 1.3 m3. With a flow rate of the outside air supply of 10 L/s, the equilibrium concentration of O2, CO2, and water vapor in the air at the EC outlet is reached in approx. 3 min.
2.2. Measuring Instruments
2.2.1. Classroom
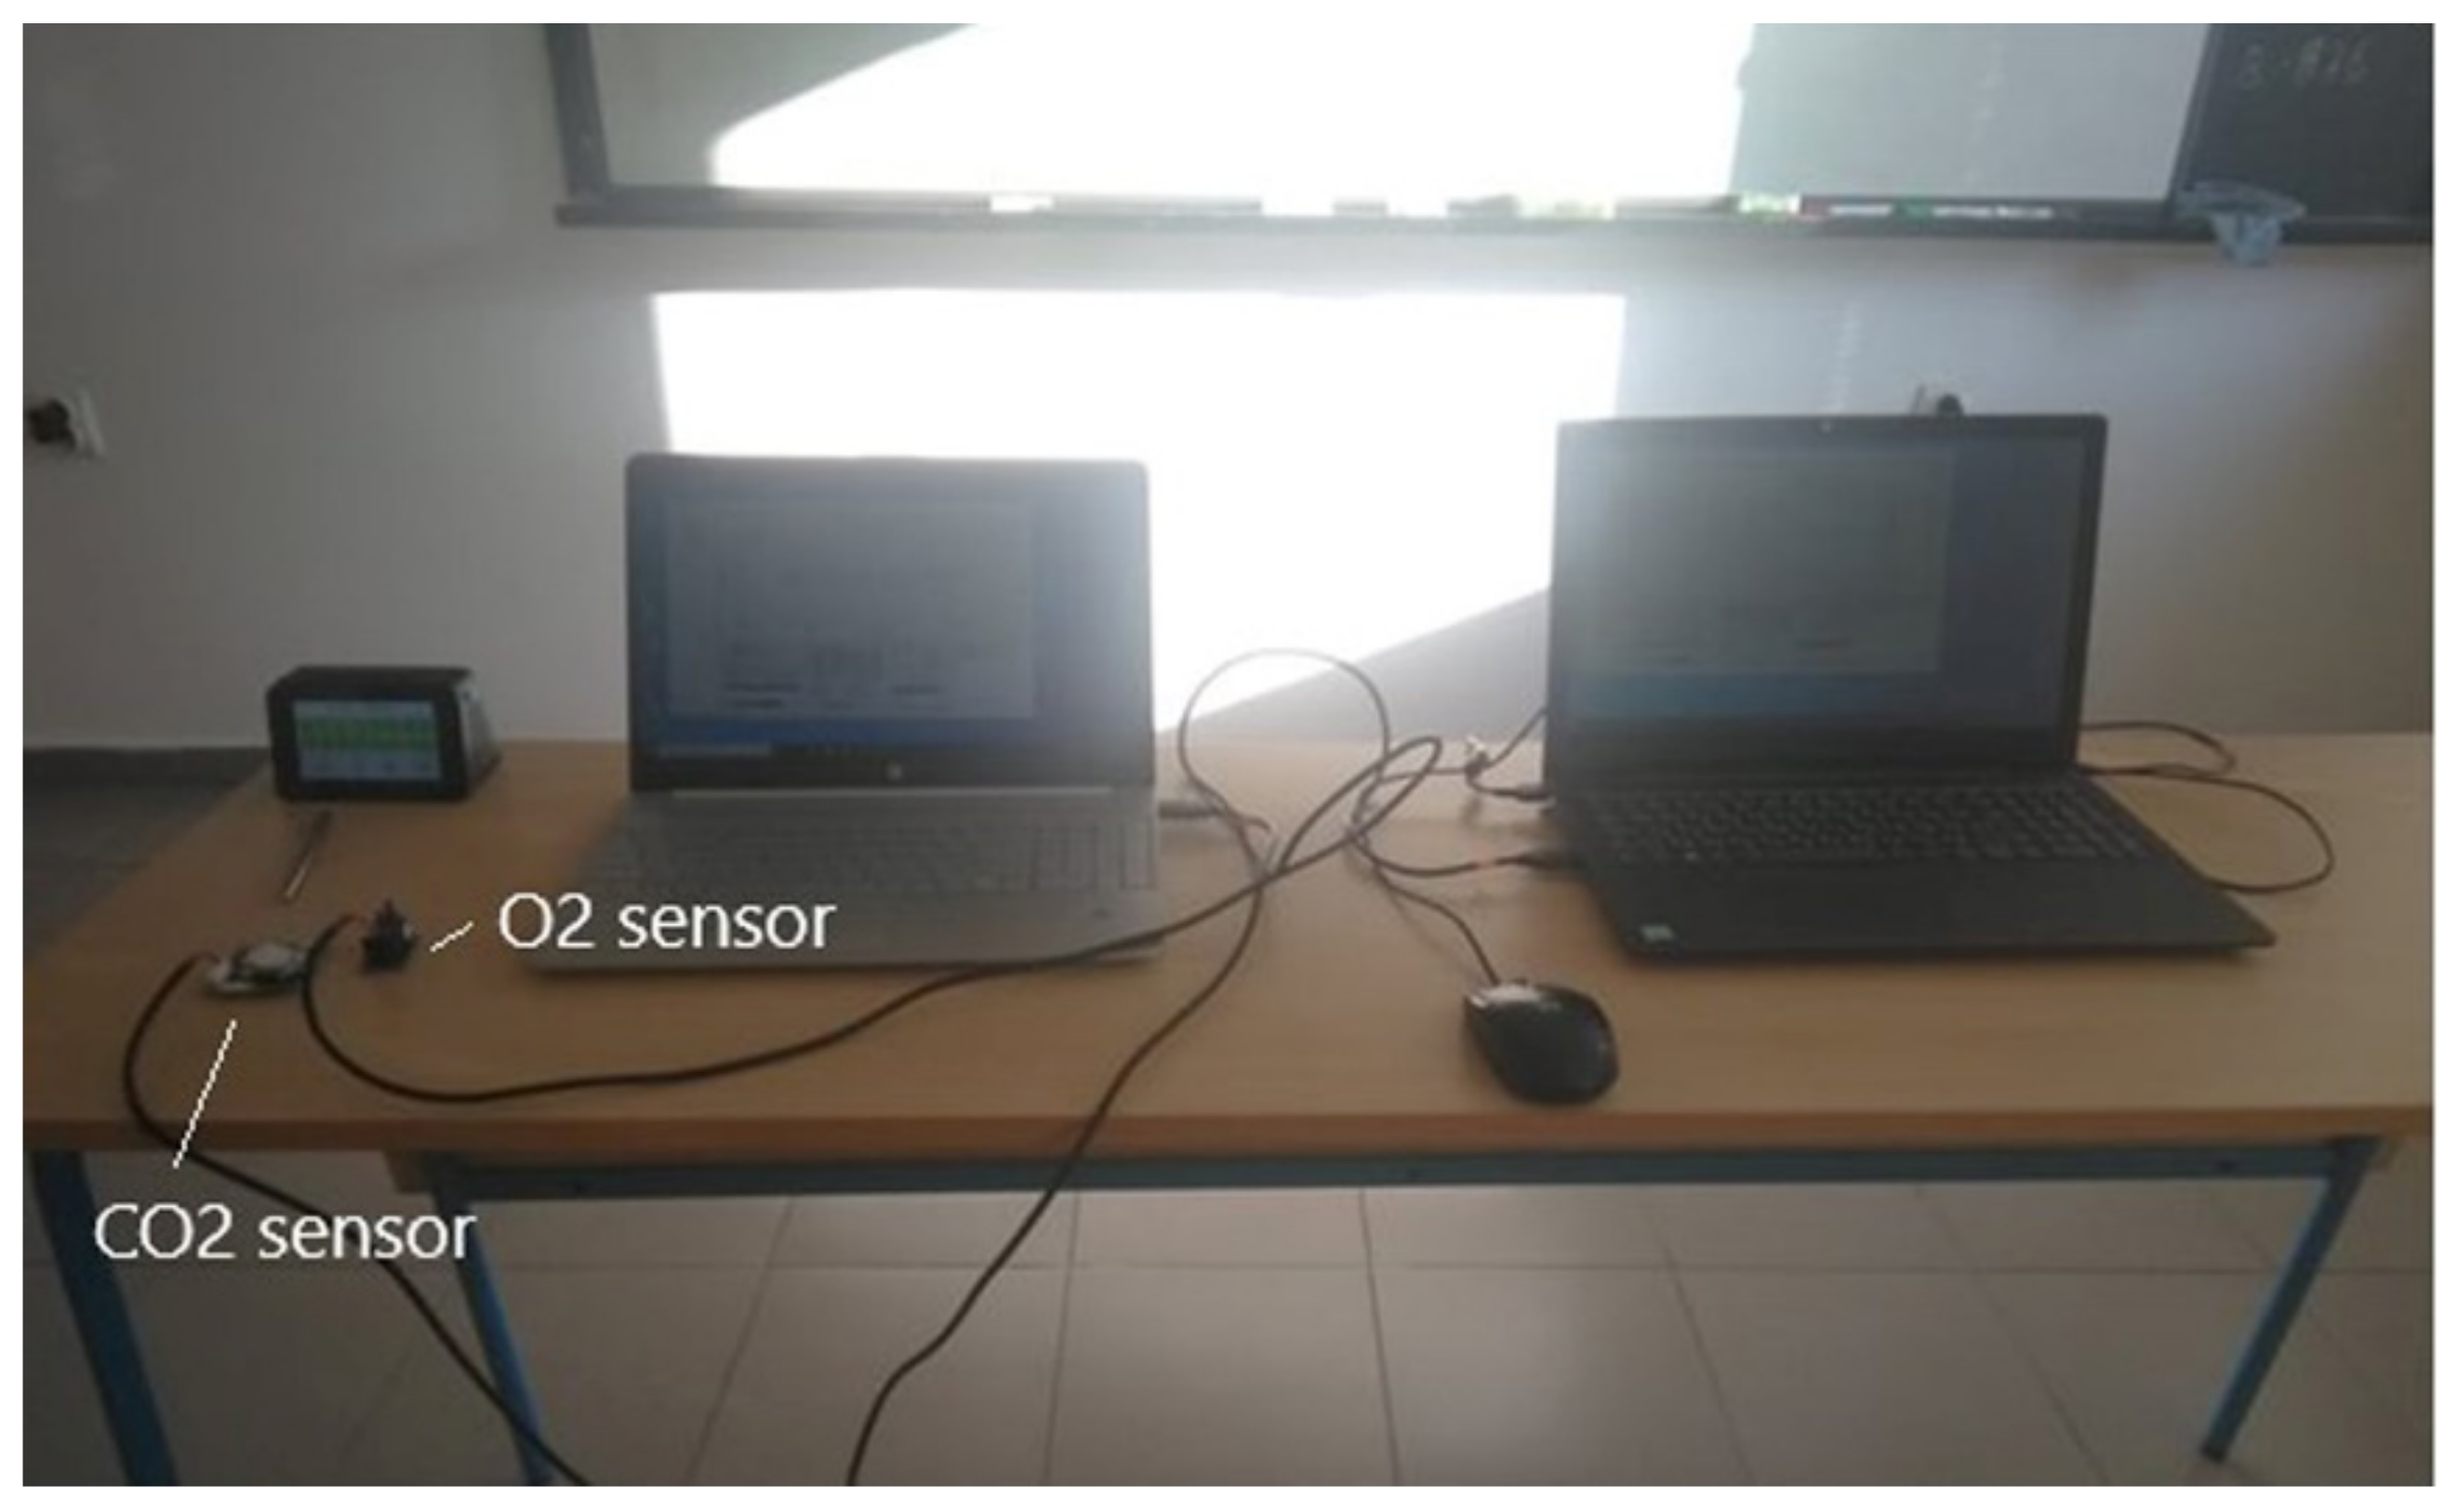
The CO
2 concentration measurements in the case study classroom were taken using a CO
2 sensor (K30 Fast Response 10,000 ppm CO
2 sensor of CO2Meter, USA). The sensor was located in the front (
Figure 9) of the classroom at a distance of 600 mm from the floor.
The O
2 concentration measurements were performed via a sensor (CM-4X of CO2Meter, USA) for joint monitoring of the oxygen concentration, air temperature, relative humidity, and pressure. It was placed in the front zone of the classroom (
Figure 9), at 600 mm from the floor.
The nearest individuals were at least two meters away from the sensors to prevent the direct effect on the sensor from their breathing.
All investigated parameters were monitored with a time step of 5 s.
2.2.2. Climate Chamber
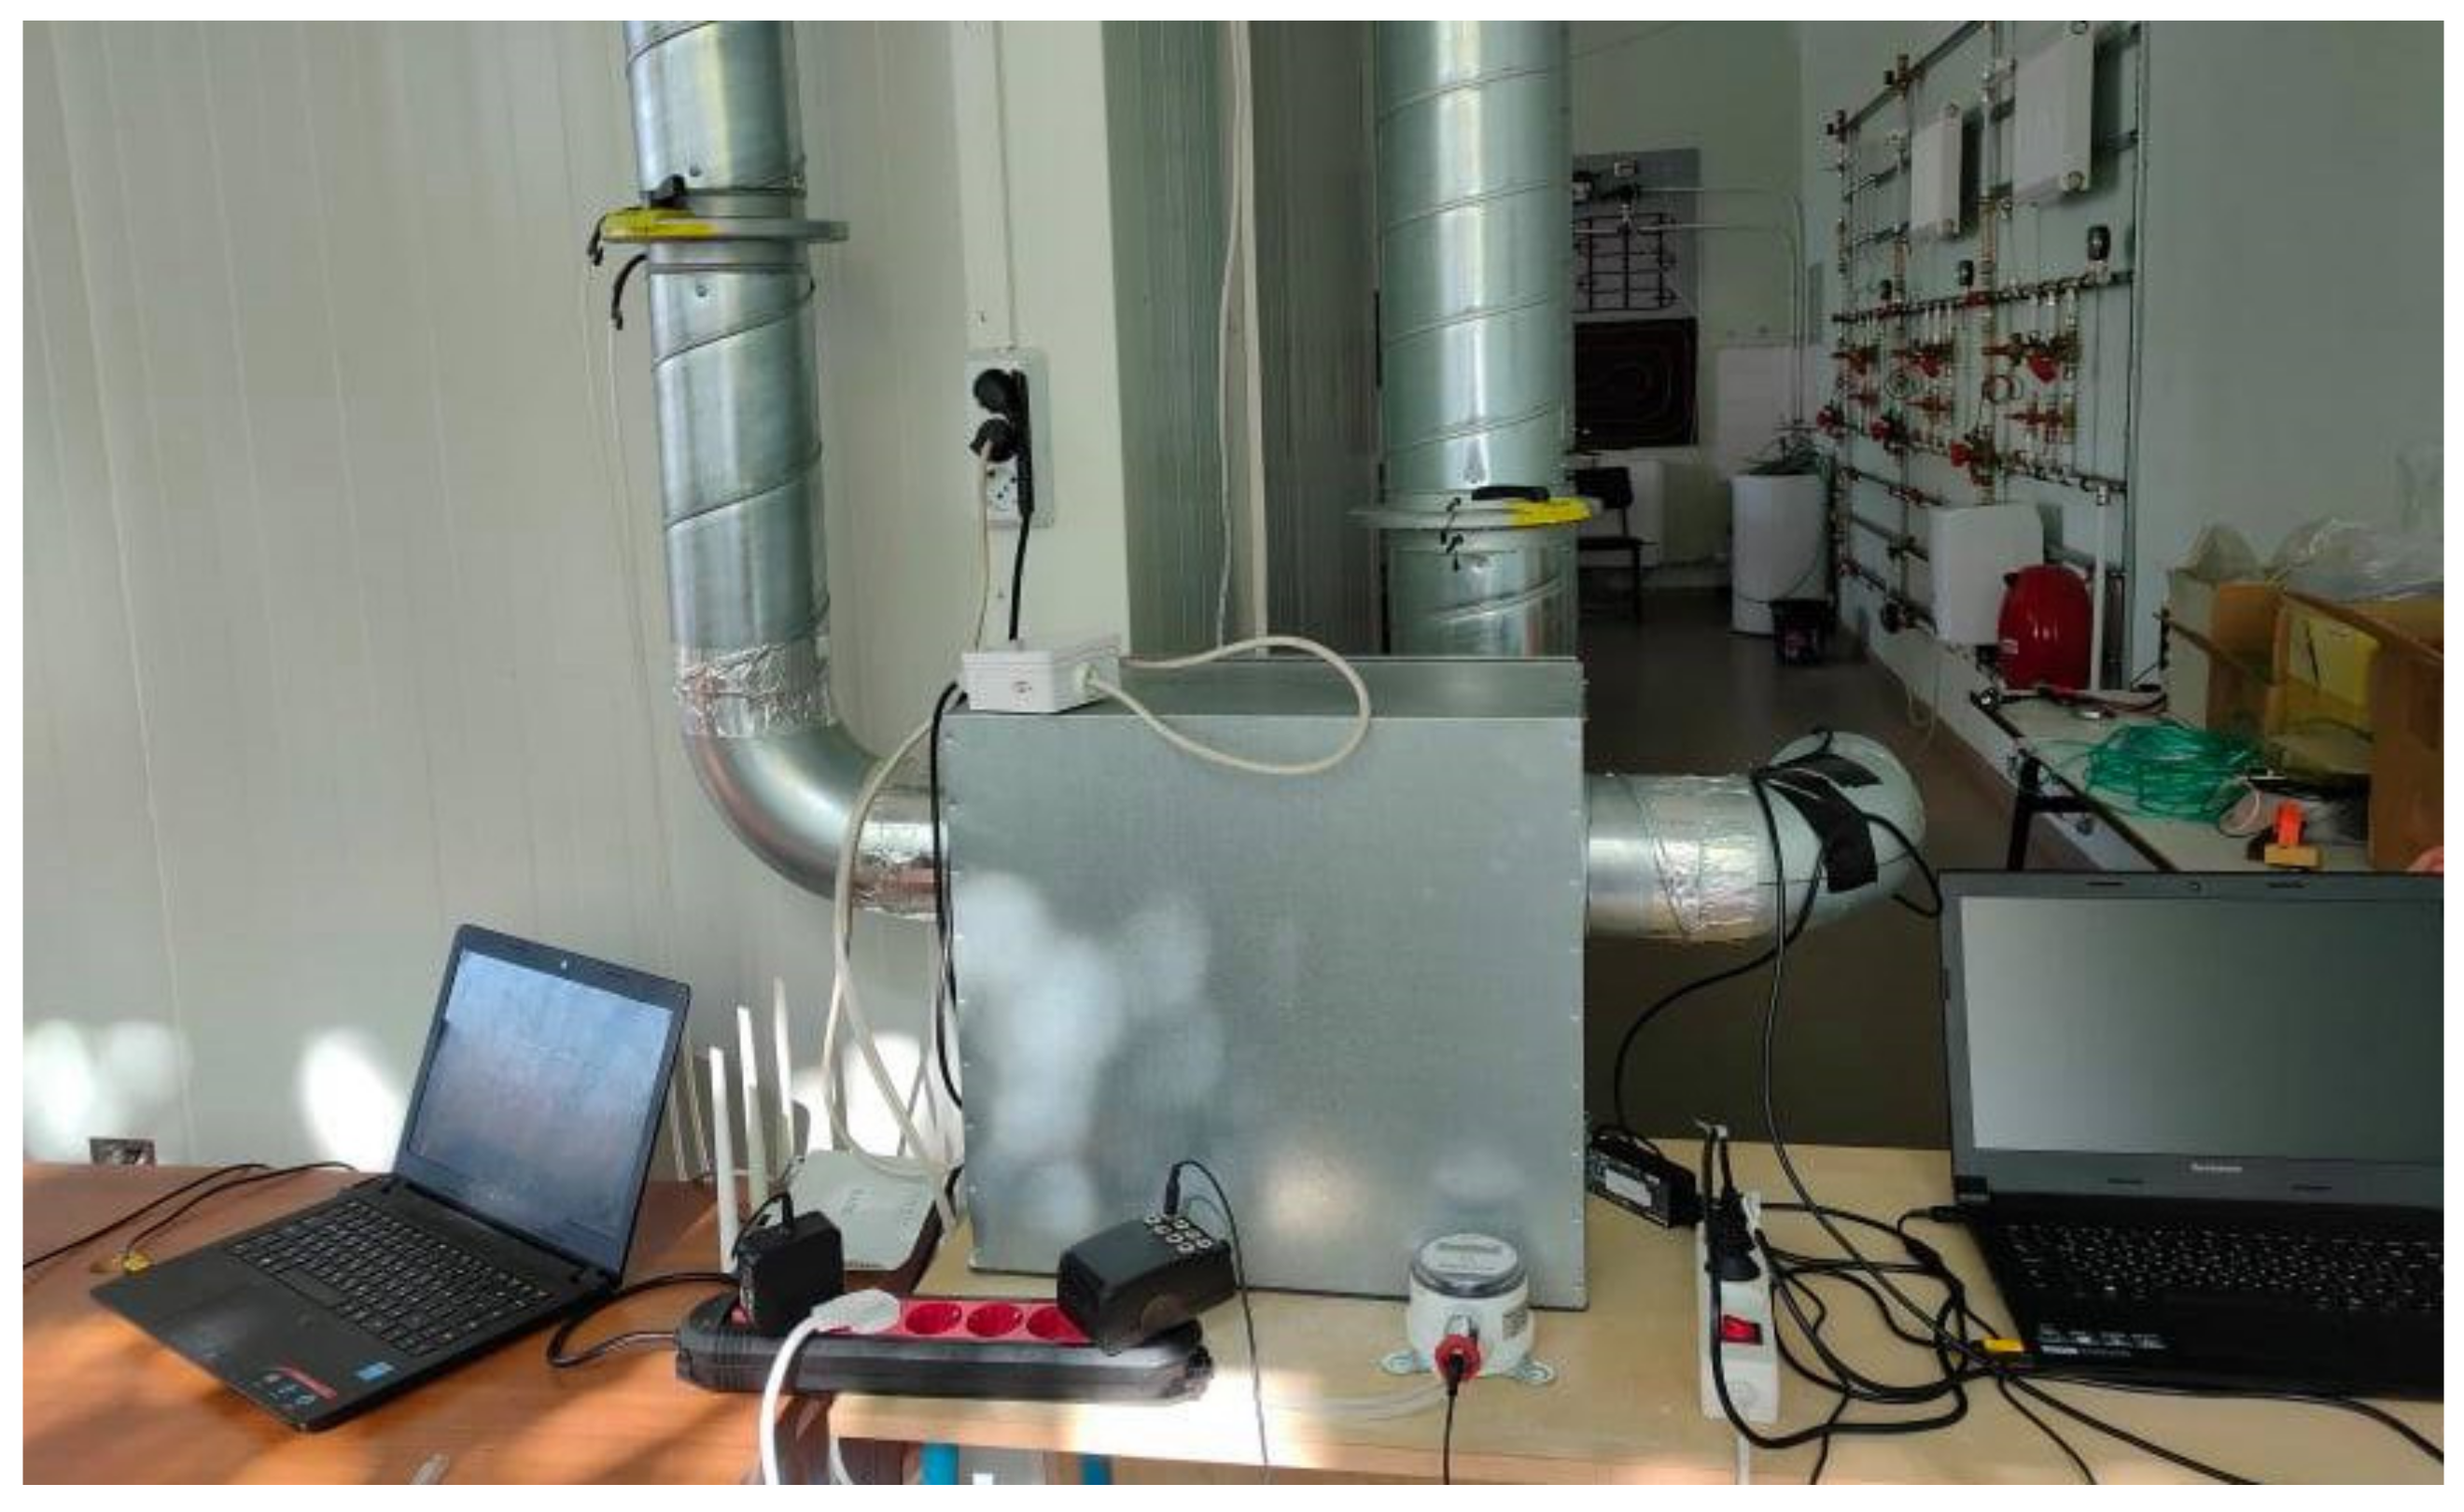
The supply air parameters were measured below the mesh floor of the climate chamber, while the exhaust air parameters were measured in the pipeline at the outlet of the suction hood in the EC.
The CO2 concentration was measured by two CM-0126 K-30 FR CO2 Development Kits of CO2Meter, USA. In addition, joint monitoring of the CO2 concentration, air temperature, and relative humidity was done using SEK-SCD30-Sensors of Sensirion, Switzerland, connected to a SEK-SensorBridge.
The O2 concentration was measured together with the air temperature, relative humidity, and barometric pressure, using two CM-42991 Development Kits of CO2Meter, USA.
The CO2 sensors were inter-calibrated by VAISALA GMP 343 flow through a carbon dioxide probe connected to a VAISALA MI70 indicator.
All indoor environment parameters, CO2 concentration, and O2 concentration were monitored with a time step of 2 s.
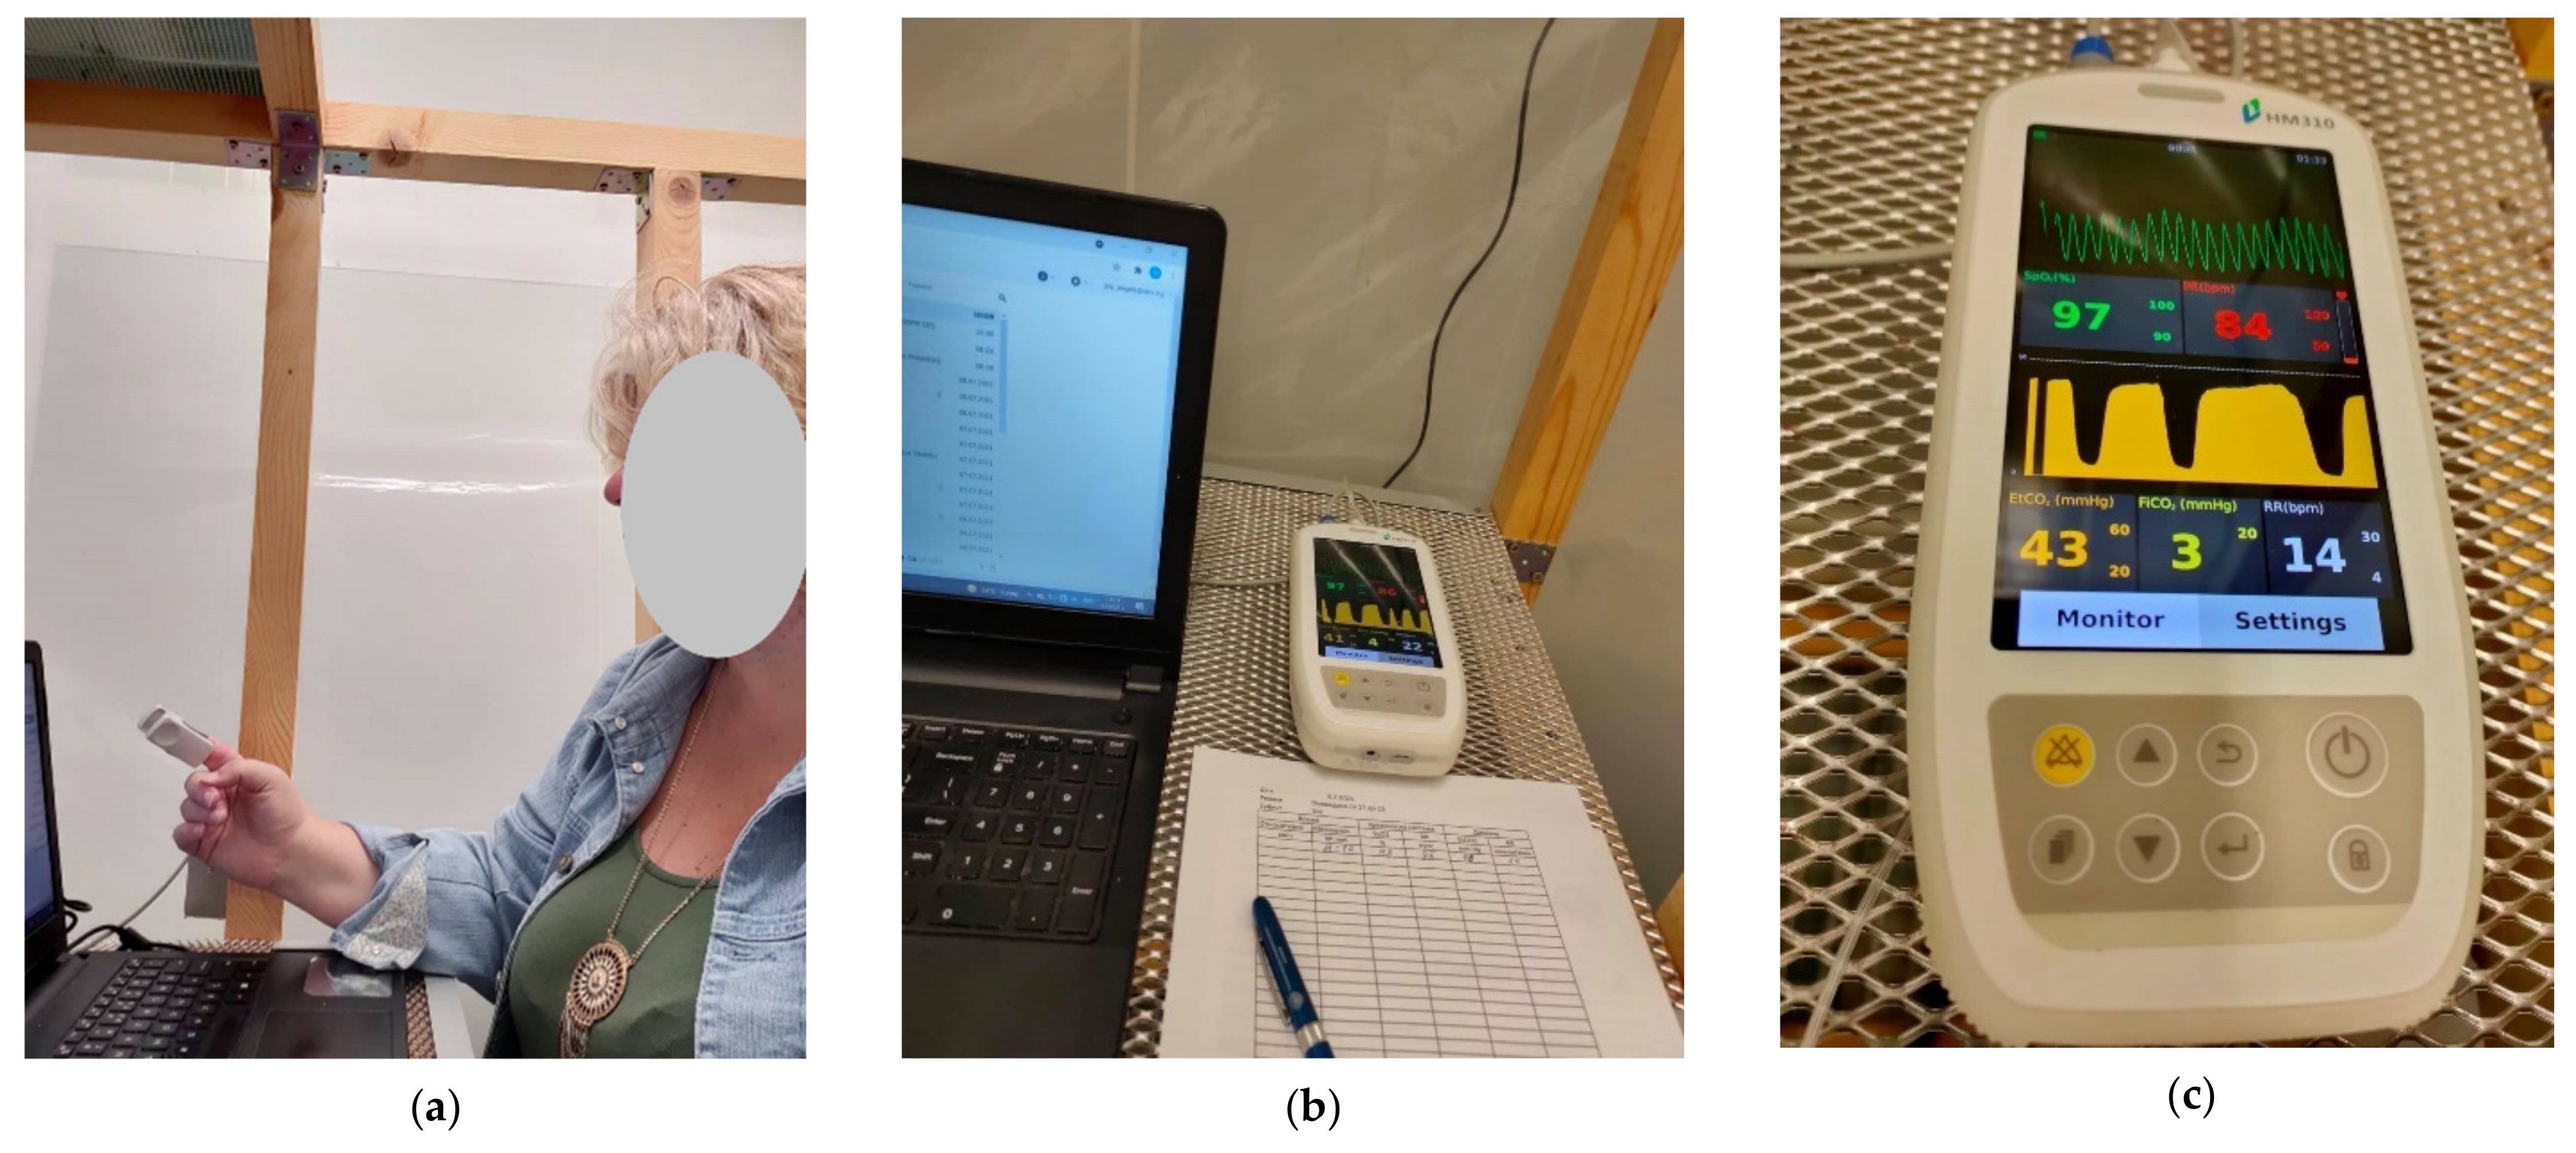
A Handled Capnograph Monitor-W HM 310 (Capnomed, China) was used to measure the following physiological parameters: oxygen saturation pressure (SpO2), pulse rate (PR), end-tidal CO2 (EtCO2), and the respiration rate (RR) of the person in the EC during the exposure. A record of the physiological parameters was made once at 300 s.
Part of the measuring equipment of the climate chamber is shown in
Figure 10.
2.3. Measuring Protocol
2.3.1. Classroom
Regular lecture classes were used to perform the measurements. Fourteen students (age 21–23 years) and two teachers (age 40, lecturing, and age 51, monitoring the measurements) were in the classroom. The participants were provided with details about the purpose and methods of the study. They declared the absence of symptoms of COVID-19 or influenza. Signing an informed consent was not applicable, as the measurements were not related to any change in the ordinary conditions in the classroom.
The measurements involved two stages with different air temperatures: Stage 1 (27 °C) and Stage 2 (23 °C). The room air temperature was maintained using the installed HVAC system (in recirculation mode).
The participants sat evenly distributed in the classroom. The required air temperature was achieved in advance. The measurements started after the door was closed. The duration of the lecture was 40 min (2400 s). Part of the records (400 s) at the beginning and the end of the measurements were omitted to equalize the recordings from all sensors. During the measurements, the students performed light sedentary work (listening and taking notes).
Stage 2 followed Stage 1 after a 30 min break, due to the need to decrease the room air temperature. All participants went out of the classroom, and the windows were open during the break. In Stage 2, the participants sat in the same places and were asked to stay with the same clothing ensembles as in Stage 1. The duration of the lecture was again 40 min.
2.3.2. Climate Chamber
One person (female, 52 years old) was sitting in the EC for 4 h and performing light office work on a computer. The volunteer declared the absence of symptoms of COVID-19 or influenza. Signing an informed consent was not applicable, as the measurements were not related to any unconventional or extreme indoor conditions and did not involve clinical experiments.
During the first 20 min of the exposure, the operative temperature in the climate chamber was 27 °C. After this period, the air temperature was decreased to 23 °C. The decrement to the new operative temperature (a transition period) took approx. 40 min. In the next three hours, the operative temperature remained 23 °C.
Figure 11 presents the exposure of the person in the climate chamber.
2.4. Statistical Analysis
The statistical analysis was done using Excel Data Analysis ToolPak. The results are given as the average value (AV) ± standard deviation (SD). Student’s t-test was used to statistically prove or reject the relationship between the average values of the different data arrays. The significance level α was set to 0.05.
3. Results
The results from the measurements are presented in two sub-sections: influence of the temperature on the accumulation of the CO2 in the case study classroom and measurement of the exhaled CO2 in the climate chamber.
3.1. Measurements in the Classroom
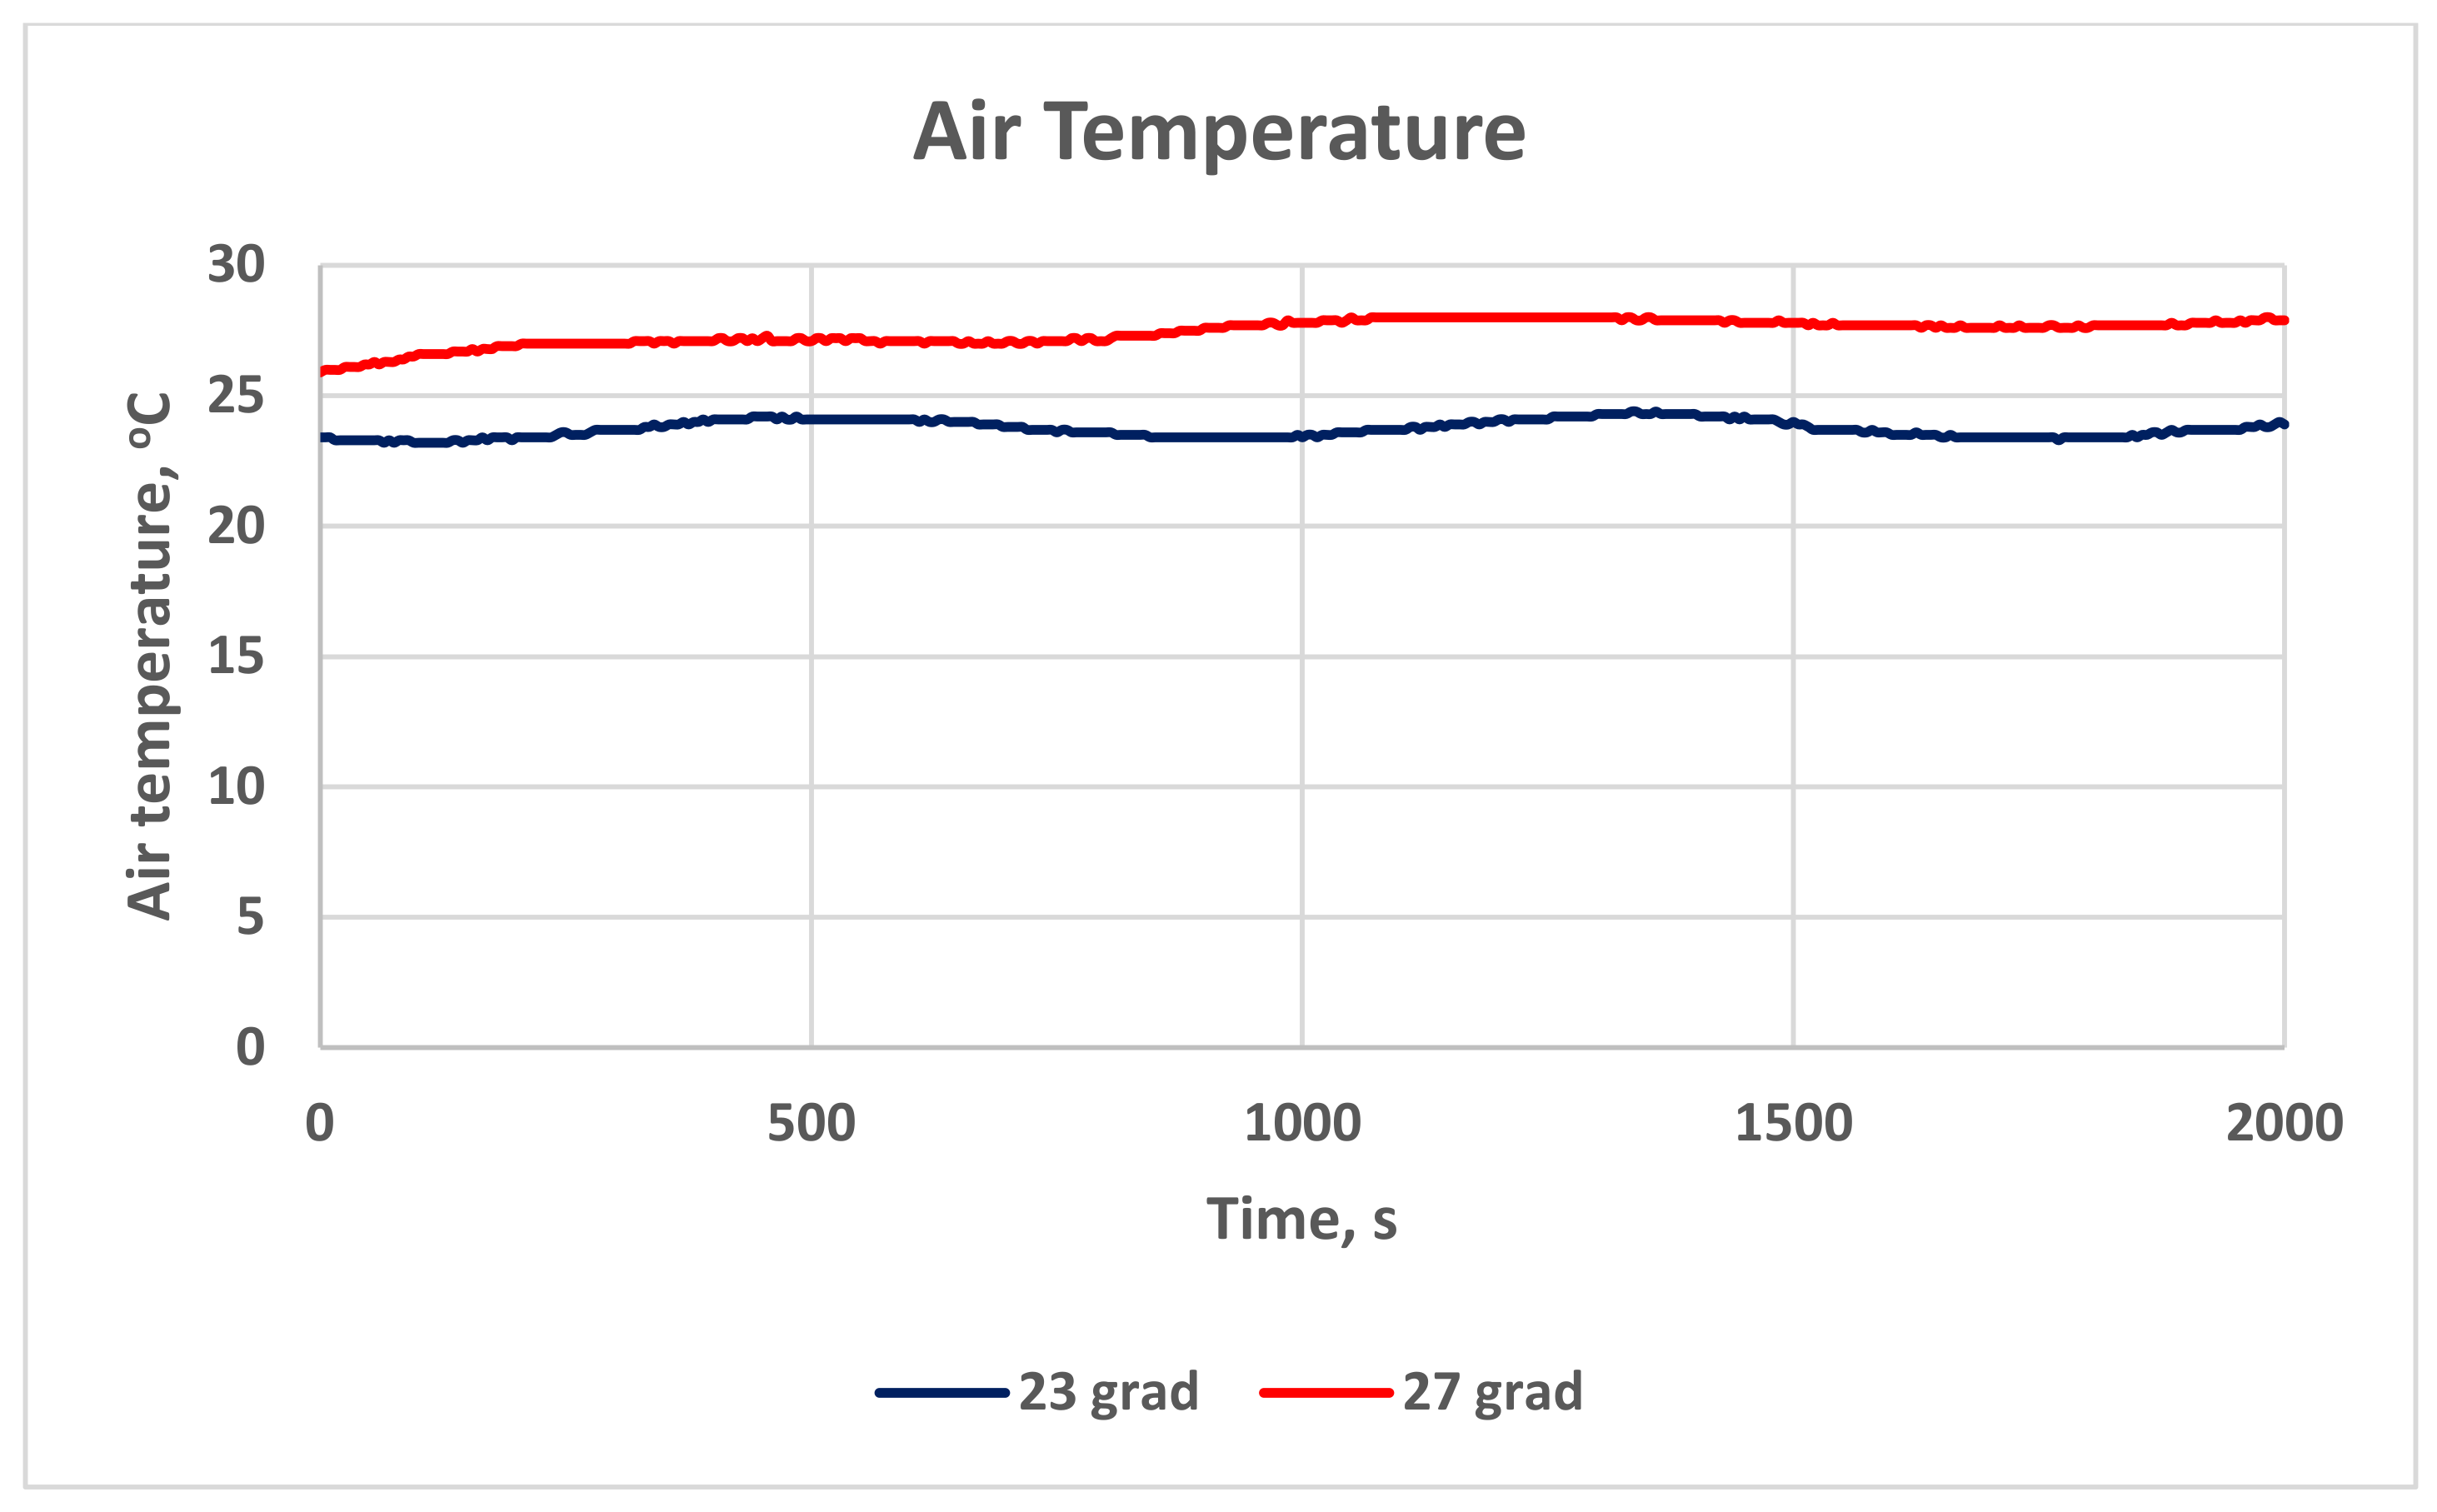
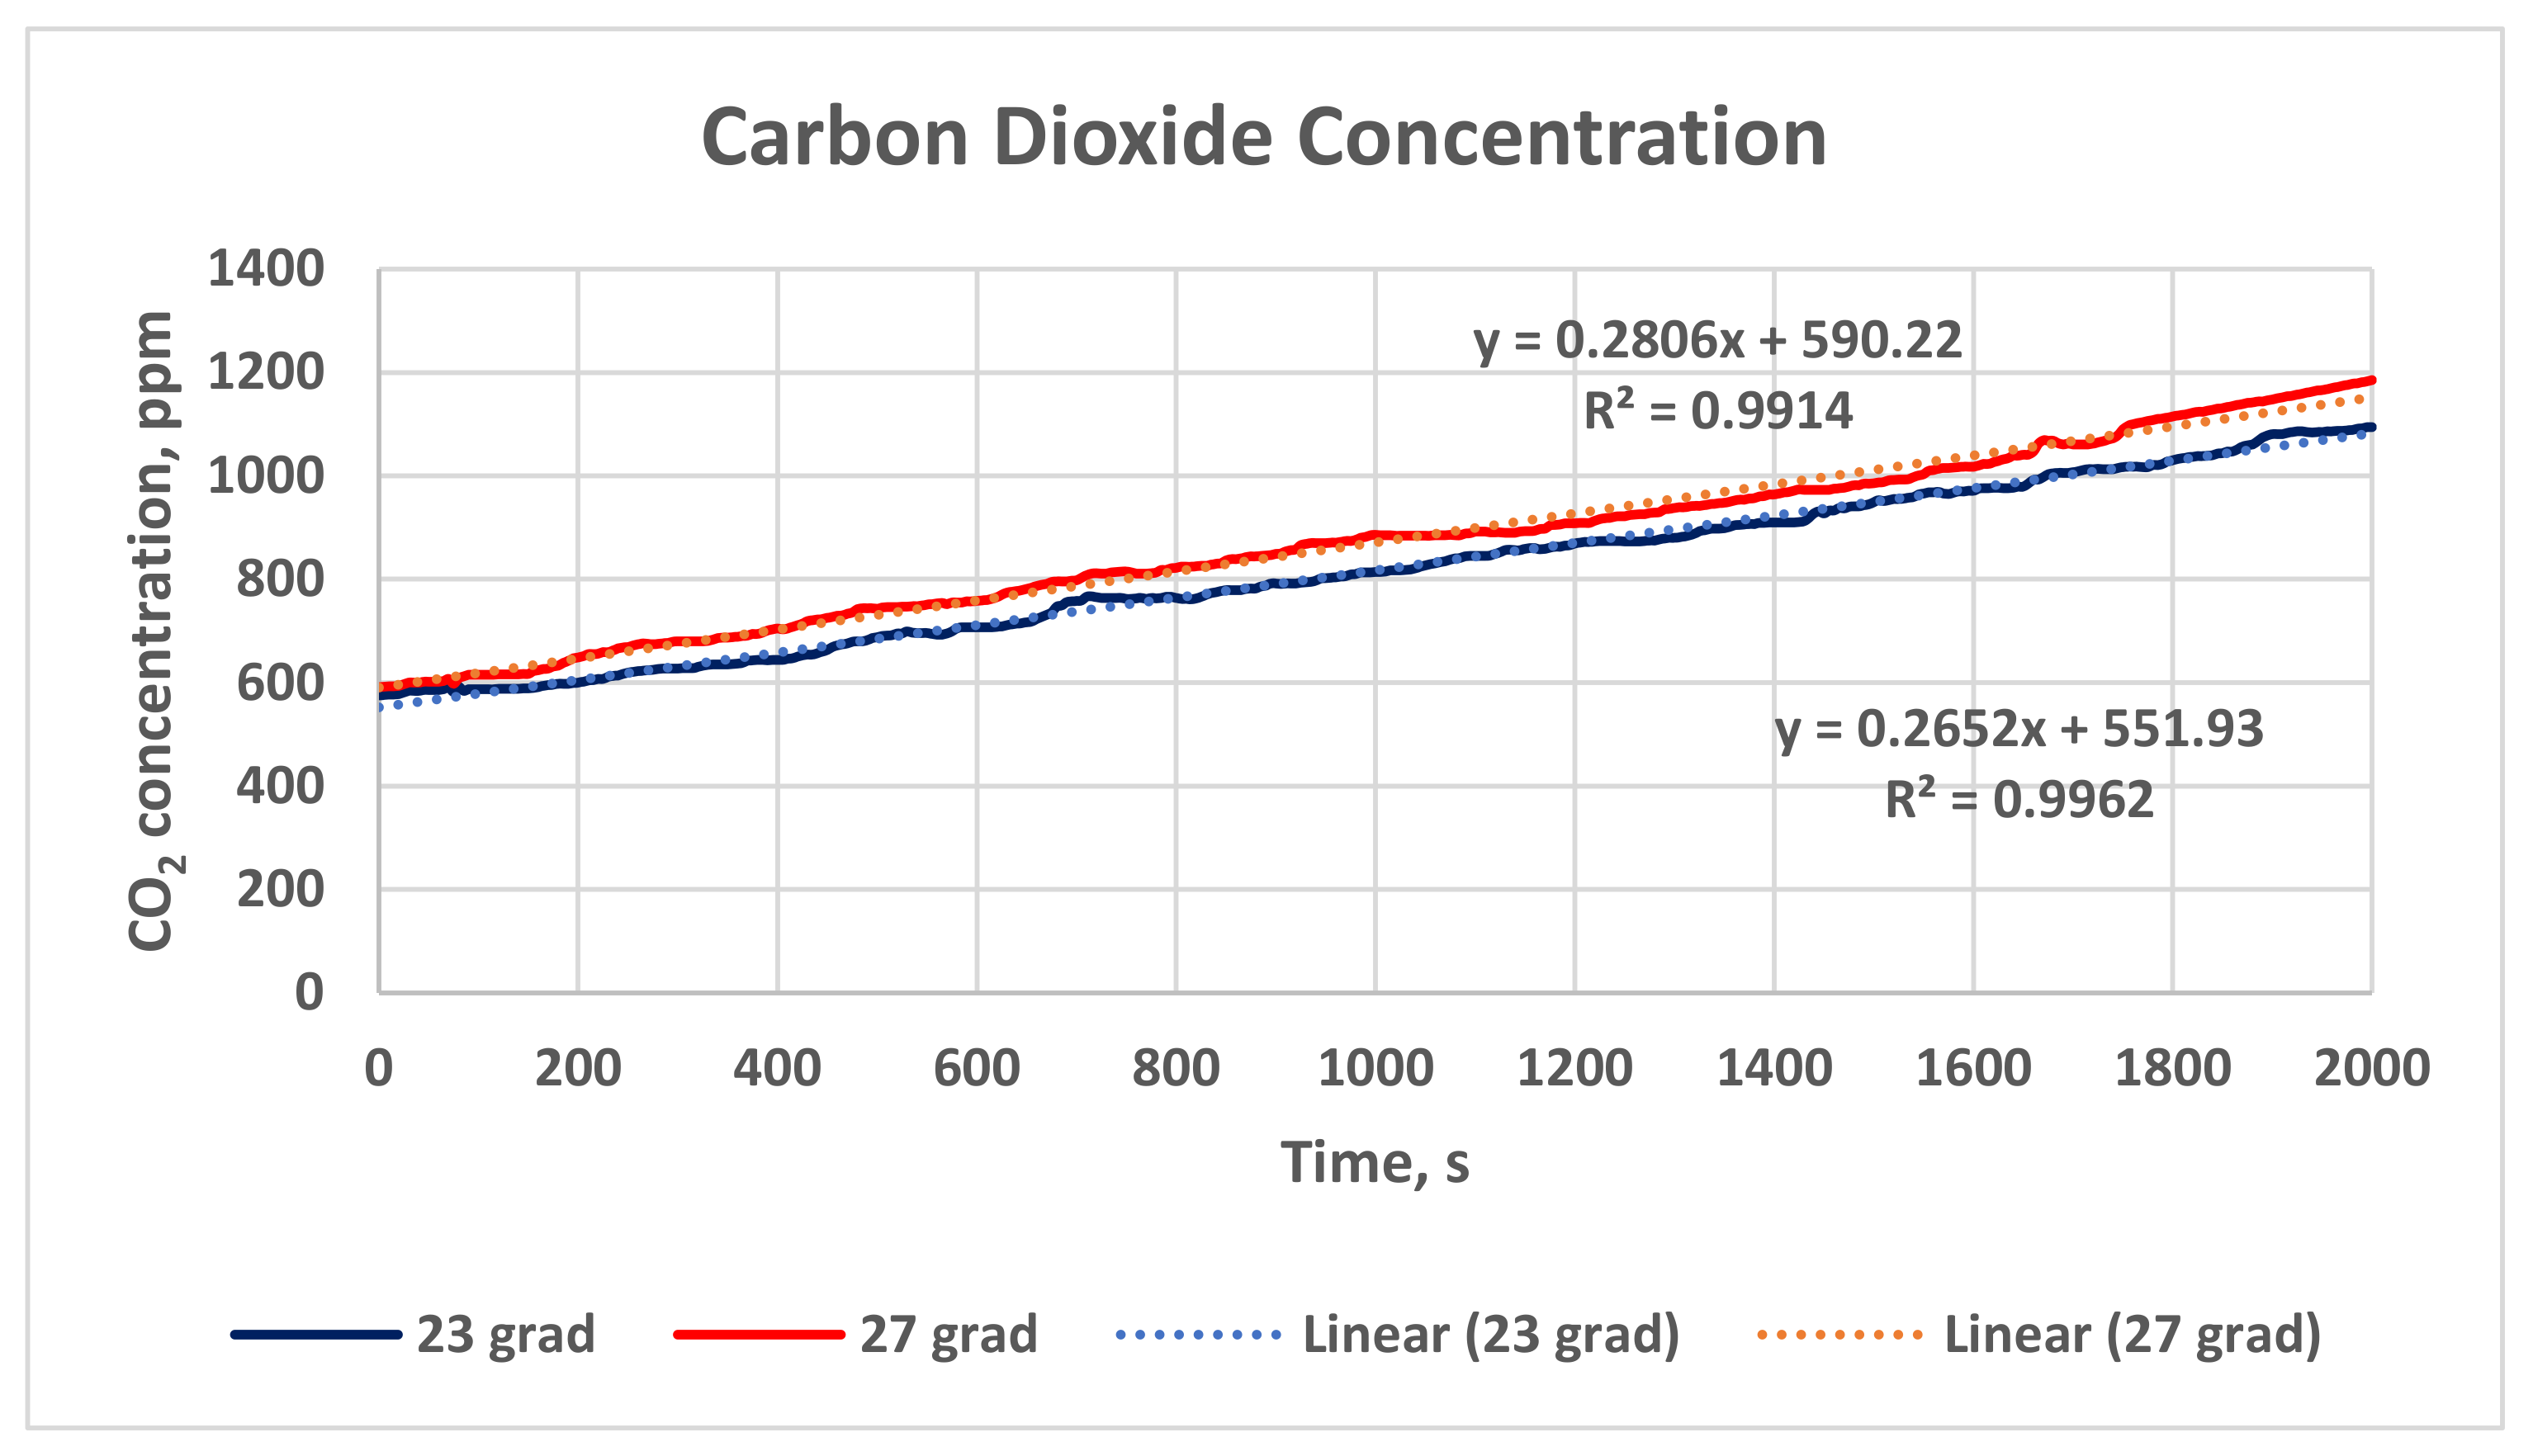
Figure 12 presents the change in the carbon dioxide concentration in the case study classroom for a time interval of 2000 s and two air temperatures: 23 °C (the blue line) and 27 °C (the red line). The mean value and standard deviation of the results for Stage 1 (27 °C) are higher than for Stage 2 (23 °C): 870.80 ± 29.52 ppm °C vs. 817.11 ± 28.58 ppm.
In addition, linear trendlines for the dependence of the CO2 accumulation on time (the dot lines) are derived for the two tested temperatures. The trendlines clearly show that the increment in the CO2 concentration in the classroom depends on the time (when the HVAC system is in a recirculation mode and the natural ventilation is impeded). The dependence is statistically very strong, as the linear correlation coefficients are r = 0.998 (for 23 °C) and r = 0.96 (for 27 °C).
The regression equations have very high coefficients of determination R
2, as shown in
Figure 12 (the dot lines):
For air temperature 23 °C, the mass of the CO
2 in the air volume of the classroom
MCO2 increases with time, following the equation (coefficient of determination R
2 = 0.9962):
where t is the time.
For air temperature 27 °C, the mass of the CO
2 in the air volume of the classroom
MCO2 increases with time, following the equation (coefficient of determination R
2 = 0.9914):
Based on Student’s
t-test, the statistical analysis shows a proven difference between the CO
2 concentration in Stage 1 and Stage 2 (the red and blue lines in
Figure 12). The statistical value (absolute value) of the
t-test is higher than the critical value (
tstat = 4.79,
tcrit = 1.96 (α = 0.05)), which proves the hypothesis that the indoor air temperature influenced the accumulation of the CO
2 in the classroom.
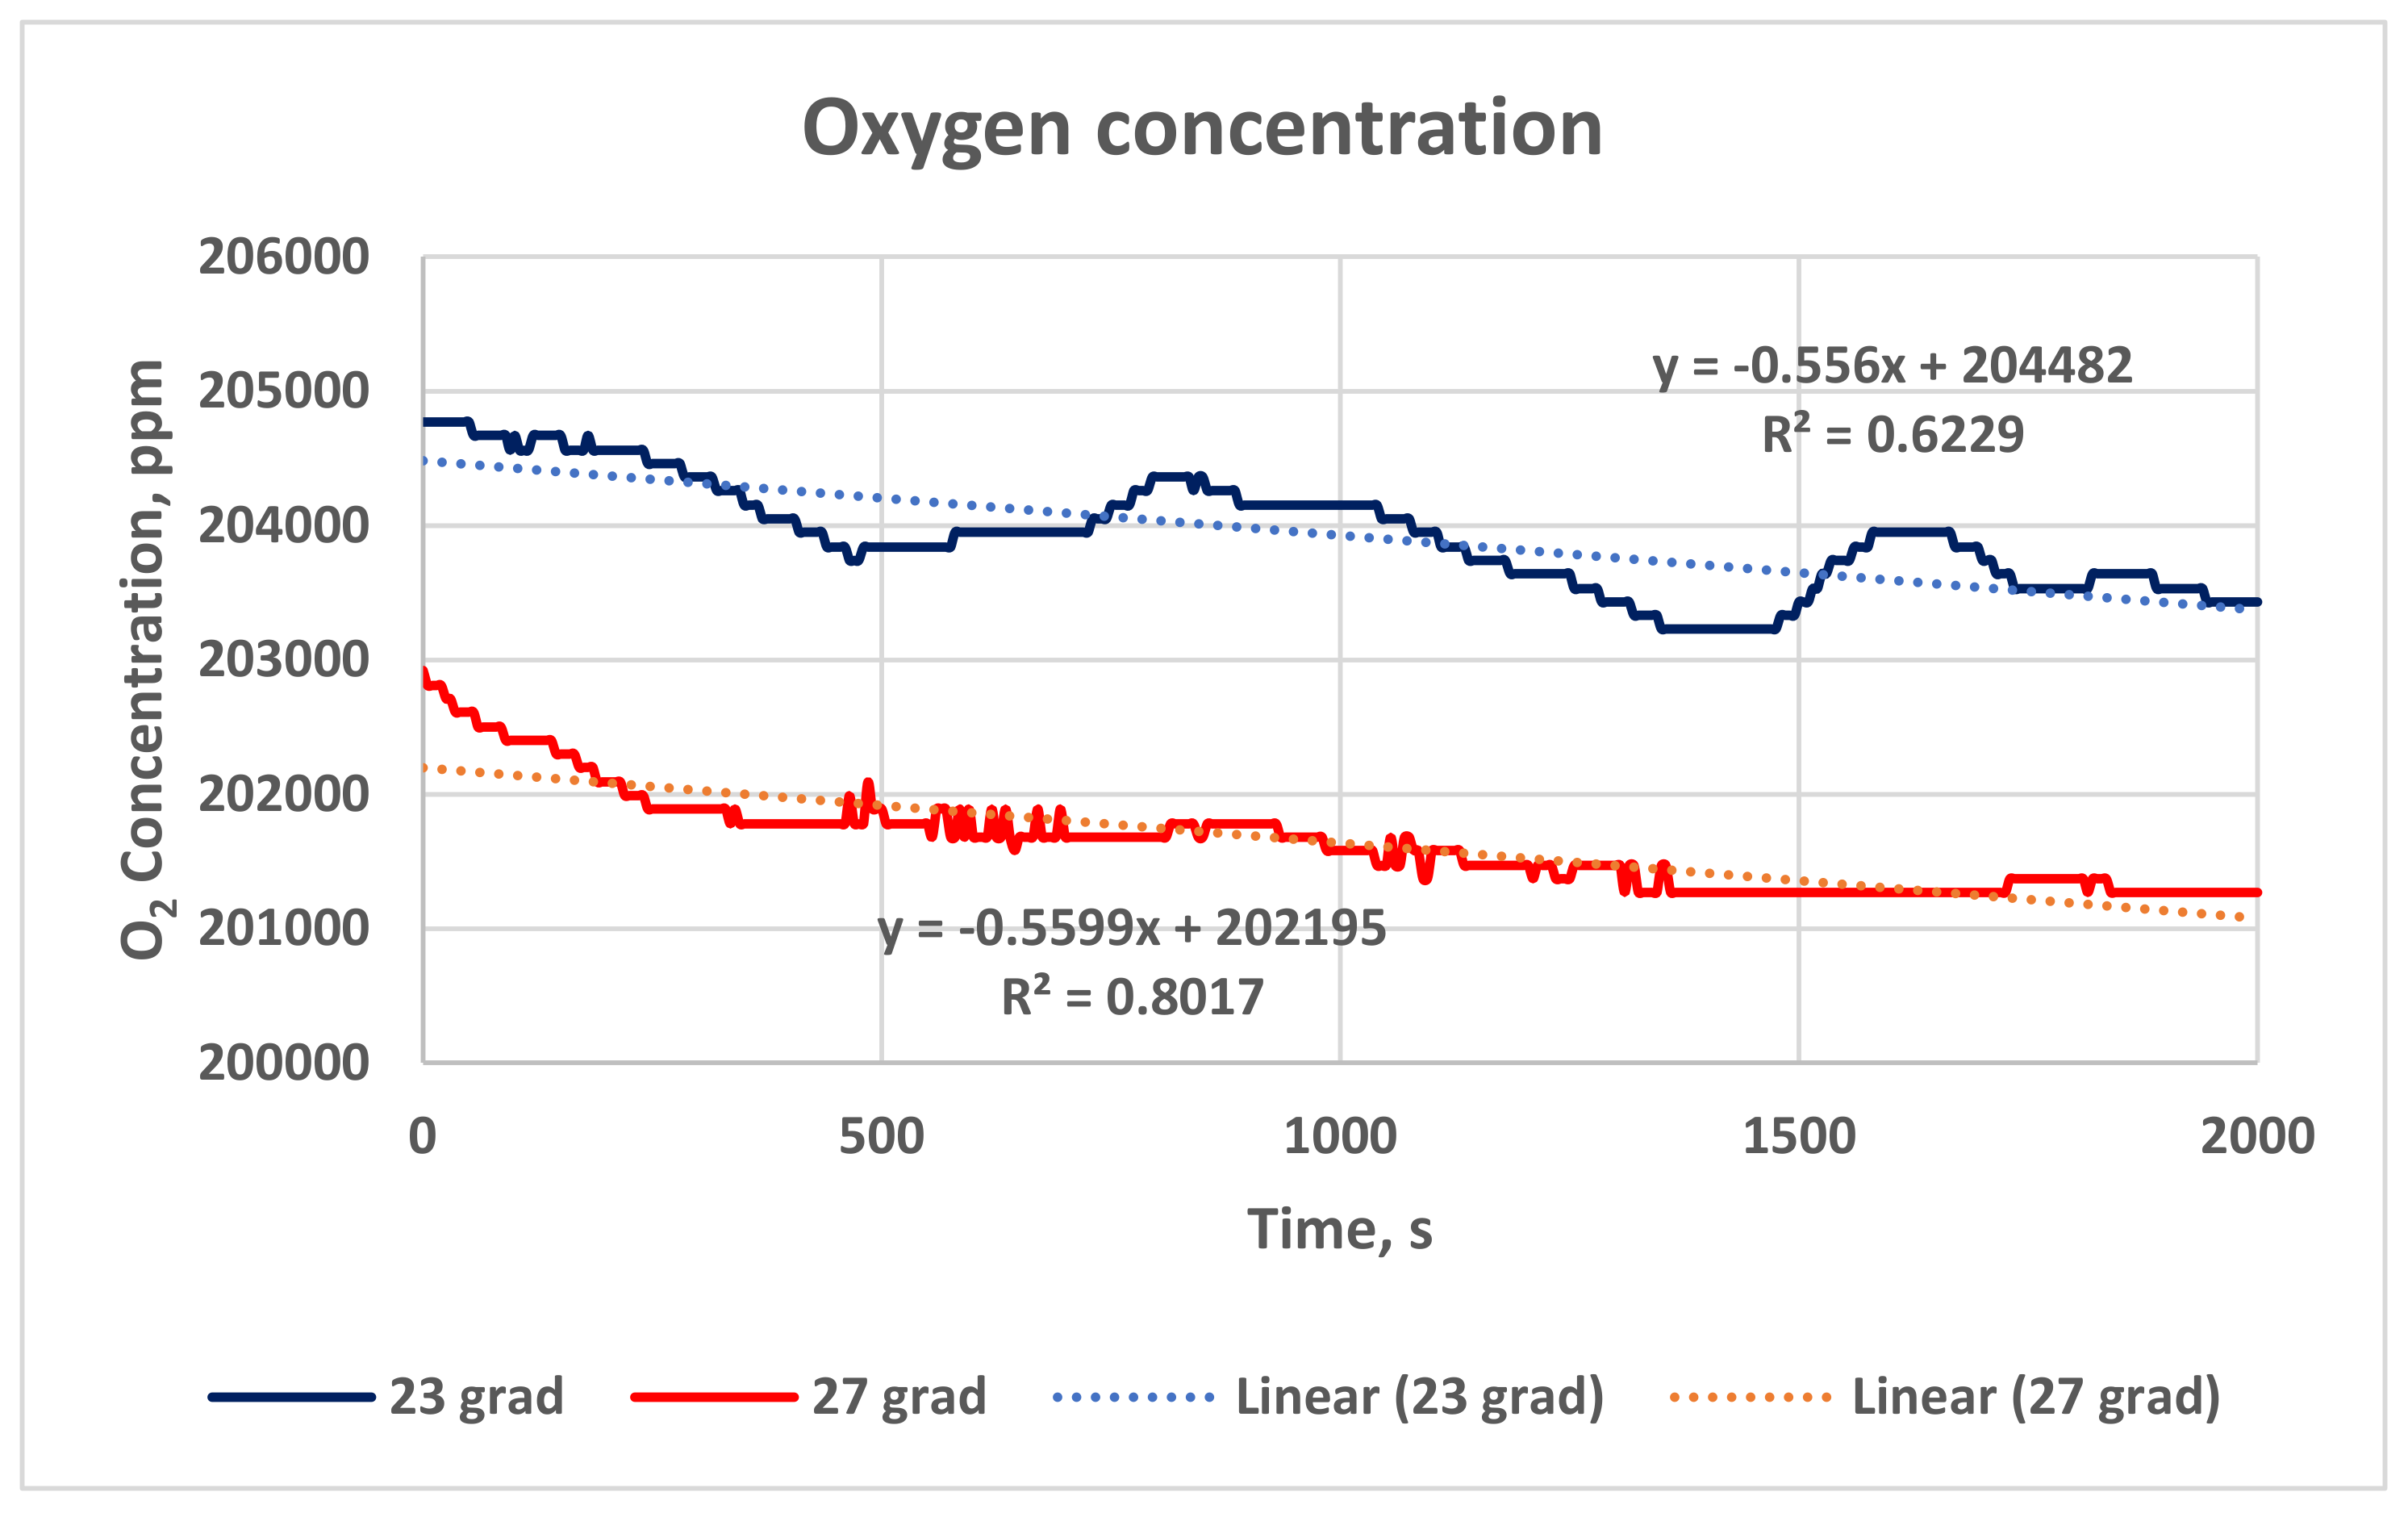
Figure 13 compares the oxygen concentration in the case study classroom for the studied air temperatures: 23 °C (the blue line) and 27 °C (the red line). The mean value and standard deviation of the results for Stage 1 (27 °C) are lower than for Stage 2 (23 °C): 201,635.16 ± 362.39 ppm vs. 203,925.76 ± 408.29 ppm.
Trendlines are derived for the change in the O2 concentration with time. The higher fluctuations in the O2 concentration in Stage 2 (23 °C) may precondition lower linear correlation coefficients for the obtained linear dependence r = 0.789; for Stage 1 (27 °C), r = 0.895. The linear correlation coefficients are high enough to prove the existence of linear dependence.
The regression equations derived are as follows (
Figure 13, the dotted lines):
For air temperature 23 °C, the mass of the O
2 in the air volume of the classroom
MO2 decreases with time, following the equation (coefficient of determination R
2 = 0.6229):
For air temperature 27 °C, the mass of the O
2 in the air volume of the classroom
MO2 decreases with time, following the equation (coefficient of determination R
2 = 0.8017):
Student’s
t-test shows a statistically proven difference between the O
2 concentration in Stage 1 and Stage 2 (the red and blue lines in
Figure 12):
tstat = 83.81,
tcrit = 1.96 (α = 0.05).
Figure 14 presents the room air temperature during the measurements in the classroom. The graphs are also proof of the actual temperature during the study. The temperature in Stage 1 is 27.4 ± 0.48 °C, and in Stage 2, it is 23.7 ± 0.32 °C.
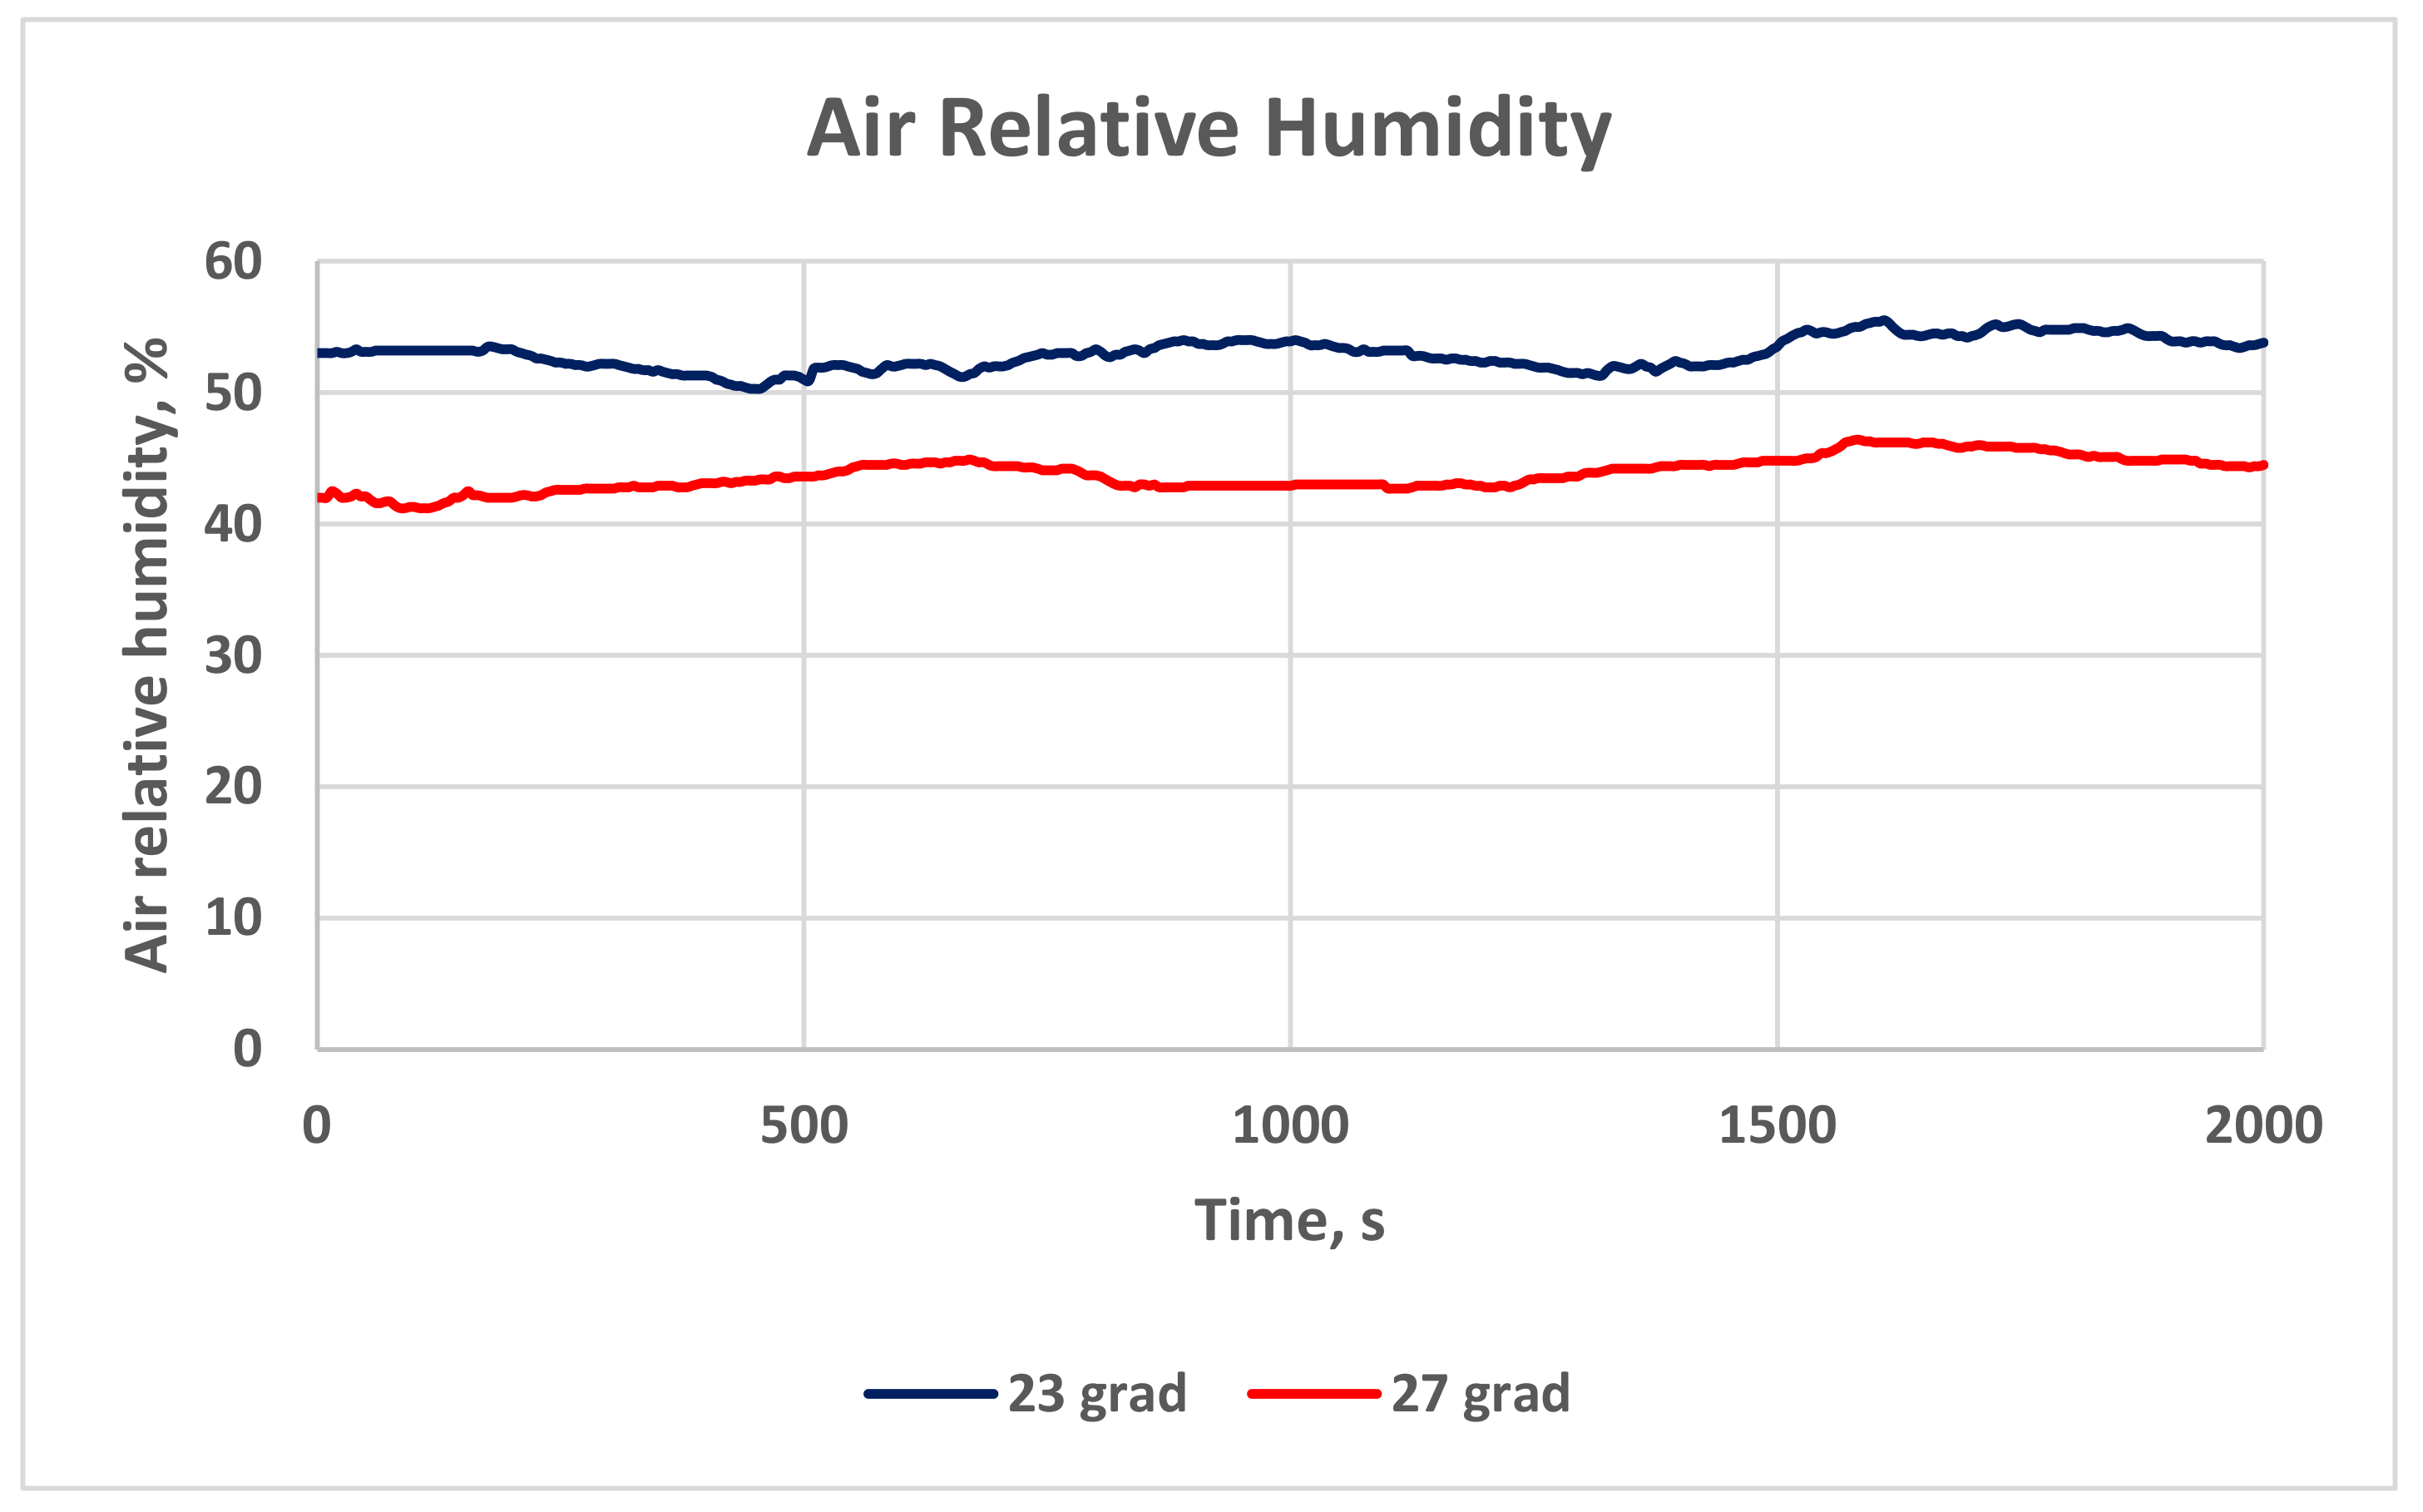
The relative humidity measurements are shown in
Figure 15. The relative humidity in Stage 1 is 43.8 ± 1.3%, and in Stage 2, it is 52.9 ± 1.2%.
The air pressure in the classroom remains constant during the measurements: 946.6 hPa.
3.2. Measurements in the Climate Chamber
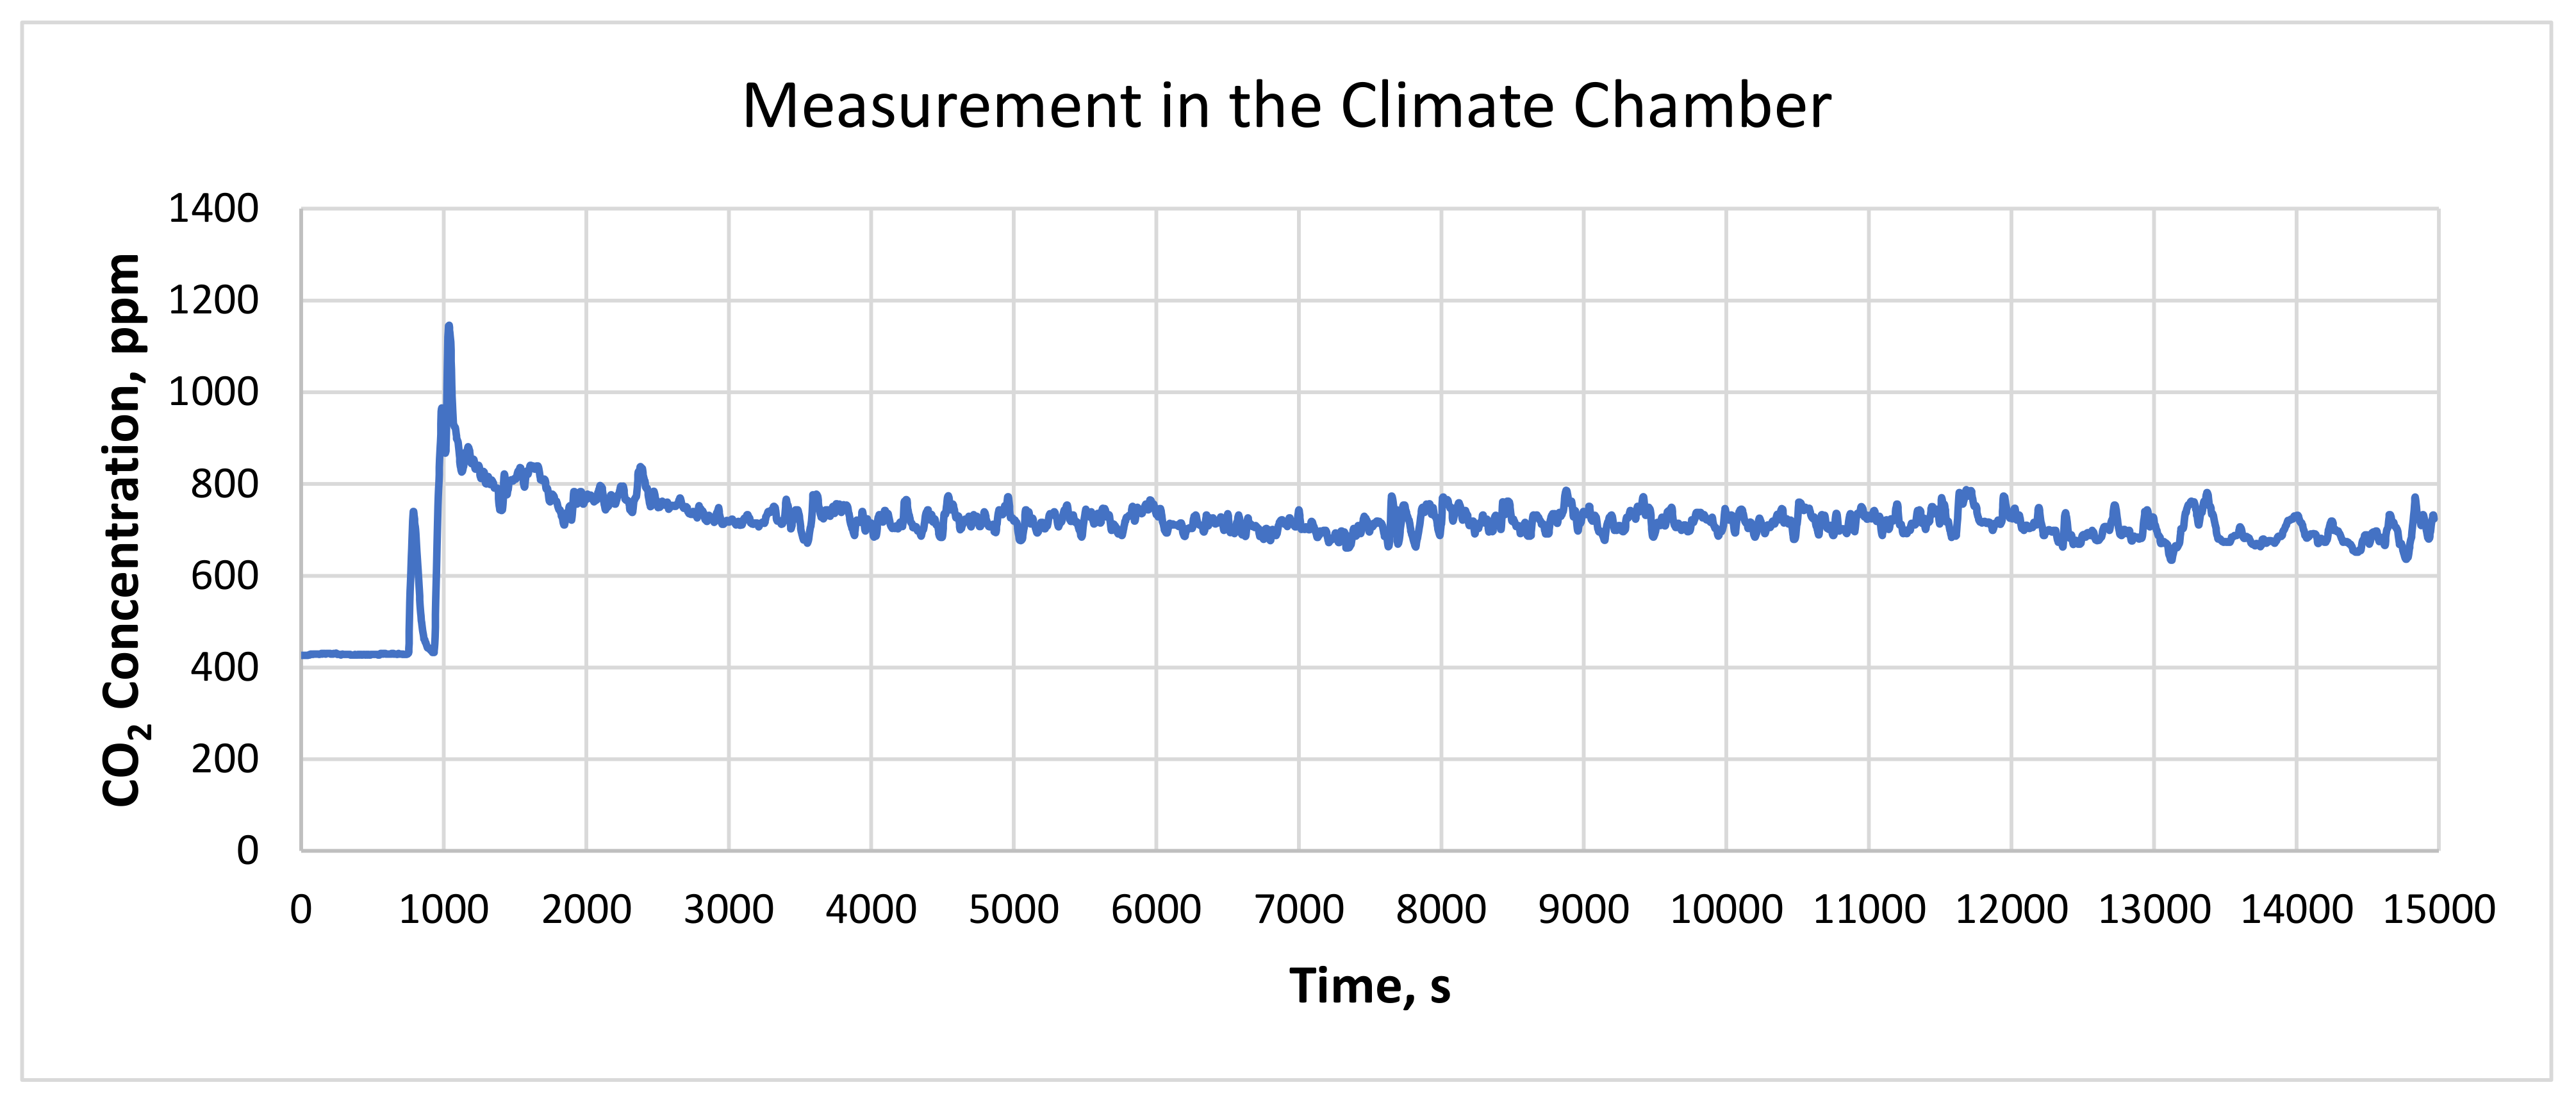
The whole record (14,966 s) of the CO
2 concentration measured in the climate chamber is shown in
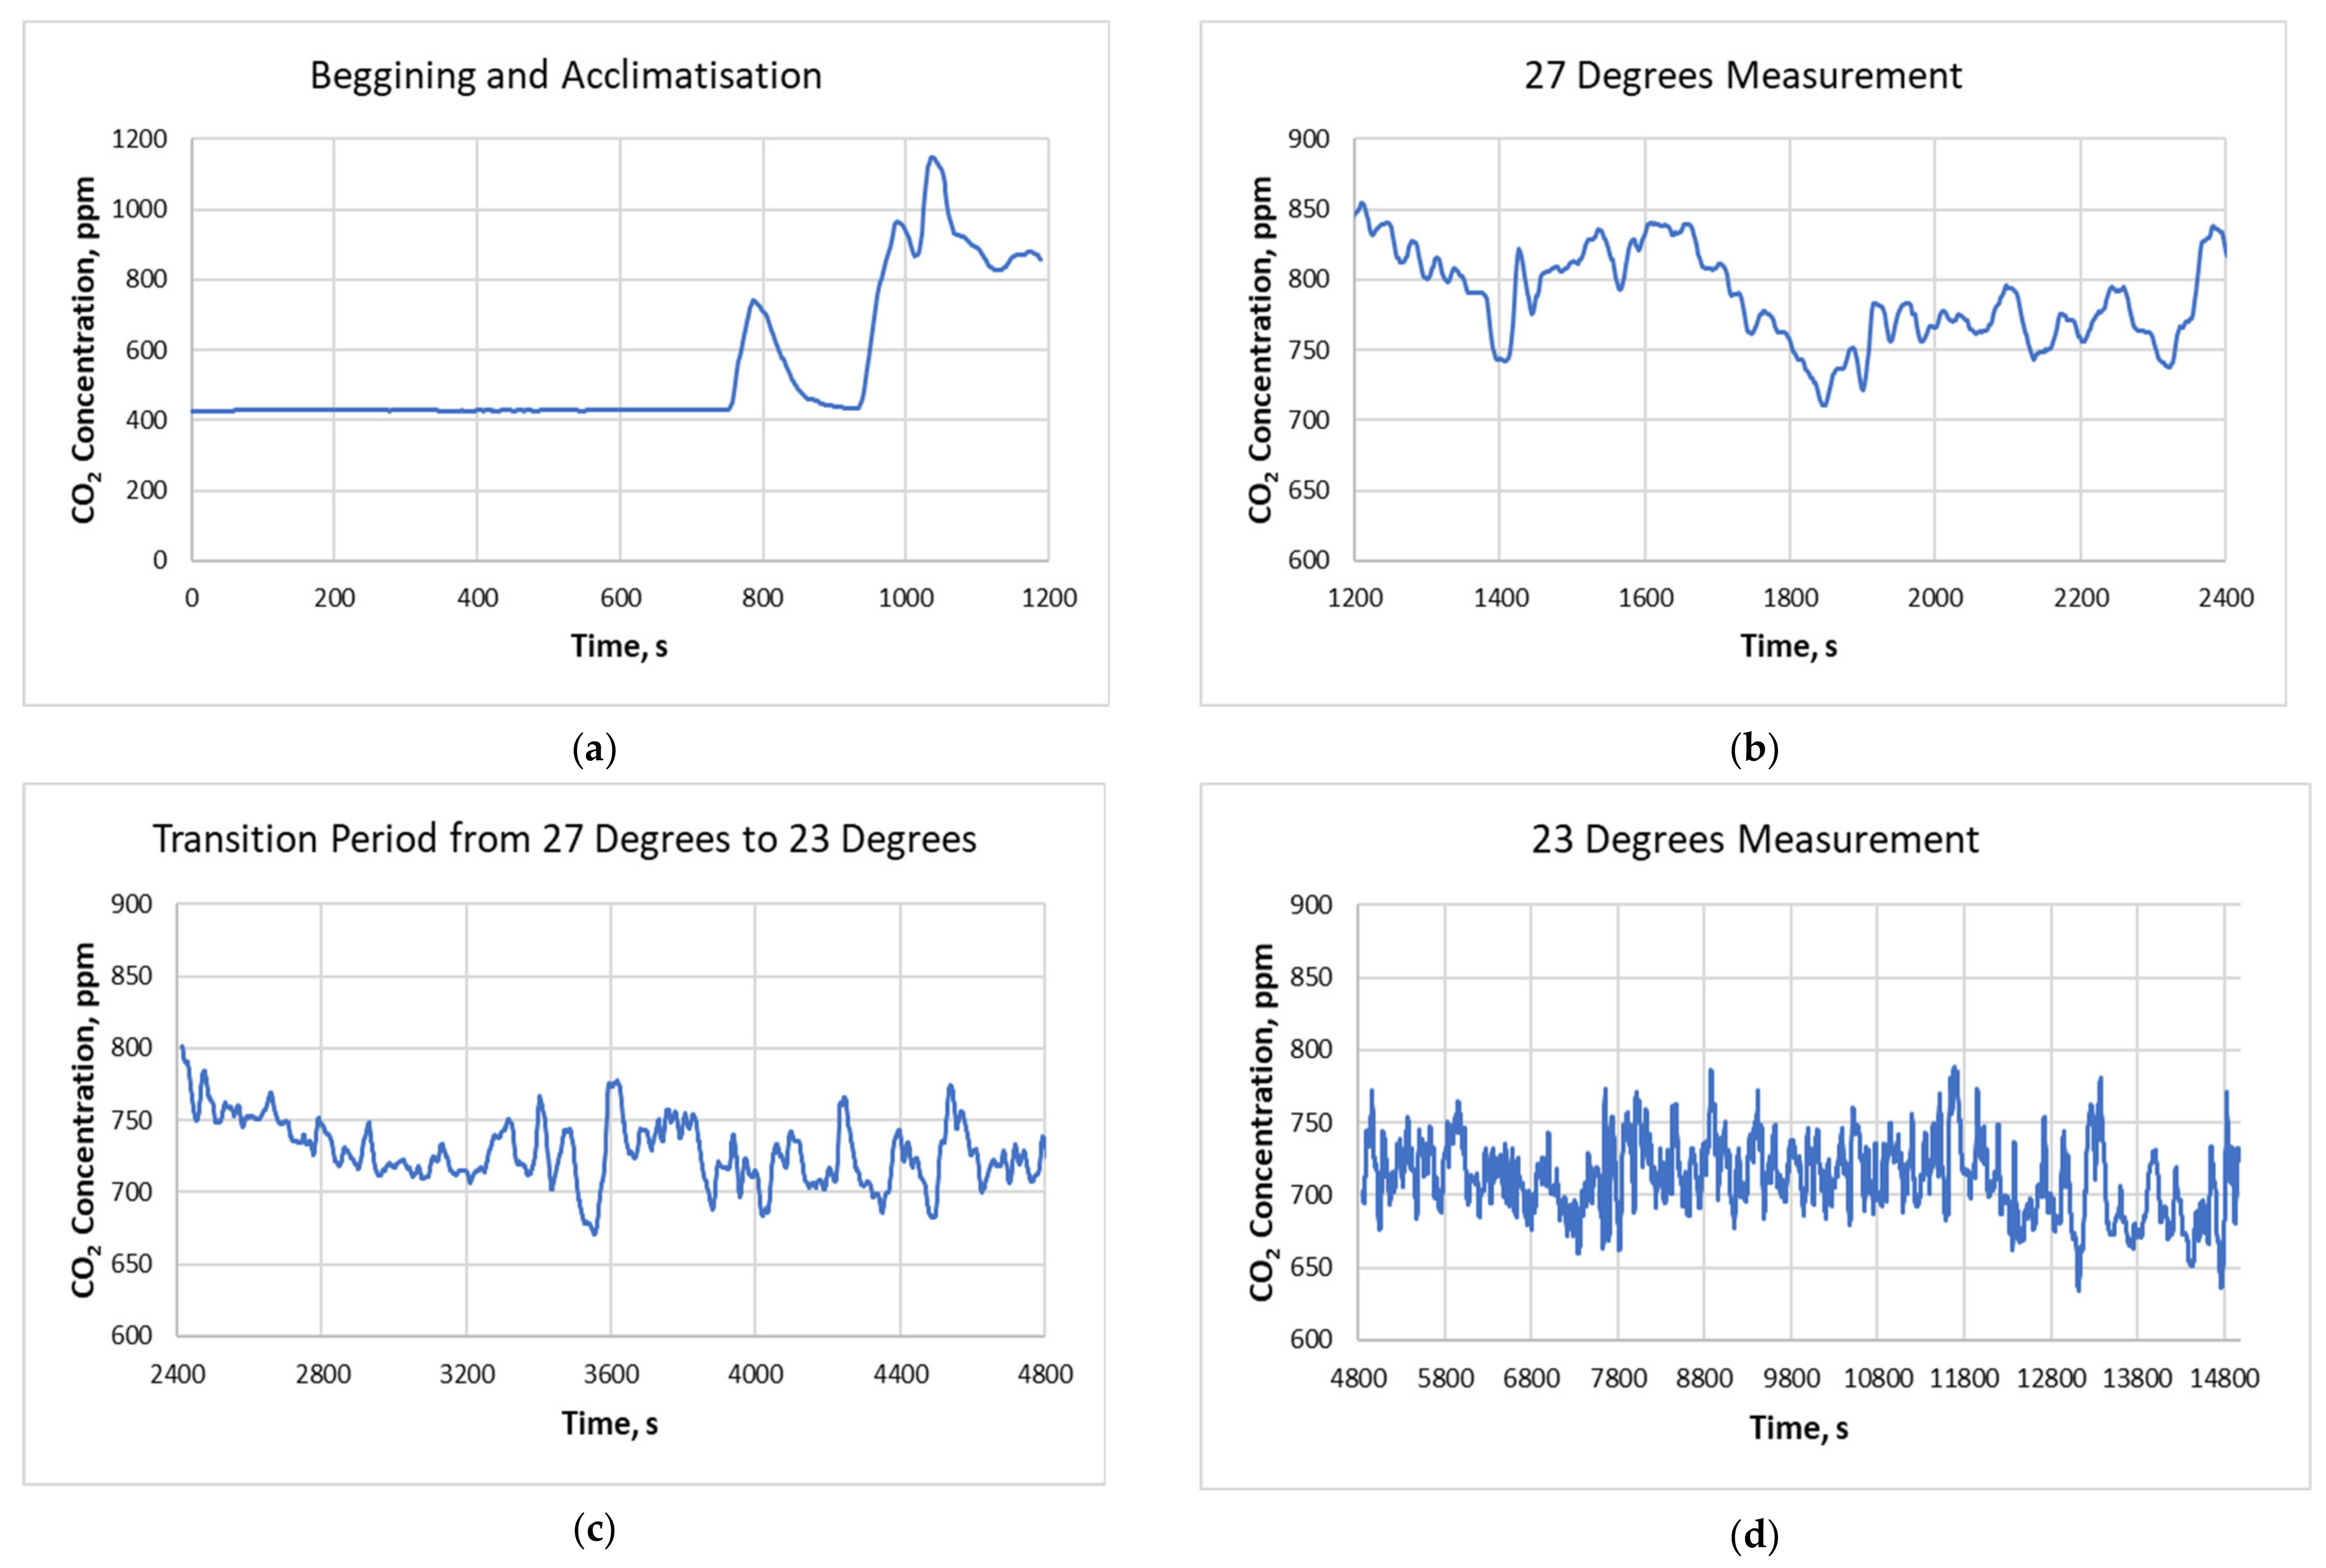
Figure 16. A breakdown of the record is presented in
Figure 17 to distinguish between the individual measurement periods. The initial CO
2 concentration in the EC and the participant’s adaptation period is shown in
Figure 17a. The change in the CO
2 concentration during the constant operative temperature of 27 °C is illustrated in
Figure 17b. The results for the transition period, when the HVAC system control set a temperature decrease from 27 °C to 23 °C, are shown in
Figure 17c. The longest period of exposure, presented in
Figure 17d, was the last one when the exposure was at 23 °C operative temperature.
Table 1 shows the results for the CO
2 concentration in the climate chamber for the different periods.
Student’s
t-test shows a statistically proven difference between the CO
2 concentration in the exposure period with 27 °C air temperature (
Figure 17b) and the transition period (
Figure 17c):
tstat = 40.49,
tcrit = 1.96 (α = 0.05). The same statistical evidence was obtained comparing the CO
2 concentration in the exposure period with 27 °C air temperature (
Figure 17b) and the exposure period with 23 °C air temperature (
Figure 17d):
tstat = 55.00,
tcrit = 1.96 (α = 0.05).
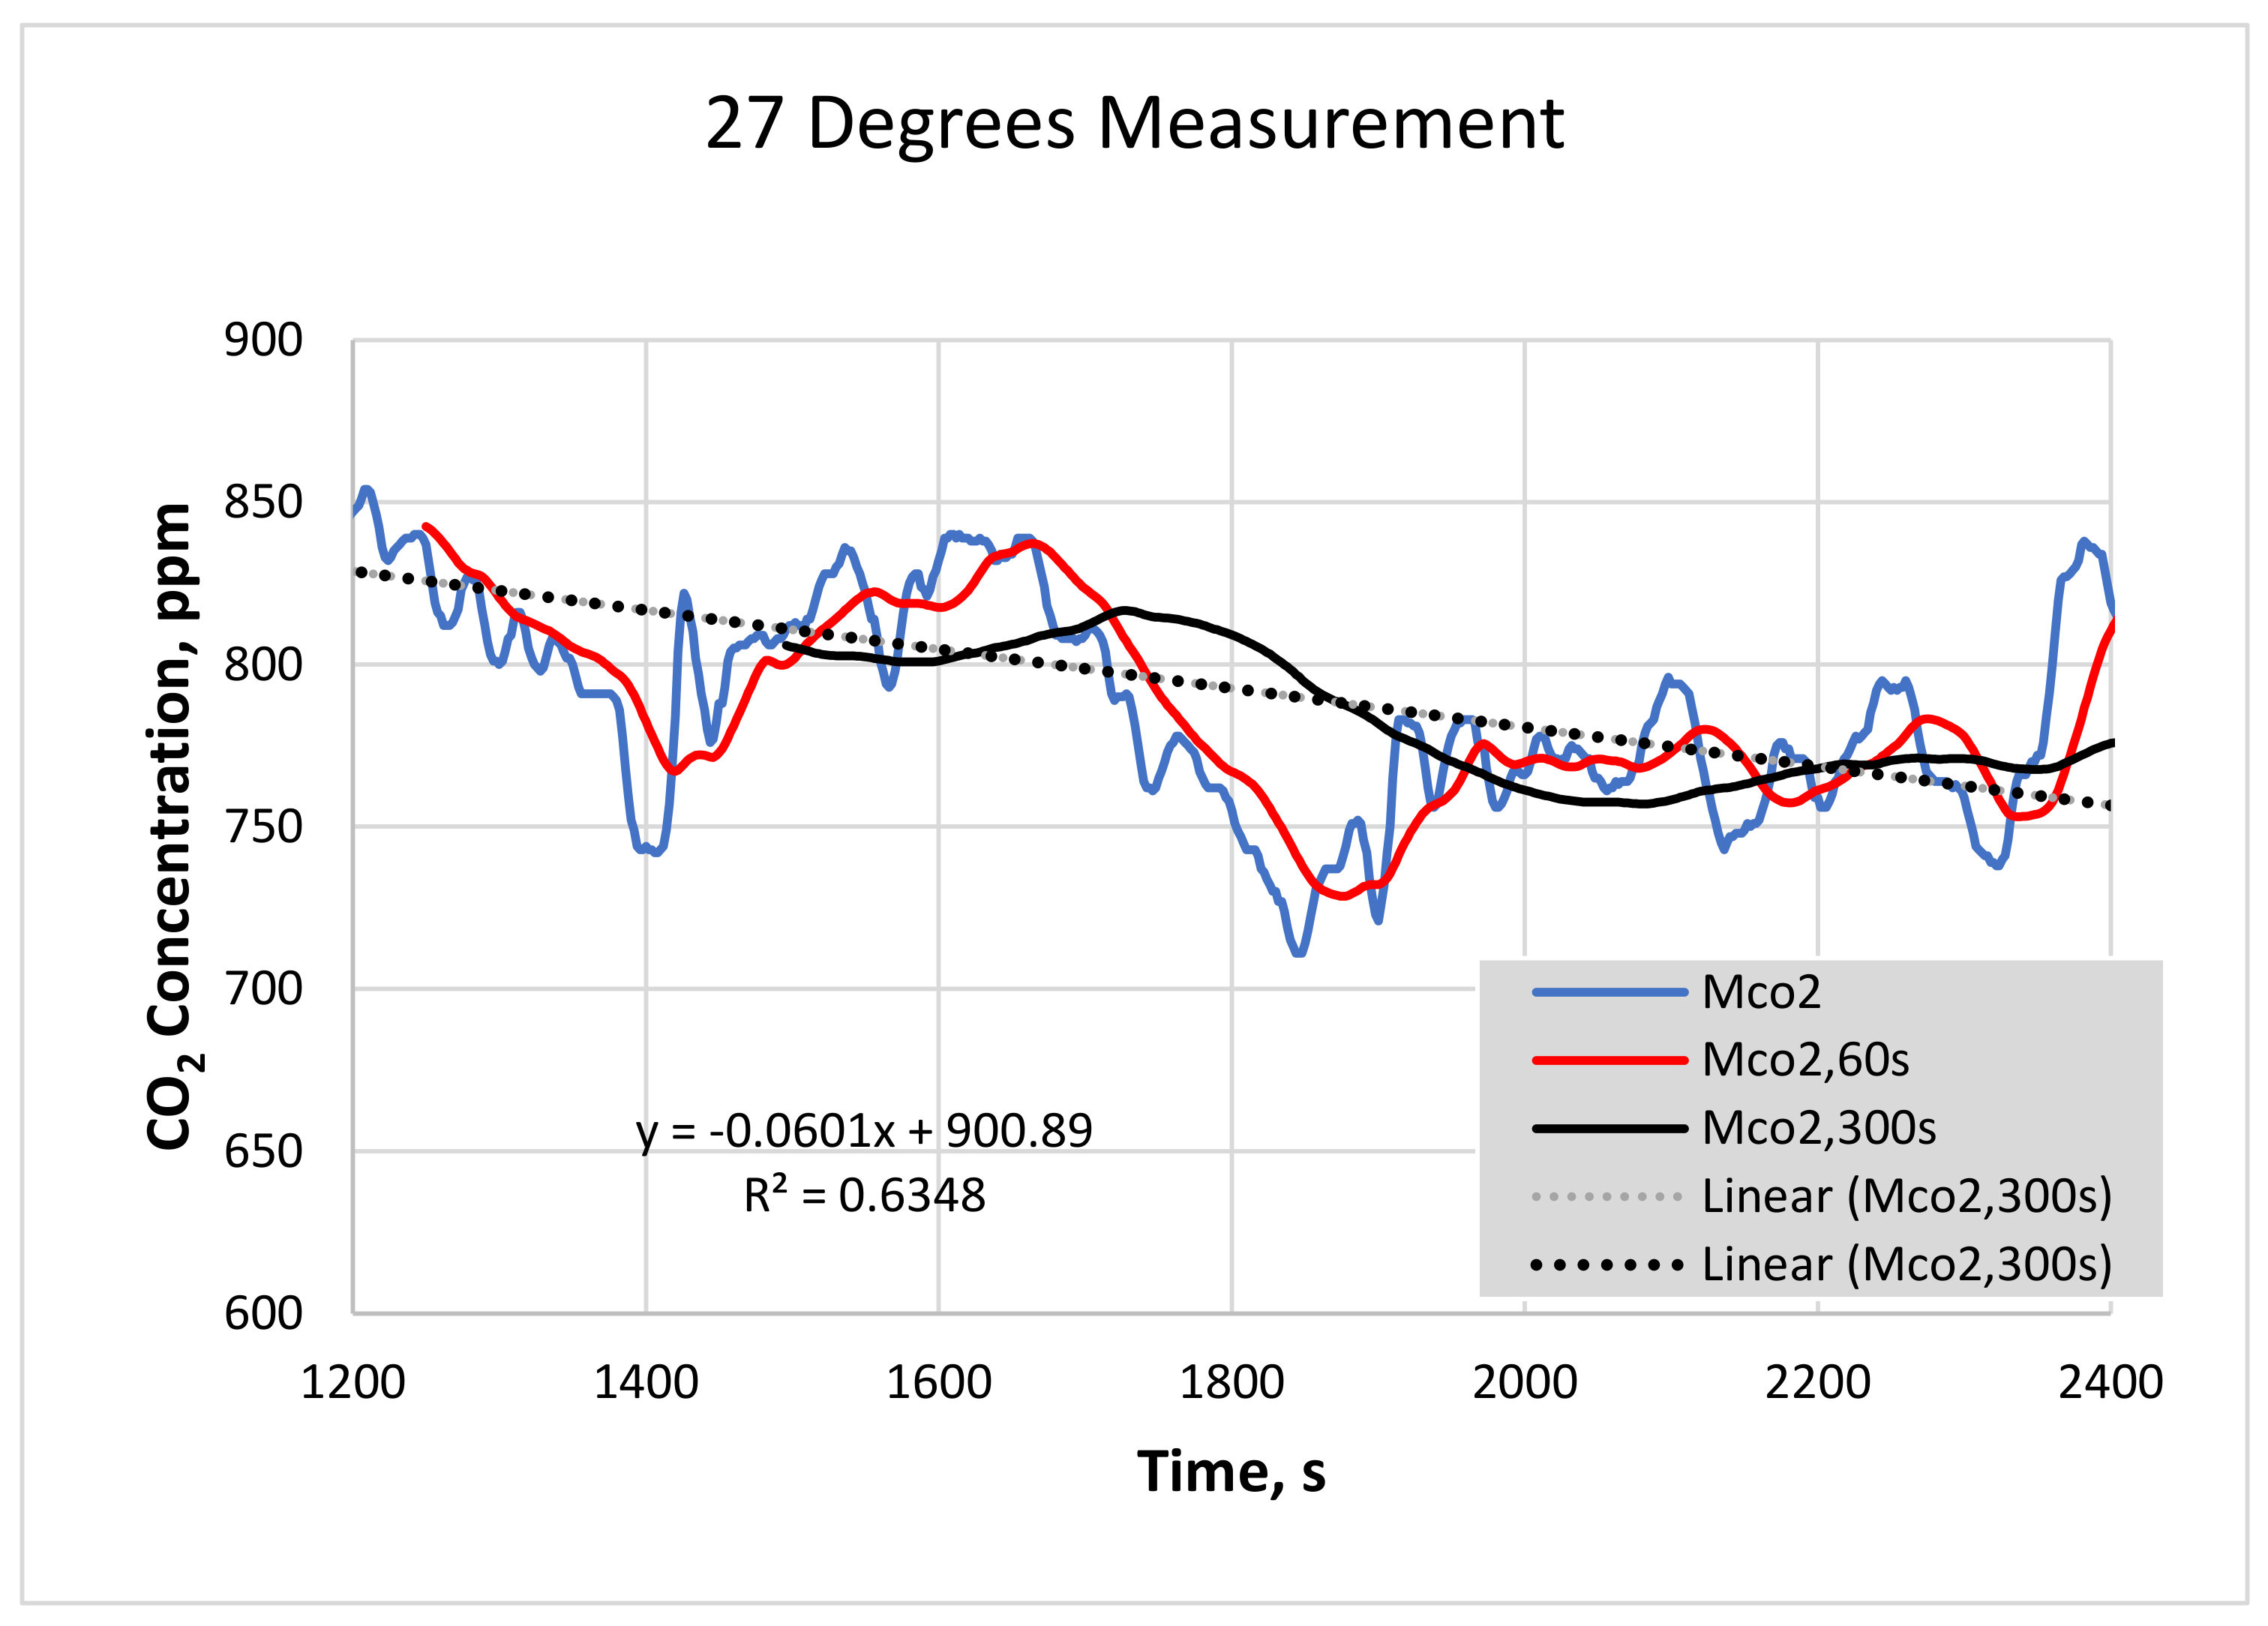
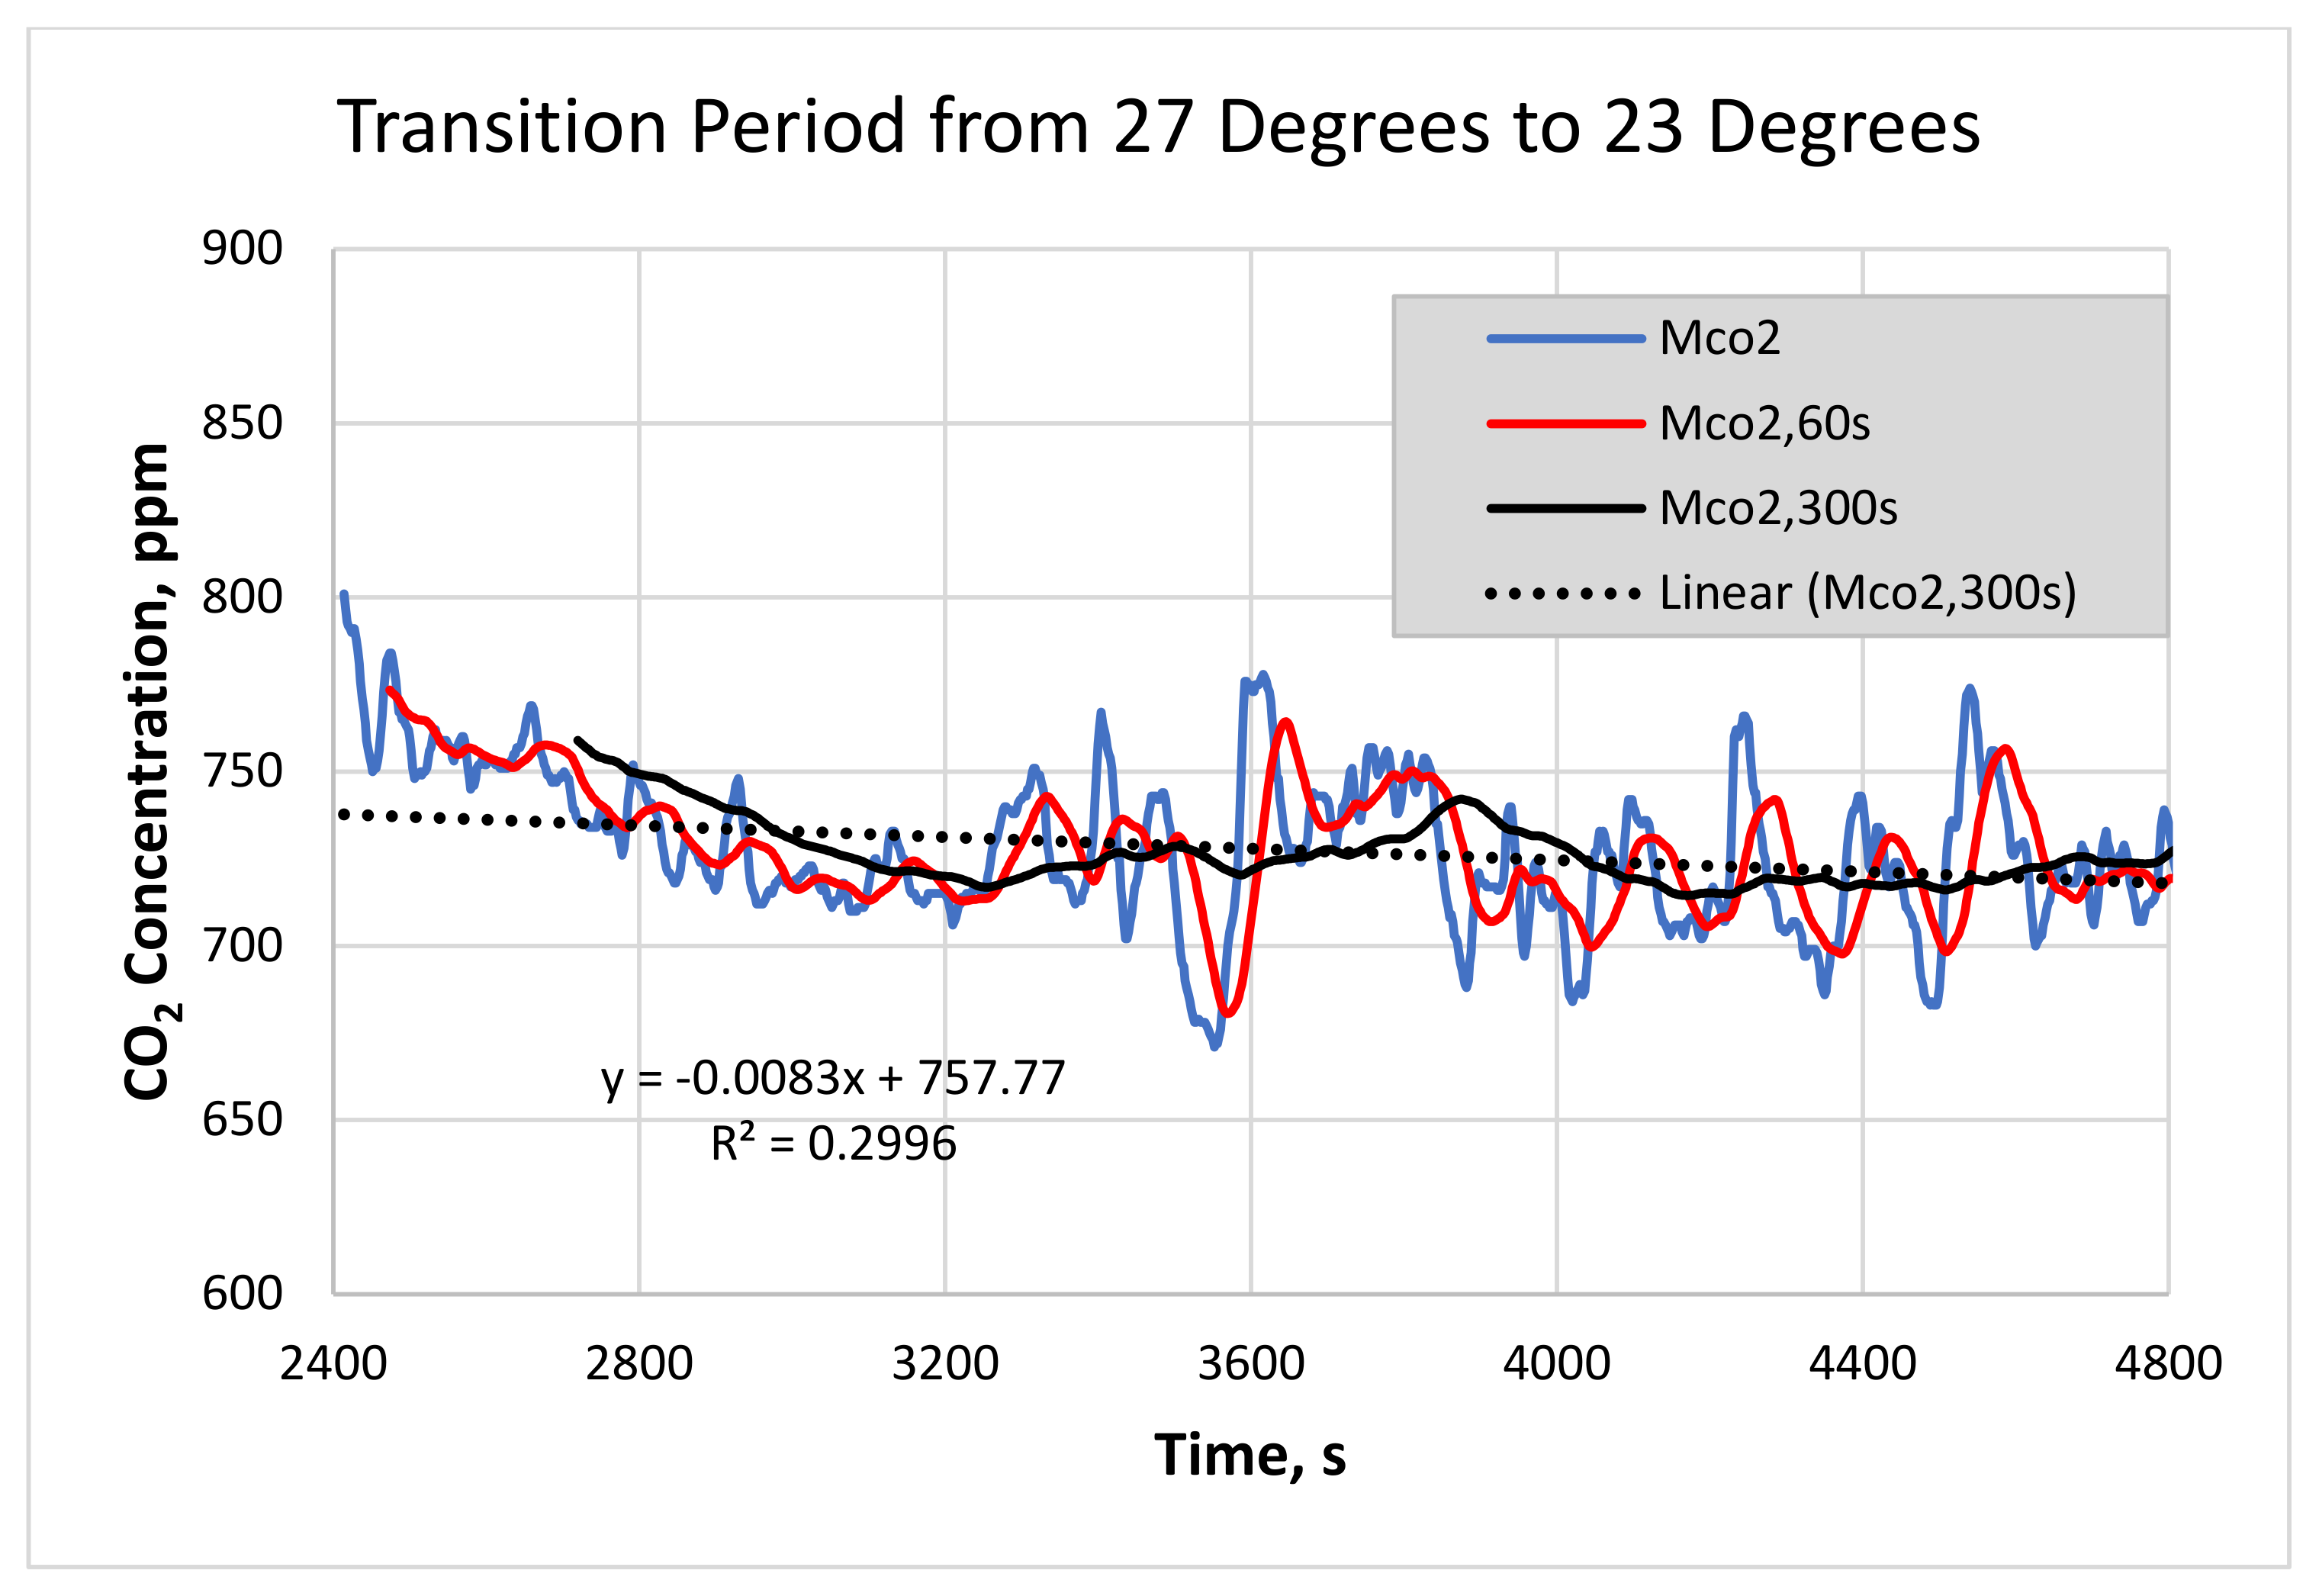
Together with the instantaneous data of the CO
2 concentration, additional data processing was done for three of the four periods (except the initial and acclimatisation period) to help analyse the data.
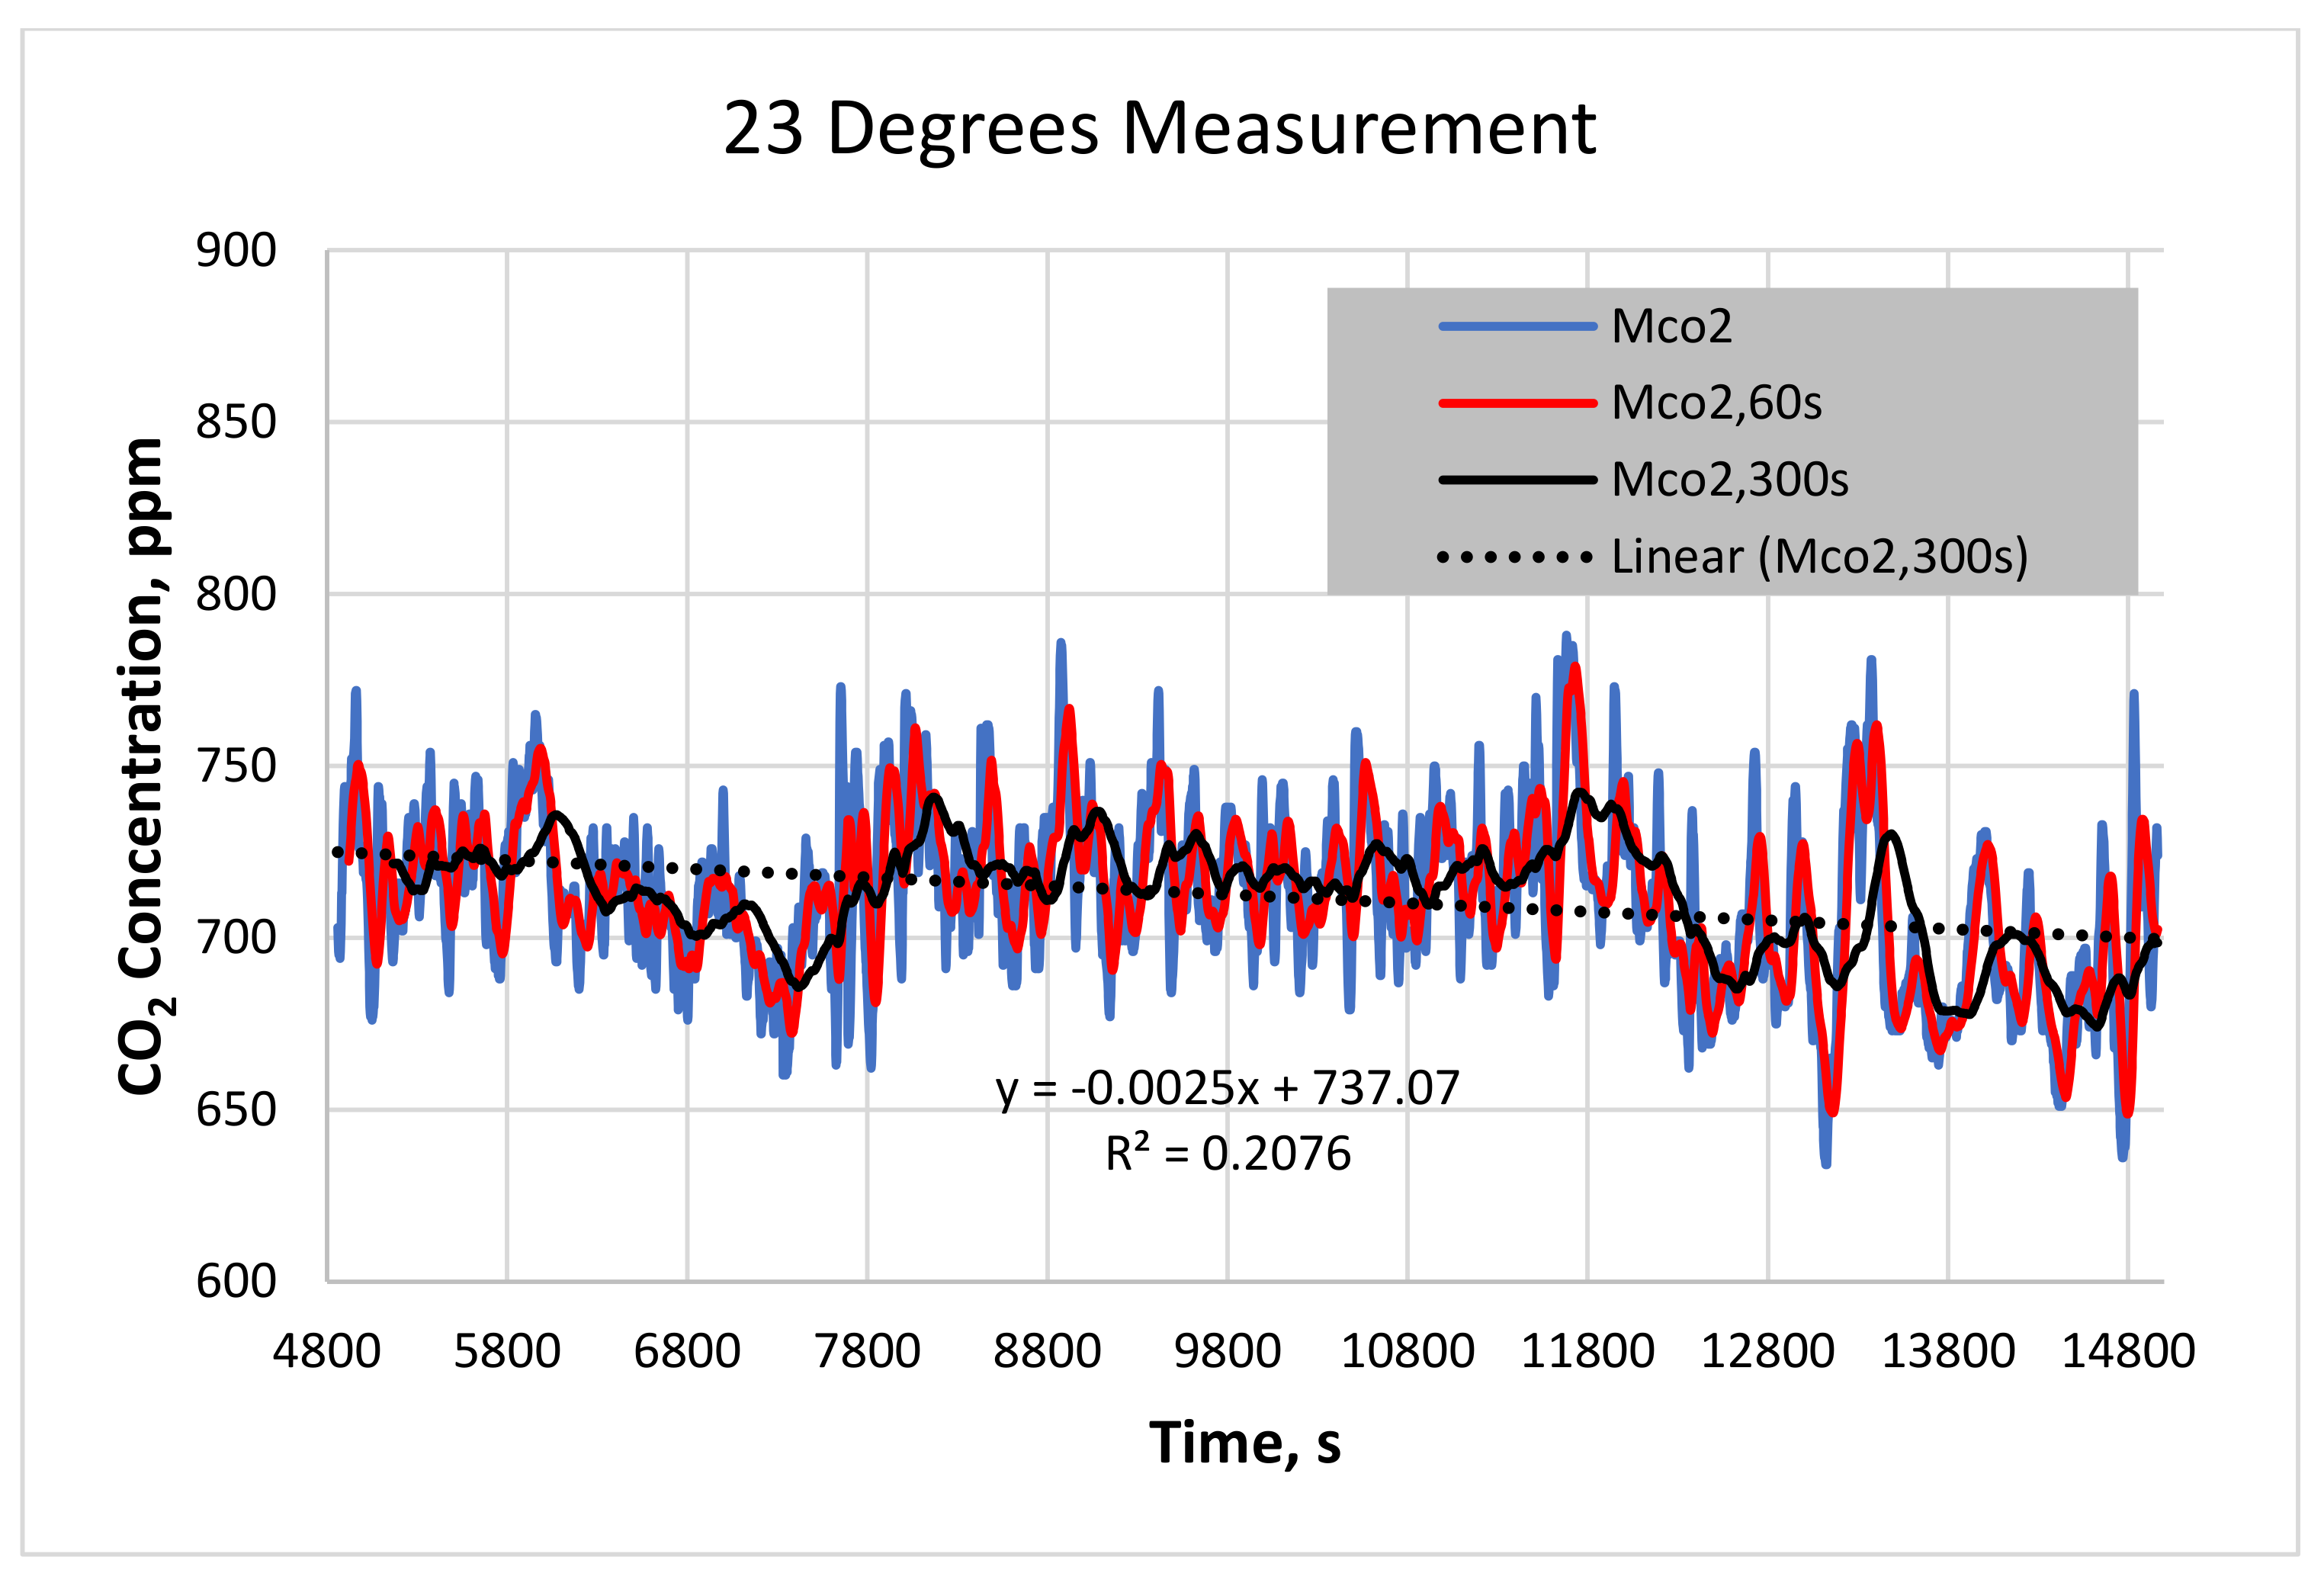
Figure 18,
Figure 19 and
Figure 20 shows the original data for the CO
2 concentration (blue curves), together with the evolution curve of the CO
2 concentration, time-averaged for 60 s, Mco
2,60s (red curves) and time-averaged for 300 s, Mco
2,300s (black curves). Additional processing was done on the time-averaged 300 s curves (Mco
2,300s), and regression equations were derived (black dot lines) to assess their tendency. The equations are of linear type, written in the figures together with the regression coefficient R
2. All derived linear dependences have low regression coefficients, but this is not so important, as the derived linear equations are used only to assess the tendency, ascending or descending, and not for forecasting.
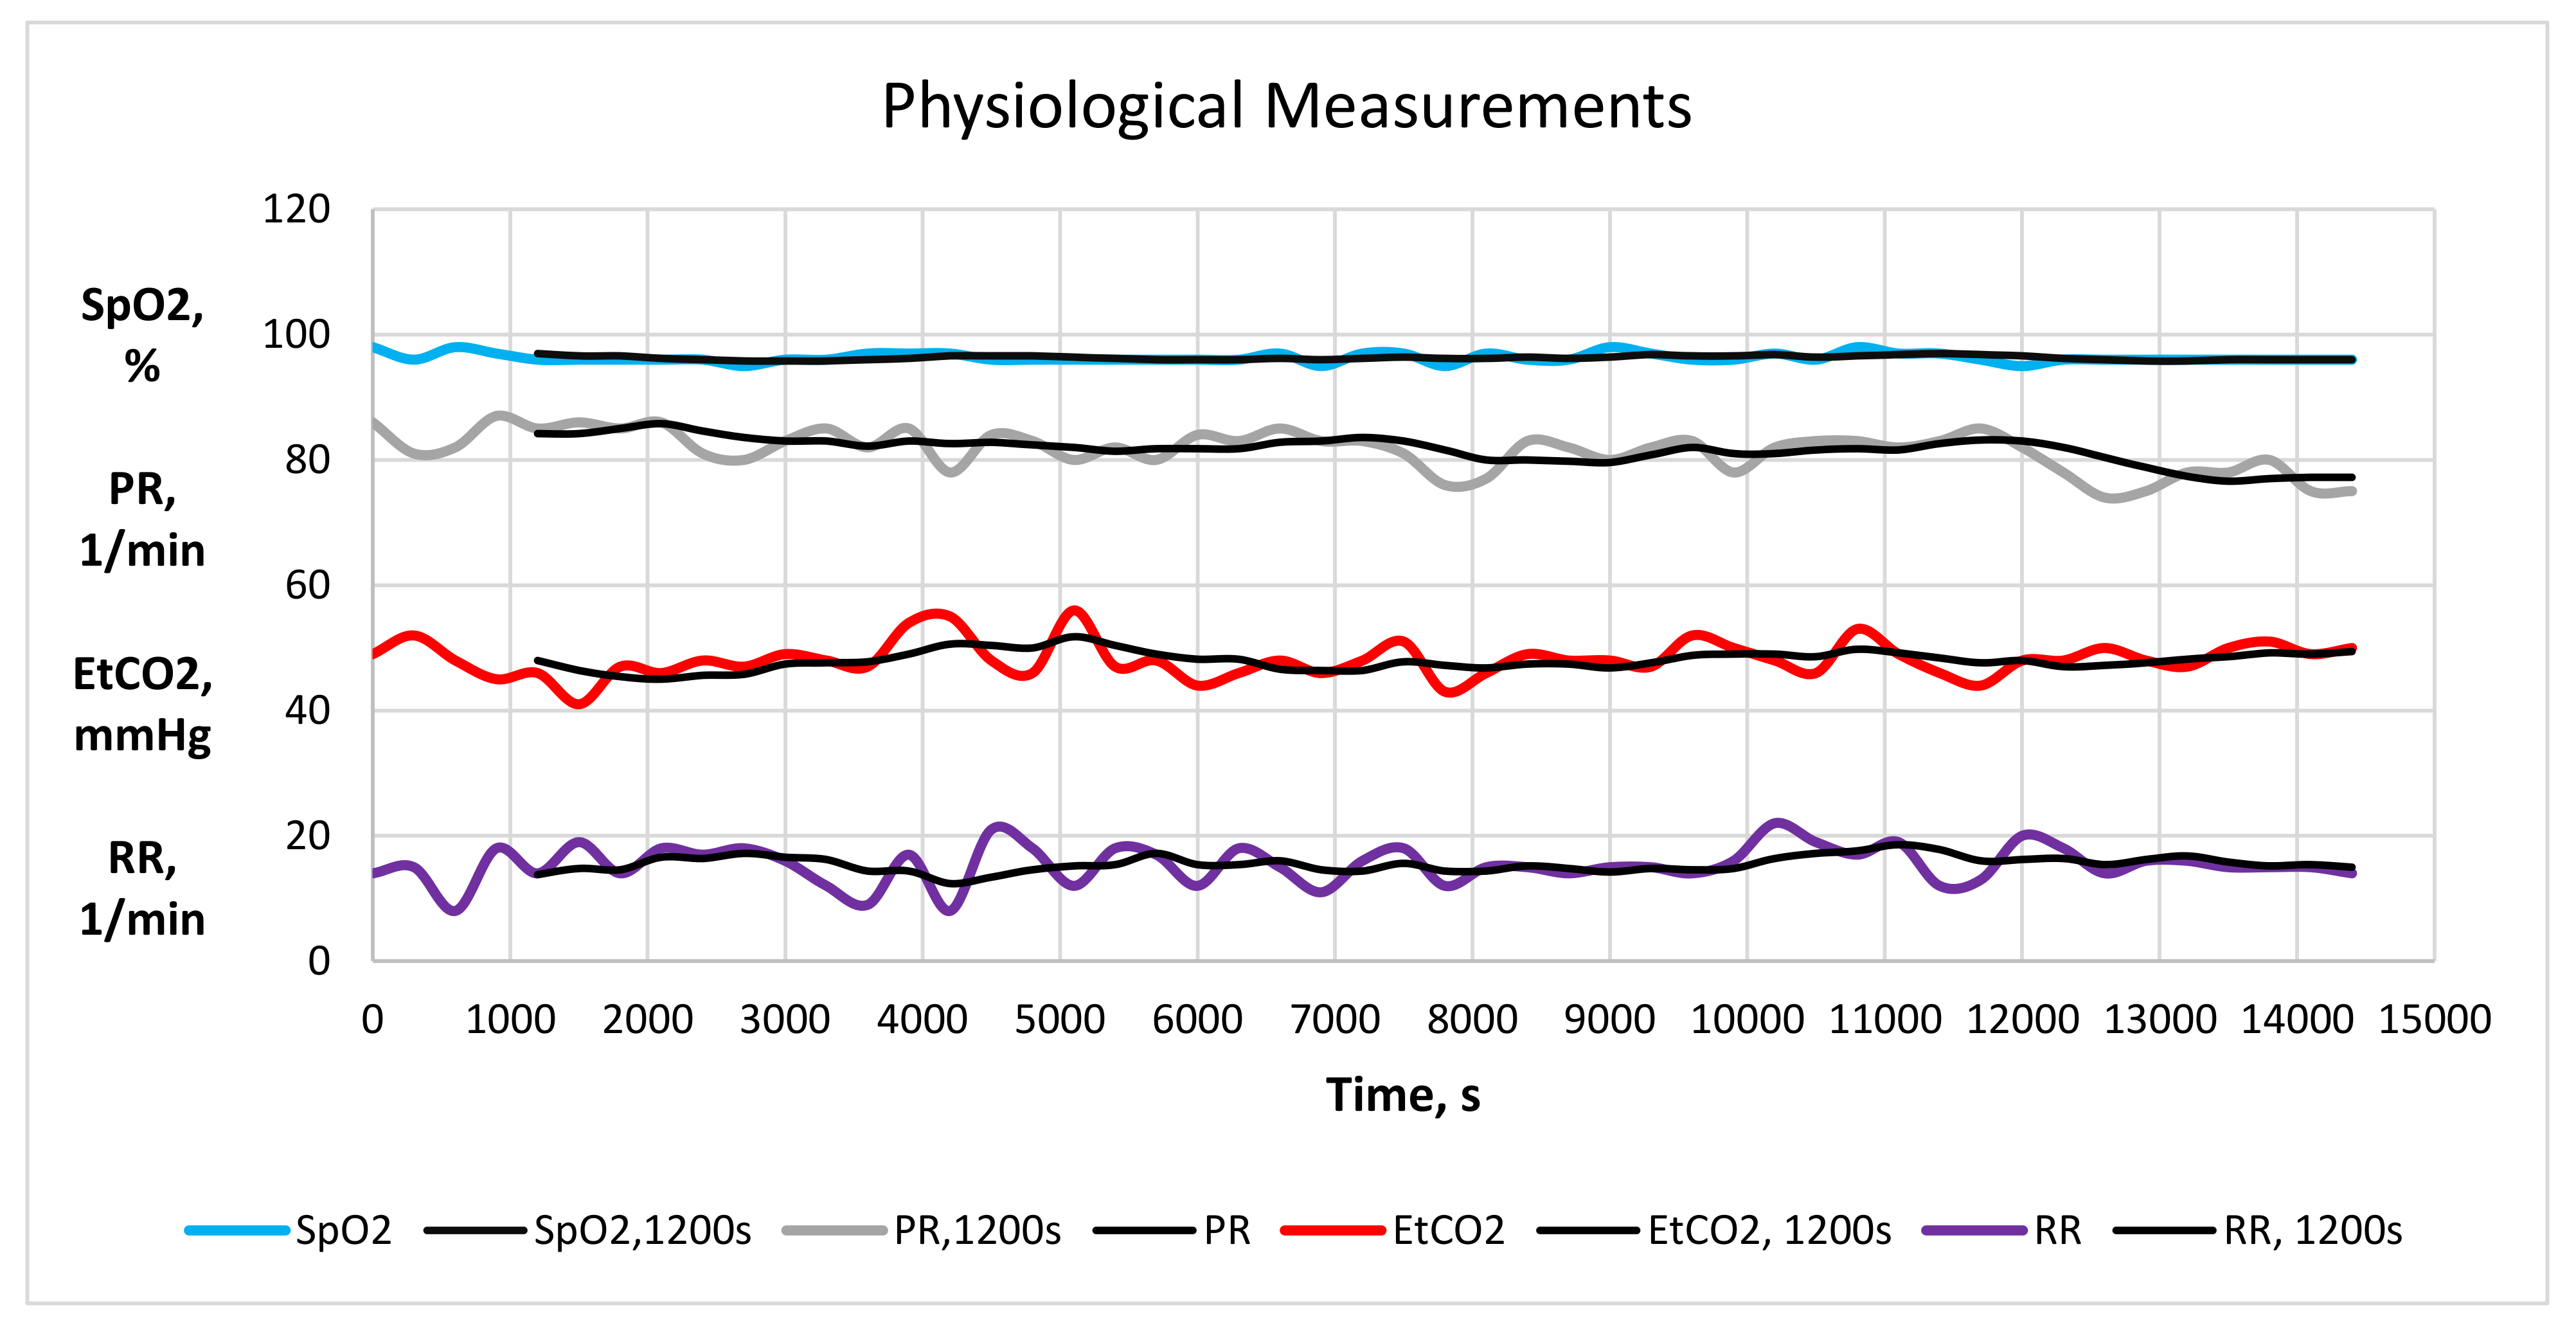
Figure 21 visualises the results for the monitored physiological parameters: oxygen saturation pressure (SpO2), pulse rate (PR), end-tidal CO
2 (EtCO2), and respiration rate (RR). They are presented in the form of the instantaneous data and the evolution curves for each parameter, time-averaged for 1200 s. The averaging interval is chosen to be 1200 s, as it is equal to the period of exposure to 27 °C and is half of the transition period from 27 °C to 23 °C.
Table 2 summarises the results for physiological parameters of the exposed person for the different periods.
Student’s t-test shows that there were no statistically proven changes in the oxygen saturation pressure SpO2 during the exposure in the climate chamber:
Comparison between 27 °C and the transition period: tstat = 2.09, tcrit = 2.57 (α = 0.05).
Comparison between 27 °C and 23 °C: tstat = 1.46, tcrit = 2.57 (α = 0.05).
Student’s t-test was applied to the results for the pulse rate, and it shows that there were statistically proven changes in PR at 27 °C and 23 °C. The comparison between the exposure at 27 °C and the transition period showed an absence of statistical evidence for the decrement in the PR:
Comparison between 27 °C and the transition period: tstat = 0.39, tcrit = 2.36 (α = 0.05).
Comparison between 27 °C and 23 °C: tstat = 2.83, tcrit = 2.31 (α = 0.05).
End-tidal CO
2 shows the maximal concentration of CO
2 at the end of the breathing [
38]. The results for EtCO2 were similarly compared using Student’s
t-test. It was found that there were no statistically proven changes in EtCO2 during the exposure in the climate chamber:
Comparison between 27 °C and the transition period: tstat = 1.00, tcrit = 2.36 (α = 0.05).
Comparison between 27 °C and 23 °C: tstat = −0.37, tcrit = 2.57 (α = 0.05).
Finally, Student’s t-test was applied to the results for the respiration rate. It was found that there were no statistically proven changes in the RR in the studied period of the exposure:
Comparison between 27 °C and the transition period: tstat = −0.72, tcrit = 2.31 (α = 0.05).
Comparison between 27 °C and 23 °C: tstat = −0.95, tcrit = 2.57 (α = 0.05).
4. Discussion
4.1. The Results in the Classroom
The results of the measurements in the classroom show that the CO
2 accumulation for the time interval of 2000 s (approx. 33 min) strongly depends on the indoor air temperature. The measured average value of the CO
2 concentration at 27 °C was higher (870 ppm) than at 23 °C (817 ppm), and the decrement of 6.2% was statistically proven with a significance level of α = 0.05. This result confirms the initial hypothesis that the indoor air temperature would influence the accumulation level of CO
2 in the classroom. At the same time, the result contradicts the expectations, based on the statements in [
11], that the lower temperature would lead to a higher generation of metabolic CO
2.
The derived trendlines with coefficients of determination R2 higher than 0.9 clearly show the linear dependence of the CO2 concentration in the classroom on time.
The results for the O2 concentration in the classroom in the investigated time interval prove the dependence of the O2 depletion on the air temperature. The average value of the O2 concentration in the classroom at 27 °C was lower than at 23 °C: 201,635.16 vs. 203,925.76. This result corresponds very well to the higher CO2 concentration, measured at 27 °C. The difference is low (1.1%), but it is statistically proven, with a significance level of α = 0.05.
The derived trendlines for the change of the O2 concentration with the time have lower linear correlation coefficient r (compared to that of the CO2 concentration), preconditioned by the higher fluctuations in the single data. However, the linear correlation coefficients are high enough (over r = 0.7) to prove the existence of linear dependence.
4.2. The Results in the Climate Chamber
The length of the records (14,966 s or approx. 4 h and 15 min) was determined by the hypothesis that the human body needs time to react to the room air temperature change. Having the preliminary results from the measurements in the classroom, we expected to get more detailed information on the change in the metabolic CO2 in the transition period with temperature decrement and, later, when the lower temperature would be reached. Therefore, an accurate record was kept at each moment of the measurement to account for any temperature changes and distinguish the individual periods.
The detailed analysis of
Figure 17 shows the very high responsiveness of the measuring equipment in the climate chamber to any change.
Figure 17a shows, for example, the empty exposure chamber at the beginning of the measurements (CO
2 concentration approx. 430 ppm). The first pick is due to the entrance of one person, dealing with the equipment, and the second, higher—due to the entrance of two persons (the one dealing with the equipment and the exposed person). Afterwards, there was a slow decrement in the CO
2 concentration when the exposed person was left alone in the exposure chamber.
The results of the measurements in the climate chamber showed that the CO2 concentration in the exposure chamber strongly depends on the indoor air temperature. The measured average value of the CO2 concentration at 27 °C was higher than at 23 °C (as in the classroom), and the decrement of 9.6% was statistically proven (for α = 0.05).
The average value of the CO2 concentration in the transition period from 27 °C to 23 °C was also lower than at 27 °C, with a statistically proven difference of 7.6% (for α = 0.05).
These results validate the data from the measurements in the classroom and confirm the hypothesis for the influence of the room air temperature on the exhaled CO
2. However, the results again contradict the expectation that the lower temperature provokes a higher generation of metabolic CO
2 [
11].
The additional processing of the CO2 measurements in the climate chamber (the time-averaging and the derived linear regression equations) prove that in all periods (except the initial one), the CO2 concentration decreases with time. The highest values are obtained at the beginning of each temperature period. At the temperature of 27 °C, this could be explained by the gradual calming of the exposed person. At the transition period, it could be explained by the gradual temperature decrement. However, the tendency exists also in the last and most prolonged period, when the air temperature was 23 °C. As the exposed person was not aware of the temperature change and she continued her light sedentary work without change, the decrement in the CO2 concentration could not be addressed to psychological tranquillization, as at the begging of the exposure. This finding would need further research to obtain its explanation.
The monitored physiological parameters during exposure in the climate chamber show some changes in the different periods. The pulse rate decreased by 4.1% at 23 °C, compared to 27 °C, and this is a logical physiological response of the thermoregulatory system, which provokes vasoconstriction at low temperatures and vasodilation at high temperatures [
39]. The respiration rate increased by 11% at both the transition period and 23 °C, compared to 27 °C.
The statistical analysis shows no proven changes in the oxygen saturation pressure, end-tidal CO2 and respiration rate during the exposure of the person in the climate chamber. The only proven difference is the decrement in the air temperature from 27 °C to 23 °C on the pulse rate.
Our study has limitations concerning the replicability of the experiments by external researchers. The first one is related to the number of sensors in the classroom. We have made measurements with two CO
2 sensors placed in the front and back zone of the classroom, finding that the data from both sensors show statistically proven influence of the room air temperature (23 °C and 27 °C) [
40]. Therefore, we used in this study only one sensor in the classroom. Nevertheless, in other enclosures, especially in classrooms where HVAC systems are not installed, the air mixture could be uneven, and more sensors would be necessary to measure the CO
2 accumulation due to exhalation. The second limitation is related to the measurements in the climate chamber. It can be repeated in other climate chambers, but with a smaller volume, as the exposure chamber is needed to assure reaching a relatively fast equilibrium in terms of thermal environment and air quality in the presence of an occupant. Furthermore, the climate chamber should allow controlling the concentration of O
2 and CO
2 in the breathing zone and both air temperature and concentration of the flow substances due to respiration at the inlet and outlet of the chamber. More information about the design of the exposure chamber and the design requirements can be found in [
41].
5. Conclusions
Our experimental study has found that the decrement in the air temperature in the indoor environment from 27 °C to 23 °C provoked statistically proven decrement in the exhaled CO2 concentration in both the investigated university classroom and climate chamber. The reduction in the accumulated CO2 in the classroom was 6.2%. The reduction in the measured CO2 in the climate chamber was 9.6%. The pulse rate of the person measured in the climate chamber also decreased by 4.1% at the lower temperature. The results were statistically proven for a significance level of α = 0.05.
A future direction of our study is the repetition of the measurements in the climate chamber with more participants. It is challenging to find any relationship between the physiological parameters measured in the present study and the exhaled CO2. One of the conclusions from our study is that the time step for reading the physiological parameters should be lower than 300 s: the time step should be 60 s or even less, as one of the preconditions for the lack of statistically proven relationship between the different periods in the climate chamber measurements is the small number of experimental results.
Another direction of our study will involve measurements of the exhaled CO2 in lower temperatures than 23 °C to submit the human body to higher thermal stress when changing the air temperature from 27 °C. There are several non-industrial environments where the common room air temperature is 20 °C and even below (e.g., bedrooms).
A third direction is to look for the possibility to directly measure the CO2 concentration in the breathing zone, using CO2 sensors of higher than 10,000 ppm range.


