Abstract
The main goal of this work is the evaluation of the energy saving achievable in railway drive when using the coasting technique extensively, with reference to a practical case of the Italian railway network taken as an example. This technique consists in exploiting the kinetic energy accumulated by the running train whenever possible. To implement a driving style on purpose, the only driver contribution is not enough; indeed, it is necessary to provide an embedded automatic calculation control system. In the paper, an algorithm has been developed to evaluate the energy absorption of railway locomotives during the normal service and validated on a real railway line. The proposed hardware and software system could be implemented aboard the train, allowing motion data processing in real-time. Speed, time intervals and power absorption for a given path are calculated; then, the best coasting parameters are estimated to maximize the energy savings. In particular, the case study presented in the paper showed that the fast-run strategy, always adopted by the railway company to recover an unexpected delay, can lead to a negligible time recovery with respect to the coasting strategy, while determining a significantly larger energy consumption.
1. Introduction
The rail transport sector contributes to the climate change and pollution significantly, because it globally absorbs large amounts of energy, due to the high-power levels and the widespread utilization. As a consequence, the sustainability in transportation is a fundamental starting point of every design [1,2].
Today, the world population consists of more than 7 billion of people and is expected to reach 8.5 billion by 2030. This implies that the mobility demand will keep growing also for goods and commercial transportation with unsustainable impacts on environment. An efficient energy management allows to greatly decrease the environmental impact. Indeed, energy saving is a fundamental pillar of the European environmental policy; however, in the EU the energy saving in transportation is not yet regulated by standards or laws. Moreover, presently the transportation companies are not subject to Authority directives, neither there is any kind of inspection regarding the energy management. In other words, companies are free to establish their own targets, although energy saving is a fundamental condition to improve their economic efficiency.
In order to make a rough comparison, the per passenger/per kilometer energy consumption associated to a conventional car is 3–5 times greater than the same quantity calculated for a train. Nevertheless, it is important to further reduce the costs of railways, thus increasing the number of users that will prefer this means of transport. Moreover, apart from conventional requirements, nowadays passengers require high-level on-board services, such as air-conditioning and other energy consuming services. This means that energy saving is becoming more and more important than in the past.
In this work, an algorithm has been developed and validated on a real railway line, to evaluate the energy absorption of railway locomotives during the normal service. The model has been applied to a case study from the Italian railway network, showing the practical advantages, also in terms of reduction of CO2 emissions, coming from the application of energy-saving techniques [3,4,5,6,7,8,9,10]. It was also intended to demonstrate that the fast-run strategy, today always adopted by the railway company to try to recover a delay due to an unexpected red light, is not necessarily the best choice. Indeed, in most cases the time saving is really negligible, with respect to an energy-saving strategy based on coasting, while the energy consumption increases significantly. The proposed hardware and software system could be implemented aboard the train, allowing motion data processing in real-time.
In order to make the best use of the railway, a number of power spikes occur, in order to follow the continuous changes of the signals. Most of the locomotives employed on the Italian railways are of old generation and do not have a gradual regulation of the current draining. A computer-based smart management of the electrical traction [3,11] can lead to a decrease of the current peaks and transients on the power line with the consequent reduction of electric disturbances [12,13,14,15,16,17].
Moreover, running the train at a more uniform speed, thanks to the automatic control system, allows to reduce the continuous changes of signaling of occupied line, further improving the line management.
The railway energy saving issues are quite important, since the Italian railway company is one of the major energy buyers in Italy (electrical energy and oil). The graph of Figure 1 shows the trend of electrical energy consumed for traction in the entire Italian railways network in the years 1965–2019.
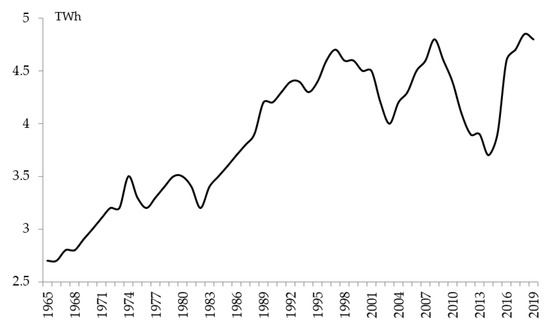
Figure 1.
Italian Railways traction energy consumption between years 1965–2019 (TWh).
It is evident from the graph that the energy absorption is still increasing although nowadays the technology has been largely improved and, as a consequence, also the energy savings have increased. Energy consumption data from other European railways companies show an increasing or at least roughly constant trend, too. Thus, it is necessary to improve the energy saving in this fundamental sector.
An intense railway traffic demand requires additional studies on energy efficiency improvement including the driving style [6,18]. Coasting is a common technique for energy saving in convoy drive, essentially consisting in switching off the locomotive motors, while the convoy continues to run thanks to inertia. In rail traffic, braking should be avoided in order to save energy and the benefits of low friction and favorable descendent slopes should be maximized [19]. Obviously, during coasting the train speed varies with time, generally decreasing, possibly causing unacceptable run times; thus, automatic management systems must be used.
This paper is focused on energy savings that can be achieved in electrical traction by means of coasting operation. The calculation of the electrical power consumption is based on conventional components presently in use; therefore, the possible technological improvements of the electrical equipment are not taken into account. The regenerative braking is not considered, because the direct consumption of the kinetic energy is privileged; this determines slightly worse travel times but a reduction of energy consumption. Moreover, with the proposed strategy it is possible to avoid expensive and delicate technologies as energy conversion systems, batteries, flywheels, super capacitors and others.
First, the best strategy for coasting starting distance is analyzed. A number of convoy parameters must be taken into account in order to evaluate the coasting starting point: type of the convoy, length, braked mass, path, etc. From the following, it comes out that the coasting strategy cannot be summarized by means of abacus-type curves. The computation must be continuously performed either in batch operation when simulating the strategy on a PC, or with dedicated hardware when operating onboard. As above mentioned, a driving style suitable to allow coasting cannot be adopted by the driver, without the aid of automatic calculations embedded in the control system [20]. In addition, the automatic calculation system is essential to optimize the operation while following the rules established by railway signals [21] and to find the best compromise between energy saving and services offered to passengers, always respecting the timetable.
The proposed algorithm has been tested on a real railway line of 135 km belonging to RFI (Rete Ferroviaria Italiana, Italian Railway Network), according to speed limit and taking the time table into account. The results demonstrate the importance of the driving style and its impact on energy savings.
The computational model is described in Section 2 and its implementation is discussed in Section 3. Then, the simulation model is validated with real data provided by the railway company in Section 4. Section 5 is devoted to the first case study, indicated as “testing condition #1”. The second case study—“testing condition #2”, actually splitted into Test A and Test B, is illustrated in Section 6. Finally, the conclusions are drawn in Section 7.
2. Simulation Model of a Railway Run
The proposed optimization method is based on mathematical models describing the physical reality of the system considered [5,7]. The computer-aided calculation system elaborates the information in real time to find the optimal velocity profile for each section of the railway line [22,23].
For the analysis of a convoy motion, three resistances have been taken into account, as follows [24,25].
- Motion resistances, including ball-bearing resistance, resistance between wheel and rail, air resistance and a virtual resistance that takes into account energy losses in suspensions springs.
- Rail line resistances, including resistance due to the friction in curves and slope resistance.
- Inertia resistance.
Railways designers estimate the motion resistances by means of the force used to move one ton of towed mass (da N/Ton); this global resistance r can be calculated by Equation (1):
where V is the convoy speed (m/s).
r = 1.5 + 0.00285 · V
The resistance due to the force of gravity can be evaluated considering the sloping plane of Figure 2.
where M is the mass of the convoy (tons) and i is the slope of rail (‰); this quantity is negative for a descent slope.
Rslope = M · sinα = M · i
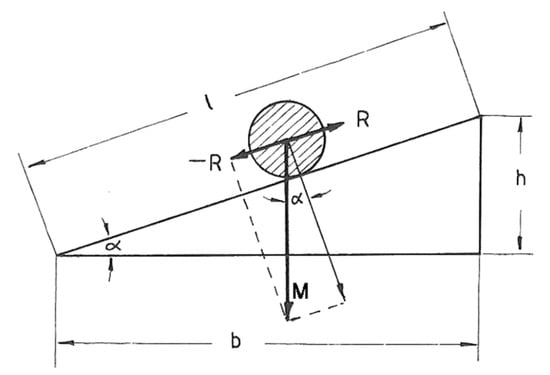
Figure 2.
Scheme of the sloping plane used to evaluate the resistance due to gravity.
In general, there is also a resistance associated to the curves; however, in the following, this quantity will not be considered, since in general European railways are well constructed.
Thus, the total resistance can be evaluated as:
Σ R = M (i + r) [da N]
In all types of locomotives, electric, diesel, steam powered, the traction force decreases when the convoy speed increases, and this occurs following the hyperbolic shape of the force/speed curve.
The mechanical power available at the locomotive rims is calculated:
where V is the convoy speed (m/s) and DF is the drive force at the rims (da N/Ton).
MP = (DF · V)/100 [kW]
The qualitative graphs of Figure 3 represent the mechanical power and drive force vs. speed, respectively.
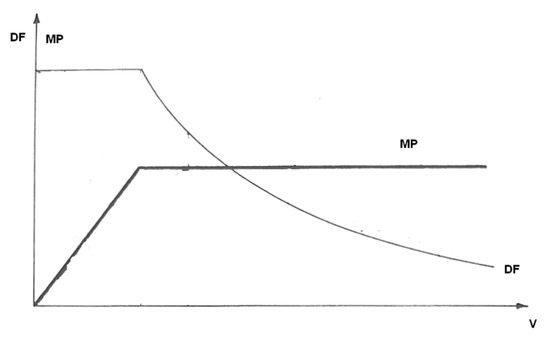
Figure 3.
Mechanical power and drive force vs. speed.
The braking force is calculated as:
where d is the deceleration. The maximum deceleration is a percentage of the acceleration of gravity (braked mass).
BF = − M · d
Standard deceleration values are reported in Figure 4 for different braked mass (%).
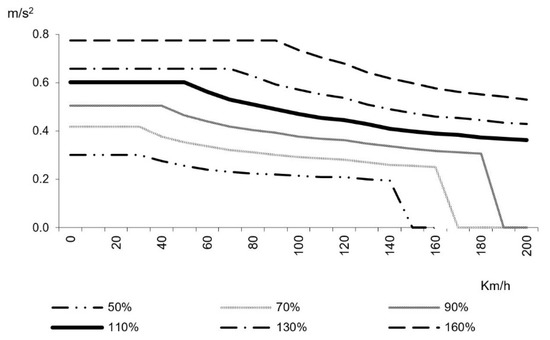
Figure 4.
Deceleration vs. speed for different braked masses.
During the acceleration phase, the drive force is:
being a the acceleration, and the equation of motion becomes
where DF is drive force at rims, ML is the locomotive mass and MT is the towed mass (M = ML + MT).
DF = Σ R + M · a
DF = (ML + MT) · (i + r + 100·a) [da N]
In case of uniform motion, Equations (6) and (7) can be simplified as follows:
DF = Σ R
DF = (ML + MT) ⋅ (i + r)
The same equations can be also modified for the braking phase as
Σ R + BF + M·a = 0
(ML + MT)·(i + r)+BF + (ML + MT)·100·a = 0
Finally, Equations (12) and (13) describe the motion by inertia, that is, the coasting run.
Σ R + M·a = 0
i + r + 100·a = 0
3. Implementation of the Simulation Model
In order to support the driving strategy, the numerical evaluation of motion variables should be processed in real-time by an onboard computer [26]. For standard routes a conventional PC with high-safety batch operation can be sufficient [27]. The approach discussed and used is a batch type, even if there are few differences between real-time and batch versions [28].
The developed simulation software is capable to simulate a real railway system taking into account the train, the type of line, all signals and controls, the required energy and power, as well as losses. The simulation software then checks and compares three different running conditions of a train running on the line: traditional running, running in coasting and finally coasting with the limitation of signals.
The program calculates speed, power, drive force at rims, absorbed energy, times and the coasting starting point, based on the motion equations described in Section 2.
As to the numerical algorithm, an iteration step of 100 m of length is assumed, although this input parameter can be easily changed. For the considered case study, this step represents 0.07% of the total route. This quantity has been chosen according to literature data to limit the output error within 1% [29].
The numerical algorithm was implemented in C++ language. The flow chart is shown in Figure 5. The software program can process also traffic lights: the signals can be set either set to green or red, in order to neglect or not the real line traffic, respectively [30,31].
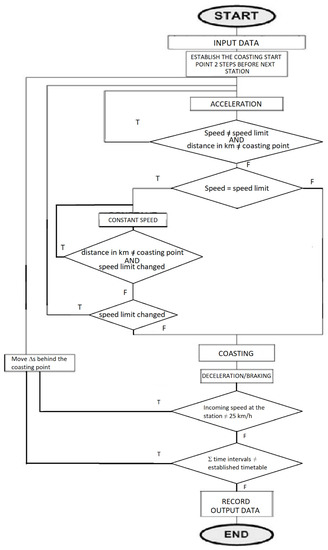
Figure 5.
Flow chart of the simulation software.
The main input quantities are: locomotive type, convoy type (passengers or goods), towed mass (tons) and braked mass (%). An important input is the ratio between maximum arrival delay time and saved energy: this is the main parameter for the evaluation of the best run strategy.
Input data are packed in an input file, that also stores the line data: altitude (m), slope (‰) and speed limit.
The program simulates a complete convoy run. The main goal is to extend the length of the coasting motion as much as possible, in order to decrease both the electromechanical and regenerative braking minimizing the energy waste. Indeed, the latter can be significantly reduced with the adoption of a coasting strategy.
The coasting starting point is fixed by the railway company management according to the network route times. In each section arriving at the next station, on either flat or downhill tracks, the algorithm increases the distance covered in coasting until the maximum time set is reached; in this way, the point at which coasting starts is automatically calculated. According to Italian laws, 300 m before the next station the speed must be set at a maximum value of 25 km/h, and kept for 200 m before starting to brake in order to stop at the station. The software sets a tentative coasting start point 500 m before the station, and moves this point behind by steps of Δs = 100 m if any condition is not satisfied.
In any case, the timetable and frequency of the convoys fixed by the network management are always the reference for any applicable strategy. The calculation is automatically performed on board and not by a conductor.
Energy savings can be evaluated by means of the developed software by considering a fixed delay time(s) according to the railways timetable. The inverse approach is also possible, and in this case the software can change the delay time automatically to calculate the best energy saving strategy [32,33,34].
The proposed software flowchart could be a basis to design the hardware DF control system logic to be installed on locomotives, to perform a real-time evaluation of motion variables to automatically command the coasting start. This would enable an automatic energy optimization. Such a system can be used in two ways. The simplest way consists of a dashboard [35] mounted on board indicating the level of energy consumption, letting the driver control the train manually. The second way is to make the control automatic: when the computer detects that there is the possibility to reach a station by coasting with an established time delay, it automatically resets the traction. The maximum time delay is set a priori according to the line, the frequency and the time available.
4. Validation of the Simulation Model
Real measured data provided by the railway company have been used to validate the simulation model and its software implementation. The calculated data are based on the consumption tables of the Bombardier E464 electric locomotive used on that type of lines, depending on the working conditions.
The tests have been performed on a real line of 135 km long, subdivided in 13 parts delimited by stations (a software session analyzes separately each part of the line).
The input data used for validation are the following:
- line: Rome-Cassino
- length: 135 km
- maximum speed: 140 km/h
- locomotive: E464 (Bombardier)
- towed mass: 450 tons
- braked mass: 110%
- train type: passenger
This route has been chosen because it has a similar altitude on the sea level at both the starting and end points (Rome and Cassino); in this way the tests are performed with a roughly zero value of average slope.
As to the software validation, in a first simulation the coasting starting point has been forced to coincide with the one commanded by the driver in a real run, in order to compare the results with the real data.
For the sake of simplicity, the results of only one run analysis are detailed here, regarding the line section between the two substations of Isoletta and Roccasecca. The results, in terms of motion variables, are shown in the graphs of Figure 6, Figure 7 and Figure 8.
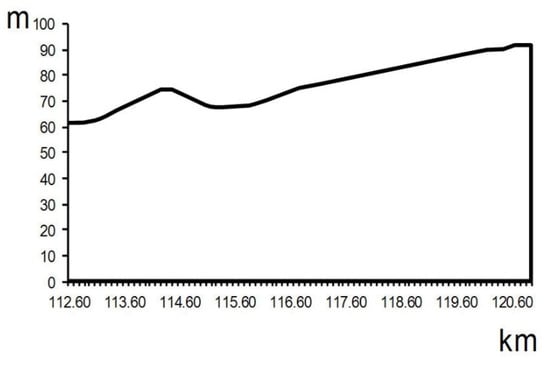
Figure 6.
Line altitude (m on s.l.) corresponding to the line distances between Isoletta and Roccasecca substations.
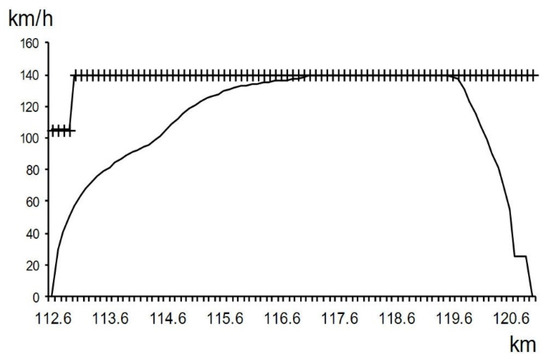
Figure 7.
Convoy speed (“−“) and maximum allowed line speed (“+”), between Isoletta and Roccasecca substations.
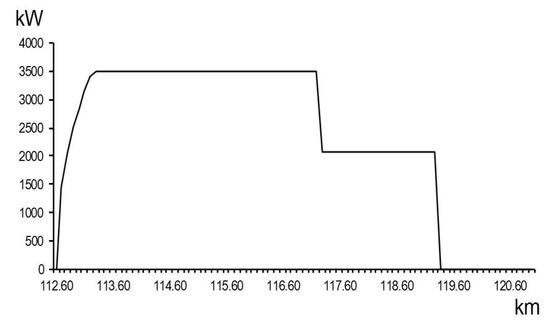
Figure 8.
Power absorbed by the locomotive during the Isoletta—Roccasecca route.
In this case, for the model validation, the second computational block calculates a coasting start positioned at the arrival station. This is equivalent not to use this technique, since the minimum speed is set as the maximum line speed, to make the comparison with the normal line operation.
The numerical values of the train speed and the absorbed electrical power of Figure 7 and Figure 8, respectively, correspond very well with the speed registrations kindly provided by the railway company.
Time and energy for this part of the route have been calculated as:
- time: 06 min 18 s
- energy: 195.9 kWh.
Again, the results obtained with the simulation software are in very good agreement with the quantities provided by the transportation company for this route. The tables comparing the calculated data with the data provided by the transportation company are very large and are omitted here for the sake of conciseness. In any case, the calculation error is always below 1%.
After validation, the software has been used to perform other simulations, illustrated in the following sections.
5. Case Study—Testing Condition #1: Evaluation of Energy Savings in a Route without Traffic Signals
In this case study, the traffic signals are neglected: the convoy can always run at the optimum speed (when possible, also at the maximum speed). In addition, the coasting strategy is applied to reach each station.
Times and energy absorption data measured on board are provided by transportation company for the entire Roma-Cassino route in normal mode without applying the coasting technique and are shown in Table 1.

Table 1.
Time duration and energy consumption data for the entire Rome-Cassino route provided by the railway company.
The software output consists of time intervals and energy consumption data, as shown in Table 2, where the variations of time and energy consumption due to the coasting–strategy with respect to the normal mode are highlighted in the fourth and fifth column, respectively.
Table 2.
Simulation results: time, absorbed energy and relative variations respect to the railways company data of Table 1.
The time duration increases by 101 s for the entire route, while the total energy saving is 349 kWh. In other terms, there is a +1.8% in time and −14.4% in energy consumption.
If the same percentage savings were applied to the whole Trenitalia network, a global energy saving of approximately 1.8 GWh per day may be achieved. This would lead to an energy saving of 663 GWh per year, corresponding to an annual moneysaving of €11,230,000 (the Italian national railways company spends about €80,000,000 per year of traction energy). Moreover, the coasting strategy savings of 152 kTep per year have a significant, positive impact on the CO2 emissions.
6. Case Study—Testing Condition #2: Evaluation of Energy Savings in a Route with Both Signals and Traffic Control
The significant impact of railway traffic on the energy consumption is strictly related to the signals and traffic regulation strategy [36]. The signals impose a limit speed or the stop command to manage traffic. In this case study their influence on energy consumption is considered.
The traffic light signals have been stored in two input files (signal-type file and signal-position file). The line is controlled by a four-code frequency signal system: 270 Hz, 180 Hz, 120 Hz, 75 Hz, No Code, corresponding to the maximum line speed (135 km/h), 100 Km/h, 25 Km/h, 50 km/h, stop, respectively.
The Italian railways company forces the drivers to use a fast-run strategy in order to reach the arrival station after an unexpected red signal: this is a method to avoid time delays. The fast-run consist of driving the convoy at the maximum allowed speed; clearly, this could not be a suitable strategy in all conditions.
A stop signal between stations Castro and Ceprano is added on purpose for the tests, in order to simulate a real situation that often occurs.
In those conditions two tests are performed:
- -
- Test A. After the stop signal, the convoy runs following the coasting-run strategy.
- -
- Test B. After the stop signal, the convoy starts running with the fast-run strategy instead, to decrease the time delay, as the company usually behaves to recover the time lost at the red light.
The graphs of Figure 9 and Figure 10 show the convoy speed and the absorbed power, respectively, in the conditions of Test A.
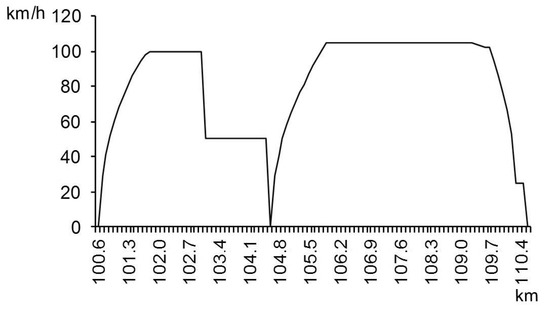
Figure 9.
Speed curve between substations Castro and Ceprano with a red signal (Test A).
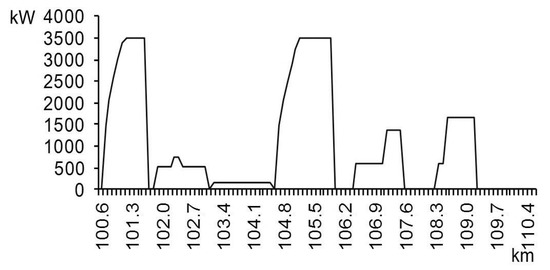
Figure 10.
Absorbed power between substations Castro and Ceprano (Test A).
For the sake of simplicity, the graphs related to Test B are not shown, but all the data of the two tests are summarized in Table 3: from these data it can be seen that with run mode B there is a recovery of only 9 s (0.15%) but an increase in absorbed energy of 13 kWh (0.6%). The differences between the graphs are not appreciable, but the values of each quantity can be found in Table 3.
Table 3.
Case study #2: energy and time comparison of Test A (slow running) and Test B (fast running to recover the time lost) as a consequence of red signal.
The calculation demonstrates how, in this case, the energy-saving running mode is always convenient. This result also demonstrates that it is neither useful nor energy efficient trying to recover a delay after a red light by manual driving and a strong increase in speed (Run B test). This habit common to many railway companies, notwithstanding the poor results.
7. Conclusions
Nowadays, the energy consumption ascribed to the electrical traction is a very large amount; therefore, even small percent savings result in large amounts of energy savings globally.
This work demonstrated the importance of an embedded control system for coasting strategy implementation aboard the trains, to achieve significant energy savings. Indeed, an efficient energy saving strategy cannot be realized with manual methods, operated by the drivers.
Nowadays, an electronic control system is certainly affordable and can be easily interfaced aboard with onboard positioning systems and railways traffic information devices.
Based on the dynamic model of a railway convoy, a simulation model capable to optimize the coasting strategy has been developed. The proposed model is of general use, and can work also for other motion phases, e.g., during acceleration. It has been set up for batch calculations, but it can be easily implemented onboard for real-time calculations.
The on-board calculation system should include a dashboard visualization providing the traction energy assessment. In this way, it would be possible to know the estimated value and the final balance of the consumed energy during the run. Such a dashboard continuously displays a current value of energy consumption to be compared to the average value of previous runs and the best value calculated by the computer. In case of manual operation, the driver would be induced to a fair energy management.
With the embedded system proposed for an on-board installation, the company could modify the line parameters remotely, making all the convoys run with the same logic. The level of coasting, the speed and all other variables can be chosen instant by instant according to the needs, in terms of frequency, timetables and energy savings. Managing all the line convoys with the same rules allows to optimize the energy management on the power line and also to decrease the maximum power required to the national power grid. Moreover, this implies the possibility to reduce the environmental impact of whatever train.
The use of a coasting-run technique to reach the arrival stations ensures to the companies savings larger than 10%.
This work provides evidence that it is not always convenient trying to recover the time lost after an unwanted stop has occurred by using a fast run driving mode. However, the latter is a well-established policy that is always applied by many railways companies. Instead, the speed adjustments should be calculated in real-time by an onboard computer.
Moreover, all railway companies ask the designers to limit as much as possible the large energy absorptions and voltage drops on the traction power line. The proposed system allows to easily integrate this policy through on-board calculations.
In conclusion, many benefits could be obtained from the implementation of the proposed strategy on trains: energy and money savings, reduction of the power and size of railway supply systems, and, last but not least, a significant reduction of CO2 emissions.
As to the future developments of the research, this management strategy will be part of an experimental activity and will be implemented on board, allowing to collect data from real time tests in different traffic condition.
Author Contributions
Conceptualization: D.M., S.E. and C.B.; Data curation: D.M., S.E. and C.B.; Formal analysis: D.M., S.E. and C.B.; Investigation: D.M., S.E. and C.B.; Methodology: D.M., S.E. and C.B.; Project administration: D.M., S.E. and C.B.; Resources: D.M., S.E. and C.B.; Software: D.M., S.E. and C.B.; Supervision: D.M., S.E., C.B. and P.B.; Validation: D.M., S.E., C.B. and P.B.; Visualization: D.M., S.E., C.B. and P.B.; Writing—original draft: D.M., S.E. and C.B.; Writing—review & editing: D.M., S.E., C.B. and P.B. All authors have read and agreed to the published version of the manuscript.
Funding
This research received no external funding.
Institutional Review Board Statement
Not applicable.
Informed Consent Statement
Not applicable.
Data Availability Statement
Data is contained within the article.
Conflicts of Interest
The authors declare no conflict of interest.
References
- Csuzi, I.; Csuzi, B. The urban electric bus, a sustainable solution to increase energy efficiency of public transport and reduce atmospheric pollution in the cities. In Proceedings of the Electric Vehicles International Conference, Bucharest, Romania, 5–6 October 2017. [Google Scholar] [CrossRef]
- Ćwil, M.; Bartnik, W.; Jarzębowski, S. Railway Vehicle Energy Efficiency as a Key Factor in Creating Sustainable Transportation Systems. Energies 2021, 14, 5211. [Google Scholar] [CrossRef]
- Asnis, I.A.; Dmitruk, A.V.; Osmolovskii, N.P. Solution of the problem of the energetically optimal control of the motion of a train by the maximum principle. USSR Comput. Math. Math. Phys. 1985, 25, 37–44. [Google Scholar] [CrossRef]
- Mellitt, B.; Sujitjorn, S.; Goodman, C.J.; Rambukwella, N.B. Energy Minimization Using an Expert System for Dynamic Coast Control in Rapid Transit Trains. Railw. Eng. Conf. 1987, 48–52. [Google Scholar] [CrossRef]
- Benjamin, B.R.; Long, A.M.; Milroy, I.P.; Payne, R.L.; Pudney, P.J. Control of rail-way vehicles for energy conservation and improved timekeeping. Proc. Conf. Railw. Eng. 1987, 41–47. [Google Scholar] [CrossRef]
- Cheng, J.; Howlett, P.G. Application of critical velocities to the minimization of fuel consumption in the control of trains. Automatica 1992, 28, 165–169. [Google Scholar] [CrossRef]
- Howlett, P.G. An optimal strategy for the control of a train. J. Aust. Math. Soc. 1990, 31, 454–471. [Google Scholar] [CrossRef] [Green Version]
- Hillmansen, S.; Ellis, R. Electric railway traction systems and techniques for energy saving. In Proceedings of the IET 13th Professional Development Course on Electric Traction Systems, London, UK, 3–6 November 2014. [Google Scholar] [CrossRef]
- Montrone, T.; Pellegrini, P.; Nobili, P.; Longo, G. Energy consumption minimization in Railway Planning. In Proceedings of the IEEE 16th International Conference on Environment and Electrical Engineering (EEEIC), Florence, Italy, 7–10 June 2016. [Google Scholar] [CrossRef]
- Longo, M.; Franzò, S.; Manfredi Latilla, V.; Antonucci, G. Smart Energy Management of a Railway Station. In Proceedings of the IEEE International Conference on Environment and Electrical Engineering and 2018 IEEE Industrial and Commercial Power Systems Europe (EEEIC/I&CPS Europe), Palermo, Italy, 12–15 June 2018. [Google Scholar] [CrossRef]
- Tian, Z.; Zhao, N.; Hillmansen, S.; Roberts, C.; Dowens, T.; Kerr, C. SmartDrive: Traction Energy Optimization and Applications in Rail Systems. IEEE Trans. Intell. Transp. Syst. 2019, 20, 2764–2773. [Google Scholar] [CrossRef]
- Jafari Kaleybar, H.; Madadi Kojabadi, H.; Brenna, M.; Foiadelli, F.; Saeed Fazel, S.; Rasi, A. An Inclusive Study and Classification of Harmonic Phenomena in Electric Railway Systems. In Proceedings of the 2019 IEEE International Conference on Environment and Electrical Engineering and 2019 IEEE Industrial and Commercial Power Systems Europe (EEEIC / I&CPS Europe), Genova, Italy, 11–14 June 2019. [Google Scholar] [CrossRef]
- Langella, R.; Sollazzo, A.; Testa, A. Modeling waveform distortion produced by DC locomotive conversion system. Part 2: Italian railway system. In Proceedings of the 11th International Conference on Harmonics and Quality of Power (IEEE Cat. No.04EX951), New York, NY, USA, 12–15 September 2004; pp. 483–488. [Google Scholar] [CrossRef]
- Lo, E.W.C.; Lai, T.M. Harmonic analysis of EMUs in railway systems. In Proceedings of the First International Conference on Power Electronics Systems and Applications, Hong Kong, China, 9–11 November 2004; pp. 142–148. [Google Scholar]
- Lee, H.; Kim, G.; Oh, S.; Lee, C. Optimal Design for Power Quality of Electric Railway. In Proceedings of the SICE-ICASE International Joint Conference, Busan, Korea, 18–21 October 2006; pp. 3864–3869. [Google Scholar] [CrossRef]
- Jingjing, D.; Zheng, Q.; Chunxing, P. Harmonic analysis method for input current of traction system applied in High-speed Electric Multiple Unit. In Proceedings of the International Conference on Electronics and Optoelectronics, Dalian, China, 29–31 July 2011; pp. V1-30–V1-34. [Google Scholar] [CrossRef]
- Feng, J.; Cao, J.G.; Wu, Z.H. Analysis and Research on Electromagnetic Compatibility of High Speed Railway Traction Current Harmonics to Track Circuit. IEEE Trans. Appl. Supercond. 2021, 31, 1–4. [Google Scholar] [CrossRef]
- Capasso, A.; Lamedica, R.; Gatta, F.M.; Geri, A.; Maccioni, M.; Ruvio, A.; Buffarini, G.G.; Carones, N. Individual driving style impact on traction energy consumption in railway lines: A simulation model. In Proceedings of the 2016 International Symposium on Power Electronics, Electrical Drives, Automation and Motion (SPEEDAM), Capri, Italy, 22 June 2016. [Google Scholar] [CrossRef]
- Capasso, A.; Ceraolo, M.; Lamedica, R.; Lutzemberger, G.; Ruvio, A. Modelling and simulation of tramway transportation systems. J. Adv. Transp. 2019, 2019, 4076865. [Google Scholar] [CrossRef] [Green Version]
- Hubka, L.; Školník, P. Tram simulation model for energy balance analyses. In Proceedings of the 21st International Conference on Process Control, Štrbské Pleso, Slovakia, 6–9 June 2017; pp. 247–251. [Google Scholar] [CrossRef]
- Su, S.; Li, X.; Tang, T.; Gao, Z.Y. A Subway Train Timetable Optimization Approach Based on Energy-Efficient Operation Strategy. IEEE. Trans. Intell. Transp. Syst. 2013, 14, 883–893. [Google Scholar] [CrossRef]
- Khmelnitsky, E. On an Optimal Control Problem of Train Operation. IEEE Trans. Autom. Control 2000, 45, 1257–1266. [Google Scholar] [CrossRef]
- Bocharnikov, Y.V.; Tobias, A.M.; Roberts, C. Reduction of train and net energy consumption using genetic algorithms for Trajectory Optimisation. In Proceedings of the IET Conference on Railway Traction Systems, Birmingham, UK, 13–15 April 2010. [Google Scholar] [CrossRef]
- Hay, W.W. Railroad Engineering; John Wiley and Sons: Hoboken, NJ, USA, 1982. [Google Scholar]
- Iwnicki, S. Handbook of Railway Vehicle Dynamics; CRC Taylor & Francis: Boca Raton, FL, USA, 2006. [Google Scholar]
- Dukkipati, R.V.; Amyot, J.R. Computer-Aided Simulation in Railway Dynamics; Marcel Dekker: New York, NY, USA, 1988. [Google Scholar]
- Giuliani, F.; Ottavi, M.; Cardarilli, G.C.; Re, M.; Di Nunzio, L.; Fazzolari, R.; Bruno, A.; Zuliani, F. Design and characterization of a high-safety hardware/software module for the acquisition of Eurobalise telegrams. In Proceedings of the 2016 IEEE International Symposium on Defect and Fault Tolerance in VLSI and Nanotechnology Systems (DFT), Storrs, CT, USA, 19–20 September 2016; pp. 111–114. [Google Scholar] [CrossRef]
- Shoup, T.; Mistree, F. Optimisation Methods with Applications for Personal Computers; Prentice Hall: Hoboken, NJ, USA, 1987. [Google Scholar]
- Joung, E.J.A. Study on quality improvement of railway software. In Proceedings of the Control, Automation and Systems (ICCAS), International Conference, Seoul, Korea, 27–30 October 2010. [Google Scholar] [CrossRef]
- Tonosaki, Y.; Miyoshi, M.; Koizumi, Y.; Takeba, T.; Tajima, M.; Miyatake, M. Punctual train operation with energy-saving Driving Advisory System in Dense Traffic Railway. In Proceedings of the 2016 IEEE International Conference on Intelligent Rail Transportation (ICIRT), Birmingham, UK, 23–25 August 2016. [Google Scholar] [CrossRef]
- Sedykh, D.; Gordon, M.; Efanov, D. Computer-Aided Design of Railway Signalling Systems Russian Federation. In Proceedings of the International Conference on Industrial Engineering, Applications and Manufacturing (ICIEAM), Moscow, Russia, 15–18 May 2018. [Google Scholar] [CrossRef]
- Gallo, M.; Botte, M.; Ruggiero, A.; D’Acierno, L. A Simulation Approach for Optimizing Energy-Efficient Driving Speed Profiles in Metro Lines. Energies 2020, 13, 6038. [Google Scholar] [CrossRef]
- Thorat, S.B.; Sudhir, J.; Ramana, M.; Somnath, P.; Kalyankar, N.V. Intelligent computing railway signal engineering. In Proceedings of the 6th International Conference on Computer Sciences and Convergence Information Technology (ICCIT), Seogwipo, Korea, 29 November–1 December 2011. [Google Scholar]
- Yong, D.; Yun, B.; Fang-ming, L.; Bao-hua, M. Simulation Algorithm for Energy-Efficient Train Control under Moving Block System. In Proceedings of the WRI World Congress on Computer Science and Information Engineering, Los Angeles, CA, USA, 31 March–2 April 2009. [Google Scholar] [CrossRef]
- Battistin, M.; Elia, S. Energy consumption evaluation for sports centers: A method based on optimization classes and qualitative dashboards. Econ. Policy Energy Environ. 2015, 1, 133–144. [Google Scholar] [CrossRef]
- Dominguez, M.; Fernandez-Cardador, A.; Cucala, A.; Pecharroman, R. Energy Savings Metropolitan Railway Substations Through Regenerative Energy Recovery and Optimal Design of ATO Speed Profiles. IEEE Trans. Autom. Sci. Eng. 2012, 9, 496–504. [Google Scholar] [CrossRef]
Publisher’s Note: MDPI stays neutral with regard to jurisdictional claims in published maps and institutional affiliations. |
© 2021 by the authors. Licensee MDPI, Basel, Switzerland. This article is an open access article distributed under the terms and conditions of the Creative Commons Attribution (CC BY) license (https://creativecommons.org/licenses/by/4.0/).