Article

Evaluating the Impact of Energy Efficiency Building Codes for Residential Buildings in the GCC

by
Mohamed H. Elnabawi
Architectural Engineering Department, College of Engineering, United Arab Emirates University, Al Ain P.O. Box 13393, United Arab Emirates
Energies 2021, 14(23), 8088; https://doi.org/10.3390/en14238088
Submission received: 14 October 2021 / Revised: 16 November 2021 / Accepted: 25 November 2021 / Published: 2 December 2021
(This article belongs to the Section G: Energy and Buildings)

Abstract

:
In arid climates, almost half of the urban peak load of energy demand is used to supply cooling and air-conditioning in the summertime. The pressure placed on energy resources to satisfy inhabitants’ indoor comfort requirements is mounting due to accelerated urbanisation rates in developing countries and has led countries such as those in the GCC (Gulf Cooperation Council) to establish sustainable building codes to enhance their environmental performance. Using the extensive parametric energy simulations provided by DesignBuilder, this study addresses the potential of applying different GCC energy efficiency measures to reduce annual energy consumption and carbon emissions in a typical residential dwelling in the Kingdom of Bahrain. To do so, first, a base case validation simulation model was generated, followed by four design scenarios addressing the minimum requirements for Bahrain’s Energy Conservation Code, Abu Dhabi’s ESTIDAMA 1, Saudi Arabia’s code, and Kuwait’s building code. Then, a feasibility study was conducted using the simple payback period (SPP) and lifecycle cost (LCC) analysis. Overall energy and carbon emission (CO2) reduction showed the potential for building sustainable codes to improve building environmental performance throughout the year. In terms of energy performance and CO2 reduction, Abu Dhabi’s ESTIDAMA 1 code recorded the best energy savings at a 24.4% and a 26.3% reduction in carbon emissions, followed by the Saudi code with a 14.6% annual energy savings and 12.3% less carbon emissions. Regarding the economic analysis, although the SPP indicates the Bahraini code offered payback in just under two years for subsidised energy and half a year for unsubsidised, the LCC analysis suggests that applying Abu Dhabi’s ESTIDAMA 1 code was the most feasible, followed by the Saudi building code. Consequently, the study suggests a comprehensive evaluation of the relationship between the sustainable building codes and their economic feasibility in order to enhance and promote the wide application in the GCC based on the code’s capabilities and their benefits for residential households and the overall economy.

1. Introduction

For many reasons, the building sector accounts for more than 40% of all primary energy use and associated greenhouse gas (GHG) emissions, including the increasing population, expanding housing stock, and better living standards; all these have led to an expected escalation in energy use. As a result, energy demand saw its sharpest growth during the last decade, recording 2.3% more in 2018 [1]. Most of this energy assists comfortable levels of heating, ventilation, and air conditioning, which account for 35%, compared to lighting (11%) and major appliances (18%), with the remaining 36% is scattered across miscellaneous areas, including electronics. However, in arid climate zones, such as in the Gulf Cooperation Council (GCC) member countries, the situation is even worse because the consequences include a higher energy load for cooling. In these zones, air conditioning accounts for over 60% of total energy consumption [2], and there is a higher incidence of heat stress and other heat-related illnesses due to the extremely hot climate [3].
Bahrain, for instance, has one of the highest energy consumption rates in the world and uses almost three times more energy per person than the world average. Based on 2014 statistics, the country consumes 11,500 kWh of energy per capita compared with the global average of 3030 kWh. According to the World Bank, in 2016, over 48.6% of total electricity consumption was attributed to residential buildings, followed by the commercial sector at 36.4% [4]. Like other GCC countries, Bahrain has a substantial seasonal variation in electricity consumption; during the extremely hot months from May to October, there is a significant increase in consumption, mainly due to the heavy use of air-conditioning units, which account for 60–65% of electricity usage in buildings. This high annual rate of electricity consumption will mostly continue and lead to an increase in energy consumption per capita, as Bahrain is witnessing a high population growth rate, rapid urbanisation, industrialisation, and commercialisation.
With more visitors coming in and causing a fast-growing domestic energy demand, these factors represent a major challenge for energy security. Increasing awareness of climate change and energy savings make it essential to review and update the building codes to meet national energy and environmental challenges. In a quick response in 1984 from GCC members, their respective ministries of electricity endorsed a thermal regulation to be voluntarily adopted by all members [5]. The proposed guidelines included minimum levels of thermal resistance (R-value) of 1.35 m2K/W for walls and 1.75 m2K/W for roofs. However, due to the differing contexts of the GCC members, such as energy infrastructure [6], dwelling and household characteristics [7], lifestyles [8,9], household behaviour [10,11], and other country-specific conditions, the type of policy instrument suitable for guiding energy efficiency varies between GCC members and different sectors. Since each GCC member has its own context that determines which policy instruments are more appropriate, individual energy efficiency codes were established.
Of the GCC members, Kuwait was the first to develop an energy efficiency code of practice, which was adopted and implemented by the Ministry of Electricity in 1983. The code specifies minimum thermal resistance for walls and roofs, size and quality for glazing, fresh air requirements, and performance standards for air-conditioning (AC) systems. The code is regularly revisited and updated with the latest in energy efficiency standards and applications, most recently in 2014 [12]. In Saudi Arabia, the building code was activated in 2007 for the first time and includes a specific section (Section 601) on energy conservation requirements for different housing conditions under different local climates [13]. The United Arab Emirates and Qatar also implemented more generic sustainability framework rating systems, where energy use is the main driver. Abu Dhabi in the United Arab Emirates launched the ESTIDAMA rating system for new developments [14], while Qatar mandated the Qatar Sustainability Assessment System (QSAS), which later became the Global Sustainability Assessment System (GSAS) [2]. Bahrain adopted an energy efficiency code for commercial buildings in 1999, which has prescriptive requirements for thermal insulation in the walls and roofs and specifications for window glazing [15,16]. The application of this code was extended to all building types in 2013 [17]. Table 1 summarises the minimum requirements for a residential building to comply with the prescriptive-based design approach, as described in some GCC codes [16,18].
However, although it is generally considered that energy efficiency measures are the most cost-effective way to enhance the security of energy supply and reduce greenhouse gas emissions [19], the feasibility of such measures has been considered separately [20]. Moreover, despite the proposals mentioned above on shifting toward energy codes, surprisingly little is known about how energy codes affect residential energy consumption in practice [21], leading to a very limited application in the GCC in general [22,23,24], and Bahrain in particular [15]. As recent applications of the different codes have revealed, there are numerous barriers to applying feasible technical and economic approaches to energy saving [11,25,26,27], and this is compounded by a noticeable lack of awareness among both designers and householders about the most suitable technology and its feasibility for the building envelope [28]. Perhaps this explains why Bahrain’s energy code has a limited ability to meet the thermal insulation requisites for the building envelope, which includes walls, roofs and window glazing. These can account for 15–40% of the total building cost and can even exceed 40% with building services such as heating and cooling systems [28]. This limited ability can be detected in the Bahraini energy code, which kept the same minimum thermal values as adopted by the GCC thermal regulation in 1984—the only difference was adding specifications regarding the window glazing—as presented in Table 1.
In this context, the study had two aims: firstly, to evaluate the effectiveness of the different GCC energy efficiency measures on overall energy consumption and carbon emission (CO2) for a typical Bahraini residential building; and, secondly, to assess the long-term and economic feasibility of these energy efficiency codes, including the percentage of annual energy consumption saving, peak cooling load reduction, payback period, and the building’s lifecycle cost.

2. Literature Review

Most of the available studies on applying different energy-saving measures are almost exclusively designed for mid-latitude climates in North America and Europe, and thus, have very limited application to the Middle East and the GCC region [15,22,23,24]. Accordingly, this section critically reviews recent studies on energy efficiency in buildings in the GCC region. Due to the recent advances in technology and enhanced energy modelling techniques, the only studies included in the review are those from the past decade, which use dynamic energy modelling, as approved by many well-established green building codes.
The first study to consider is from 2008 [29], when Radhi examined the reduction in consumed energy as a result of several energy efficiency measures for an office building in Bahrain. These measures included thermal insulation for walls and roofs, low emissivity glazing, energy efficient systems and appliances such as daylight sensors and better energy-saving equipment, in addition to examining different cooling setpoints. This combination of measures led to a 42% energy reduction. However, no feasibility analysis was conducted to evaluate the cost-effectiveness of such measures. Another study by Radhi et al. [16] tested the impact of Bahrain’s thermal insulation code, known as Article 32, on reducing the energy consumption and carbon emissions of both residential and commercial buildings. The study analysed the impact of different insulation levels, glazing types, and window-to-wall ratios on both thermal comfort and total building energy consumption. The study concluded that window size and type have a significant impact on thermal comfort for residential buildings and that simply improving the building envelope is insufficient to achieve a 40% reduction in both energy use and carbon emissions [16]. Again, no economic analysis was conducted as part of these studies.
In a similar study, Taleb and Sharples [30] considered the hot, arid climate of Saudi Arabia and reported that a 32.4% reduction in annual electricity could be achieved by enhancing the insulation of external walls and roofs and by using double glazed windows with appropriate shading devices on residential buildings [30]. In the United Arab Emirates, Taleb [31] conducted a dynamic energy simulation on a residential villa in Dubai by assessing the passive cooling strategies of eight different principles, and reported a 23.6% reduction in annual energy use. Similar outcomes were reported in Saudi Arabia by Alaidroos and Krarti [32], who examined the impact of the building envelope on the energy saving of a typical residential building in different cities within the kingdom. Energy savings of 22.7–39.5% could be achieved, subject to the context and climate of the city. In Qatar, Kharseh and Al-Khawaja examined five different energy retrofitting methods related to building envelopes and their effects on the cooling loads of a residential building [33]. The outcomes showed a potential reduction in cooling energy of 53%. Almost identical outcomes were reported in another study in Kuwait conducted by Ameer and Krarti [34]. They investigated Kuwaiti residential building energy codes and found that there was a substantial reduction in electricity bills when the energy codes were applied.
In Oman, Al-Saadi et al. [35] explored different energy-efficient retrofitting strategies, including air tightness improvement, LED light installation, and walls and roof insulations. The findings indicated that 42.5% less energy was used by combining the best tactic from each measure. Another study in the same context found that by applying the proper energy efficiency measures, maximum energy saving could reach 26.7% [36]. Alalouch et al. [18] employed dynamic building simulations to examine the energy-saving potential of applying the minimum requirements of the energy-saving code on residential buildings located in different climate zones within Oman. The outcomes showed an energy reduction of 13.2% in a warm, tropical climate compared to 48% in a hot, dry climate.
In Saudi Arabia, another interesting study by Wahl [37] investigated the amount of energy that can be saved by adapting the building envelope according to different energy efficiency measures, using energy simulations for a two-storey residential building. Changing the window type from single clear glass to double glass with a reflective surface produced the highest energy saving of 21–27% of total saved energy. Other energy savings were gained by adding insulation to an uninsulated roof (23% total energy saving), enhancing the thermal insulation of the external walls (11–21%), and installing fixed shades when dimensioned for the peak cooling load (8–13%). Another study in Saudi Arabia by Almushaikah and Almasri [38] assessed different energy-efficient measures in the residential sector. The results suggested that the applied measures were responsible for reducing energy consumption by 27–29% for walls, 13–14% for roofs, and 6% for windows; these findings are much lower in comparison to Wahl [37] regarding the windows and roofs, despite both studies being set in the same climate. In summary, all of the above reviews reported different findings regarding energy saving potential when energy efficiency is considered in the various arid climate locations of the GCC.
The literature review also revealed a lack of investigation of the energy efficiency measures taken in Bahrain, despite the fact that Bahrain consumes almost three times more energy per person compared to the world average and, after Qatar, and is the second-highest polluter of CO2 emissions (36.58 tonnes per capita) [39]. Following an extensive literature review of more than 100 studies on building performance between 2001–2017, and according to Koppen’s climate classification (Figure 1) [40], most recent studies have been conducted on tropical, subtropical, and temperate climates (in descending order of frequency). Given the paucity of studies on hot, dry climates, therefore, it is important to gain further understanding of both the feasibility and impact of implementing energy efficiency measures in residential buildings in such climates, and within Bahrain, in particular.

3. Methodology

In accordance with the background to this study, this paper hypothesizes that relying solely on the amount of energy or carbon emissions to be saved is not enough for the wide application of energy efficiency measures in the GCC. Still, more analyses are required to have a comprehensive evaluation and understand the long-term and economic feasibility of implementing these codes in the residential sector. Moreover, it is crucial to differentiate the capabilities of each code based on different factors such as context, climate, design requirements, electricity prices, and other country-specific conditions. Therefore, the study particularly considered the effectiveness of the current GCC energy efficiency measures for building envelopes regarding energy saving, reduced carbon footprint, and economic feasibility for residential buildings in the arid climates of Bahrain. Accordingly, the proposed framework was designed to investigate:
  • The energy consumption rates associated with the residential sector growth rate;
  • Base case selection criteria for a typical residential building;
  • Dynamic energy modelling for the base case for validation purposes;
  • A parametric energy analysis for the different GCC building code scenarios, based on the annual energy consumption saving percentage, peak cooling load, and carbon emissions reduction;
  • Long-term and economic feasibility, including the simple payback period (SPP) and the building’s lifecycle cost (LCC).
The objectives of the five phases were to:
  • Evaluate the effectiveness of the different GCC energy efficiency codes on typical Bahraini residential building energy consumption and carbon emissions;
  • Assess the economic and environmental benefits of applying these energy efficiency codes.

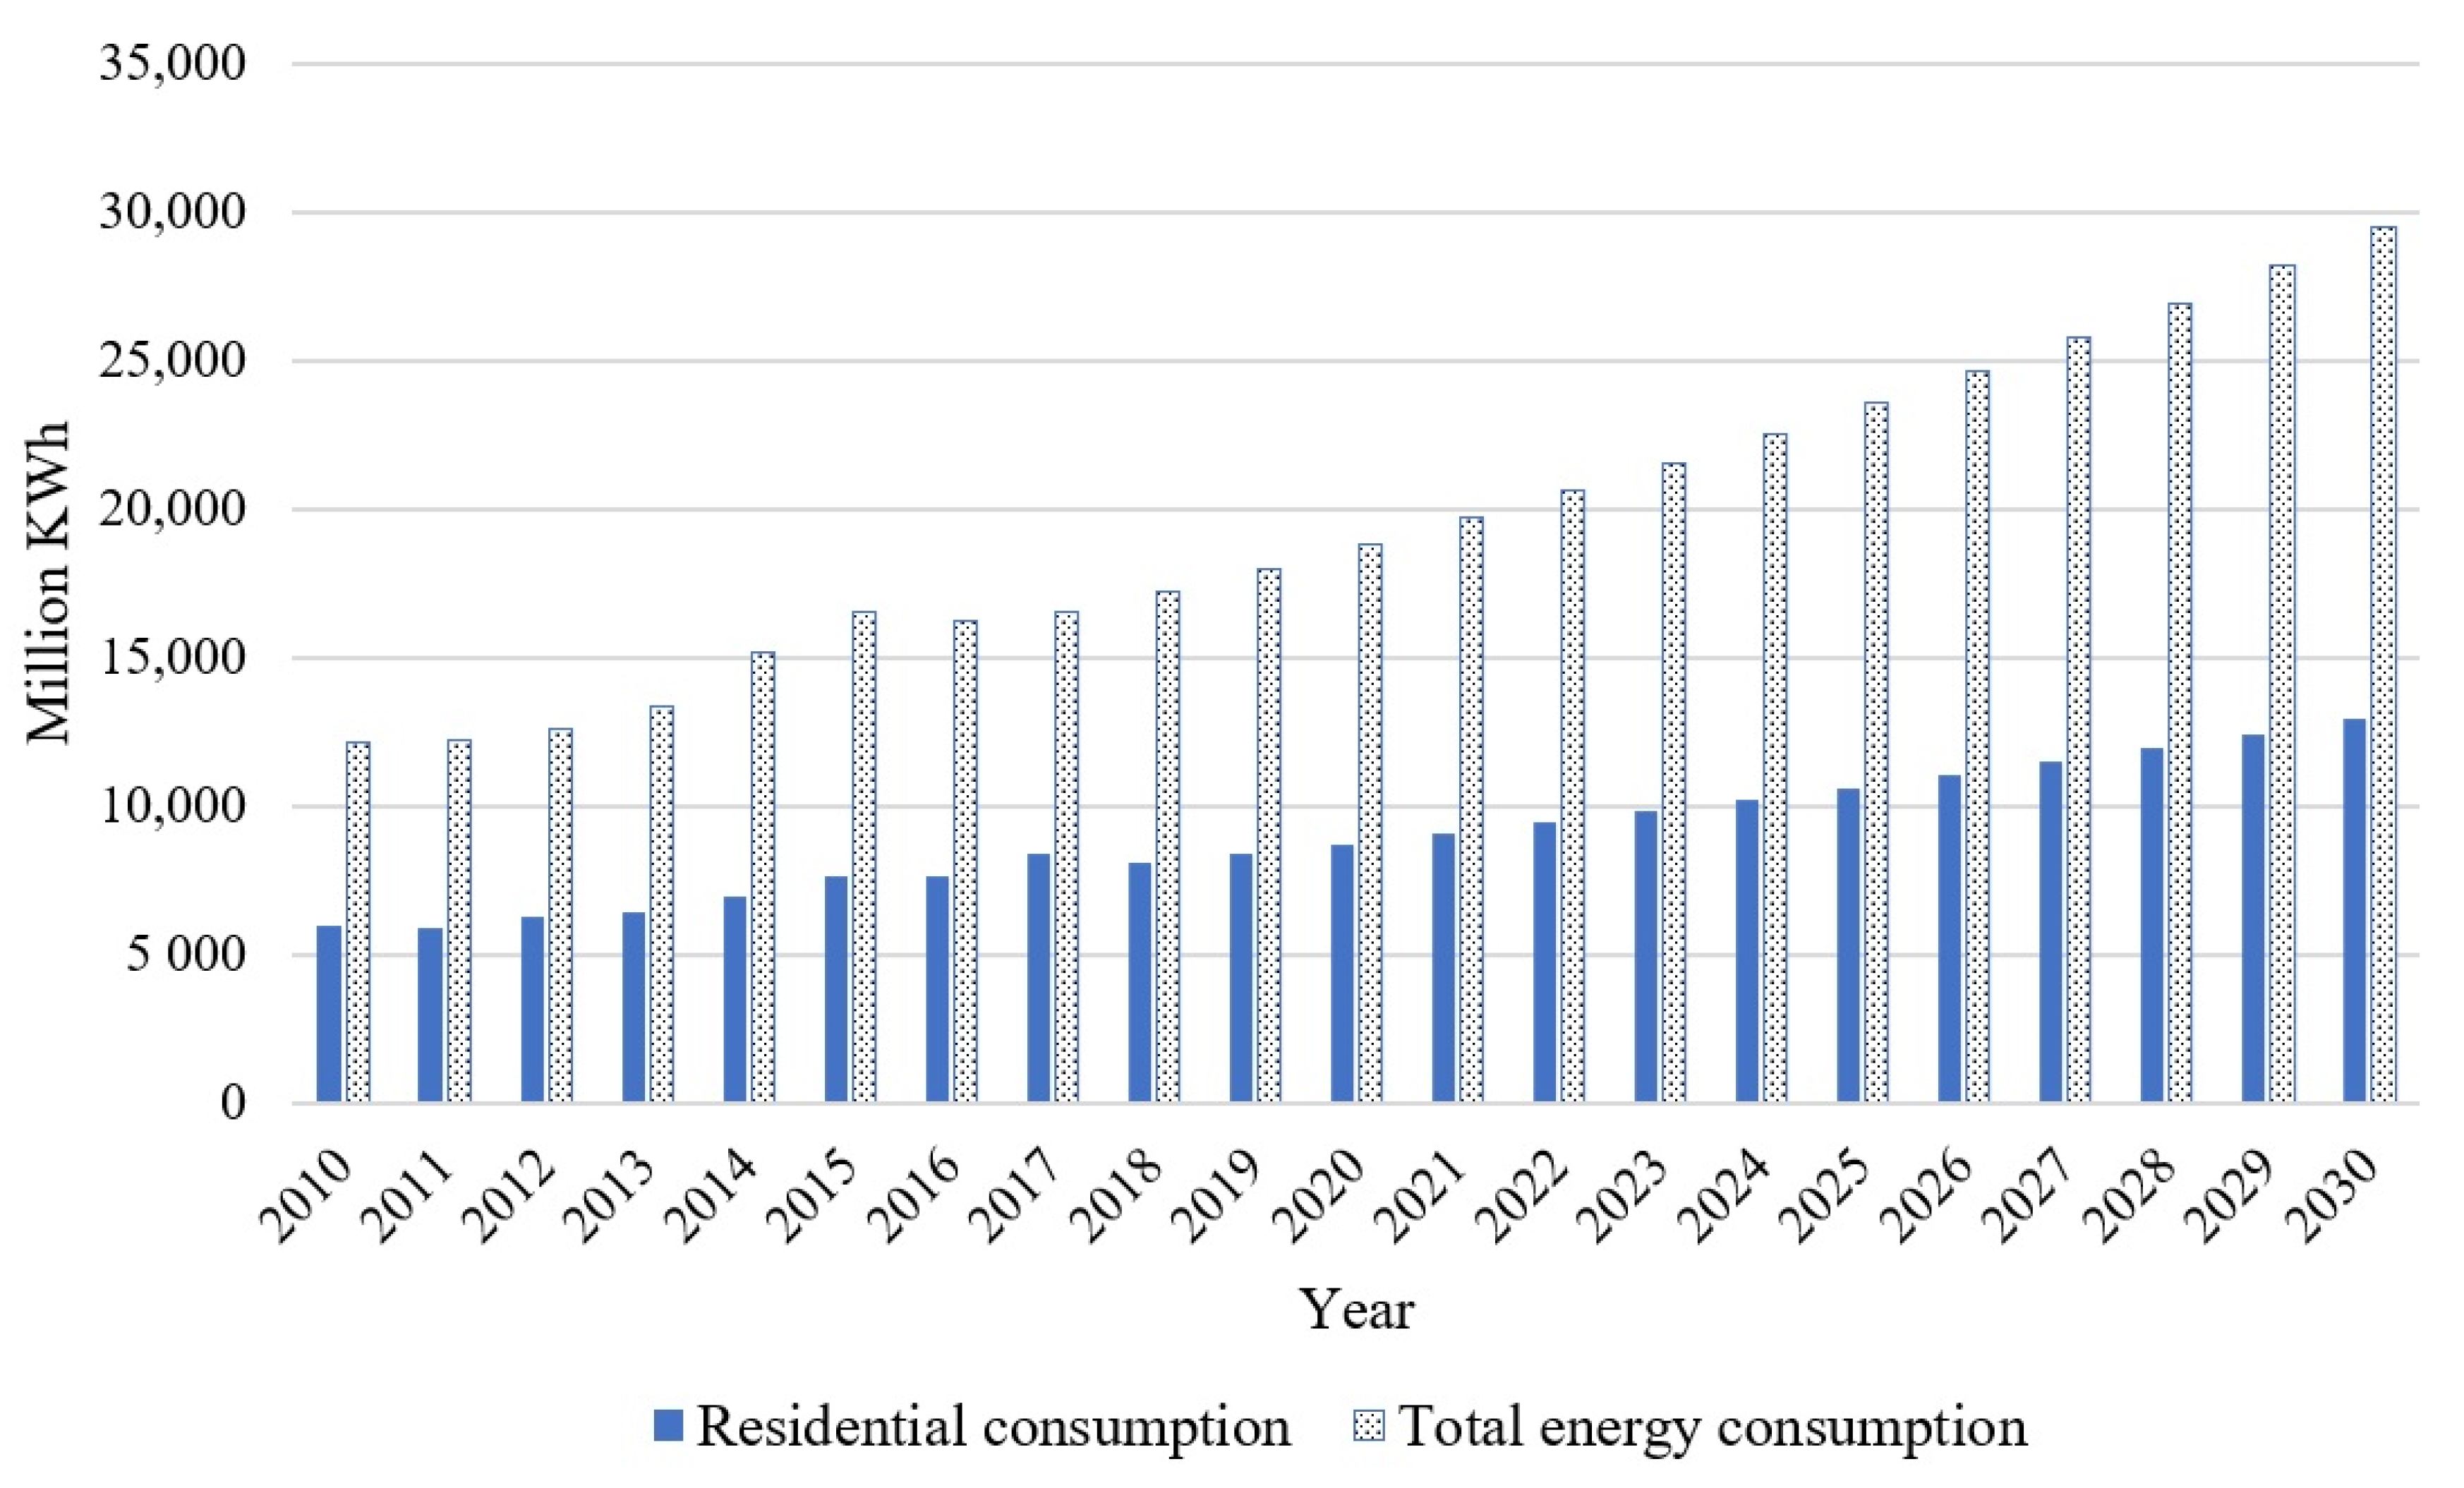
3.1. The Potential Growth Rate of Bahrain’s Residential Sector

To assess the effectiveness of potential energy savings in the residential sector in Bahrain, it is first crucial to estimate the residential sector’s role in the overall energy consumed by the country at present and in the future. Accordingly, to locate the required data, reports and information were gathered from relevant bodies. Annual reports were analysed up to 2017 from the World Bank and the Sustainable Energy Unit (SEU), which is a joint initiative between the Office of the Minister of Electricity and Water Affairs and the United Nations Development Program (UNDP) [41]. In addition, the study considered reports for the years 2000–2016 from the Central Informatics Organisation (under the supervision of the Ministry of Finance and National Economy) and an Energy Country Profile report 2020 [42]. The data required for the estimation include:
  • The size of the residential sector compared to others such as the industrial, agricultural, and commercial sectors;
  • The annual energy consumed by the residential sector compared to others;
  • The annual growth rate of the residential sector.
Moreover, the energy to be consumed by the residential sector in 2030, aligned with the 2030 Bahrain economic vision, was forecasted using Equation (1), which was developed using Pascal’s Triangle [43]. Equation (1) is based on the percentage of annual average energy consumption by the residential sector and annual total energy consumption:
E n = ( 1 + r % ) n o × E o
where En = total energy consumption in the target year, r% = annual growth rate of energy consumption, n = the target year, o = the most recent year where the total energy consumption is known, and Eo = total energy consumed at year 0.

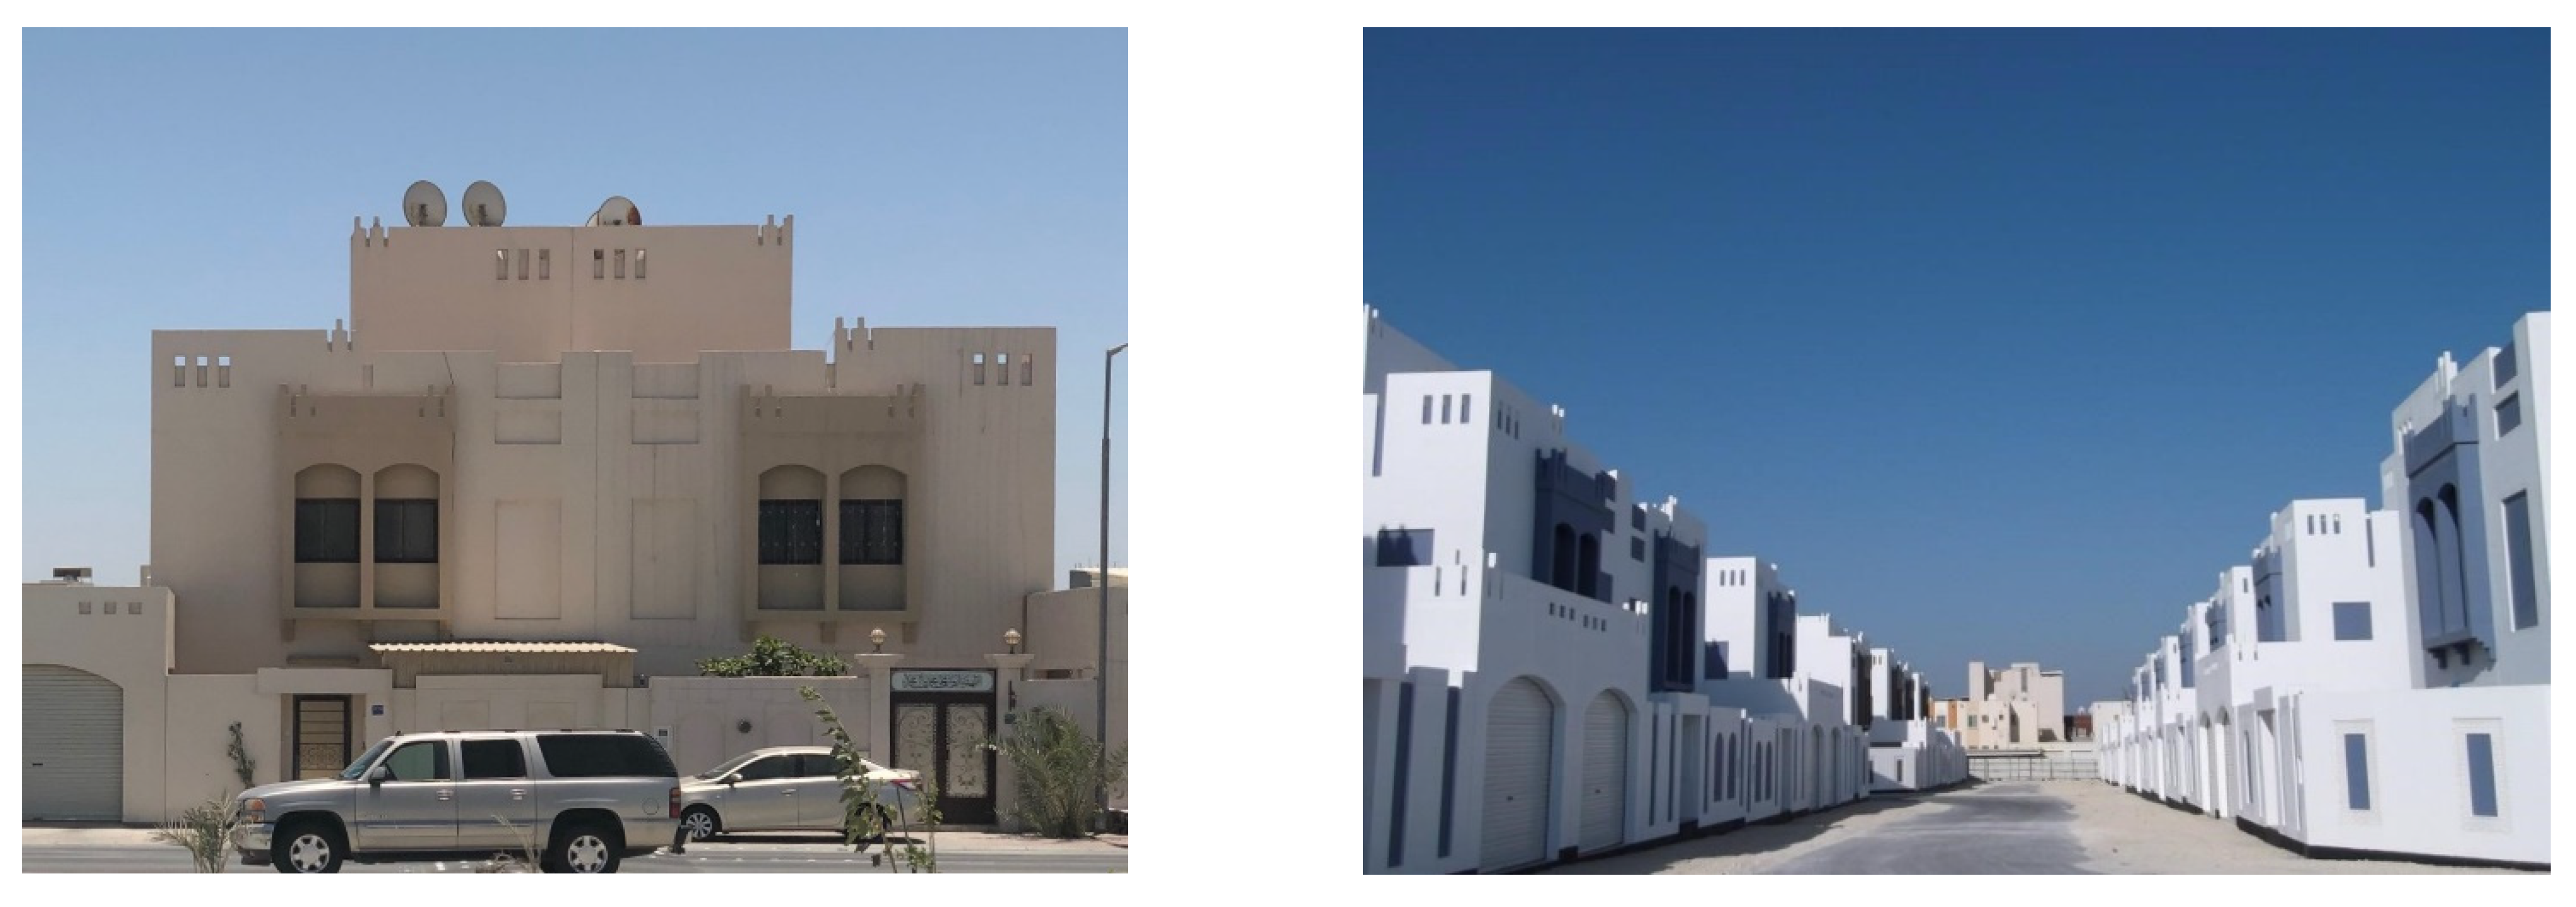
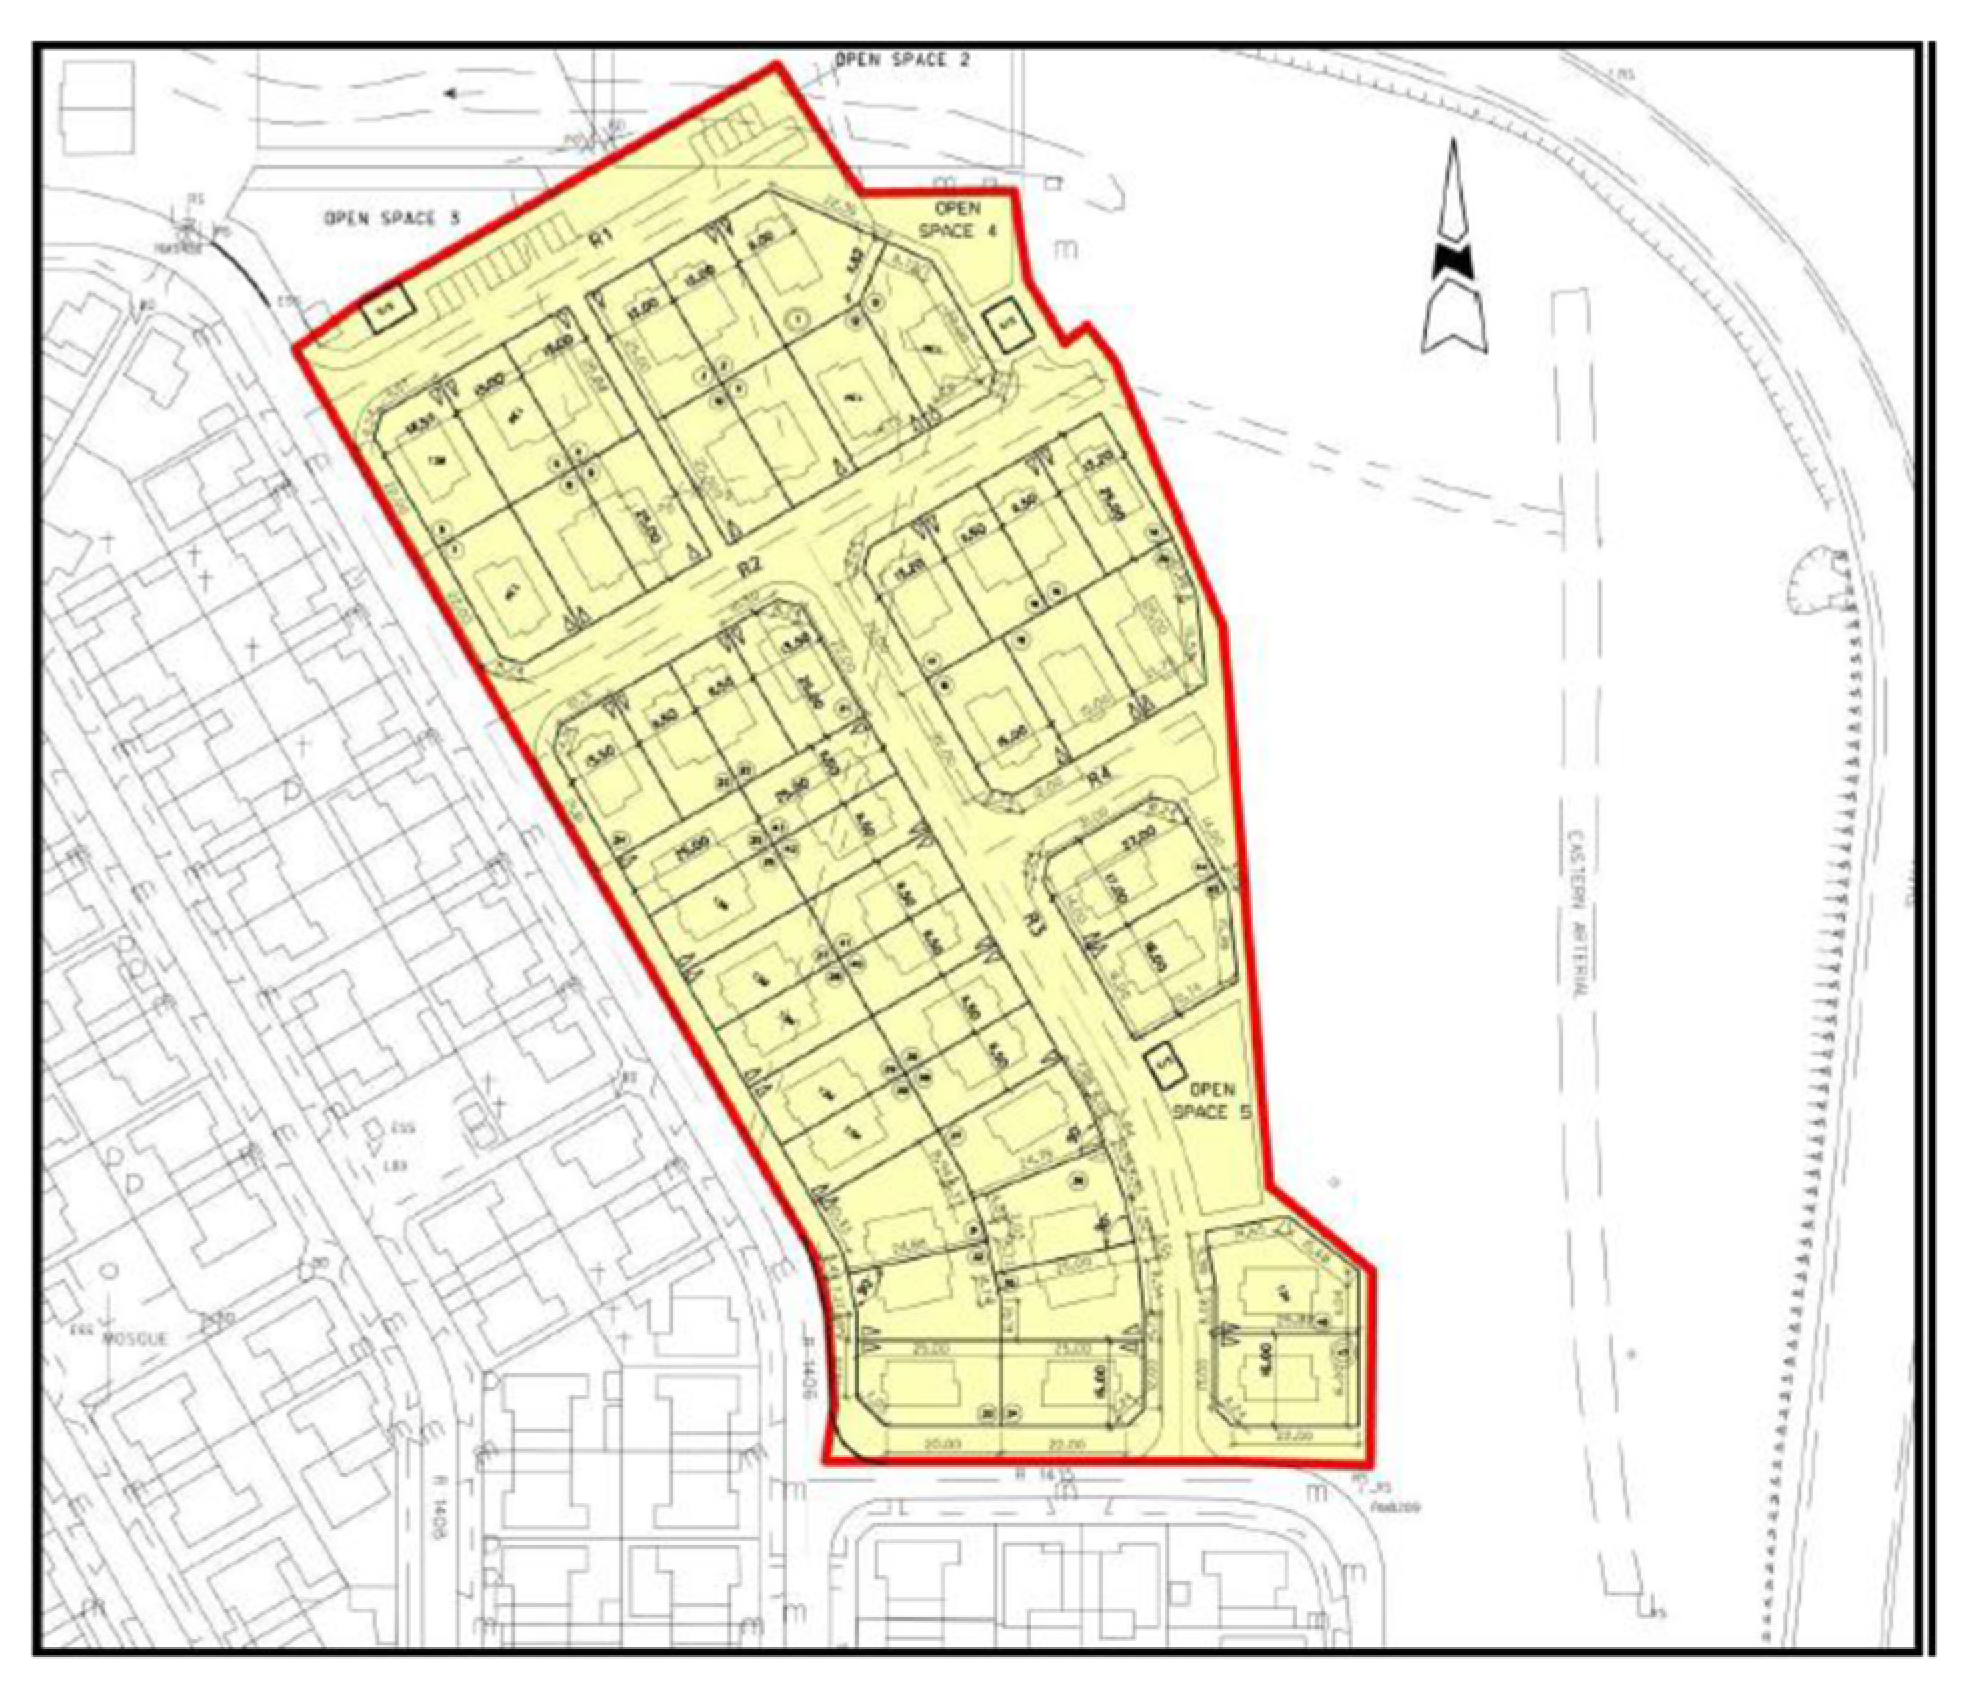
3.2. Base Case Selection Criteria

The reference case study for the research is a prototype housing unit provided by the Ministry of Housing in Bahrain. Although there are many housing typologies, the most affordable and commonly known is the T3M unit (Figure 2). The reasons for deciding on this case study were:
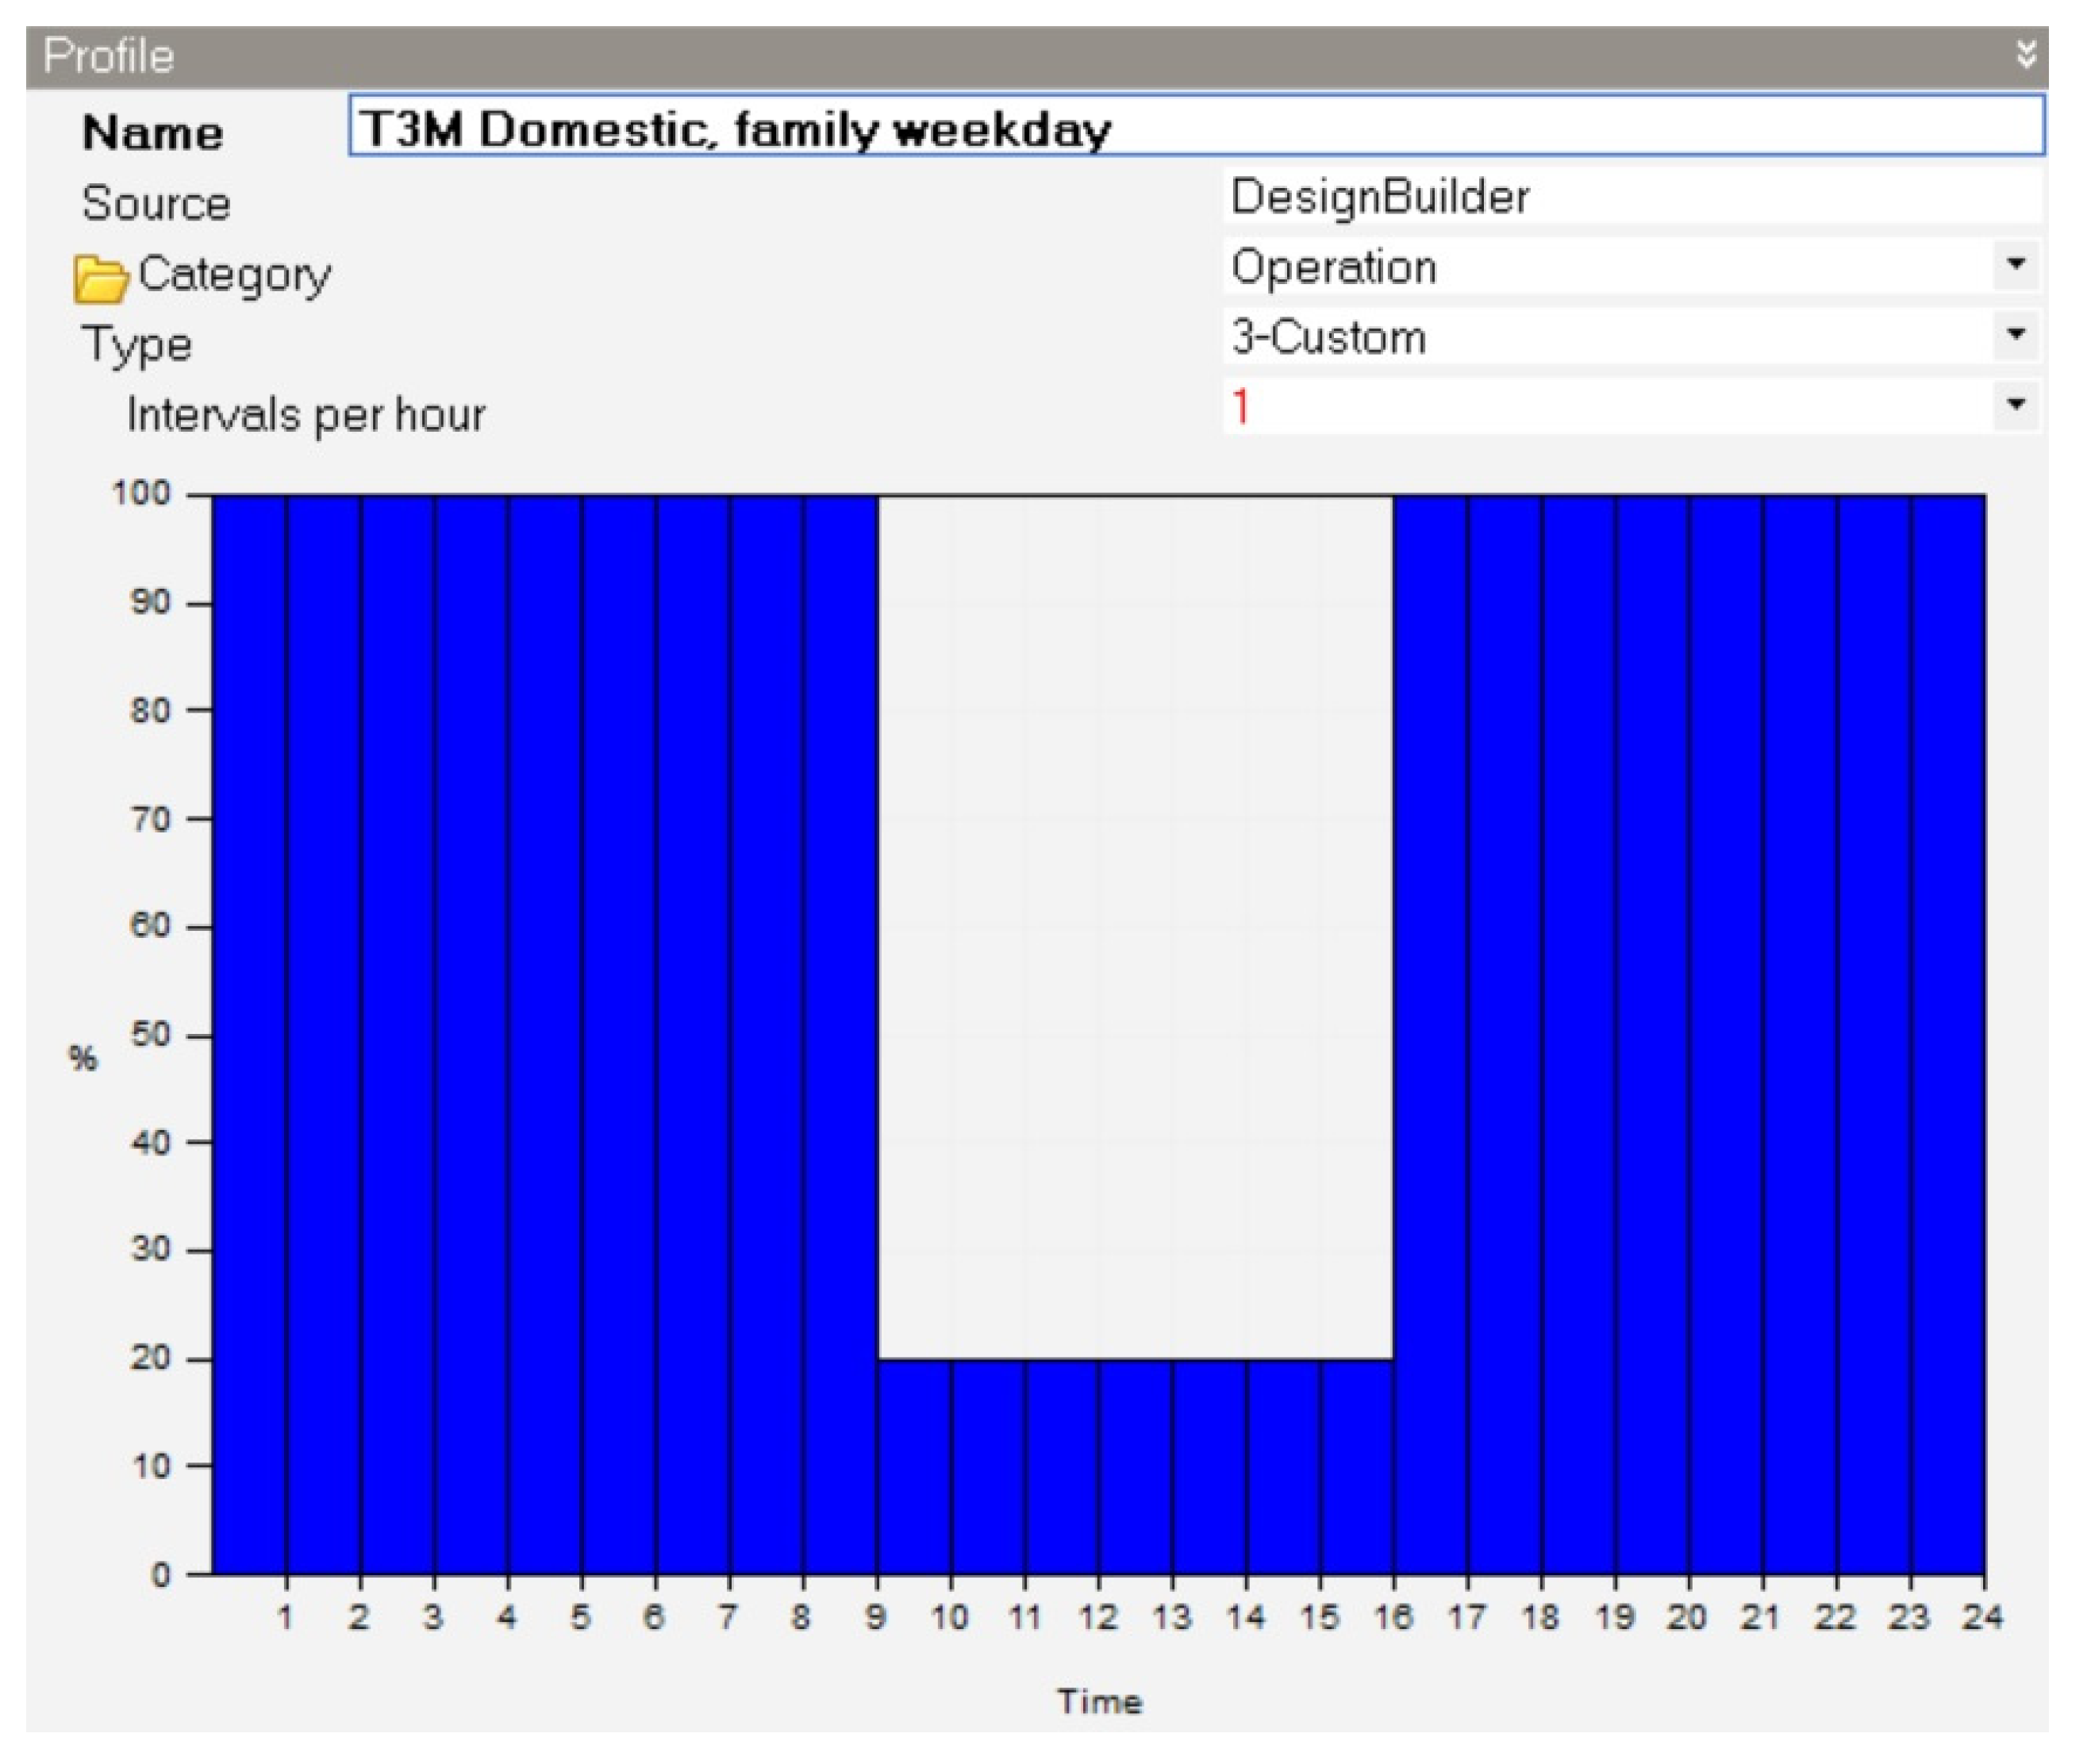
  • The availability of all the required data, such as the building construction drawings, main materials properties, operational schedule and energy consumption monthly patterns. These data will add more confidence to the outcomes and facilitate further studies in the future.
  • The very high energy consumption rate of the residential sector in Bahrain, which, according to previous studies, consumes more than 48% of the total electricity generated by the whole country [15,44].
  • Residential buildings constitute most of Bahrain’s building stock and about 76% of the total and projected annual growth in energy consumption [15].

3.3. Dynamic Energy Modelling Setups and Software Selection

Several studies have analysed the use of simulation tools in evaluating the energy and thermal performance of buildings [45,46]. According to a comprehensive review based on the most used building energy modelling tools, DesignBuilder, developed by DesignBuilder Software Ltd in the UK, is the most suitable tool for assessing performance applications and criteria [47,48,49]. It is the most comprehensive interface for the well-known EnergyPlus, (which is Department of Energy’s open-source whole-building energy modeling (BEM) engine), compared to others [50]. DesignBuilder outcomes have been validated and used in several studies with similar aims to the current study [49,51].

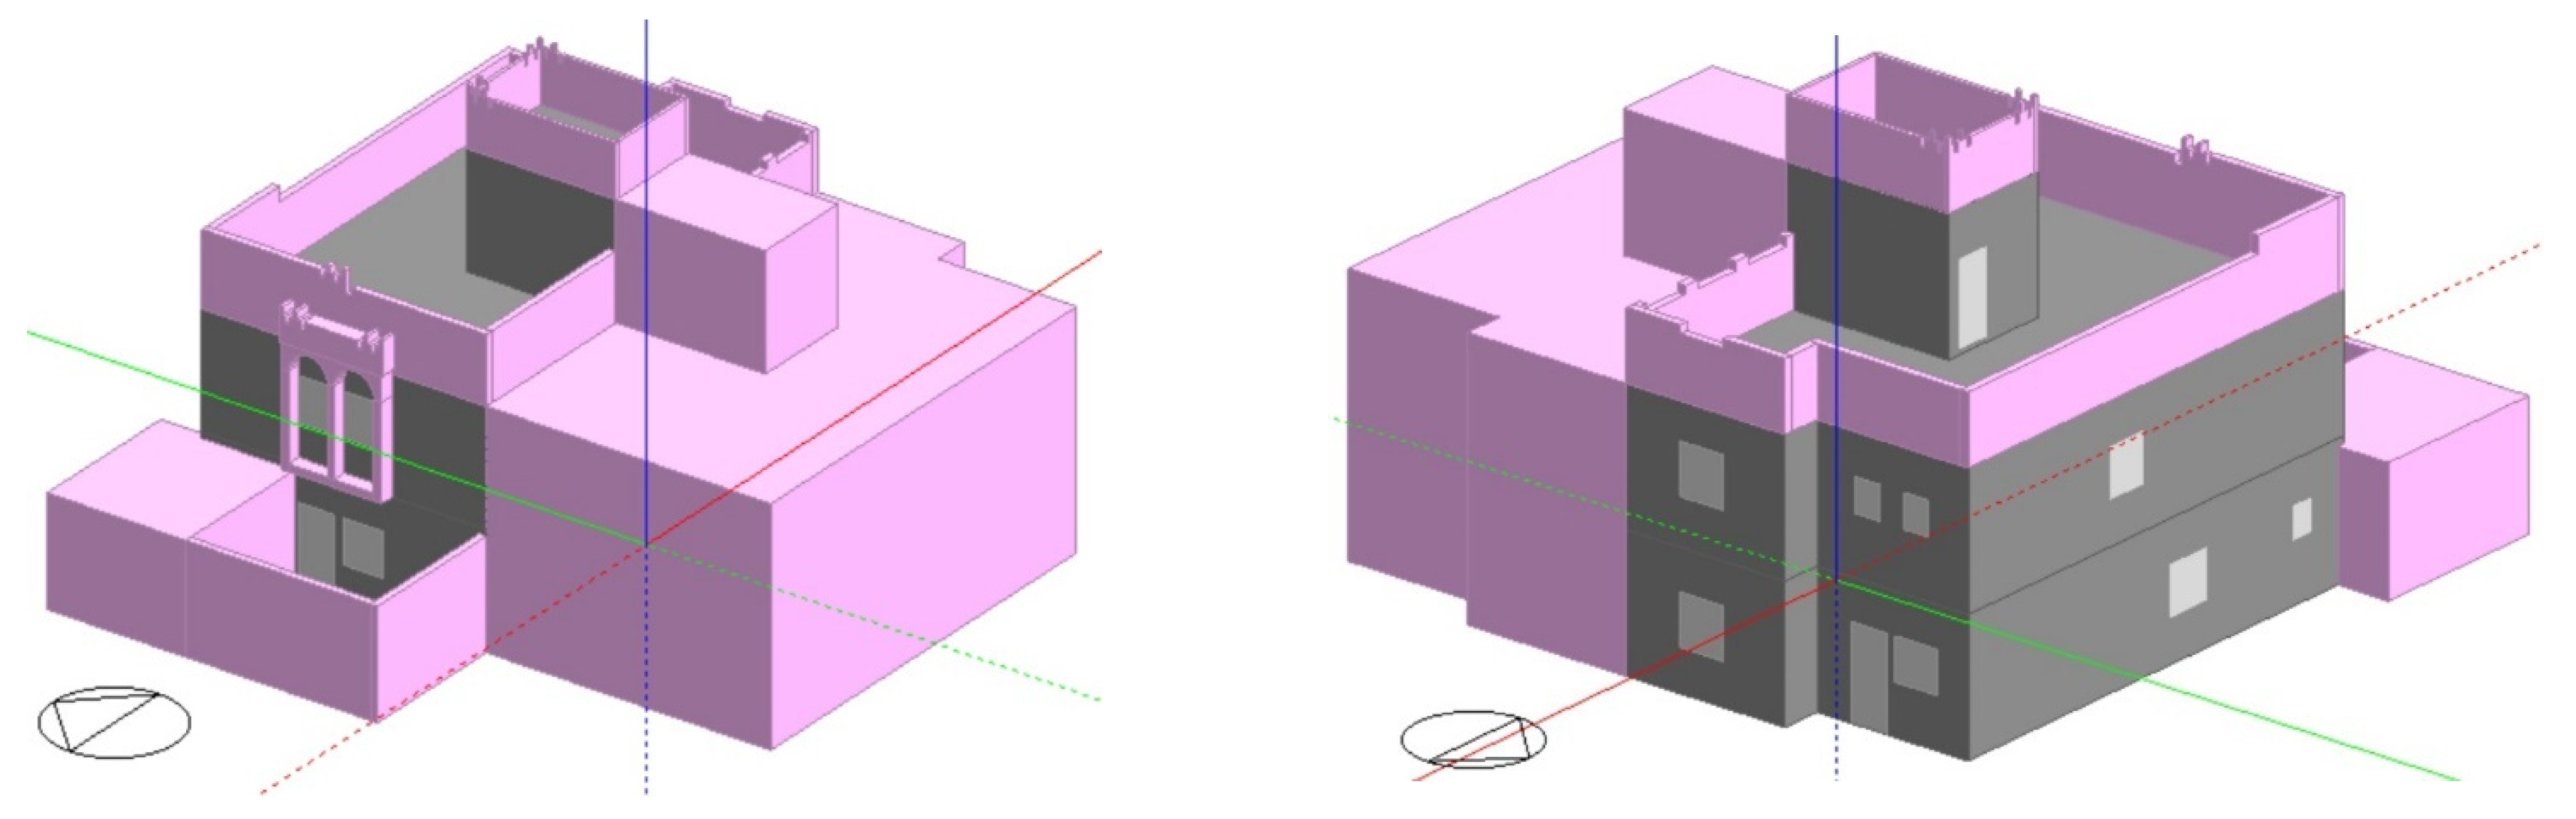
Building Model and Location—The Base Model

The T3M case study building is in Bahrain, which is classified as hot, dry climate zone 1B by the American Society of Heating, Refrigerating, and Air-Conditioning Engineers (ASHRAE) standards [52], and BWh in the Köppen-Geiger climate classification, which stands for hot, desert climate [53]; it has extremely hot summers and mild winters. As presented in Figure 3, the T3M is a two-storey building with three bedrooms and a living room on the upper floor, plus family living, kitchen, and majlis (guest reception based on gender), and a garage and small garden on the ground floor, with a total area equal to 209 m2. It is worth mentioning that some of these units are standalone while others are semidetached, depending on the plot size and location. The unit selected for this study is located in Hamad city, north of Bahrain, which has 48 standard T3M units over a plot area of 2.5 hectares (Figure 4). The main construction is a reinforced concrete frame structure with 0.2 m thick brick infilled walls without insulation or an airtight building envelope. The windows are double-coated with a solar heat gain coefficient (SHGC) of 0.31. The overall glass surface area in the facades is estimated at 24.6%, and they have no solar protection.
According to Maile’s [50] ideal workflow for BEM tools, the building form was simplified, and all the inner spaces and zones were identified and labelled. Table 2, shows all the data required to perform a dynamic energy simulation, including the site location, weather data, building form, construction materials, HVAC system, internal load, and operational schedule. The data were used to create a dynamic energy simulation model for the base case for validation purposes before testing the various measures of the energy codes, including the different building envelopes’ technologies. The building has no heating system, and the AC runs continuously at a setpoint of 24 °C. A lighting density of 5 W/m2 is set for the building during operational hours, as presented in Figure 5, assuming that on weekdays from 09:00 till 16:00, family members will be either at work or school and only the housemaid will be at home. Thus, the occupancy load at these times will only be 20% but rises to 100% with the presence of all family members, and similarly will be 100% during the weekend. Occupancy density in this study was assumed to be six occupants.

3.4. Parametric Energy Analysis for GCC Energy Efficiency Measures

Since one of the paper’s aims was to assess the effectiveness of GCC energy efficiency measures in the arid conditions of Bahrain, it was important to validate the simulation results to add confidence in the outcomes. Therefore, a base model for a prototypical Bahraini T3M house, described in Table 2, was modelled and verified by comparing the simulated electrical prediction with the actual consumption. This was followed by the modelling of four different scenarios, each representing one of the energy efficiency codes listed in Table 1. The GCC’s thermal regulations of 27 years ago were excluded as, due to recent building technology developments, each GCC member has already created their own thermal regulations. Each case’s data on annual energy consumption, peak cooling load, carbon emissions, and economic feasibility were then compared against the base case and analysed for the best scenario.

3.5. Long Term Performance and Economic Statistics

To assess the long-term performance of the energy efficiency scenarios listed in Table 1, percentages for annual energy consumption savings and peak cooling load reduction were statistically analysed using Equation (2):
% = a b a × 100
where (a) represents either the annual energy consumption or the peak cooling load of the base case, and (b) represents the annual energy consumption or the peak cooling load of the proposed scenario.
Regarding economic feasibility, two other indicators were used:
  • The SPP, which shows the amount of time taken to recover the initial investment of the project, as shown in Equation (3):
    SPP   = T o t a l   I n v e s t m e n t   C o s t A n n u a l   c o s t   s a v i n g s
  • The LCC, which provides the total cost of facility ownership. It considers all costs of acquiring, owning, and disposing of a building or building system and can be estimated according to Equation (4):
    LCC = T o t a l   I n v e s t m e n t   C o s t + 1 ( 1 + d ) N d × E C
    and,
    EC = EU × re
    where (d) represents the discount rate, and (N) represents the life cycle of the building in years. According to several studies, the LCC (d) discount rate is presumed to be 5% over a 30-year cycle period, (N) [18,34,54,55]. (EC) is the annual estimated energy cost, (EU) is the annual energy consumption acquired from the dynamic energy simulation, and (re) is the electricity tariff obtained from the EWA annual report for 2019 [56], as per Table 3, including both the unsubsidised and subsidised electricity tariff. The total investment cost was obtained from a previous study, as shown in Table 4 [18,34].

4. Results and Discussion

4.1. The Energy Consumption Growth Rate in the Bahraini Residential Sector

Rapidly rising Bahraini population figures, expected to increase by 33% by 2030 compared to 2015 [57], will produce an increase in housing stock; together with better living standards, this will, in turn, cause further growth in energy use. According to the Electricity and Water Authority [4], the average amount of electricity consumed by the residential sector between 2010–2018 was 47.9% of all electricity supplied by the country; this means that the sector consumed almost half the electricity, while the other half was consumed by three different sectors. Table 5 presents the annual electricity consumption of all sectors in Bahrain between 2010–2018 [4]. By comparing these rates to average global electricity consumption, Bahrain’s rates are very high and almost double the world average, estimated to be 27% [58]. In Canada, 16% of total energy production is consumed by the residential sector [59], while in the US and UK, this figure is 22% and 28%, respectively [60]. Moreover, energy intensity, which is a standard measure for how efficiently energy is used, is 54% higher in Bahrain than the GCC average and 88% higher than the world average [41,61]. These figures make the energy sector the greatest source of greenhouse gas emissions in Bahrain, at 77% of total emissions. According to the World Bank [61], Bahrain’s per capita emissions are amongst the highest in the world and continue to rise.

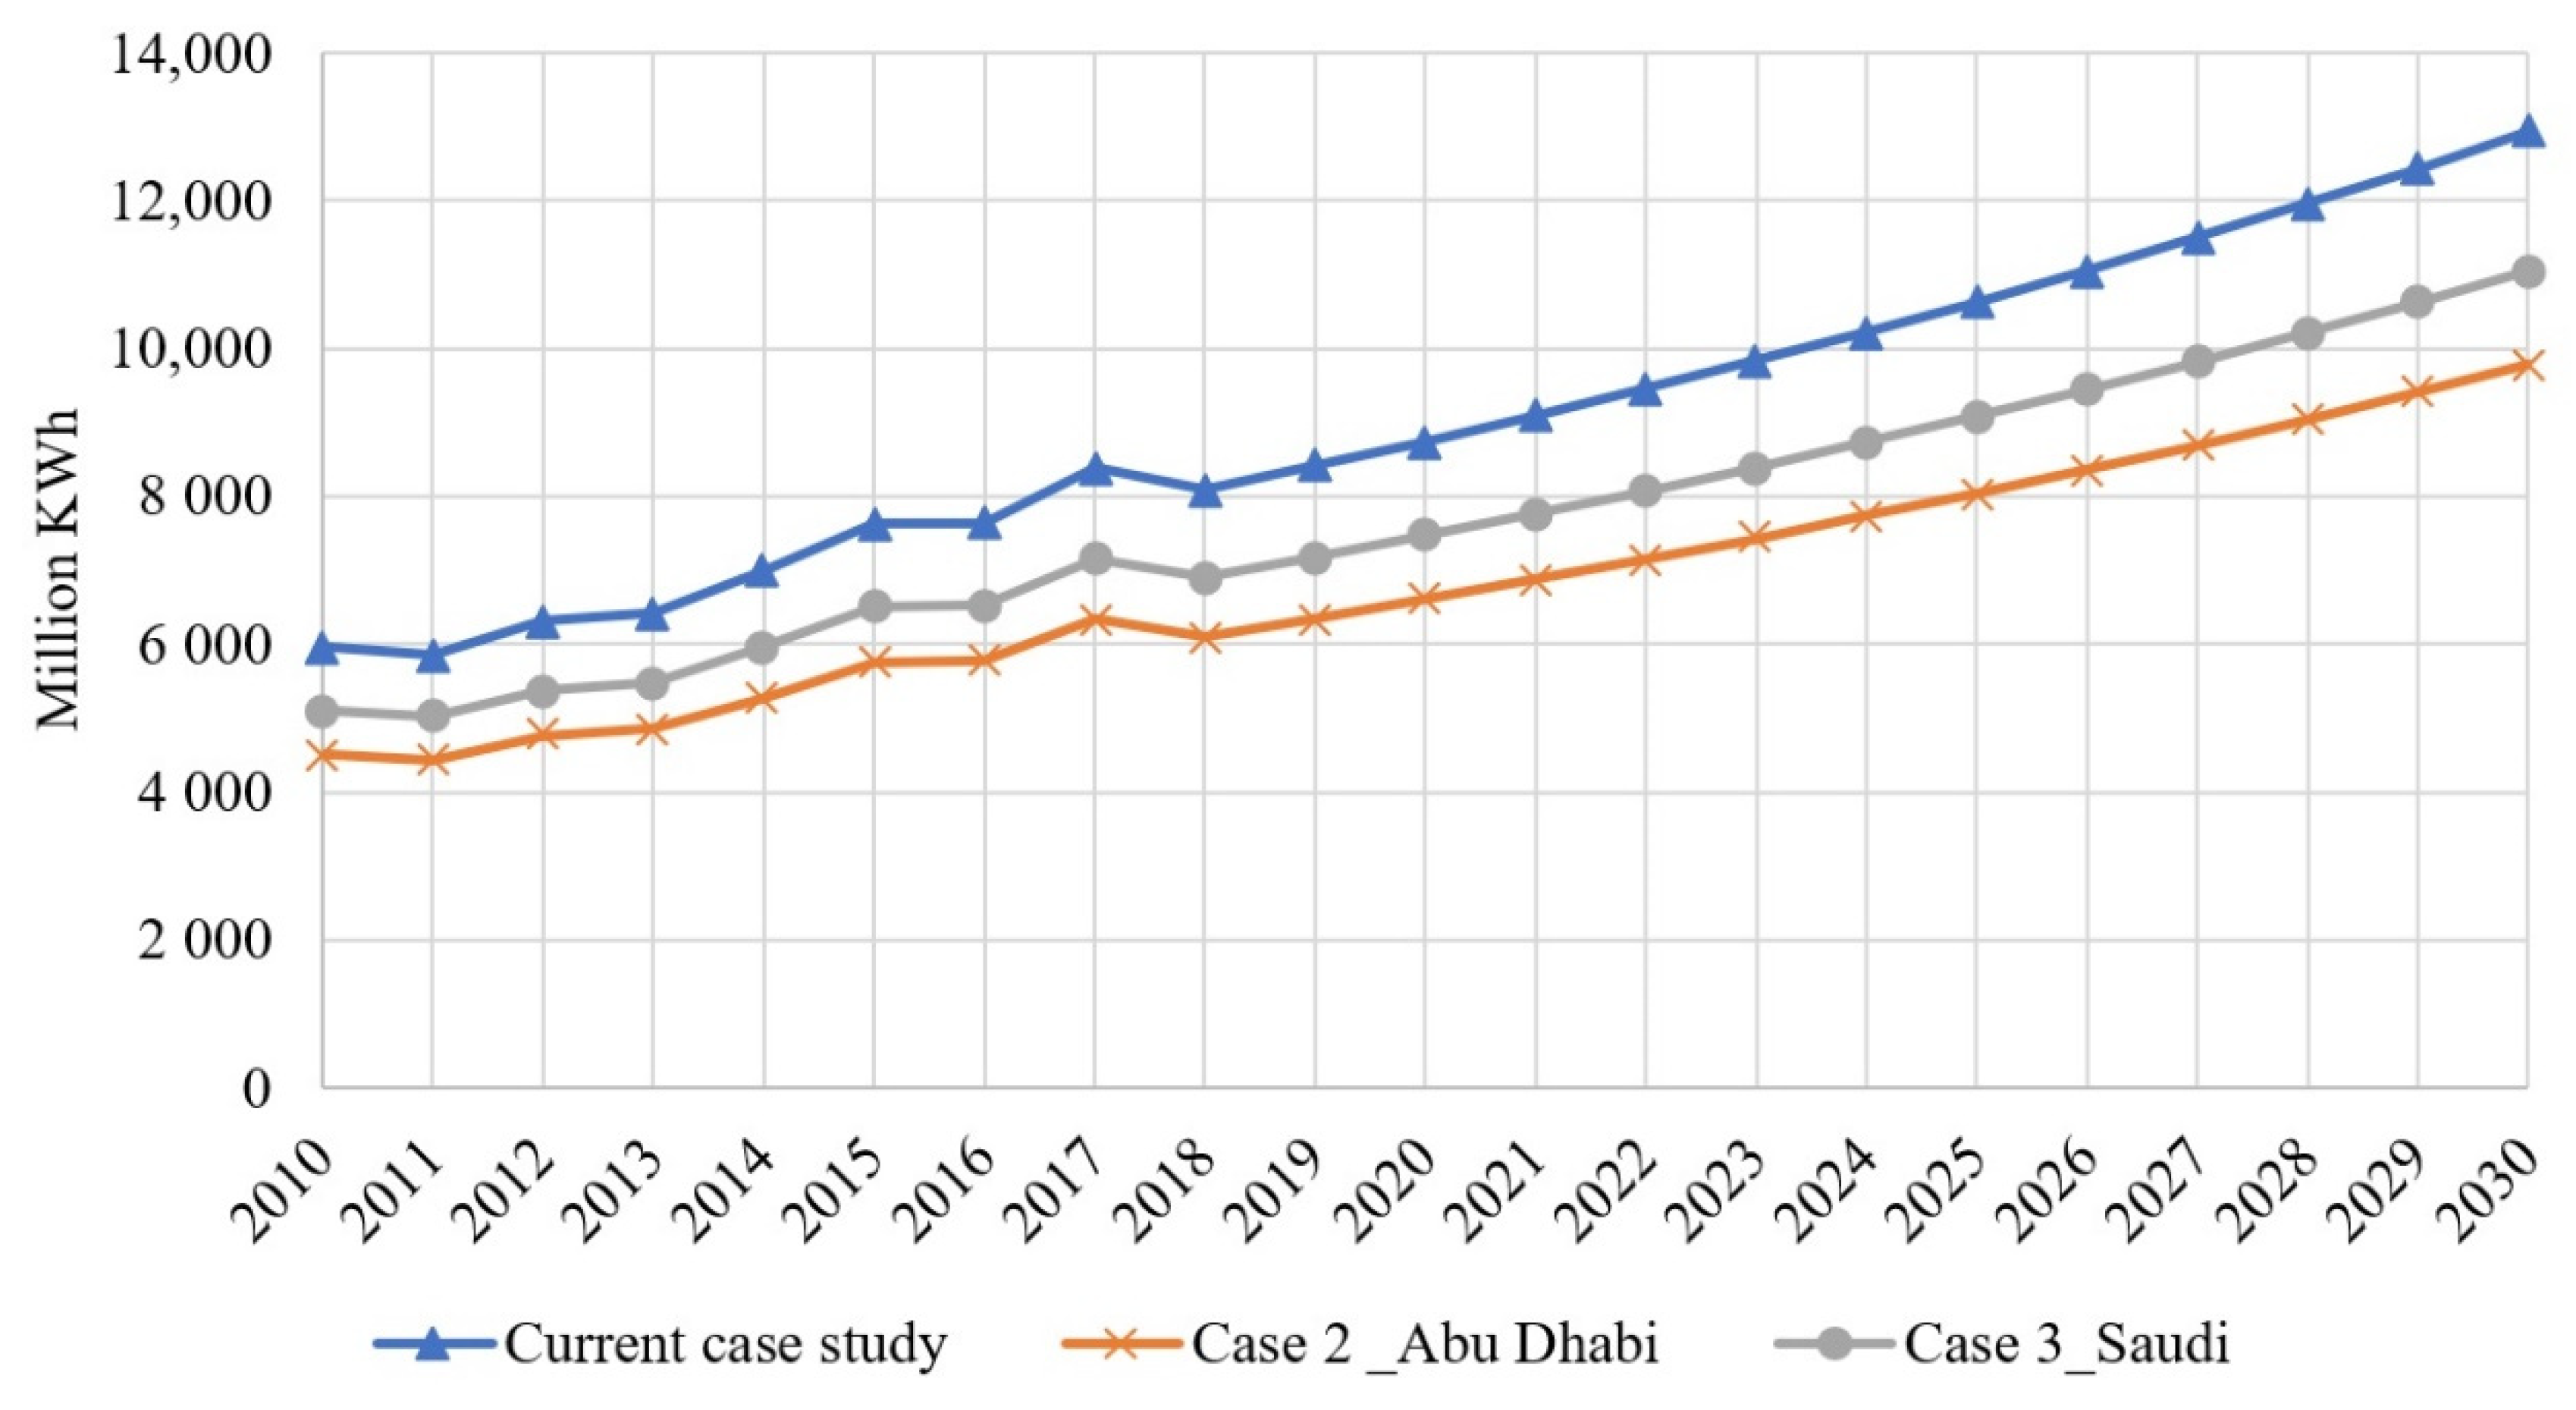
4.2. Projecting Long-Term Residential Sector Electricity Demand

Demand forecasts play a decisive role in energy supply-demand management for both governments and private sectors. Therefore, it is crucial to have an accurate forecast of future energy consumption trends to manage power production and distribution systems better [62]. Based on Pascal’s Triangle [43], Equation (1), as noted above, was used to model future energy trends. However, due to high fluctuation in the annual growth rate of energy consumption (r%), which recorded 1% in 2011, and 13.7% and 9% in 2014 and 2015, respectively, the average annual growth rate was calculated for the given period (2010–2018) as 4.6% for total energy consumption and 4% for residential sector energy consumption. The average rate was used in Equation (1), for instance:
E 2030 = ( 1 + 4.6 % ) 2030 2018 × 17,241 = 29,499   million   KWh
The country’s total energy plus the energy forecast to be consumed by residential buildings was modelled up to 2030, in alignment with Bahrain’s 2030 economic vision, as seen in Figure 6. By 2030, residential buildings are expected to consume 12,937 million KWh, accounting for almost 44% of the country’s total energy consumption. The accumulated energy consumption is equivalent to 11,789 million KWh between 2020–2030, which accounts for 92,094 million tonnes in carbon emissions as per the United States Environmental Protection Agency (EPA) projection [63]. According to the World Bank, Bahrain’s per capita emissions are amongst the highest in the world and continue to trend upwards [61].

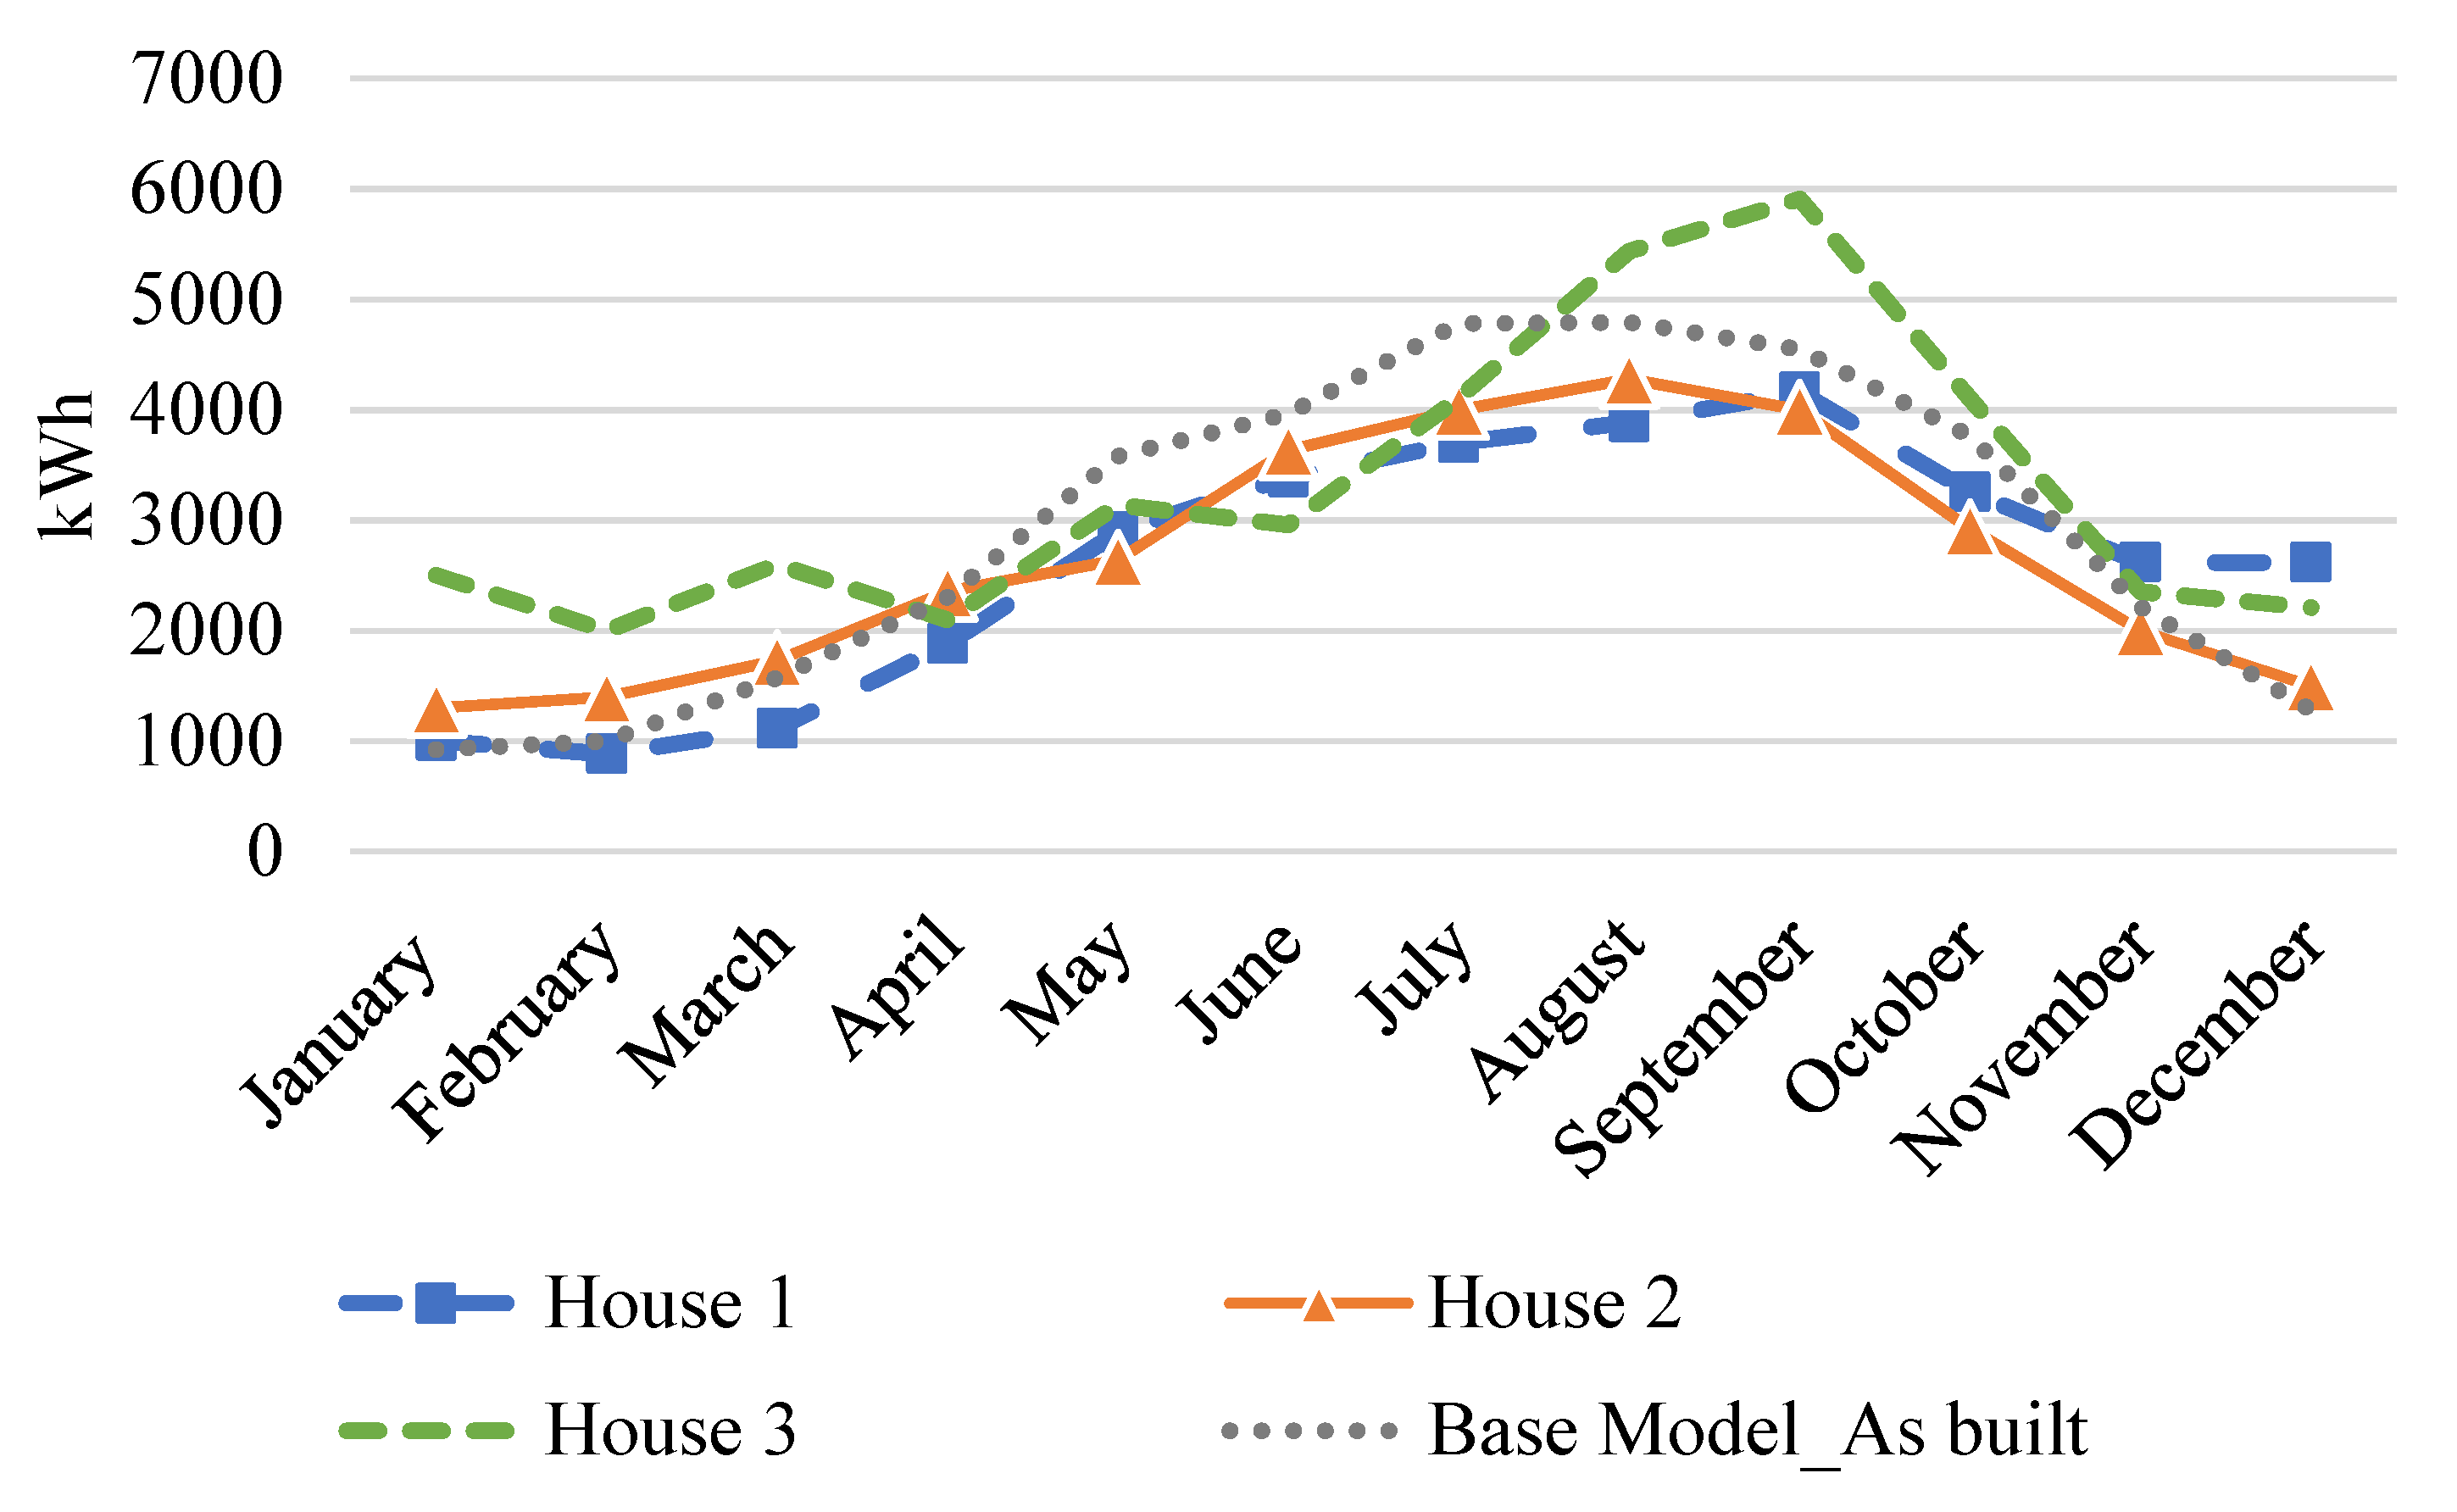
4.3. Base Model Energy Performance and Validation

Since one of the paper’s aims was to assess the validity of GCC energy efficiency measures in the context of the arid conditions of Bahrain, it was crucial to verify the simulated electrical consumption from DesignBuilder. This is because energy consumption for the same house unit can vary according to users’ behaviour and lifestyle and the number of persons using the house. Therefore, three official monthly electricity bills were collected and benchmarked with the DesignBuilder simulated prediction for the same T3M residential building type. The analysis of the official electricity bills indicated that all three residential units shared the same electricity consumption trends, with significant increases in the summer months from May to October, probably due to the heavy use of AC units, which account for 60–65% of electricity usage in buildings [41]. The annual consumption value of the three houses ranged between 31,403 kWh and 39,420 kWh, with an average of 34,194.33 kWh. Although DesignBuilder predicted an electrical consumption of 34,720.19 kWh/year, this still falls within the acceptable average range of <10–20% [64,65], as it recorded variations of 10.5%, 9.3% and 11.9% for houses 1–3, respectively. The simulated outcomes were plotted against the three houses’ actual electricity consumption, as shown in Figure 7. All shared almost the same drift by beginning to rise in April and May and reaching a peak in August, except for house number three, which peaked in September and then began to fall. In terms of root mean square error (RMSE), Equation (6) is a good measure of how accurately the model predicts the response. The RMSE was 6.80%, 5.23%, and 8.89% for houses 1–3, respectively, falling within ASHRAE 14 tolerance criteria for RMSE of ±20% [66,67,68]. This shows that the developed DesignBuilder base model was able to capture the main aspects of the building’s physics in the simulation.
RMSE   = i = 1 N ( x i x ^ i ) 2 N
RMSE = root mean square error; i = variable i ; N = number of non-missing data points; x i = actual observations time series; x i ^ = estimated time series.

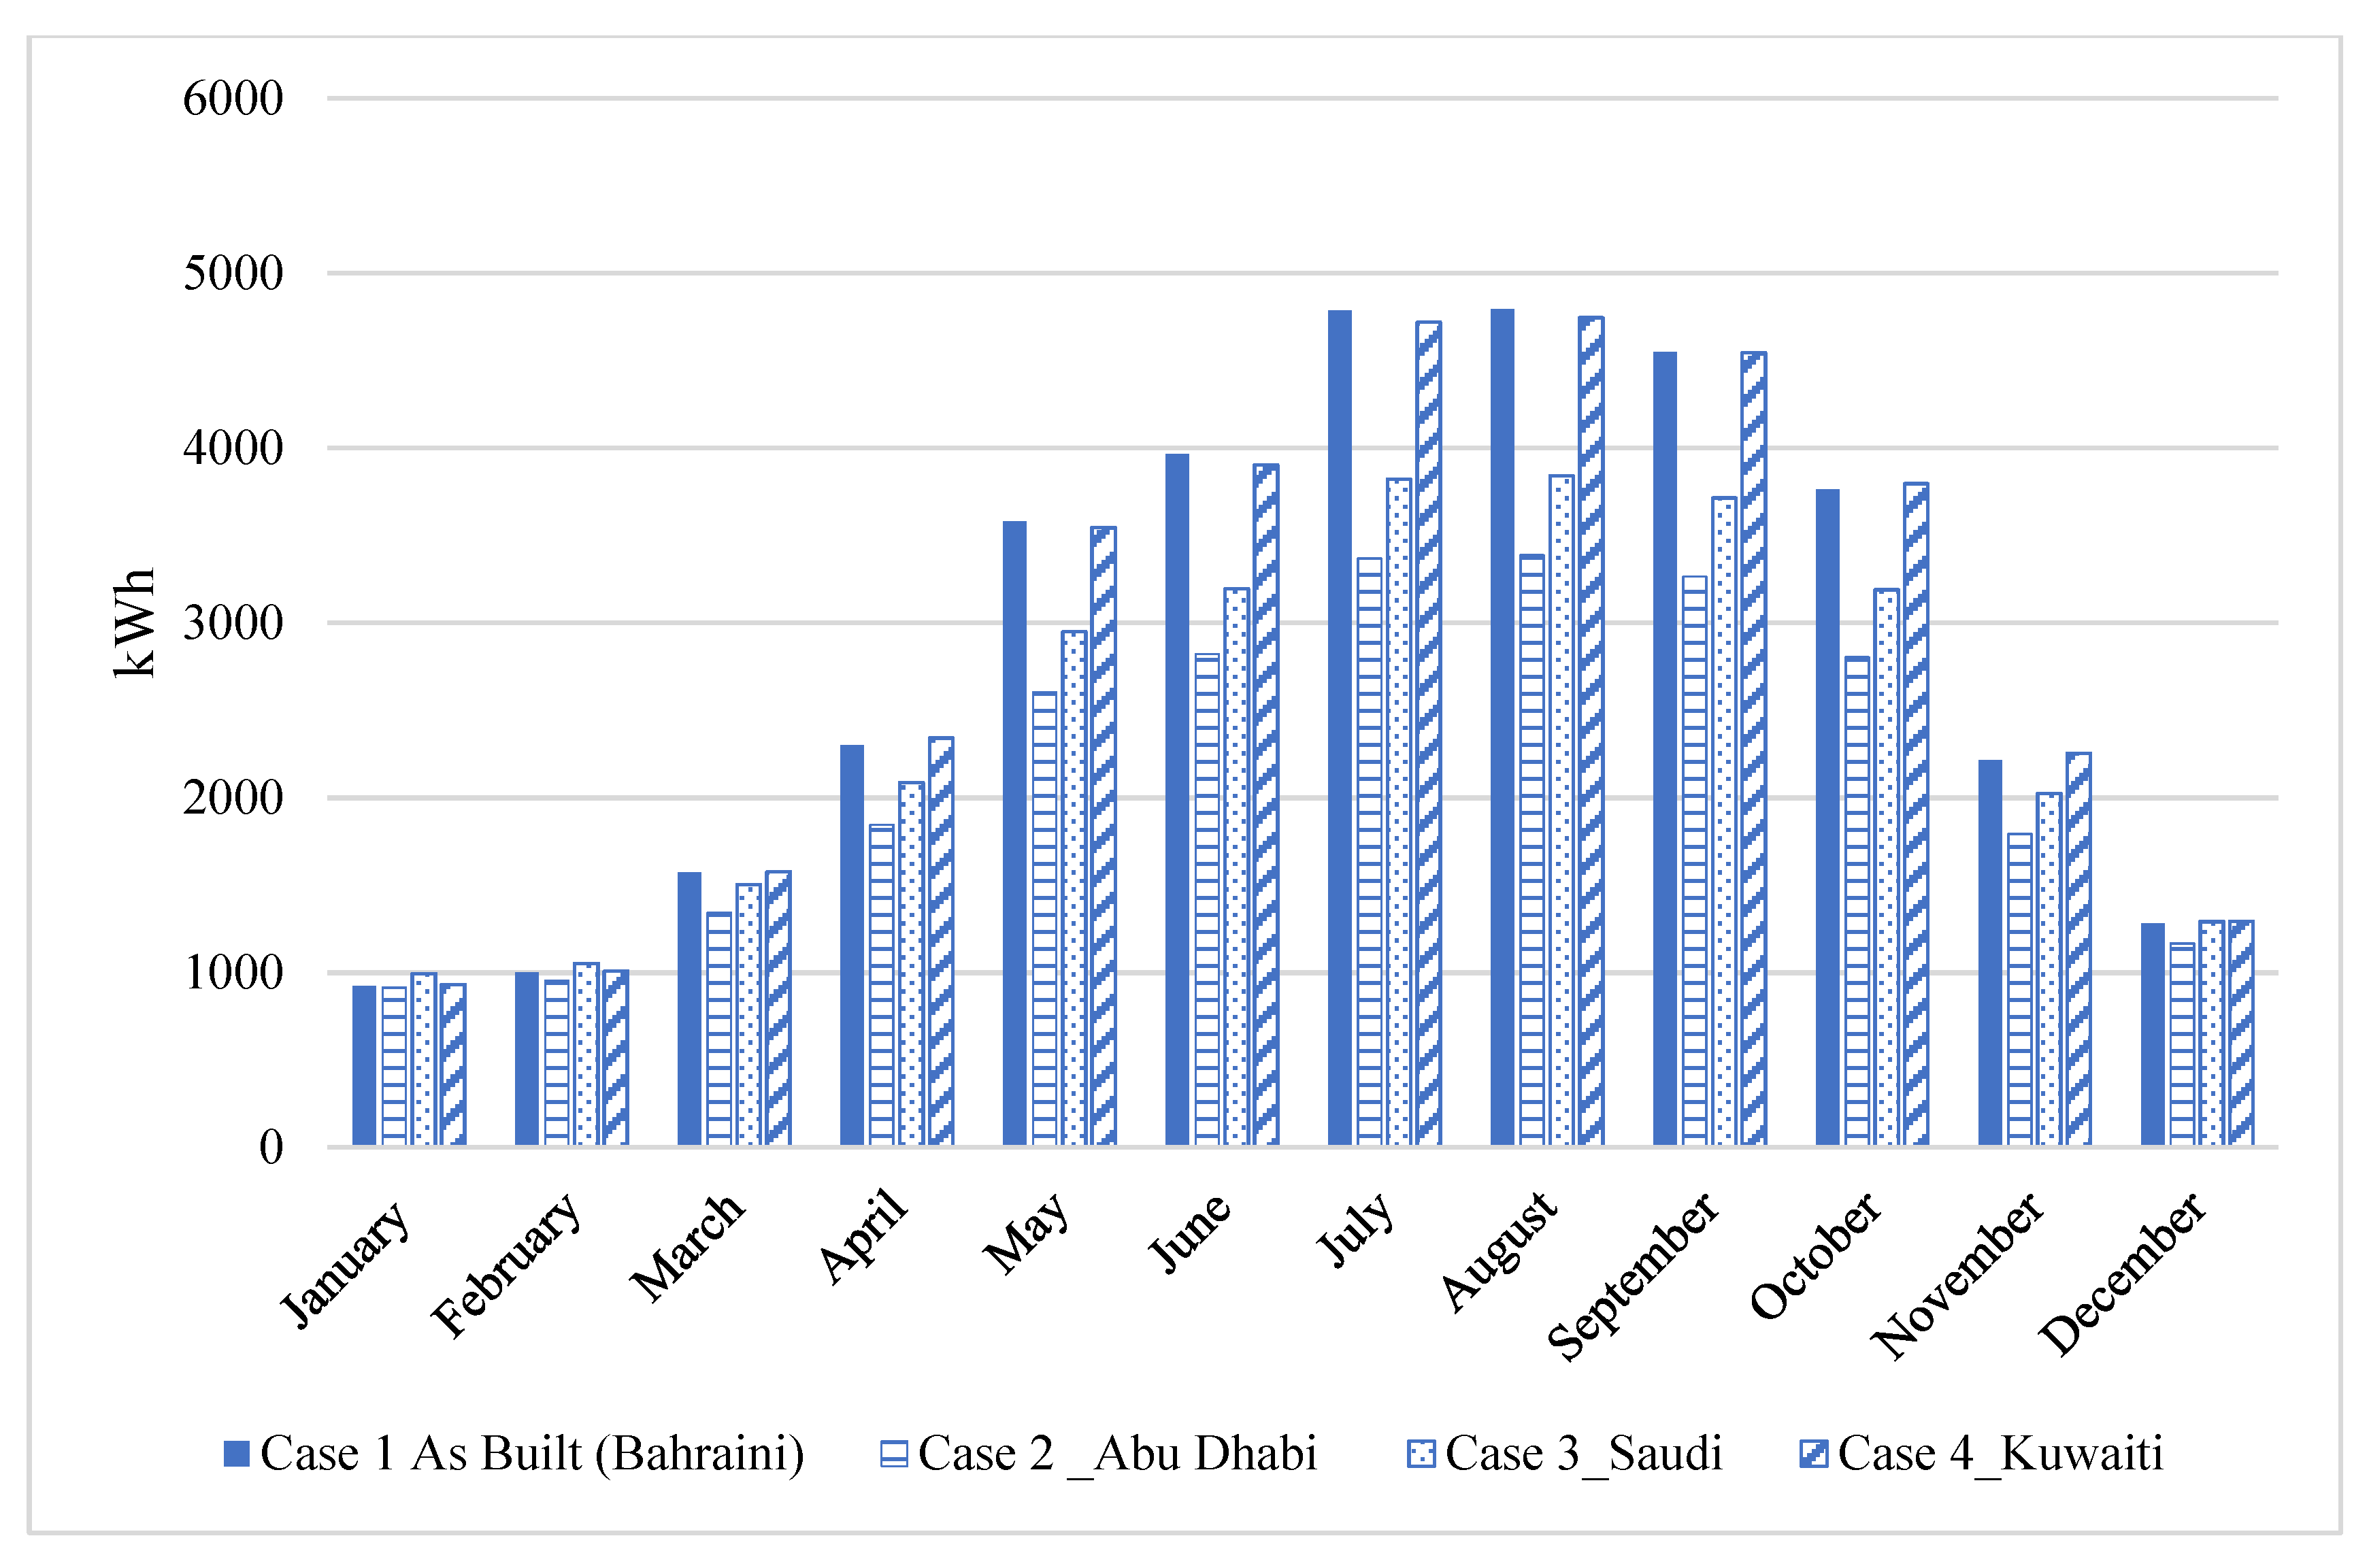
4.4. Impact of Energy Conservation of Practice Codes: Comparative Analysis

Using the previous settings for weather file, model location, geometry, orientation, and occupation schedule, the validations were applied for all examined scenarios. Each scenario was modified to represent one of the energy conservation practice codes presented in Table 6. Afterwards, a cross-comparison of the impact of the four scenarios was made, including annual energy consumption, peak cooling load, and carbon emissions. As illustrated in Figure 8, annual energy savings varied between the different codes, but Case 2, Abu Dhabi’s ESTIDAMA 1 code, recorded the minimum amount of energy consumption per year at 26,262.78 KhW. This demonstrated a 24.4% annual saving compared to the base case. Case 3, the Saudi Building code, had the second-lowest energy consumption with a total of 29,661.57 KhW per year, accounting for 14.6% of total energy savings compared to the base case. These cases were followed, respectively, by the Kuwaiti Building Code as Case 4 and the Bahraini base Case 1, with very similar amounts of 34,656.90 KhW and 34,720.19 KhW, respectively. Although the Kuwaiti Building Code includes specifications for better roof and exterior wall thermal insulation, the window U value is much higher than in the Bahraini Code. This feature is a crucial parameter for energy saving in an arid climate and may be the reason for the very similar energy savings of the two codes. Previous studies have shown that a change in the glass type can lead to a significant reduction in energy consumption [69,70,71], reaching up to an 18.8% energy saving [72]. The base case (Case 1) representing the Bahraini Code showed the least annual energy savings, possibly because the only requirement of the 1984 GCC thermal regulations regarding the wall and roof design elements was the addition of the window U value. Applying these outcomes to the previously forecast energy consumption for the residential sector (Figure 6), a promising energy savings of 24.4% may be achieved by 2030 if the Ahu Dhabi ESTIDAMA 1 code is applied, while a 14% energy savings may be achieved if the Saudi Building Code is implemented, as illustrated in Figure 9.

4.5. Peak Cooling Load Savings Potential

It was also very important to examine the impact of the tested scenarios on the cooling loads in GCC countries, where most energy consumption is used to provide occupants with better indoor thermal conditions. Reducing the cooling load cuts down the capital cost of the cooling equipment in the first place. Table 7 presents the cooling loads and reduction percentage for each case compared to the base case. Case 2 (Abu Dhabi ESTIDAMA 1 code) offered a 29.35% annual reduction, followed by Case 3, the Saudi Building Code, which recorded 16.4%, and finally Case 4, the Kuwaiti Code, which consumed less than 2% more energy compared to the base case.

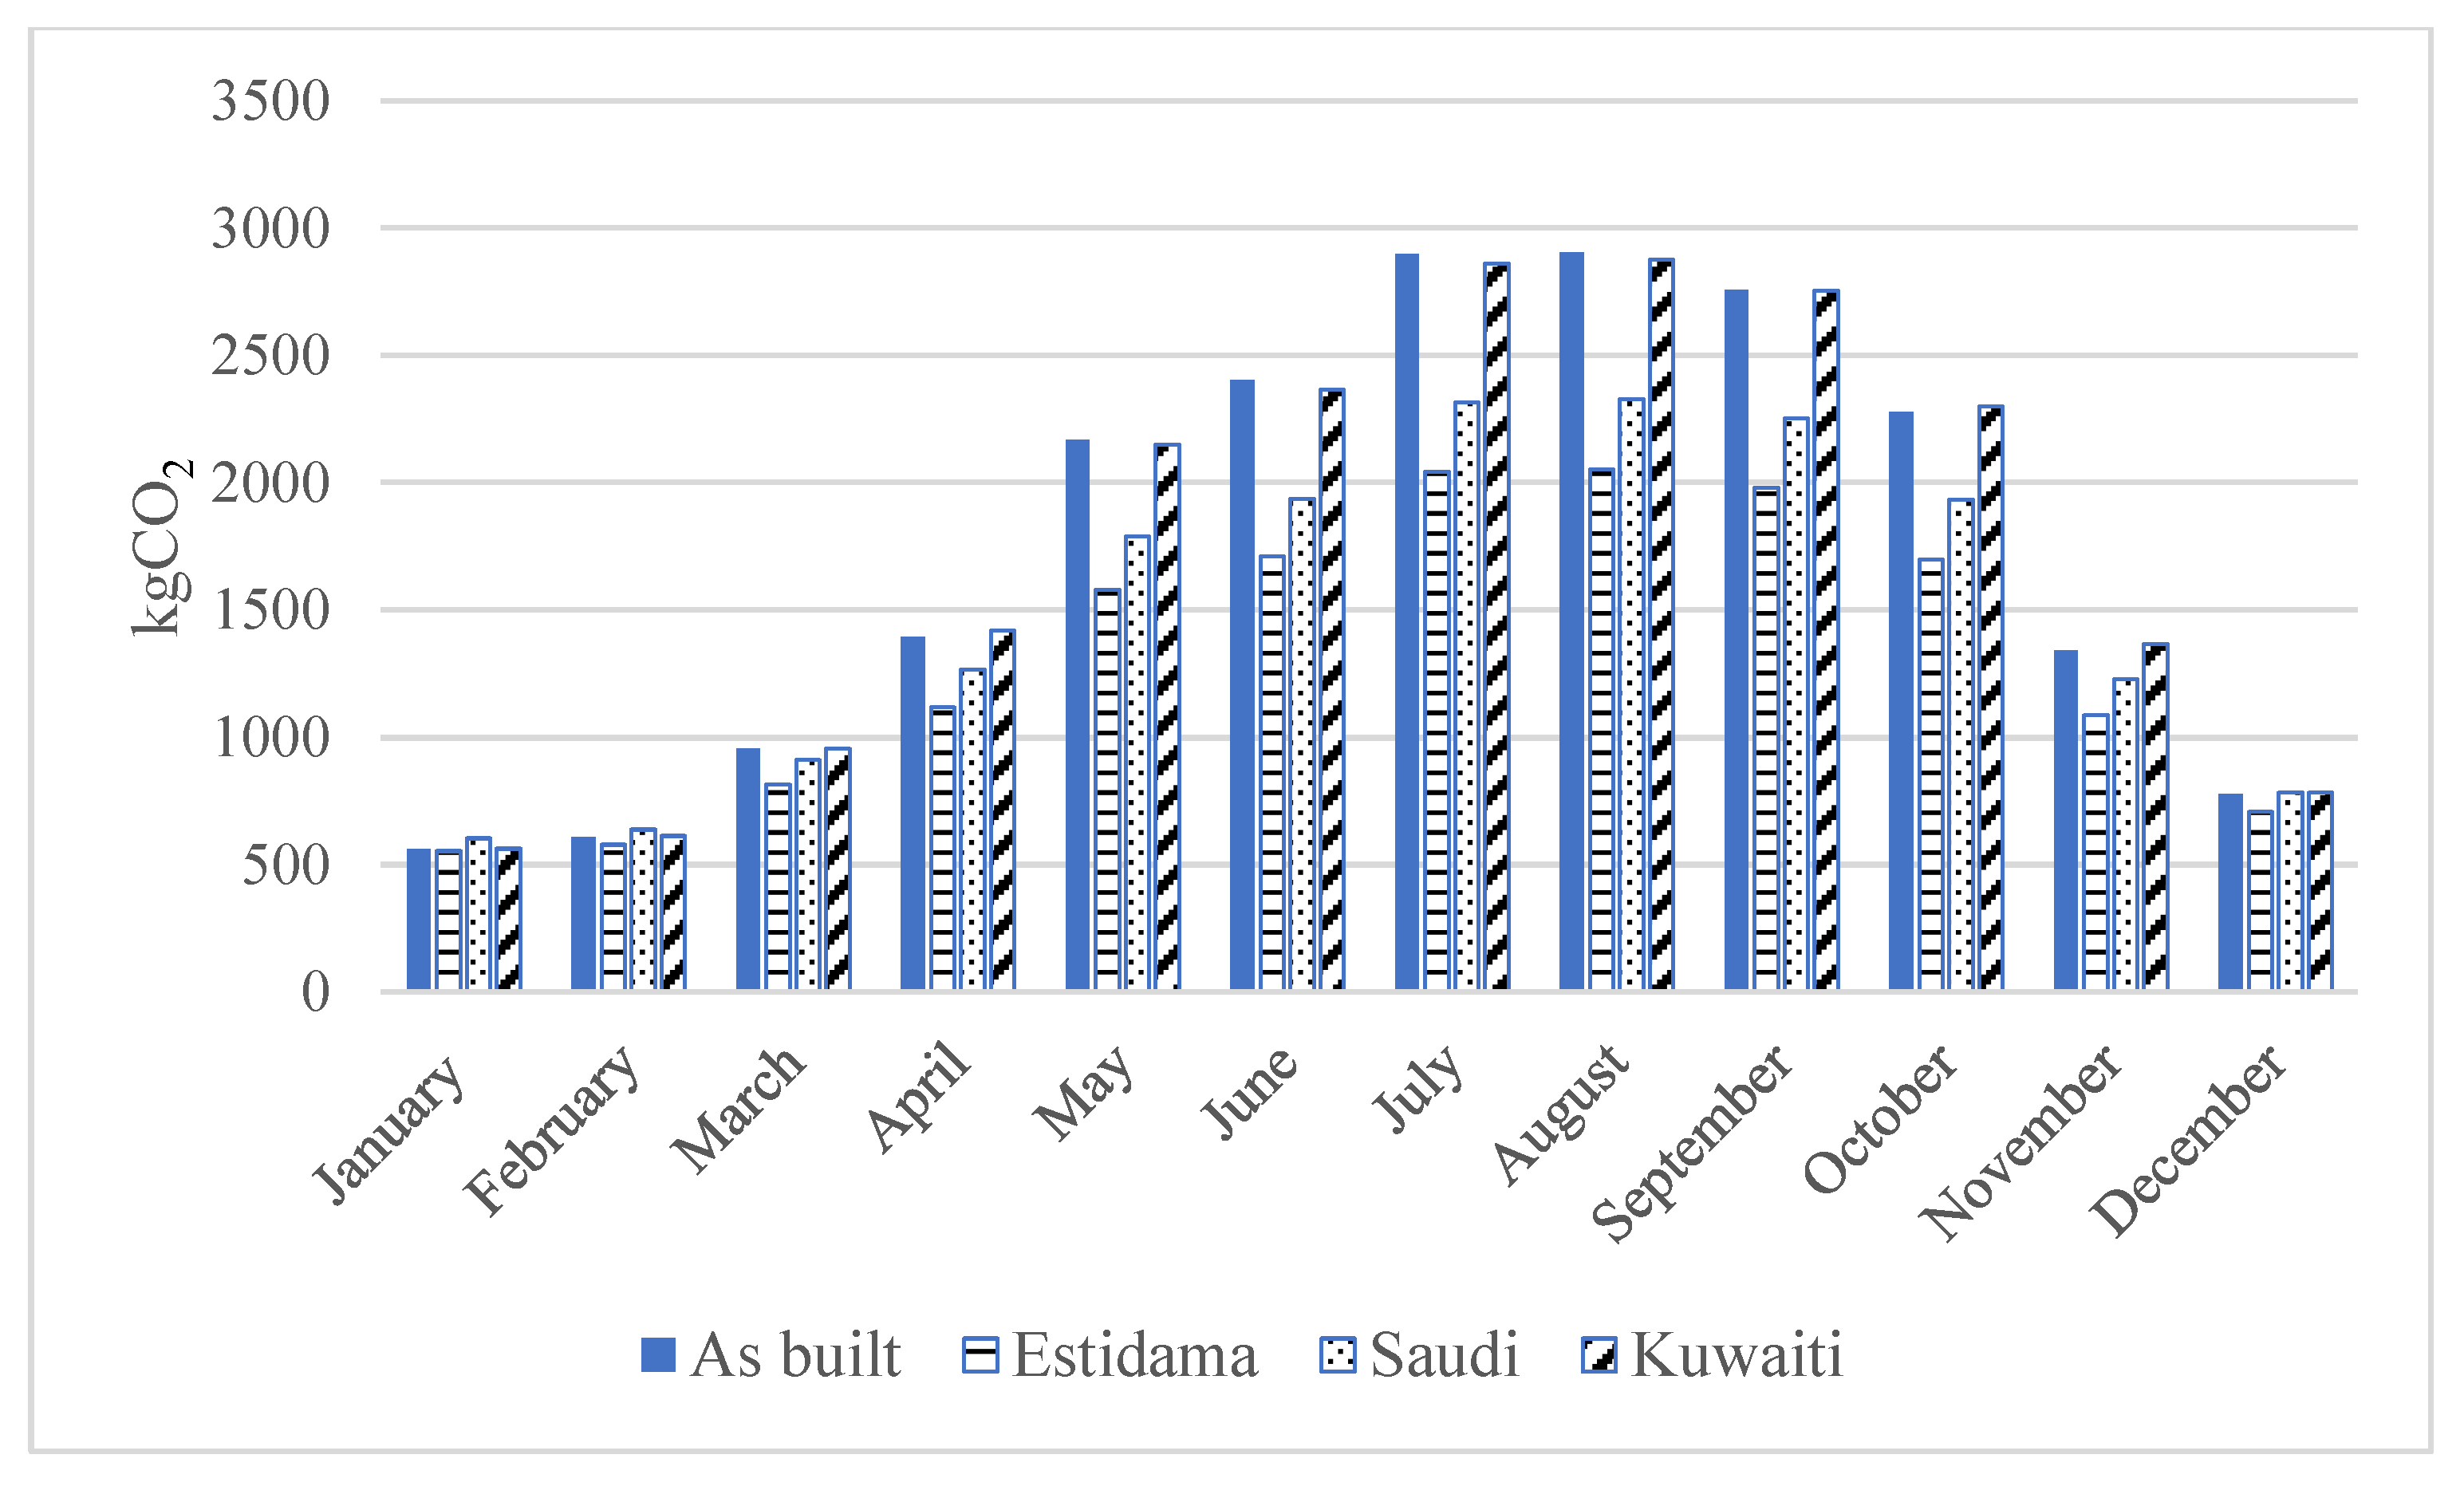
4.6. Carbon Emissions (CO2) Reduction Potential

The elevated quantity of energy used for cooling adds to the burden on the surroundings by boosting carbon emissions (CO2) from the built environment, leading to higher air pollution levels, greater health risks, energy insecurities, and climate change. For the GCC, the situation is even worse due to the extremely warm weather and subsequent greater energy load for cooling [3]. AC units account for 60–65% of electricity usage in buildings and will lead to more carbon emissions and other heat-trapping gases being emitted [73,74]. In the GCC, according to a recent study, air conditioning accounts for 70% of the annual peak electricity consumption in the residential sector [6]. In Bahrain, the contribution of residential AC to peak power consumption is even more significant, approaching 80% of residential peak power demand [75]. Figure 10 shows that the monthly carbon emissions (CO2) per scenario align with previous outcomes; Abu Dhabi’s ESTIDAMA 1 code (Case 2) recorded the highest annual reduction in CO2 with 26.3%, while the Saudi Building Code (Case 3) was second with 12.3% less carbon emissions compared to the base Case 1. Case 4, the Kuwaiti Building Code, had almost the same amount of CO2 as the base case.

4.7. Economic Analysis

Evaluating the technical performance of energy efficiency codes in compliance with economic viability explores a balanced option for introducing (or revising) the benchmarking criteria that may be adopted by various stakeholders [76]. Therefore, the analysis was performed as a feasibility study to understand the costs and economic advantages of complying with the energy efficiency codes, including the annual energy savings, the return on initial investment and the total cost of each scenario. One well known economic indicator is the simple payback period (SPP), which shows the amount of time taken to recover the initial investment of the project, as stated previously in Table 4, in addition to the investment cost for the base case. This is very similar to the GCC thermal regulations initial cost, with the addition of the extra cost of the modified windows. Table 8 presents the SPP values for the different case studies, and the index was calculated based on a 5-year SPP, as recommended in different studies [18,34]. Case 2, the Abu-Dhabi ESTIDAMA 1 code, was the only scenario that offered a payback period of almost five years for the unsubsidised energy tariff, and 16.8 years to recover the initial investment for the subsidised energy rate, compared to the base case. Regarding Case 3, the Saudi Building code, it would take 9.9 years for investment payback of the unsubsidised energy rate and 31.9 for the subsidised ones. These figures only provide a quick overview of the economic feasibility and ignore future increases in energy consumption and prices; however, further analysis is required for a wider performance perspective, such as LCC, which can determine the cost-effectiveness of energy retrofits. This is because LCC considers both the whole building lifecycle and various economic parameters [77,78]. The case study with a lower LCC compared to the LCC of the base case is considered a feasible option. As presented in Table 9, the LCC of the four scenarios were very interesting, although the SPP indicated that the as-built base Case 1 was the best case in terms of offering payback in almost two years for subsidised energy and eight months for unsubsidised. However, the LCC analysis indicates that Case 2, the Abu-Dhabi ESTIDAMA code, is the most feasible, offering 19.5% and 10% savings for unsubsidised and subsidised, respectively, compared to the base case. This is followed by Case 3 (Saudi Building Code), which offered only 9% for unsubsidised energy but cost more for the subsidised energy compared to the base case, and then the as-built base Case 1 and Case 4, which had very similar outcomes.

5. Conclusions

The building sector accounts for more than 40% of all primary energy use and associated greenhouse gas (GHG) emissions. This is attributed to the anthropogenic heat generation related to an increasing population, growing housing stock, and higher expectations for better living standards, all of which have led to an expected increase in the demand for energy use [1,79]. Countries with a hot, arid climate use almost half the urban peak load of energy demand for cooling and AC needs in summer [2]. In Bahrain, the contribution of residential AC to the peak power consumption is approaching 80% of residential peak power demand [75]. This has triggered a renewed interest in countries such as Bahrain and the GCC states, which are facing similar pressures in developing their own energy-efficient building codes to meet national energy and environmental challenges. However, there are very few applications, and studies on these codes in an arid climate remain very limited [22,23,24,40]. Therefore, the goal of this study was to explore the energy performance and economic feasibility of the building energy codes mandated by the GCC members, which share a similar climate, when implemented in a typical residential unit in Bahrain for better application. The key results can be concluded as follows:
  • The outcomes confirm the continuation of the residential sector in maintaining the bigger share of energy consumption at almost 44% of Bahrain’s total energy expenditure until 2030; this high percentage opens the door for immediate action to review the efficiency of the current code and any other available codes before any application.
  • The results show very high potential for energy savings in the residential sector in Bahrain if proper building codes are analysed and applied correctly. The best-case showed a 24.4% reduction in energy compared to the base case. These outcomes are in line with previous findings of a similar context; for instance, in Dubai, the savings from applying energy-efficient measures can reach 23.6% [31]; in Oman, it ranges between 22.7% and 53% [36] and between 22.7% and 39.5% in Saudi Arabia [32].
  • The harsh climatic characteristics of the Kingdom of Bahrain, as well as other GCC states, adds an extra overload during the long summer due to the need for continuous cooling, leading to an increase in carbon emissions (CO2) from the built environment, higher air pollution levels, greater health risk, energy insecurities, and climate change. Accordingly, by examining the tested scenarios, it was found that Case 2 (Abu Dhabi ESTIDAMA 1 code) offered a 29.35% reduction in annual cooling load and a 26.3% reduction in annual CO2 emissions; this was followed by Case 3, the Saudi building code, which recorded a 16.4% lower cooling load and 12.3% less carbon emissions compared to the base Case 1.
  • One of the shortcomings of previous studies was the lack of information regarding the economic feasibility of these energy codes, especially when comparing the initial cost with the base case, as this can provide misleading information, which does not help decision-makers; therefore, the current study conducted an economic analysis using SPP and LCC, which can determine the cost-effectiveness of energy retrofits, including a number of economic parameters [77]. This was obvious in the output for both indicators, where the SPP stated that the base case was the best option as it offered a payback period of almost two years, but the LCC stated that, in terms of long-term investment, applying the Abu Dhabi ESTIDAMA 1 code would be a better option. The latter offers 19.5% and 10% savings for unsubsidised and subsidised electricity, respectively, compared to the base case. Again, this opens the door for further studies on the feasibility of the available studies and codes, not only from a technical point of view but also financially and economically.
  • In this case, only energy efficiency measures related to the building envelope were considered, but the code should also consider integrating passive approaches with active techniques, such as using hybrid ventilation techniques and solar energy, which has proven to be a very efficient approach for further energy reduction in arid climates, in some cases, it can provide energy saving of 23% throughout the year [79].
  • It seems that the examined energy-efficient building codes are not designed for minimum energy consumption or for long-term economic feasibility, which may explain their limited application by house owners.
Applying energy-efficient building codes could soon be a very promising tool for sustainable and low energy building design; having said this, the process is as yet a non-standardised practice that varies from one code to another, from one designer to another, and from one location to another. With the lack of reliable data regarding the codes’ feasibility for house owners, it is crucial to differentiate the capabilities of each code based on different factors such as context, climate, design requirements, and other country-specific conditions. This is in addition to its economic viability, which might open the door for either introducing or revisiting the benchmarking criteria that may be adopted by various stakeholders. This paper provides a comprehensive evaluation of the effectiveness of the current energy efficiency measures in the residential sector if proper building codes are applied. The paper’s significance lies in the fact that there has been a lack of investigation of the energy efficiency measures in the GCC and limited information regarding its economic feasibility for residential buildings in the arid climates of Bahrain. In closing, some of the issues examined in the paper still need to be tackled, as the study has only investigated one building type and four GCC sustainable building codes. As noted, this could take into account the integration of other renewable energy sources, such as solar energy. All of these areas need further investigation and present possibilities for future research.

Funding

This research received no external funding.

Institutional Review Board Statement

Not applicable.

Informed Consent Statement

Not applicable.

Data Availability Statement

The DesignBuilder files used to derive the results in this paper are available from the author.

Conflicts of Interest

The author declares that he has no competing interests.

References

  1. IEA. Global Energy & CO2 Status Report 2019; IEA: Paris, France, 2019; Available online: https://www.iea.org/reports/global-energy-co2-status-report-2019 (accessed on 10 April 2021).
  2. Elsarrag, E.; Alhorr, Y. Modelling the thermal energy demand of a Passive-House in the Gulf Region: The impact of thermal insulation. Int. J. Sustain. Built Environ. 2012, 1, 1–15. [Google Scholar] [CrossRef] [Green Version]
  3. Harlan, S.L.; Brazel, A.J.; Prashad, L.; Stefanov, W.L.; Larsen, L. Neighborhood microclimates and vulnerability to heat stress. Soc. Sci. Med. 2006, 63, 2847–2863. [Google Scholar] [CrossRef]
  4. Bahrain Electricity and Water Authority (EWA) Statistics Annual Report 2018. Available online: https://www.ewa.bh/en/AboutUs/AnnualReport/statistics%202018.pdf (accessed on 19 May 2021).
  5. Gulf Countries Electric Energy Conservation Committee. Doha thermal insulation regulations. In Proceedings of the First Meeting of Gulf Ministers of Electricity, Doha, Qatar, 30–31 October 1984. [Google Scholar]
  6. Al-Badi, A.; Almubarak, I. Growing energy demand in the GCC countries. Arab. J. Basic Appl. Sci. 2019, 26, 488–496. [Google Scholar] [CrossRef] [Green Version]
  7. Mills, B.; Schleich, J. Residential energy-efficient technology adoption, energy conservation, knowledge, and attitudes: An analysis of European countries. Energy Policy 2012, 49, 616–628. [Google Scholar] [CrossRef] [Green Version]
  8. Lorenzen, J.A. Going green: The process of lifestyle change. Sociol. Forum 2012, 27, 94–116. [Google Scholar] [CrossRef]
  9. Thøgersen, J. Housing-related lifestyle and energy saving: A multi-level approach. Energy Policy 2017, 102, 73–87. [Google Scholar] [CrossRef]
  10. Lopes, M.; Antunes, C.H.; Martins, N. Energy behaviours as promoters of energy efficiency: A 21st century review. Renew. Sustain. Energy Rev. 2012, 16, 4095–4104. [Google Scholar] [CrossRef]
  11. Frederiks, E.R.; Stenner, K.; Hobman, E.V. Household energy use: Applying behavioural economics to understand consumer decision-making and behaviour. Renew. Sustain. Energy Rev. 2015, 41, 1385–1394. [Google Scholar] [CrossRef] [Green Version]
  12. Ministry of Electricity and Water. Energy Conservation Code of Practice; MEW/R-6/2010; Ministry of Electricity and Water: Kuwait City, Kuwait, 2010.
  13. The Saudi Building Code National Committee. The Saudi Building Code, Section 601: Energy Conservation; The Saudi Building Code National Committee: Riyadh, Saudi Arabia, 2007.
  14. The Department of Municipal Affairs (DMA). Abu Dhabi International Energy Conservation Code (AD-IECC): Pearl Building Rating System (PBRS), RE-R1 Energy Prescriptive Pathway; The Department of Municipal Affairs: Abu Dhabi, United Arab Emirates, 2011.
  15. Dubey, K.; Krarti, M. An Evaluation of High Energy Performance Residential Buildings in Bahrain; KS-2017--DP16; King Abdullah Petroleum Studies and Research Center (KAPSARC): Riyadh, Saudi Arabia, 2017. [Google Scholar]
  16. Radhi, H. Can envelope codes reduce electricity and CO2 emissions in different types of buildings in the hot climate of Bahrain? Energy 2009, 34, 205–215. Available online: http://www.sciencedirect.com/science/article/pii/S0360544208003216 (accessed on 28 May 2021). [CrossRef]
  17. Alnaser, N. Building integrated renewable energy to achieve zero emission in Bahrain. Energy Build. 2015, 93, 32–39. [Google Scholar] [CrossRef]
  18. Alalouch, C.; Al-Saadi, S.; AlWaer, H.; Al-Khaled, K. Energy saving potential for residential buildings in hot climates: The case of Oman. Sustain. Cities Soc. 2019, 46, 101442. [Google Scholar] [CrossRef]
  19. Trotta, G.; Spangenberg, J.; Lorek, S. Energy efficiency in the residential sector: Identification of promising policy instruments and private initiatives among selected European countries. Energy Effic. 2018, 11, 2111–2135. [Google Scholar] [CrossRef]
  20. Wang, Z.; Zhao, J. Optimization of passive envelop energy efficient measures for office buildings in different climate regions of China based on modified sensitivity analysis. Sustainability 2018, 10, 907. [Google Scholar] [CrossRef] [Green Version]
  21. Jacobsen, G.D.; Kotchen, M.J. Are building codes effective at saving energy? Evidence from residential billing data in Florida. Rev. Econ. Stat. 2013, 95, 34–49. [Google Scholar] [CrossRef] [Green Version]
  22. Ezzeldin, S.; Rees, S. The potential for office buildings with mixed-mode ventilation and low energy cooling systems in arid climates. Energy Build. 2013, 65, 368–381. [Google Scholar] [CrossRef] [Green Version]
  23. Daaboul, J.; Ghali, K.; Ghaddar, N. Mixed-mode ventilation and air conditioning as alternative for energy savings: A case study in Beirut current and future climate. Energy Effic. 2018, 11, 13–30. [Google Scholar] [CrossRef]
  24. Gomis, L.L.; Fiorentini, M.; Daly, D. Potential and practical management of hybrid ventilation in buildings. Energy Build. 2021, 231, 110597. [Google Scholar] [CrossRef]
  25. Gillingham, K.; Palmer, K. Bridging the energy efficiency gap: Policy insights from economic theory and empirical evidence. Rev. Environ. Econ. Policy 2014, 8, 18–38. [Google Scholar] [CrossRef] [Green Version]
  26. European Commission. Good Practice in Energy Efficiency COM (2016) 761 Final. 2016. Available online: http://ec.europa.eu/energy/sites/ener/files/documents/5_en_autre_document_travail_service_part1_v4.pdf (accessed on 6 June 2021).
  27. Knoop, K.; Lechtenböhmer, S. The potential for energy efficiency in the EU Member States—A comparison of studies. Renew. Sustain. Energy Rev. 2017, 68, 1097–1105. [Google Scholar] [CrossRef] [Green Version]
  28. Khalil, A.-A.; Fikry, M.; Abdeaal, W. High technology or low technology for buildings envelopes in residential buildings in Egypt. Alex. Eng. J. 2018, 57, 3779–3792. [Google Scholar] [CrossRef]
  29. Radhi, H. A systematic methodology for optimising the energy performance of office buildings in Bahrain. Energy Build. 2008, 40, 1297–1303. [Google Scholar] [CrossRef]
  30. Taleb, H.M.; Sharples, S. Developing sustainable residential buildings in Saudi Arabia: A case study. Appl. Energy. 2011, 88, 383–391. Available online: http://www.sciencedirect.com/science/article/pii/S0306261910002989 (accessed on 24 May 2014). [CrossRef]
  31. Taleb, H.M. Using passive cooling strategies to improve thermal performance and reduce energy consumption of residential buildings in U.A.E. buildings. Front. Arch. Res. 2014, 3, 154–165. [Google Scholar] [CrossRef] [Green Version]
  32. Alaidroos, A.; Krarti, M. Optimal design of residential building envelope systems in the Kingdom of Saudi Arabia. Energy Build. 2015, 86, 104–117. [Google Scholar] [CrossRef]
  33. Kharseh, M.; Al-Khawaja, M. Retrofitting measures for reducing buildings cooling requirements in cooling-dominated environment: Residential house. Appl. Therm. Eng. 2016, 98, 352–356. [Google Scholar] [CrossRef]
  34. Ameer, B.; Krarti, M. Impact of subsidization on high energy performance designs for Kuwaiti residential buildings. Energy Build. 2016, 116, 249–262. [Google Scholar] [CrossRef]
  35. Al-Saadi, S.N.; Al-Hajri, J.; Sayari, M.A. Energy-efficient retrofitting strategies for residential buildings in hot climate of Oman. Energy Procedia 2017, 142, 2009–2014. [Google Scholar] [CrossRef]
  36. Al-Saadi, S.N.J.; Al-Jabri, K.S. Energy-efficient envelope design for residential buildings: A case study in Oman. In Proceedings of the 2017 Smart City Symposium, Prague, Czech Republic, 25–26 May 2017; pp. 1–8. [Google Scholar] [CrossRef]
  37. Wahl, E. Buildings in Arid Desert Climate: Improving Energy Efficiency with Measures on the Building Envelope. 2017. Available online: https://ltu.diva-portal.org/smash/get/diva2:1084934/FULLTEXT01.pdf (accessed on 10 April 2021).
  38. Almushaikah, A.S.; Almasri, R.A. Evaluating the potential energy savings of residential buildings and utilizing solar energy in the middle region of Saudi Arabia—Case study. Energy Explor. Exploit. 2020, 39, 1457–1490. [Google Scholar] [CrossRef]
  39. Qader, M.R. Electricity consumption and GHG emissions in GCC countries. Energies 2009, 2, 1201–1213. [Google Scholar] [CrossRef] [Green Version]
  40. Bano, F.; Sehgal, V. Finding the gaps and methodology of passive features of building envelope optimization and its requirement for office buildings in India. Therm. Sci. Eng. Prog. 2019, 9, 66–93. [Google Scholar] [CrossRef]
  41. Sustainable Energy Unit (SEU). The Kingdom of Bahrain National Energy Efficiency Action Plan (NEEAP). 2017. Available online: http://www.sea.gov.bh/wp-content/uploads/2018/04/02_NEEAP_full-report.pdf (accessed on 11 June 2021).
  42. Ritchie, H.; Roser, M. Energy. 2020. Available online: https://ourworldindata.org/energy/country/bahrain#citation (accessed on 1 April 2021).
  43. Edwards, A.W. Pascal’s Arithmetical Triangle: The Story of a Mathematical Idea; Johns Hopkins University Press: London, UK, 2002. [Google Scholar]
  44. Krarti, M.; Dubey, K. Benefits of energy efficiency programs for residential buildings in Bahrain. J. Build. Eng. 2018, 18, 40–50. [Google Scholar] [CrossRef]
  45. Ferrara, M.; Fabrizio, E.; Virgone, J.; Filippi, M. A simulation-based optimization method for cost-optimal analysis of nearly zero energy buildings. Energy Build. 2014, 84, 442–457. [Google Scholar] [CrossRef]
  46. Sadeghifam, A.N.; Zahraee, S.M.; Meynagh, M.M.; Kiani, I. Combined use of design of experiment and dynamic building simulation in assessment of energy efficiency in tropical residential buildings. Energy Build. 2015, 86, 525–533. [Google Scholar] [CrossRef]
  47. Han, T.; Huang, Q.; Zhang, A.; Zhang, Q. Simulation-based decision support tools in the early design stages of a green building—A review. Sustainability 2018, 10, 3696. [Google Scholar] [CrossRef] [Green Version]
  48. Solmaz, A.S. A critical review on building performance simulation tools. Alam Cipta 2019, 12, 7–21. [Google Scholar]
  49. Elnabawi, M.H. Building information modeling-based building energy modeling: Investigation of interoperability and simulation results. Front. Built Environ. 2020, 6, 573971. [Google Scholar] [CrossRef]
  50. Maile, T.; Fischer, M.; Bazjanac, V. Building Energy Performance Simulation Tools—A Life-Cycle and Interoperable Perspective; CIFE Working Paper 107; Stanford University: Stanford, CA, USA, 2007; pp. 1–49. [Google Scholar]
  51. Elnabawi, M.H.; Hamza, N. Investigating Building Information Model (BIM) to Building Energy Simulation (BES): Interoperability and simulation results. IOP Conf. Series Earth Environ. Sci. 2019, 397, 012013. [Google Scholar] [CrossRef] [Green Version]
  52. American Society of Heating, Refrigerating and Air-Conditioning Engineers. 2017 ASHRAE Handbook; ASHRAE: Peachtree Corners, GA, USA, 2017. [Google Scholar]
  53. Peel, M.C.; Finlayson, B.L.; McMahon, T.A. Updated world map of the Köppen-Geiger climate classification. Hydrol. Earth Syst. Sci. 2007, 11, 1633–1644. [Google Scholar] [CrossRef] [Green Version]
  54. Ihm, P.; Krarti, M. Design optimization of energy efficient residential buildings in Tunisia. Build. Environ. 2012, 58, 81–90. [Google Scholar] [CrossRef]
  55. Griego, D.; Krarti, M.; Hernández-Guerrero, A. Optimization of energy efficiency and thermal comfort measures for residential buildings in Salamanca, Mexico. Energy Build. 2012, 54, 540–549. [Google Scholar] [CrossRef]
  56. Bahrain Electricity and Water Authority (EWA) Statistics Annual Report 2019. Available online: https://www.ewa.bh/en/Customer/BillsTariffs/electricity-water-tariffs (accessed on 11 June 2021).
  57. Bahrain in 2030: The Future Demographic Euromonitor Report (July 2017). Available online: https://www.euromonitor.com/bahrain-in-2030-the-future-demographic/report (accessed on 11 June 2021).
  58. Elgendy, K. A Visual Guide to Energy Use in Buildings in the Middle East. 2012. Available online: http://www.carboun.com/sustainable-design/a-visual-guide-to-energy-use-in-buildings-in-the-middle-east (accessed on 11 June 2021).
  59. Natural Resource Canada’s (NRCan’s) Office of Energy Efficiency (OEE). Energy Efficiency Trends in Canada. 2014. Available online: https://www.nrcan.gc.ca/sites/www.nrcan.gc.ca/files/energy/pdf/trends2013.pdf (accessed on 11 June 2021).
  60. Pérez-Lombard, L.; Ortiz, J.; Pout, C. A review on buildings energy consumption information. Energy Build. 2008, 40, 394–398. [Google Scholar] [CrossRef]
  61. World Bank, World Development Indicators. 2016. Available online: https://openknowledge.worldbank.org/bitstream/handle/10986/23969/9781464806834.pdf (accessed on 11 June 2021).
  62. Ghalehkhondabi, I.; Ardjmand, E.; Weckman, G.R.; Young, W.A. An overview of energy demand forecasting methods published in 2005–2015. Energy Syst. 2016, 8, 411–447. [Google Scholar] [CrossRef]
  63. EPA. United State Environmental Protection Agency. (n.d). Available online: https://www.epa.gov/energy/greenhouse-gas-equivalencies-calculator (accessed on 20 March 2021).
  64. Maamari, F.; Andersen, M.; de Boer, J.; Carroll, W.; Dumortier, D.; Greenup, P. Experimental validation of simulation methods for bi-directional transmission properties at the daylighting performance level. Energy Build. 2006, 38, 878–889. [Google Scholar] [CrossRef]
  65. Oleiwi, M.Q.; Mohamed, M.F.; Sulaiman, M.K.A.M.; Che-Ani, A.I.; Raman, S.N. Thermal environment accuracy investigation of integrated environmental solutions-virtual environment (IES-VE) software for double-story house simulation in Malaysia. J. Eng. Appl. Sci. 2019, 14, 3659–3665. [Google Scholar] [CrossRef] [Green Version]
  66. Hong, T.; Kim, J.; Jeong, J.; Lee, M.; Ji, C. Automatic calibration model of a building energy simulation using optimization algorithm. Energy Procedia 2017, 105, 3698–3704. [Google Scholar] [CrossRef]
  67. Cipriano, J.; Mor, G.; Chemisana, D.; Pérez, D.; Gamboa, G. Evaluation of a multi-stage guided search approach for the calibration of building energy simulation models. Energy Build. 2015, 87, 370–385. [Google Scholar] [CrossRef]
  68. Kim, J.; Hong, T.; Koo, C.-W. Economic and environmental evaluation model for selecting the optimum design of green roof systems in elementary schools. Environ. Sci. Technol. 2012, 46, 8475–8483. [Google Scholar] [CrossRef] [PubMed]
  69. Sayed, M.A.A.E.D.A.; Fikry, M.A. Impact of glass facades on internal environment of buildings in hot arid zone. Alex. Eng. J. 2019, 58, 1063–1075. [Google Scholar] [CrossRef]
  70. Sayadi, S.; Hayati, A.; Salmanzadeh, M. Optimization of window-to-wall ratio for buildings located in different climates: An IDA-indoor climate and energy simulation study. Energies 2021, 14, 1974. [Google Scholar] [CrossRef]
  71. Alwetaishi, M.; Benjeddou, O. Impact of window to wall ratio on energy loads in hot regions: A study of building energy performance. Energies 2021, 14, 1080. [Google Scholar] [CrossRef]
  72. Faggal, A.A.; Moustafa, A.M.; Arafat, M.Y. Effect of different windows’ glazing types on energy consumption of a residential building in a hot-arid climate case study: Residential building in New Cairo City. JES. J. Eng. Sci. 2019, 47, 706–719. [Google Scholar] [CrossRef]
  73. Sb, M.A.R. Building energy consumption and carbon dioxide emissions: Threat to climate change. J. Earth Sci. Clim. Chang. 2015, s3, 1. [Google Scholar] [CrossRef] [Green Version]
  74. UN Environment and International Energy Agency. Towards a Zero-Emission, Efficient, and Resilient Buildings and Construction Sector. Global Status Report 2017. Available online: https://www.worldgbc.org/sites/default/files/UNEP%20188_GABC_en%20%28web%29.pdf (accessed on 19 May 2021).
  75. Akbari, H.; Morsy, M.G.; Al-Baharna, N.S. Electricity Savings Potentials in the Residential Sector of Bahrain. United States. 1996. Available online: https://www.osti.gov/servlets/purl/420365 (accessed on 10 May 2021).
  76. Vyas, G.; Jha, K. Benchmarking green building attributes to achieve cost effectiveness using a data envelopment analysis. Sustain. Cities Soc. 2017, 28, 127–134. [Google Scholar] [CrossRef]
  77. Krarti, M. Energy Audit of Building Systems: An Engineering Approach; CRC Press: Hoboken, NJ, USA, 2020; ISBN 9780367820466. [Google Scholar]
  78. Goh, B.H.; Sun, Y. The development of life-cycle costing for buildings. Build. Res. Inf. 2016, 44, 319–333. [Google Scholar] [CrossRef]
  79. Elnabawi, M.H.; Saber, E. Reducing carbon footprint and cooling demand in arid climates using an integrated hybrid ventilation and photovoltaic approach. Environ. Dev. Sustain. 2021, 1–23. [Google Scholar] [CrossRef]
Figure 1. Distribution of studies according to climate type [40].
Energies 14 08088 g001
Figure 2. T3M residential unit as a reference case study.
Energies 14 08088 g002
Figure 3. T3M residential unit DesignBuilder building model.
Energies 14 08088 g003
Figure 4. Hamad city, official layout. Source: Ministry of Housing, Bahrain.
Energies 14 08088 g004
Figure 5. A typical Bahraini family’s daily profile on weekdays, including HVAC and lighting loads.
Energies 14 08088 g005
Figure 6. Energy consumption forecast for Bahrain’s residential sector in relation to total energy consumption.
Energies 14 08088 g006
Figure 7. The three residential buildings’ actual monthly electricity usage and those of DesignBuilder.
Energies 14 08088 g007
Figure 8. Monthly energy consumption for base Case 1 (Bahraini code), Abu-Dhabi ESTIDAMA 1 code, Saudi code, and Kuwaiti code.
Energies 14 08088 g008
Figure 9. Forecast energy consumption of the residential sector for the promising design scenarios up to 2030.
Energies 14 08088 g009
Figure 10. Monthly carbon emissions for the four cases.
Energies 14 08088 g010
Table 1. Minimum requirements for code compliance in residential buildings for different GCC countries adapted from [16,18].
Design ElementGCC Thermal Regulations [5]Bahrain Energy Conservation Code [15,16]UAE, Abu Dhabi ESTIDAMA 1 Pearl Compliance [14]Saudi Building Code [13]Kuwaiti Building Code [12]
Exterior WallsU = 0.741 W/m2.K (0.131 Btu/h.ft2.F)U = 0.741 W/m2.K (0.131 Btu/h.ft2.F)(1)Massive wall
U = 0.30 W/m2.K (0.0528 Btu/h.ft2.F)
Massive walls
U = 0.27 W/m2.K (0.0476 Btu/h.ft2.F)
U = 0.483 W/m2.K (0.0851 Btu/h.ft2.F)
RoofU = 0.57 W/m2.K
(0.1 Btu/h.ft2.F)
U = 0.57 W/m2.K
(0.1 Btu/h.ft2.F)
Insulation entirely above deck
U = 0.2 W/m2.K
(0.035 Btu/(ft2.hr.F))
U = 0.116 W/m2.K (0.0204 Btu/(ft2.hr.F))U = 0.341 W/m2.K (0.060 Btu/h.ft2.F)
FloorNANAMassive floor
U = 1.65 W/m2.K (0.291 Btu/h.ft2.F)
U = 0.27 W/m2.K (0.0476 Btu/h.ft2.F)U = 0.714 W/m2.K (0.126 Btu/h.ft2.F)
WindowNAMaximum U-value
(W/m2.°C)
U = 0.75
Window glazing
WWR(2) = 10–20% (U = 5.10)
WWR > 20% (U = 2.4)
WWR < 30%
U = 1.9 W/m2.K
(0.335 Btu/h.ft2.F)
If projection factor PF < 0.25, then SHGC should
be 0.23
U = 1.99 W/m2.K
(0.351 Btu/h.ft2.F)
SHGC = 0.4
U-value of the door = 2 W/m2.K (0.352 Btu/
h.ft2.F)
U = 3.61 W/m2.K (0.636 Btu/h.ft2.F)
SHGC = 0.6
Tv = 0.6
InfiltrationNANA3.64 l/s/m2 of exterior surface area0.39
(0.57 × weather factor), (Weather
factor = 0.69 for hot humid climate)
0.25
Coefficient of performance
(COP)
NANAIf cooling capacity is
>40 kW
and <70 kW, then COP should be 3.22
2.72.3
Notes: (1) In addition to exterior walls, other walls and floors connected to non-air-conditioned spaces must be insulated; (2) WWR = window-to-wall ratio.
Table 2. Simulation inputs for the building’s properties.
Building PropertiesUnit
No. of floors2
Total area209m2
Floor height3.17m
Ground level0.45m
External wall area421.6m2
External opening area104.03 m2
External wall insulationU-value: 2.746 W/m2-K
Roof insulationU-value: 0.53W/m2-K
GlazingDouble coated 6/8/6 (SHGC 0.31)
3.26 W/m2-KW/m2-K
Window-to-wall ratio24.6%
ShadingBlinds (inside) with high-reflectivity slats
Occupancy density6 occupants
System typeSplit air-conditioning units
Thermostat setting 24 °C for cooling (no heating is provided)
Cooling system seasonal CoP2.5
Table 3. Subsidised and unsubsidised electricity consumption tariff.
Electricity Consumption UnitElectricity Usage Charge ($)
Kilowatt-Hour (kWh)SubsidisedUnsubsidised
First 30000.0800.77
3001–50000.24
Above 50000.42
Table 4. Total capital cost of the design alternatives [18,34].
Design AlternativeTotal Investment Cost [$]
Design Case 1—Bahrain: GCC thermal regulations 14,166.3
Design Case 2—UAE, Abu Dhabi ESTIDAMA 34,142.4
Design Case 3—Saudi Building Code 38,755.2
Design Case 4—Kuwaiti Building Code 21,319.7
Table 5. Annual electricity usage by all sectors in Bahrain, 2010–2018 [4].
SectorResidentialCommercialIndustrialAgriculturalTotal
Year Million KWhMillion KWhMillion KWhMillion KWhMillion KWh
2010 5966.004720.001408.004912,143.00
%49.138.911.60.4100.0
2011 5871.004523.001821.004812,263.00
%47.936.914.80.4100.0
2012 6309.004551.001739.004512,644.00
%49.936.013.80.4100.0
2013 6426.254854.562017.2951.5413,349.63
%48.136.415.10.4100.0
2014 69855520.002632.004815,185.00
%46.036.417.30.3100.0
2015 7626614127285716,552.00
%46.137.116.50.3100.0
2016 7643597925876116,270.00
%47.036.715.90.4100.0
2017 8378541227105916,559.00
%50.632.716.40.4100.0
2018 8086630727866217,241.00
%46.936.616.20.4100.0
Table 6. The examined case studies, including the proposed changes as per the GCC energy conservation codes.
Case 1 as BuiltCase 2Case 3Case 4
Design ElementBahrain Energy Conservation Code (1) [15,16]UAE, Abu Dhabi ESTIDAMA 1 Pearl Compliance [14]Saudi Building Code [13]Kuwaiti Building Code [12]
Exterior WallsU = 0.741 W/m2·K (0.131 Btu/h.ft2·F)Include 0.082 m EPS expanded polystyrene
U = 0.30 W/m2·K
Include 0.095 m EPS expanded polystyrene
U = 0.27 W/m2·K
Include 0.031 m EPS expanded polystyrene
U = 0.483 W/m2·K
RoofU = 0.57 W/m2·K
(0.1 Btu/h.ft2·F)
Add 0.18 m EPS expanded polystyrene
U = 0.2 W/m2·K
Add 0.3 m EPS expanded polystyrene
U = 0.116 W/m2·K
Add 0.095 m EPS expanded polystyrene
U = 0.341 W/m2·K
FloorNAAdd 0.01 m EPS expanded polystyrene
U = 1.65 W/m2·K
0.13 m EPS expanded polystyrene
U = 0.27 W/m2·K
0.045 m EPS expanded polystyrene
U = 0.714 W/m2·K
WindowMaximum U-value
(W/m2.°C)
U = 0.75
Window glazing
WWR (2) = 10–20% (U = 5.10)
WWR > 20% (U = 2.4)
WWR < 30%
U = 1.9 W/m2·K
(0.335 Btu/h·ft2·F)
If projection factor PF < 0.25, then SHGC should
be 0.23
U = 1.99 W/m2·K
(0.351 Btu/h.ft2·F)
SHGC = 0.4
U-value of the door = 2 W/m2·K (0.352 Btu/
h.ft2·F)
U = 3.61 W/m2·K (0.636 Btu/h.ft2·F)
SHGC = 0.6
Tv = 0.6
InfiltrationNA3.64 l/s/m2 of exterior surface area0.39
(0.57 × weather factor), (Weather
factor = 0.69 for hot humid climate)
0.25
Coefficient of performance
(COP)
NAIf cooling capacity is
>40 kW
and <70 kW, then COP should be 3.22
2.72.3
(1) The proposed guidelines included minimum levels of thermal resistance (R-value) of 1.35 m2K/W for walls and 1.75 m2·K/W for roofs without specifying any guidelines for some other items, including floors, infiltration rate, and coefficient of performance (COP). (2) WWR = window-to-wall ratio.
Table 7. Cooling loads and reduction percentages compared to the base case.
Case 1 As-Built (Bahraini)Case 2
Abu Dhabi
Case 3
Saudi
Case 4
Kuwaiti
kWhkWh%kWh%kWh%
January 317.0330.7−4.3425.3−34.2371.3−17.1
February463.4437.85.5551.3−19.0518.8−11.9
March997.5791.120.7966.63.11050.8−5.3
April1743.21309.624.91568.410.01830.6−5.0
May3018.72065.931.62431.119.53041.1−0.74
June3424.52302.832.82697.921.23420.50.11
July4218.02826.633.03300.721.74212.00.14
August4229.32845.532.73321.121.54234.8−0.12
September3989.32728.831.63193.519.94032.8−1.0
October3171.22237.729.42637.116.83254.8−2.6
November1636.91239.824.31485.69.21725.4−5.4
December669.8579.913.4718.5−7.3728.6−8.7
Total27,878.619,696.229.423,297.116.428,421.5−1.94
Table 8. Simple payback period, including the subsidised and unsubsidised energy costs.
Case 1 As-Built (Bahraini)Case 2
Abu Dhabi
Case 3
Saudi
Case 4
Kuwaiti
Annually energy consumption (KWh)34,720.226,262.829,661.634,656.9
Energy saving compared to the as-built (KWh)NA8457.45058.663.3
Unsubsidised cost ($) 0.7726,734.56512.23895.148.7
Subsidised cost ($) 0.248332.82029.81214.115.2
5 years unsubsidised133,672.732,561.019,475.7243.7
5 years subsidised41,664.210,148.96070.375.9
Total investment cost [$]17,524.934,142.438,755.221,319.7
SPP unsubsidised in years0.75.29.9437.5
SPP subsidised in years2.116.831.91403.6
Table 9. Lifecycle cost for the examined design scenarios including subsidised and unsubsidised energy rates.
Case 1
As-Built Bahrain
Case 2
Abu Dhabi
Case 3
Saudi
Case 4
Kuwait
(EC) is the annual energy cost estimated (unsubsidised) ($)26,734.5420,222.3422,839.4126,685.81
(EC) is the annual energy cost estimated (subsidised) ($)8332.846303.067118.778317.65
(EU) is the annual energy consumption acquired from the dynamic energy simulation (KWh)34,720.226,262.829,661.634,656.9
(re) is the electricity tariff obtained from the EWA annual (unsubsidised) ($)0.770.770.770.77
(re) is the electricity tariff obtained from the EWA annual (subsidised) ($)0.240.240.240.24
Total investment cost [$]17,524.934,142.438,755.221,319.7
LCC unsubsidised ($)428,500.4 345,009.3389,852.9431,546.1
LCC subsidised ($)145,621.165131,035.993148,188.25149,182.47
Publisher’s Note: MDPI stays neutral with regard to jurisdictional claims in published maps and institutional affiliations.

