Article

Performance Analysis of Commercial Passive Balancing Battery Management System Operation Using a Hardware-in-the-Loop Testbed

Department of Electrical and Computer Engineering, Florida International University, Miami, FL 33174, USA
*
Author to whom correspondence should be addressed.
Energies 2021, 14(23), 8037; https://doi.org/10.3390/en14238037
Submission received: 27 October 2021 / Revised: 15 November 2021 / Accepted: 23 November 2021 / Published: 1 December 2021
(This article belongs to the Collection Batteries, Fuel Cells and Supercapacitors Technologies)

Abstract

:
With increased usage, individual batteries within the battery pack will begin to show disparate voltage and State of Charge (SOC) profiles, which will impact the time at which batteries become balanced. Commercial battery management systems (BMSs), used in electric vehicles (EVs) and microgrids, typically send out signals suggesting removal of individual batteries or entire packs to prevent thermal runaway scenarios. To reuse these batteries, this paper presents an analysis of an off-the-shelf Orion BMS with a constrained cycling approach to assess the voltage and SOC balancing and thermal performances of such near-to-second life batteries. A scaled-down pack of series-connected batteries in 6s1p and 6s2p topologies are cycled through a combination of US06 drive and constant charge (CC) profiles using an OPAL-RT real-time Hardware-in-the-loop (HIL) simulator. These results are compared with those obtained from the Matlab/Simulink model to present the error incurred in the simulation environment. Results suggest that the close-to-second life batteries can be reused if operated in a constrained manner and that a scaled-up battery pack topology reduces incurred error.

1. Introduction

Lithium-ion (Li-ion) batteries are widely used in EV and microgrid applications; however, they are susceptible to electrical instabilities brought on by slight chemical variations between individual batteries [1,2,3,4]. These variations can cause significant voltage imbalances between series-connected batteries, leading to increased individual battery degradation and premature replacement or failure [5]. A cost-effective way of managing these instabilities is by deploying a passive balancing BMS capable of dissipating excess charge through resistive components. Active balancing is another way mismatches in individual battery charge capacities can be dealt with; however, it introduces a large number of additional components, increasing control complexity and reducing system reliability. Thus, it is often less practical for many battery energy storage applications. Additionally, multiple newly-developed battery chemistries such as Li-sulfur [6], and their variants discussed in [7,8], are being researched for incorporation with BMSs to assess prognostic properties of their parameters in conjunction with variation management [9].
Batteries that have experienced capacity degradation through extensive cycling, termed as close-to-second life batteries, can be re-purposed and have recently gained higher interest as industries and consumers continue to look for more sustainable alternatives for their energy needs [10,11]. Near-to second life batteries must go through a close inspection and assessment of their performance capability before determining possible second life implementation. They also require more strict monitoring and protection as chemical instabilities in these batteries are amplified compared to first-life batteries. It is common for second-life batteries to be implemented for grid service applications after being used in EVs for the duration of their first life [12]. However, it is also possible to reuse them in EV applications which may also reduce costs for consumers [13].
The key contributions of this paper are that it:
  • Provides a detailed component-wise comparison of the existing battery models,
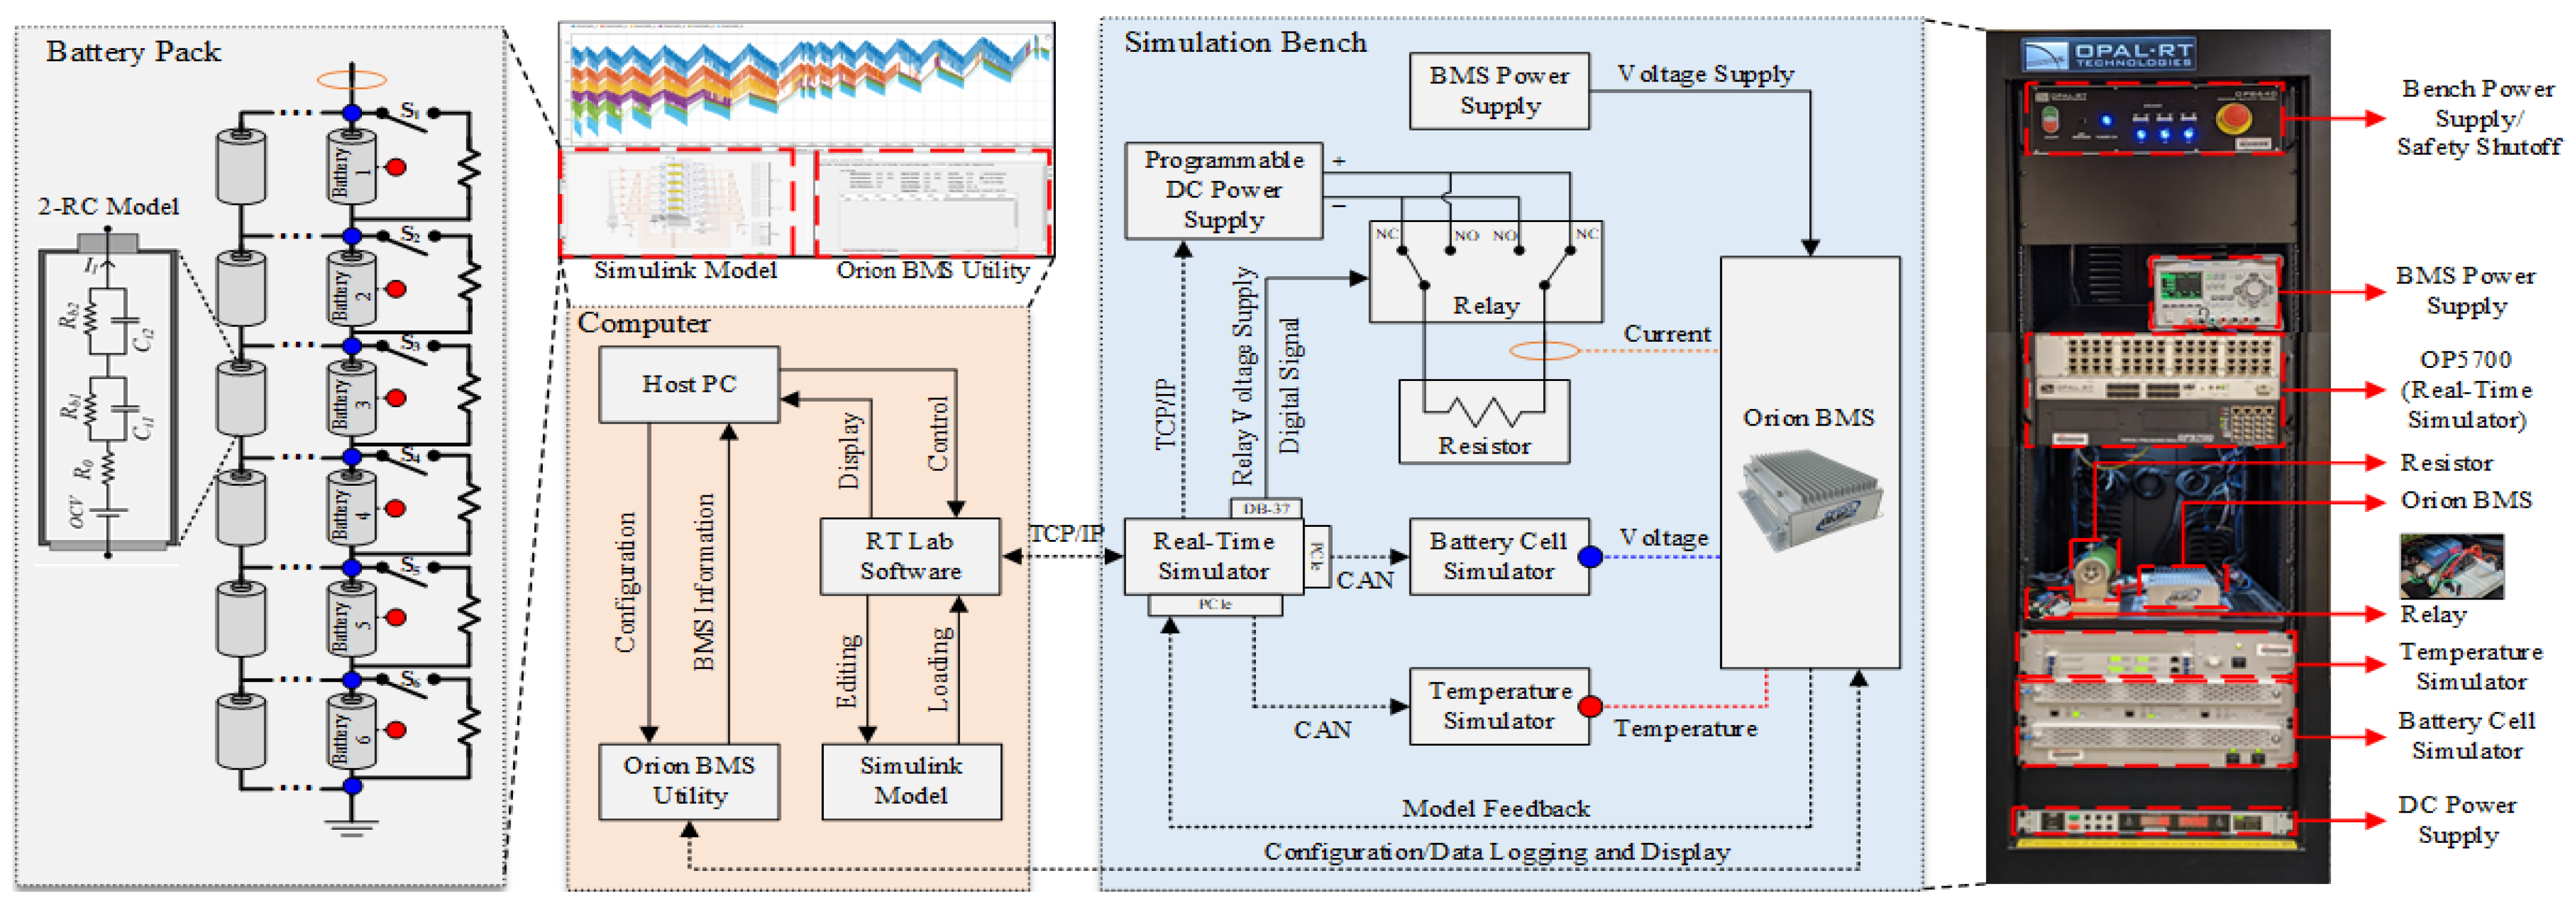
  • Provides details on the configuration and operation of a Control-HIL (CHIL) testbed for a commercial BMS,
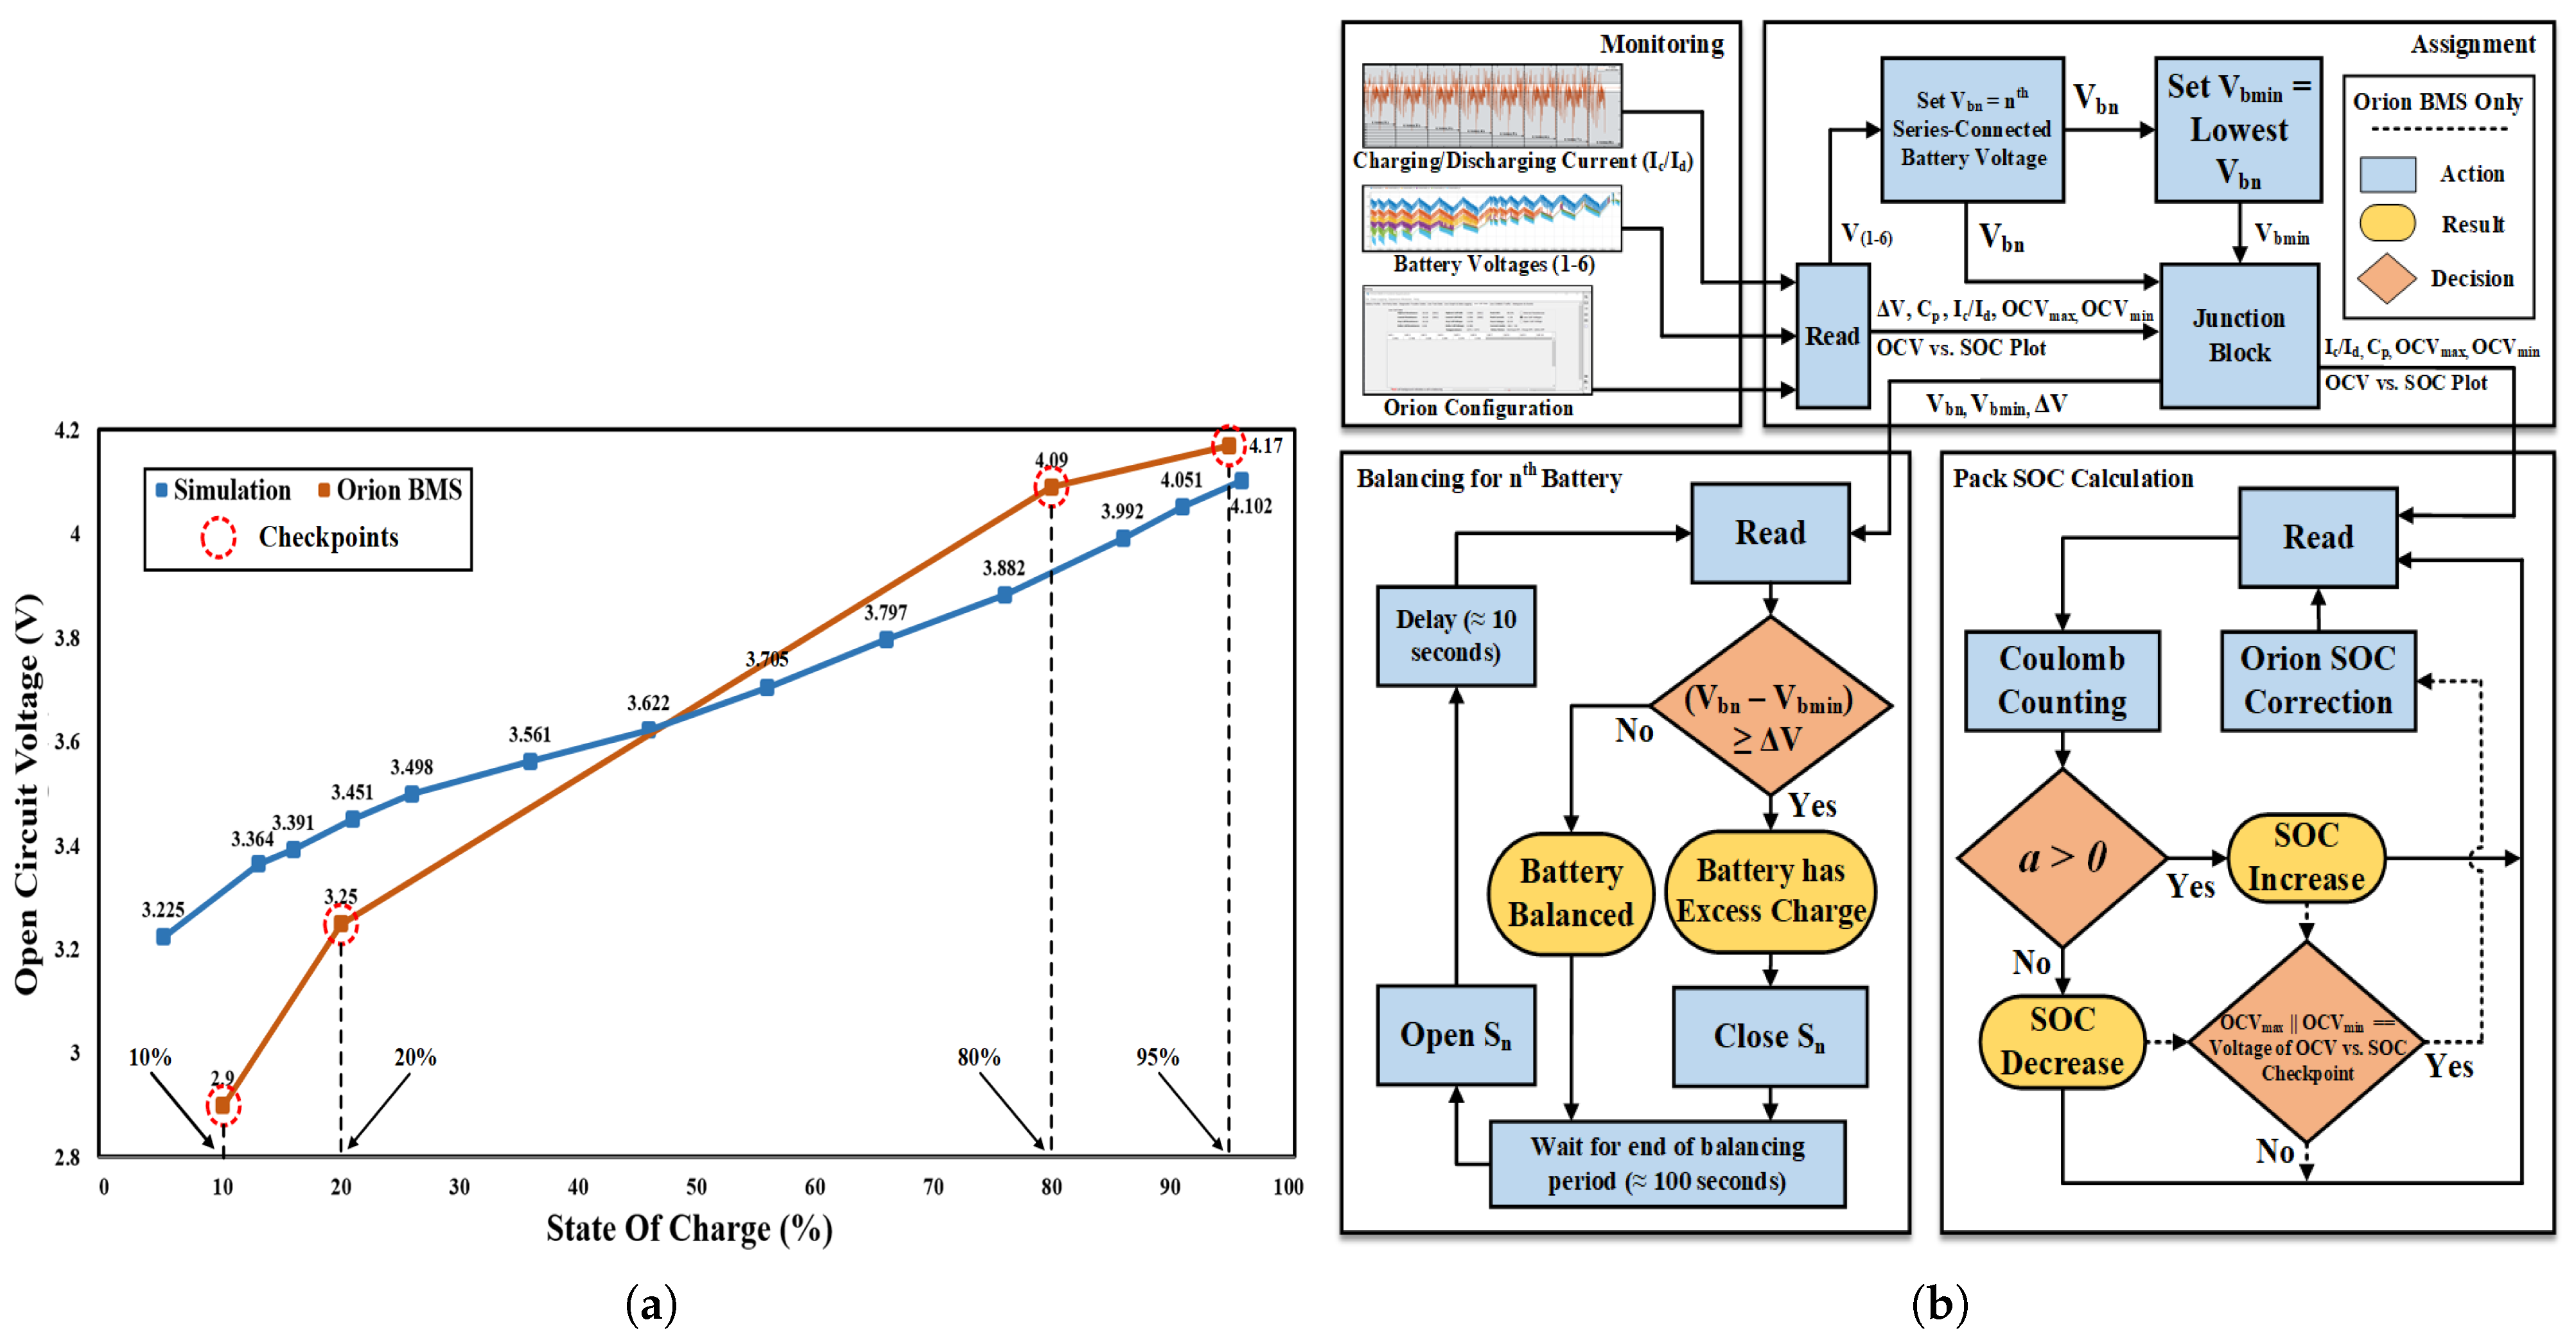
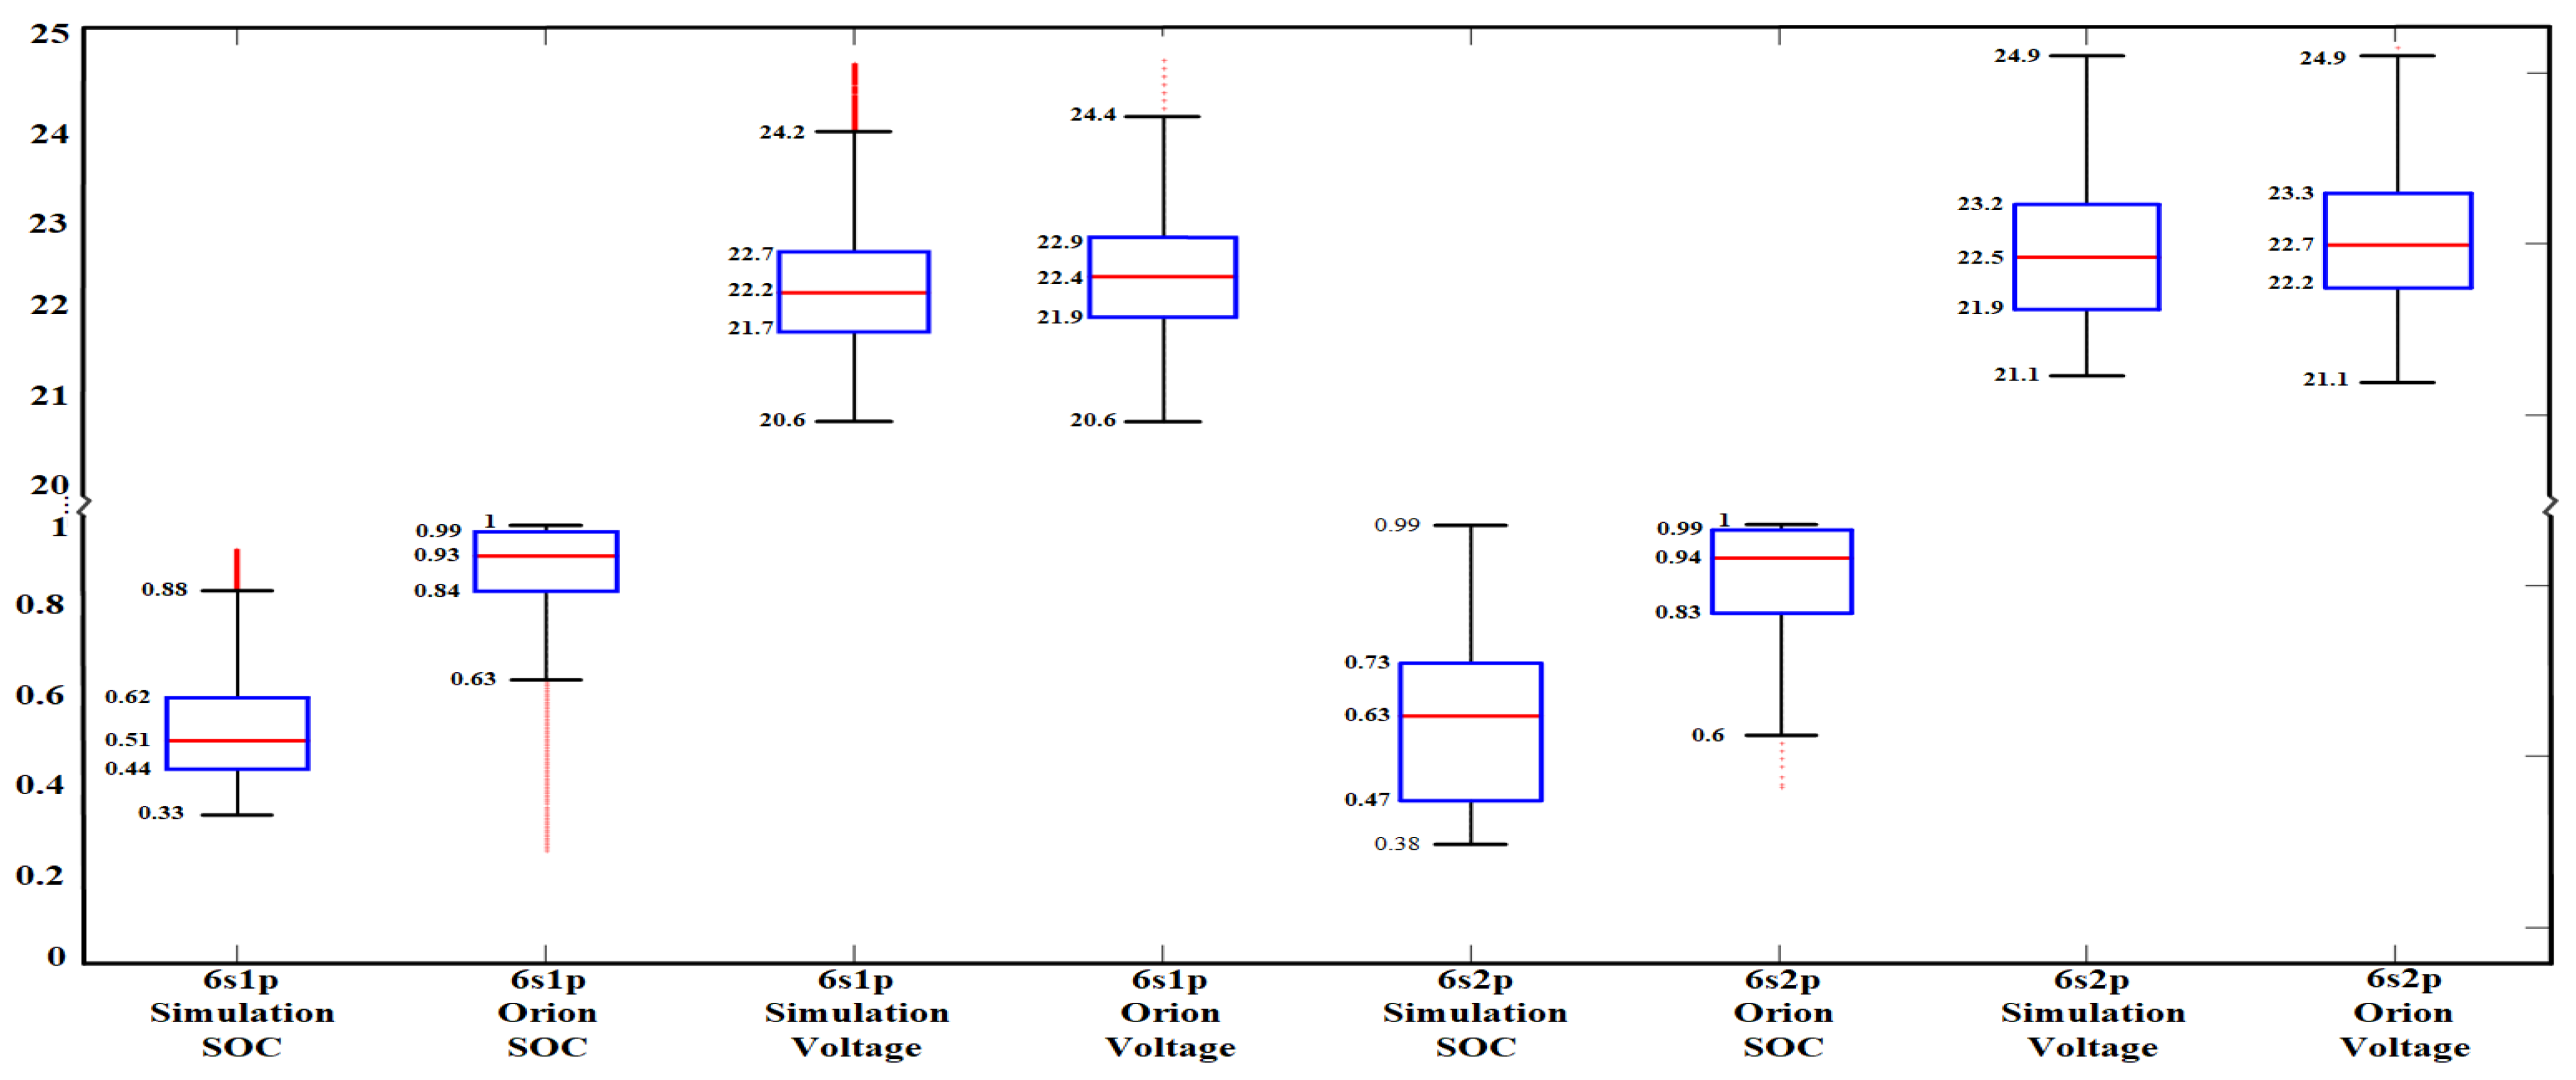
  • Presents a comparison of simulation-based and commercial BMS results to assess the resulting error introduced by operating close-to-second life batteries in a US06 drive profile,
  • Presents additional insights into the operation of the commercially available Orion BMS for system integrators and recommendations for enhancing the future SOC estimation for decreased battery degradation,
  • Provides a comparison of existing literature works that utilize the same commercial passive balancing BMS while adding new supplemental information.

2. Related Work

Second-life batteries have become a popular idea for increasing the sustainability of new lithium battery-based technologies, and thus, numerous reviews are available for the research community. For example, Martinez-Laserna et al. [13] provides information for second-life batteries from an economic, technical, and environmental perspective and as well as provides a market value range of 44 to 180 USD/kWh for varying second-life batteries. This review concludes that these prices make second-life alternatives more viable; however, it asserts that continued research and development is needed in terms of battery aging towards knowing how realizable second-life applications are. Towards this, Hossain et al. [14] provides relevant data on power and capacity fade as a function of life cycles. This review also discusses the practical uses, eligibility, and manufacturing of second-life batteries while asserting that extension of first-life batteries for second-life use will have significant environmental impacts and is therefore necessary. A battery tracking system, posited by Zhao et al. [15], may help in this effort for increased standardization of the process towards identifying near-to-second life batteries for their best possible usage, either in a second life application or for recycling to be used in the new battery manufacturing process. This review also provides further details on the challenges and opportunities of the reuse and recycling of varying second-life batteries.
Towards battery management, Daowd et al. [16] and P. Deja [17] provide a review of the functionalities, advantages, and disadvantages of various active and passive balancing techniques employed by BMSs. One such example of an active balancing control of series-connected second-life batteries for dealing with capacity mismatches is implemented in [18]. However, it is suggested that active balancing approaches require a higher number of electronic components, thereby increasing the financial constraints of the design. Hence, passive balancing techniques are commonly implemented using commercial off-the-shelf passive BMSs which support grid storage applications [19], mainly towards achieving network stability. Towards this, Lacap et al. [20] deploys an Orion BMS for monitoring and management of second-life batteries for use in a real-world photovoltaic (PV) and grid storage time-shifting application. Numerous works have also implemented these techniques for EV applications. For instance, Rezal et al. [21] expressed the ability to cycle batteries using constant current constant voltage (CCCV) charging and to discharge with a defined cut-off voltage. In addition, Braco et al. in [22], performs substantial second life charge-discharge cycling to analyze capacity and internal resistance towards the aging performance of second-life batteries. Similarly, Yusof et al. [23] cycles batteries with CCCV charging but instead uses drive profiles for the discharge portion of the cycle. With respect to using real-time simulators to emulate such scenarios, Kollmer et al. [24] discuss the implementation of OPAL-RT real-time HIL simulators to create a testbed meant for evaluation of cyberattacks in a microgrid. Another example of a testbed for simulation of a PV and Wind energy-based second life grid storage application geared towards EV charging is demonstrated in [25]. Finally, Taylor et al. [19] also proposes an RTDS HIL testbed for simulating a battery pack with the Orion BMS to assess the impact of battery energy storage on the power grid. All these works consider a series-connected battery pack topology and none of the discussed works analyze passive balancing operation on a CHIL testbed.
The rest of the paper is organized as follows. Section 3 describes the steps involved in configuring a CHIL testbed with an Orion BMS. Section 4 describes the details of the selected battery model parameters used in both the simulation and for the Orion BMS. Section 5 presents and discusses the results obtained from both simulation and the Orion BMS. Section 6 concludes the paper by providing a comparison of the incurred error, balancing times, and distribution of the balancing data from both the simulation and the Orion BMS. In addition, a comparison of the existing literature with the obtained conclusions, along with the possible options for future work, are discussed.

3. BMS Testbed Configuration

To analyze the performance of battery pack topologies on the balancing operation, an OPAL-RT bench equipped with a battery cell simulator, a temperature simulator, a programmable single-quadrant DC power supply (in a current control mode), and an OP5700 real-time simulator is used in conjunction with the Orion BMS to form a CHIL testbed. This testbed allows charging and discharging operations by means of an automated relay controlled by the Matlab/Simulink model, which switches the current flow from the programmable DC power supply across the resistor in the event of a negative current in the simulation. This in effect, is read as a charging/discharging current by the Orion BMS’s DHAB S/125 open-loop hall effect current sensor, which is placed between the relay and the resistor. The relay is operated using a DB-37 digital output port and a 12V DC supply voltage from the real-time simulator. Communication between other simulation peripherals is facilitated by two common communication protocols, TCP/IP and controller area network (CAN). The CAN bus network interfaces using PCIe slots that are also located on the real-time simulator. The Orion BMS is powered by a separate, additional power supply providing a 16 V output. Orion connects with a battery cell simulator using six voltage probes and six negative temperature coefficient thermistors to read individual battery voltages and temperatures. The precision of temperature measurements obtained from the Orion BMS has an integer step of 1 °C. The Orion BMS allows for the configuration of a target Δ V, where Δ V is the allowable difference between maximum and minimum voltages of individual batteries in a battery pack topology. The CHIL testbed used for validation of the Orion BMS can be visualized in Figure 1 including an overview of the communication pathways, feedback loops, supply currents/voltages, and measurement locations for Orion BMS sensors.

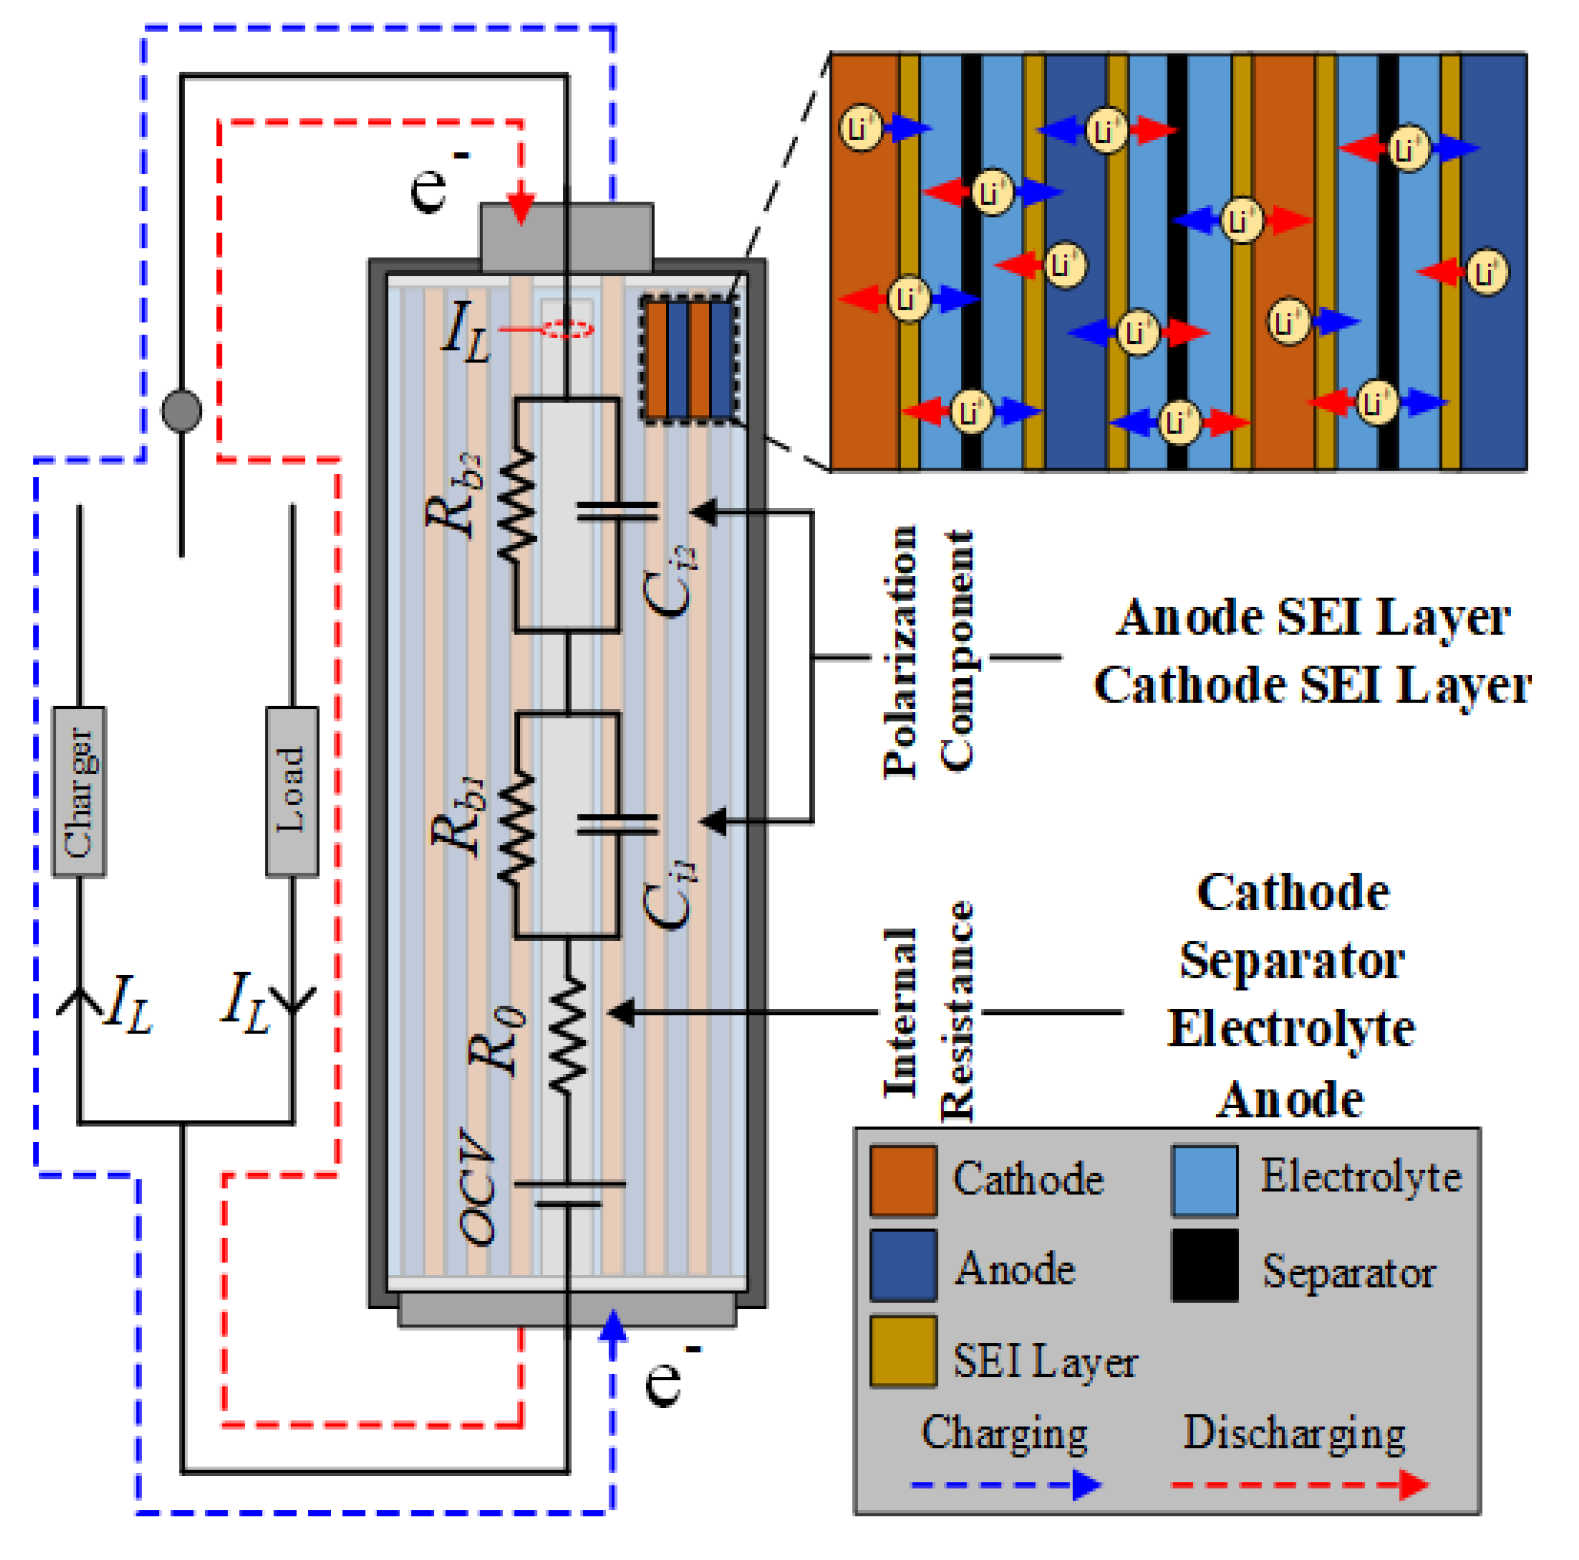
4. Battery Modeling Approach

Several Li-ion models for simulation, including the Rint/Simple model, SAFT RC model, linear model, and Thevenin model derivatives, are available online, with the SAFT RC model having the highest SOC estimation accuracy. Table 1 provides an extensive list of existing battery models along with their dynamicity, which is described by the number of variable functions within them. Variable functions provide information on the set of variables for which the relationship would need to be developed, in addition to inputs, for the model to be operational.
A battery model, as a result, develops the relationship between internal parameters and the external application of the battery to identify and simulate their dynamic working characteristics. Internal parameters include, but are not limited to, open circuit voltage (OCV) and internal/ohmic/electrolytic ( R 0 ), capacitor ( R a ), end ( R e ), terminal ( R t ), charging ( R c ), discharging ( R d ), concentration polarization ( R p c ), activation/electrochemical polarization ( R p a ), and polarization/faradic/lumped interfacial reaction ( R b x ) resistances, where x { Z + ranging from 1 to m } is the number of RC branch pairs. In addition, main capacitance ( C e ) representing the capability of the battery to store charge chemically, secondary capacitance ( C a ) representing the limiting behavior of battery to deliver current depending on diffusion material and time constants ( τ ), concentration polarization ( C p c ), activation/electrochemical polarization ( C p a ), and polarization/interfacial ( C i x ) capacitances where x { Z + ranging from 1 to m } is the number of RC branches constituting the remaining internal battery parameters [55]. External application parameters include load current ( I L ) varying with time (t), V [ X ] , which indicates voltage applied across element X, where X { C a , C e , C i x } , and the output is the battery open terminal voltage. These models indicate the behavioral approximation of a real battery. Supported battery types and simulation software(s) used are also presented to indicate the extent of scalability of each model.
The m-RC model, also termed as the table based or dual polarization model in various literatures, allows modeling of the dynamics of battery components by including all the inputs and components of all the other models listed in Table 1. A simplified representation of this model is shown in Figure 2. The m value is limited to 2 in order to allow simplified modeling of the battery. With this limited m value, the required parameters/variables are R 0 ( S O C ) , R a (SOC), R e (SOC), time constants τ 1 (SOC) ( = C a R a ) and τ 2 (SOC) ( = C e R e ), OCV(SOC), and I L ( t ) . The resulting open terminal voltage (OTV) varying with t across the modeled battery is represented as shown in Equation (1).
O T V ( t ) = O C V I L R 0 I L R a e t τ 1 I L R e e t τ 2 ,
Hybrid pulse power characterization and electrochemical impedance spectroscopy test results from a 3.6 V nominal voltage, 2.75 Ah capacity NCR18650PF battery, found in [56], are used to build this model based on the steps shown in [57]. This modeling technique is similar to the Verband der Automobilindustrie current step-based method for modeling the battery [58]. The beginning values of SOC in the modeled battery pack range from [9.6%, 85.9%] to replicate close-to-second life batteries. The resulting modeled battery pack contains battery stacks consisting of 6 series-connected batteries where the minimum number of series connections for the operation of the Orion BMS is 4. For the first simulation, a single stack (6s1p) is used, while for the second simulation, two battery stacks are connected in an interleaved manner (for 6s2p topology) [59].
The capacity rating (dependent on battery temperature) of each battery is obtained from the battery’s datasheet. Each series-connected battery is equipped with balancing circuitry capable of mimicking the Orion BMS’s capabilities. The balancing current (for both 6s1p and 6s2p topologies) is set to 200 mA as determined from the Orion BMS’s operation manual. The OPAL-RT’s RT Lab software provides an interface to model using Matlab/Simulink and control the real-time simulators using a TCP/IP protocol. During simulation, the Orion BMS returns balancing commands feedback to the battery pack model in order to emulate its individual battery balancing capability. Balancing operation is realized by monitoring battery charging/discharging current and voltage parameters. The difference in voltage between each individual battery ( V b n ) and the lowest voltage battery ( V b m i n ) is compared against the configured target Δ V. Here, n is the number of series-connected batteries. If the difference is greater than target Δ V, the switch corresponding to that battery’s number, S n , will close, thereby completing the balancing circuit and allowing for the dissipation of excess charge. After a balancing period defined by the Orion BMS’s algorithm (approximately 100 s), switch S n will reopen, and a monitoring check delay (approximately 10 s) will be performed before determining again if batteries need to continue to be balanced.
S O C = S O C t x + t x t y { a I c + ( a 1 ) I d } d t C p × 100 % , where , a = 0 , while discharging 1 , while charging
Towards SOC calculation, both the simulation and the Orion BMS implement a standard coulomb counting method by using charging/discharging current ( I c / I d ) and capacity ( C p ), acquired from monitoring, to determine a SOC increase or decrease, as shown in Equation (2). In Equation (2), S O C t x is the SOC measured at initial time instant t x and t y = t x + Δ t is the elapsed time, where Δ t is the SOC measurement duration between instances t x and t y . In addition to coulomb counting, the Orion BMS implements a secondary SOC adjustment (correction) algorithm where the lowest ( O C V m i n ) and highest ( O C V m a x ) individual battery OCVs are used to help determine actual SOC values of the battery pack based on a configurable SOC vs. OCV plot. By selecting the NCR18650PF battery within the Orion BMS’s utility, nominal capacity and SOC vs. OCV look-up table checkpoints are set by default. Values for SOC vs. OCV for both the simulation and the Orion BMS’s default settings are superimposed in Figure 3a, where checkpoint values for SOC adjustment are also marked. The battery pack model topologies, circuitry, and individual battery components can be visualized in Figure 1, whereas the operational flowchart for battery balancing and SOC calculation for both the simulation and the Orion BMS can be seen in Figure 3b.

5. Simulation and Orion BMS Results Discussion

Assessments have been conducted in order to analyze the second life battery balancing capabilities of the Orion BMS and include subjection to a rigorous charge-drive cycle. A US06 current profile, shown in Figure 4, where each {US(N + 1) − US(N)} portion with a duration of approximately 10 min, has been selected for the drive portions of the sequence, and a CC of 1.375 A and 0.6875 A (through each individual battery) is selected for the charge portions of the sequence based on the datasheet, for 6s1p and 6s2p topologies respectively. Battery sequencing is realized by alternating drive and charge portions where drive time and charge time are incremented by one US06 iteration and 7.5 min, respectively, until a cumulative maximum drive duration of 80 min and a cumulative maximum charge duration of 60 min has been achieved. To properly sequence the 6s1p topology, the US06(1) drive portion is omitted. For the 6s2p topology, the US06(1) drive portion is placed at the end of the sequence in order to keep continuity, and an additional alternating sequence is also used because of the increased capacity. Although the US06 current profile has a maximum charge (regenerative) and discharge currents of 7.57 A and −20.82 A, respectively, the drive current is limited to ±1.5 A within the simulation model. This limit is obtained from the datasheet of the programmable DC power supply. A Δ V target of 50 mV is set in the Orion BMS utility as the voltage threshold at which balancing is triggered for any individual battery outside of this limit in comparison to the lowest series-connected individual battery voltage. A breakdown of the battery pack topologies, charge-drive sequences, Δ V targets, and current limits being used during each test can be found in Table 2.
The alternating charge-drive sequence used for both battery pack topologies can be visualized in Figure 5a and is subsequently shown in its entirety in Figure 5a–f. Individual battery voltages of the first topology, for both the simulation and the Orion BMS, can be seen converging in Figure 5a,b respectively. Similarly, individual battery voltages of the second topology, for both the simulation and the Orion BMS, are shown in Figure 5c,d, respectively. Balancing time for the 6s1p topology is shown in Figure 5a,b,e, as a dotted line at 36,830 s. Similarly for the 6s2p topology, a balancing time of 74,220 s is shown in Figure 5c–e. Total battery pack SOC from both the simulation and the Orion BMS for both 6s1p and 6s2p topologies can be seen together in Figure 5e. Maximum measured battery pack temperatures from both the simulation and the Orion BMS for both topologies can be seen in Figure 5f. Temperatures for the 6s2p topology are considerably lower considering that the current flow through each individual battery is half (0.6875 A) compared to the 6s1p topology (1.375 A). It should also be noted that maximum temperatures stabilized with a decrease in SOC imbalances, for both topologies.
As shown in Figure 6 for both topologies, the interquartile range decreases in comparison with simulation, meaning that data from the Orion BMS is less dispersed. While Orion BMS’s voltage distribution presents close to a normal distribution, its SOC distribution shows right skewness resulting from the SOC frequently reaching the maximum value as evident in Figure 5e. In addition, a significant reduction in the density and quantity of outliers from 6s1p to 6s2p suggest that the unusual or error introducing data points reduce as the topology gets scaled up.
The voltage and SOC for the simulation and the Orion BMS (for each battery topology) are evaluated at four evenly spaced timestamps ( t 0 3 for 6s1p and t 4 7 for 6s2p) where t 3 and t 7 are balancing times of 6s1p and 6s2p topologies, respectively. Δ V, balancing time, and SOC differences ( Δ SOC) between the simulation and the Orion BMS are evaluated at each timestamp and are tabulated in Table 3a–c, respectively. In Table 3a,b, Δ V for both topologies decreases to below 50 mV, with 6s1p having a higher overshoot of voltage balancing at the balanced stage. In Table 3c, Δ SOC between the simulation and the Orion BMS for both battery topologies is calculated for all timestamps and shows significant differences in SOC calculation. At the end of the balancing period for both 6s1p and 6s2p, Δ SOC reduces significantly; however, they still present a difference of 6.16% and 8.06%, respectively. Additionally, although the Δ V values for both topologies suggest that the Orion BMS closely follows the simulation Δ V and subsequently the balancing times, the Δ SOC between the two presents a significant difference in values for both topologies.
Throughout both 6s1p and 6s2p cycling, it can be seen that for the Orion BMS, SOC values often reach 100% due to maximum individual battery voltage reaching 4.2 V, which is considered ‘fully charged’ within the Orion BMS’s utility. Minimum individual battery voltages also affect the SOC calculations when the SOC correction algorithms SOC vs. OCV checkpoints are reached. Due to the large differences in individual battery voltages within the modeled battery pack, a back and forth swing in SOC (in Orion BMS) from t = 0 to t 0 can be seen in Figure 5e. Another observation that can be seen in Figure 5e is the SOC dip experienced by the simulation (for both topologies) within the first sequence resulting in mismatched pack SOC minimums between the simulation and the Orion BMS. This can be attributed to the simulation taking into account the loss of individual battery charge due to each battery’s dissipative balancing current, whereas for the Orion BMS, since these currents do not pass through the current hall sensor, they are not registered as a loss in SOC when using the coulomb counting method. Furthermore, the mean squared error (MSE) between the results obtained from simulation and Orion BMS is calculated using Equation (3), where Y S i m u l a t e d ∈ simulated BMS’s pack SOC or pack voltage, and Y O r i o n ∈ Orion BMS’s pack SOC or pack voltage, for both topologies. The number of data points, k, used for this calculation are 36,830 and 74,220 for 1s1p and 1s2p topologies respectively.
MSE % = 100 % k j = 1 k ( Y S i m u l a t e d ( j ) Y O r i o n ( j ) ) 2
The results show that the MSE drops from 6.42% to 6.24% for voltage and from 13.7% to 10.09% for SOC when the topology is scaled-up from 6s1p to 6s2p.

6. Conclusions

Towards the emerging field of second-life batteries, this paper presents an experiment aimed at comparing the operational differences of a commercial passive balancing Orion BMS for two different battery pack topologies consisting of second-life batteries. An OPAL-RT real-time HIL testbed is used to feed the BMS’s sensors voltage, current, and temperature values from a Matlab/Simulink model, and the results from the simulation and the Orion BMS are compared. The recommendations based on the suggested outcomes for operating near-to-second life batteries using a passive BMS can be enumerated as follows:
(1) The disparity in SOC vs. OCV checkpoints, seen in Figure 3a, introduces SOC identification error. Thus, the default SOC adjustment algorithm’s checkpoint values in commercial BMSs must be analyzed and updated for every battery chemistry based on their applicable SOC-OCV test results, while also taking into consideration applicable battery models seen in Table 1, for every battery chemistry.
(2) As the simulated BMS voltages present a gradual increase up to the upper voltage threshold of 4.2 V (as seen in Figure 5b,d), the constrained operation thus keeps the battery within safe operation thresholds. Hence, Orion BMS would benefit from constrained cycling approaches depending on the state of individual battery parameters.
(3) SOC minimums and maximums in the Orion BMS frequently reach extremes, as seen in Figure 5e, and may signal early battery replacement. In addition, these extremes also appear to be influenced by balancing currents because of the visible dips in the first sequence. These dips could affect mid-range SOC calculations, which, as a result, might not trigger SOC adjustment algorithms. Hence, this further strengthens the requirement of operating commercial BMSs in a constrained cycling manner.
(4) As the Orion BMS only measures temperatures in increments of 1 °C, the results in Figure 5f do not present the complete temperature dynamics as opposed to the simulation BMS. Hence, increasing temperature measurement precision as well as taking into account the change in capacity resulting from thermal variations could improve the SOC calculations of the Orion BMS.
(5) The interleaved battery topology (6s2p) significantly decreased overshooting voltages at timestamps t 3 and t 7 , seen in Figure 5e and Table 3a. This suggests that lower target Δ V values can be implemented for scaled-up battery topologies. In addition, a scaled-up battery topology with higher capacity series components reduces the incurred error, as evident from the MSE reduction of 0.18% in the case of voltage and 3.61% in the case of SOC. A similar pattern can also be seen with the diminishing outliers evident in Figure 6.
Table 4 provides a comparison of literature works that use the commercially available Orion BMS. This includes it’s deployment application, the topology of the battery pack, the charge and discharge methodology, the discussed topics related to the Orion BMS, and the conclusions about the Orion BMS of each paper. Although other works provide insight into the balancing performance, protection capabilities, and a few operational details of the Orion BMS, none provide detailed operation of how balancing and SOC estimation algorithms work while providing substantial SOC estimation limitations and recommendations using varying battery topologies. The fact that several literature works have encountered SOC estimation issues suggests that, although inadequate SOC estimation has been previously reported on, conclusions (1), (3), (4) and (5) have identified some key areas for BMS research and improvement. Lastly, conclusion (2) moves the discussion on cycling limitations further by proposing that adaptability of BMSs may be the key to increased capacity utilization.
From the aforementioned conclusions and CHIL testing capabilities of the developed test bench, several future works are possible for expansion of BMS testing and optimization. Based on conclusions (1) and (2), the effectiveness of providing a BMS with the ability to take into account the effects of aging resulting from varying degrees of environmental and operational factors towards SOC estimation can be studied. As stated in conclusion (4), temperature variations can play a role in battery capacity and thus low temperature measurement accuracy may affect SOC determination of individual series cells. Therefore, varying temperature simulations in order to show cell SOC mismatches that may accompany low-temperature measurement accuracy as well as an analysis about their effects on battery health can be performed. Conclusions (3) and (5) suggest a study on the effectiveness of using adaptive balancing currents on separate batteries and varying scaled-up battery pack topologies may be useful for future BMS algorithm optimization. Lastly, conclusions (1) and (5) encourage the completion of a comparative study on the performance of varying battery pack configurations such as interleaved and non-interleaved configurations with several different battery chemistries which may indicate the capabilities of this commercial BMS for handling various applications.

Author Contributions

Conceptualization, A.K. and A.S.; methodology, A.K. and A.S.; validation, A.K. and A.S.; formal analysis, A.K. and A.S.; investigation, A.K. and A.S.; resources, A.I.S.; writing—original draft preparation, A.K. and A.S.; writing—review and editing, A.K. and A.S.; visualization, A.K. and A.S.; supervision, A.I.S.; project administration, A.I.S.; funding acquisition, A.I.S. All authors have read and agreed to the published version of the manuscript.

Funding

This work was supported by the National Science Foundation under Award No. 1553494 and by the Florida International University Graduate School Dissertation Year Fellowship.

Conflicts of Interest

The authors declare no conflict of interest.

References

  1. Deng, D. Li-ion batteries: Basics, progress, and challenges. Energy Sci. Eng. 2015, 3, 385–418. [Google Scholar] [CrossRef]
  2. Wei, L.; Sarwat, A.I.; Saad, W.; Biswas, S. Stochastic games for power grid protection against coordinated cyber-physical attacks. IEEE Trans. Smart Grid 2016, 9, 684–694. [Google Scholar] [CrossRef]
  3. Olowu, T.O.; Sundararajan, A.; Moghaddami, M.; Sarwat, A.I. Future Challenges and Mitigation Methods for High Photovoltaic Penetration: A Survey. Energies 2018, 11, 1782. [Google Scholar] [CrossRef] [Green Version]
  4. Debnath, A.; Olowu, T.O.; Parvez, I.; Sarwat, A. A Binary Search Algorithm based Optimal Sizing of Photovoltaic and Energy Storage Systems. In Proceedings of the 2021 IEEE Green Technologies Conference (GreenTech), Denver, CO, USA, 7–9 April 2021; pp. 563–568. [Google Scholar]
  5. Islam, A.; Domijan, A.; Damnjanovic, A. Assessment of the reliability of a Dynamic Smart Grid System. Int. J. Power Energy Syst. 2011, 31, 198–202. [Google Scholar] [CrossRef]
  6. Li, S.; Fan, Z. Encapsulation methods of sulfur particles for lithium-sulfur batteries: A review. Energy Storage Mater. 2021, 34, 107–127. [Google Scholar] [CrossRef]
  7. Li, S.; Leng, D.; Li, W.; Qie, L.; Dong, Z.; Cheng, Z.; Fan, Z. Recent progress in developing Li2S cathodes for Li–S batteries. Energy Storage Mater. 2020, 27, 279–296. [Google Scholar] [CrossRef]
  8. Li, S.; Jiang, J.; Dong, Z.; Wu, J.; Cheng, Z.; Zhu, H.; Fan, Z.; Wang, Y.; Leng, D. Ferroconcrete-inspired construction of self-supporting Li2S cathode for high-performance lithium–sulfur batteries. Microporous Mesoporous Mater. 2020, 293, 109822. [Google Scholar] [CrossRef]
  9. Propp, K.; Marinescu, M.; Auger, D.J.; O’Neill, L.; Fotouhi, A.; Somasundaram, K.; Offer, G.J.; Minton, G.; Longo, S.; Wild, M.; et al. Multi-temperature state-dependent equivalent circuit discharge model for lithium-sulfur batteries. J. Power Sources 2016, 328, 289–299. [Google Scholar] [CrossRef] [Green Version]
  10. Dharmasena, S.; Sarwat, A.I. Fuzzy Decision Making Assisted Model Predictive Direct Power Controller for a Grid-Interlinking Converter of a Battery Energy Storage System. In Proceedings of the 2020 52nd North American Power Symposium (NAPS), Tempe, AZ, USA, 11–13 April 2021; pp. 1–6. [Google Scholar]
  11. Saleem, D. Design considerations of a cryptographic module for distributed energy resources. In Proceedings of the CyberPELS 2019 Presentations, Knoxville, TN, USA, 15 May 2019. [Google Scholar]
  12. Saez-de Ibarra, A.; Martinez-Laserna, E.; Stroe, D.I.; Swierczynski, M.; Rodriguez, P. Sizing study of second life Li-ion batteries for enhancing renewable energy grid integration. IEEE Trans. Ind. Appl. 2016, 52, 4999–5008. [Google Scholar] [CrossRef] [Green Version]
  13. Martinez-Laserna, E.; Gandiaga, I.; Sarasketa-Zabala, E.; Badeda, J.; Stroe, D.I.; Swierczynski, M.; Goikoetxea, A. Battery second life: Hype, hope or reality? A critical review of the state of the art. Renew. Sustain. Energy Rev. 2018, 93, 701–718. [Google Scholar] [CrossRef]
  14. Hossain, E.; Murtaugh, D.; Mody, J.; Faruque, H.M.R.; Sunny, M.S.H.; Mohammad, N. A comprehensive review on second-life batteries: Current state, manufacturing considerations, applications, impacts, barriers & potential solutions, business strategies, and policies. IEEE Access 2019, 7, 73215–73252. [Google Scholar]
  15. Zhao, Y.; Pohl, O.; Bhatt, A.I.; Collis, G.E.; Mahon, P.J.; Rüther, T.; Hollenkamp, A.F. A Review on Battery Market Trends, Second-Life Reuse, and Recycling. Sustain. Chem. 2021, 2, 167–205. [Google Scholar] [CrossRef]
  16. Daowd, M.; Omar, N.; Van Den Bossche, P.; Van Mierlo, J. Passive and active battery balancing comparison based on MATLAB simulation. In Proceedings of the 2011 IEEE Vehicle Power and Propulsion Conference, Chicago, IL, USA, 6–9 September 2011; pp. 1–7. [Google Scholar]
  17. Deja, P. Tests of BMS Battery Management System with active and passive system of balancing the battery capacity. In IOP Conference Series: Materials Science and Engineering; IOP Publishing: Szczyrk, Poland, 2019; Volume 679, p. 012009. [Google Scholar]
  18. Einhorn, M.; Permann, R.; Kral, C.; Conte, F.; Guertlschmid, W.; Blochberger, T.; Kumpusch, R.; Fleig, J. Current equalization of serially connected battery cells for a possible second life application. In Proceedings of the 2011 IEEE Vehicle Power and Propulsion Conference, Chicago, IL, USA, 6–9 September 2011; pp. 1–5. [Google Scholar]
  19. Taylor, Z.; Akhavan-Hejazi, H.; Mohsenian-Rad, H. Power hardware-in-loop simulation of grid-connected battery systems with reactive power control capability. In Proceedings of the 2017 North American Power Symposium (NAPS), Morgantown, WV, USA, 17–19 September 2017; pp. 1–6. [Google Scholar]
  20. Lacap, J.; Park, J.W.; Beslow, L. Development and Demonstration of Microgrid System Utilizing Second-Life Electric Vehicle Batteries. J. Energy Storage 2021, 41, 102837. [Google Scholar] [CrossRef]
  21. Rezal, M.; Zulaikha, A.; Sabri, M.; Yusof, R.; Ridzwan, S. Orion Battery Management System (BMS) For Lithium-Ion Battery Pack. In Proceedings of the Colloquium of Education, Engineering & Technology (COLEET 2014) at Universiti Kuala Lumpur Malaysian Spanish Institute, Kulim, Kedah, Malaysia, 10 October 2014; pp. 80–86. [Google Scholar]
  22. Braco, E.; San Martín, I.; Berrueta, A.; Sanchis, P.; Ursúa, A. Experimental assessment of cycling ageing of lithium-ion second-life batteries from electric vehicles. J. Energy Storage 2020, 32, 101695. [Google Scholar] [CrossRef]
  23. Yusof, Y.; Adnan, M.F.M.; Guenther, R.; Zaman, M.H.M.; Ibrahim, A.A.; Ayob, A. Li-ion battery pack charging process and monitoring in electric vehicle. Appl. Mech. Mater. 2014, 663, 504–509. [Google Scholar] [CrossRef]
  24. Kollmer, J.D.; Biswas, S.K.; Bai, L.; Sarwat, A.I.; Saad, W. A hardware-in-the-loop experimental platform for power grid security. In Proceedings of the 2018 ASEE Annual Conference & Exposition, Salt Lake City, UT, USA, 24–27 June 2018; pp. 1–17. [Google Scholar]
  25. Hamidi, A.; Weber, L.; Nasiri, A. EV charging station integrating renewable energy and second-life battery. In Proceedings of the 2013 International Conference on Renewable Energy Research and Applications (ICRERA), Madrid, Spain, 20–23 October 2013; pp. 1217–1221. [Google Scholar]
  26. He, H.; Xiong, R.; Fan, J. Evaluation of Lithium-Ion Battery Equivalent Circuit Models for State of Charge Estimation by an Experimental Approach. Energies 2011, 4, 582–598. [Google Scholar] [CrossRef]
  27. Mousavi, G.S.; Nikdel, M. Various battery models for various simulation studies and applications. Renew. Sustain. Energy Rev. 2014, 32, 477–485. [Google Scholar] [CrossRef]
  28. Pang, S.; Farrell, J.; Du, J.; Barth, M. Battery state-of-charge estimation. In Proceedings of the 2001 American Control Conference, (Cat. No.01CH37148), Arlington, VA, USA, 25–27 June 2001; Volume 2, pp. 1644–1649. [Google Scholar]
  29. John, S. Modeling a Lithium-Ion Cell Using PLECS. Plexim GmbH, 2009. Available online: https://www.plexim.com/files/plecs_li-\thium_ion.pdf (accessed on 24 October 2021).
  30. Brando, G.; Dannier, A.; Spina, I.; Piegari, L. Comparison of accuracy of different LiFePO4 battery circuital models. In Proceedings of the 2014 International Symposium on Power Electronics, Electrical Drives, Automation and Motion, Ischia, Italy, 18–20 June 2014; pp. 1092–1097. [Google Scholar]
  31. Hussein, A.A.; Batarseh, I. An overview of generic battery models. In Proceedings of the 2011 IEEE Power and Energy Society General Meeting, Detroit, MI, USA, 24–28 July 2011; pp. 1–6. [Google Scholar]
  32. Hussein, A.A.; Batarseh, I. Experimental modeling and analysis of lithium-ion battery temperature dependence. In Proceedings of the 2015 IEEE Applied Power Electronics Conference and Exposition (APEC), Charlotte, NC, USA, 15–19 March 2015; pp. 1084–1088. [Google Scholar]
  33. Johnson, V.H.; Pesaran, A.A.; Sack, T. Temperature-Dependent Battery Models for High-Power Lithium-Ion Batteries. In Proceedings of the 17th Annual Electric Vehicle Symposium Presentations, Montreal, QC, Canada, 15–18 October 2000. [Google Scholar]
  34. Omar, N.; Widanage, D.; Abdel Monem, M.; Firouz, Y.; Hegazy, O.; Van den Bossche, P.; Coosemans, T.; Van Mierlo, J. Optimization of an advanced battery model parameter minimization tool and development of a novel electrical model for lithium-ion batteries. Int. Trans. Electr. Energy Syst. 2014, 24, 1747–1767. [Google Scholar] [CrossRef]
  35. Zhang, X.; Zhang, W.L.G. A review of li-ion battery equivalent circuit models. Trans. Electr. Electron. Mater. 2016, 17, 311–316. [Google Scholar] [CrossRef] [Green Version]
  36. Lu, L.; Han, X.; Li, J.; Hua, J.; Ouyang, M. A review on the key issues for lithium-ion battery management in electric vehicles. J. Power Sources 2013, 226, 272–288. [Google Scholar] [CrossRef]
  37. Barré, A.; Deguilhem, B.; Grolleau, S.; Gérard, M.; Suard, F.; Riu, D. A review on lithium-ion battery ageing mechanisms and estimations for automotive applications. J. Power Sources 2013, 241, 680–689. [Google Scholar] [CrossRef] [Green Version]
  38. Ramadesigan, V.; Northrop, P.W.; De, S.; Santhanagopalan, S.; Braatz, R.D.; Subramanian, V.R. Modeling and simulation of lithium-ion batteries from a systems engineering perspective. J. Electrochem. Soc. 2012, 159, R31. [Google Scholar] [CrossRef]
  39. Wehbe, J.; Karami, N. Battery equivalent circuits and brief summary of components value determination of lithium ion: A review. In Proceedings of the 2015 Third International Conference on Technological Advances in Electrical, Electronics and Computer Engineering (TAEECE), Beirut, Lebanon, 29 April–1 May 2015; pp. 45–49. [Google Scholar]
  40. Amrouche, S.O.; Rekioua, D.; Rekioua, T.; Bacha, S. Overview of energy storage in renewable energy systems. Int. J. Hydrogen Energy 2016, 41, 20914–20927. [Google Scholar] [CrossRef]
  41. Chen, M.; Rincon-Mora, G.A. Accurate electrical battery model capable of predicting runtime and I-V performance. IEEE Trans. Energy Convers. 2006, 21, 504–511. [Google Scholar] [CrossRef]
  42. Benveniste, G.; Rallo, H.; Casals, L.C.; Merino, A.; Amante, B. Comparison of the state of Lithium-Sulphur and lithium-ion batteries applied to electromobility. J. Environ. Manag. 2018, 226, 1–12. [Google Scholar] [CrossRef] [Green Version]
  43. Attanayaka, A.; Karunadasa, J.; Hemapala, K. Estimation of state of charge for lithium-ion batteries—A Review. AIMS Energy 2019, 7, 186–210. [Google Scholar] [CrossRef]
  44. Subburaj, A.S.; Bayne, S.B. Analysis of dual polarization battery model for grid applications. In Proceedings of the 2014 IEEE 36th International Telecommunications Energy Conference (INTELEC), Vancouver, BC, Canada, 28 September–2 October 2014; pp. 1–7. [Google Scholar]
  45. Zhao, X.; Cai, Y.; Yang, L.; Deng, Z.; Qiang, J. State of charge estimation based on a new dual-polarization-resistance model for electric vehicles. Energy 2017, 135, 40–52. [Google Scholar] [CrossRef]
  46. Salameh, Z.M.; Casacca, M.A.; Lynch, W.A. A mathematical model for lead-acid batteries. IEEE Trans. Energy Convers. 1992, 7, 93–98. [Google Scholar] [CrossRef]
  47. Chiang, Y.H.; Sean, W.Y.; Ke, J.C. Online estimation of internal resistance and open-circuit voltage of lithium-ion batteries in electric vehicles. J. Power Sources 2011, 196, 3921–3932. [Google Scholar] [CrossRef]
  48. Jaguemont, J.; Boulon, L.; Dubé, Y. A comprehensive review of lithium-ion batteries used in hybrid and electric vehicles at cold temperatures. Appl. Energy 2016, 164, 99–114. [Google Scholar] [CrossRef]
  49. Plett, G.L. Extended Kalman filtering for battery management systems of LiPB-based HEV battery packs: Part 2. Modeling and identification. J. Power Sources 2004, 134, 262–276. [Google Scholar] [CrossRef]
  50. Hu, X.; Li, S.; Peng, H. A comparative study of equivalent circuit models for Li-ion batteries. J. Power Sources 2012, 198, 359–367. [Google Scholar] [CrossRef]
  51. Zhang, C.; Li, K.; Mcloone, S.; Yang, Z. Battery modelling methods for electric vehicles—A review. In Proceedings of the 2014 European Control Conference (ECC), Strasbourg, France, 24–27 June 2014; pp. 2673–2678. [Google Scholar]
  52. Li, J.; Mazzola, M.S. Accurate battery pack modeling for automotive applications. J. Power Sources 2013, 237, 215–228. [Google Scholar] [CrossRef]
  53. Li, J.; Mazzola, M.S.; Gafford, J.; Jia, B.; Xin, M. Bandwidth based electrical-analogue battery modeling for battery modules. J. Power Sources 2012, 218, 331–340. [Google Scholar] [CrossRef]
  54. Kroeze, R.C.; Krein, P.T. Electrical battery model for use in dynamic electric vehicle simulations. In Proceedings of the 2008 IEEE Power Electronics Specialists Conference, Rhodes, Greece, 15–19 June 2008; pp. 1336–1342. [Google Scholar] [CrossRef]
  55. Tran, D.D.; Vafaeipour, M.; El Baghdadi, M.; Barrero, R.; Van Mierlo, J.; Hegazy, O. Thorough state-of-the-art analysis of electric and hybrid vehicle powertrains: Topologies and integrated energy management strategies. Renew. Sustain. Energy Rev. 2020, 119, 109596. [Google Scholar] [CrossRef]
  56. Kollmeyer, P. Panasonic 18650PF Li-Ion Battery Data. 2018. Available online: https://data.mendeley.com/datasets/wykht8y7tg/1 (accessed on 24 October 2021).
  57. Khalid, A.; Hernandez, A.; Sundararajan, A.; Sarwat, A.I. Simulation-based analysis of equalization algorithms on active balancing battery topologies for electric vehicles. In Advances in Intelligent Systems and Computing; Springer: Cham, Switzerland, 2019; Volume 1069, pp. 708–728. [Google Scholar]
  58. Madani, S.S.; Schaltz, E.; Knudsen Kær, S. Review of parameter determination for thermal modeling of lithium ion batteries. Batteries 2018, 4, 20. [Google Scholar] [CrossRef] [Green Version]
  59. Khalid, A.; Sarwat, A.I. Battery module performance analysis under varying interconnection topology for electric vehicles. In Proceedings of the 2019 IEEE Transportation Electrification Conference (ITEC-India), Bengaluru, India, 17–19 December 2019; pp. 1–5. [Google Scholar]
Figure 1. An illustration of the CHIL testbed setup and operation (middle and right), with the battery model used (left).
Energies 14 08037 g001
Figure 2. Simplified representation of 2-RC model equivalency.
Energies 14 08037 g002
Figure 3. (a) SOC vs. OCV plot for simulation and Orion BMS, (b) Simulation and Orion BMS Operational Flowchart.
Energies 14 08037 g003
Figure 4. CompleteUS06 current profile containing iterations, obtained from [56] out of which a ±1.5 A region is used in the sequence.
Energies 14 08037 g004
Figure 5. Plots for: Voltage equalization during (a) Simulation, and (b) Orion BMS operation, both for the 6s1p topology, (c) Simulation, and (d) Orion BMS operation, both for the 6s2p topology, (e) SOC% values and (f) Temperature values for both 6s1p and 6s2p topologies.
Energies 14 08037 g005
Figure 6. Box plots of simulation BMS and Orion BMS results for 6s1p and 6s2p topologies.
Energies 14 08037 g006
Table 1. List of Battery Models.
ModelsComponentsInputVariable FunctionsBattery Types SupportedSimulation Software Used
Internal ResistancesDiodesCapacitancesDC Source
Rint/Simple Battery Model [26,27,28,29,30] R 0 --CurrentOCV and R 0 -LithiumPLECS
Linear Model [31,32] R c , R d 2-Voltage, Current R c , R d , OCV, SOC, I L OCV(SOC)LithiumAdvisor
NREL SAFT 2-Capacitance/SAFT RC Model [26,33,34,35] R a , R e , R t - C a , C e Current R a , R 0 , R e , R t , V [ C a ] , V [ C e ] , I L R 0 , R a , R e ( S O C ) , O C V ( S O C ) , I L ( t ) LithiumMatlab, Pspice, Advisor
Thevenin Models and their Derivatives
Basic Thevenin Model [26,36,37,38,39,40,41,42,43] R 0 , R b 1 - C i 1 Voltage, Current C i 1 , R 0 , I L , V [ C i 1 ] , OCV, SOC I L ( t ) Lithium, Lead Acid, Nickel-Metal HydrideMatlab, Pspice
Dual Polarization/Second Order Model [26,39,44,45] R 0 , R p a , R p c - C p a , C p c Voltage, Current R 0 , R p a , R p c , C p a , C p c , I L , OCV I L ( t ) LithiumPSCAD, Matlab
First Order Model/Modified Thevenin Model [27,46,47] R 0 , R b 1 - C i 1 Voltage, Current C i 1 , R 0 , I L , V [ C i 1 ] , OCV, SOCOCV(SOC), I L ( t ) Lithium, Lead AcidAdvisor
Resistive Thevenin/Modified Simple Model/Modified Thevenin Model (Pang et al.) [27,28,31,39,48,49,50] R c , R d 2-Voltage, Current R c , R d , OCV, I L I L ( t ) Lead Acid, LithiumAdvisor
Reactive Battery Model/Modified Thevenin Model (Pang et al.) [27,28,48] R c , R d , R 0 2 C i 1 Voltage, Current R c , R d , V [ C i 1 ] , OCV, I L I L ( t ) Lead Acid, LithiumAdvisor
m t h Order Linear Parameter Varying/Electrical Analogue Model [39,51,52,53,54] R 0 , R b 1 , … R b m - C i 1 , … C i m Voltage, Current R 0 , R b 1 R b m , C i 1 C i m , OCV, SOC, I L OCV(SOC); R 0 (SOC), R b 1 (SOC), … R b m (SOC); C i 1 (SOC), … C i m (SOC); I L ( t ) Lithium, Lead Acid, Nickel-Metal HydrideMatlab
Table 2. Implemented battery pack topologies and and their corresponding specifications.
Simulation NumberTopologySequenceTarget Δ VCCUS06 Current Range
16s1pCC(7.5)-US(2)-CC(15)-US(3)-CC(22.5)-US(4)-
CC(30)-US(5)-CC(37.5)-US(6)-CC(45)-US(7)-
CC(52.5)-US(8)-CC(60)
50 mVC/2±1.5 A
26s2pCC(7.5)-US(2)-CC(15)-US(3)-CC(22.5)-US(4)-
CC(30)-US(5)-CC(37.5)-US(6)-CC(45)-US(7)-
CC(52.5)-US(8)-CC(60)-US(1) [Repeat Twice]
50 mVC/4±1.5 A
Labels: CC(t), where t = charge time in minutes; US(N), where N = Number of US06 iterations; C/ α = 2.75 Ah/ α C-rate, where α ∈ {2,4}.
Table 3. Δ values corresponding to time stamps t 0 , t 1 , t 2 , t 3 , t 4 , t 5 , t 6 , and t 7 for.
(a) 6s1p Topology
Time (in seconds) t 0 t 1 t 2 t 3
920718,41027,62036,830
Simulation Δ V0.4510.3140.2040.036
Orion BMS Δ V0.5610.4180.3170.042
(b) 6s2p interleaved topology
Time (in seconds) t 4 t 5 t 6 t 7
18,55037,11055,66074,220
Simulation Δ V0.5140.3870.2070.048
Orion BMS Δ V0.5840.5020.3170.049
(c) Simulation versus Orion BMS for both topologies
Time (in seconds) t 0 t 1 t 2 t 3
920718,41027,62036,830
Δ SOC 6 s 1 p 29.05%44.26%32.44%6.16%
Time (in seconds) t 4 t 5 t 6 t 7
18,55037,11055,66074,220
Δ SOC 6 s 2 p 38.65%35.06%27.53%8.06%
Table 4. List of Existing Literatures using Orion BMS.
LiteratureApplicationTopologyCycling ApproachOrion BMS Functionality DiscussedConclusion(s)
Dega et al. [17]Functional
Testing
224s1pCharge: CC of 0.3C
Discharge: Varying load
current values ranging from
0.5C to 1.1C
  • Balancing during charging and discharging for several currents
  • Over voltage and over temperature protection relays
  • Active Balancing can provide faster battery balancing with minimal heat loss.
  • Financial constraints may hinder the implementation of active balancing BMSs.
Taylor et al. [19]Grid-Support12s1pCharge: C/10 for 10.5 h
Discharge: 1C max based on
PQ support required.
  • Voltage monitoring and protection relays
  • Minimum voltage for balancing thresholds
  • Presents a few SOC estimation limitations
  • SOC estimation algorithms may be calibrated over the lifetime of a battery.
  • A low balancing current may reduce overall battery pack capacity.
Lacap et al. [20]Grid-Support108s16pCharge: CC-CV load leveling
with approximately 0.2C CC.
Discharge: CC peak shaving
at less than 0.2C.
  • SOC and voltage acquisition accuracy limitations
  • Protection capabilities and control of relays
  • Improper battery system component analysis as well as current ripples may reduce SOC estimation accuracy.
  • Improved SOC estimation algorithms will improve battery operation windows.
Rezal et al. [21]Functional
Analysis
26s2pCharge: None
Discharge: None
  • Orion BMS specific hardware configuration
  • Orion BMS specific software configuration
  • Operational summary of Orion BMS has been provided.
Yusof et al. [23]EV26s2pCharge: CC-CV at approx-
imately 0.3 CC.
Discharge: 18.27 km of EV
driving at varying C rates.
  • Balancing performance during charging and discharging
  • BMS hardware configuration within an EV
  • The Orion BMS may be used in order to send information signals to external controllers.
This paperEV6s1p,
6s2p
Charge: Increasing duration
intervals of CC at C/2 and
C/4 for 1s1p and 2s2p
respectively. (1.375 A each)
Discharge: Increasing dura-
tion intervals of the US06
drive profiles.
  • Operational specifics of balancing and SOC estimation algorithms
  • Details SOC estimation limitations and recommendations
  • Varying topology BMS monitoring and balancing performance
  • The ability to be used within a testbed for system/controller validation.
  • Primary and secondary Orion SOC algorithms may be insufficient for SOC estimation in second life applications.
  • BMSs may benefit from regularly updated tertiary algorithms that account for degradation factors, thermal capacity variations, and usage patterns.
  • Scaled-up battery packs utilizing smaller Δ V target values allow for increased usable capacity.
Publisher’s Note: MDPI stays neutral with regard to jurisdictional claims in published maps and institutional affiliations.

