Article

Wind Tunnel Experiments on Interaction between Two Closely Spaced Vertical-Axis Wind Turbines in Side-by-Side Arrangement

1
Department of Mechanical Engineering, Kagawa National Institute of Technology (KOSEN), Kagawa College, 355 Chokushi, Takamatsu 761-8058, Japan
2
Faculty of Engineering, Tottori University, 4-101 Koyama-Minami, Tottori 680-8552, Japan
*
Author to whom correspondence should be addressed.
Energies 2021, 14(23), 7874; https://doi.org/10.3390/en14237874
Submission received: 25 October 2021 / Revised: 19 November 2021 / Accepted: 20 November 2021 / Published: 24 November 2021
(This article belongs to the Special Issue Wake, Energy, and Heat 2021)

Abstract

:
This study aimed to determine the optimal rotor spacing of two vertical-axis wind turbines, which are simulated by miniature models arranged side-by-side with a relatively low aspect ratio. Wind tunnel experiments with a pair of 3-D printed model rotors were conducted at a uniform velocity. A series of experiments were conducted involving both incremental adjustments to the rotor gaps, g, and the rotational direction of each rotor. Increases in the power and the related flow patterns were observed in all three arrangements: Co-Rotating (CO), Counter-Up (CU), and Counter-Down (CD). The maximum phase-synchronized rotational speed occurs at the narrowest gap in the CD arrangement. Meanwhile, local maxima arise in the CO and CU arrangements at g/D < 1, where D is the rotor diameter. From an engineering perspective, the optimal rotor spacing is g/D = 0.2 with the CO arrangement, using the same two rotors rotating in the same direction. Based on flow visualization using a smoke-wire method at a narrower gap opening of 0.2D, the wake width in the case of the CU arrangement was remarkably narrower than those obtained in the CO and CD arrangements. In the CU arrangement, a movement towards the center of the rotor pair of the nominal front-stagnation point of each rotor was confirmed via flow visualization. This finding explains a reduction tendency in the rotational speed of the rotors via a reduction in the lift in the CU arrangement.

1. Introduction

Experimental evidence concerning the optimal rotor spacing between two vertical-axis wind turbines, abbreviated to VAWTs, is required to help fulfill our enormous global energy requirements. This study determines the optimal rotor spacing in side-by-side arrangement of a pair of turbines with the widely used aspect ratio of ~1. Although the augmentation of the power by using a pair of counter-rotating VAWTs had been known, at the latest, in 2004 by the Patent of Thomas, Dabiri [1] firstly proposed and investigated a wind farm in which a lot of pairs of counter-rotating VAWTs were arrayed like a fish schooling. He demonstrated a power density 6–9 times larger than that of modern wind farms that utilize horizontal-axis wind turbines.
Zanforlin and Nishino [2] described the mechanism of enhanced power generation by closely spaced VAWTs by two-dimensional (2-D) numerical simulation. They reported that, “for the case of two turbines arrayed side-by-side with respect to the incoming wind, the change of lateral velocity in the upwind path make the direction of local flow approaching the turbine blade more favourable to generate lift and torque”. The studies by Dabiri [1] and Zanforlin and Nishino [2], however, do not contain a co-rotating configuration.
To address the above issue on co-rotating configuration, De Tavernier et al. [3] used a double-rotor VAWT configuration for their parametric study of a two-dimensional panel/vortex model used also by Ferreira [4]. Their research demonstrated that using two rotors in close proximity increased the power performance [3]. They defined three different double-rotor VAWT layouts: (1) Co-Rotating (CO), (2) Counter-Up (CU), and (3) Counter-Down (CD). Their study concluded that: “the counter-up configuration seems to be the best performance configuration”. This conclusion is in opposition to the result obtained by Zanforlin and Nishino [2], which reports better performance in CD arrangements.
Recently, Hara et al. [5] in our research group conducted a 2-D numerical analysis on the dynamic interaction between two closely spaced VAWTs, where changes in the rotational speed of each rotor could occur as a result of both the interaction between the two rotors and the interaction between each rotor and its surrounding fluid flow. The simulation produced the key results: (1) two closely arranged VAWTs enhanced the power output in the order of CD > CO > CU, and (2) the CO with a gap equal to the rotor radius (0.5D) is most effective with a bidirectional wind. Since the flow around the VAWTs is three-dimensional, there exists the possibility of discrepancy between the 2-D simulation [5] and the actual flow. The significance of three-dimensional effects on VAWT wakes has been verified using a new volumetric particle-tracking velocimetry method (Wei et al. [6]).
Considering the studies above, this paper investigates the interaction between two closely spaced VAWTs in a side-by-side arrangement. This study aimed to determine the optimal rotor spacing for VAWTs, via wind tunnel experiments using miniature models assuming application to variable-speed small VAWTs. The results are in good agreement with the CFD results obtained by Hara et al. [5]. In particular, phase-synchronized rotation for CD and remarkable changes in the wake width and stagnation point for CU were found.

2. Methods

2.1. Configuration of Flow Field

The wind tunnel experiments were conducted at the National Institute of Technology (KOSEN), Kagawa College. The wind tunnel has a 4000-mm-long rectangular section (the turbulent intensity in the freestream is about 0.1%, Jodai et al. [7]) with an outlet area 600-mm-wide × 350-mm-high. The model rotors were printed in polylactic acid on a 3-D printer, and the surfaces were smoothed with sandpaper. The rotor of the miniature wind turbine model is presented in Figure 1b. This is a scaled-down model of a Butterfly Wind Turbine (BWT) shown in Figure 1a with a rotor diameter of 7 m (Hara et al. [8] and Hara [9]), which features an armless rotor with looped blades. A BWT is a lift-type VAWT, suitable for electric power generation, with straight-blade portions like an H-Darrieus wind turbine, although a BWT has a unique rotor shape intended to achieve low cost and high performance. The diameter D and the height H of the miniature model are 50 mm and 43.4 mm, respectively. Because the utilized 3-D-printed model is symmetrical with respect to the equatorial plane, it can be used in both directions by flipping it upside down. The cross section of the model at the equatorial plane shown in Figure 1c is the same as that used in the simulation by Hara et al. [5], except the 18-mm-diameter hub supporting the blades. Here, the chord length c is 20 mm, the blade cross section is NACA 0018, and the blade number B is 3. We chose NACA 0018 airfoil for our experiments for two reasons: (1) this symmetric blade section has been widely used in VAWTs due to as a good balance between aerodynamic performance and structural strength (Timmer [10]), and (2) the aerodynamic characteristics of the airfoil can be obtained over a wide range of Reynolds numbers and angles of attack (Kumar et al. [11]). We selected three-bladed VAWTs, which have the advantages of a better torque ripple, better structural dynamics, and lower energy fluctuations for each revolution (Islam et al. [12]). The experiments were conducted on a pair of two rotors in a side-by-side arrangement at a uniform velocity V = 10 m/s (2 or 1 m/s in visualization) in the open space after the wind tunnel exit. The blockage ratio of a pair of the miniature models, placed 150 mm downstream of the wind tunnel exit, is about 2.0%. The Reynolds number based on the rotor diameter D, the tip speed ratio at a rotational speed of 3000 rpm, and the solidity were ReD = 3.3 × 10⁴, λ = 0.785, and σ = 0.382, respectively. The Reynolds number based on the chord length c was Rec = 1.3 × 10⁴. The error in the rotational-speed measurements of the model is ±10 rpm, which corresponds to 0.36%, 1.8%, and 3.6% of the rotational speed of a single rotor at uniform velocities of 10, 2, and 1 m/s, respectively. The six gap ratios (g/D = 0.1, 0.2, 0.3, 0.5, 1.0, and 2.0, where g = 5, 10, 15, 25, 50, and 100 mm are the space between the two rotors) were tested. Since the thickness of the blade was 3.8 mm, the actual clearance between the surfaces of the two rotors was just 1.2 mm (0.024D) in the case of the smallest gap of g = 5 mm (g/D = 0.1). As far as we know, the present g/D = 0.1 is the smallest gap ratio reported based on a wind tunnel experiment for the closely spaced VAWTs arranged side-by-side.
Figure 2 shows three layouts against a wind direction of a closely spaced VAWT pair in accordance with De Tavernier et al. [3] (see Section 1). In the Co-Rotating (CO) layout, the two rotors turn in the same rotational direction as illustrated in Figure 2a, in the Counter-Up (CU) layout the blades move upwind in the gap as shown in Figure 2b, and in the Counter-Down (CD) layout the blades move downwind in the gap as indicated in Figure 2c. Rotor 1 and Rotor 2 are denoted by R1 and R2, respectively. The coordinate of x represents the wind direction perpendicular to the double-rotor array (side-by-side) and the coordinate of y represents the direction normal to x, respectively. The red arrows indicate the rotational directions of the rotors. Spanwise direction z (not shown) is defined as the direction normal to the x-y-plane. The closed and open circles indicate clockwise and counterclockwise direction. Table 1 compares the parameters of related studies with ours. The angular velocity of the rotor is denoted by ω.

2.2. Characteristics of Single Rotor Configuration

The aim of this subsection is to specify the properties of the model turbine and its starting characteristics. Figure 3a shows the torque characteristics of a wind turbine. The torque Q was measured at Tottori University in advance. The detail of the torque measurement is shown in Appendix A.
In the present experiments, a direct current motor (KIT, MT1415: Tokyo, Japan) was used to start the rotation of a turbine in a uniform wind. As mentioned later, after an operation as a wind turbine generating a positive torque was established, the motor’s circuit was opened (i.e., no electric current flows in the motor). Then, each rotor can revolve at a condition in which the rotor torque and the load torque become equal. In Figure 3a, the red curve indicates the motor load torque with no current; this is approximated in Equation (1) as QL_EXP (mN m). The intersections of the turbine torque curves and the motor torque curve show the expected operating condition in the wind tunnel experiments. In the case of 10 m/s, the corresponding angular velocity ω is 330.2 rad/s (rotational speed N = 3153 rpm). Figure 3b,c shows the variation in the torque coefficient Cq and the power coefficient Cp with the tip speed ratio λ. Although the model turbine has its maximum power coefficient at less than one in tip speed ratio due to the small size, the torque performance indicates the nature of lift-type turbine, i.e., worse starting nature. The relationship between the rotational speed and the motor power (power of the model turbine in equilibrium) is shown in Figure 3d, where the red circles are interpolated points from the experiment. The approximated black curve in Figure 3d is expressed by Equation (2). The present experiments are equivalent to the operation of variable-speed small VAWTs.
Q L _ E X P   [ mN   m ] = 0.1757 ( ω   [ rad / s ] 1000 ) 2 + 0.0075 ( ω   [ rad / s ] 1000 ) + 0.1998
P   [ mW ] = 0.2047 ( N   [ rpm ] 1000 ) 3 + 0.0442 ( N   [ rpm ] 1000 ) 2 + 21.042 ( N   [ rpm ] 1000 ) 0.0851
Figure 4 contains the starting characteristics of a single 3-D-printed experimental rotor. The model’s rotational speed N (rpm) in Figure 4a was measured using a non-contact type digital tachometer (Ono Sokki, HT-4200: Yokohama, Japan) with an accuracy of ±1 rpm, spaced 250–300 mm apart from rotors. Meanwhile, the tip speed ratio λ = /V = R(2πN/60)/V defined in Table 1 is shown in Figure 4b. The closed circles indicate the rotational speeds when a dry battery supplied power to the start-up motor (Motor ON), whereas the open circles indicate the rotational speeds when the power supply was terminated after the activation of the turbine (Motor OFF). By referring to Figure 4, it is evident that the turbine continues to rotate at a sufficiently high speed (more than 90% of that with a power supply) without a continuous power supply when the wind speed is more than 10 m/s. Therefore, a wind speed of 10 m/s was used to measure the rotor speed in this study.
The relatively low value for Cp and λ is attributed to the high solidity of the present 3-bladed miniature rotor (BWT) with a rotor diameter of 0.05 m and the deteriorated aerodynamic performance of the blades due to the low Reynolds number (approximately 104). Note that the maximum power coefficient of 0.415 at the tip speed ratio of 3.7 in the case of 8 m/s is predicted for a 5-bladed large BWT by Hara et al. [8].

2.3. Experimental Setup of a Pair of VAWTs

Figure 5 shows the mean-flow-velocity distribution in the y-direction along which the rotors are aligned. The origin of the y-axis corresponds to the center of the two rotors. We confirmed uniformity within the range of −80 < y (mm) < 75 (Figure 5). This 155-mm uniform range covers the full width, including a pair of two rotors (2D = 100 mm) and the maximum gap of 50 mm.
Figure 6 shows the experimental setup of a pair of 3-D-printed VAWT models with a 5-mm gap, viewed from downstream. Rotor 1 and Rotor 2 are configured relative to the wind direction, which corresponds to that in Figure 2. The rotors can easily be moved along the rail in the ±y direction to obtain the required spacing between the two rotors. In addition to measuring the rotors’ rotational speed, the flow pattern around the VAWTs was visualized using a smoke-wire method at wind speeds of 1.0 or 2.0 m/s (λ = 0.785, ReD ~ 3.0 × 10³ (N = 300 rpm) or ReD ~ 6.0 × 10³ (N = 600 rpm)). A stainless-steel wire (diameter of 0.2 mm) was horizontally set 1D upstream of the center of the double-rotor array, as shown in Figure 7. A direct current pulse of 500 ms at 300 V was supplied to the wire located at the center (z/D = 0) of the turbine height by a smoke pulse generator (Sugawara, MS-405: Kawasaki, Japan). The streak lines were captured by a high-speed camera (Kato Koken, k-II: Isehara, Japan) at 100 frames per second (fps).

3. Results and Discussion

3.1. Rotational Speeds and Power of Closely Spaced VAWTs

Figure 8 shows the variation in the rotational speed N [rpm] with the gap between the two rotors, 
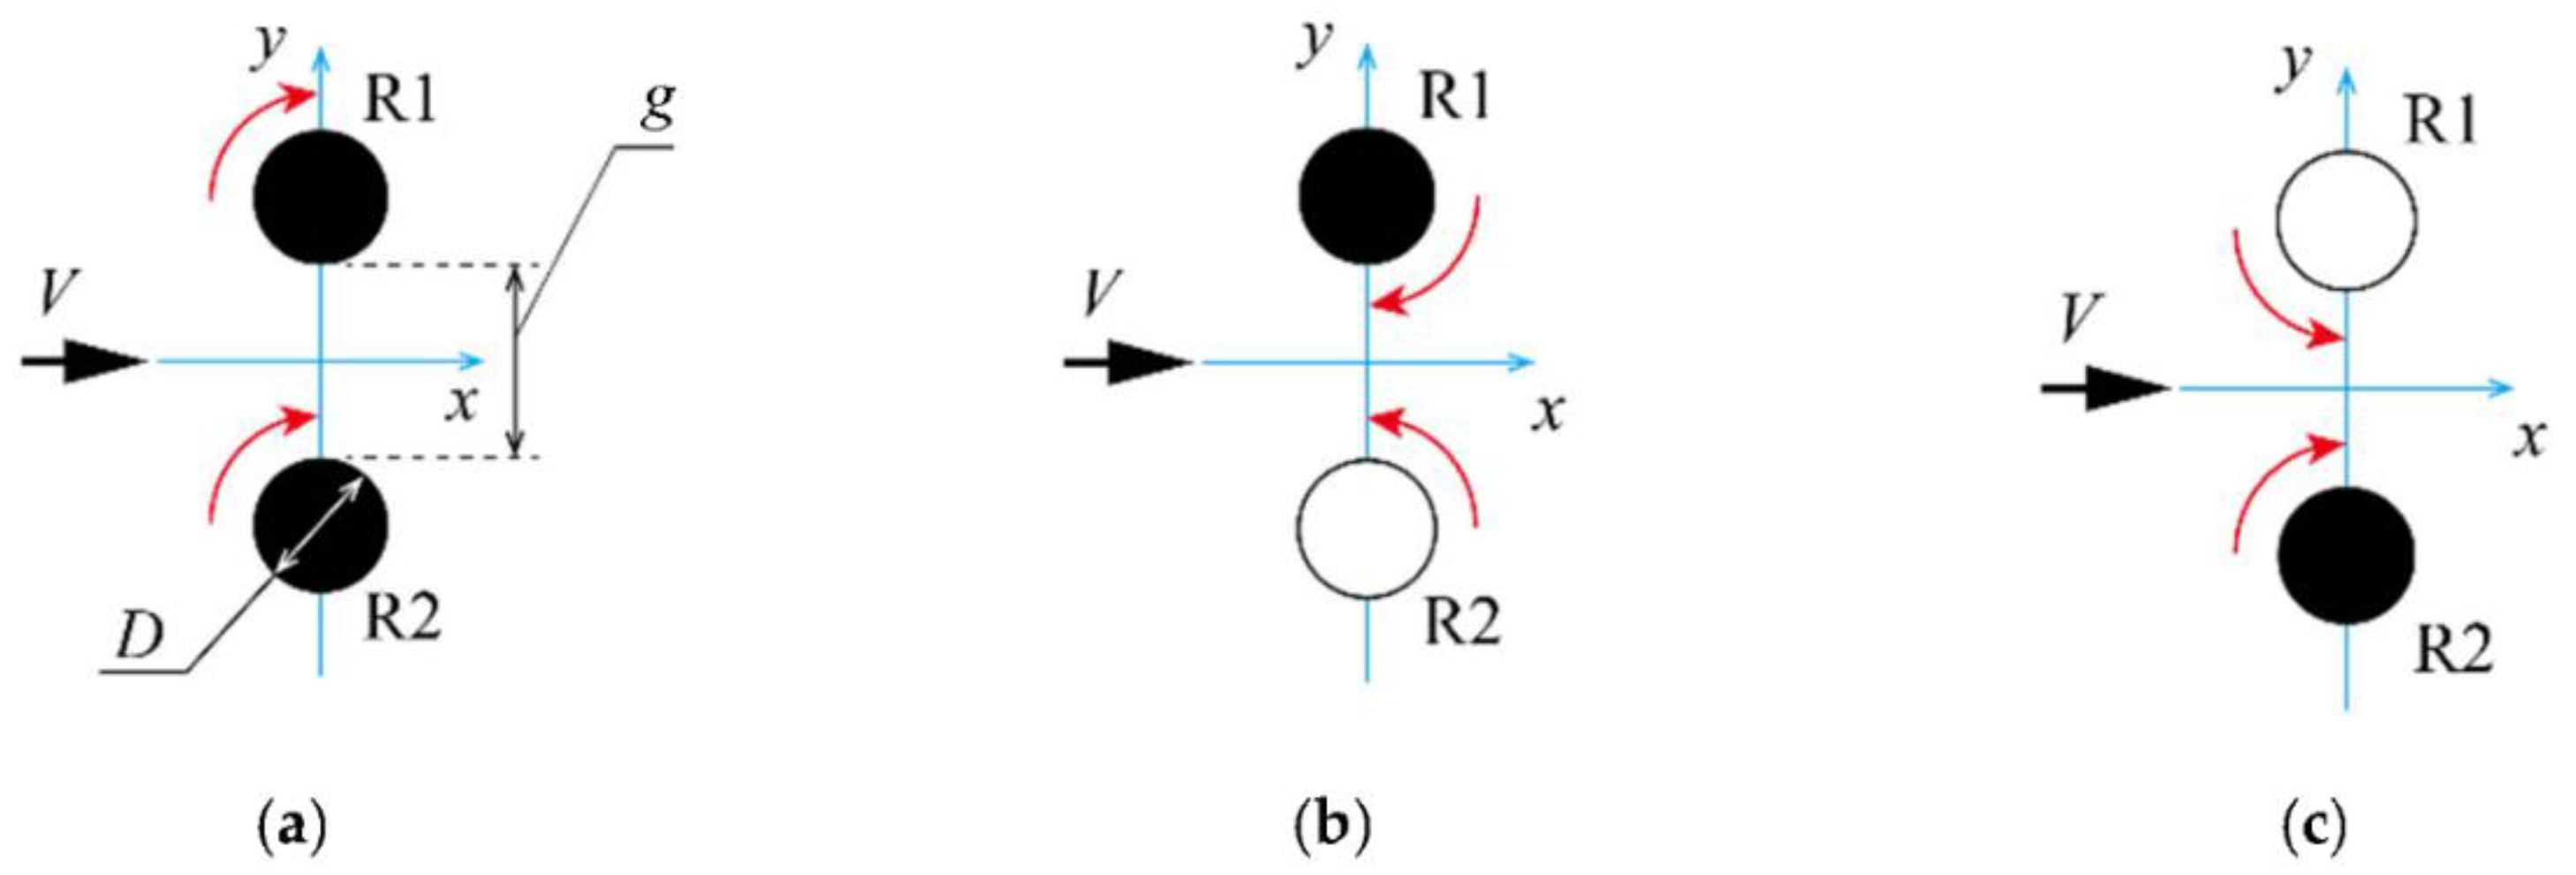
g. The results for the CO, CU, and CD configurations are presented in Figure 8a–c, respectively. We define the average rotational speed of rotors (Rotor 1 and Rotor 2) as Nave. In the experimental rotor, the achieved rotational speed depended on subtle differences in alignment between the turbine rotor and the direct current motor. The free rotational speed in the case of the single-rotor NSI was carefully adjusted 2720 ± 10 rpm at y = 0 mm (see Figure 4), just before each double-rotor experiment. This is the most difficult task for the experiment, and it usually takes half a day. The rotational direction of each rotor is the same as in Figure 2. The values of Nave were 2763 rpm, 2733 rpm, and 2770 rpm at g/D = 2.0 for CO, CU, and CD, respectively. The rotational speed of the isolated rotor obtained in the experiments was lower than the value (3153 rpm) expected from the results presented in Figure 3. This may be attributed to differences in the turbulent intensities of the wind tunnels in different institutes, in addition to the subtle differences in alignment. Since the turbulent intensity (T.I.) in the freestream has a possibility to improve the blade aerodynamic efficiency by increasing the lift-to-drag ratio (as suggested by Ahmadi-Baloutaki et al. [13] based on Devinant et al. [18]), the isolated model rotor may rotate at higher speed with the wind tunnel at the Tottori university (T.I. < 5%) compared with the experiments at the Kagawa college (T.I. < 2%).
First, in the CO configuration in Figure 8a, the rotational speed of Rotor 1 (R1) increased as the gap decreased. An increase in the power of Rotor 1 was indicated by acceleration. The maximum increase in the rotational speed reached 6.3% of NSI. Meanwhile, in Rotor 2 (R2), there was little change in the rotational speed with a decreased gap, except in the case of the smallest gap. The maximum decrease in the rotational speed of Rotor 2 reached 1.5% of NSI. Note that the speed of Rotor 1 is always higher than that of Rotor 2. This is in good agreement with the CFD results obtained by Hara et al. [5]. Between the two VAWTs, the blades of Rotor 1 proceed in the opposite direction (negative x-direction) to the gap flow (x-direction), whereas the rotational direction of the blades of Rotor 2 is the same as the gap flow. The higher rotational speed of Rotor 1 can be explained by the strong induced velocity caused by Rotor 2 (see reference De Tavernier et al. [3]). The sharp reduction in the rotational speed of Rotor 2 at the minimum gap is attributed to the induced velocity of Rotor 1. The increase in the average rotational speed of the two turbines corresponds to the power density, which is defined as the power output per unit land area.
Second, in the CU configuration in Figure 8b, the rotational speeds of both Rotor 1 and Rotor 2 slightly increase with the decreasing gap until it reaches g = 25–50 mm. Conversely, with a reduction in the gap of less than 25 mm, both rotors start to decelerate. As a whole in the CU configuration, compared with the cases of CO and CD, the rotational speeds of Rotor 1 and Rotor 2 do not change much with a decrease in gap until the smallest gap examined. This indicates the insensitivity of the rotational speed of the CU configuration against gap variation. Note that the almost constant difference in rotational speeds between Rotor 1 and 2 is attributed to the individual difference of rotors and slight miss-alignment.
Last, in the CD configuration presented in Figure 8c, both Rotor 1 and 2 demonstrate a significant increase in the rotational speed with a decrease in gap until the smallest gap tested is reached. The most interesting finding is the “phase-synchronized rotation” (Jodai et al. [19]; Hara et al. [20]; Hara and Jodai [21]) between both rotors when the gap is equal to or less than 15 mm (g/D ≤ 0.3), as a result of the dynamic interaction between VAWTs. The synchronized rotation has also been reported by Vergaerde et al. [15] based on an experiment at g/D = 0.3 using two-bladed Darrieus turbines with NACA 0018 airfoil. Vergaerde et al. [15] explained the synchronization that the rotational speeds equalize, and the phase difference between both rotors converges consistently to a mean value. In our experiments, the maximum rotational speed at g/D = 0.1 reached 113% of NSI. To the best of our knowledge, this is the first experiment to show a steep rise in the rotational speed in the extreme gap of g/D = 0.1 accompanied by the phase-synchronization. Note that this synchronism automatically occurs after 30–120 s (the rotational speeds of both Rotor 1 and 2 increase gradually during the time period), depending on the gap and the initial rotor speeds. This suggests that a relatively long simulation time is necessary to replicate the synchronistic effect in an unsteady CFD for solving dynamic interaction.
Recently, the CFD results obtained by Hara et al. [5] revealed a relatively large fluctuation in the rotational speeds of both rotors with the ‘opposite phase’ (the blades move downwind in the gap region simultaneously) in the case of CD configuration with a short gap of g/D = 0.2. These are the first reproduction of the phase-synchronization of two VAWT rotors via CFD analysis. They also demonstrated phase-synchronization in the case of g/D = 0.3 of the CU layout, though phase-synchronization was not observed in the CD layout with g/D = 0.3. More details of the mechanism of phase-synchronization generation are given in the paper by Hara et al. [5].
Next, we examine the normalized rotational speed Nnorm and the normalized power Pnorm based on the average rotational speed Nave and the average power Pave, and clarify the effects of the double rotor configuration. Here, Nnorm and Pnorm are defined in Equations (3) and (4), respectively. Note that Pave and the power in the case of the single-rotor PSI are obtained using Equation (2).
N n o r m = N a v e N S I
P n o r m = P a v e P S I
Figure 9 shows the gap dependence of Nnorm and Pnorm of a pair of VAWT models arranged side-by-side. The gap between the two rotors (g on the abscissa) is also nondimensionalized with the diameter of each rotor D. Regardless of the layout type, as the gap decreased, the normalized rotational speed (Figure 9a) and the normalized power (Figure 9b) increased gradually until g/D reached 0.5–1.0. This supports the findings obtained by Hara et al. [5] via CFD analysis (normalized power is shown in Figure 9c). For CO, the maximum increase in the normalized rotational speed Nnorm occurs at g/D = 0.2–0.5, which is 4–5% of the NSI (Figure 9a). For CU, the maximum increase in Nnorm is only 2% of the NSI. The decreasing tendency of Nnorm and Pnorm at a narrower gap for CU is important, which is also consistent with the CFD result by Hara et al. [5]. On the other hand, Nnorm for CD shows a significant increase at g/D < 0.5 and the maximum increase in Nnorm or in Pnorm occurs at g/D = 0.1, which is 13% of the NSI or 15% of the PSI.
Therefore, in order to obtain higher power generation using the acceleration of the closely arranged VAWTs, the gaps of g/D ≤ 0.5 for CO and CD are recommended. Comparing the values of the normalized rotational speeds or the normalized power shown in Figure 9a,b, the relation CD > CO > CU is evident, which is in agreement with the CFD result at the narrowest gap by Hara et al. [5] shown in Figure 9c. Zanforlin and Nishino [2] obtained the same relation (CD > CU) via CFD analysis using 2-D rotors with a medium solidity σ = 0.102 (Table 1).
This differs significantly from the result reported by De Tavernier et al. [3] with a small solidity (σ = 0.032), where CU was identified as best configuration (see Figure 8 in De Tavernier et al. [3]; at g/D = 0.2, the power coefficient for CU was the highest, and that for CD was the lowest). Our result, showing higher rotational speeds for CD than for CU at g/D < 0.5, is also in opposition to the result obtained by Vergaerde et al. [15], in which the power coefficient for CU was higher than that for CD at g/D = 0.3 (see their Figure 7). Note that Vergaerde et al. [15] reported only the case of g/D = 0.3, which may not be sufficiently small to realize a strong synchronization for their experiments. The discrepancy could be attributed to the differences in solidity. According to the references (Ahmadi-Baloutaki et al. [13]; Thomas [22]), high solidity wind turbines (such as σ = 0.382 in our study compared to a small solidity, whose value is unknown, of Vergaerde et al. [15]) can increase the duration that blades spend in the gap region between two counter-rotating turbines. This may explain the aforementioned significant increase in Nnorm for CD in our study. The solidity σ = Bc/(πD) in Vergaerde et al. [16] is 0.064, though they do not cite their earlier study (Vergaerde et al. [15]). In future, our experimental results should be validated by using larger turbine models with low solidity.
Incidentally, it is worth noting that the power of CO is higher than the averaged power of CU and CD as shown in Figure 9b, except for the case of g/D = 0.1. This supports the finding of our recent CFD results that the co-rotating pair yielded a higher output power than the counter-rotating pair under ideal bidirectional wind conditions (Table 1 in Hara et al. [5]). Therefore, we propose using a low-cost CO configuration in the field in cases of bidirectional wind, such as strong accelerated flow between high-rise buildings, rather than CD or CU configurations.
In summary for unidirectional wind, a clearance of g/D = 0.2 is recommended on VAWTs in a side-by-side arrangement, if significant deceleration or acceleration due to misalignment in the field of wind-power generation at g/D = 0.1 for CO or CD is undesired. Here, the values of Nnorm (corresponding Pnorm) by the VAWTs at g/D = 0.2 are 1.047 (1.054) and 1.063 (1.073) for CO and CD, respectively. Consequently, one of the best configurations is CO at g/D = 0.2 using the same two rotors rotating in the same direction if reducing engineering costs is the first priority (reducing the manufacturing and installation costs while maintaining a raised power of more than 5%).
Among some related studies on the interaction between two Savonius turbines (drag-type, e.g., Shigetomi et al. [23]; Shaheen et al. [24]), Ogawa et al. [25] experimentally reported an increase in turbine power in the order of CD > CO > CU. Table 2 compares the normalized power Pnorm by Ogawa et al. [25] with our studies using a Butterfly Wind Turbine (BWT). The values of Pnorm in Table 2 for CU at g/D = 0.5 fit well with each other. Shigetomi et al. [23] reported extra power production using particle image velocimetry and explained the mechanism in connection with the pressure coupling or change in mean velocity. The error in the free rotational speeds of their models with 40 mm diameter was 180 rpm (13.6% of the average speed of 1327 rpm). Note that our corresponding difference of 10 rpm (0.36% of mean velocity, see Section 2.1) was strictly imposed on our model with a 50 mm diameter. Although Shaheen et al. [24] concluded that the optimum gap distance is 0.2D in a CO arrangement based on CFD, counter-rotating configurations have not been reported.

3.2. Flow Pattern around the VAWTs

Figure 10 shows the photographs taken by the smoke-wire method around the two rotors without rotation. The gap between Rotor 1 (above in Figure 10) and Rotor 2 (below in Figure 10) is g = 10 mm. The dotted curves indicate the cross section of the turbine blades at the equatorial plane (these curves are not precisely represented in scale and angle). This arrangement corresponds to the CD configuration, although the rotational speed is zero. The black area marked by a letter A at t = 0.15 s (streak fronts are slightly left) in Figure 10a shows the flow separation at the blade painted out in red. Figure 10a also includes an enlarged inset that shows the area in which A is contained. Here, t = 0 s is recorded as the time when streaks left the wire. The area marked by a letter B at t = 0.21 s (the streak fronts are in the middle) in Figure 10b is the domain that corresponds to A, which has been flown down. The large vortex-like areas marked by letters C and D at t = 0.27 and 0.33 s, respectively (the streak fronts are slightly right and right, respectively), in 
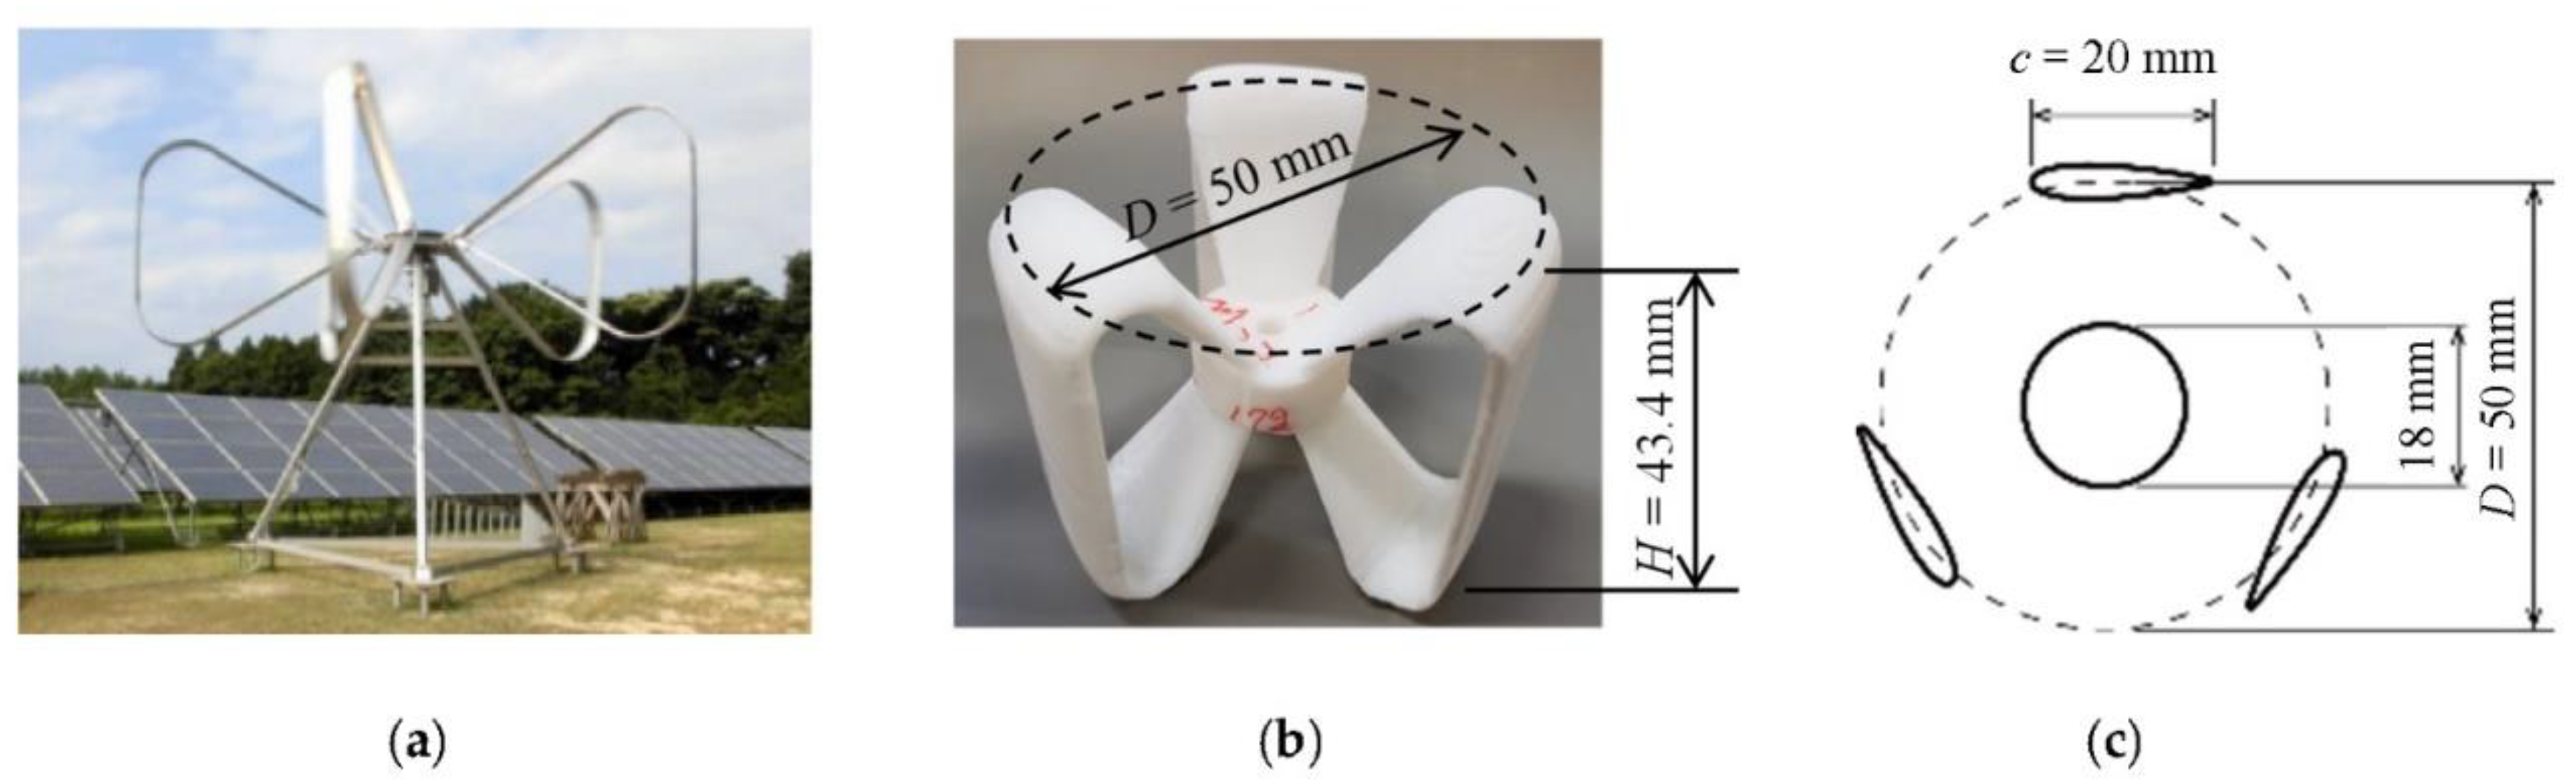
Figure 10c,d are the areas that correspond to B, but are enlarged toward the lower right. The appearance period of area A is about 0.03–0.04 s (around 30 Hz). Since the Strouhal number based on the blade chord length (c = 20 mm) and the uniform wind velocity (V = 1 m/s) is about 0.6, the vortex shedding from A is not the result of roll-up shedding from a bluff body (lower turbine, Rotor 2) with a diameter of D = 50 mm (expecting 4.2 Hz), considering that the Strouhal number of a circular cylinder is about 0.21 at the Reynolds number (e.g., Schlichting [26]). Now, we call the outside of B, C, and D areas as ‘undulating shear layers’. On the other hand, the streaks that pass between the two turbines seem relatively smooth.
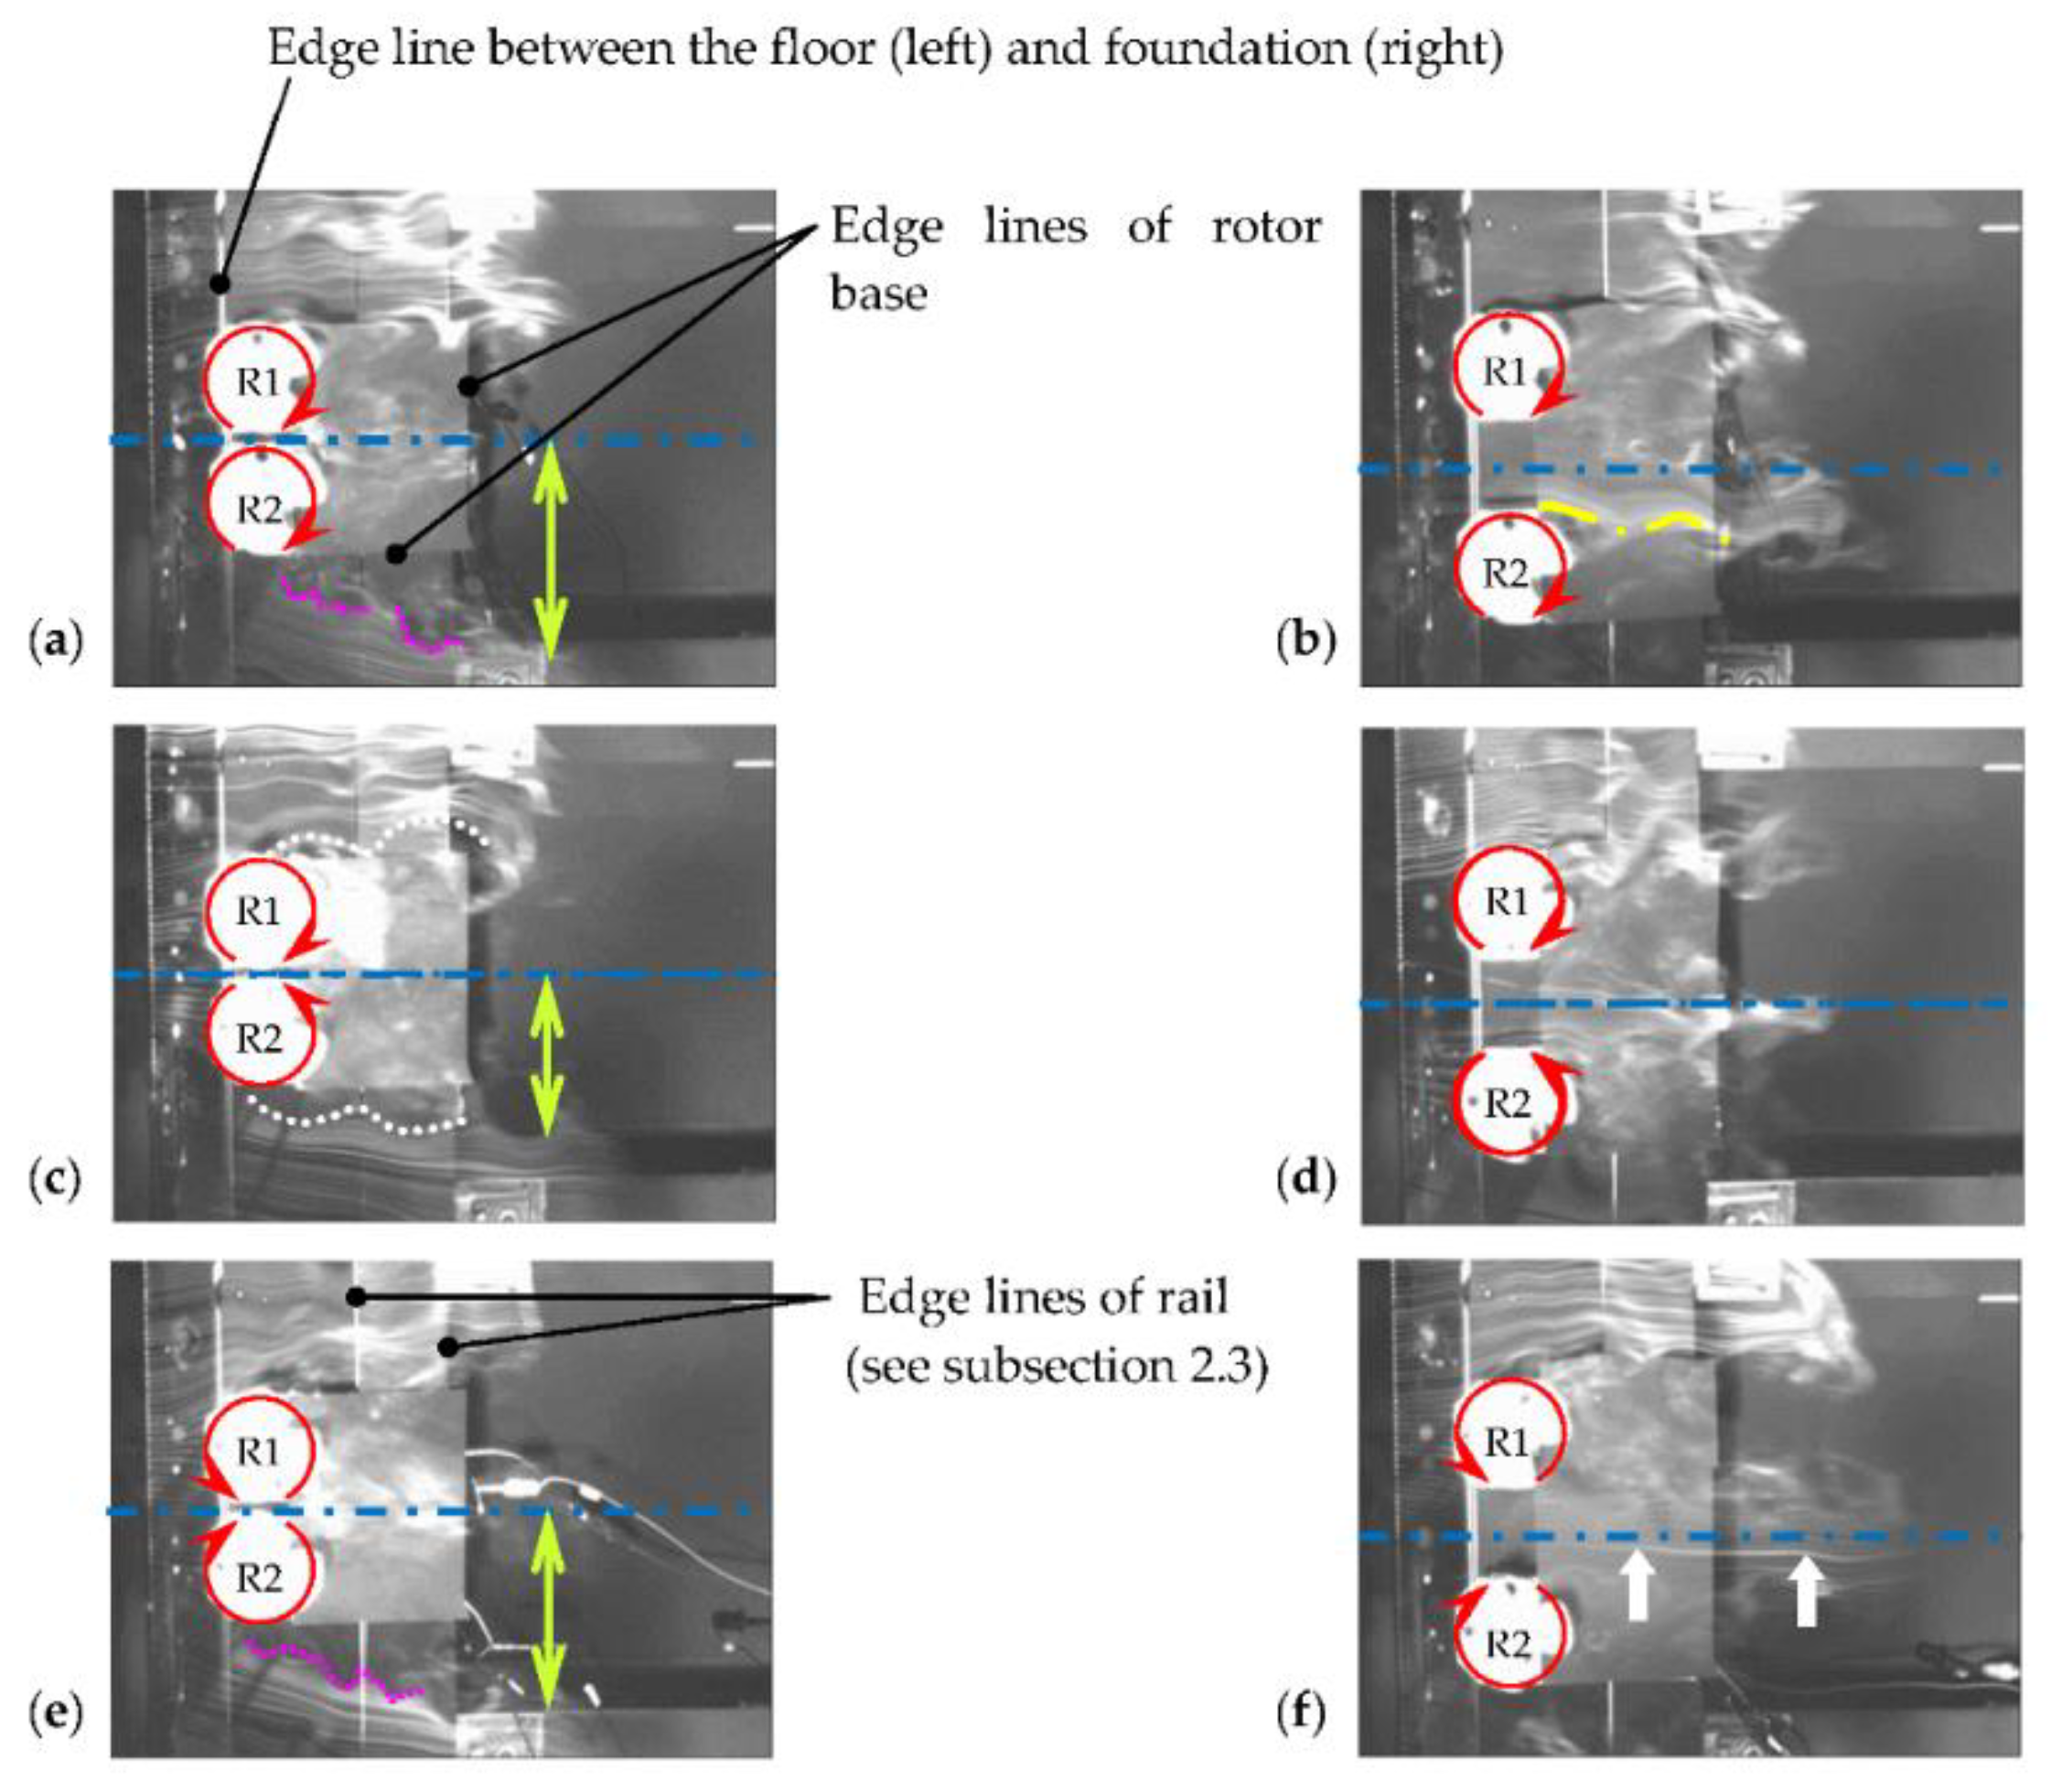
Figure 11 presents the flow pattern captured by the smoke-wire method around the two rotors with rotation. The flow (V = 1 m/s) is the same as that in Figure 10, from left to right. The pitch between the streaks when they left the wire was carefully set to be sufficiently small (less than 0.1D) by using kinked wire (Figure 7) to capture the flow pattern in detail. An edge line between the floor (left, far below) and foundation (right, supporting rotors), the edge lines of the rail (see explanation of Figure 6), and the edge line of the rotor base are shown as white/black lines in each photograph in addition to electric wires (far below, see Figure 10). The gaps between Rotor 1 (above) and Rotor 2 (below) are g = 10 and 50 mm. For the CO, CU, and CD configurations, the results are shown in Figure 11a–f, respectively. The red curved arrows indicate the rotational directions of the turbine rotors, whereas the blue dash–dotted lines represent the center lines between the two rotors. In all cases, since the streaks flowing outside the turbines (upward and downward in Figure 11) are strongly bent in front of the rotors and the volumetric flow rate per unit width normal to a stream is increased, the acceleration of fluid flow occurs there as in Figure 4 of Zanforlin and Nishino [2]. First, we explore the flow pattern at a narrower gap of g/D = 0.2. A yellow-green arrow shows the wake half-width, the distance from the center line to the concentrated region of streaks inside the outer shear layers. Apparently, the wake width in the case of CU is remarkably narrower than those obtained for CO and CD. This is consistent with the result of Zanforlin and Nishino [2] (though the CO case was not examined), where a narrower wake width can be confirmed in the case of CU by the contour of streamwise velocity (see Figure 4b,c in Zanforlin and Nishino [2] and Figure 6b,c in Hara et al. [5]).
Figure 12 shows a significant difference in wake width by the rotor arrangements (in the order of CD > CO > CU) obtained using CFD results (Hara et al. [5]) in our research group at a narrower of g/D = 0.2. Here, the wake width b is determined as the full range at which the streamwise time-averaged velocity attains a value of 10 m/s. It is quite interesting that the wake width in the case of CU (doublet-like configuration, Figure 6a in Chan et al. [27]) is also narrower than that in the case of CD (reverse doublet-like configuration, Figure 17b in Chan et al. [27]), for g/D = 3.0, λ = 1 (close to our λ~0.8) and ReD~200, as an example for a pair of counter-rotating cylinders. Zanforlin and Nishino [2] highlighted important features, such as “flow acceleration between the two turbines is less pronounced for CU” and “more flow tends to go outside of the two turbines for CU than for CD”. This agrees with an explanation by Zheng et al. [28] for CD that a wake constraint effect helps accelerate the flow through the rotor path and thus improves the power coefficient.
In contrast to the CU configuration, in the cases of CO and CD, much momentum seems to be transferred between the gap, as seen in Figure 11a,e, in which dense streaks can be clearly observed downstream of the gap flow region. As for the difference of CO and CD, an investigation of successive images with an interval of 0.01 s confirms that intermittent fluid injection (corresponding to the “phase-synchronized rotation”) between the rotors only occurs in the case of CD and not CO. The decrease in wake width for the CU configuration is also clearly confirmed by the evidence of a gentle downward (outward) slope of the shear layers just below the bottom turbine (Rotor 2) in Figure 11c.
The second interesting finding of the present experimental study is that the “nominal front-stagnation point” of each rotor moved toward the center of the rotor pair (x-axis) based on the flow visualization in the CU arrangement. Since the streak line toward the stagnation point was considerably inclined to the outside in that configuration, the outer streak lines around the stagnation point are bent along with the circle made by the rotation of the rotor-blades. There are similarities to the increase in streamline curvature around a rotational circular cylinder, which dominate the Magnus effect. Maruyama [29] explained the physical mechanisms of the Magnus effect, based on both Bernoulli’s theorem and the momentum theorem including discussions on the streamline curvature theorem and the shift of the stagnation points. Moreover, the streamwise-spatial interval of the ‘undulating shear layers’ in the CU arrangement (white rounded dotted lines in Figure 11c, where the blades move along the mainstream) is longer than that in either the CO or CD (purple jagged dotted lines in Figure 11a,e, where the blades move against the mainstream).
In the CU configuration, the clear (undisturbed) shear layers occur because the direction of flow and the direction of movement of the blades are the same at the outsides of the VAWTs; consequently, the shear layers are not affected by strong disturbance from the turbine blades. Here, the frequency of the undulation corresponds to the passing period of each blade, which is about 0.07 s (6–7 frames at a speed of 100 fps). Similar undulation can be confirmed by the contour of streamwise velocity reported by Hara et al. [5]. In all cases with a small clearance of g/D = 0.2, the wake behind VAWTs seems to behave as one. Though further investigation is required, this seems similar to the behavior of the wake flow behind two parallel circular cylinders at rest as reported by Alam et al. [30] (g/D = 0.1) and Yoon et al. [31] (g/D = 0.2). In addition, a vortex street seen in the flow behind two parallel rotating cylinders in the CU configuration in Figure 6c of Yoon et al. [31] (g/D = 0.7) is also similar to that of a single bluff body flow. It is well known that a pair of counter-rotating cylinders can suppress vortex shedding (e.g., Chan et al. [27]). It should be noted that there is a completely different regime called ‘bistable’ (Alam et al. [30]), ‘flip-flopping’ (Yoon et al. [31]) or ‘gross unsteadiness’ (Bearman and Wadcock [32]) in the 0.1–0.2 < g/D < 1–1.2, according to the references, for the flow around two parallel stationary cylinders.
Next, we investigate the flow pattern at a wider gap of g/D = 1.0. The white region, which consists of a bundle of streaks near the wake center line, reaches further downstream at t = 0.25 s, compared with that in a narrower gap. In the cases of CO and CU in Figure 11b,d, the white region meanders downstream, which is probably due to the passing of each turbine blade. As seen in Figure 11b, a clear ‘undulating shear layer’ in the CO (yellow dash–dotted line) is observable only on the inner side of the bottom turbine (Rotor 2), where the direction of flow and the direction of movement of the blades between the VAWTs are identical. Conversely, in the case of CD in Figure 11f, there is a long straight streak (indicated by white arrows) along the wake center line, which implies the existence of a high-momentum zone without transverse mixing between the turbines. In all the cases with a large clearance of g/D = 1.0, the following wake seems to be roughly in the form of two vortex streets. Again, this has similarities with the wake flow behind two parallel circular cylinders at rest discussed by Alam et al. [30] (g/D > 1.5), Bearman and Wadcock [32] (g/D = 2.0), and Yoon et al. [31] (g/D = 1.5).
The narrower wake width for CU than for CD at a wider gap of g/D = 1.0 is also reported by Lam and Peng [14] based on wake measurements with a tip speed ratio of λ = 1.01 and a solidity of σ = 0.371 (close to λ ~ 0.8 and σ = 0.382 obtained in our study), as presented in Table 1. They explained the reason for the narrower wake for CU using two pairs of stationary counter-rotating streamwise vortices. This concurs well with our latest additional visualizations with a wire set behind rotors (not shown here) using a smoke-wire method at the span center (z/D = 0) and above the pair of rotors (z/D = 1.0).
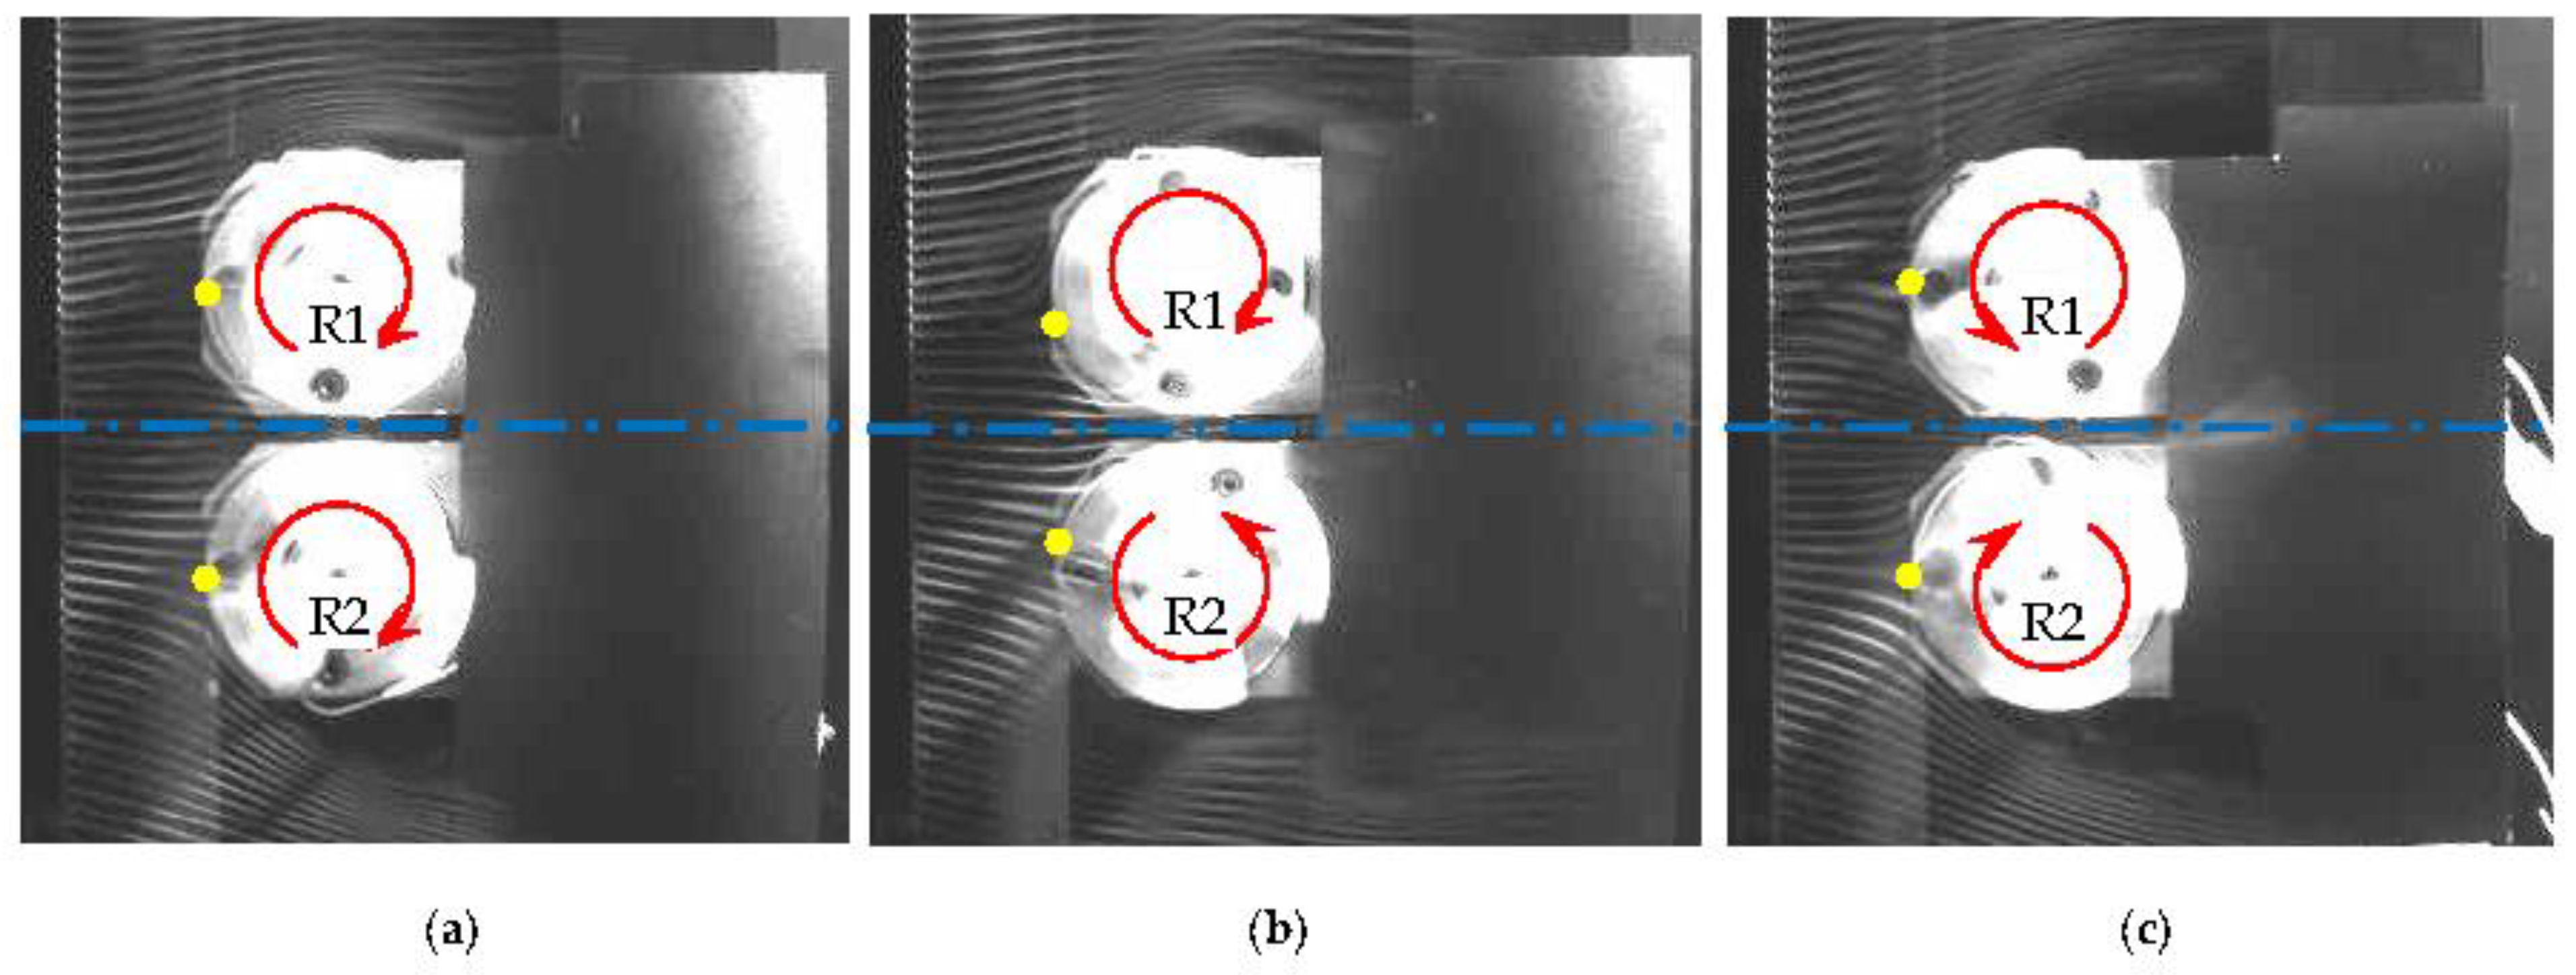
Figure 13 shows the flow pattern captured by the smoke-wire method around the two rotors with rotation at a narrower gap of g/D = 0.2. The uniform wind velocity V is 2 m/s. The flow direction, red curved arrows, and the blue dash–dotted lines are the same as those in Figure 10 and Figure 11. For the CO, CU, and CD configurations, the results are shown in Figure 13a–c. The movement of the “nominal front-stagnation point” of each rotor towards the center of the rotor pair (mentioned in relation to Figure 11c) can be clearly confirmed in Figure 13b for the CU arrangement, as indicated by the closed-yellow circles. This is consistent with the numerical result of Zanforlin and Nishino [2] (see their Figure 4c), although they do not mention it.
Figure 14 shows the flow patterns around the two rotating turbines arranged side-by-side at g/D = 1.0. Photographs of smoke flow under a uniform velocity of V = 2 m/s and the corresponding binarization images are placed in the left and middle columns, respectively. The right column contains the time-averaged streamlines based on the CFD results (Hara et al. [5]) obtained by our research group. As illustrated by the green arrows, the deflected gap flow towards the bottom side of the image can be clearly confirmed in Figure 14a,c for the CO arrangement. For the CU arrangement, significant movement of the nominal front-stagnation point indicated by the closed yellow circle of each rotor toward the center of the rotor pair in Figure 14d can be clearly substantiated by the CFD result in Figure 14f. In this case, the gentle outward flows indicated by blue arrows can be confirmed outside the turbines, as shown in Figure 14d,f.
This leads to the narrowest wake width for the arrangement as quantitatively shown in Figure 12 for g/D = 0.2. Note that a slight downward shift of the front-stagnation point can also be confirmed in the CO arrangement in Figure 14a–c only for the upper rotor R1, which rotates at a higher speed (see Figure 8a) as a result of the induced velocity by the lower rotor R2. For the CD arrangement, steep outward flows are illustrated by lavender arrows outside the turbines in Figure 14g,i, leading to a wide wake behind the turbines. The area in the lavender broken frame in Figure 14h shows long straight streak lines along the wake center line (explained in Figure 11f), supporting the high-speed region shown in Figure 14i obtained by CFD (Hara et al. [5]).
Figure 15 shows the binarized images of smoke flow around two turbines arranged side-by-side at g/D = 1.0, rotating at 600 rpm under V = 2 m/s. Orange circles indicate the movement of a particular blade in each rotor for convenience, but are not precisely represented in angle. Figure 15a–e shows a series of images at t = 0–0.08 s of the CO arrangement, Figure 15f–j shows those of the CU arrangement, and Figure 15k–o shows those of the CD arrangement, with a temporal interval of 0.02 s corresponding to 1/5 rotation (72°). The far-left column corresponds to the time of smoke generation at t = 0 s. It is important that the flow pattern in each arrangement is not largely deformed owing to the rotation of the blades. As a conclusion of flow visualization in this study, Figure 15 corroborates our findings supported by Computational Fluid Dynamics (CFD) adopting the dynamic fluid-body interaction (DFBI) method reported by Hara et al. [5].
Figure 16 illustrates the effect of the movement of the stagnation point, indicated by the closed-yellow circle, on the relative velocity W and the angle of attack α of the model blade. U is the flow velocity approaching the rotor and is the peripheral velocity due to the rotation of the blade. The above movement (‘without shift’ to ‘with shift’ in Figure 16) towards the centerline of the rotor pair results in a decrease in W and an increase in α. According to the properties of the NACA 0018 airfoil (Kumar et al. [11]) in the range of a blade-chord-based Reynolds number of ~104, a decrease in W leads to a decrease in the lift and an increase in α beyond 5° reduces the lift to drag ratio. This translates to a reduction in the wind turbine torque and the rotational speed. This agrees with Figure 8 and Figure 9, where the rotational speeds of both Rotor 1 and Rotor 2 decrease for a narrow gap only in the case of CU.

4. Conclusions

Wind tunnel experiments, which mimic a pair of variable-speed turbines arranged side-by-side, have revealed the effects of a closely spaced pair of vertical-axis wind turbines (Butterfly Wind Turbines with high solidity) on the rotational speed and the rotor power. The increase in the rotational speed (rotor power) and the related flow pattern have been observed in all the three arrangements with different gaps. The maximum “phase-synchronized rotational speed” occurs at the narrowest gap of g/D = 0.1 in the CD arrangement. Meanwhile, local maxima arise at g/D < 1 in the CO and CU arrangements. From an engineering perspective, the optimal rotor spacing is g/D = 0.2 with the CO arrangement if significant deceleration or acceleration due to misalignment at g/D = 0.1 for CO or CD is undesired. The wake width in the case of CU is remarkably narrower than those obtained in the cases CO and CD. Furthermore, based on flow visualization, the “nominal front-stagnation point” of each rotor in the CU arrangement moves toward the center of the rotor pair.

Author Contributions

Conceptualization, Y.J. and Y.H.; methodology, Y.J.; software, Y.J. and Y.H.; validation, Y.J.; formal analysis, Y.J. and Y.H.; investigation, Y.J.; resources, Y.J. and Y.H.; data curation, Y.J. and Y.H.; writing—original draft preparation, Y.J.; writing—review and editing, Y.J. and Y.H.; visualization, Y.J. and Y.H.; supervision, Y.H.; project administration, Y.H.; funding acquisition, Y.H. and Y.J. The authors have read and agreed to the published version of the manuscript. All authors have read and agreed to the published version of the manuscript.

Funding

This research was supported by JSPS KAKENHI Grant Number JP 18K05013 and the International Platform for Dryland Research and Education (IPDRE), Tottori University.

Data Availability Statement

The data that support the findings of this study are available from the corresponding author, Y.J., upon reasonable request.

Acknowledgments

The authors thank Yuki Sogo, Taiki Kitoro, and Kenji Marusasa at Kagawa College for their technical assistance in all our experimental work. We also thank Tomoyuki Okinaga at Tottori University for stimulating discussions. The authors would like to extend their appreciation to the editor and the reviewers from the Energies for their insightful suggestions and constructive comments that significantly improved this paper.

Conflicts of Interest

The authors declare no conflict of interest.

Appendix A

Figure A1 shows the experimental setup of the torque measurements at Tottori University (Hara et al. [33]). Figure A1a is for a miniature wind turbine model and Figure A1b is for a direct current motor. The torque was measured by a torque detector with tachometer (Ono Sokki, MD-501B: Yokohama, Japan) shown in Figure A2.
In the torque measurement of a wind turbine in Figure A1a, the turbine was supported by a ball bearing holder connected to the torque detector, which was driven by an induction motor (Panasonic, M61X6GD4L: Kadoma, Japan) via a speed-increasing gear (Matex, LGU35-4SRS: Yao, Japan; acceleration ratio of 3.66) as illustrated in Figure A2a. The rotational speed of the induction motor was controlled with an inverter. Wind speed was measured by a Pitot tube placed in a uniform flow generated by a wind tunnel (cross sectional area of the nozzle exit: 300 mm × 300 mm). The distance between the wind turbine and the wind tunnel exit was 300 mm. In the torque measurement of a direct current motor with no current (no-load condition) in Figure A1b, the motor supported by a motor holder was directly connected to the torque detector as illustrated in Figure A2b.
Figure A1. Experimental setup of the torque measurements at Tottori University (viewed from downstream): (a) a miniature wind turbine model; (b) a direct current motor with no current.
Energies 14 07874 g0a1
Figure A2. Experimental setup of the torque measurements and the wind tunnel at Tottori University: (a) a miniature wind turbine model; (b) a direct current motor with no current.
Energies 14 07874 g0a2

References

  1. Dabiri, J.O. Potential order-of-magnitude enhancement of wind farm power density via counter-rotating vertical-axis wind turbine arrays. J. Renew. Sustain. Energy 2011, 3, 043104. [Google Scholar] [CrossRef] [Green Version]
  2. Zanforlin, S.; Nishino, T. Fluid dynamic mechanisms of enhanced power generation by closely spaced vertical axis wind turbines. Renew. Energy 2016, 99, 1213–1226. [Google Scholar] [CrossRef] [Green Version]
  3. De Tavernier, D.; Ferreira, C.; Li, A.; Paulsen, U.S.; Madsen, H.A. Towards the understanding of vertical-axis wind turbines in double-rotor configuration. J. Phys. Conf. Ser. 2018, 1037, 022015. [Google Scholar] [CrossRef] [Green Version]
  4. Ferreira, C.S. The near wake of the VAWT. Ph.D. Thesis, Delft University of Technology, Delft, The Netherlands, 26 October 2009. [Google Scholar]
  5. Hara, Y.; Jodai, Y.; Okinaga, T.; Furukawa, M. Numerical analysis of dynamic interaction between two closely spaced vertical-axis wind turbines. Energies 2021, 14, 2286. [Google Scholar] [CrossRef]
  6. Wei, N.J.; Brownstein, I.D.; Cardona, J.L.; Howland, M.F.; Dabiri, J.O. Near-wake structure of full-scale vertical-axis wind turbines. J. Fluid Mech. 2021, 914, 1–40. [Google Scholar] [CrossRef]
  7. Jodai, Y.; Takahashi, Y.; Ichimiya, M.; Osaka, H. The effects of splitter plates on turbulent boundary layer on a long flat plate near the trailing edge. Trans. ASME J. Fluids Eng. 2008, 130, 051103-1–051103-7. [Google Scholar] [CrossRef]
  8. Hara, Y.; Tagawa, K.; Saito, S.; Shioya, K.; Ono, T.; Makino, K.; Toba, K.; Hirobayashi, T.; Tanaka, Y.; Takashima, K.; et al. Development of a Butterfly wind turbine with mechanical over-speed control system. Designs 2018, 2, 17. [Google Scholar] [CrossRef] [Green Version]
  9. Hara, Y. Study on optimal close-arrangement of small vertical axis wind turbines. Agric. Biotech. 2020, 4, 61–64. [Google Scholar]
  10. Timmer, W.A. Two-dimensional low-Reynolds number wind tunnel results for airfoil NACA 0018. Wind Eng. 2008, 32, 525–537. [Google Scholar] [CrossRef] [Green Version]
  11. Kumar, V.; Paraschivoiu, M.; Paraschivoiu, I. Low Reynolds number vertical axis wind turbine for mars. Wind Eng. 2010, 34, 461–476. [Google Scholar] [CrossRef]
  12. Islam, M.; Fartaj, A.; Carriveau, R. Analysis of the design parameters related to a fixed-pitch straight-bladed vertical axis wind turbine. Wind Eng. 2008, 32, 491–507. [Google Scholar] [CrossRef]
  13. Ahmadi-Baloutaki, M.; Carriveau, R.; Ting, D.S.-K. A wind tunnel study on the aerodynamic interaction of vertical axis wind turbines in array configurations. Renew. Energy 2016, 96, 904–913. [Google Scholar] [CrossRef]
  14. Lam, H.F.; Peng, H.Y. Measurements of the wake characteristics of co- and counter-rotating twin H-rotor vertical axis wind turbines. Energy 2017, 131, 13–26. [Google Scholar] [CrossRef]
  15. Vergaerde, A.; De Troyer, T.; Kluczewska-Bordier, J.; Parneix, N.; Silvert, F.; Runacres, M.C. Wind tunnel experiments of a pair of interacting vertical-axis wind turbines. J. Phys. Conf. Ser. 2018, 1037, 072049. [Google Scholar] [CrossRef]
  16. Vergaerde, A.; De Troyer, T.; Muggiasca, S.; Bayati, I.; Belloli, M.; Kluczewska-Bordier, J.; Parneix, N.; Silvert, F.; Runacres, M.C. Experimental characterisation of the wake behind paired vertical-axis wind turbines. J. Wind Eng. Ind. Aerod. 2020, 206, 104353-1–104353-13. [Google Scholar] [CrossRef]
  17. Zanforlin, S. Advantages of vertical axis tidal turbines set in close proximity: A comparative CFD investigation in the English Channel. Ocean Eng. 2018, 156, 358–372. [Google Scholar] [CrossRef]
  18. Devinant, P.; Laverne, T.; Hureau, J. Experimental study of wind-turbine airfoil aerodynamics in high turbulence. Wind Eng. Ind. Aerod. 2002, 90, 689–707. [Google Scholar] [CrossRef]
  19. Jodai, Y.; Hara, Y.; Sogo, Y.; Marusasa, K.; Okinaga, T. Wind tunnel experiments on interaction between two closely spaced vertical axis wind turbines. In Proceedings of the 23rd Chu-Shikoku-Kyushu Branch Meeting, JSFM, Yamaguchi, Japan, 1–2 June 2019; pp. 11-1–11-2. [Google Scholar]
  20. Hara, Y.; Jodai, Y.; Okinaga, T.; Sogo, Y.; Kitoro, T.; Marusasa, K. A synchronization phenomenon of two closely spaced vertical axis wind turbines. In Proceedings of the 25th Chu-Shikoku-Kyushu Branch Meeting, JSFM, Takamatsu, Japan, 31 May 2020; pp. 3-1–3-2. [Google Scholar]
  21. Hara, Y.; Jodai, Y. Study on Close Arrangement of Small Vertical Axis Wind Turbines. Turbomach 2021, 49, 13–21. [Google Scholar]
  22. Thomas, R.N. Coupled Vortex Vertical Axis Wind Turbine. U.S. Patent publication 6784566-B2, 31 August 2004. [Google Scholar]
  23. Shigetomi, A.; Murai, Y.; Tasaka, Y.; Takeda, Y. Interactive flow field around two Savonius turbines. Renew. Energy 2011, 36, 536–545. [Google Scholar] [CrossRef]
  24. Shaheen, M.; El-Sayed, M.; Abdallah, S. Numerical study of two-bucket Savonius wind turbine cluster. J. Wind Eng. Ind. Aerod 2015, 137, 78–89. [Google Scholar] [CrossRef]
  25. Ogawa, T.; Yoshida, H.; Sugiura, S. Study of a Savonius-type wind turbine (4th report, effects of the mutual interaction). Tran. JSME Ser. B 1986, 52, 3259–3265. [Google Scholar] [CrossRef] [Green Version]
  26. Schlichting, H. Boundary-Layer Theory, 7th ed.; McGraw-Hill: New York, NY, USA, 1979; p. 32. [Google Scholar]
  27. Chan, A.S.; Dewey, P.A.; Jameson, A.; Liang, C.; Smits, A.J. Vortex suppression and drag reduction in the wake of counter-rotating cylinders. J. Fluid Mech. 2011, 679, 343–382. [Google Scholar] [CrossRef] [Green Version]
  28. Zheng, H.-D.; Zheng, X.Y.; Zhao, S.X. Arrangement of clustered straight-bladed wind turbines. Energy 2020, 200, 117563-1–117563-17. [Google Scholar] [CrossRef]
  29. Maruyama, Y. Study on the physical mechanism of the Magnus effect. Trans. JSASS 2011, 54, 173–181. [Google Scholar] [CrossRef] [Green Version]
  30. Alam, M.M.; Moriya, M.; Sakamoto, H. Aerodynamic characteristics of two side-by-side circular cylinders and application of wavelet analysis on the switching phenomenon. J. Fluids Struct. 2003, 18, 325–346. [Google Scholar] [CrossRef]
  31. Yoon, H.S.; Chun, H.H.; Kim, J.H.; Ryong Park, I.L. Flow characteristics of two rotating side-by-side circular cylinder. Comput. Fluids 2009, 38, 466–474. [Google Scholar] [CrossRef]
  32. Bearman, P.W.; Wadcock, A.J. The interaction between a pair of circular cylinders normal to a stream. J. Fluid Mech. 1973, 61, 499–511. [Google Scholar] [CrossRef]
  33. Hara, Y.; Jodai, Y.; Yamamoto, S.; Okinaga, T. Numerical Simulation on Tandem Layout of Two Vertical Axis Wind Turbines. In Proceedings of the 2019 Annual General Meeting, JSME, Akita, Japan, 8–11 September 2019; pp. J05325-1–J05325-5. [Google Scholar]
Figure 1. Butterfly Wind Turbine: (a) 7-m turbine; (b) 3-D-printed model; (c) cross section.
Energies 14 07874 g001
Figure 2. Three layouts against the wind direction in a closely spaced VAWT pair: (a) Co-Rotating (CO); (b) Counter-Up (CU); (c) Counter-Down (CD).
Energies 14 07874 g002
Figure 3. Experimental data of a 3-D-printed miniature rotor measured in Tottori University: (a) torque characteristics of the wind turbine and motor load torque; (b) torque coefficient; (c) power coefficient; (d) power as a function of rotational speed.
Energies 14 07874 g003
Figure 4. Starting characteristics of a single 3-D-printed experimental rotor: (a) rotational speed vs. uniform velocity; (b) tip speed ratio vs. uniform velocity.
Energies 14 07874 g004
Figure 5. Mean-flow-velocity distribution in the lateral direction at x = 0 without turbines.
Energies 14 07874 g005
Figure 6. Experimental setup of a pair of 3-D-printed VAWT models with an extremely narrow gap of g/D = 0.1 (viewed from downstream).
Energies 14 07874 g006
Figure 7. Experimental setup of smoke-wire method (see Figure 11).
Energies 14 07874 g007
Figure 8. Variation in the rotational speed along with the gap between the two rotors: (a) Co-Rotating (CO); (b) Counter-Up (CU); (c) Counter-Down (CD).
Energies 14 07874 g008
Figure 9. Gap dependence in a pair of VAWT models arranged side-by-side: (a) normalized rotational speed by experiment; (b) normalized power by experiment; (c) normalized power by CFD.
Energies 14 07874 g009
Figure 10. Photographs of smoke flow past two turbines at rest arranged side-by-side at g = 10 mm under V = 1 m/s: (a) t = 0.15 s; (b) t = 0.21 s; (c) t = 0.27 s; (d) t = 0.33 s.
Energies 14 07874 g010
Figure 11. Photographs of smoke flow past two rotating turbines arranged side-by-side at g = 10 and 50 mm at t = 0.25 s under V = 1 m/s: (a) CO at g/D = 0.2; (b) CO at g/D = 1.0; (c) CU at g/D = 0.2; (d) CU at g/D = 1.0; (e) CD at g/D = 0.2; (f) CD at g/D = 1.0.
Energies 14 07874 g011
Figure 12. Streamwise variation of wake width obtained using CFD results by Hara et al. [5].
Energies 14 07874 g012
Figure 13. Photographs of smoke flow past two rotating turbines arranged side-by-side at g/D = 0.2 at t = 0.1 s under V = 2 m/s: (a) CO; (b) CU; (c) CD.
Energies 14 07874 g013
Figure 14. Photographs of smoke flow and the binarization images past two rotating turbines arranged side-by-side at g/D = 1.0 and t = 0.1 s under V = 2 m/s with corresponding CFD results (streamlines, V = 10 m/s): (ac) CO; (df) CU; (gi) CD.
Energies 14 07874 g014
Figure 15. Time series (t = 0–0.08 s) of binarized images of smoke flow past two turbines arranged side-by-side at g/D = 1.0, rotating at 600 rpm under V = 2 m/s: (ae) CO; (fj) CU; (ko) CD. A temporal interval of 0.02 s corresponds to 1/5 rotation (72°).
Energies 14 07874 g015
Figure 16. Effect of the movement (shift) of stagnation point on the relative velocity W and the angle of attack α of the model blade.
Energies 14 07874 g016
Table 1. Comparison of VAWT parameters. D is the rotor diameter, H/D is the aspect ratio, λ = /V is the tip speed ratio and σ = Bc/(πD) is the solidity (not in Bc/D as in, e.g., De Tavernier et al. [3]). N/A means not available.
StudyD [m]H/D [−]λ [−]σ [−]
Ahmadi-Baloutaki et al. [13]0.301.00~0.05–0.30.239
Dabiri [1]1.23.421.5–3.00.102
De Tavernier et al. [3]20–(2-D)2.5, 3.50.032
Hara et al. [5]0.050–(2-D)~0.90.382
Lam and Peng [14]0.301.001.010.371
Vergaerde et al. [15]N/AN/A~2.7–3.3N/A
Vergaerde et al. [16]0.501.63.00.064
Wei et al. [6]2.21.680.96–1.20.349
Zanforlin and Nishino [2]1.25.082.3–3.20.102
Zanforlin [17]1.01.001.750.175
Present0.0500.868~0.80.382
Table 2. Comparison of normalized power Pnorm = Pave/PSI. BWT means Butterfly Wind Turbine (see Section 2.1).
StudyCDg/D = 0.3
CO
CUCDg/D = 0.5
CO
CU
Ogawa et al., Savonius [25]112 10598 108108103
Hara et al., BWT [5]115.3114.896.4123.4118.6103.5
Present, BWT105.9104.5102.2105.3104.9102.6
Publisher’s Note: MDPI stays neutral with regard to jurisdictional claims in published maps and institutional affiliations.

