
EMI Shielding and Absorption of Electroconductive Textiles with PANI and PPy Conductive Polymers and Numerical Model Approach


Abstract
1. Introduction
2. Materials and Methods
2.1. Materials
2.2. Methods
2.2.1. Formation of Material for Electrical Conductivity Tests and Electromagnetic Wave Attenuation
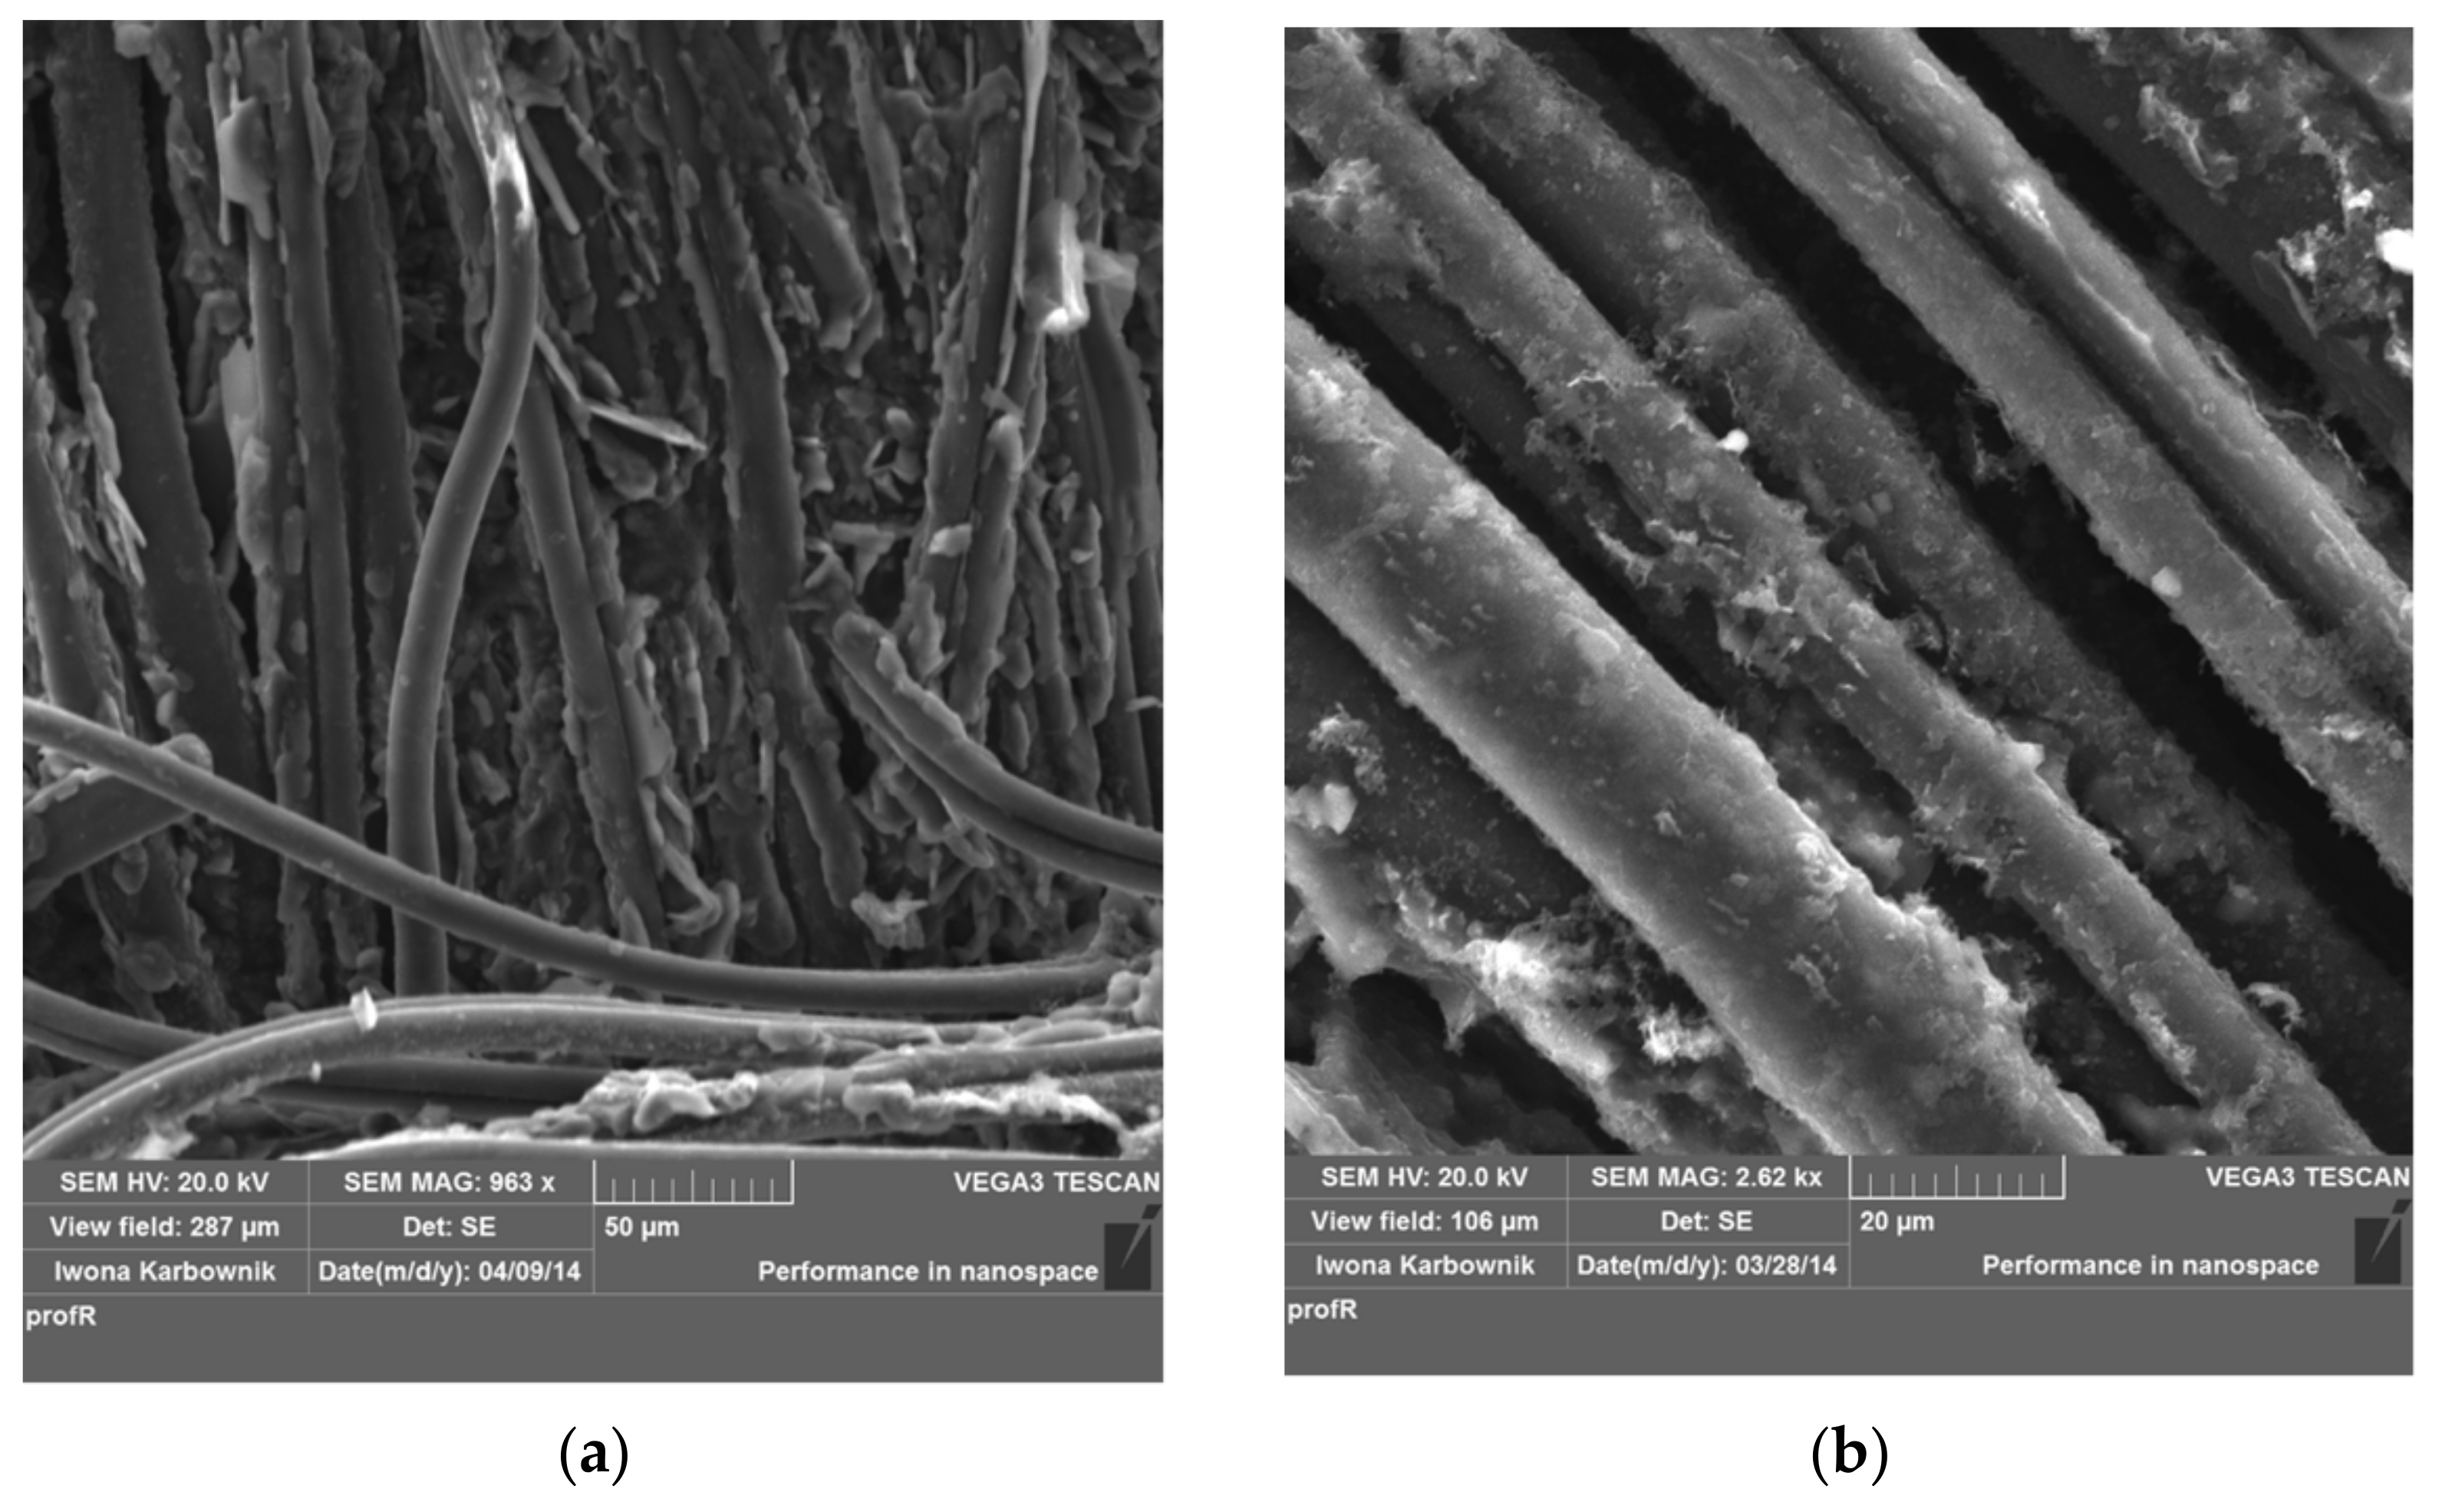
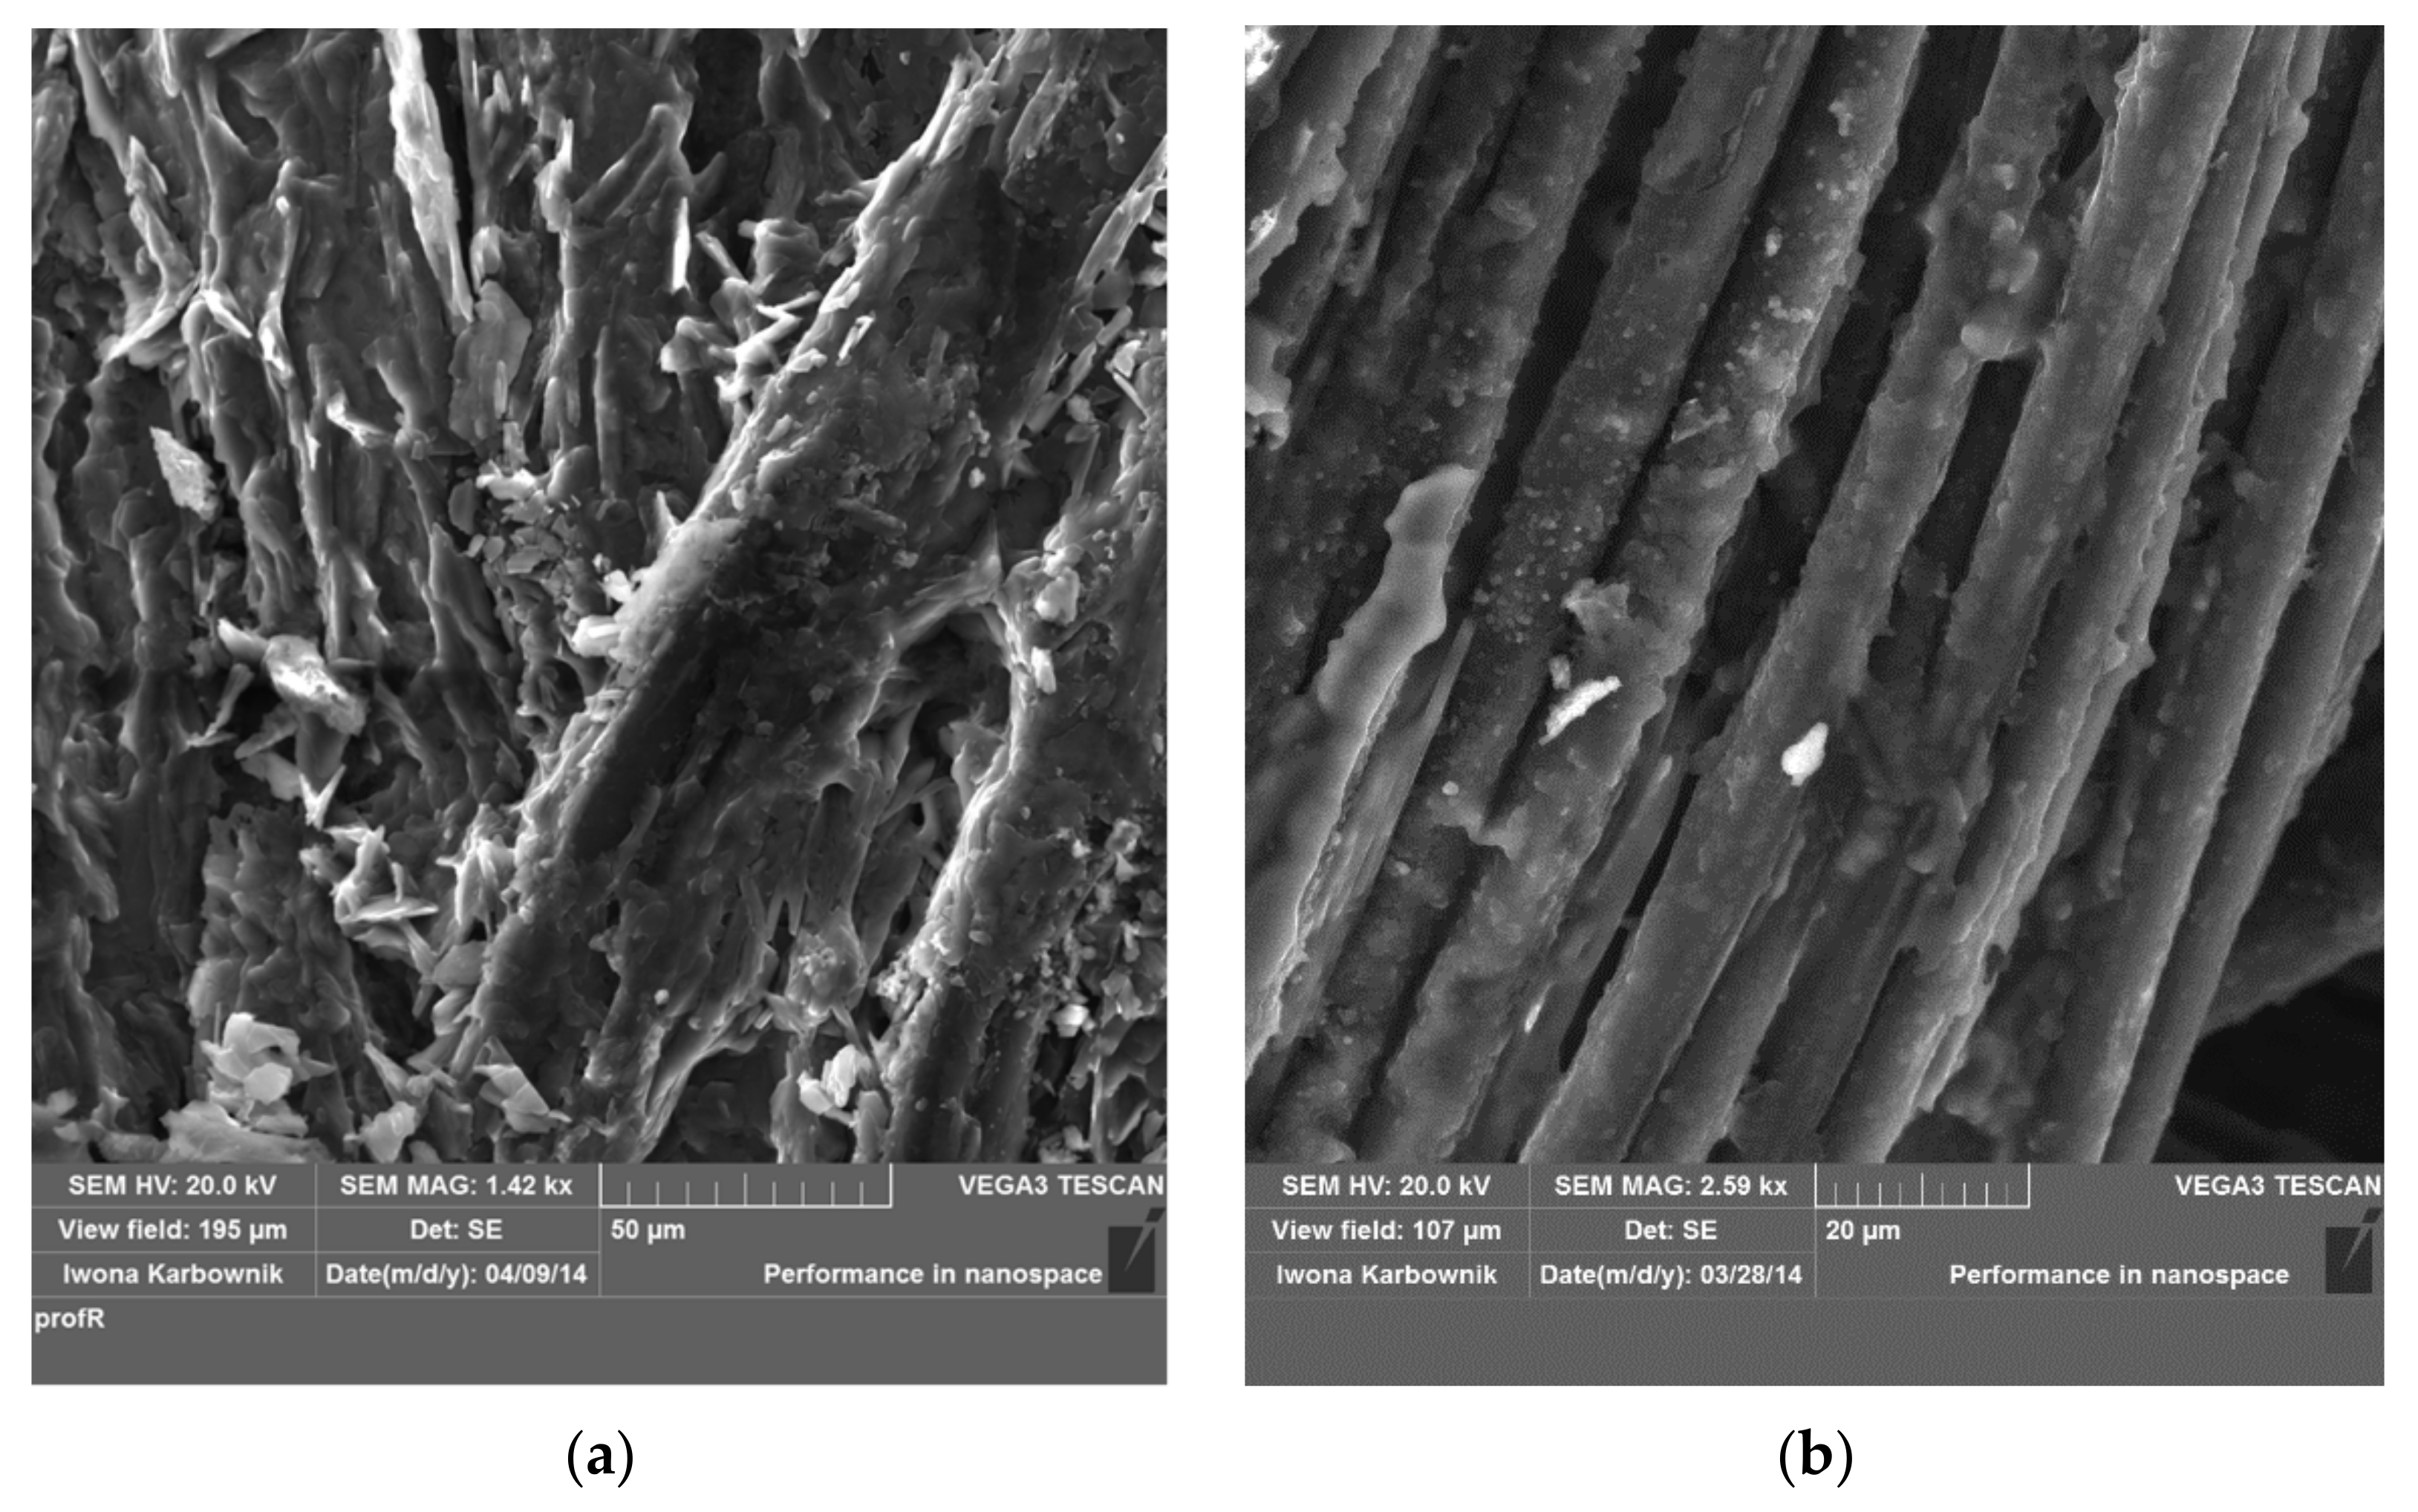
2.2.2. Scanning Electron Microscope Measurements
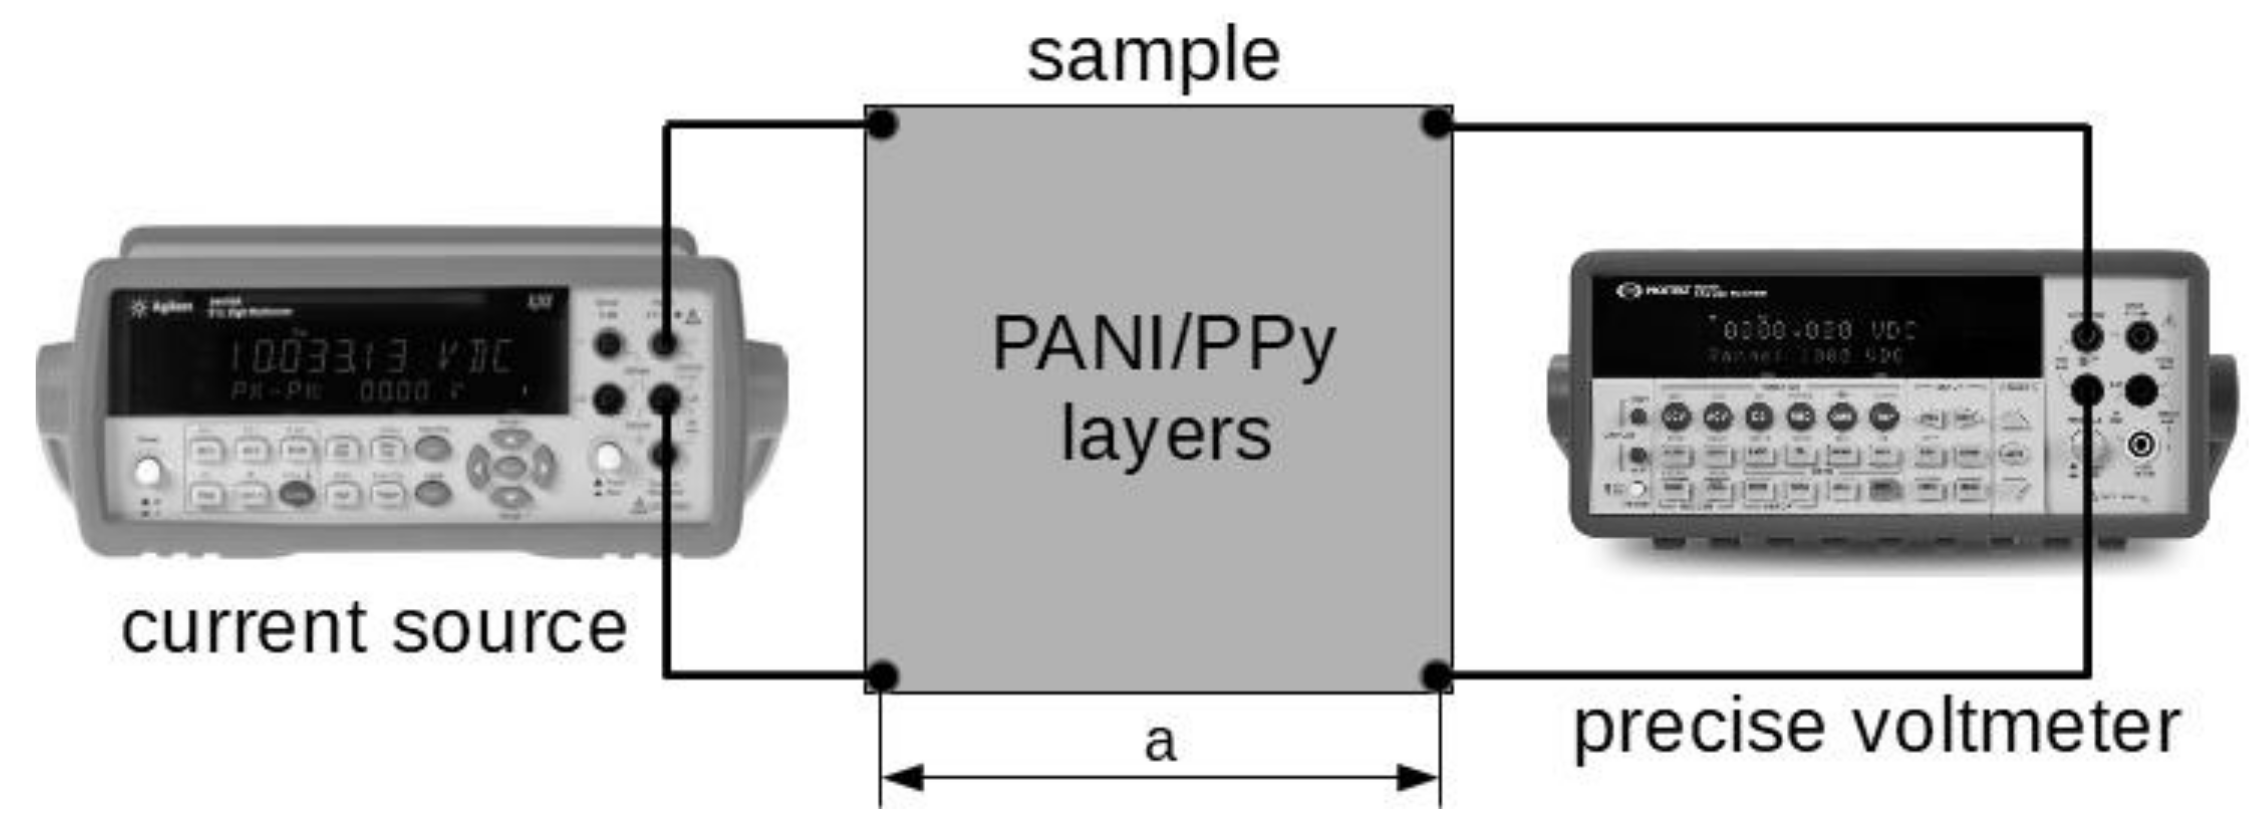
2.2.3. Measurements of Surface Resistivity
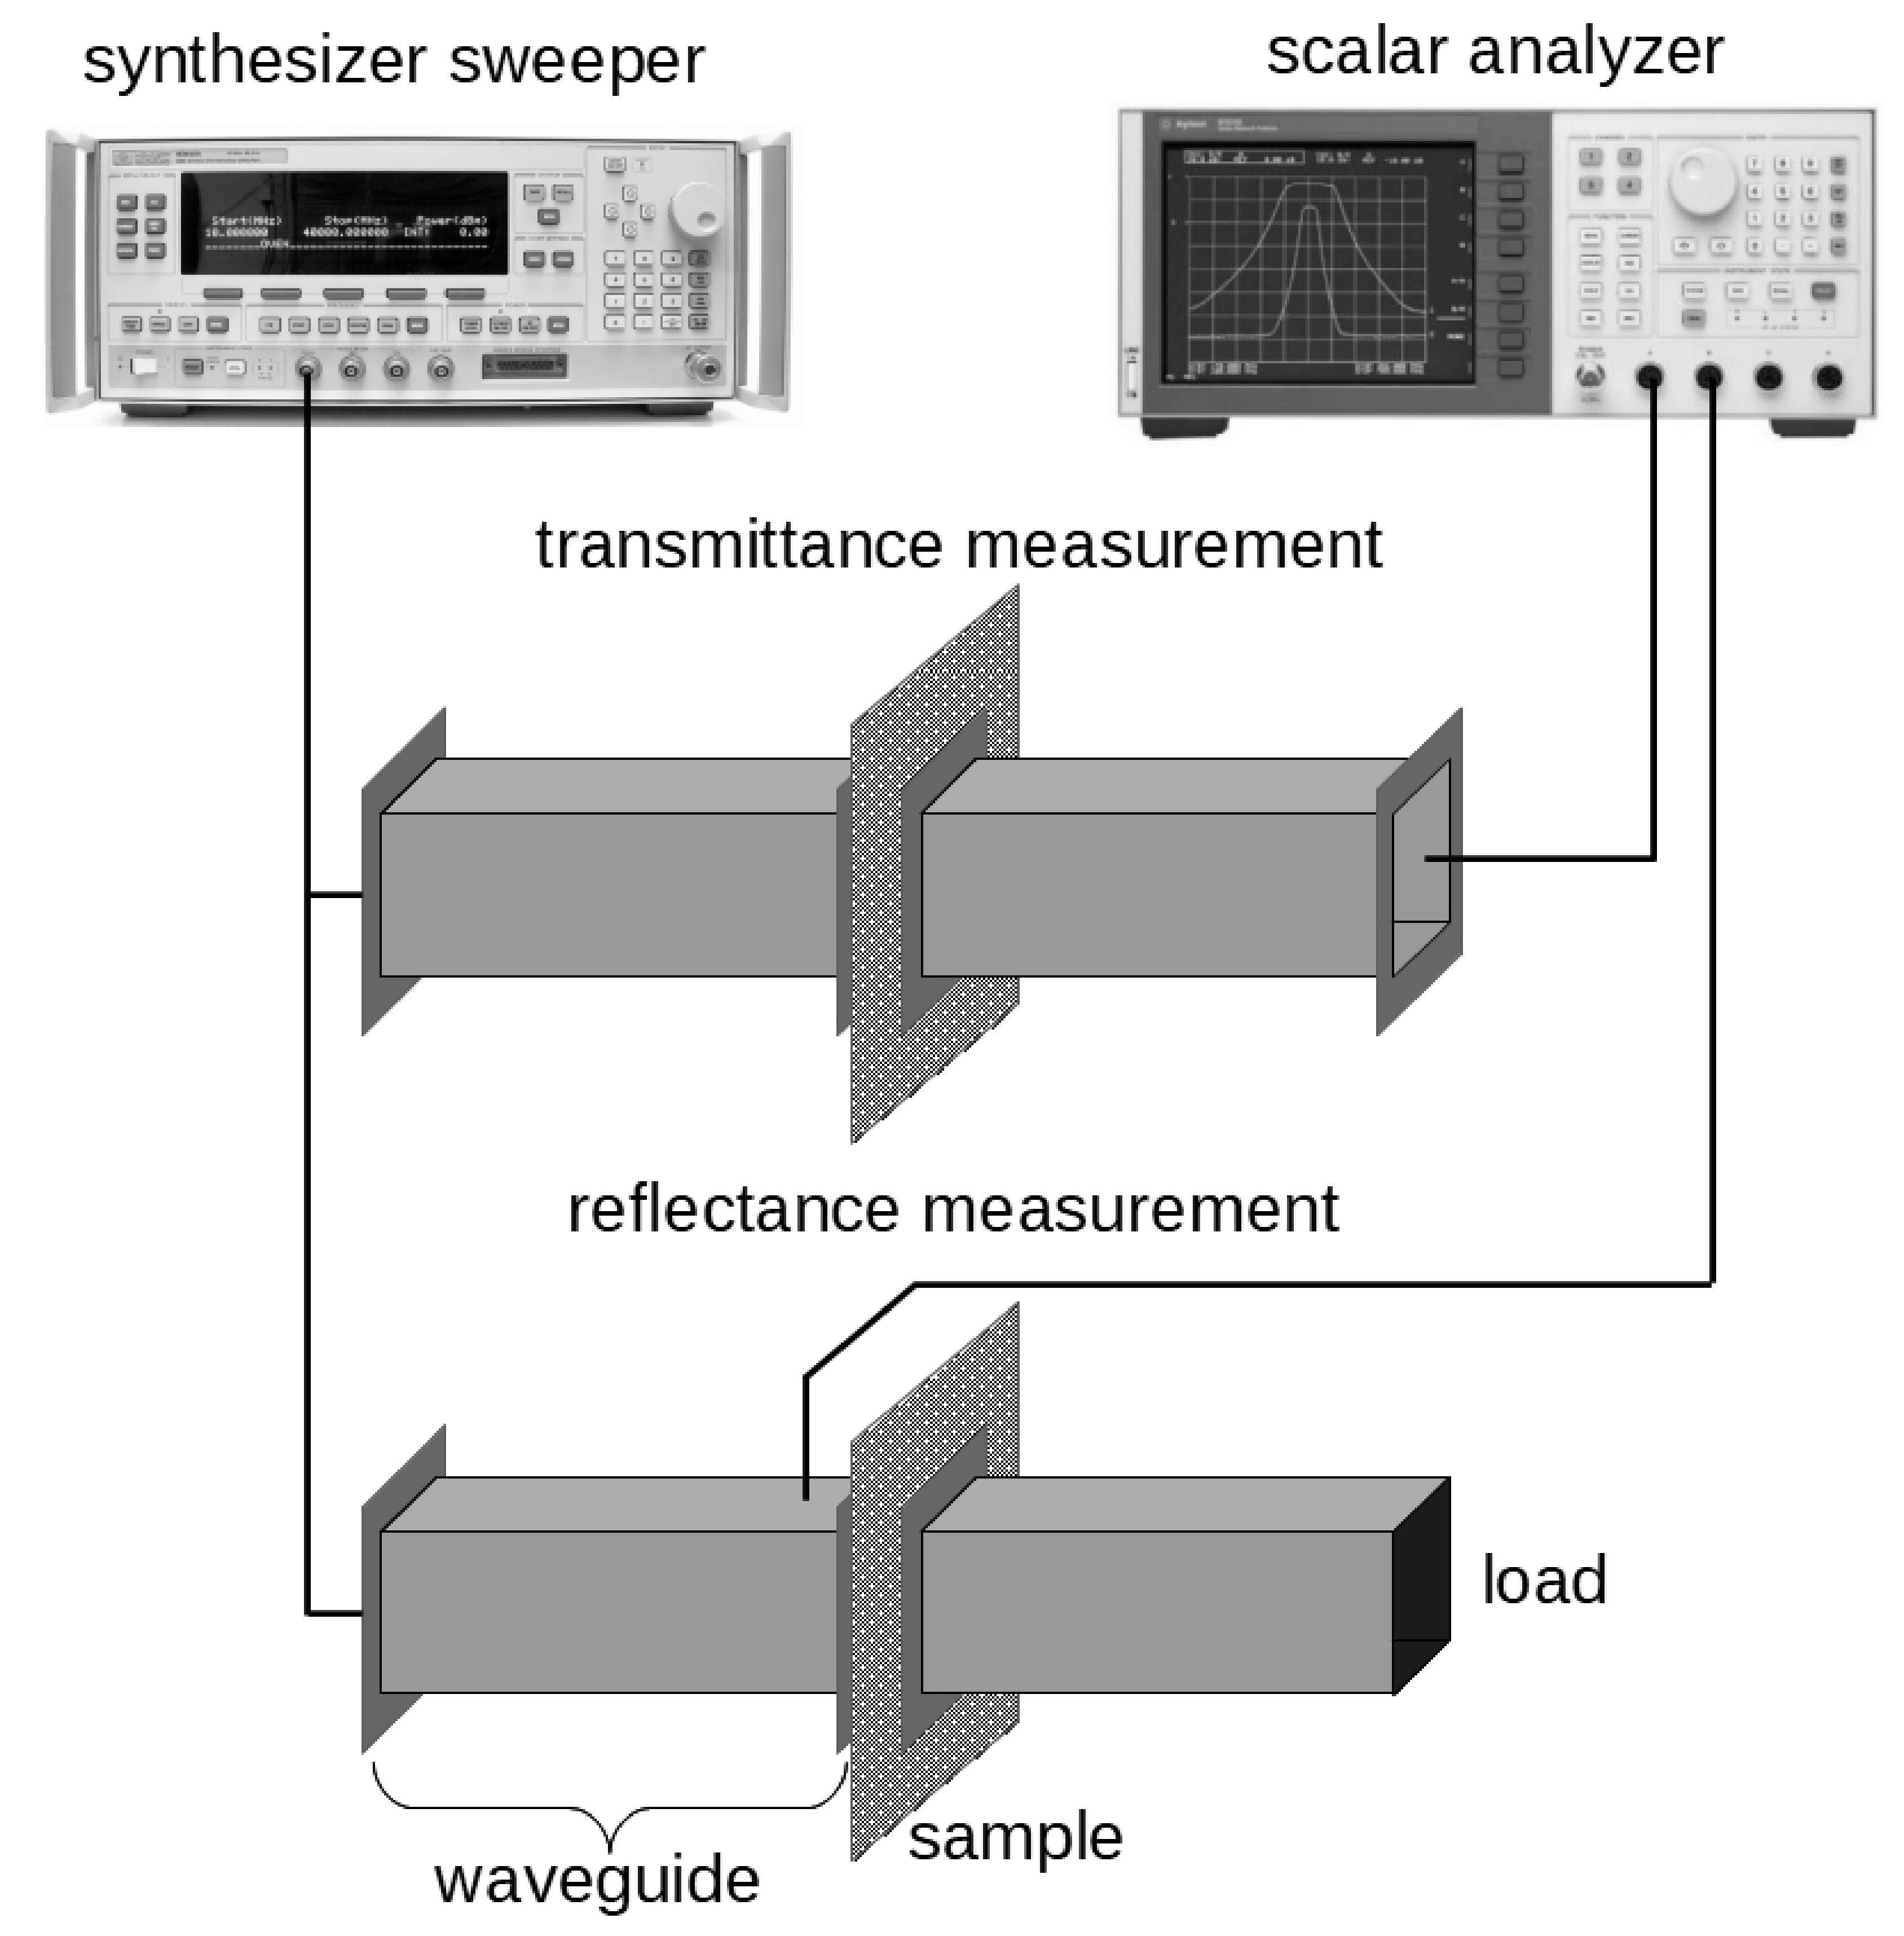
2.2.4. Measurement of the Effectiveness of Electromagnetic Interference Shielding
- WR-284 (2.5–3.5 GHz),
- WR-187 (3.5–5.0 GHz),
- WR-137 (5.0–8.0 GHz),
- WR-90 (8.0–13.0 GHz),
- WR-62 (13.0–18.0 GHz).
- -
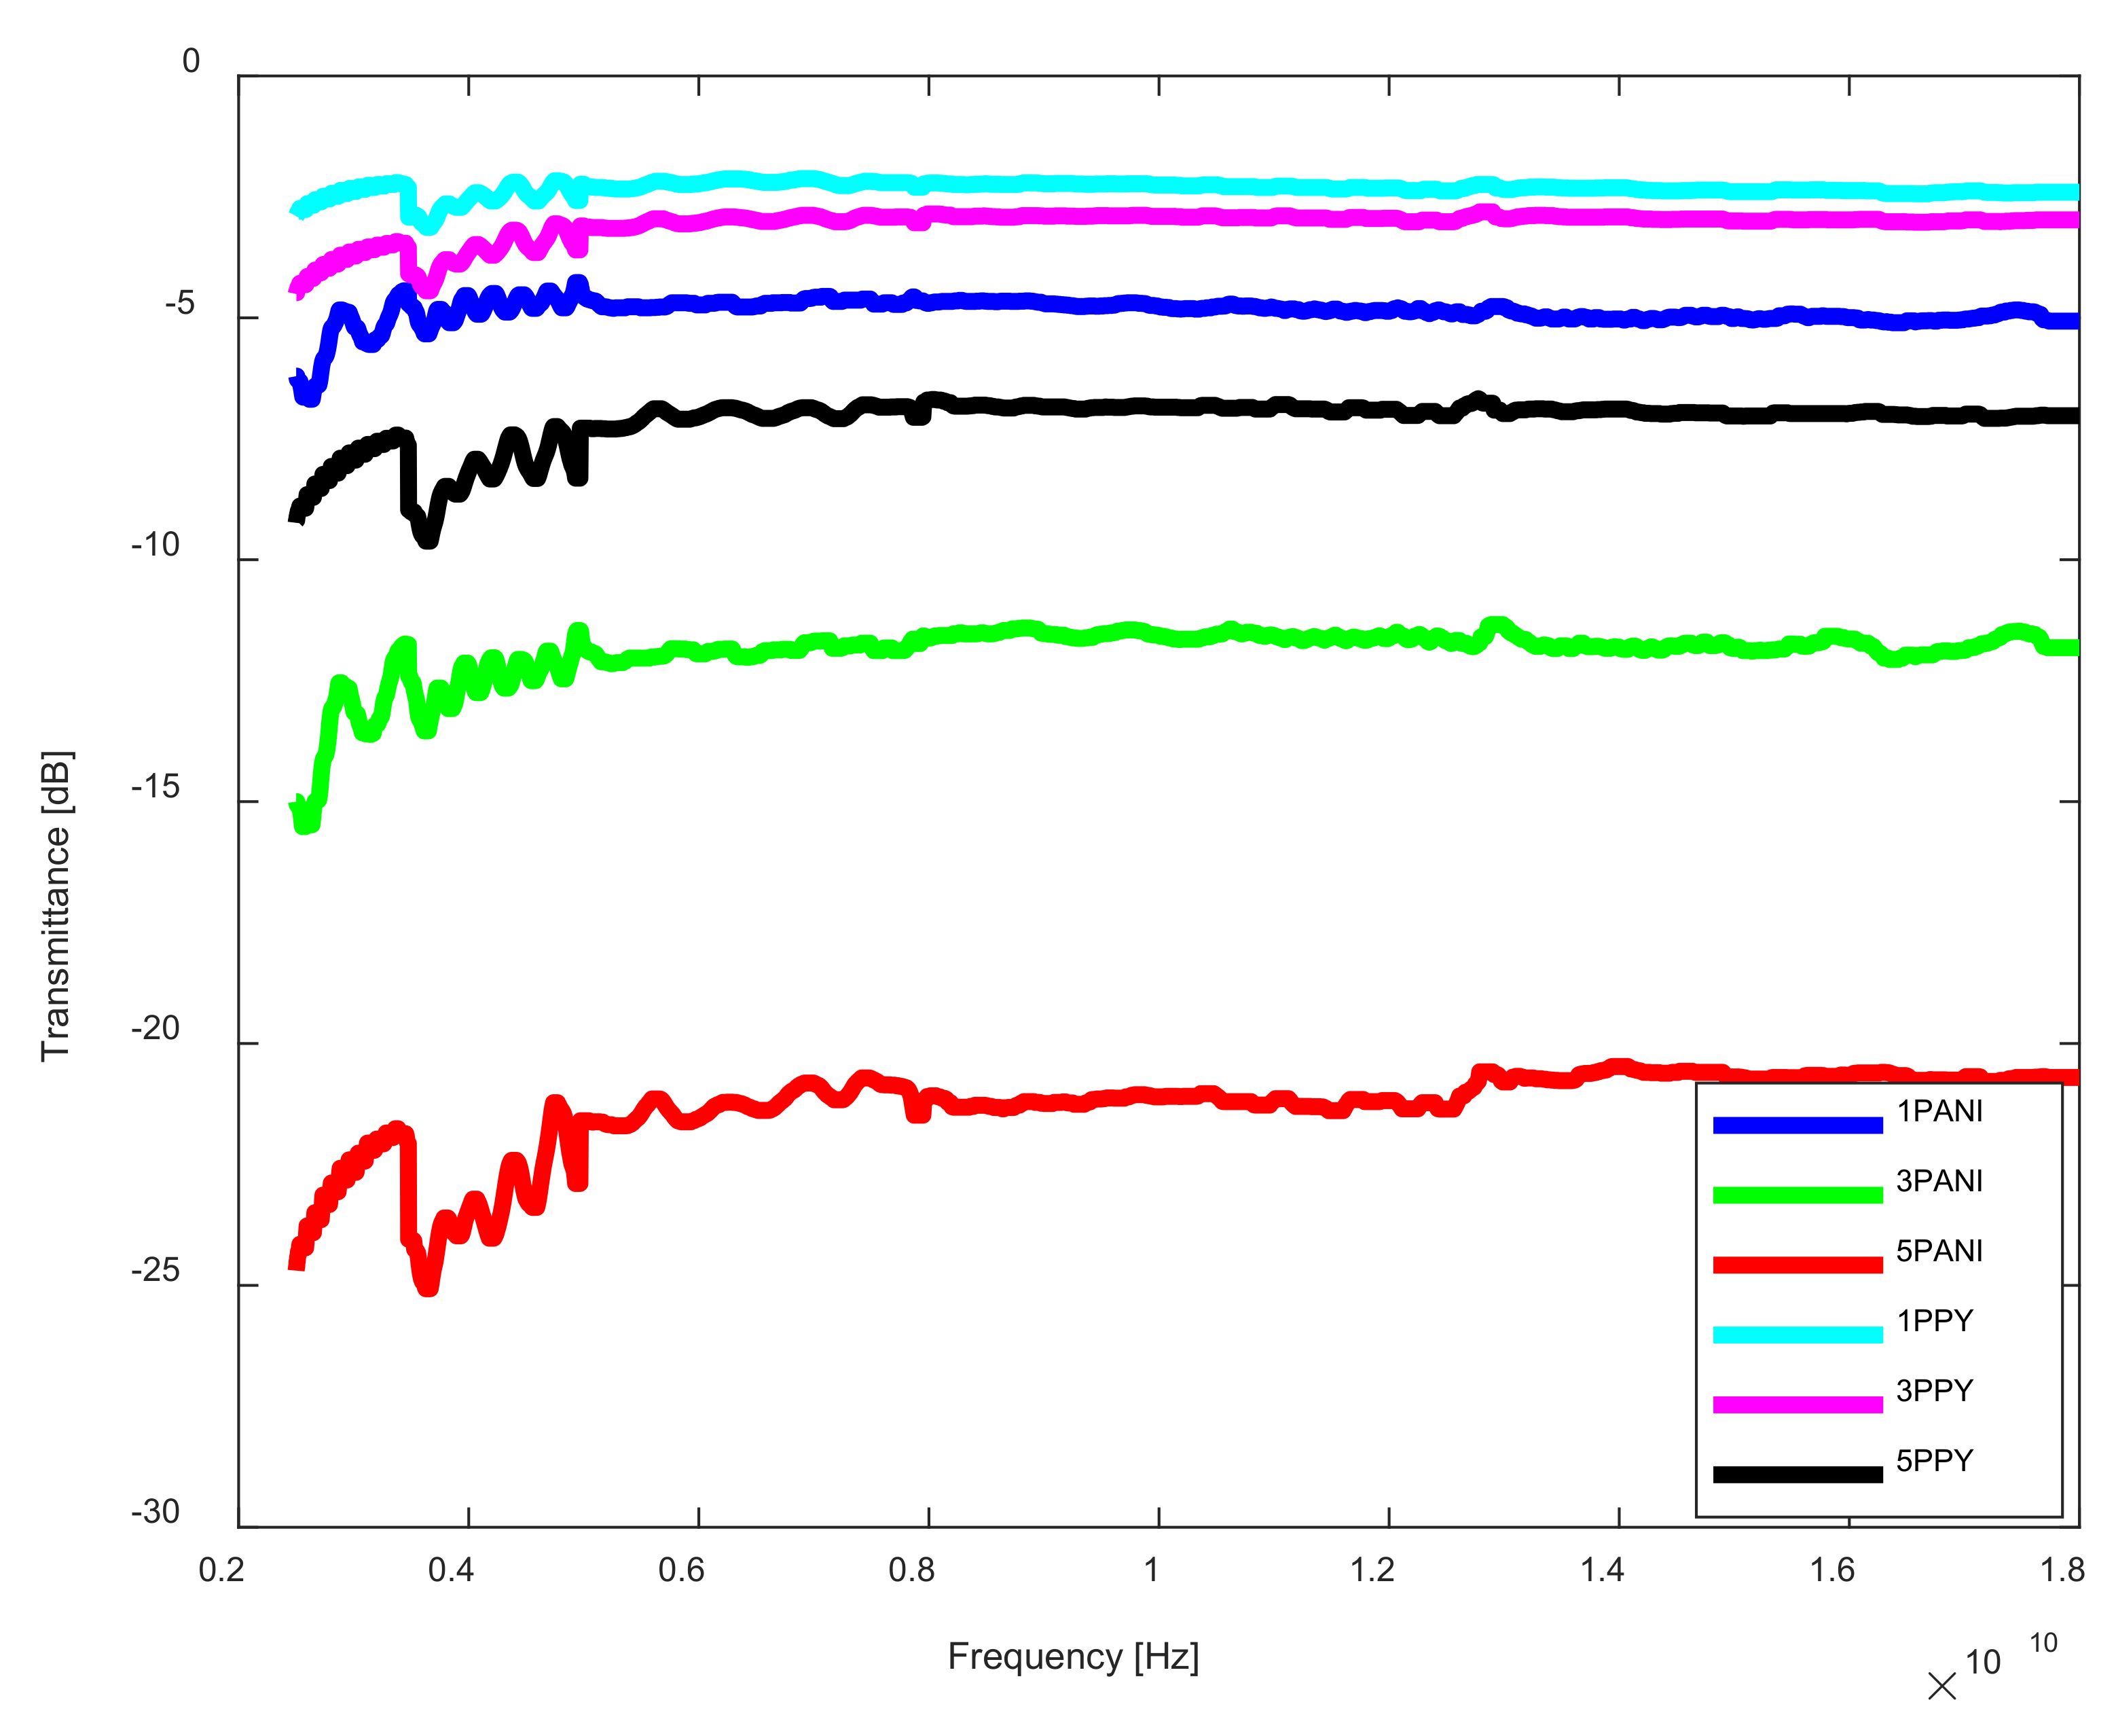
- The transmittance of the sample (in dB)—T1 that is defined as the logarithmic ratio of power of electromagnetic wave measured behind the tested sample to the incident power of electromagnetic wave on its surface:
- -
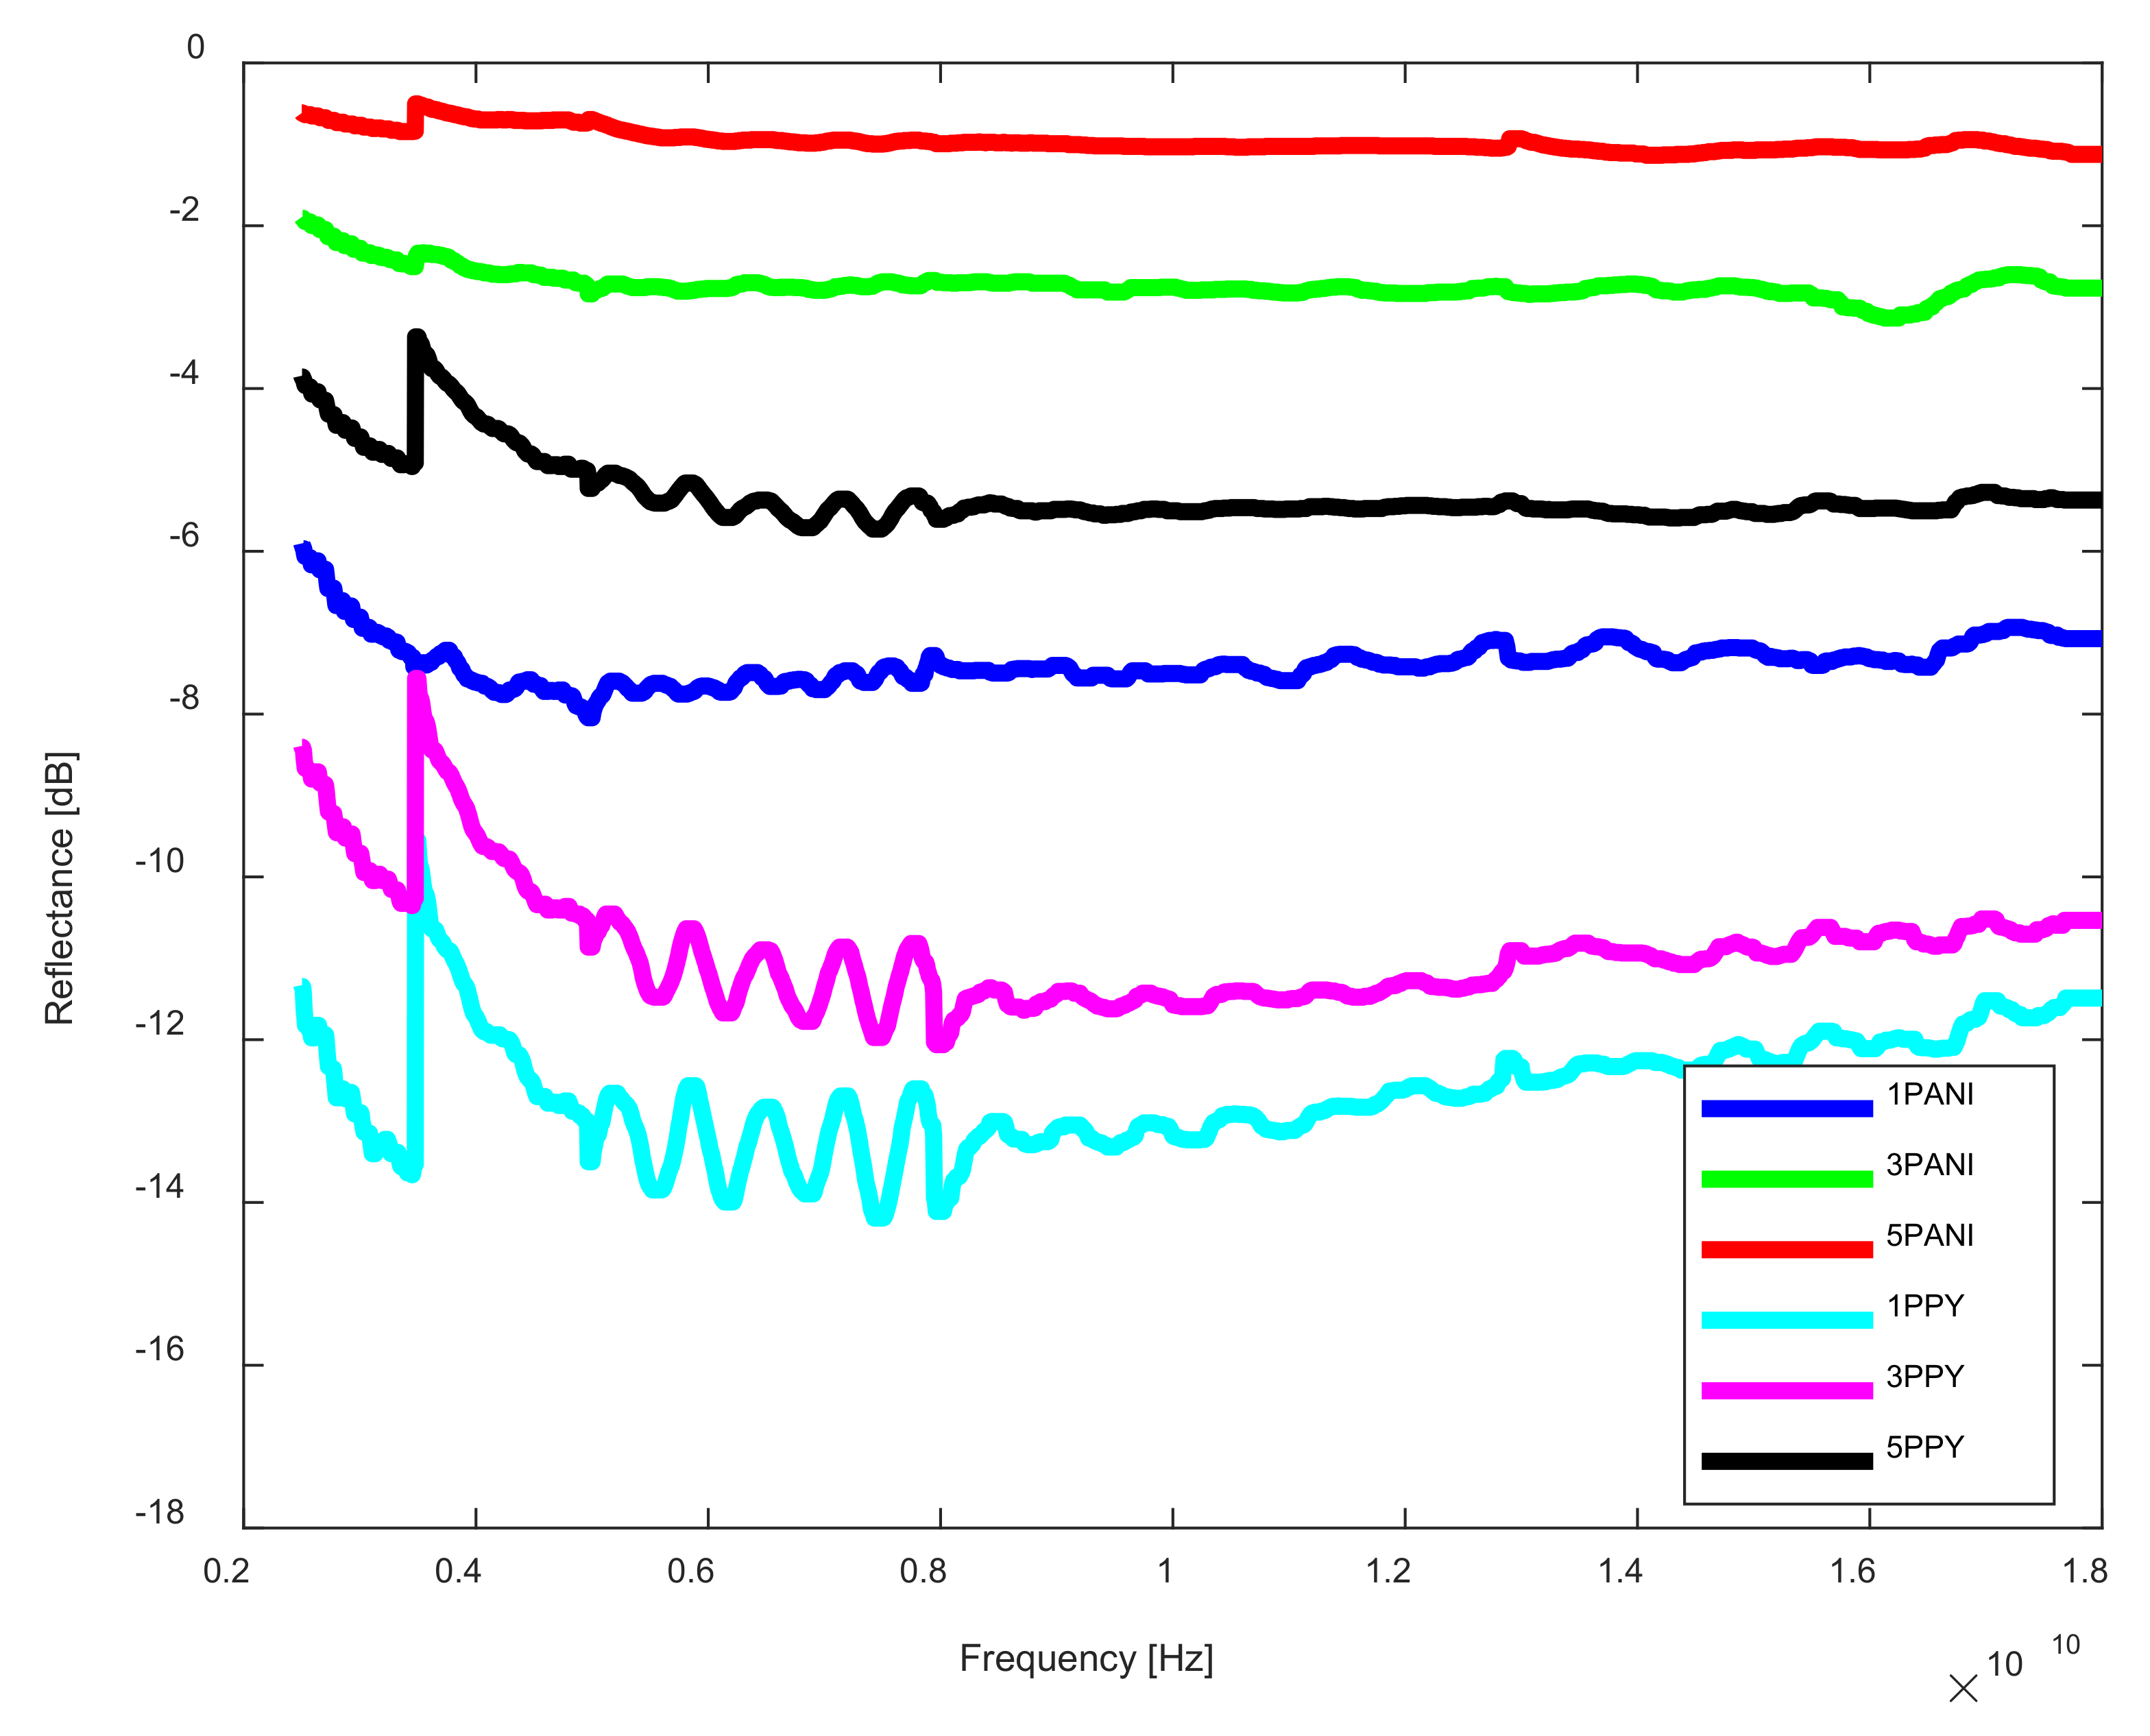
- The reflectance of the sample (in dB)—R1 defined as the logarithmic ratio of the signal reflected from the sample tested to the power of incident radiation on its surface, which can be expressed as:where:
- T—transmittance of the sample, ;
- R—reflectance of the sample, ;
- P1—incident power on the tested sample, mW;
- P2—measured power behind the tested sample, mW;
- PR—power reflected from the tested sample, mW.
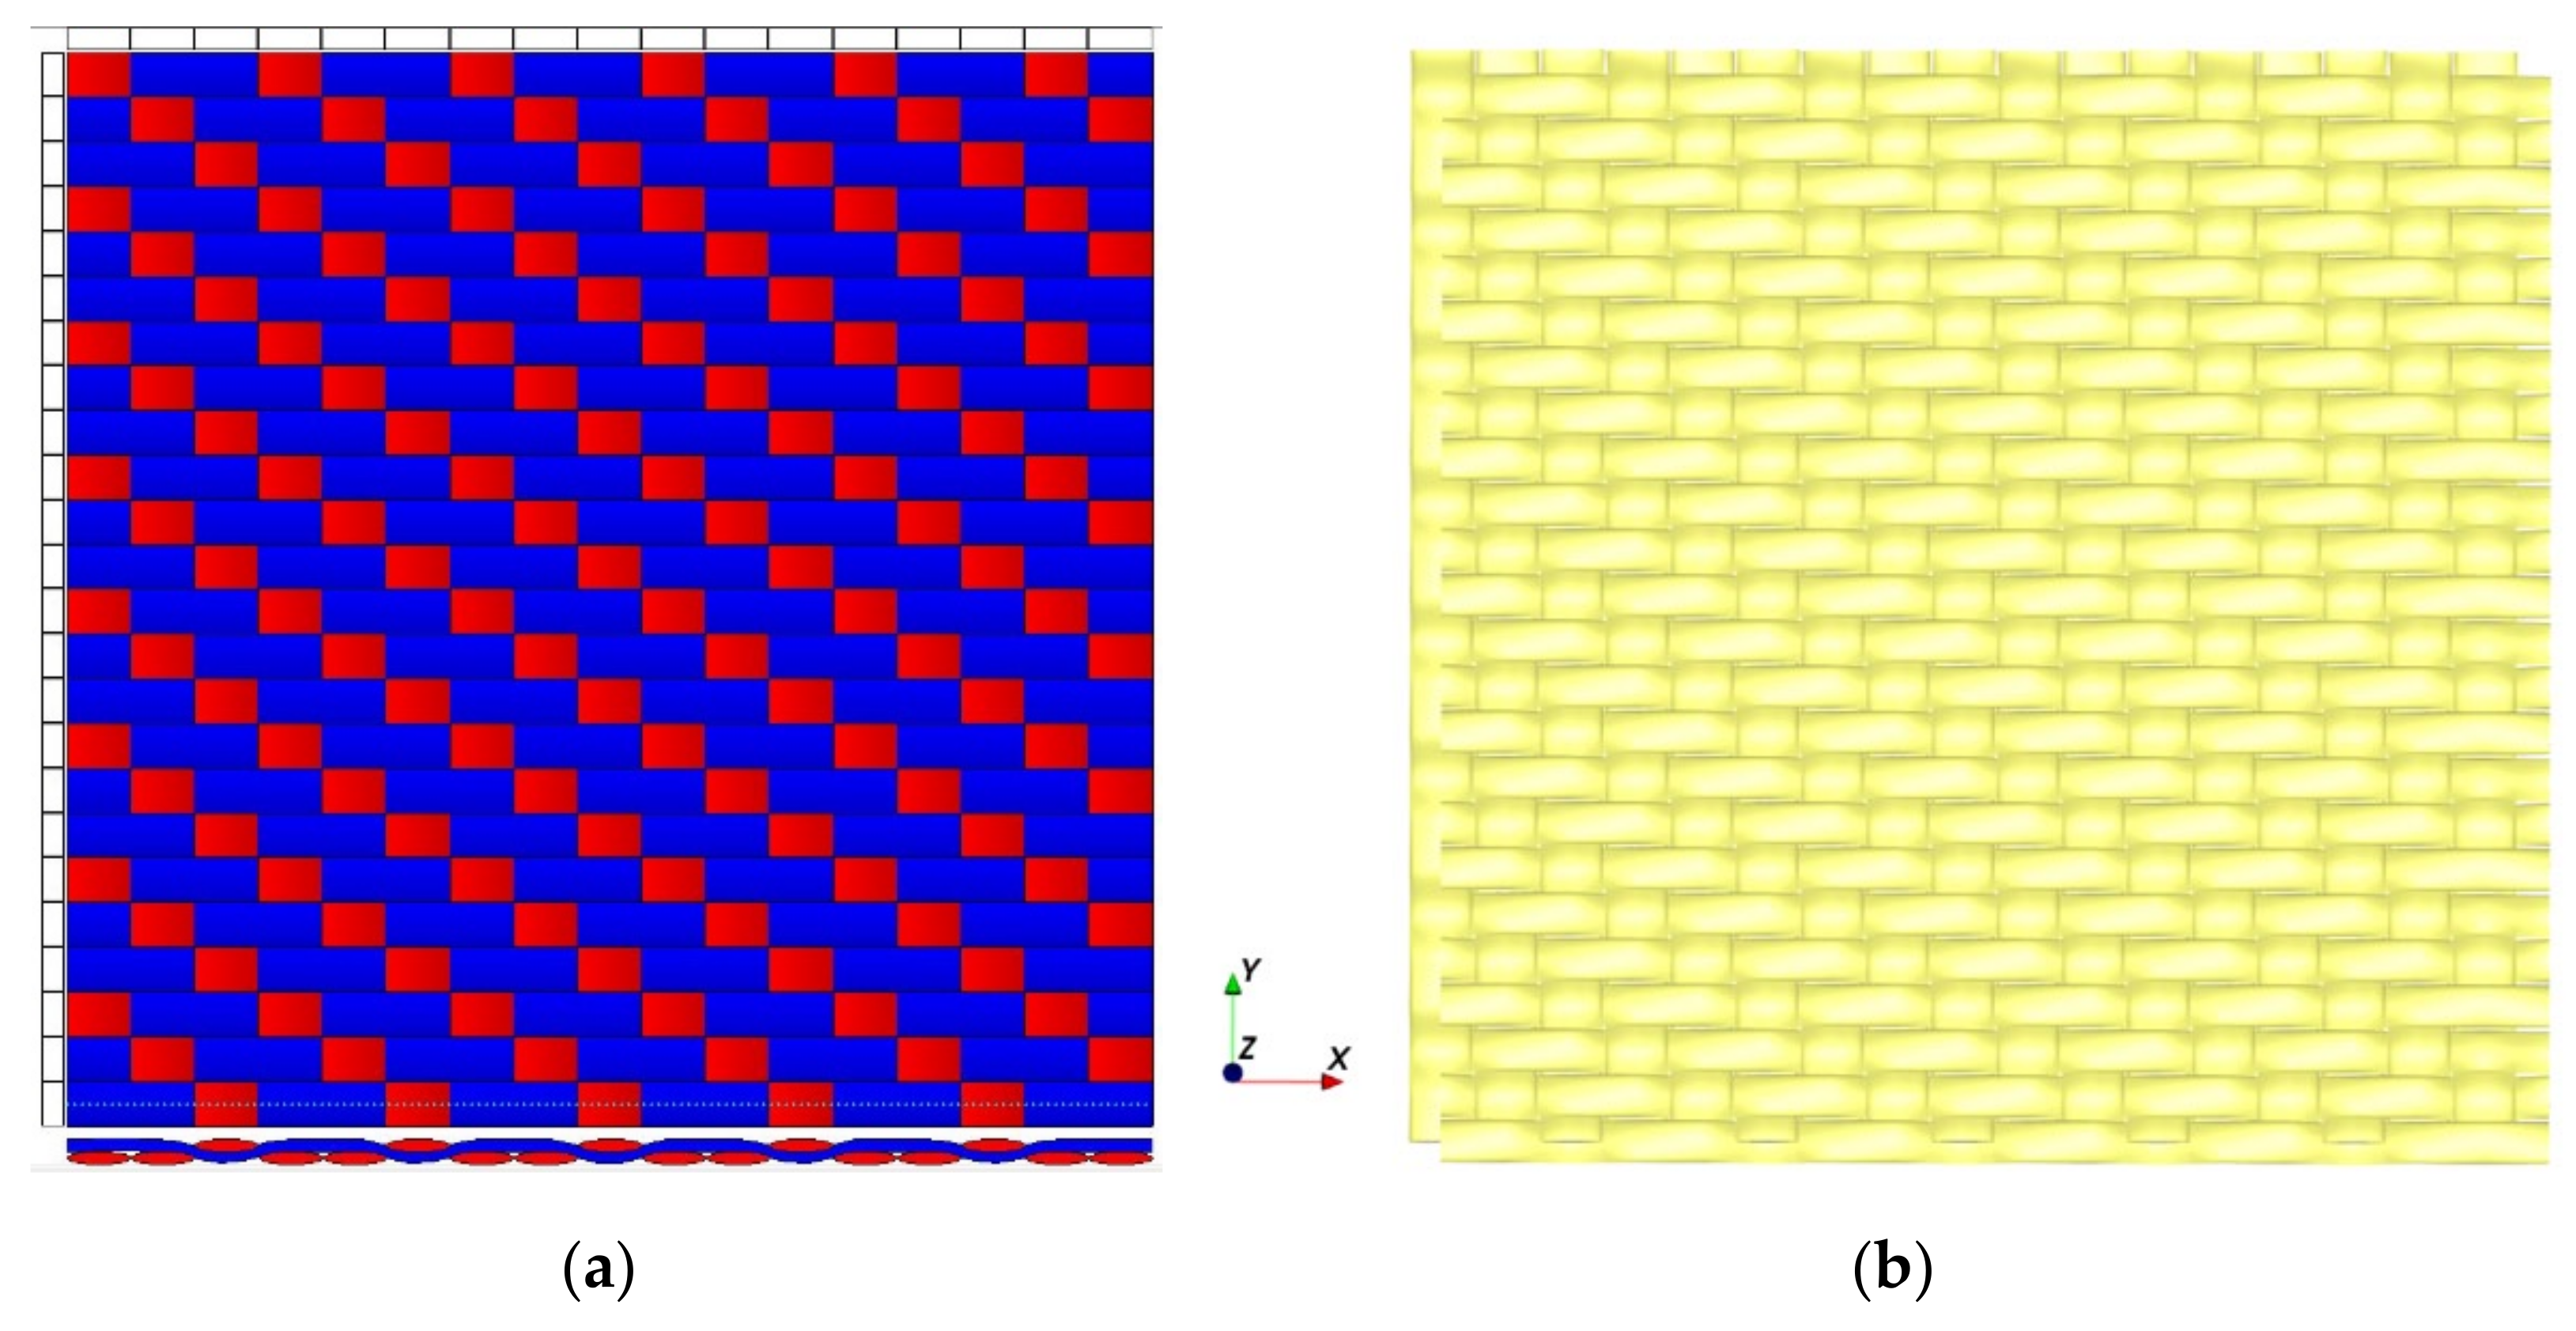
2.2.5. Numerical Modeling of Electromagnetic Interference Shielding Effectiveness
3. Results and Discussion
3.1. Morphological Characterization
3.2. PANI Surface Weight and Layer Thickness vs. Number of Layers
3.3. Surface Resistance—PANI and PPy Surfaces Weight vs. Number of Layers
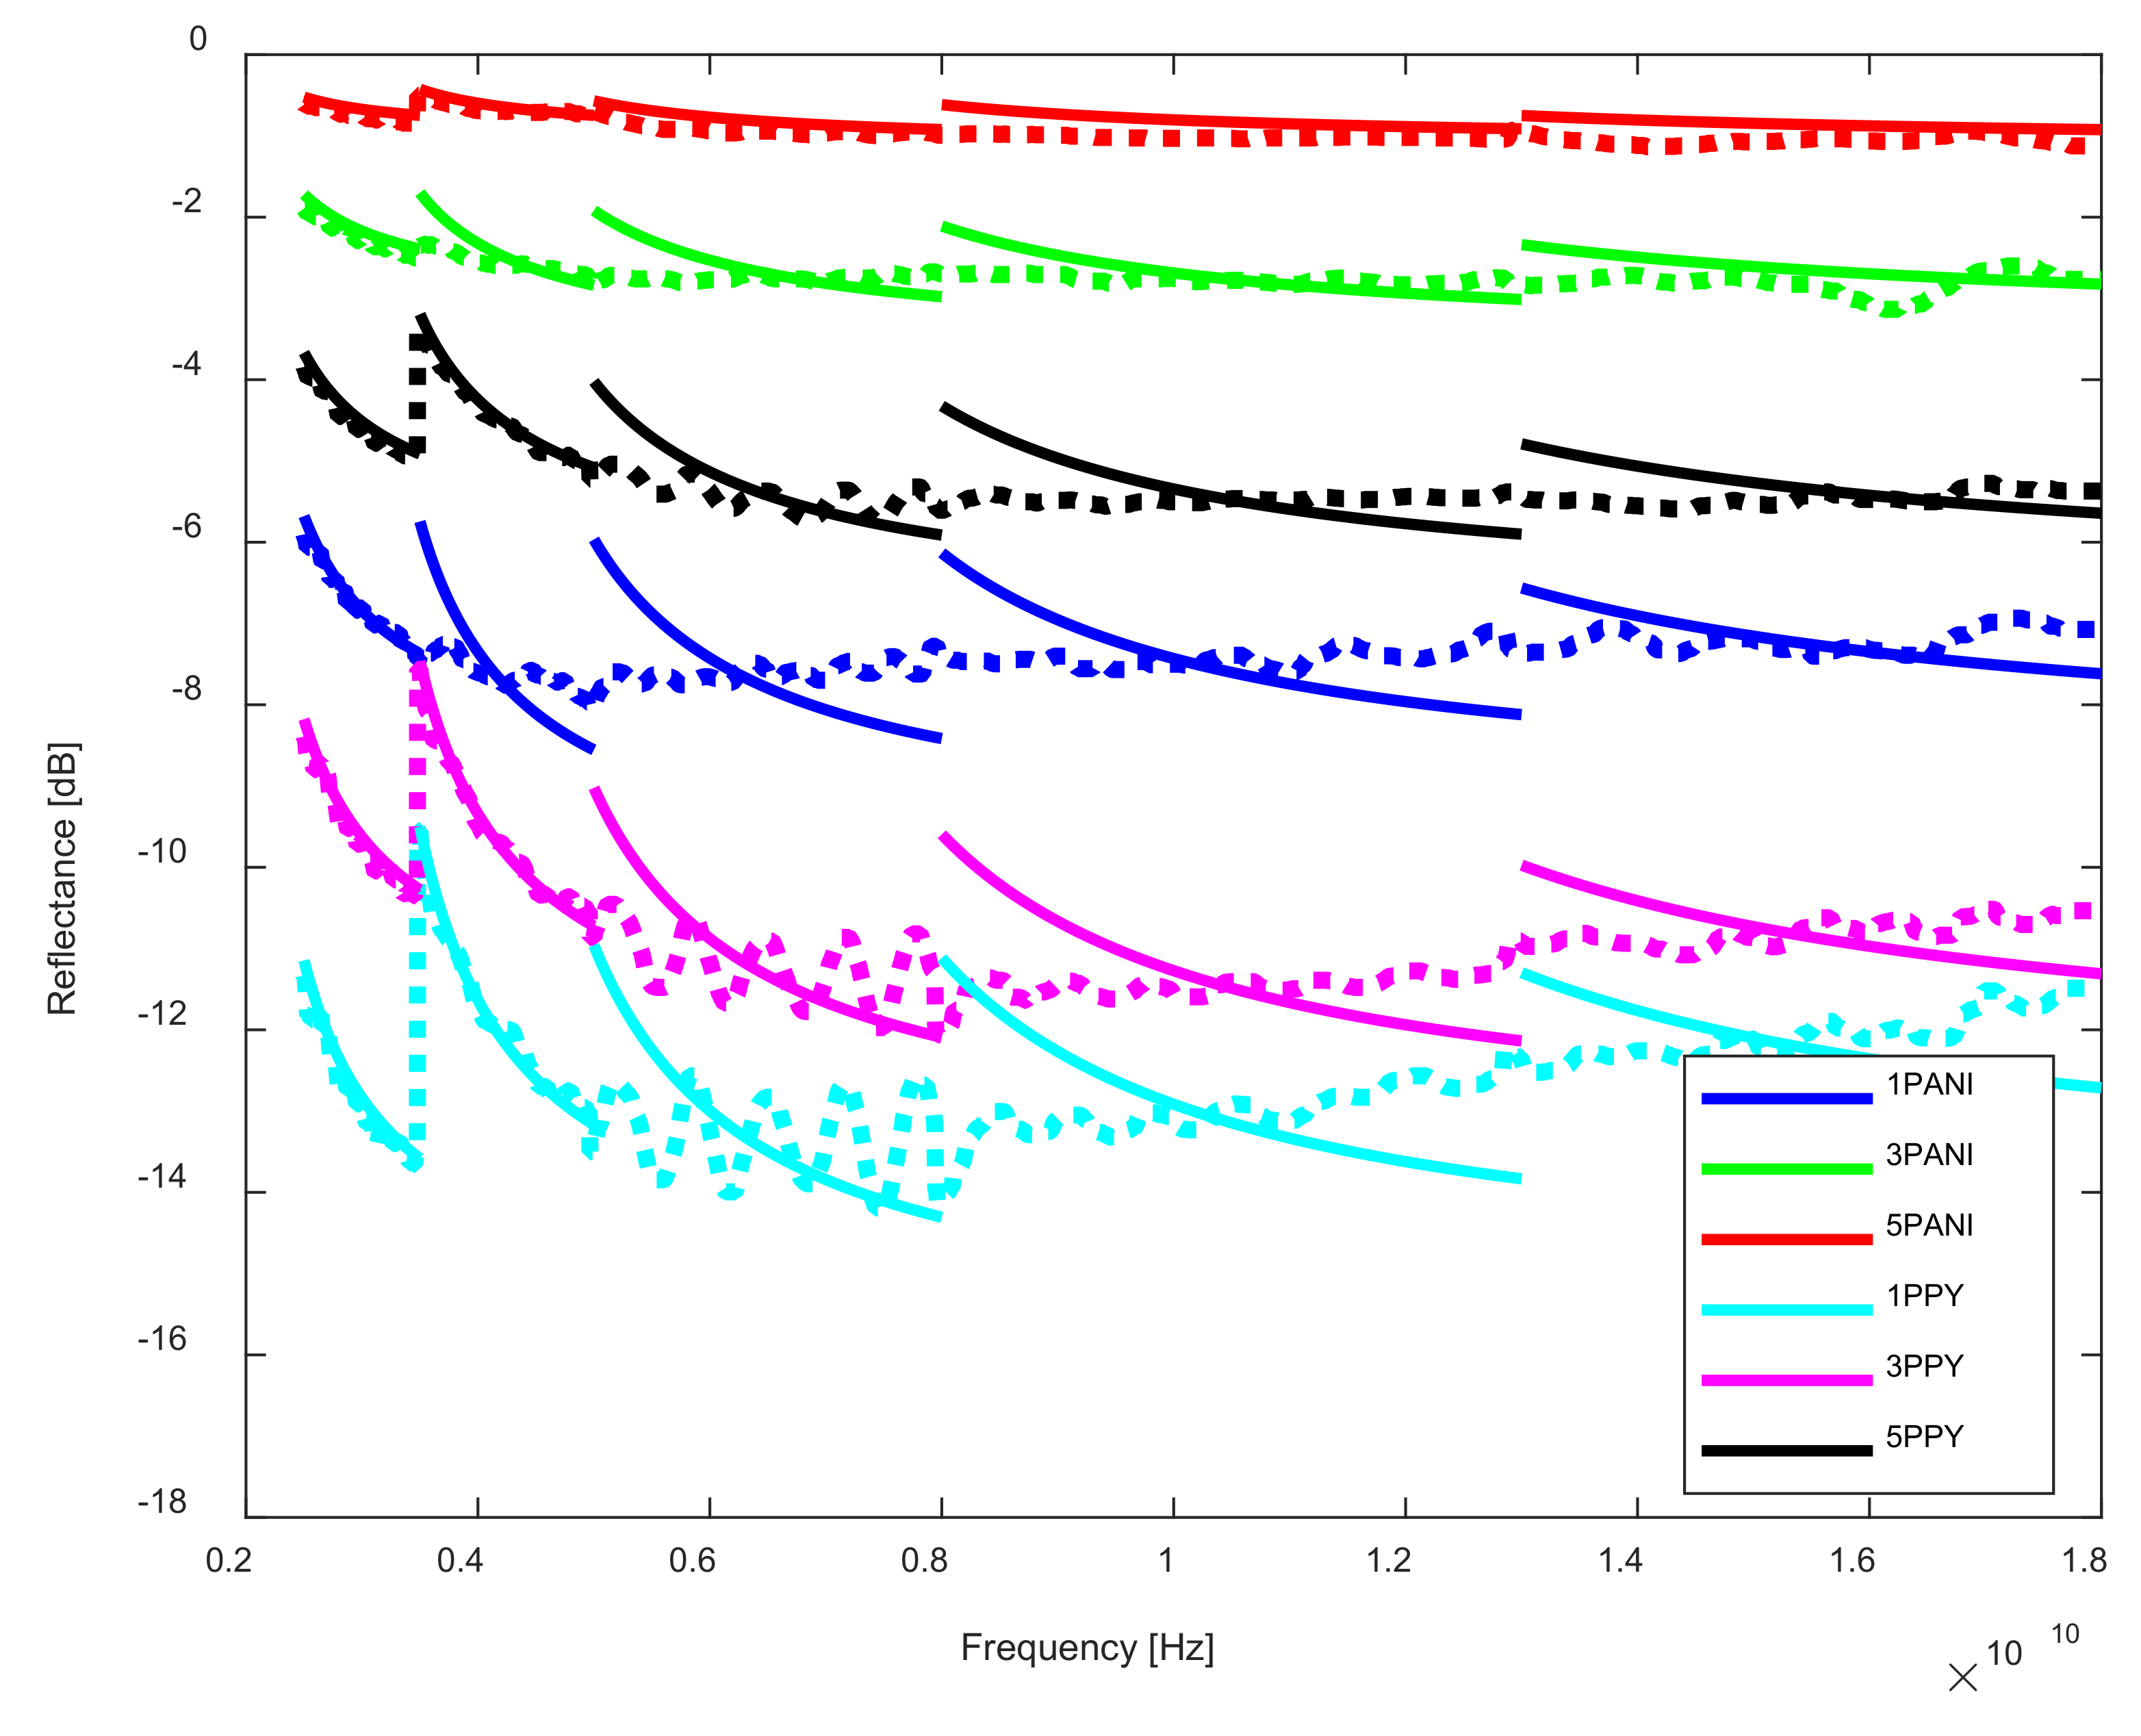
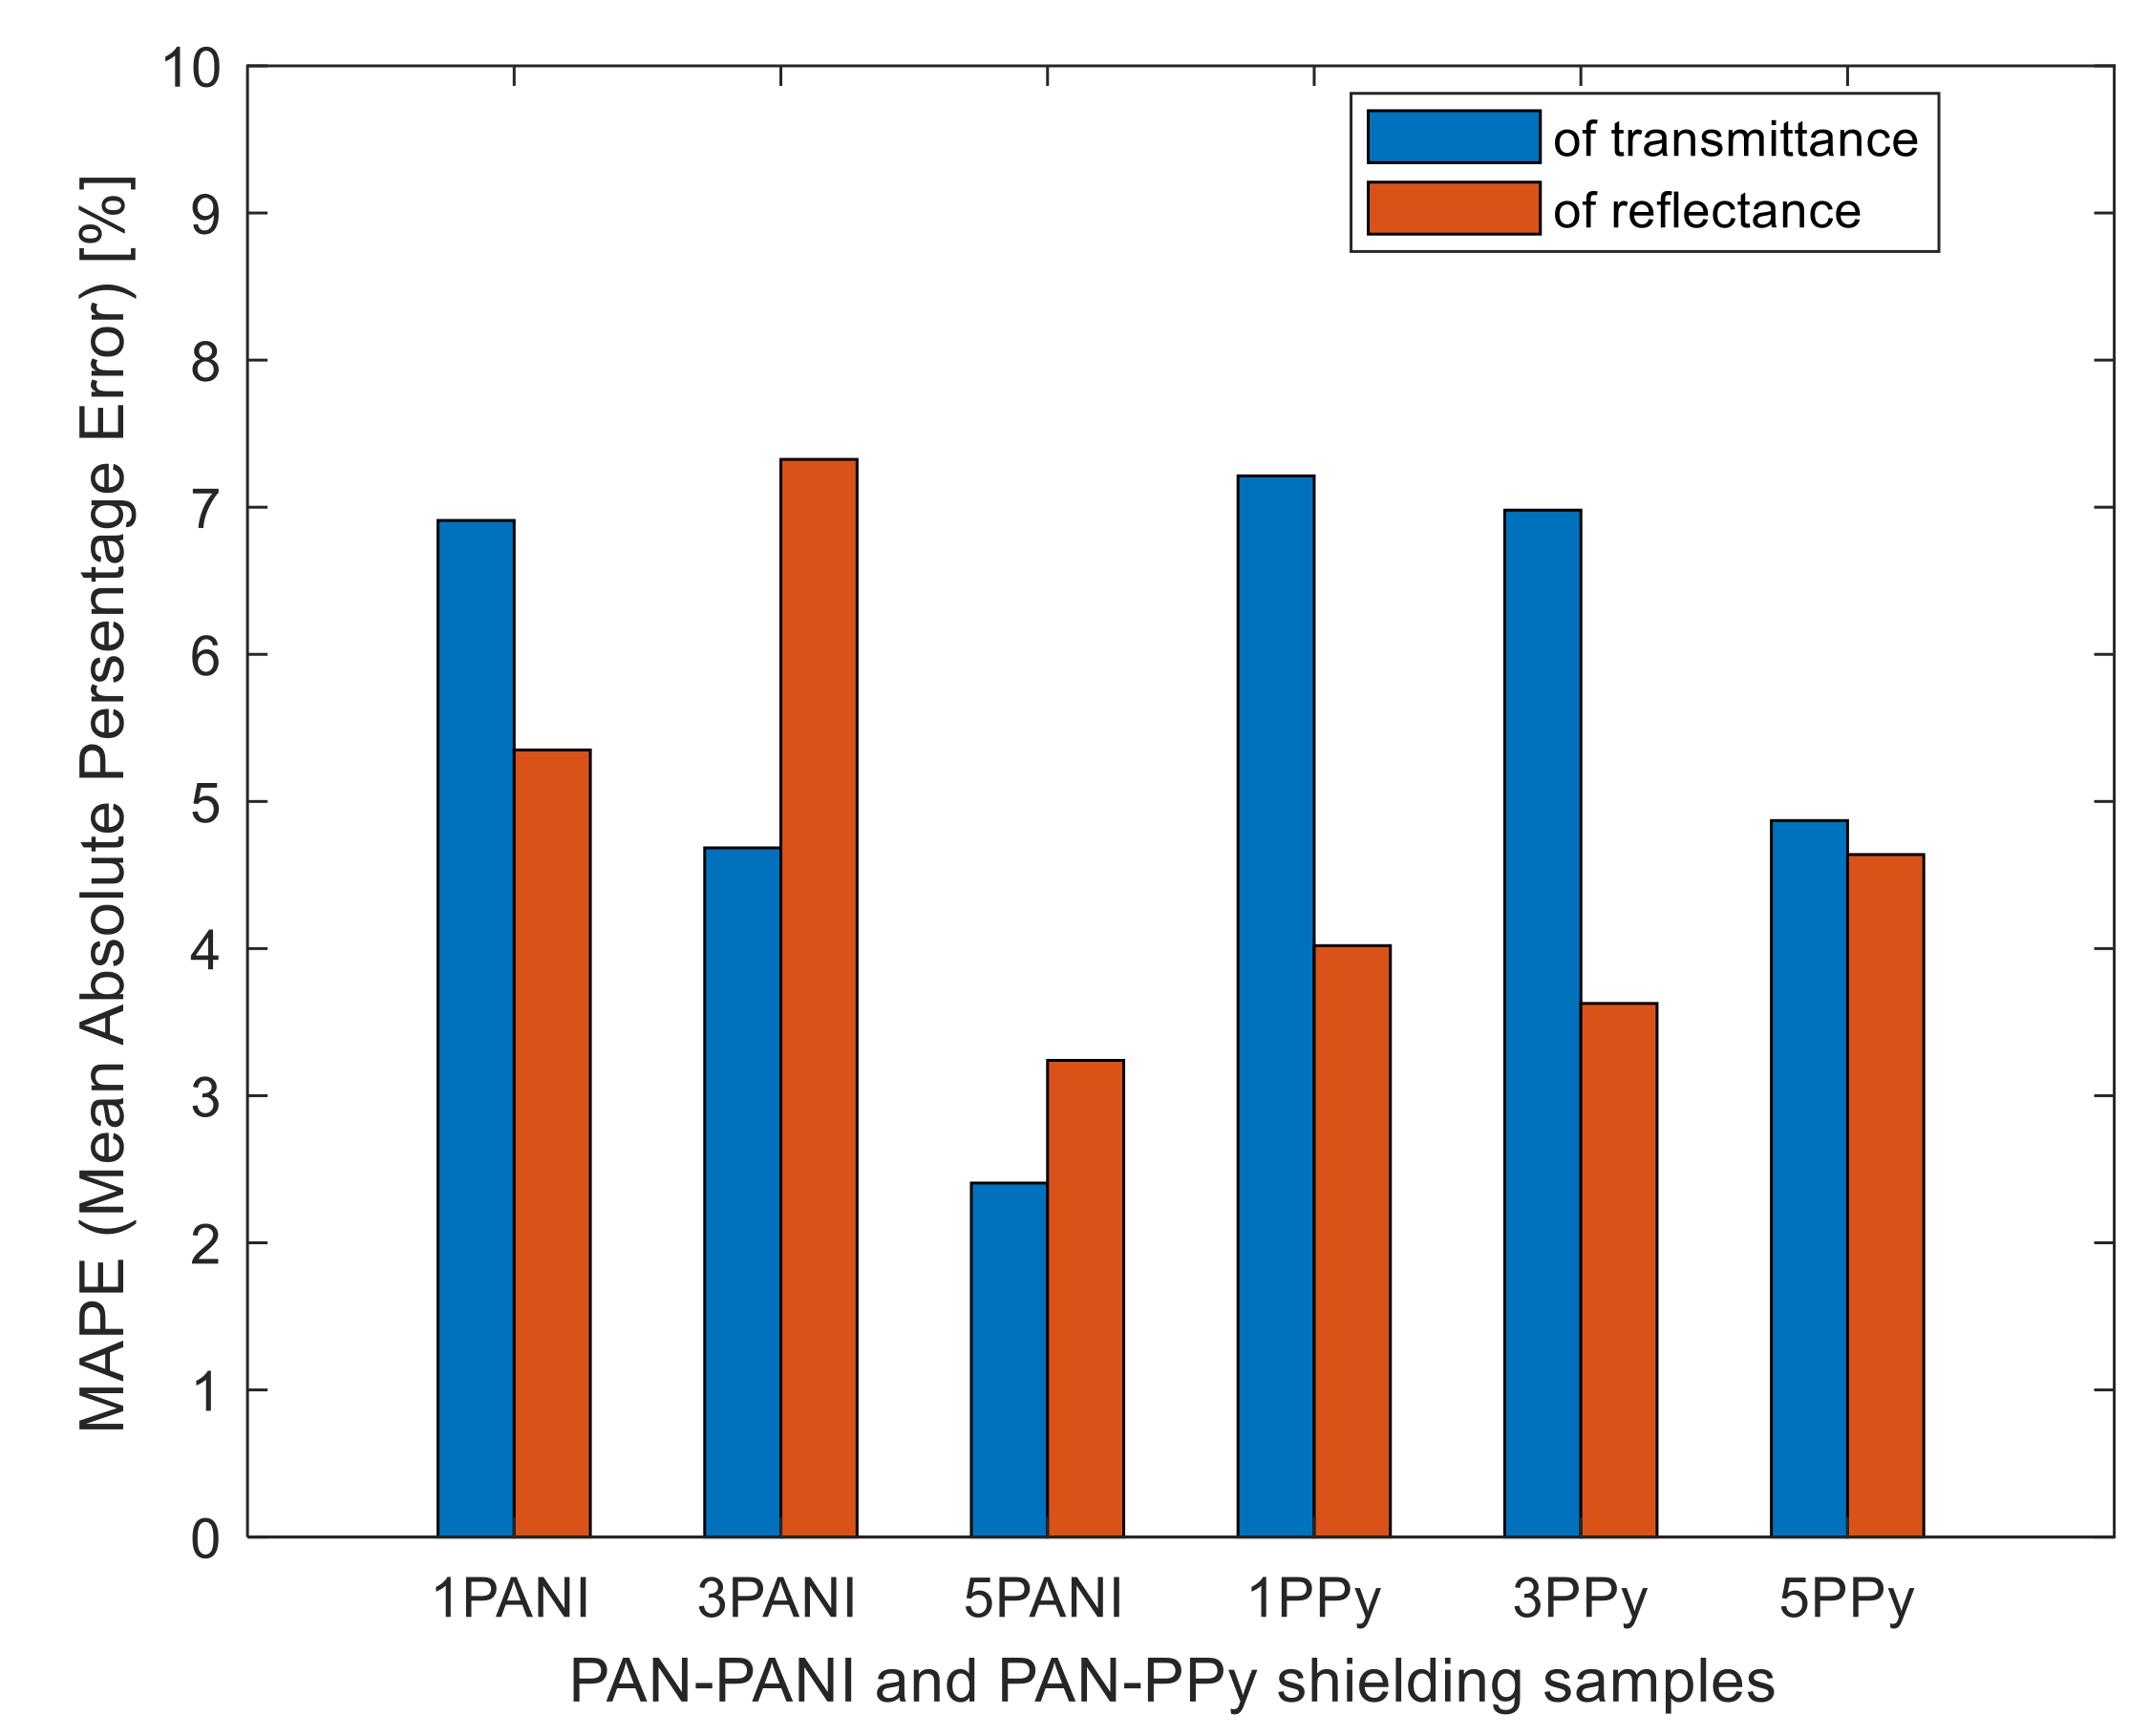
3.4. Effectiveness of Electromagnetic Shielding
- —modulus of measurement transmittance data;
- —modulus of model transmittance data;
- —modulus of measurement reflectance data;
- —modulus of model reflectance data.
4. Conclusions
Author Contributions
Funding
Institutional Review Board Statement
Informed Consent Statement
Data Availability Statement
Conflicts of Interest
References
- Aphesteguy, J.C.; Damiani, A.; DiGiovanni, D.; Jacobo, S.E. Microwave absorption behavior of a polyaniline magnetic composite in the X-band. Phys. B Condens. Matter 2012, 407, 3168–3171. [Google Scholar] [CrossRef]
- Aphesteguy, J.C.; Damiani, A.; DiGiovanni, D.; Jacobo, S.E. Microwave-absorbing characteristics of epoxy resin composites containing nanoparticles of NiZn- and NiCuZn-ferrites. Phys. B Condens. Matter 2009, 404, 2713–2716. [Google Scholar] [CrossRef]
- Ohlan, A.; Singh, K.; Chandra, A.; Dhawan, S.K. Microwave absorption properties of conducting polymer composite with barium ferrite nanoparticles in 12.4–18 GHz. Appl. Phys. Lett. 2008, 93, 053114. [Google Scholar] [CrossRef]
- Wen, H.; Cao, M.; Sun, G.; Xu, W.; Wang, D.; Zhang, X.; Hu, C. Hierarchical Three-Dimensional Cobalt Phosphate Microarchitectures: Large-Scale Solvothermal Synthesis, Characterization, and Magnetic and Microwave Absorption Properties. J. Phys. Chem. C 2008, 112, 15948–15955. [Google Scholar] [CrossRef]
- Das, C.K.; Mandal, A. Microwave Absorbing Properties of DBSA-doped Polyaniline/BaTiO3-Ni0.5Zn0.5Fe2O4 Nanocomposites. J. Mater. Sci. Res. 2012, 1, 1. [Google Scholar] [CrossRef]
- Colaneri, N.F.; Schacklette, L.W. EMI shielding measurements of conductive polymer blends. IEEE Trans. Instrum. Meas. 1992, 41, 291–297. [Google Scholar] [CrossRef]
- Lin, M.-S.; Chen, C.H. Plane-wave shielding characteristics of anisotropic laminated composites. IEEE Trans. Electromagn. Compat. 1993, 35, 21–27. [Google Scholar] [CrossRef]
- Naishadham, K. Shielding effectiveness of conductive polymers. IEEE Trans. Electromagn. Compat. 1992, 34, 47–50. [Google Scholar] [CrossRef]
- Saib, A.; Bednarz, L.; Daussin, R.; Bailly, C.; Lou, X.; Thomassin, J.-M.; Pagnoulle, C.; Detrembleur, C.; Jerome, R.; Huynen, I. Carbon nanotube composites for broadband microwave absorbing materials. IEEE Trans. Microw. Theory Tech. 2006, 54, 2745–2754. [Google Scholar] [CrossRef]
- Villacorta, B.S.; Ogale, A.A.; Hubing, T.H. Effect of heat treatment of carbon nanofibers on the electromagnetic shielding effectiveness of linear low density polyethylene nanocomposites. Polym. Eng. Sci. 2013, 53, 417–423. [Google Scholar] [CrossRef]
- Saini, P.; Aror, M. Microwave Absorption and EMI Shielding Behavior of Nanocomposites Based on Intrinsically Conducting Polymers, Graphene and Carbon Nanotubes. In New Polymers for Special Applications; InTech: London, UK, 2012. [Google Scholar] [CrossRef]
- Saini, P.; Choudhary, V.; Singh, B.P.; Mathur, R.B.; Dhawan, S.K. Enhanced microwave absorption behavior of polyaniline-CNT/polystyrene blend in 12.4–18.0 GHz range. Synth. Met. 2011, 161, 1522–1526. [Google Scholar] [CrossRef]
- Hoang, N.H.; Wojkiewicz, J.-L.; Miane, J.-L.; Biscarro, R.S. Lightweight electromagnetic shields using optimized polyaniline composites in the microwave band. Polym. Adv. Technol. 2007, 18, 257–262. [Google Scholar] [CrossRef]
- Saini, P.; Choudhary, V.; Singh, B.P.; Mathur, R.B.; Dhawan, S.K. Polyaniline–MWCNT nanocomposites for microwave absorption and EMI shielding. Mater. Chem. Phys. 2009, 113, 919–926. [Google Scholar] [CrossRef]
- Wang, Y.; Jing, X. Intrinsically conducting polymers for electromagnetic interference shielding. Polym. Adv. Technol. 2005, 16, 344–351. [Google Scholar] [CrossRef]
- Kim, M.S.; Kim, H.K.; Byun, S.W.; Jeong, S.H.; Hong, Y.K.; Joo, J.S.; Song, K.T.; Kim, J.K.; Lee, C.J.; Lee, J.Y. PET fabric/polypyrrole composite with high electrical conductivity for EMI shielding. Synth. Met. 2002, 126, 233–239. [Google Scholar] [CrossRef]
- Kaynak, A.; Håkansson, E.; Amiet, A. The influence of polymerization time and dopant concentration on the absorption of microwave radiation in conducting polypyrrole coated textiles. Synth. Met. 2009, 159, 1373–1380. [Google Scholar] [CrossRef]
- Saini, P.; Choudhary, V.; Dhawan, S.K. Improved microwave absorption and electrostatic charge dissipation efficiencies of conducting polymer grafted fabrics prepared via in situ polymerization. Polym. Adv. Technol. 2012, 23, 343–349. [Google Scholar] [CrossRef]
- Zhu, X.; Li, X. Current status and research direction of electromagnetic shielding fabric. In Proceedings of the 2011 Cross Strait Quad-Regional Radio Science and Wireless Technology Conference, Harbin, China, 26–30 July 2011; IEEE: Piscataway, NJ, USA, 2011; pp. 104–107. [Google Scholar]
- Saini, P.; Choudhary, V. Conducting polymer coated textile based multilayered shields for suppression of microwave radiations in 8.2–12.4 GHz range. J. Appl. Polym. Sci. 2013, 129, 2832–2839. [Google Scholar] [CrossRef]
- Dhawan, S.; Singh, N.; Venkatachalam, S. Shielding behaviour of conducting polymer-coated fabrics in X-band, W-band and radio frequency range. Synth. Met. 2002, 129, 261–267. [Google Scholar] [CrossRef]
- Muthukumar, N.; Thilagavathi, G. Development and characterization of electrically conductive polyaniline coated fabrics. Indian J. Chem. Technol. 2012, 19, 434–441. [Google Scholar]
- Håkansson, E.; Amiet, A.; Kaynak, A. Electromagnetic shielding properties of polypyrrole/polyester composites in the 1–18 GHz frequency range. Synth. Met. 2006, 156, 917–925. [Google Scholar] [CrossRef]
- Wojkiewicz, J.-L.; Fauveaux, S.; Miane, J.-L. Electromagnetic shielding properties of polyaniline composites. Synth. Met. 2003, 135–136, 127–128. [Google Scholar] [CrossRef]
- Engin, F.Z.; Usta, I. Electromagnetic shielding effectiveness of polyester fabrics with polyaniline deposition. Text. Res. J. 2014, 84, 903–912. [Google Scholar] [CrossRef]
- Saini, P.; Choudhary, V. Electrostatic charge dissipation and electromaghetic interference shielding response of polyaniline based conducting fabrics. Indian J. Pure Appl. Phys. 2013, 51, 112–117. [Google Scholar]
- Folgueras, L.d.C.; Nohara, E.L.; Faez, R.; Rezende, M.C. Dielectric microwave absorbing material processed by impregnation of carbon fiber fabric with polyaniline. Mater. Res. 2007, 10, 95–99. [Google Scholar] [CrossRef]
- Phang, S.W.; Tadokoro, M.; Watanabe, J.; Kuramoto, N. Microwave absorption behaviors of polyaniline nanocomposites containing TiO2 nanoparticles. Curr. Appl. Phys. 2008, 8, 391–394. [Google Scholar] [CrossRef]
- Stejskal, J.; Gilbert, R.G. Polyaniline. Preparation of a conducting polymer (IUPAC Technical Report). Pure Appl. Chem. 2002, 74, 857–867. [Google Scholar] [CrossRef]
- MacDiarmid, A.G.; Epstein, A.J. Secondary doping in polyaniline. Synth. Met. 1995, 69, 85–92. [Google Scholar] [CrossRef]
- Stempien, Z.; Rybicki, T.; Rybicki, E.; Kozanecki, M.; Szynkowska, M.I. In-situ deposition of polyaniline and polypyrrole electroconductive layers on textile surfaces by the reactive ink-jet printing technique. Synth. Met. 2015, 202, 49–62. [Google Scholar] [CrossRef]
- Dhawan, S.; Singh, N.; Venkatachalam, S. Shielding effectiveness of conducting polyaniline coated fabrics at 101 GHz. Synth. Met. 2001, 125, 389–393. [Google Scholar] [CrossRef]
- Bhadra, S.; Khastgir, D.; Singha, N.K.; Lee, J.H. Progress in preparation, processing and applications of polyaniline. Prog. Polym. Sci. 2009, 34, 783–810. [Google Scholar] [CrossRef]
- Kim, B.; Koncar, V.; Devaux, E.; Dufour, C.; Viallier, P. Electrical and morphological properties of PP and PET conductive polymer fibers. Synth. Met. 2004, 146, 167–174. [Google Scholar] [CrossRef]
- Foroughi, J.; Spinks, G.M.; Wallace, G.G. Conducting Polymer Fibers. In Handbook of Smart Textiles; Springer: Singapore, 2014; pp. 1–27. [Google Scholar]
- Knittel, D.; Schollmeyer, E. Electrically high-conductive textiles. Synth. Met. 2009, 159, 1433–1437. [Google Scholar] [CrossRef]
- Loffredo, F.; Burrasca, G.; Quercia, L.; Sala, D.D. Gas Sensor Devices Obtained by Ink-jet Printing of Polyaniline Suspensions. Macromol. Symp. 2007, 247, 357–363. [Google Scholar] [CrossRef]
- De Gans, B.-J.; Duineveld, P.C.; Schubert, U.S. Inkjet Printing of Polymers: State of the Art and Future Developments. Adv. Mater. 2004, 16, 203–213. [Google Scholar] [CrossRef]
- Tekin, E.; de Gans, B.-J.; Schubert, U.S. Ink-jet printing of polymers? From single dots to thin film libraries. J. Mater. Chem. 2004, 14, 2627. [Google Scholar] [CrossRef]
- Bietsch, A.; Zhang, J.; Hegner, M.; Lang, H.P.; Gerber, C. Rapid functionalization of cantilever array sensors by inkjet printing. Nanotechnology 2004, 15, 873–880. [Google Scholar] [CrossRef]
- Perumalraj, R.; Dasaradan, B.S. Electromagnetic Shielding Effectiveness of Doubled Copper-Cotton Yarn Woven Materials. Fibres Text. East. Eur. 2010, 18, 74–80. [Google Scholar]
- Neruda, M.; Vojtech, L. Electromagnetic Shielding Effectiveness of Woven Fabrics with High Electrical Conductivity: Complete Derivation and Verification of Analytical Model. Materials 2018, 11, 1657. [Google Scholar] [CrossRef]
- Rybicki, T. EMI Shielding and Reflection From Textile Mesh Grids Compared With Analytic Models. IEEE Trans. Electromagn. Compat. 2019, 61, 372–380. [Google Scholar] [CrossRef]
- Radulescu, I.R.; Surdu, L.; Scarlat, R.; Constantin, C.; Mitu, B.; Morarr, C.; Costea, M. Modelling the woven structures with inserted conductive yarns coated with magnetron plasma and testing their shieldning effectiveness. Textiles 2021, 1, 4–20. [Google Scholar] [CrossRef]
- Al Achkar, G.; Pichon, L.; Daniel, L.; Benjelloun, N. Effective Electromagnetic Properties of Woven Fiber Composites for Shielding Applications. IEEE Trans. Electromagn. Compat. 2020, 62, 1082–1089. [Google Scholar] [CrossRef]
- Taflowe, A.; Hagness, S.C. Computational Electrodynamics: The Finite-Difference Time-Domain Method, 3rd ed.; Artech House: Norwood, MA, USA, 2005. [Google Scholar]
- Liu, Z.; Su, Y.; Li, Y.; Pan, Z.; Wang, X. Numerical calculation of shielding effectiveness of electromagnetic shielding fabric based on finite difference time domain. Int. J. Appl. Electromagn. Mech. 2016, 50, 593–603. [Google Scholar] [CrossRef]
- Kubík, Z.; Skála, J. Shielding Effectiveness Simulation of Small Perforated Shielding Enclosures Using FEM. Energies 2016, 9, 129. [Google Scholar] [CrossRef]
- Harrington, R.F. IEEE/OUP Series on Electromagnetic Wave Theory; Oxford University Press: Oxford, UK, 1993. [Google Scholar]
- Slovenski Inštitut za Standardizacijo. EN 12127. Textiles—Fabrics—Determination of Mass Per Unit Area Using Small Samples; Slovenski Inštitut za Standardizacijo: Ljubljana, Slovenia, 1997. [Google Scholar]
- Slovenski Inštitut za Standardizacijo. EN 1049-2. Textiles—Woven Fabrics—Construction—Methods of Analysis—Part 2: Determination of Number of Threads Per Unit Length; Slovenski Inštitut za Standardizacijo: Ljubljana, Slovenia, 1993. [Google Scholar]
- Van der Pauw, L.J. A method of measuring the resistivity and Hall coefficient on lamellae of arbitrary shape. Philips Tech. Rev. 1958, 20, 220–224. [Google Scholar]
- Tokarska, M. Characterization of electro-conductive textile materials by its biaxial anisotropy coefficient and resistivity. J. Mater. Sci. Mater. Electron. 2019, 30, 4093–4103. [Google Scholar] [CrossRef]
- Tokarska, M. New concept in assessing compactness of woven structure in terms of its resistivity. J. Mater. Sci. Mater. Electron. 2016, 27, 7335–7341. [Google Scholar] [CrossRef]
- Rybicki, T.; Stempień, Z.; Rybicki, E.; Szugajew, L. EMI Shielding Effectiveness of Polyacrylonitrile Fabric with Polyaniline Deposition by Reactive Ink-Jet Printing and Model Approach. IEEE Trans. Electromagn. Compat. 2016, 58, 1025–1032. [Google Scholar] [CrossRef]
- Casey, K.F. Electromagnetic shielding behavior of wire-mesh screens. IEEE Trans. Electromagn. Compat. 1988, 30, 298–306. [Google Scholar] [CrossRef]
- Ilvinas Kancleris, Ž.; Slekas, G.; Matulis, A. Modeling of Two-Dimensional Electron Gas Sheet in FDTD Method. IEEE Trans. Antennas Propag. 2013, 61, 994–996. [Google Scholar] [CrossRef]
- Rubeziene, V.; Baltusnikaite-Guzaitiene, J.; Abraitiene, A.; Sankauskaite, A.; Ragulis, P.; Santos, G.; Pimenta, J. Development and investigation of PEDOT-PSS composition coated fabrics intended for microwave shielding and absorption. Polymers 2021, 13, 1191. [Google Scholar] [CrossRef] [PubMed]
- Orfandis, S.J. Electromagnetic Waves and Antennas; Rutgers University: New Brunswick, NJ, USA, 2002. [Google Scholar]
- Brown, L.P.; Long, A.C. Modeling the geometry of textile reinforcements for composites: TexGen. In Composite Reinforcements for Optimum Performance; Woodhead Publishing: Sawston, UK, 2011; pp. 239–264. [Google Scholar]
- Lin, H.; Brown, L.P.; Long, A.C. Modelling and Simulating Textile Structures Using TexGen. Adv. Mater. Res. 2011, 331, 44–47. [Google Scholar] [CrossRef]
- Diaz, A.F.; Castillo, J.I.; Logan, J.A.; Lee, W.-Y. Electrochemistry of conducting polypyrrole films. J. Electroanal. Chem. Interfacial Electrochem. 1981, 129, 115–132. [Google Scholar] [CrossRef]
- López Cascales, J.J.; Otero, T.F. Molecular dynamic simulation of the hydration and diffusion of chloride ions from bulk water to polypyrrole matrix. J. Chem. Phys. 2004, 120, 1951–1957. [Google Scholar] [CrossRef] [PubMed]
- Paul, C.R. Introduction to Electromagnetic Compatibility; Wiley Series in Microwave and Optical Engineering; Wiley: Hoboken, NJ, USA, 2006; ISBN 9780471758143. [Google Scholar]
- Specified Requirements of Electromagnetic Shielding Textiles FTTS-FA-003. Available online: https://www.ftts.org.tw/images/003e.pdf (accessed on 28 April 2021).


| Sample Type | Number of Layers | Surface Weight, g/m2 | Equivalent Thickness µm |
|---|---|---|---|
| PAN/PANI | 1 | 16.4 | 12.4 |
| 3 | 60.1 | 45.2 | |
| 5 | 105.9 | 79.7 | |
| PAN/PPy | 1 | 13.5 | 9.0 |
| 3 | 47.8 | 31.8 | |
| 5 | 84.3 | 56.2 |
| Sample Type | PAN/PANI | PAN/PPy | ||||
|---|---|---|---|---|---|---|
| Numer of conductive polymer layers | 1 | 3 | 5 | 1 | 3 | 5 |
| Surface resistance, Ω/sq. | 127 | 33 | 20 | 380 | 165 | 96 |
| Sample Number | SE (1/Transmittance) [dB] | Reflectance [dB] | Transmission Coefficient [%] | Reflection Coefficient [%] | Absorption Coefficient [%] |
|---|---|---|---|---|---|
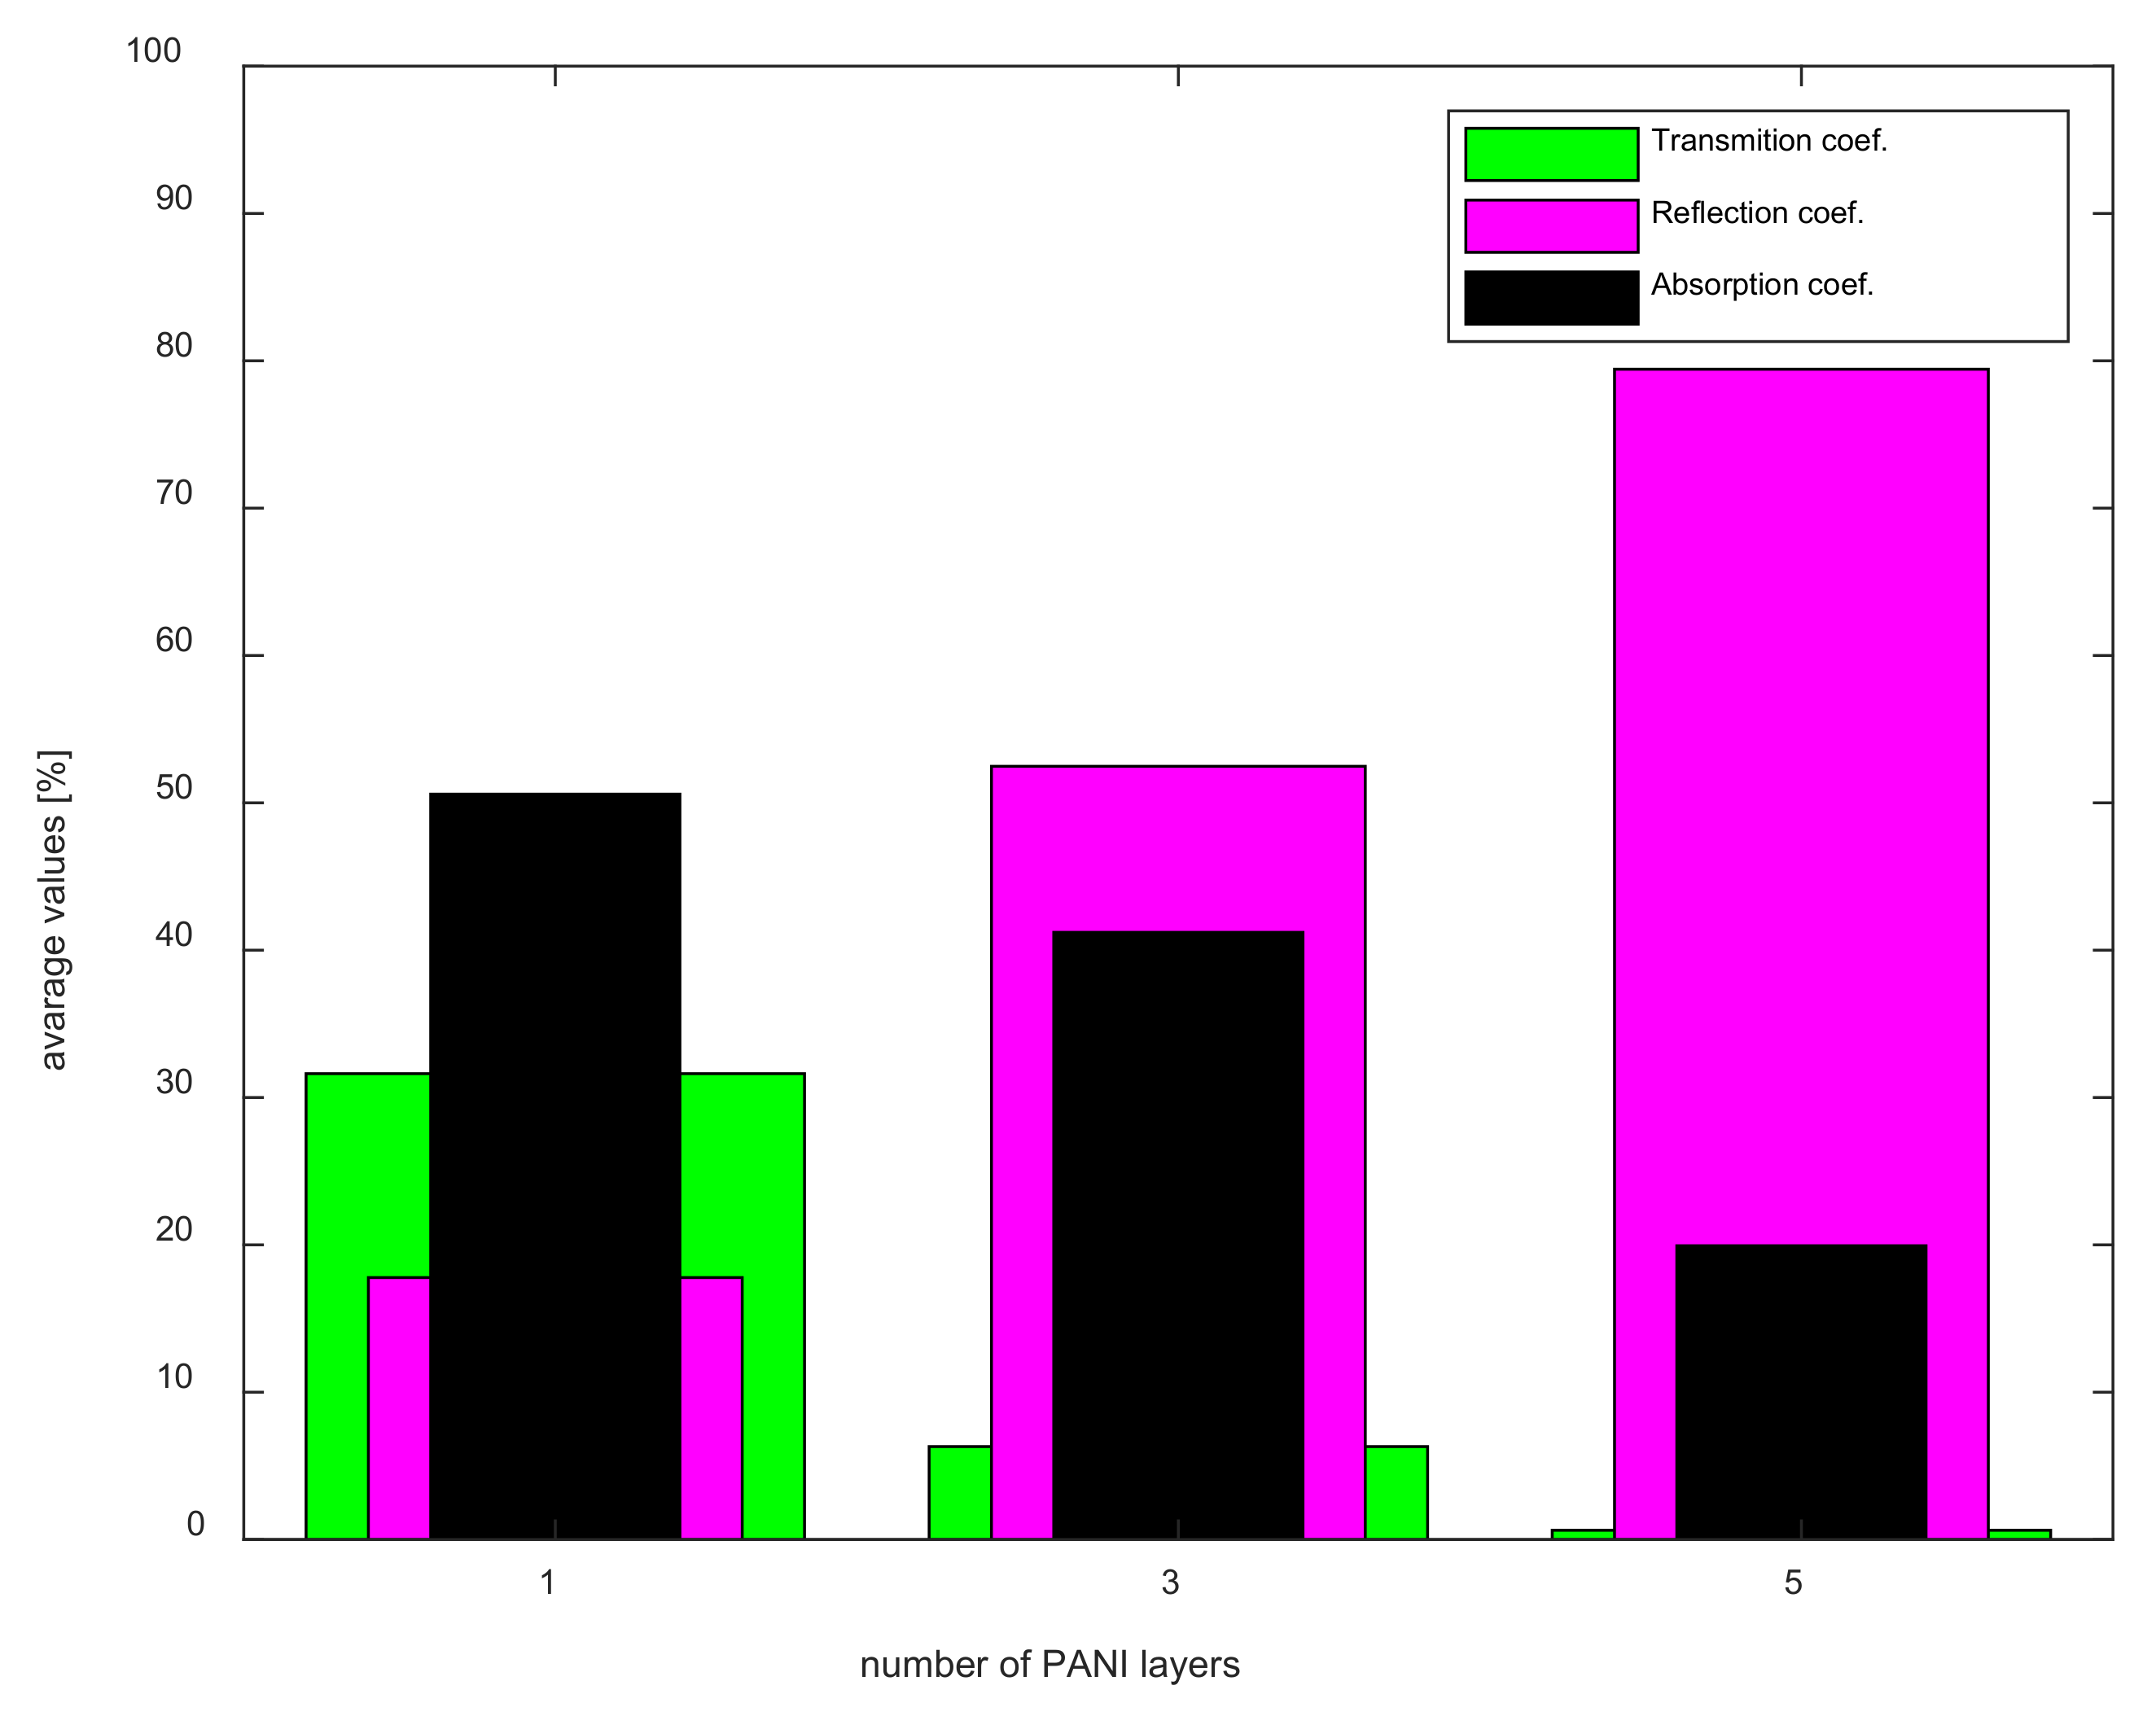
| 1 w PANI | 5.00 | −7.50 | 31.62 | 17.78 | 50.59 |
| 3 w PANI | 12.00 | −2.80 | 6.31 | 52.48 | 41.21 |
| 5 w PANI | 22.00 | −1.00 | 0.63 | 79.43 | 19.94 |
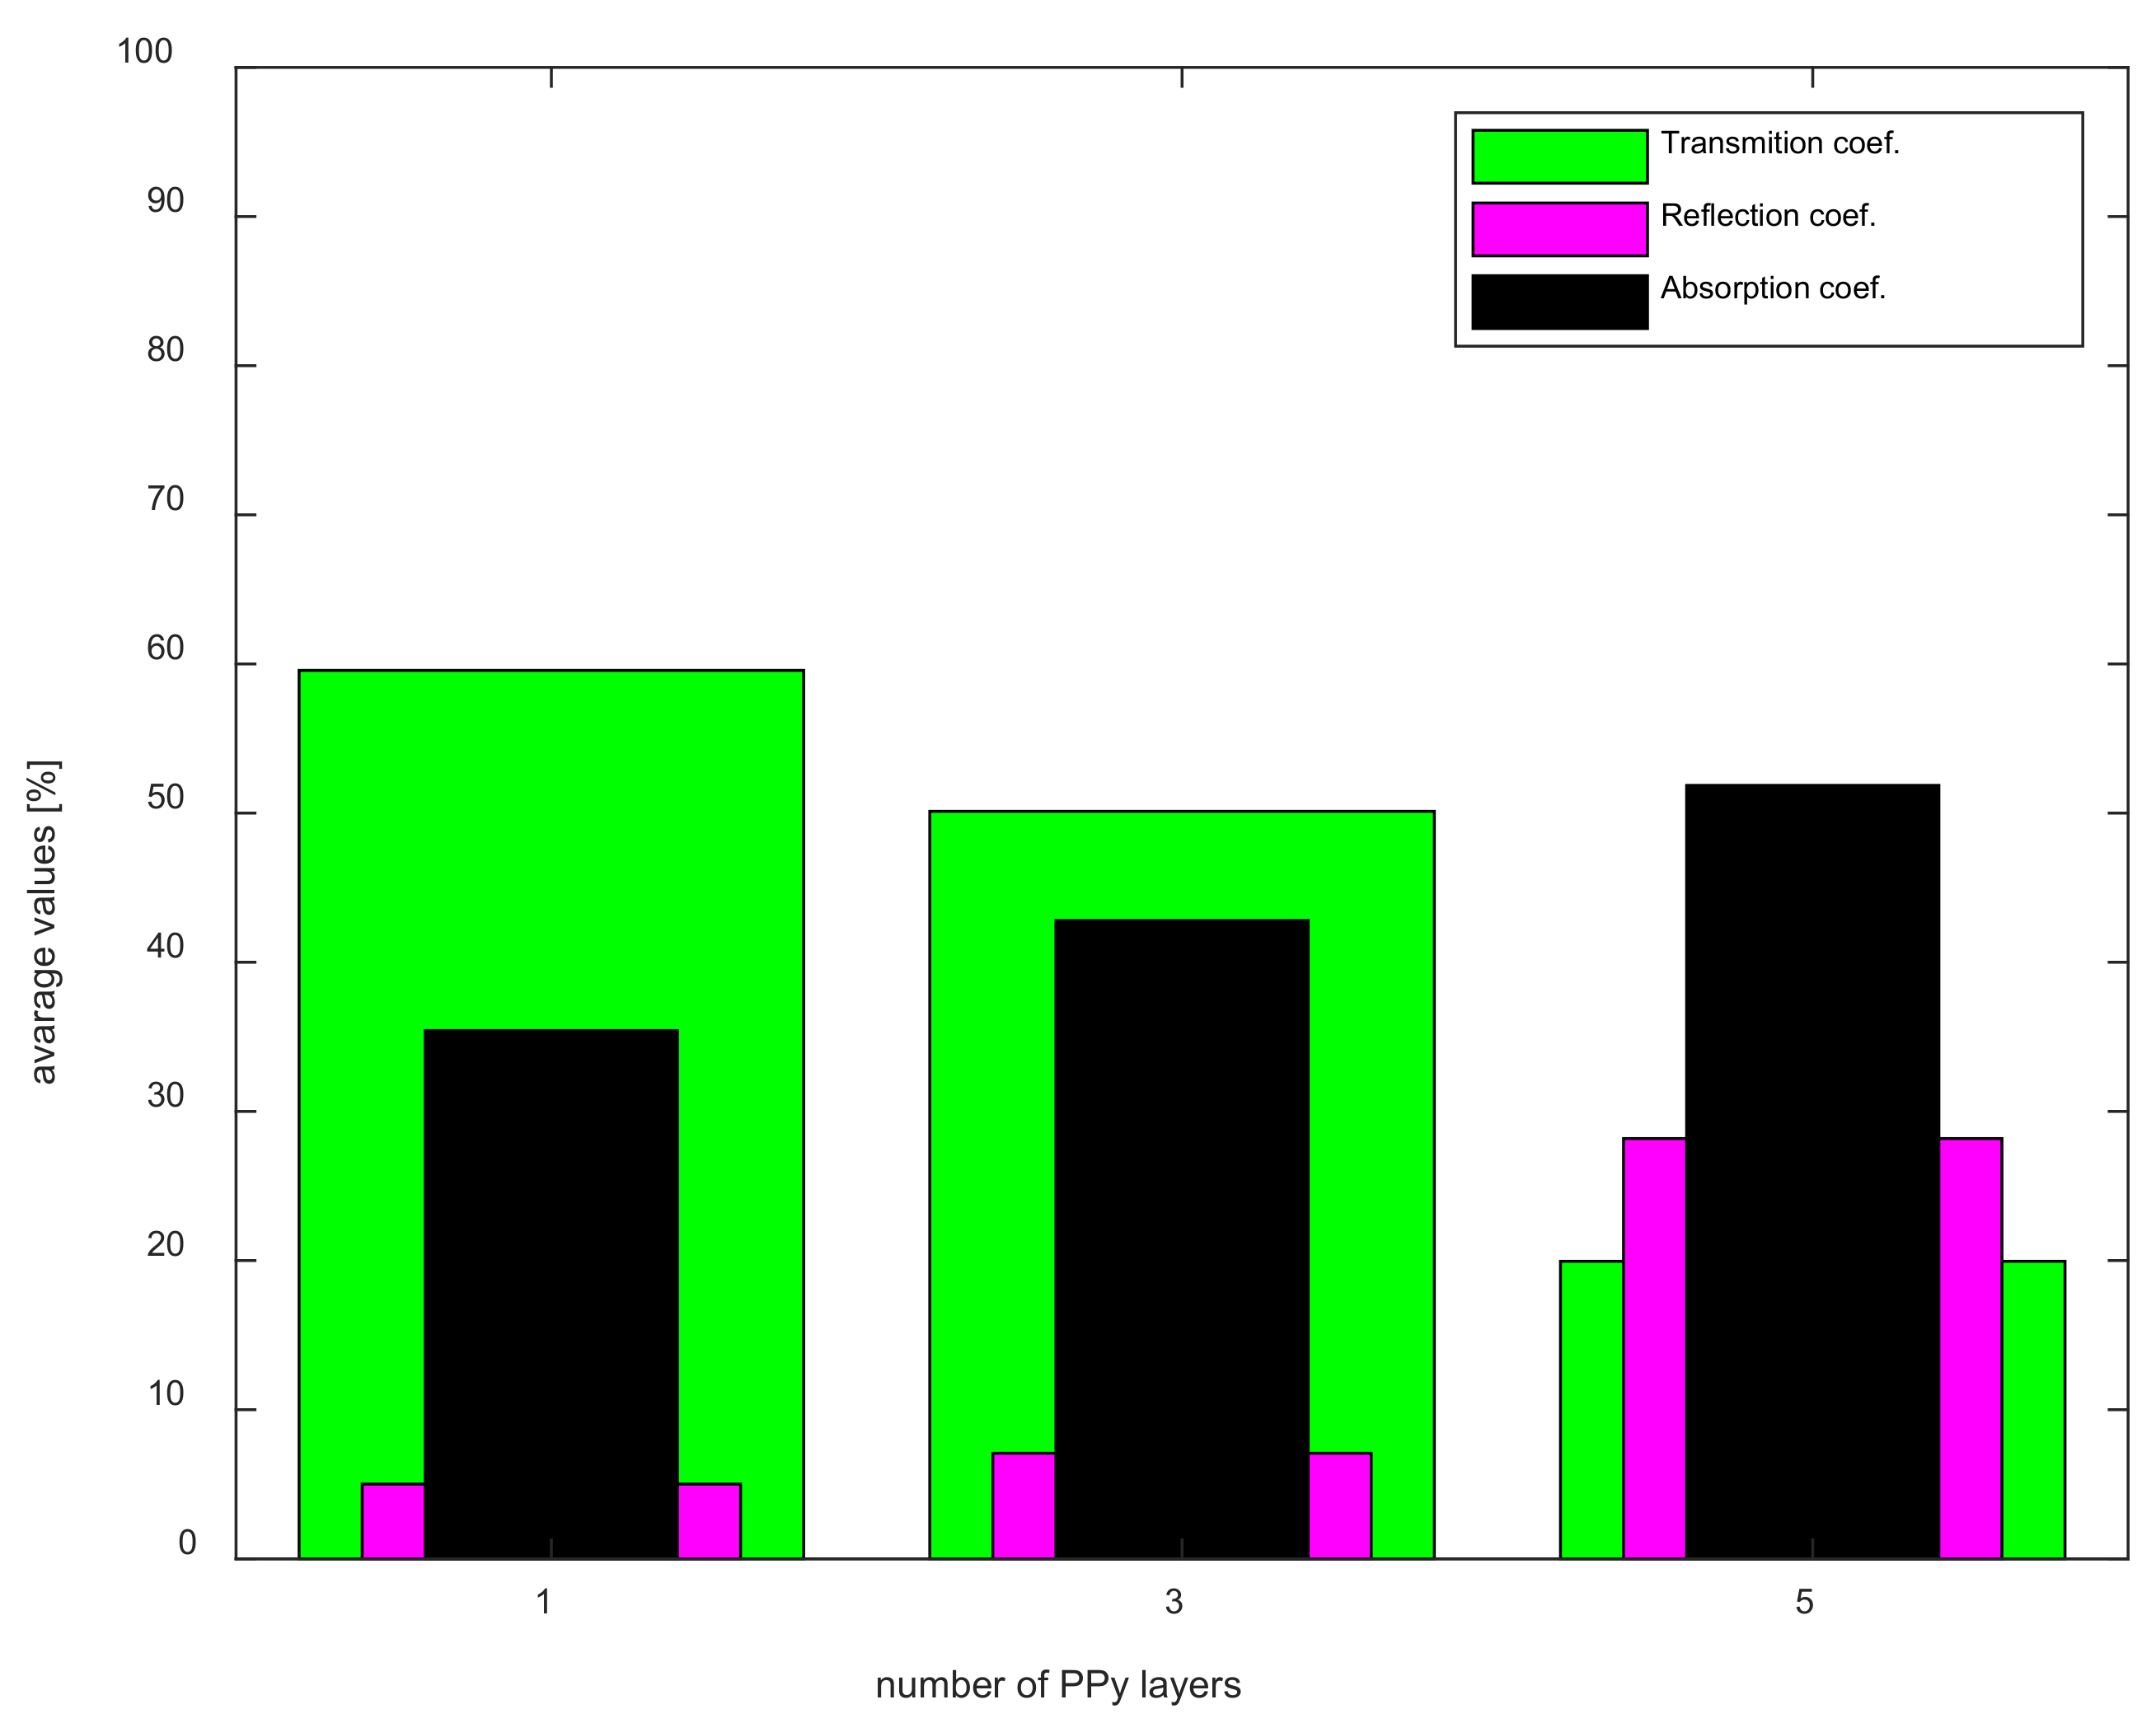
| 1 w PPy | 2.25 | −13.00 | 59.57 | 5.01 | 35.42 |
| 3 w PPy | 3.00 | −11.50 | 50.12 | 7.08 | 42.80 |
| 5 w PPy | 7.00 | −5.50 | 19.95 | 28.18 | 51.86 |
| 1_PANI Layer | 3_PANI Layers | 5_PANI Layers | 1_PPy Layer | 3_PPy Layers | 5_PPy Layers | |||||||
|---|---|---|---|---|---|---|---|---|---|---|---|---|
| Frequency Range | Q1 [%] | Q2 [%] | Q1 [%] | Q2 [%] | Q1 [%] | Q2 [%] | Q1 [%] | Q2 [%] | Q1 [%] | Q2 [%] | Q1 [%] | Q2 [%] |
| 2.5–3.5 GHz | 6.405 | 1.038 | 4.165 | 5.545 | 0.740 | 1.369 | 5.076 | 2.092 | 5.740 | 2.109 | 1.515 | 3.405 |
| 3.5–5.0 GHz | 7.529 | 6.541 | 4.935 | 7.427 | 2.398 | 1.885 | 5.710 | 1.098 | 5.190 | 1.070 | 4.276 | 1.779 |
| 5.0–8.0 GHz | 8.013 | 8.189 | 5.693 | 9.013 | 3.258 | 3.203 | 8.968 | 5.729 | 8.980 | 5.150 | 6.782 | 6.187 |
| 8.0–13.0 GHz | 8.428 | 6.856 | 5.512 | 6.421 | 3.422 | 4.056 | 9.987 | 6.329 | 9.652 | 5.622 | 7.067 | 6.767 |
| 13.0–18.0 GHz | 4.173 | 4.121 | 3.115 | 8.218 | 2.212 | 5.679 | 6.324 | 4.834 | 5.357 | 4.186 | 4.722 | 5.057 |
Publisher’s Note: MDPI stays neutral with regard to jurisdictional claims in published maps and institutional affiliations. |
© 2021 by the authors. Licensee MDPI, Basel, Switzerland. This article is an open access article distributed under the terms and conditions of the Creative Commons Attribution (CC BY) license (https://creativecommons.org/licenses/by/4.0/).
Share and Cite
Rybicki, T.; Stempien, Z.; Karbownik, I. EMI Shielding and Absorption of Electroconductive Textiles with PANI and PPy Conductive Polymers and Numerical Model Approach. Energies 2021, 14, 7746. https://doi.org/10.3390/en14227746
Rybicki T, Stempien Z, Karbownik I. EMI Shielding and Absorption of Electroconductive Textiles with PANI and PPy Conductive Polymers and Numerical Model Approach. Energies. 2021; 14(22):7746. https://doi.org/10.3390/en14227746
Chicago/Turabian StyleRybicki, Tomasz, Zbigniew Stempien, and Iwona Karbownik. 2021. "EMI Shielding and Absorption of Electroconductive Textiles with PANI and PPy Conductive Polymers and Numerical Model Approach" Energies 14, no. 22: 7746. https://doi.org/10.3390/en14227746
APA StyleRybicki, T., Stempien, Z., & Karbownik, I. (2021). EMI Shielding and Absorption of Electroconductive Textiles with PANI and PPy Conductive Polymers and Numerical Model Approach. Energies, 14(22), 7746. https://doi.org/10.3390/en14227746