1. Introduction
Changing user requirements over the years have consistently changed the paradigm for data transmission over the network. Initially, what is known today as peer-to-peer communication was used. The purpose of the simulations and analysis presented here is an analysis of selected open-source solutions for traffic balancing in server infrastructures providing WWW service, which has a direct impact on the energy consumption of the data centers. Clients were connected directly to each other via a transmission medium, usually wired. As time passed, it was quickly realized that this technology had limitations in computer applications, where it was much more important to have access from many places to many places, rather than from one place to another—such a network was too inflexible and prone to failures. Years later, networks using packet switching became widespread for good, which was one of the foundations of ARPANET. In this technique, groups of hosts are connected to each other using network nodes—the role of nodes today is usually played by routers and switches. It is these devices that, based on the source and destination addresses, are able to deliver the packet from the source to the destination. With the horizontal scaling model, it is not necessary to replace the equipment when performance needs to be increased. Instead, a second machine is added to the functioning one. From then on, the role of one machine will be performed by both machines in parallel. The development of such a configuration consists of successively adding more machines to the environment. Theoretically, there is also no limit to their number. An important feature of horizontal scaling is the fact that the added machines can be radically different from each other because their hardware configuration only affects the performance of requests received from the network.
Industry 4.0 and big data are generating huge amounts of data, the processing of which involves huge energy demands. New technologies such as sensor networks have been incorporated into building management for organizations and cities. Sensor networks have led to an exponential increase in the amount of data available in recent years, which can be used to extract consumption patterns to save energy and money. Responsible, efficient, and environmentally friendly energy consumption behavior is becoming a necessity for a reliable, modern electric grid. For this reason, new approaches and strategies are needed to analyze information in Big Data environments.
In a standard implementation, these machines do not work together in any way. This is not a form of clustering, but merely an attempt to multiply an access point from which resources can be retrieved. The operation of the machines in a horizontally scaled infrastructure is based on receiving a request from a client and then sending it back to the client. From the user’s point of view, the destination servers are treated as if they were a single server rather than a set of servers. This fulfills the assumption of network layer transparency for the end-user. The IP address of the resource does not change, and the URI/URL of the resource also remains the same. Moving to a ubiquitously scaled infrastructure also provides another huge advantage, as it allows one to dynamically manage the number of nodes in the cluster quite easily. This term is called autoscaling and is very often offered as a service among public computing cloud providers.
When surfing the Internet, very often users, impatient by nature, look for specific information. The moment they see an item they are interested in they want to browse through it right away. When it does not load for a few seconds, they are inclined to leave the page and go to browse another result or another path. For this reason, when optimizing your infrastructure for the time it takes to deliver content to your audience, consider optimizing the speed at which the interface and content appear.
A user using the network cannot, or at least does not need to, be aware that any request he makes to access information is first initiated on his device, then passes through a series of devices to the destination where it is processed, eventually returning the response he sees on the screen. This is not necessary at all. Hence, from the beginning of the network’s development, it has been focused on its transparency to the average user. Thus, between the client’s request and what he sees on the screen, a gigantic space has been created, in which the content of these requests can be shaped in any way and processed with the use of technologies known to the world.
As the number of users increased over the years, pioneering technologies and solutions in given areas ceased to be sufficient even in terms of performance. Therefore, there was a need for their development or even redesign and redefinition. This paper deals with one issue that undoubtedly has a huge impact on the current shape of the global network and the way information is processed in it. Without this concept, mankind would not have been able to develop the Internet in the way it has developed today. This issue is load balancing (LB), especially in the server infrastructure associated with the World Wide Web (WWW), providing users with the ability to browse the Internet efficiently and reliably.
2. Literature Review
Two mathematical laws are associated with distributed systems and motion balancing. The first is Amdahl’s law and the second, relating to the first, is Gustafson’s law. Both of them deal with efficiently solving performance problems by means of parallelizing them. Gene Amdahl, a designer of the first computers and pioneer of computer architecture, is behind the invention of Amdahl’s law. It dates back to 1967 and is used to determine the acceleration that can be maximally achieved by a parallel program running on a multiprocessor computer [
1,
2].
Amdahl’s law proves that traffic balancing is highly optimal only when the task is highly parallelizable. Thus, a direct implication of the law is to avoid sequentially processed tasks during software design. However, Amdahl’s law is based on the assumption that the problem size is fixed, that is when the workload does not change as the amount of resources increases. Therefore, Gustafson’s law was developed on its basis 21 years later. It assumes the concept of fixed time leading to scalable acceleration and states that an increase in the size of the problem combined with increasing computing power of computers and a fixed problem size allows the problem to be solved in the same amount of time. In short, the faster the components, the larger the problems that can be solved in an equal amount of time [
2,
3].
In a sense, Gustafson’s law redefines the efficiency of executing a task, since constraints due to the sequential part of the task can be balanced by an increase in computational power. Thus, by transferring the consideration to the servers and their handling of requests, both laws prove unambiguously that the upper limit of traffic-balancing efficiency, and hence the minimum response time from a horizontally scaled infrastructure, is the execution time of the part of the computation that must be executed sequentially.
In the case of load balancers and web servers, the sequential part of the task will be the processing of the request by the load balancer to direct it to the appropriate server, and then any form of information transfer, assuming that the bandwidth of links is limited. The failover clustering often seen in infrastructures, which involves chaining together a group of servers performing the same roles and distributing requests between them, is not always the same as load balancing. Strictly speaking, it depends on the type of cluster used. In the case of an HA (High Availability) active–passive cluster, servers are also multiplied, but only one of them is responsible for correct service operation at any given time [
4,
5]. Only at the moment of failure of the first host—often referred to in cluster terminology as the node—another machine takes over the role of the server providing the service. Data can be synchronized between servers in an HA cluster in active–passive mode, or not. This is by no means an obligation. Everything depends on the service provided by a set of machines. For example, in the case of the MySQL database, the role of the HA cluster can be played by the configuration of two instances of the same database in master–slave mode. The data from the master node is periodically synchronized to the slave node so that in the case of a master host, it can take over the functionality from it while maintaining the latest possible state of the stored data [
6]. The above configuration does not require a load balancer.
Optimization and traffic management load-balancing issues in particular are becoming a new research challenge. A multidisciplinary big-data environment enables cross-domain data integration combined with new artificial intelligence algorithms and distributed registry technology. The data-driven architecture enables reliable and efficient policymaking and supports the creation and use of innovative energy efficiency services by leveraging a wide range of data for efficient processes e.g., building operations [
7].
On the other hand, in the case of active–active HA clusters, this is also not forced, as it can be implemented in various ways, once again depending on the clustered service. In the case of two web service servers sharing the same static content, it is possible to talk about load balancing, as requests, depending on the algorithm used, will go once to one server and once to the other. When clustering entire virtual machines, on the other hand, there are at least two servers responsible for running the service. The point is that they work simultaneously because the disk space on which the machine data are stored is shared between two hosts, which, combined with the synchronous writing of machine data and mutual polling of nodes—usually called a heartbeat—makes them work simultaneously in practice. An example of such an infrastructure is the VMware vSphere Metro Storage Cluster [
8].
Scientific Big Data analytical methodologies and innovative data-mining algorithms are being developed to help companies improve their business systems by taking advantage of vast amounts of data stored in incompatible systems, as well as data that was previously not considered at all. Big Data enables companies to perform rapid analysis of huge amounts of information and thus improves operational decision making. In [
9], a methodology was proposed to extract electricity consumption patterns in big data time series so that a very valuable conclusion can be drawn for managers and governments. With this solution, managers are able to easily identify and diagnose operational issues. It also provides the opportunity to make appropriate business decisions and actions.
There are many challenges such as facing the speed of data provided by sensors, the heterogeneity of data collected, power plant performance, and uncontrollable factors such as weather conditions and user consumption profiles [
10].
Without access to Big Data systems, many problems would not be solved. An example is the use of renewable energy sources including wind turbines. It is worth ensuring optimal working conditions for such systems, which is not easy. Researchers address many challenges to optimize the performance of such systems and the reliability of operation. In [
11], the authors considered the optimization of operation and maintenance of wind turbines in multi-user wind farms. They proposed a new approach to the problem as a sequential decision problem over a long time horizon and used deep-learning mechanisms with reinforcement based on proximal policy optimization to solve it. Another problem is to find the optimal wind turbine layout for a given wind farm. In [
12], a new algorithm called the carrier vector regression-driven genetic algorithm is proposed to solve the problem of optimizing the distribution over wind-heat, which integrates the ability of each individual to adapt to obtain better “efficiency “ with the guiding information extracted from the response surface approximated by the carrier vector regression. Such numerical studies under different wind distribution conditions and wind farms with useless cells, would not be possible without the use of Big Data systems.
Due to the high computational cost of performing complex numerical analyses, including discovering patterns and traffic anomalies based on Big Data analyses and taking into account the fact that many problems are highly nonlinear and multivariate, substitute models, also called meta-models, should be constructed. Meta-modeling methods are capable of analyzing multivariate problems. Non-parametric regression procedures known as multivariate adaptive regression splines (MARS) are often used in approximating the relationship between input and output data with large amounts of data. In [
13], the authors identify a key element in the MARS model building process, and that is the node positioning step, which potentially affects the accuracy of the final MARS model. Identifying well-positioned nodes requires evaluating the quality of multiple nodes in each model building iteration, which requires an intensive computational effort. By examining the change in residual sum of squares (RSS) in MARS, we find that the local optima from previous iterations can be very close to those of the current iteration. The authors exploit the previous change in residual sum of squares (RSS) information for optimal node positioning. As a result, two methods for positioning MARS nodes are proposed, the first is the ascent method (HCM), which ignores the prior change of RSS information, the second is the ascent method using the prior change of RSS information (PHCM). The proposed methods are 10% to 70% faster than the traditional method and PHCM is 70% faster than HCM for higher-dimensional datasets. These methods can significantly impact statistical modeling approaches with wide-ranging real-world applications, in particular affecting energy consumption, which is directly related to the required computing power. Hence, it may be advisable to perform load balancing already during the design phase of computational and optimization tasks.
Over the years, because the origins of load balancing techniques were in the 1990s, many divisions of load balancers and algorithms have emerged due to various criteria ranging from where traffic is distributed to the division of the algorithms themselves. Some of the concepts that describe load balancing in infrastructures are shared with distributed processing. The main division of traffic balancing comes down to whether the traffic balancing is done from the client or device side of the service provider, that is, client-side load balancers and server-side [
14,
15,
16].
Due to the heterogeneity and a large amount of data, it is necessary to use appropriate Big Data analysis techniques to perform fast and secure data access that cannot be achieved by traditional data management approaches. The authors in [
17] presented an intelligent data mining model for analyzing, predicting, and visualizing energy time series to discover different temporal patterns of energy consumption. Device usage in terms of time, such as time of day, time of day, day of the week, week, month, and season, as well as device-to-device associations in the household, which are key factors, were identified to infer and analyze the impact of consumer energy consumption behavior and the energy consumption forecasting trend. For this task, unsupervised data clustering and frequent pattern search analysis in energy time series and Bayesian network forecasting were used to forecast energy consumption. In contrast, a distributed Vi-POC system was proposed in [
18] to store massive amounts of data collected from energy production plants and weather forecasting services. HBase over Hadoop framework was used on a cluster of commodity servers in order to provide a system that can be used as a basis for running machine-learning algorithms. The authors obtained a day-ahead prediction of photovoltaic energy production based on artificial neural networks in two learning settings, i.e., structured and unstructured performance prediction.
One measure of UX (User experience) effectiveness is how fast a website loads. The faster the website is rendered on the user’s screen, the greater the chance that the user will want to spend some time on it. What is more, Google already announced in 2010 that the loading speed factor of websites will be taken into account during their positioning in the search results on desktop browsers. For mobile devices, a fix called “speed update” was implemented in July 2018 [
11]. Studies on this issue have been ongoing for years. Jakob Nielsen, a well-known scientist in the world of human–machine interaction, distinguished in his book as early as 1993—interestingly, he also referred to publications from as early as 1968 claiming that this issue has not changed much over the years—three limits for designing interfaces based on human perception abilities: 0.1 s—such a fast response of the system makes the user claim that it is instantaneous; 1 s—this response time of the system defines more or less the period after which the user does not feel its negative consequences, in other words, it does not interfere with the way he works. If the wait is longer, consider placing a message with appropriate information in the interface. 10 s—this should be the limiting time, after which the user stops waiting for the result of the action, loses attention, and is occupied with something else [
19,
20].
It is worth noting that the largest leaders in the network traffic handling market also play a large role in the development of solutions in this area, regardless of whether they are used exclusively for their own or also public needs [
21,
22,
23].
3. Basic Load Balancing Mechanisms
Load balancers use many mechanisms including, among others, proxy and reverse proxy mechanisms based on the HTTP protocol. HTTP (Hypertext Transfer Protocol) is an established method of communication between a client and a web server. It results in the download of files from the server by the client, which is usually a browser, but can also be an HTTP console client such as wget, curl, and ApacheBench. HTTP runs at the application layer of the ISO/OSI model and uses TCP to initially establish a connection. It is also a stateless protocol, i.e., one in which both sides of the communication do not store information about previous transactions between devices, at least in its standard version, which does not use cookies or other solutions. A proxy server, in the literal sense of the term, refers to software, or a server with the appropriate software installed, acting as an intermediary for client requests to access a resource. This server receives the request from the client and then processes it on its behalf and returns a response. In practice, this is accomplished in such a way that a request passing through the proxy server is dropped, and then a new connection is established through the proxy server to the destination server. In this way, the destination server from which the resource is retrieved is not aware of the existence of the client initiating the request, only of the proxy server itself. Hence, one of the main uses of a proxy server is to anonymize the client. Another name for a server that works in this way is a forward proxy [
24,
25,
26].
A reverse proxy is the opposite of a classic proxy. Just as in the previous case only the IP address of the proxy server (and not that of the client) was known to the target server, a reverse proxy is able to hide the address of the target server from the client. The reverse proxy server in this case acts as a (public) gateway allowing access to the servers behind it, which can be in any location, either publicly accessible or on a private network [
27].
There are two main types of traffic balancing depending on the layer where request classification takes place: Balancing at the transport or application layer, abbreviated as L4 and L7. Both methods are used in this paper.
Traffic balancing at the transport layer of the ISO/OSI model is a simpler way to distribute requests between servers. Nevertheless, it also has its advantages. It cannot understand application layer protocols, but only IP addresses and ports from the transport layer, so there is no need to process application layer protocol request headers. Therefore, it can operate more efficiently because TCP headers are faster to process. Due to fewer calculations performed, it requires less computing power. The disadvantage of this method is that it does not recognize the URL paths that the client wants to access, which is a direct consequence of not operating at the application layer. Moreover, Layer 4 does not support mechanisms typical of Layer 7, such as content caching, SSL/TLS connection termination.
Load balancing in layer 7 of the ISO/OSI model is a method that differs significantly from the previous one. Its main advantage is the ability to look into the content sent by the application layer protocols of the ISO/OSI model. As a result, it is able to base request-processing decisions on the characteristics of the HTTP headers and the content of the actual request, such as the URL, data type (text, video, graphics), or information stored in cookies. This is a great advantage because it is possible to design the infrastructure in such a way that some servers are optimized for storing and processing text, and some for multimedia. Moreover, it is possible to implement the so-called sticky sessions mechanism thanks to which a user will always go to the same backend server or network segment in order to, for example, maintain a session on the website. The disadvantage is the higher demand for computing power necessary to process more complicated queries.
4. Software Used to Examine Load Balancing in the Server Node
The research presented in this paper aimed to analyze and compare the efficiency of several widely used load balancing tools with each other. An important role in the selection process was played by the license on which the software was released—due to the implementation costs, tools released under commercial licenses were abandoned. For the purposes of the research, it was therefore decided to use the following three solutions: HAProxy (High Availability Proxy), Nginx, and LVS [
28,
29,
30,
31,
32].
4.1. HAProxy–High Availability Proxy
HAProxy is a solution offering high availability through the multiplication of backend servers, load balancing, and the reverse proxy mechanism for applications based on TCP and HTTP protocols. It is designed for high throughput and is currently the standard for open-source software implementing the above-mentioned functions. It is available in the form of packages in the repository for all popular Linux distributions and a dedicated device (commercial version). The first stable version 1.1 was released in 2006, although the project itself dates back to 2001; currently, it is version 2.1. Thanks to a number of optimization measures that are the product’s hallmark, it is known for its low system resource consumption, which allows it to handle very high traffic of tens of thousands of simultaneous sessions on a single, dual-core 1U server at throughputs of tens of gigabits per second. The tool is built in the architecture based on events, not processes (it operates as a single system process), thanks to which the number of context switches in the processor and memory usage is limited, as the producer declares that the tool on 1 GB of operational memory is able to maintain about 30,000 sessions [
29,
30].
The software itself can work at both the transport and application layers. It supports a number of traffic-balancing algorithms: Round robin, static round-robin, least connection, first, source, uri, url_param, hdr, random, and rdp-cookie. It also implements support for health checks, which allows one to constantly monitor the state of backend servers and, if necessary, remove them from the group to which requests are redirected. It is also possible to configure a website displaying live connection statistics [
29,
30].
4.2. Nginx
Nginx is open-source software used as an efficient web server, reverse proxy, cache, load balancer, or media player. It is most commonly used to host static content. Designed to work as a web server, it is optimized for performance and stability. Apart from the functionality related to the HTTP protocol, Nginx can also serve as a proxy server for e-mail services (POP3, IMAP, and SMTP protocols) and a reverse proxy for servers working with HTTP, UDP, and TCP protocols. The concept and developer of the software is one man, Igor Sysoev, who, releasing the first version in 2004, decided to solve the then well-known C10k optimization problem of handling 10,000 simultaneous connections over a single network socket. This was achieved using an event-driven architecture that asynchronously processes incoming requests. Thanks to these advantages, according to W3Techs data, it is currently responsible for supporting almost 43% of the most popular websites in the world, which is the highest among the web service servers. It was released in a free and commercial version (this project is called NGINX Plus) [
28,
31,
32,
33].
4.3. LVS
LVS, an extension of Linux Virtual Server, is the lightest of the software studied. It was created in 1998 and since then it has been fully open source, released under the GNU GPL v2.0 license. The aim of the project from the beginning was to build a high-performance server for machines based on the Linux kernel, providing good scalability, availability, and quality of service [
22,
27,
28,
29,
30]. Technically, the software implements the load balancer in the transport layer of the ISO/OSI model; additionally, it operates in the kernel layer, not the user layer, which ensures a very high speed of switching processor commands. It can balance software using TCP and UDP protocols. The software can work in three modes: NAT, IP Tunneling, and Direct Routing, and they differ in the way they process and forward segments to backend servers [
34,
35,
36,
37].
5. Research Methodology
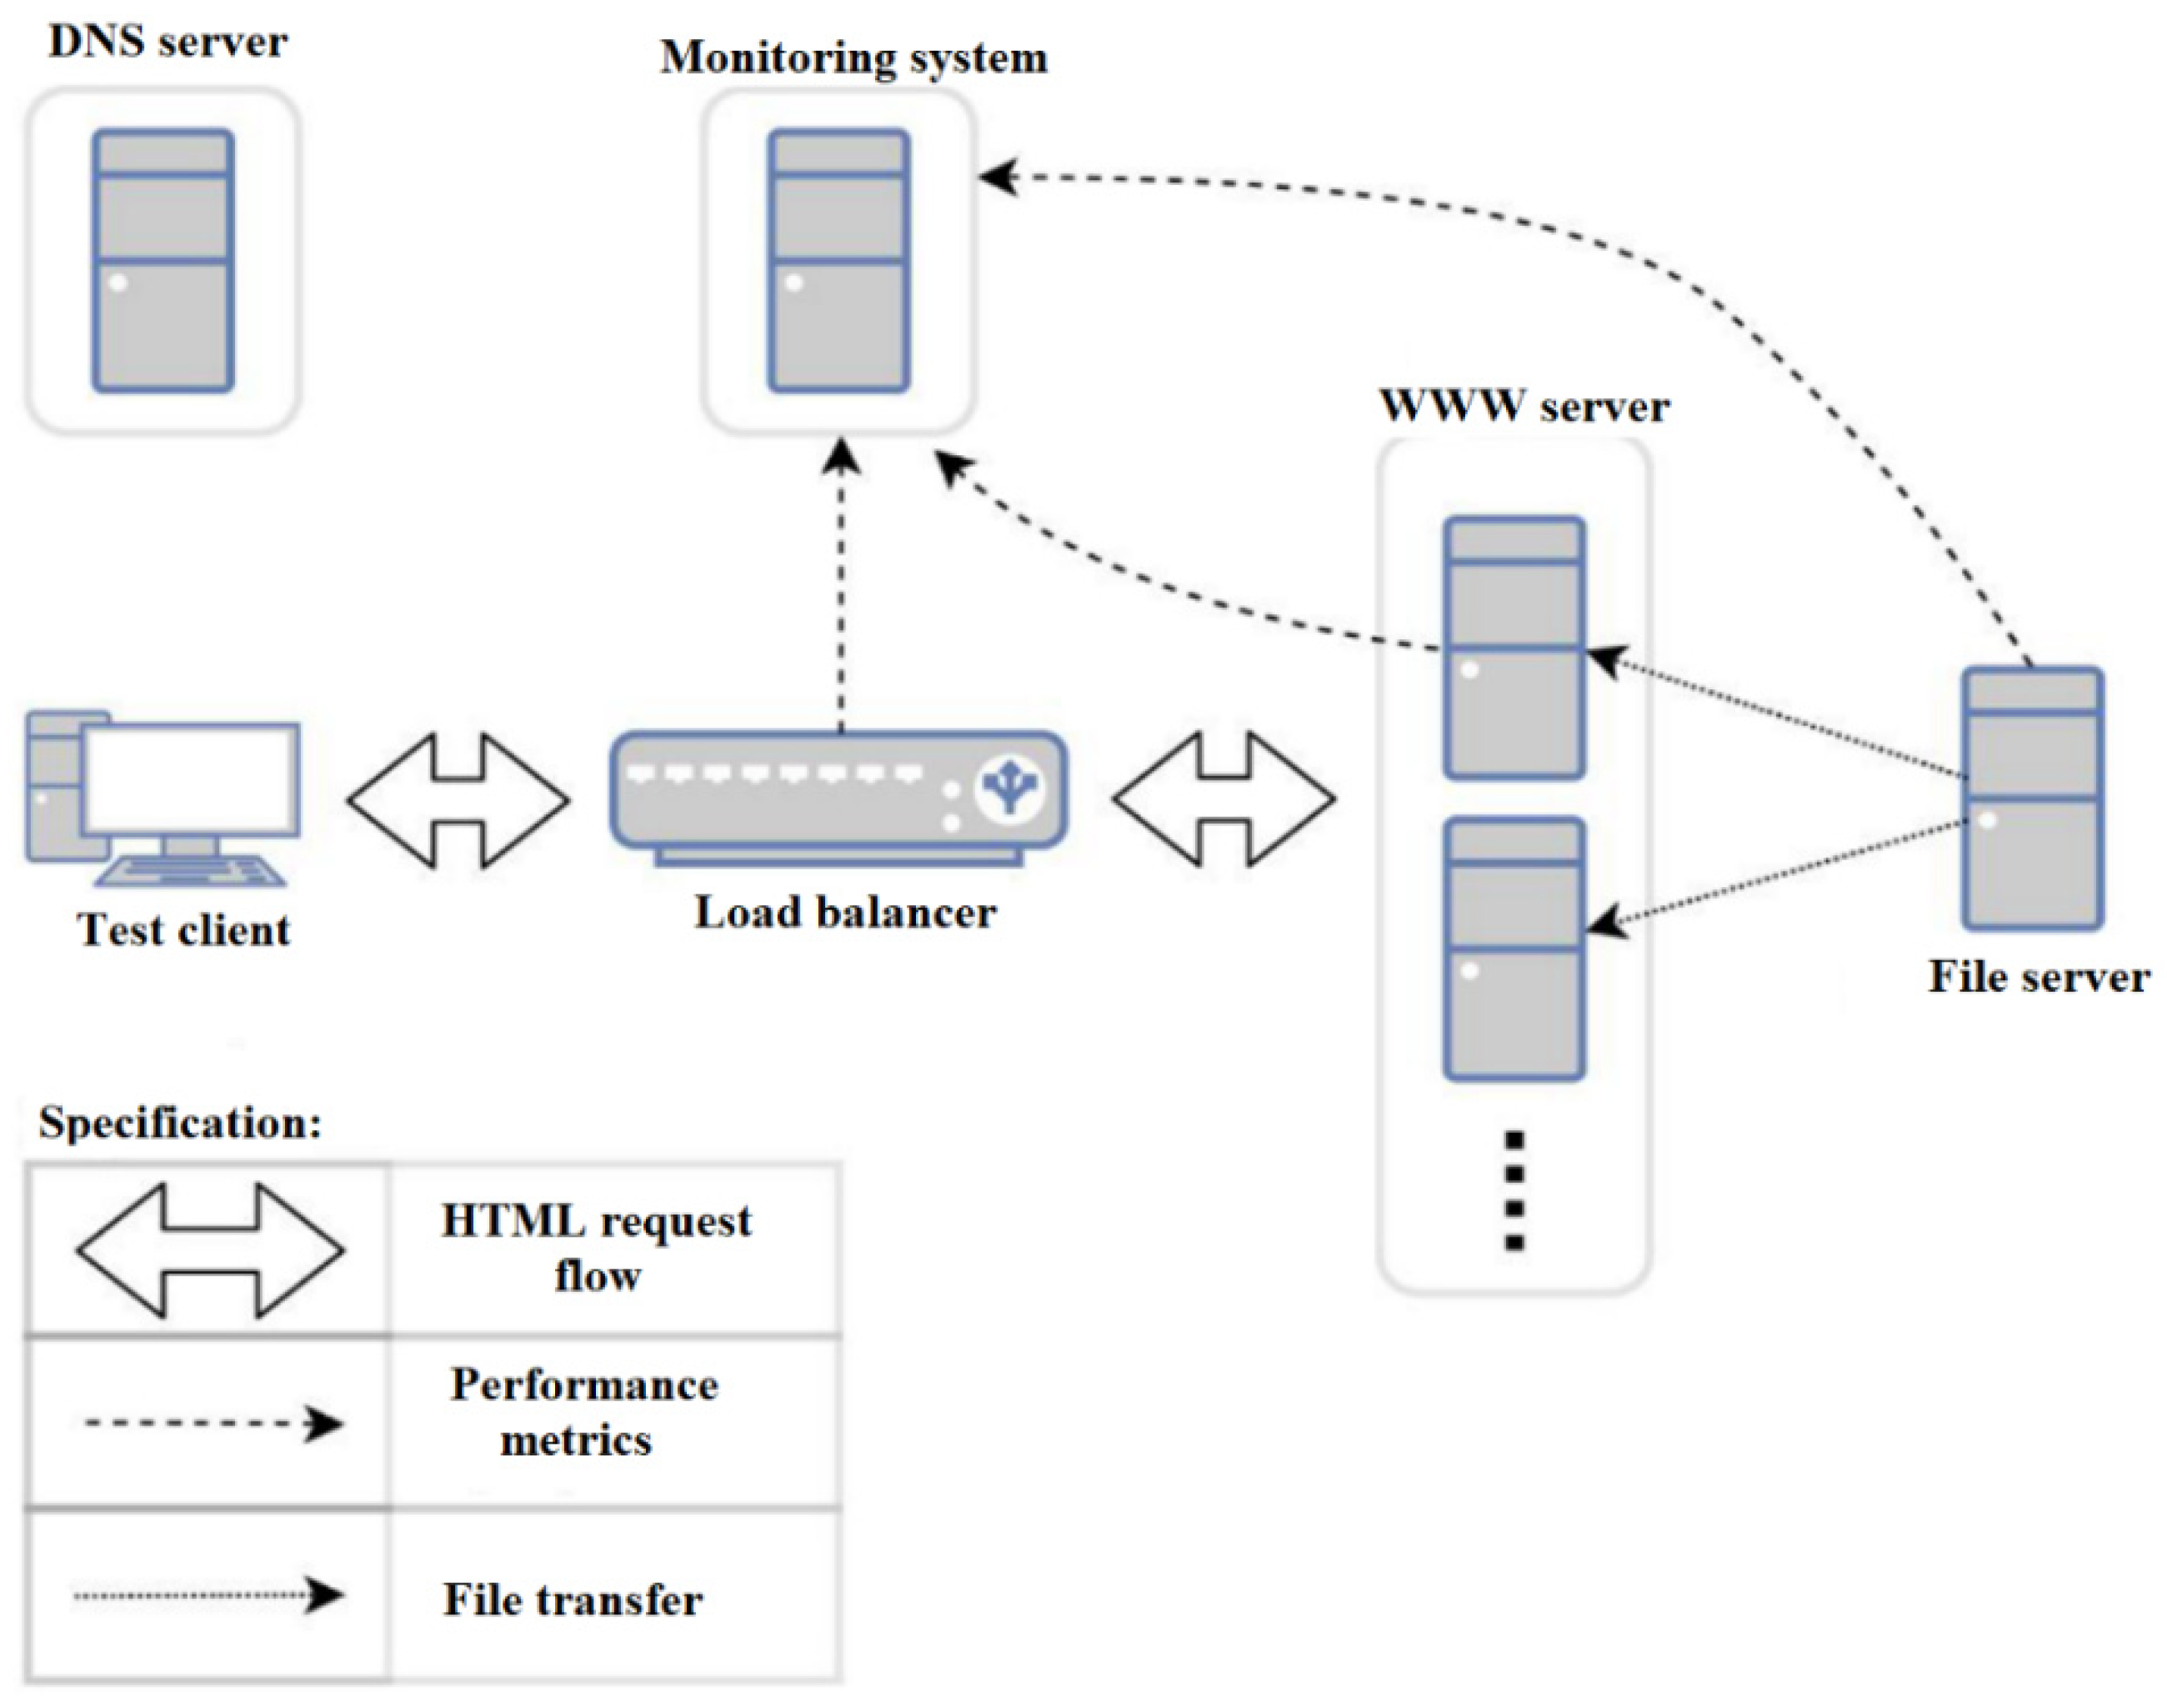
The entire test environment was created in the form of virtual machines running on the Proxmox VE 6.0-7 hypervisor, which runs the latest Debian version 10.3, kernel version 5.0.21-2-pve. The physical server was equipped with two 1.8 GHz quad-core Intel Xeon E5-2603 processors with Intel VT-x virtualization support. The physical server was connected to the network via a wired Intel 82574L network card with a maximum throughput of 1 Gbit/s. The virtual machines were started in QEMU/KVM technology with paravirtualization of the network card. Network access was realized as testing three different load balancers together with load monitoring required the design of one common infrastructure concept (see
Figure 1) taking into account the specifics of each solution, and then tailoring the software configuration to the appropriate solution.
All measurements were performed through the ApacheBench tool. The result of each measurement was exported during execution to the TSV format, which is the equivalent of the popular CSV format, but the tab character is a separator instead of a comma. The data prepared in this way were then imported into the gnuplot tool, which, based on a dedicated script created, was processed into a 2D chart. This chart was also one of the comparison criteria between different technologies.
Another of the criteria that were possible to analyze through the ApacheBench tool was the load balancer’s request processing time, which is the time that elapsed between the client establishing a TCP connection with the load balancer and receiving the first byte of response data. This follows directly from the source code of the tool provided on the GitHub platform, which calculates several points in time (denoted as T1–T5):
− T1—the start of establishing the TCP connection.
− T2—the establishment of a TCP connection, the start of the request transmission.
− T3—request sent.
− T4—receiving the first response byte.
− T5—closing the connection.
Four values are returned with the result of carried out single test:
− Connect—the interval between T1 and T2.
− Processing—the interval between T2 and T5.
− Waiting—the interval between T3 and T4.
− Total time—the interval between T1 and T5.
When measuring load balancer performance, the period between T3 and T4 is important, which ignores the latency caused by the network, so graphs of this value were included in the test results. The last step of preparation was to create the files to be requested by the test client with an HTTP request, which will be stored on the NFS server. Their sizes were experimentally chosen to be 1 MB and 5 MB. The former is used to simulate a low load, while the latter is used to simulate a slightly higher load. In order to best replicate the different nature of traffic similar to the real environment, different file formats were downloaded in the tests, both text and multimedia.
This assumption seems to be correct since load balancers worked at the transport layer of the ISO/OSI model. Lower-layer protocols of the network model do not understand the transmission of higher-layer protocols. They represent only a payload, i.e., a stream of bits they are supposed to transport. Websites, and especially the content they provide, are based on technologies that work within application layer protocols. Common basic languages in web technologies, such as HTML, CSS, and JavaScript, for example, are transmitted over the HTTP transport protocol. Nevertheless, it was decided to verify this theory, and tests were conducted in which the test client generated 500 requests with a concurrency of 10 (at any time during the test, the number of simultaneous client connections to backend servers was 10), and the size of 500 kB to three web servers behind load balancers. The files tested were:
− HTML itself.
− HTML with CSS extensions.
− HTML, with CSS and JavaScript extensions.
− Only graphics.
− Random characters from/dev/urandom.
A series of tests showed that for each type of load balancer, the content of the downloaded file does not matter, because the time differences between their types are negligible. The content of the file does not affect the time of its handling by the load balancer. For the analysis, as a type of downloaded file, random characters from the file /dev/urandom were adopted because of the simplicity of generating files of the desired size. Since the purpose of this study was to evaluate the performance of load balancers and not servers, it was decided not to complicate the configuration of backend servers beyond those defined in
Table 1.
The backend servers for the load balancer were web servers running Apache2 software released under the Apache 2.0 free software license. The file base used during the tests for the web servers was an open standard distributed file system (NFS) server. The role of sending test HTTP requests was performed by ApacheBench software. The infrastructure monitoring functions were performed by two tools: Prometheus (Apache 2.0 license) and Grafana (Apache 2.0 license).
The configured environment made it possible to perform the tests. The bandwidth of the network cards of the machines involved in the tests was, respectively:
Load balancers frontend interfaces: 10 Gbps.
Backend load balancer interfaces: 10 Gbps.
LVS director interface: 10 Gbps.
Backend servers: 1 Gbps.
The network cards of the other servers used in the tests are not relevant in terms of request handling performance, as the primary goal is to compare the performance of different load balancers under different conditions. The throughput of the network cards was limited through a Linux mechanism called Traffic Control, which allows outgoing traffic to be limited on the interface. The following were taken as parameters in the study:
Load balancer software or its absence.
Number of total requests in the test.
Number of concurrent requests.
Traffic-balancing algorithms.
Number of backend servers.
Test file size.
In turn, given the methodology described, the test plan includes:
Load balancer software preparation or its absence.
Determination of the number of total requests in the test.
Determination of the number of concurrent requests.
Tuning traffic balancing algorithms.
Determining the number of backend servers.
Determination of test file size.
In turn, given the methodology described, the research plan includes:
Environment 1: No load balancer.
Environment 2: Traffic balancing using HAProxy software.
Environment 3: Traffic balancing using Nginx software.
Environment 4: Traffic balancing using LVS software.
All variants were tested for two traffic-balancing algorithms: RR (Round Robin) and LC (Least Connection). The detailed input parameters for the tests are shown in
Table 1. Additionally, for each test (I–VIII), it was decided for comparison purposes to see how environment 1 would perform, i.e., the webserver alone without any load balancer infrastructure. This test was repeated twice each time, in order to show the difference between successive test runs. The environment is not able to be fully reproducible, because much depends on the request generator and the current load. For example, when testing throughput between two points in the network, we will obtain similar results each time, but they will differ by a few percent in value. This is also the case here, so we decided to perform it twice and show the difference.
The ApacheBench client cannot run in multithreaded mode, so the performance of this software is probably the limitation. After deciding that virtualization might be to blame, the client was run on another physical machine (a laptop) and the results were the same. We also attempted to multiply the VMs generating requests to 3 and sending them at the same time, while splitting the target number of requests, say 200, across the three machines. The effect of the test was that the total test duration was the same or often even lower than a single test with a concurrent request count of 200.
5.1. Analysis of the Average Time to Establish a Connection
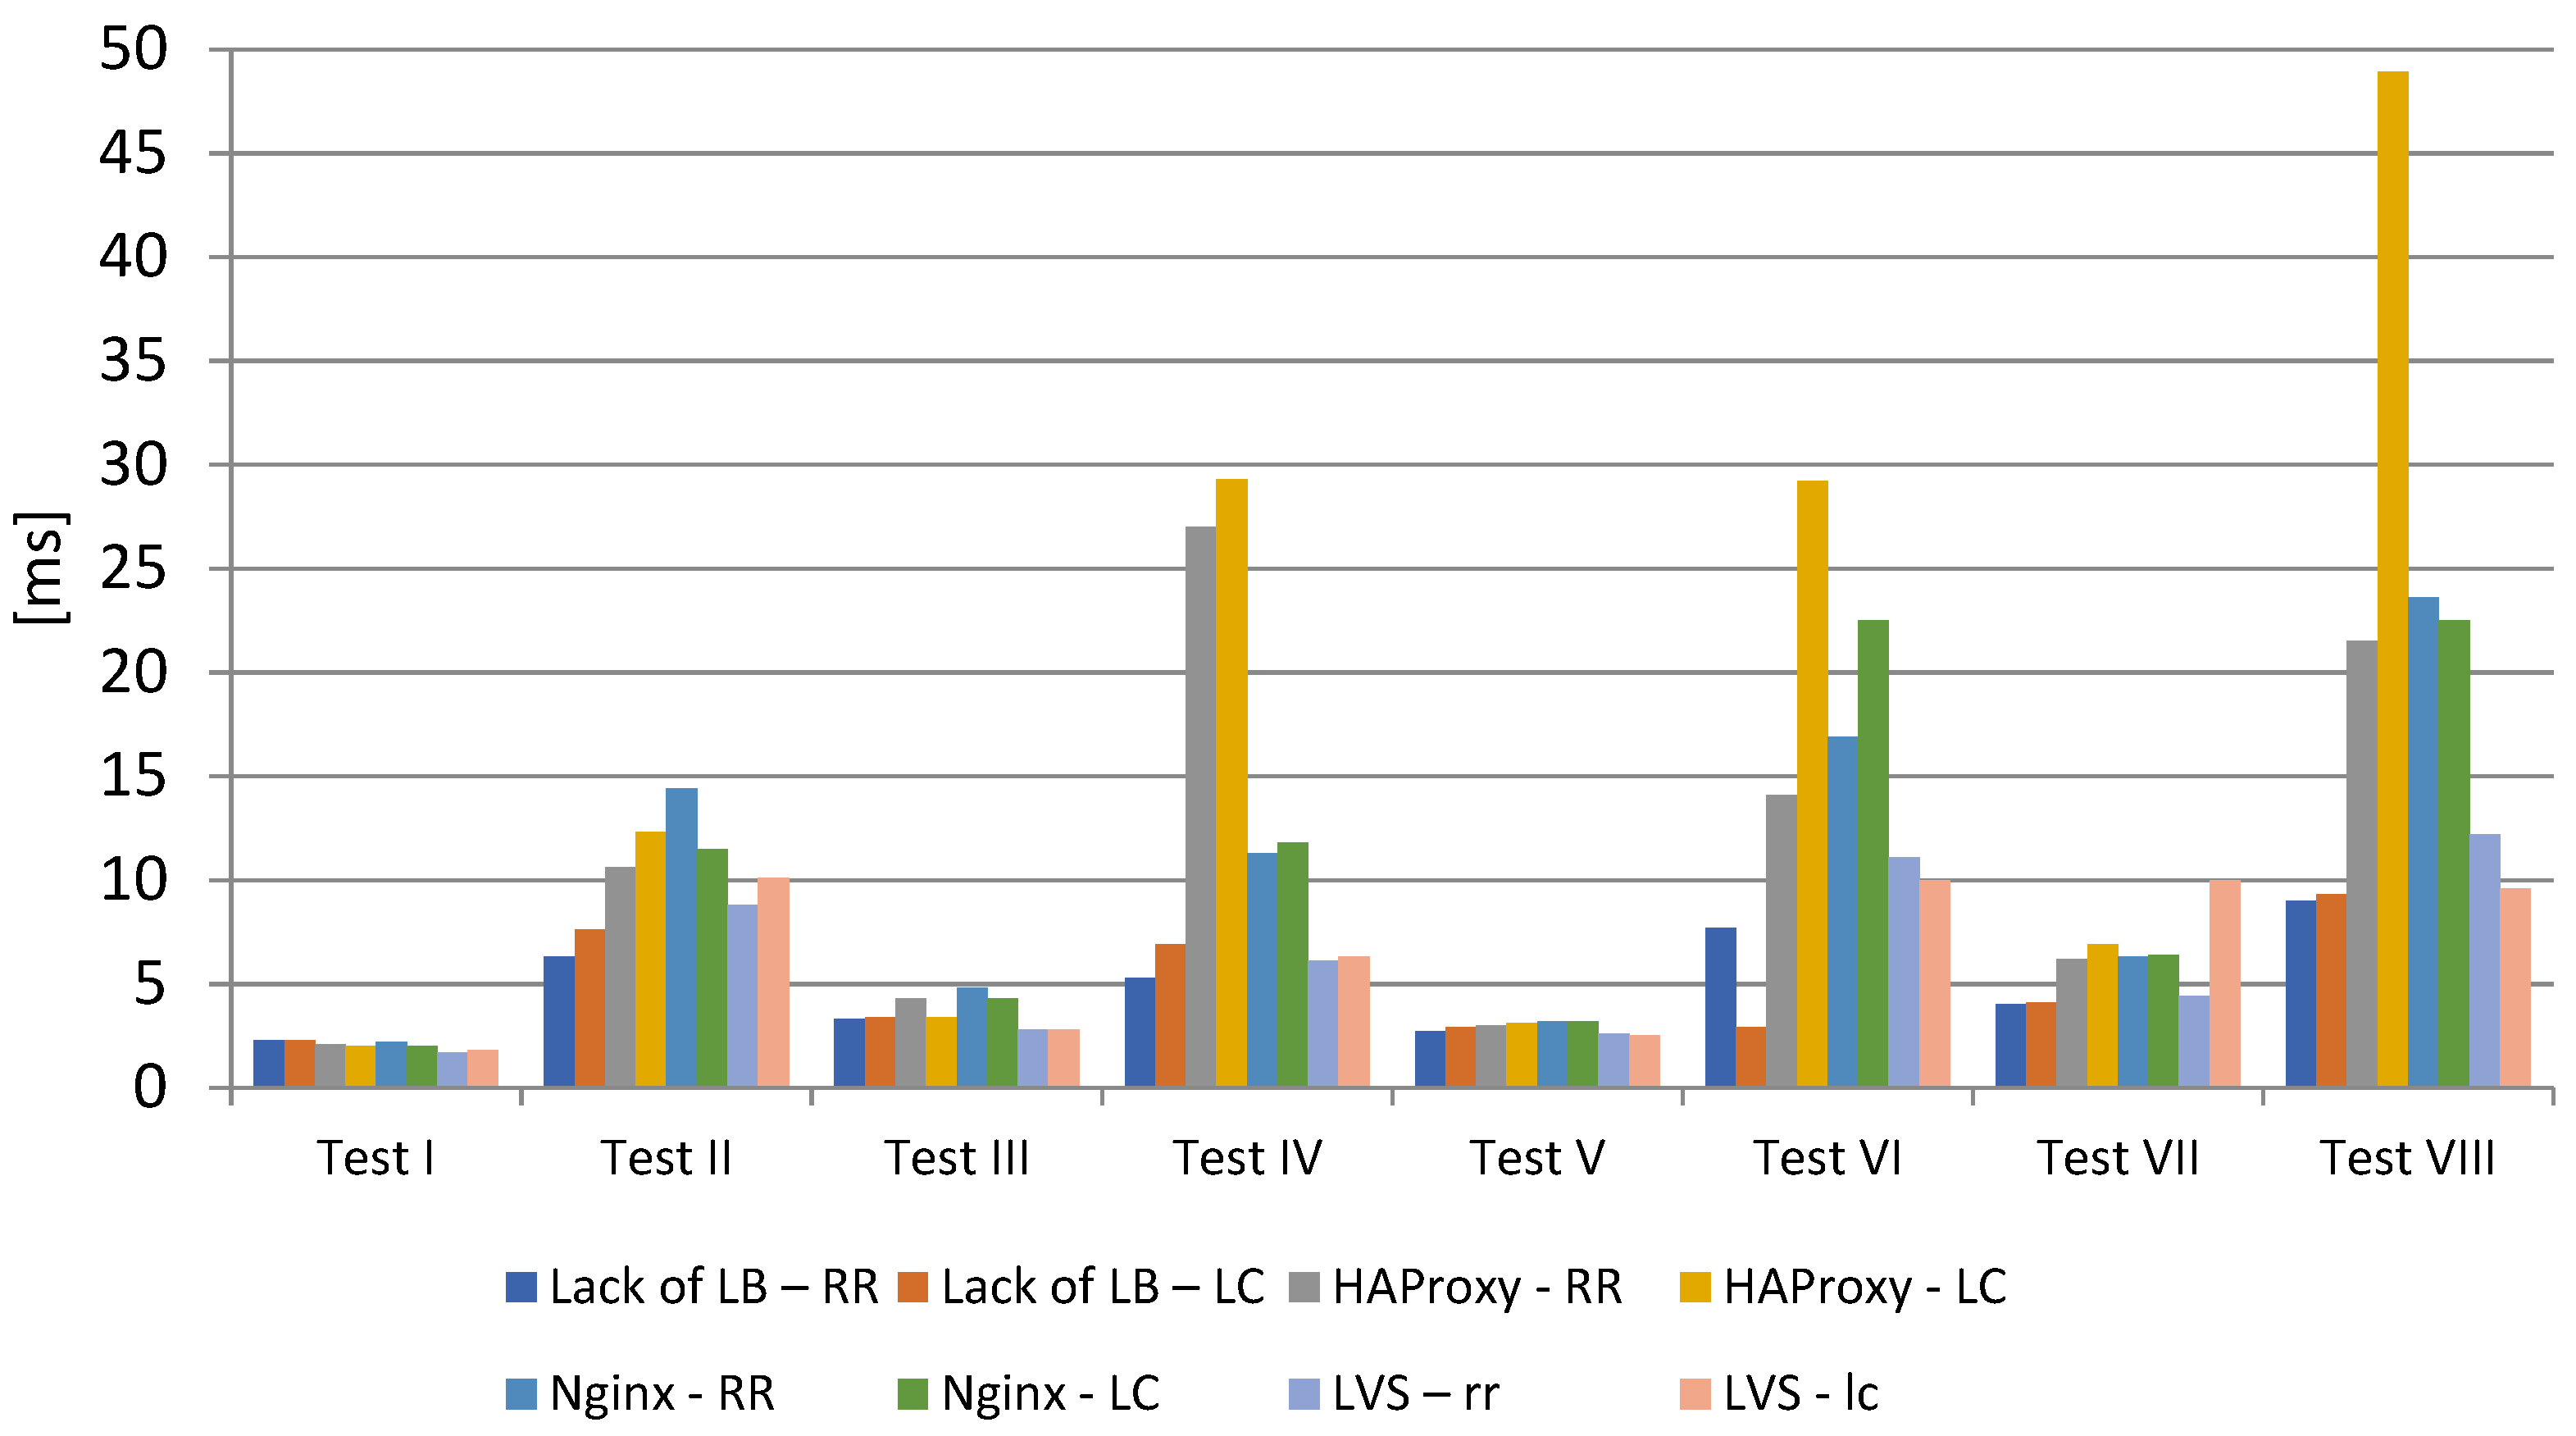
The visualization (
Figure 2) shows the average time to establish a connection in each test performed. The values obtained in tests I, III, V, and VII show a stabilization, which confirms that the connection time does not significantly affect the total request handling time. Tests IV, VI, and VIII show a clear deviation for HAProxy, due to the specificity of the test described in earlier sections of the analysis. These values are significantly lower than the response time and overall handling time, so further analysis focuses on a detailed evaluation of the other parameters.
5.2. Test I Results Analysis
The data presented in
Figure 3 showed that the total handling time subsequent to customers’ requests increases until a certain point, at which point there is a sudden decrease. In the graph, the following designations are adopted: 1—round-robin algorithm, 2—least-connection algorithm. The reason for this behavior was not seen in the collected data, which could be for example the time of establishing a TCP connection, or the time of processing a request by the load balancer and the backend server. Results with these characteristics were obtained in every test sample. For the data from Test I, there was no difference between the round-robin and least connection balancing algorithms, as the times are virtually identical as shown in
Table 2,
Table 3 and
Table 4. For the readability of the analyses, the tables show the aggregate results for all scenarios.
Table 2 shows the average connection establishment time,
Table 3 shows the average response return time, while
Table 4 shows the average total service time.
The LVS infrastructure is able to respond to client requests faster even than a single server in the case of a round-robin algorithm as shown in (
Figure 4). HAProxy and Nginx are at a similar level.
For the least-connection algorithm, similar relationships were observed. Each of the tests were characterized by the occurrence of temporary values significantly different from the average. The highest values were observed for HAProxy and Nginx, and the lowest for LVS. The obtained average simulation results showed that for both the round-robin algorithm and least-connection algorithm, the LVS balancer achieved the lowest values of time to establish a connection, average response time, and average overall handling time. As can be seen in
Figure 2,
Figure 3 and
Figure 4, the time to establish a connection is similar for all LBs, but already the average response time (10.1 ms for HAProxy, 9.9 ms for Nginx) and average overall handling times (about 90.1 ms without LB, 62.8 ms for HAProxy, and about 65 ms for Nginx) are much lower for LVS (the average response time about 3.5, while the overall handling time 43 ms). The difference in average response time for HAProxy/LVS and Nginx/LVS was nearly 300%, and the average overall handling time for without LB was over 200%, for HAProxy/LVS over 145%, and Nginx/LVS about 151%. As one can observe, the graphs show the average values of each parameter with standard error bars. Detailed results are summarized in
Table 2,
Table 3 and
Table 4.
5.3. Test II Results Analysis
The data collected in
Table 2,
Table 3 and
Table 4 show that the traffic-balancing algorithm is insignificant for these inputs. Again, the best software in both comparison categories was LVS. The highest standard deviation was characterized by not using a load balancer. The Nginx software also proved to be less efficient than HAProxy and had less stability.
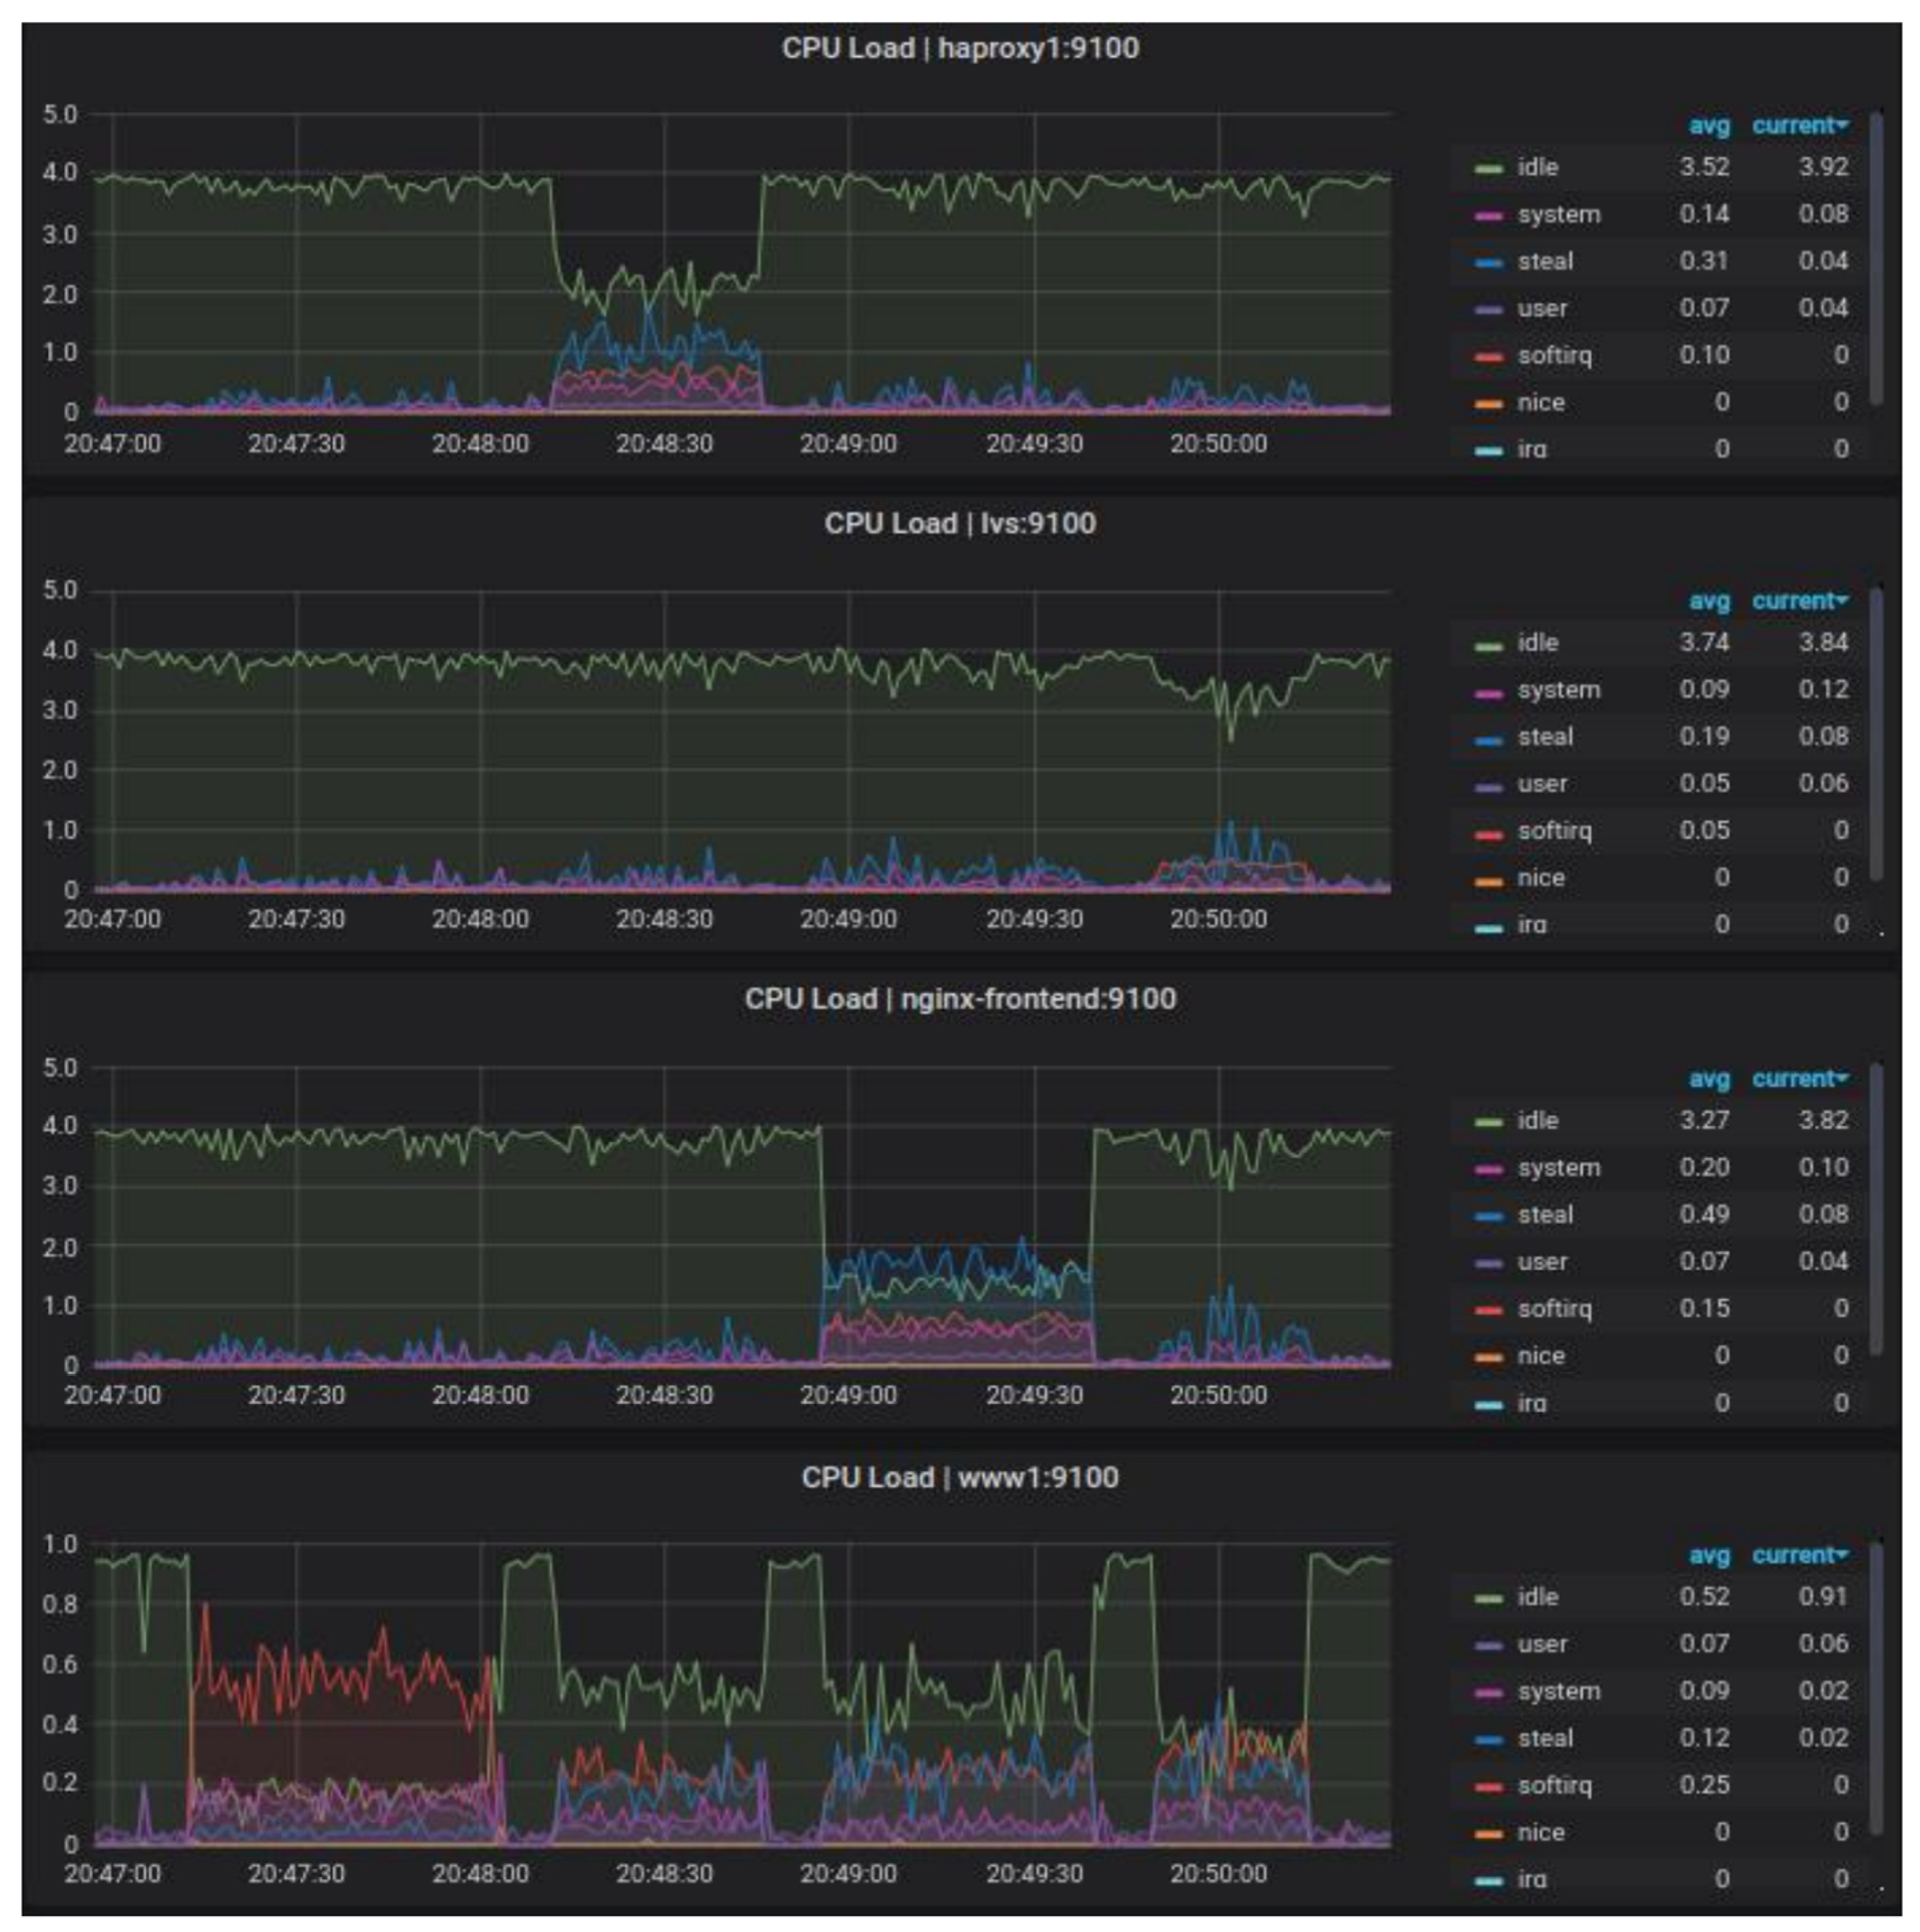
Figure 5 shows the CPU load of the load balancers.
Figure 6 shows that despite achieving similar performance results, Nginx software puts more load on the CPU than HAProxy. This may be due to the lack of optimization for the reverse proxy functionality or the changes made mandating the use of a second network interface to the backend portion of the infrastructure.
As in Test I, during Test II, the time to establish a connection is similar for all LB, which one may see in detail in
Figure 2. As regards the average response time and average overall handling times (
Figure 6), just as in Test I, the values are much lower for LVS. The difference of average response time was 2 times for HAProxy/LVS and was more than 2.7 times for Nginx/LVS, respectively. The average overall handling time for no LB was more than 2 times, for HAProxy/LVS was more than 1.3 times, and for Nginx/LVS was about 1.86 times.
5.4. Test III Results Analysis
Figure 7 shows that for the results from test III, LVS was again the most efficient load balancer, followed by HAProxy and Nginx. The least efficient load balancer was no load balancer, which is due to less bandwidth from the summed three backend servers. Detailed results are summarized in
Table 2,
Table 3 and
Table 4. It takes approximately several milliseconds for the HAProxy and Nginx load balancers to process a request. The TCP connection establishment time for each environment is similar and within a few milliseconds. The results of test III are similar to the results of test I, as the dependencies are almost identical. However, the response time has changed to several times longer, as none of the tested environments in Test I exceeded an average total service time of 100 ms. In the case of HAProxy and Nginx, the request processing time almost doubled, while in the case of LVS, it halved. In addition, the total test time increased, which was due to bandwidth limitations and more data to be transferred between machines. Of note is the analysis of the difference in average response time and average overall handling time. The difference in average response time was more than 2.7 times for HAProxy/LVS and Nginx/LVS. The average overall handling time for no LB was over 2.4 times, for HAProxy/LVS it was over 1.4 times, and for Nginx/LVS it was over 1.5 times.
5.5. Test IV Results Analysis
Test IV simulated the highest load for the three web servers among the scenarios tested. This is reflected in the results, as a single web server achieved the worst results in terms of the difference between the other infrastructures. Under high and sustained load, the results of HAProxy and Nginx were again similar. The best performance was once again achieved with the LVS-based infrastructure. The average response turnaround time for LVS was more than five times shorter than the HAProxy and LVS-based infrastructures, and the standard deviation was many times lower, also when compared to a single web server. Thus, one can venture to say that even a single server hidden behind a load balancer would return very good results (
Figure 8).
The mean total service time in this test was very long compared to the rest of the tests due to the fact that network card bandwidth was limited, and requests were waiting for their turn to transmit data. This is evidenced by the low connection establishment time and the average response return time. Just sending it back was the longest part of downloading content from the server. The difference in average response time was over 4 times for HAProxy/LVS and about 5 times for Nginx/LVS. The average overall handling time for no LB is about 2.5 times, for HAProxy/LVS and Nginx/LVS it is more than 1.4 times. Detailed results are summarized in
Table 2,
Table 3 and
Table 4.
5.6. Test V Results Analysis
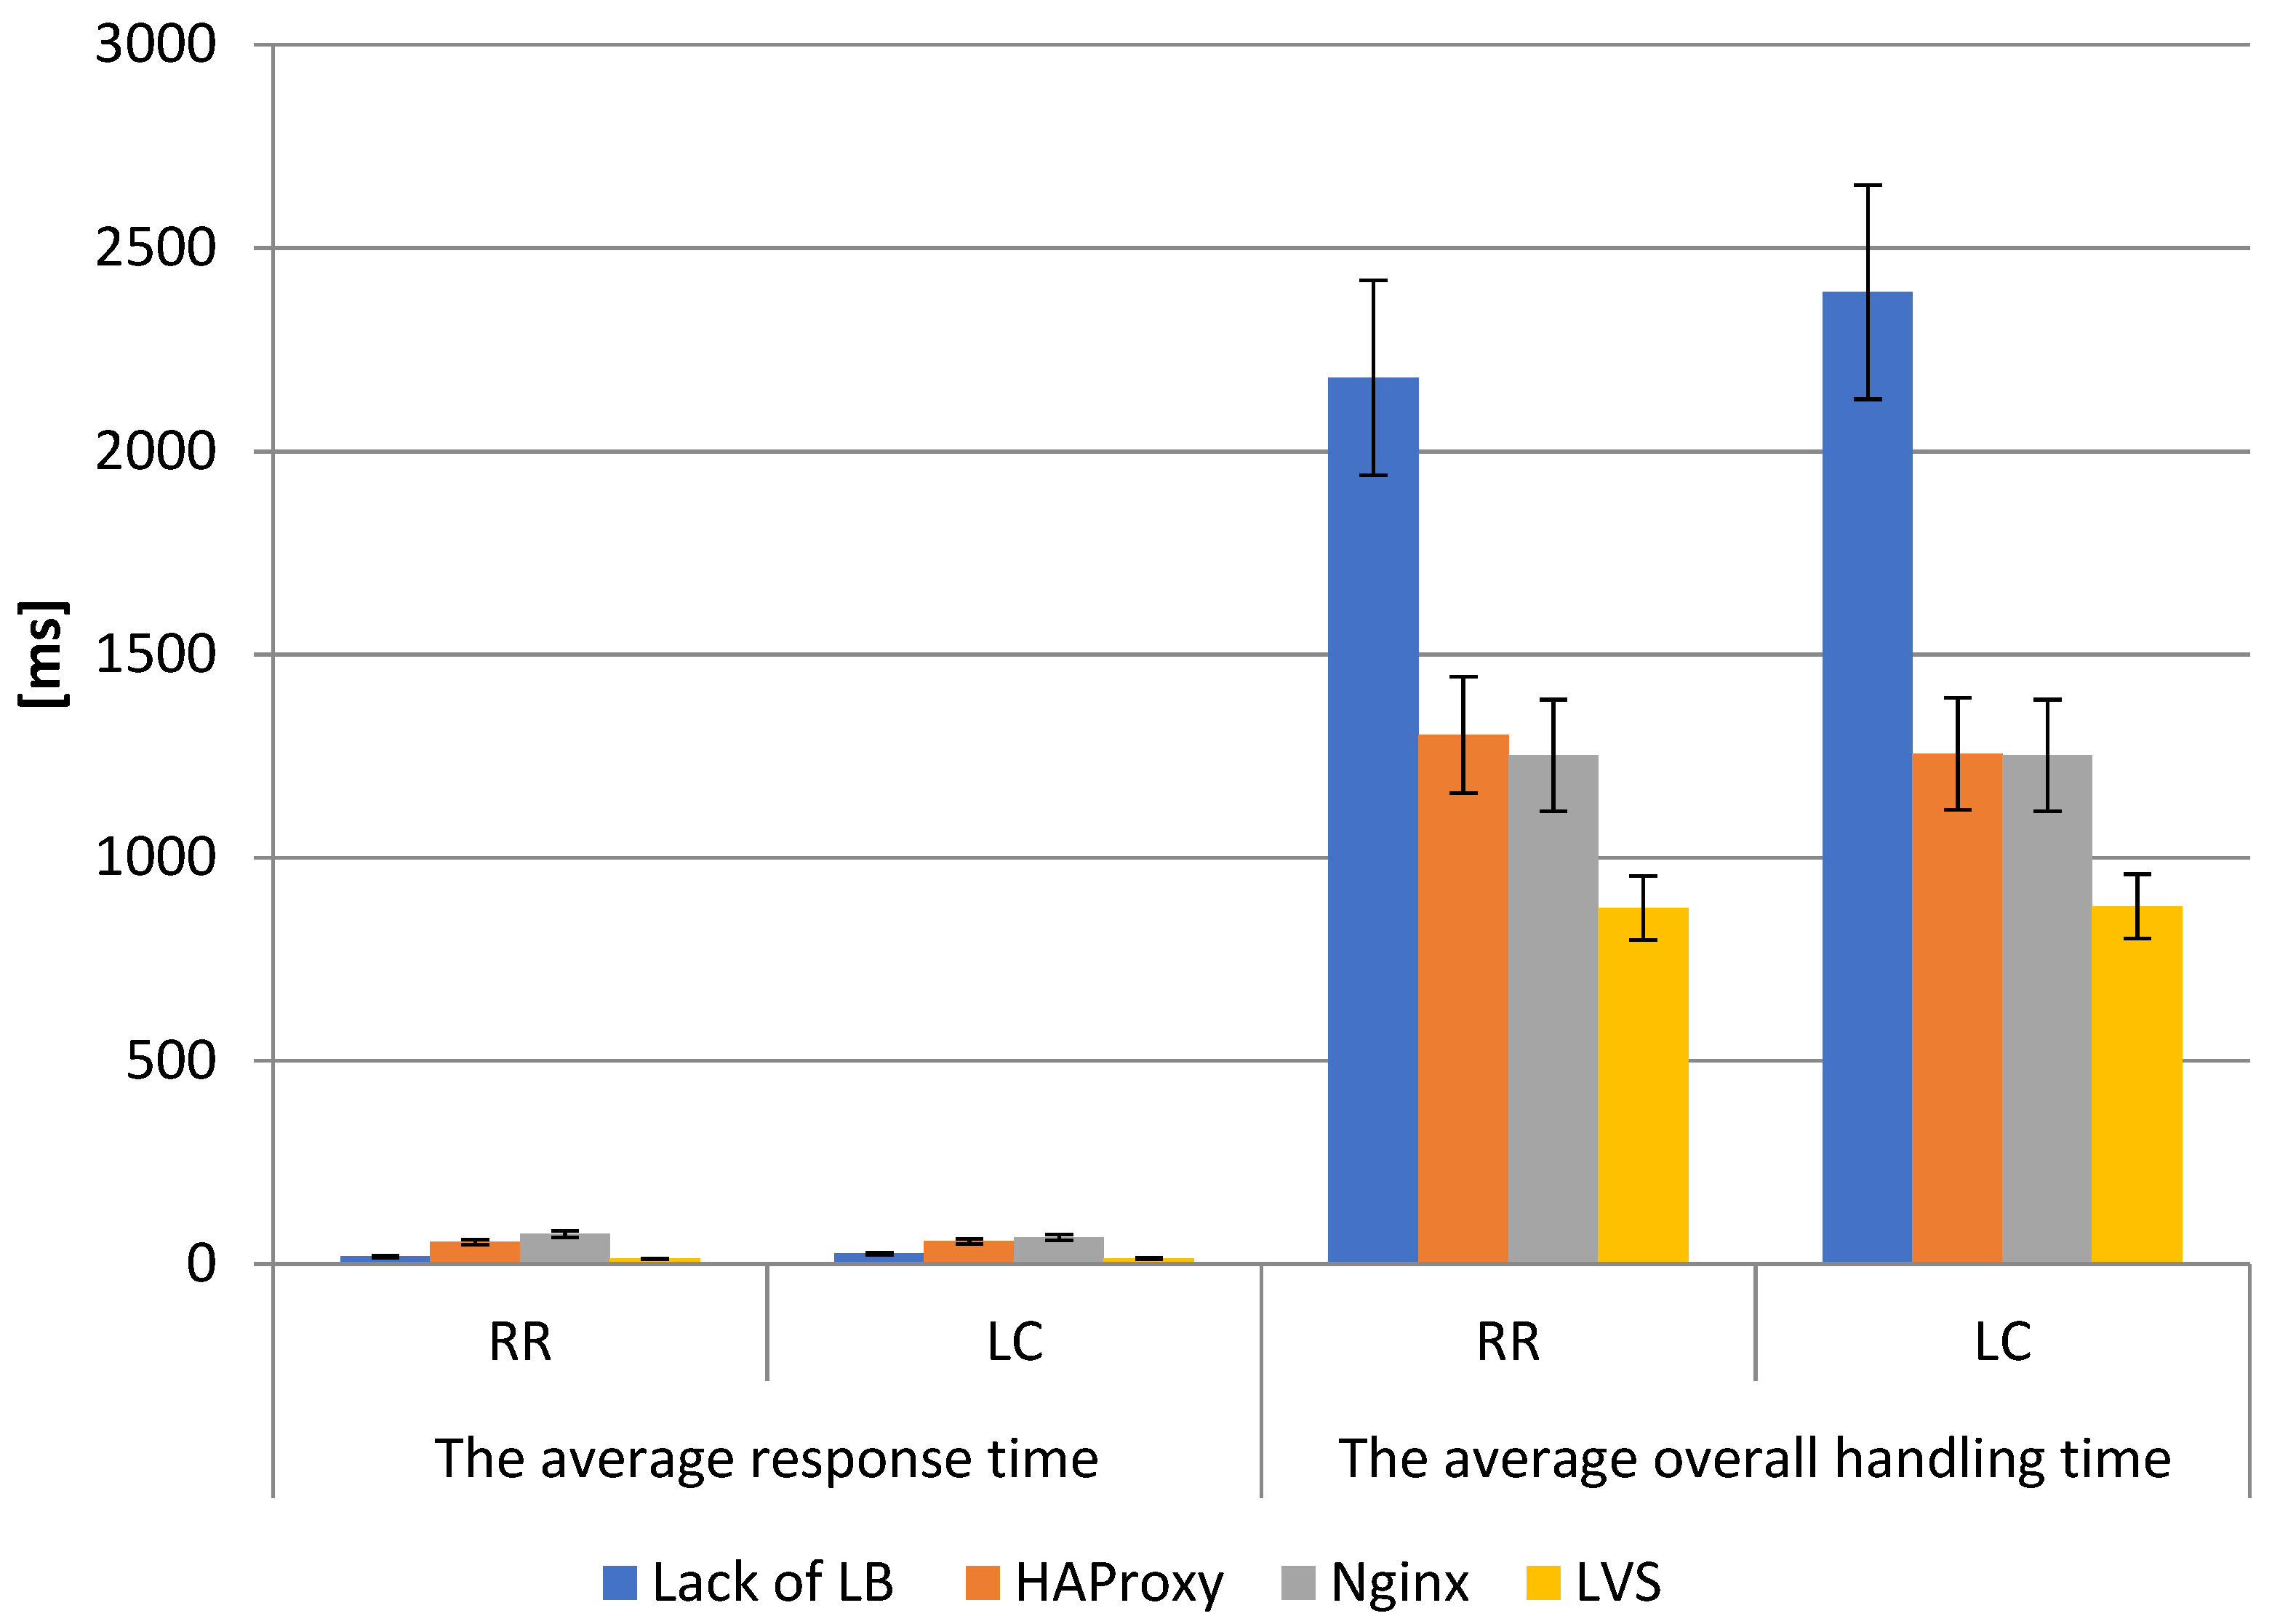
Test V is the first test in which ten backend servers appeared. Analyzing the results in
Figure 9, it can be seen that increasing the number of backend servers did not significantly affect the performance distribution. For short-term and low load, the best performance was again achieved by the LVS load balancer. They had the shortest average response turnaround time, twice as fast as a single server and three times as fast as HAProxy and Nginx-based infrastructures. The average time to service the entire request was almost twice as fast as the other results. The LVS-based results also had the smallest standard deviation. HAProxy and Nginx once again achieved almost identical results. The impact of the traffic-balancing algorithm also seems to be irrelevant for more servers.
The research showed that, as before, of all the load balancers, the server was most loaded when testing the LVS-based infrastructure. The test time was also the shortest, proving that it is the most efficient software under these conditions. The difference in average response time was nearly 4 times for HAProxy and Nginx. The average overall handling time, similarly to previous tests, also reached values lower than competitors by half (being on average 54 ms against 90 ms for HAProxy and Nginx). Detailed results are summarized in
Table 2,
Table 3 and
Table 4.
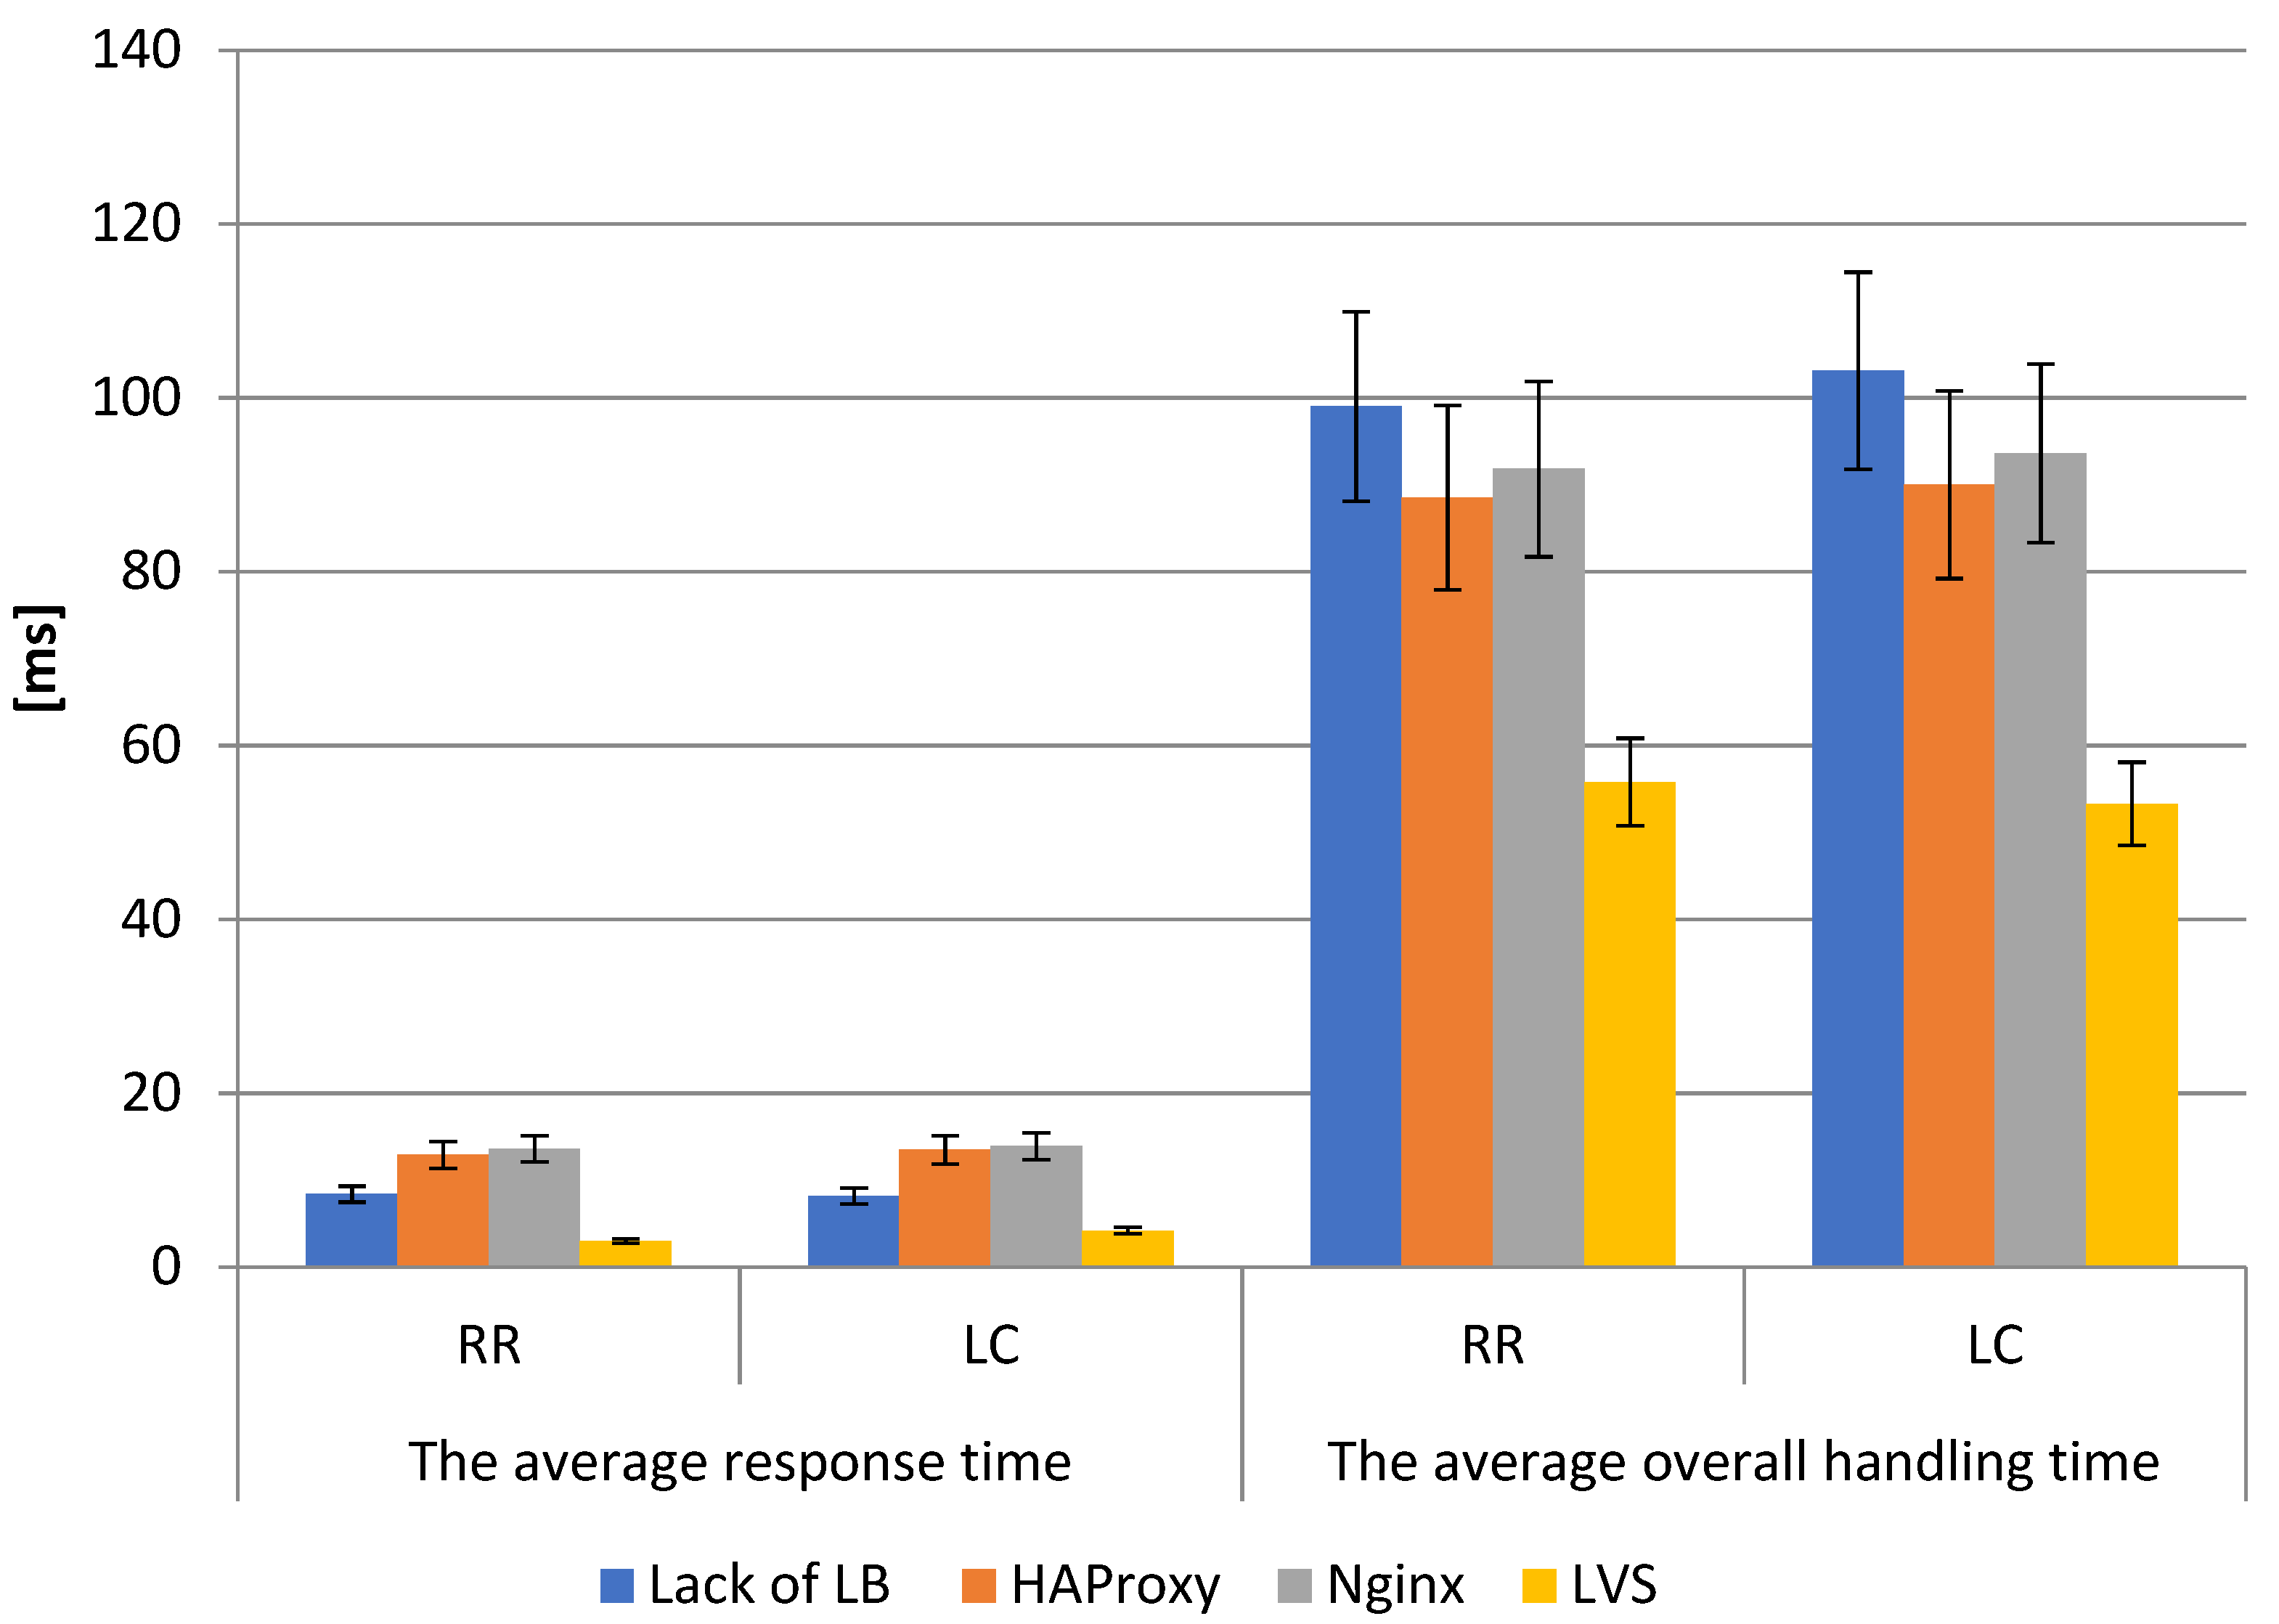
5.7. Test VI Results Analysis
Analyzing the results from Test VI, compared to the results obtained in Test II, for the same input data, but now for 10 backend servers (rather than 3), they were able to respond to the request at different times on average. For HAProxy this time increased slightly, for Nginx it almost doubled, while for LVS it decreased three times. However, the average time to service the entire request was almost identical for all infrastructures. This may suggest an insufficient load of concurrent requests, issues with processing by the web servers, or imprecision in the number of requests generated by the test client. During tests, it was observed that for a larger number of concurrent requests, the client is not able to reliably generate as many requests as declared, even despite attempts to increase the available computing power of the test client.
The maximum limit reached in the tests seemed to be the number of concurrent requests in the range of 70–80, and it was also not repeatable, because once it was 60 and once it was 90. The ApacheBench client cannot work in the multithreaded mode, so the limitation here is probably the performance of this software. After deciding that virtualization might be to blame, the client was run on another physical machine (a laptop) and the results were the same. We also attempted to multiply the VMs generating requests to 3 and send them at the same time, while splitting the target number of requests, for instance 200, across the three machines. The effect of the test was that the total duration of the tests was the same or often even lower than in the case of a single test with the number of concurrent requests of 200. As in the case of three servers, here the CPU utilization by the Nginx software is the highest among the load balancers. For LVS, due to the principle of operation, the number of requests and servers does not matter, as it still provides the highest performance. When using the load balancer for more web servers, the CPU load of the backend server is almost negligible. As can be seen in
Figure 10, the difference in the performance of the RR and LC algorithms is significant. The average response time of the RR algorithm for HAProxy and Nginx is nearly twice as short as the LC algorithm (HAProxy-RR 48 ms, HAProxy-LC 83.8 ms, while Nginx-RR 22.3 ms, Nginx-LC 40.3 ms). LVS for both algorithms showed similar difference results (7 ms (RR) and 8.7 ms (LC), respectively). The average overall handling time, similarly to previous tests, also reached values lower than competitors by half. Detailed results are summarized in
Table 2,
Table 3 and
Table 4.
5.8. Test VII Results Analysis
For the ten backend servers, as for three, the total response time cyclically increases and drastically decreases. This time, however, it occurs about three times more frequently, so it can be concluded that the backend servers’ request processing is to blame for this phenomenon.
As shown in
Figure 11, the average response time for both algorithms in Test VII looks similar. The advantage of LVS over HAProxy and Nginx for the average response time in extreme cases was nearly 3 times. The average overall handling time similarly to the previous tests also reached values lower than the competitors by almost half (HAProxy-RR 351.5 ms, HAProxy-LC 364.9 ms, Nginx-RR 387.6 ms, Nginx-LC 389.2 ms compared to LVS-RR 204.1 ms, LVS-LC 194.6 ms). Detailed results are summarized in
Table 2,
Table 3 and
Table 4.
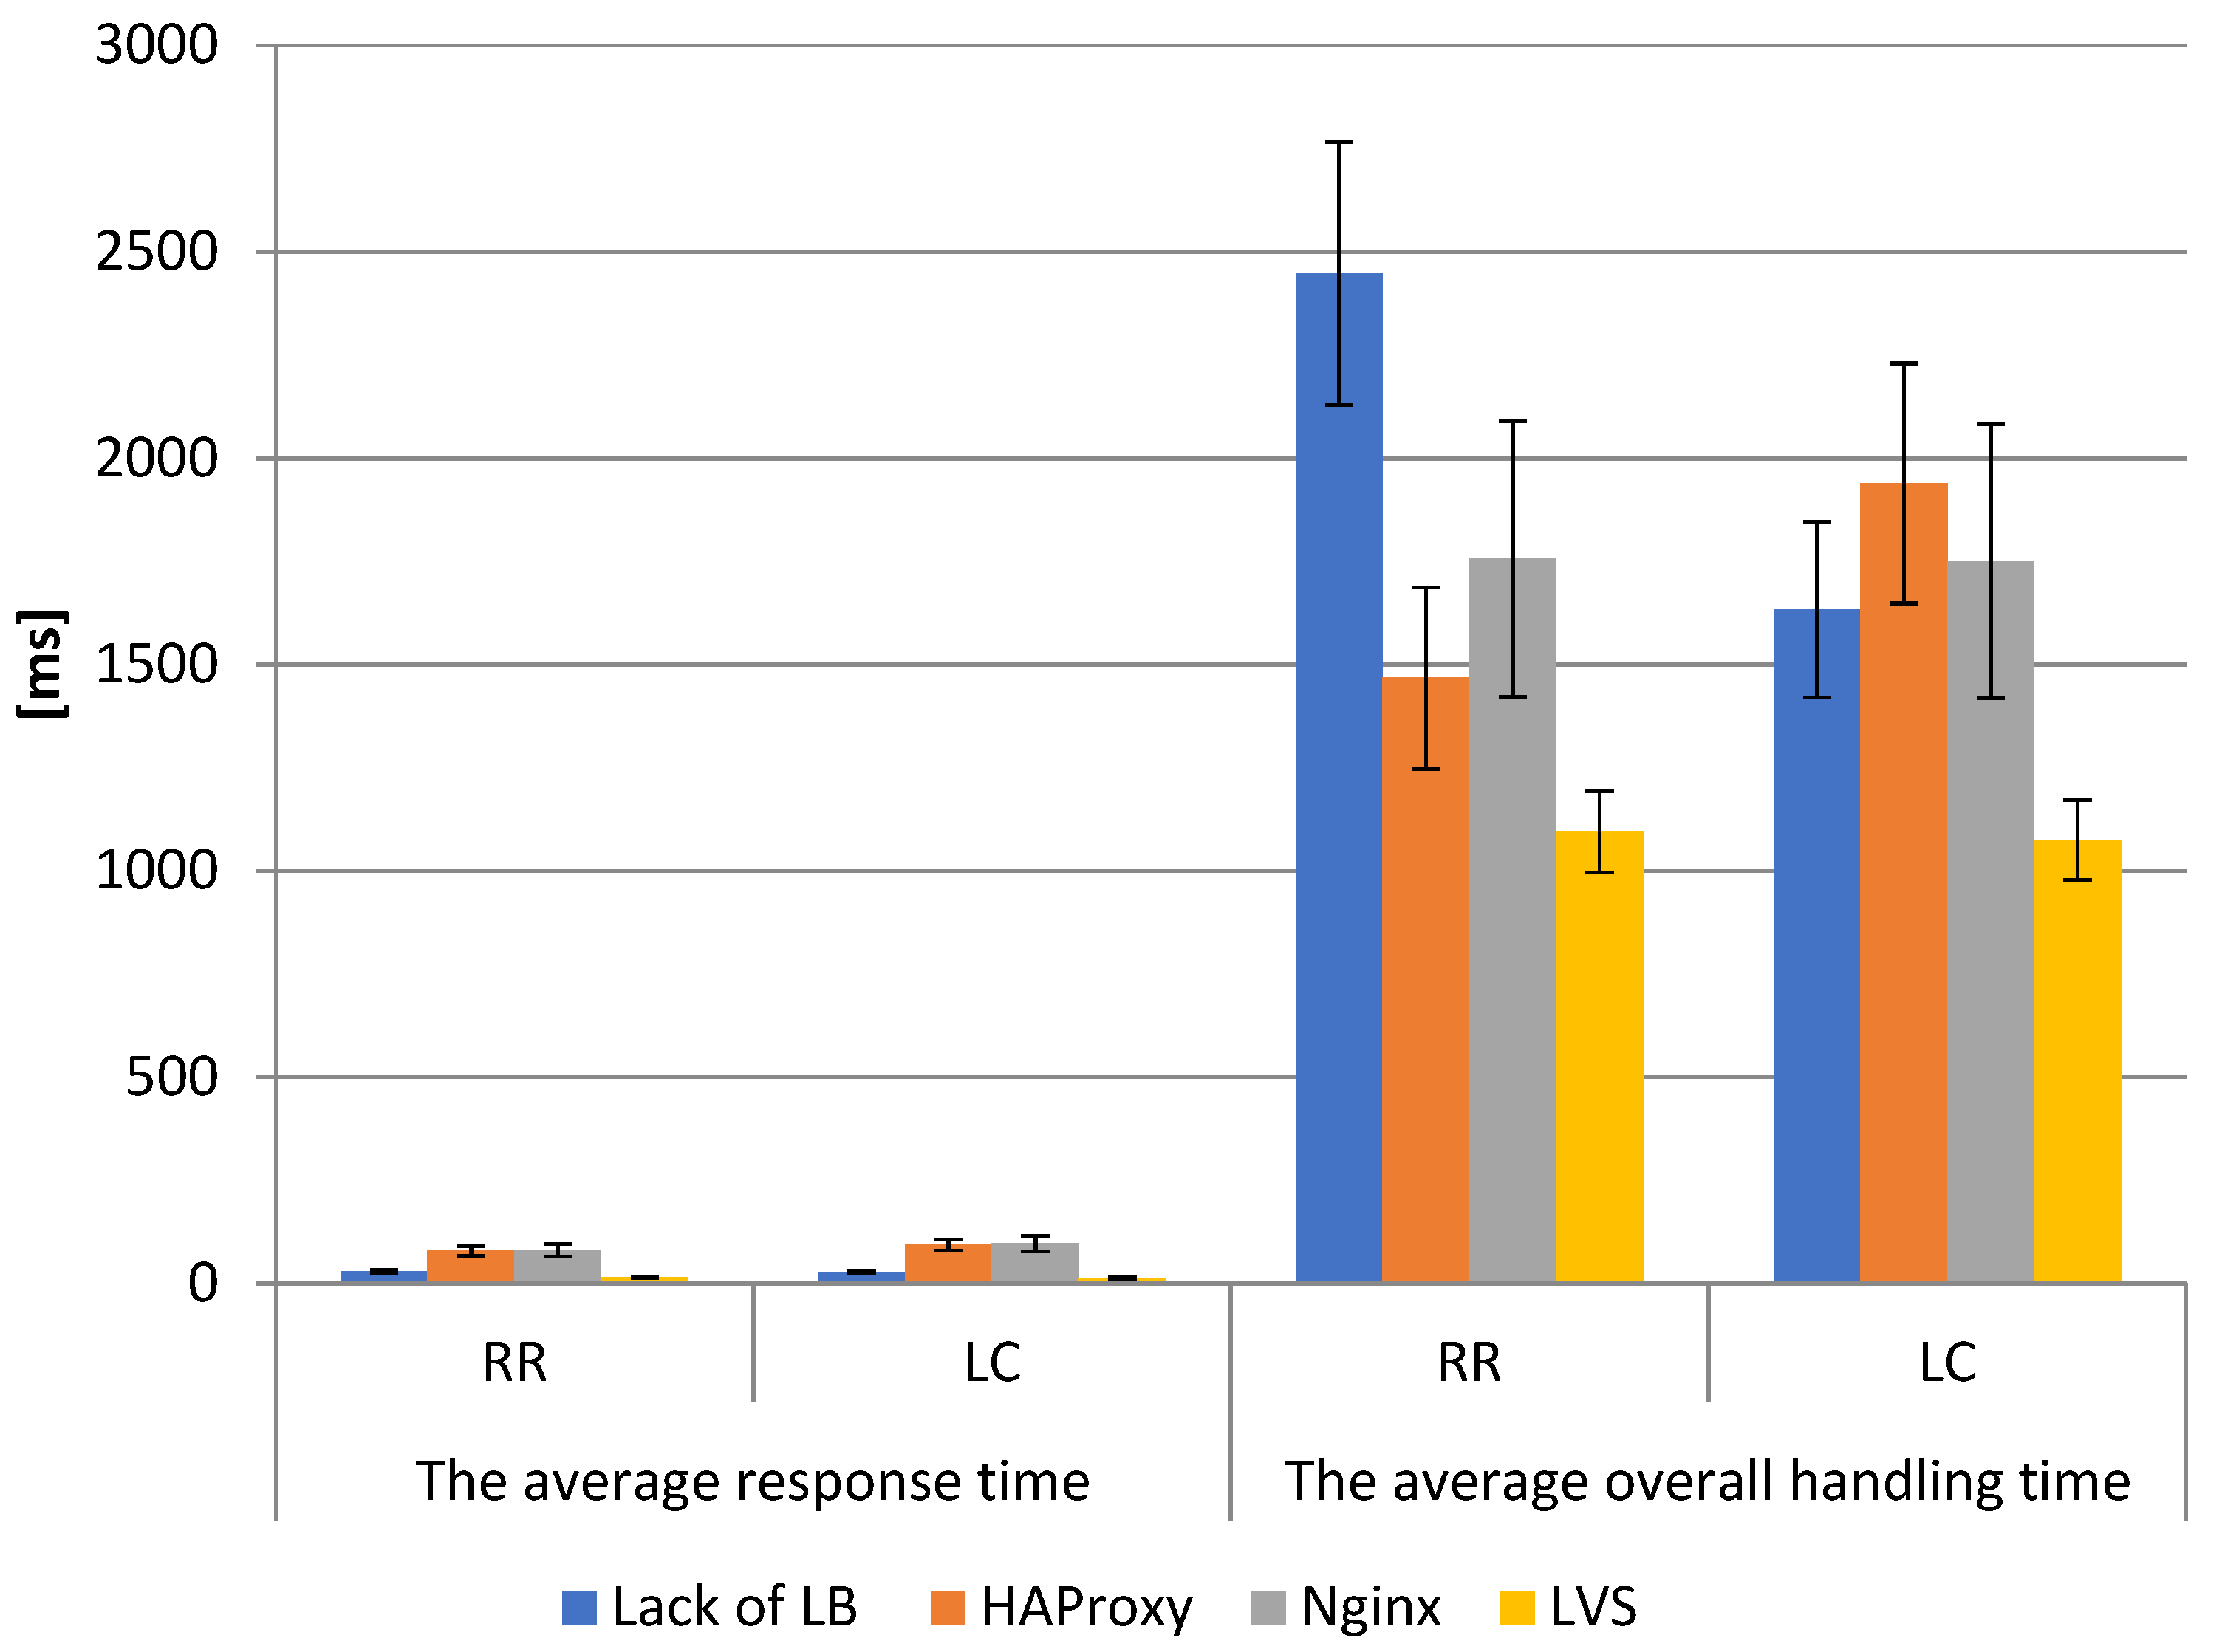
5.9. Test VIII Results Analysis
As in the previous cases, the Test VIII results for the ten backend servers were worse than for the three backend servers, but nevertheless still maintained the same regularities in terms of performance comparison that have prevailed since the beginning of the tests. The last test has a high standard deviation for the average total service time, which was most likely caused by congestion on the webserver network cards. For the average response turnaround time, LVS outperformed the HAProxy and Nginx software by a factor of five and the single web server by a factor of two.
The standard deviation was also low for this infrastructure, so it must be concluded that the long response time was not due to delays in processing the request on the load balancer or the webserver. The compared infrastructures for both traffic-balancing algorithms once again achieved similar results. Therefore, it can be concluded that for this type of infrastructure and technology, the use of the algorithm can be arbitrary, as it does not affect the overall performance of the environment. As shown in
Figure 12, the advantage of LVS over HAProxy and Nginx for the average response time was, in extreme cases, more than 6 times (e.g., HAProxy-RR 79.5 ms, HAProxy-LC 93.1 ms, Nginx-RR 80.3, and Nginx-LC 96.7 ms compared to the LVS average of 14 ms). Average overall handling time, similarly to the previous tests, also reached values lower than competitors by almost half (HAProxy-RR 1467.6 ms, HAProxy-LC 1939.5 ms, Nginx-RR 1755.9 ms, and Nginx-LC 1750.7 ms compared to LVS-RR 1095.3 ms, LVS-LC 1074.5 ms). Detailed results are summarized in
Table 2,
Table 3 and
Table 4.
5.10. Comparative Analysis of All Tests
All detailed results are summarized in
Table 2,
Table 3 and
Table 4. The table shows that this software HAProxy is more efficient than Nginx for these data. The average response turnaround time is lowest for LVS and highest for HAProxy and Nginx. The average total request handling time is longest for a single server and the shortest for LVS. The highest standard deviation for total service time is characterized by Nginx and the lowest by no load balancer, reflecting the conclusions drawn in the previous paragraph. The impact of the traffic-balancing algorithm turned out to be marginal, as the results are almost identical and within repeatability limits.
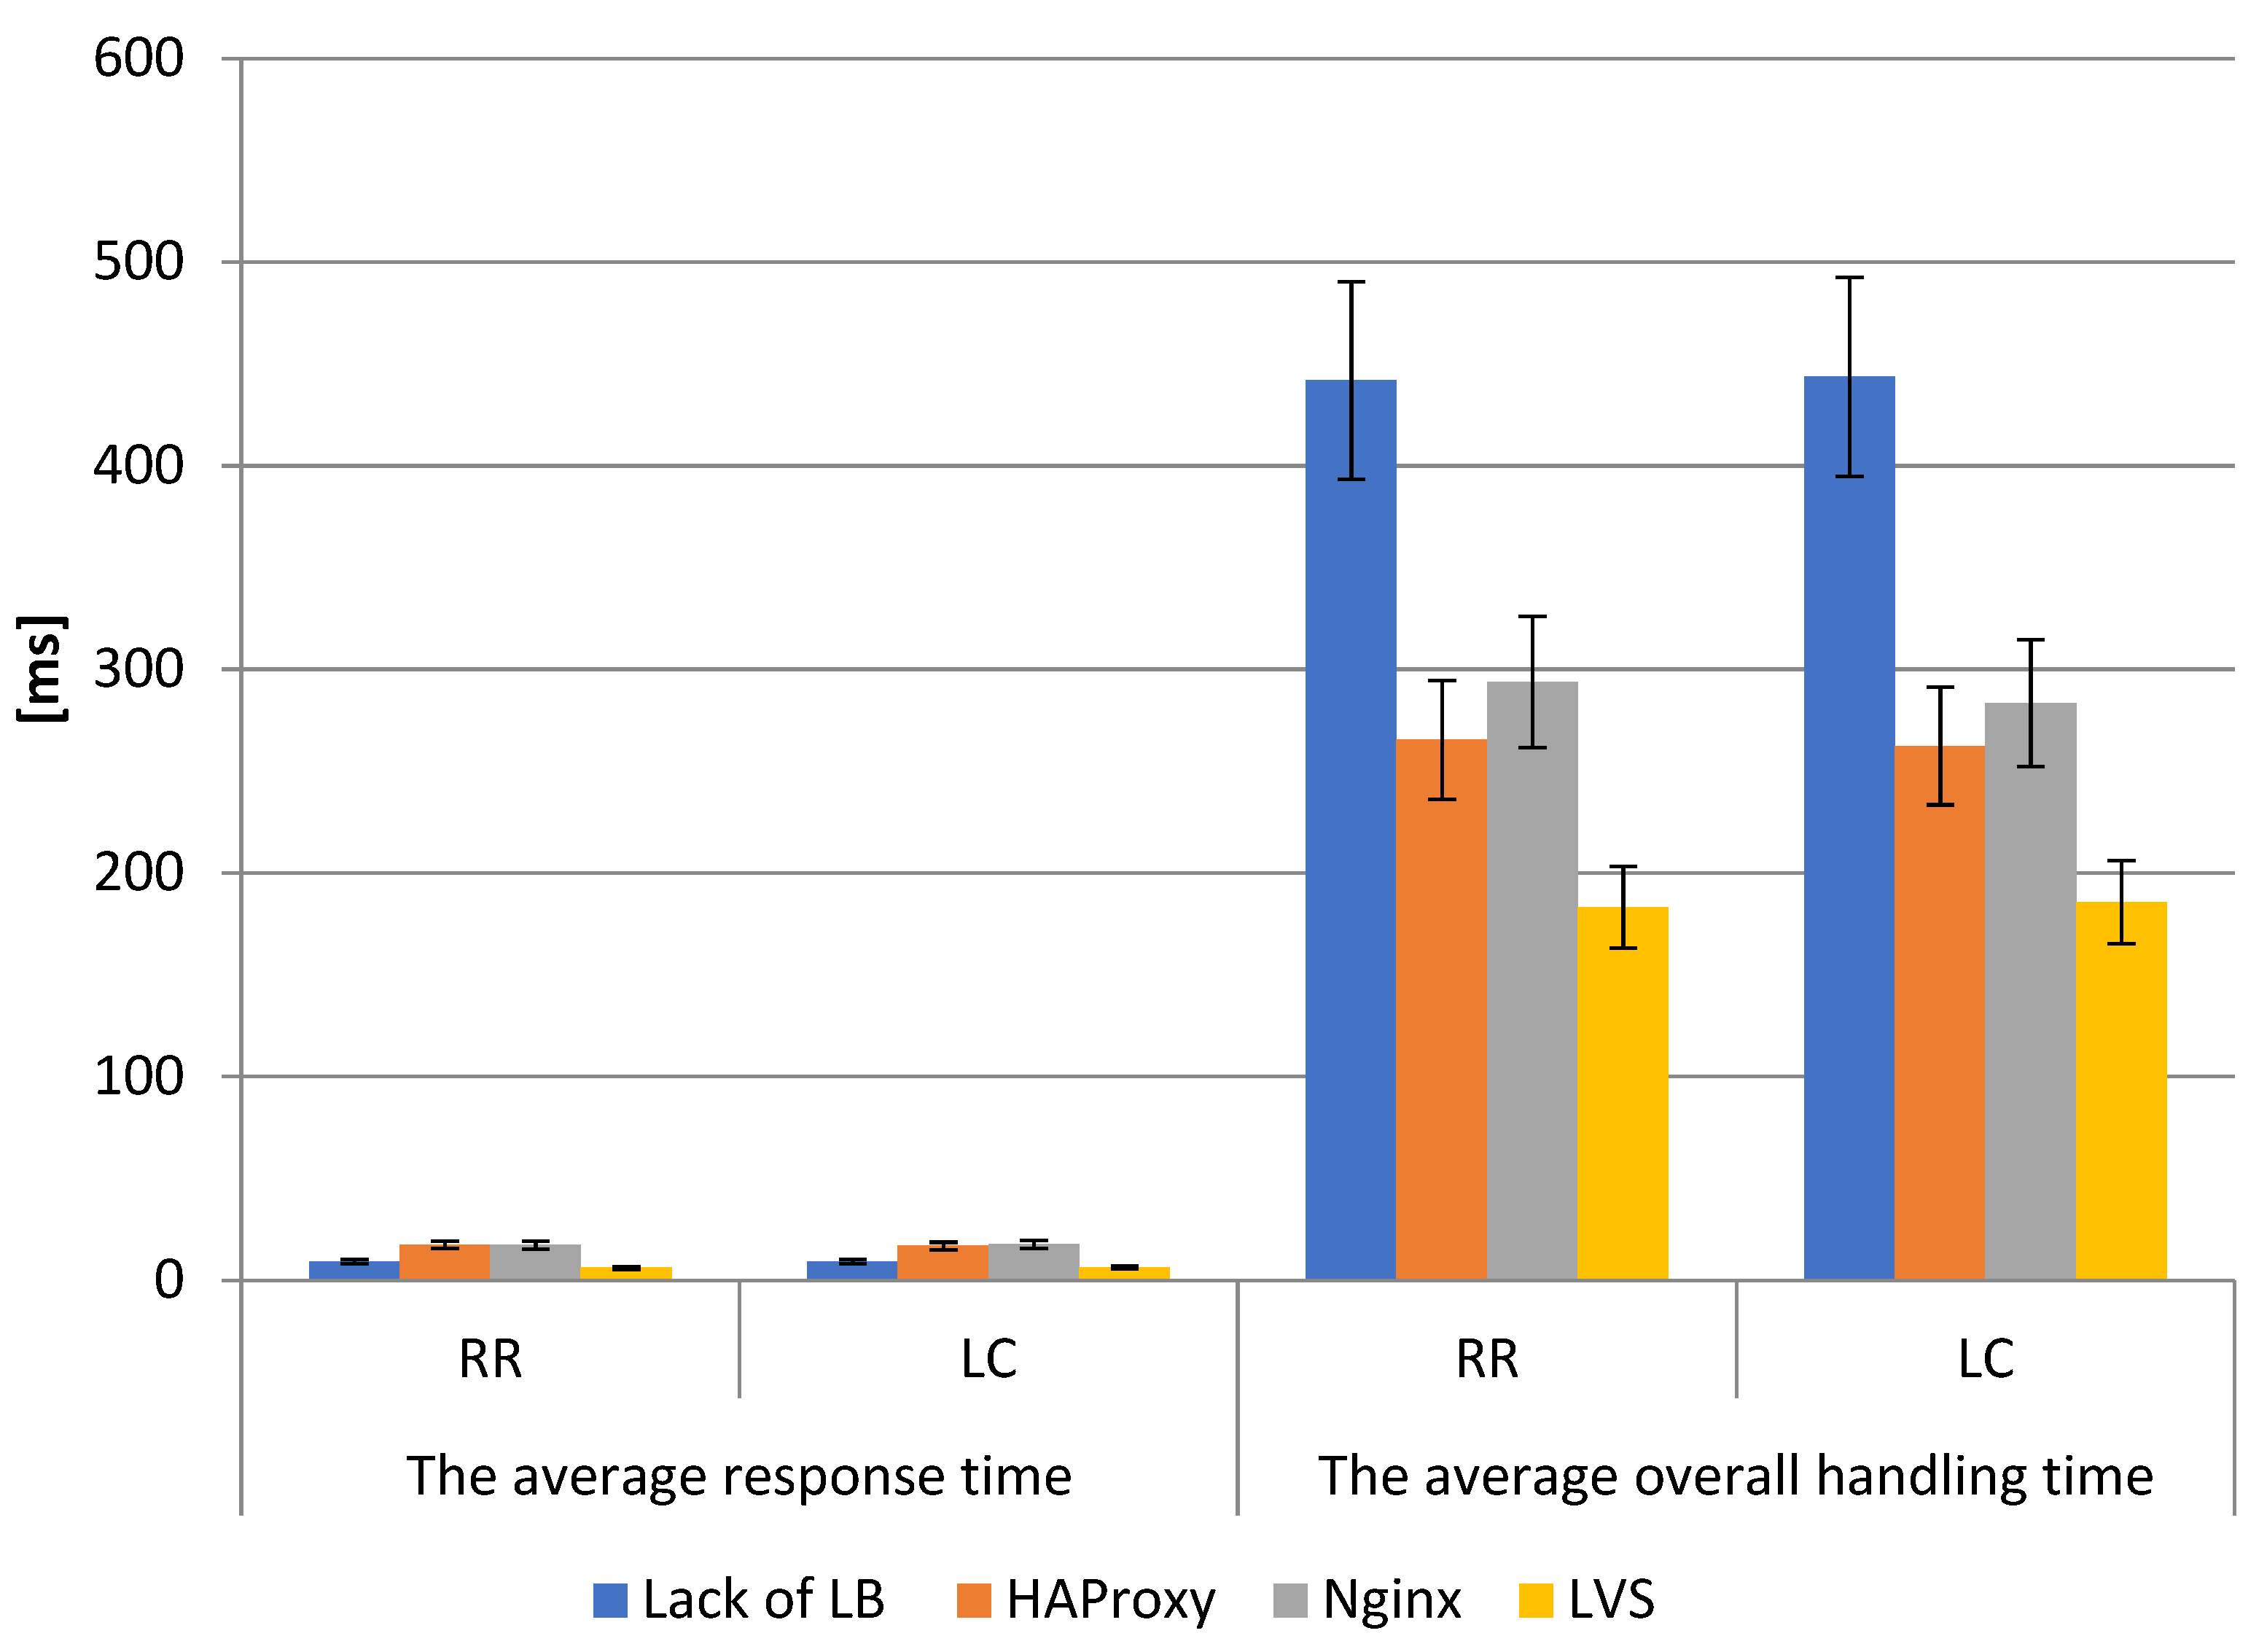
As shown in
Figure 13, the percentage difference in average overall handling time values versus LVS for almost every test was over 100%. Detailed analysis of the results presented in
Table 2,
Table 3 and
Table 4 clearly showed that load balancing solutions based on LVS algorithms are the fastest, making them a leader in data center applications. Additionally, the simulation results showed that the performance of this solution is not significantly affected by the number of requests and servers. LVS still provides the highest performance compared to other solutions.
6. Conclusions
While balancing traffic in server infrastructures is important, High Availability of the service is more important. It is important to distinguish between low and no quality of service. In the case of high availability, the goal is to make the service immune to the failure of the machine that makes it available in the network. In other words, the service must have a minimum of two instances with the ability to dynamically switch between them in case of failure of one of them—this is how clustering in active–passive mode works, which was described in the theoretical section. On the other hand, active–active mode forces the operation of both machines simultaneously. The main goal of implementing HA is to minimize service unavailability time during switching (downtime). The shorter the downtime, the better, because fewer sessions will be lost.
In the case of the compared solutions, none of them offers HA by default, so this has to be implemented using another service. As a result of the research, it was concluded that the most efficient server in the designed infrastructure is LVS, while HAProxy and Nginx tools achieve largely similar results, depending on the load. However, taking into account the overall issue, i.e., not only the results but also the background in the form of configuration options and applications for which each solution was designed, it is hard to resist the impression that HAProxy achieved the best results, as in a direct comparison with load balancers working in the transport layer, it presented similar performance while consuming less hardware resources and possessing much broader configuration options than Nginx software. LVS, on the other hand, despite achieving the best results by far, often several hundred percent above the competition, was determined to be well suited for balancing traffic between other traffic balancers.
Studies have shown that LVS is best able to handle the HTTP request load of an infrastructure consisting of a load balancer and web servers. Competing solutions such as HAProxy and Nginx perform less well, most likely due to their principle of operation. The infrastructure with LVS also shows remarkable stability compared to other solutions. As expected, the load on web server components decreases as the number of servers accepting requests increases, while for load balancers the relationship is reversed—their load increases as the number of requests they have to process increases. Still, LVS-based infrastructure shows the lowest load.
Rising energy costs and the negative environmental impact of power generation, especially when using fossil fuels, are increasing the demand for energy-efficient data processing. In addition to optimizing hardware devices, an important area of current research is the use of appropriate software solutions such as load balancers to reduce energy consumption. Distributing the load between servers requires appropriate techniques, which are presented in this paper. There is a great potential to reduce energy consumption with the described techniques.
Cloud computing data center design and management must adapt to these changes while aiming to improve system performance, energy efficiency, and reliability. Load balancing using the Round Robin algorithm is the simplest and easiest load balancing technique that can be further implemented in fog computing environments. Cloud computing is becoming increasingly popular, and services are generally being extended to fog computing, which provides the power and advantages of data creation and analysis at the network edge. Real-time location-based services and applications with mobility support are available due to the physical proximity of users and high-speed Internet connection to the cloud. Fog processing is promoted using the described load balancing techniques. The balance between load balancing and network load distribution among data servers is critical to the development of energy-efficient data center solutions.
In general, the worst results during the tests were obtained by Nginx software, which, while in a direct comparison of absolute results with the HAProxy software achieved similar results, in a broader perspective, after taking into account the configuration capabilities and resource utilization, presented itself as worse. Convergence tests showed that in a cluster consisting of two machines, service unavailability time should not exceed one second, and actually was about 0.6–0.7 s, which is an acceptable result for rare events, such as failures in well-managed infrastructures.


