Article

Analysis of the Long-Term Mass Balance and Efficiency of Waste Recovery in a Municipal Waste Biodrying Plant

1
Department of Environmental Biotechnology, Faculty of Geoengineering, University of Warmia and Mazury in Olsztyn, 10720 Olsztyn, Poland
2
Department of Environment Engineering, Faculty of Geoengineering, University of Warmia and Mazury in Olsztyn, 10720 Olsztyn, Poland
3
Collection of Plasmids and Microorganisms, Faculty of Biology, University of Gdansk, Str. Wita Stwosza 59, 80308 Gdańsk, Poland
4
Municipal Waste Treatment Plant in Olsztyn, Str. Lubelska 53, 11410 Olsztyn, Poland
*
Authors to whom correspondence should be addressed.
Energies 2021, 14(22), 7711; https://doi.org/10.3390/en14227711
Submission received: 28 October 2021 / Revised: 10 November 2021 / Accepted: 12 November 2021 / Published: 17 November 2021
(This article belongs to the Special Issue Integrated Waste Management)

Abstract

:
The aim of this study was to determine the role of an installation based on biodrying of municipal waste in a Circular Economy by taking into account the quantitative and qualitative changes in its selectively collected waste stream. As a case study, the Mechanical-Biological municipal waste treatment installation in Olsztyn, Poland, was selected, which is equipped with a separate section for valorizing the selectively collected waste stream. The scope of the work included a complete mass balance of the waste treatment plant, an assessment of the technological efficiency of the municipal waste biodrying installation, and determination of the changes in the main waste from 2016 to 2020. This paper proposes an empirical method for estimating process loss during biodrying and provides many technological results. The average process loss was 23.47%, and on average, 88.9% of the waste produced by biodrying consisted of the Refuse-Derived Fuel fraction. The recovery of commercial assortments from selectively collected waste increased from 84.82% in 2016 to 89.26% in 2020. Considering the current morphology of municipal waste in this region, the maximum share of waste subjected to material and organic recycling processes in the analyzed region could be increased to around 60%, which indicates that Circular Economy targets can be achieved. This work should provide a compendium of information for countries implementing a Circular Economy.

Graphical Abstract

1. Introduction

The concept of a ‘Circular Economy’ was first used in the literature by Pearce and Turner in 1990 [1]. Their publication, entitled ‘Economics of Natural Resources and the Environment’, explains the process of transformation from a conventional (linear, open) economic system to a circular one. Authors suggested reducing the consumption of raw materials, designing products so that they can be easily disassembled and reused (eco-design), extending product life through maintenance and repairs, using secondary raw materials in products, and recovering raw materials from waste streams [2,3]. The implementation of a Circular Economy in the European Union entails new challenges in waste management [4,5]. For example, by the end of 2035, EU Member States will be required to recycle 65% of the municipal waste stream and will only be allowed to landfill 10% of municipal waste.
Due to the great importance of a Circular Economy for sustainable development, it is necessary to assess the level of circularity in the Member States of the European Union. Underscoring the importance of this assessment is the fact that circular economies are becoming a global phenomenon, as they are developed in not only European countries but also in Asian ones [6,7]. The key questions are: (1) at what stage are the EU countries currently in terms of meeting the Circular Economy requirements, and (2) what are the main challenges on the road to achieving circularity in Europe? Eurostat data [8] show that material and organic recycling of the municipal waste stream averaged 48% in the EU-27 in 2019, and landfilling of municipal waste streams averaged 26%. The highest level of recycling was achieved by Germany, which was the only country that met the Circular Economy requirements in 2019. Among the European countries that are not members of the EU, a relatively high level of material and organic recycling (over 40%) takes place in Switzerland, Great Britain and Norway. In turn, 18 EU member states were below the EU-27 average in 2019 (Figure 1).
High recycling rates can be misleading or insufficient indicators for assessing circularity in European countries. These rates do not directly reflect the amount of cross-border waste flow, nor do they require the possession of documents confirming that all the waste was recycled. These are important issues, because, until 1 January 2018, China and other Asian countries were the world’s leading importers of plastic waste. According to Wang et al. [9], these countries collected about 70% of the plastic waste produced in highly developed European countries. Currently, the main recipients of plastic waste are countries such as Malaysia and Indonesia [9,10]. In these countries, the actual amount of European waste that is recycled is difficult to determine and is subject to some doubts. Hence, to reliably assess the level of circularity of a given country, macro- and microeconomic indicators should be considered, as well as indicators of economic competitiveness and innovation. For example, Saidani et al. [11] identified 55 different sets of circularity indicators. Similarly, Kasztelan [12] developed and verified an empirically aggregated circular index of national economies (INEC), which uses 14 different indicators of circularity. That author estimated that the INEC value for 24 EU countries averages 0.3021, which, given that it can range from 0 to 1, indicates the low level of circularity that has been achieved in Europe.
The above observations raise the question of the main obstacles to achieving a Circular Economy in Europe. The principal challenges seem to include the need to build new installations for material recycling, to remodel the existing installations and municipal plants to serve as recycling centers, and to implement adequate social education. In this regard, Poland can serve as a useful example of the challenges facing many countries in Europe and around the world. In this country, 98% of municipal waste management in 2003 was based on landfilling [8], and in 2007, over 25% of the country’s population was still not served by an organized waste collection system [13]. As a result, the cost of modernizing the Polish waste management system during the years 2011–2020 was estimated to be 4947 million Euros in 2010 [14]. These investments allowed about 200 plants for Mechanical–Biological Treatment (MBT) of municipal waste to be built, as well as seven waste incineration plants with a total capacity of 1074,000 Mg/year (1,458,324 MWht/year) [15] and many recycling installations. This infrastructure allowed the amount of waste sent for landfilling to be reduced to 42%, and the levels of material recycling and energy recovery to be increased 25% and 21.43%, respectively (Figure 2).
However, the main goal of the above-mentioned transformations of the Polish waste management system was not to meet the requirements for a Circular Economy but to meet the requirements of Directive 1999/31 EU [16], which ordered the EU member states to limit the stream of biodegradable waste sent for landfilling. Hence, during the modernization of waste management in Poland, most of the installations were designed for aerobic stabilization and biodrying of municipal waste. While it is possible to transform waste stabilization installations (linear economy) into organic recycling installations (Circular Economy), the roles of biodrying installations and waste-to-energy (WtE) installations in a Circular Economy constitute interesting questions. The requirements for a Circular Economy, including 65% recycling and 10% landfilling, suggest that a Circular Economy is not possible without thermal treatment of waste. The example of Germany (Figure 1) suggests that WtE processes in a Circular Economy may be responsible for the management of more than 25% of the waste stream. The issue of the role of thermal waste treatment in a Circular Economy seems to be a global problem. As of December 2018, more than 2450 WtE plants were in operation worldwide, with a processing capacity of approximately 368 million tonnes per year. It is estimated that, by 2028, there will be more than 2700 WtE plants [17]. However, it is difficult to determine the number of operating installations for biodrying of municipal waste. According to Ragazzi et al. [18], in 2007, there were 20 biodrying installations in Europe with a total capacity of 2,372,000 Mg/year. Since then, however, this technology has expanded in many EU countries, including Poland. In Poland alone, biodrying installations have a total capacity of at least 500,000 Mg/year and constitute a significant part of the national municipal waste management system.
According to Psaltis and Komilis [19], typical industrial biodrying in MBT is a technique of autothermal drying shredded municipal waste for a period of 7–15 days. The process of initial waste shredding is used by EcoDeco (200–300 mm shredder, windrows biodrying) [20], by Future Fuels (80–120 mm shredder, rotary biodrying) [21] or by Herhof (200 mm shredder, batch reactor biodrying) [22]. Moisture losses in a typical biodrying process amount to about 30% w/w [23], while the reduction of organic matter ranges from 2% to 30% w/w [24,25,26]. The final stage of the industrial biodrying process is valorization of the produced RDF fuel, consisting in the separation of ferro- and paramagnetic metals as well as removal of inert contaminants. Rada et al. [27] recognized the average capacity of a typical industrial biodrying installation at around 95,000 Mg/year for a region with a population of 500,000 inhabitants.
With the requirements for a Circular Economy, several questions arise regarding, for example, the maximum share that biodrying processes play in the processing of communal waste, or the possibility of recovering commercially valuable materials during pre- and postprocessing of waste in such a technological line. These are extremely important technological parameters that would constitute useful knowledge for future designers and specialists addressing problems in global waste management.
Hence, the aim of this study was to prepare a mass balance for a municipal waste biodrying installation, including the flow of waste, and to determine the mass of waste prepared for material recycling in the installation.

2. Materials and Methods

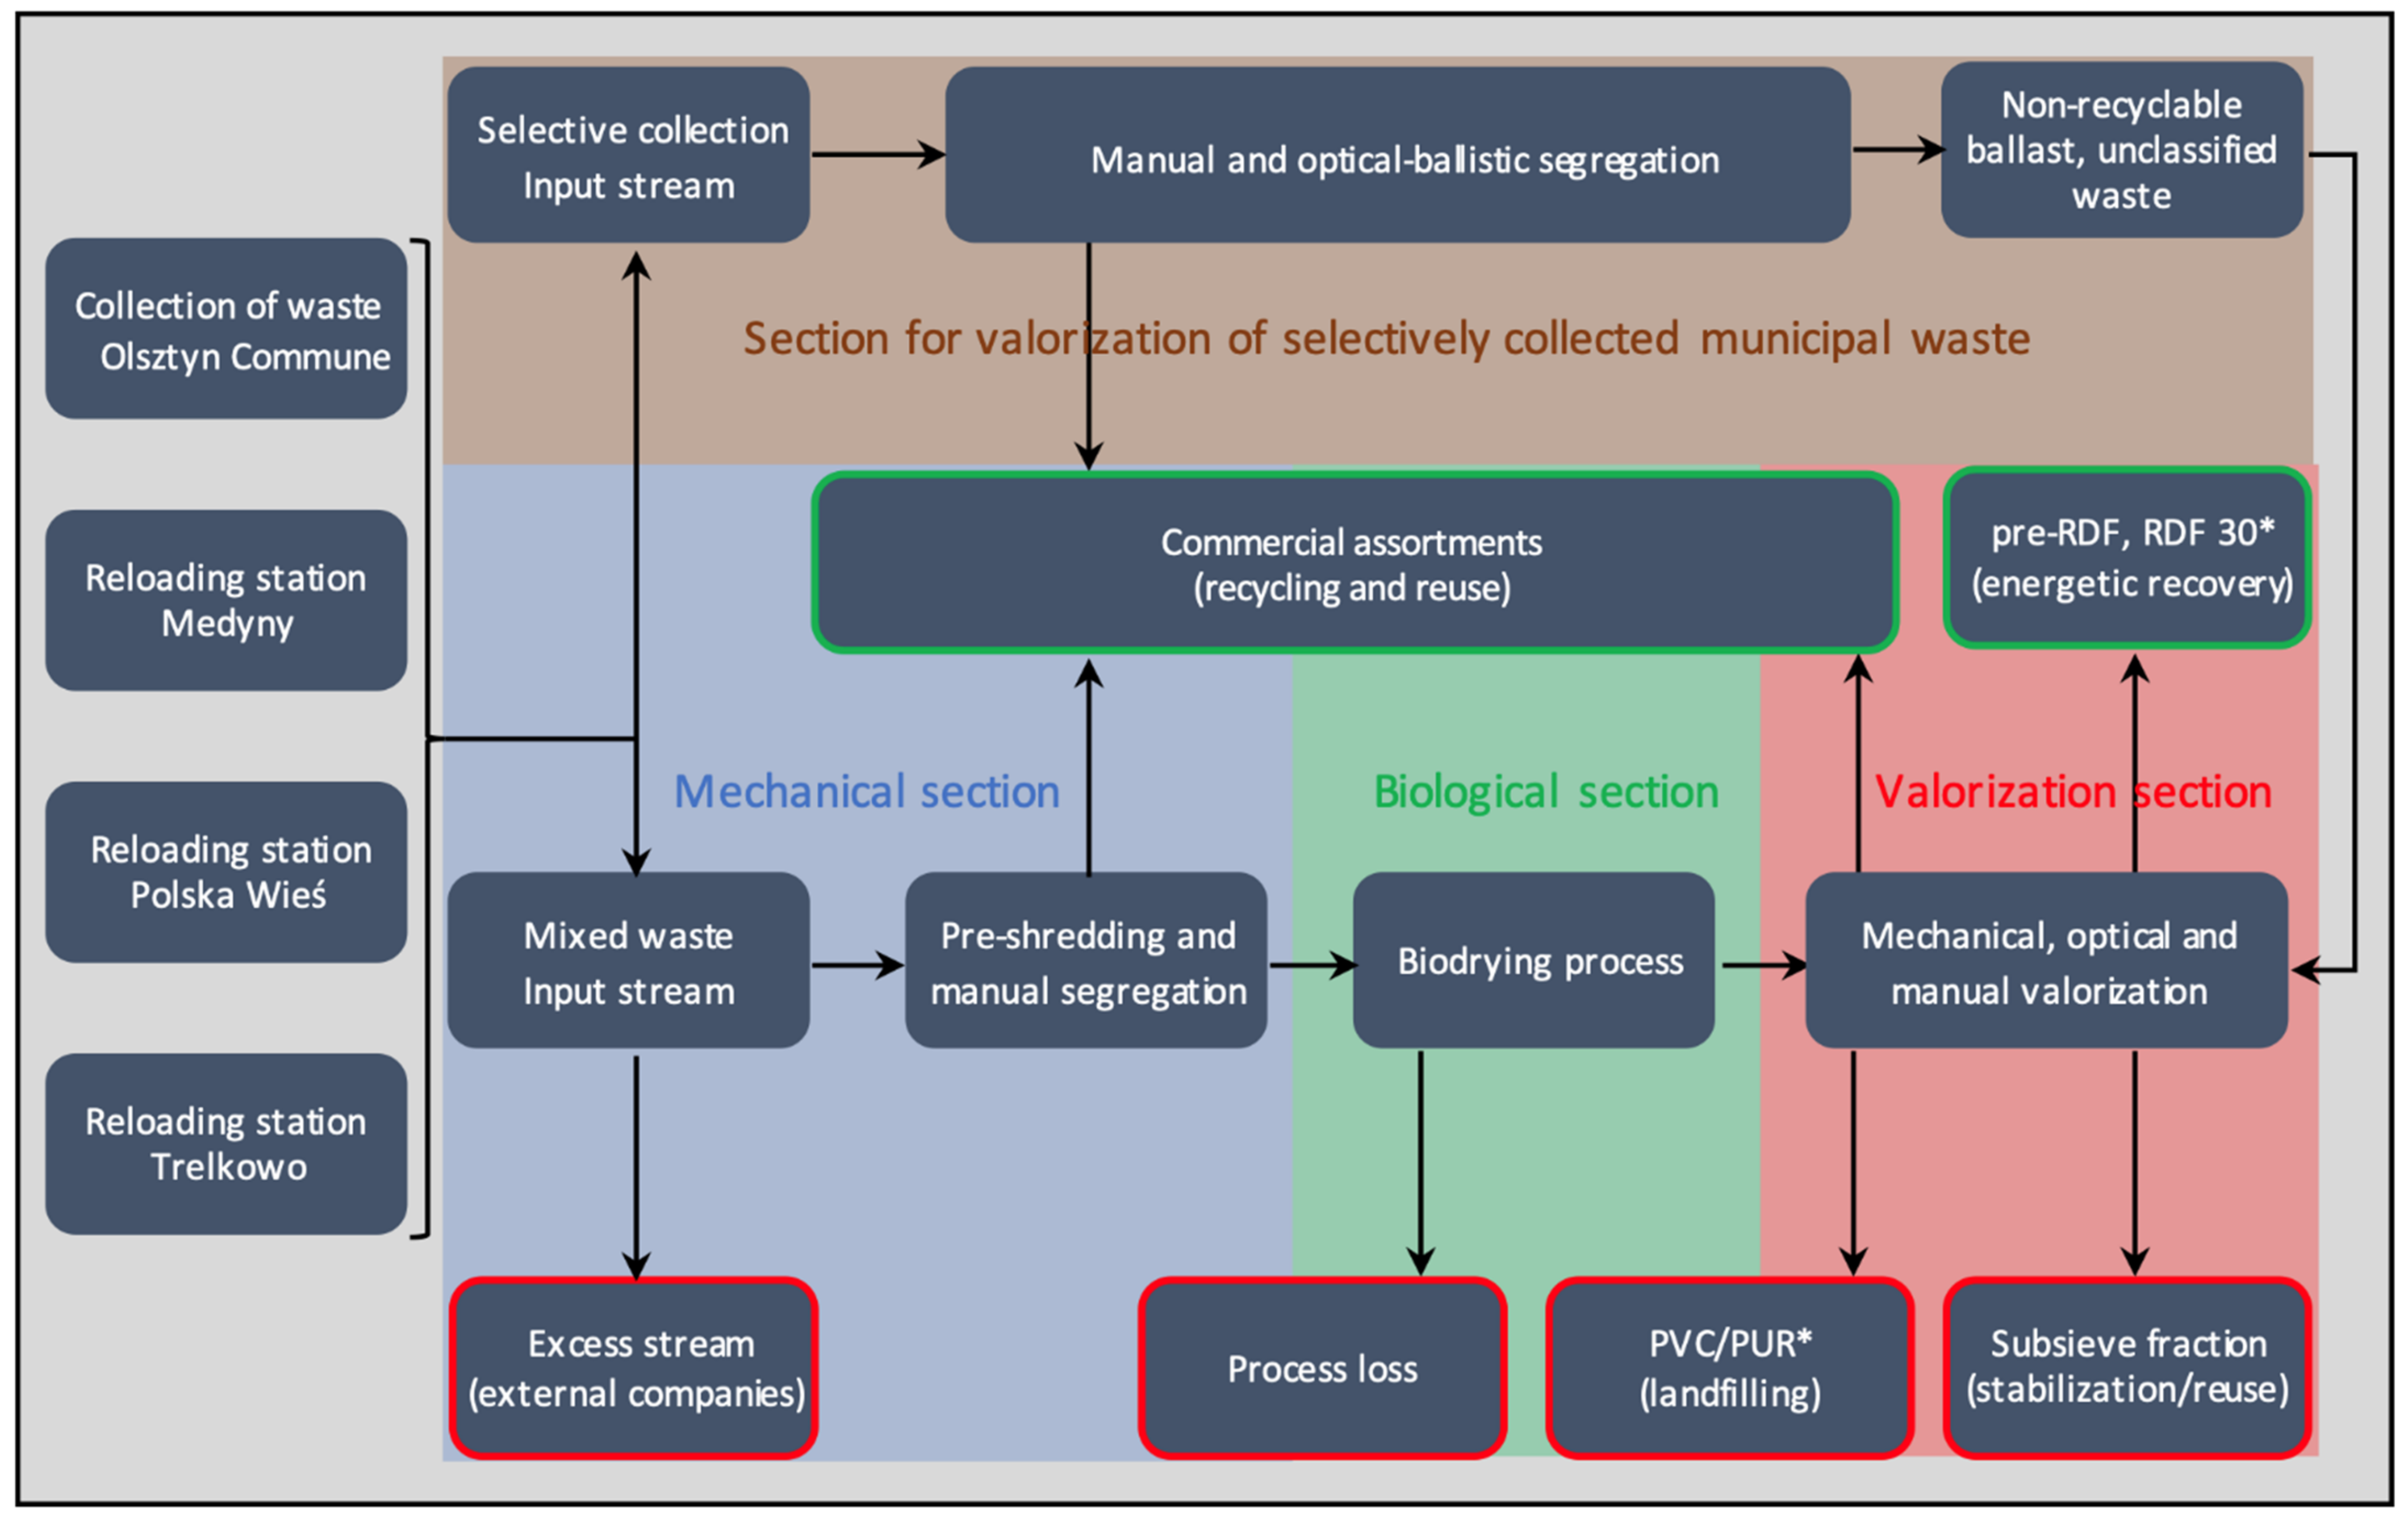
2.1. Subject of the Case Study

As a case study, the Municipal Waste Management Plant in Olsztyn, Poland, was selected, which serves approximately 500,000 inhabitants in the central part of Warmia and Mazury Voivodeship. The plant is served by three reloading stations located in a distance of around 50 km from the plant. The waste treatment installation in the Municipal Waste Treatment Plant consists of a Mechanical–Biological Treatment line with a capacity of 95,000 Mg/year, and a line for processing the selectively collected municipal waste with a capacity of 16,000 Mg/year. The plant perfectly meets the criteria for a biodrying installation of average capacity, adopted in the work of Rada et al. [27] (500,000 inhabitants, 95,000 MgMSW/year).
The Mechanical-Biological Treatment line in Olsztyn focuses on the production of alternative fuel from solid waste, and also enables material recovery of secondary raw materials. The line is divided into a mechanical section, a biological section and a section for valorization of the alternative fuel. The mixed waste is received and unloaded in a storage space with a capacity of 2600 m3. After mechanical pre-treatment, the waste is directed to the biological processing segment, which has the installations for autothermal biological drying. During this stage, process loss occurs because of evaporation of water, including metabolic water contained in the municipal waste. The last stage is valorization, during which pre-RDF fuel is prepared and ballast, i.e., the fraction sent for landfilling or stabilization and recovery, is separated. The devices in this final segment enable separation of a flammable fraction, a non-flammable fraction and raw-material metals and non-metals.
The line for processing selectively collected municipal waste focuses on the recovery of recyclable commercial assortments, such as PET bottles, polypropylene, polyethylene, Tetra PAK, paper and glass. The installation works in an alternating fashion: after sorting out the plastic packaging, it is converted for the recovery of paper, and then for glass. It is a relatively simple installation equipped with a bag ripper and a ballistic sorter, which separates the waste stream into two parallel streams: a stream of flat waste and a stream of waste with greater depth (so-called 2D and 3D waste, respectively). Both streams flow through a dedicated optical sorter. When sorting plastics, the 2D optical sorter selects foil waste, and the 3D sorter selects PET bottles. For sorting paper, the respective sorters select paper and cardboard. Sorting of glass waste consists only of manual removal of plastic bags. The whole is complemented by three-stage manual sorting of commercial assortments. The first sorting cabin is located directly after the bag ripper, and the other two sorting cabinets are located after the 2D and 3D sorters. Non-recyclable packaging is treated as ballast. Due to the high energy value of the ballast, the sorting plant is integrated with an alternative fuel valorization section, thanks to which the ballast waste is mixed with pre-RDF and used for energy recovery.
The flow of waste streams in the installation in this study is presented in Figure 3.

2.2. Scope of the Research

The analysis was performed based on data contained in 120 waste dispersion reports of the Municipal Waste Management Plant in Olsztyn in the period from 1 January 2016, to December 31, 2020. The waste dispersion reports were used to analyze the mass flow of waste, including the amount of waste fractions sorted for material and energy recovery, and amount of ballast produced. The above balance allowed for the calculation of the process loss obtained during the biodrying stage.

2.3. Calculation Methods

To determine the process loss, a method for empirically determining the effectiveness of the biodrying process was developed. When analyzing the flow of the streams presented in Figure 3, the overall mass balance of the Mechanical-Biological Treatment line of the Municipal Waste Management Plant in Olsztyn can be described as follows:
InputStr = pre-RDF + MatRecMTS + MatRecVS + Ballast + ProcLoss + ExcStr,
where InputStr is the total mass of municipal waste brought to the plant; pre-RDF is the mass of alternative fuel produced; MatRecMTS is the mass of the commercial assortments for material recovery/recycling sorted in the mechanical section; MatRecVS, the mass of commercial assortments for material recovery/recycling sorted in the alternative fuel valorization section; Ballast, the mass of ballast obtained in the alternative fuel valorization section; ProcLoss, process loss (mainly H2O) during the biodrying stage; and ExcStr, the mass of excess waste collected by external commercial companies. All the above values are expressed in Mg.
From Formula (1), it is possible to calculate the total weight of the commercial assortments prepared for the recycling/recovery process:
MatRecTOT = MatRecMTS + MatRecVS
The mass of excess waste is understood as the mass of waste that could not be processed because it exceeded the processing capacity of the biodrying line. Hence, taking into account the recovery of some commercial assortments in the mechanical section, the mass of waste actually subjected to the biodrying process (BiodStr) is:
BiodStr = InputStr – MatRecMTS — ExcStr

3. Results

3.1. Mechanical-Biological Treatment Line

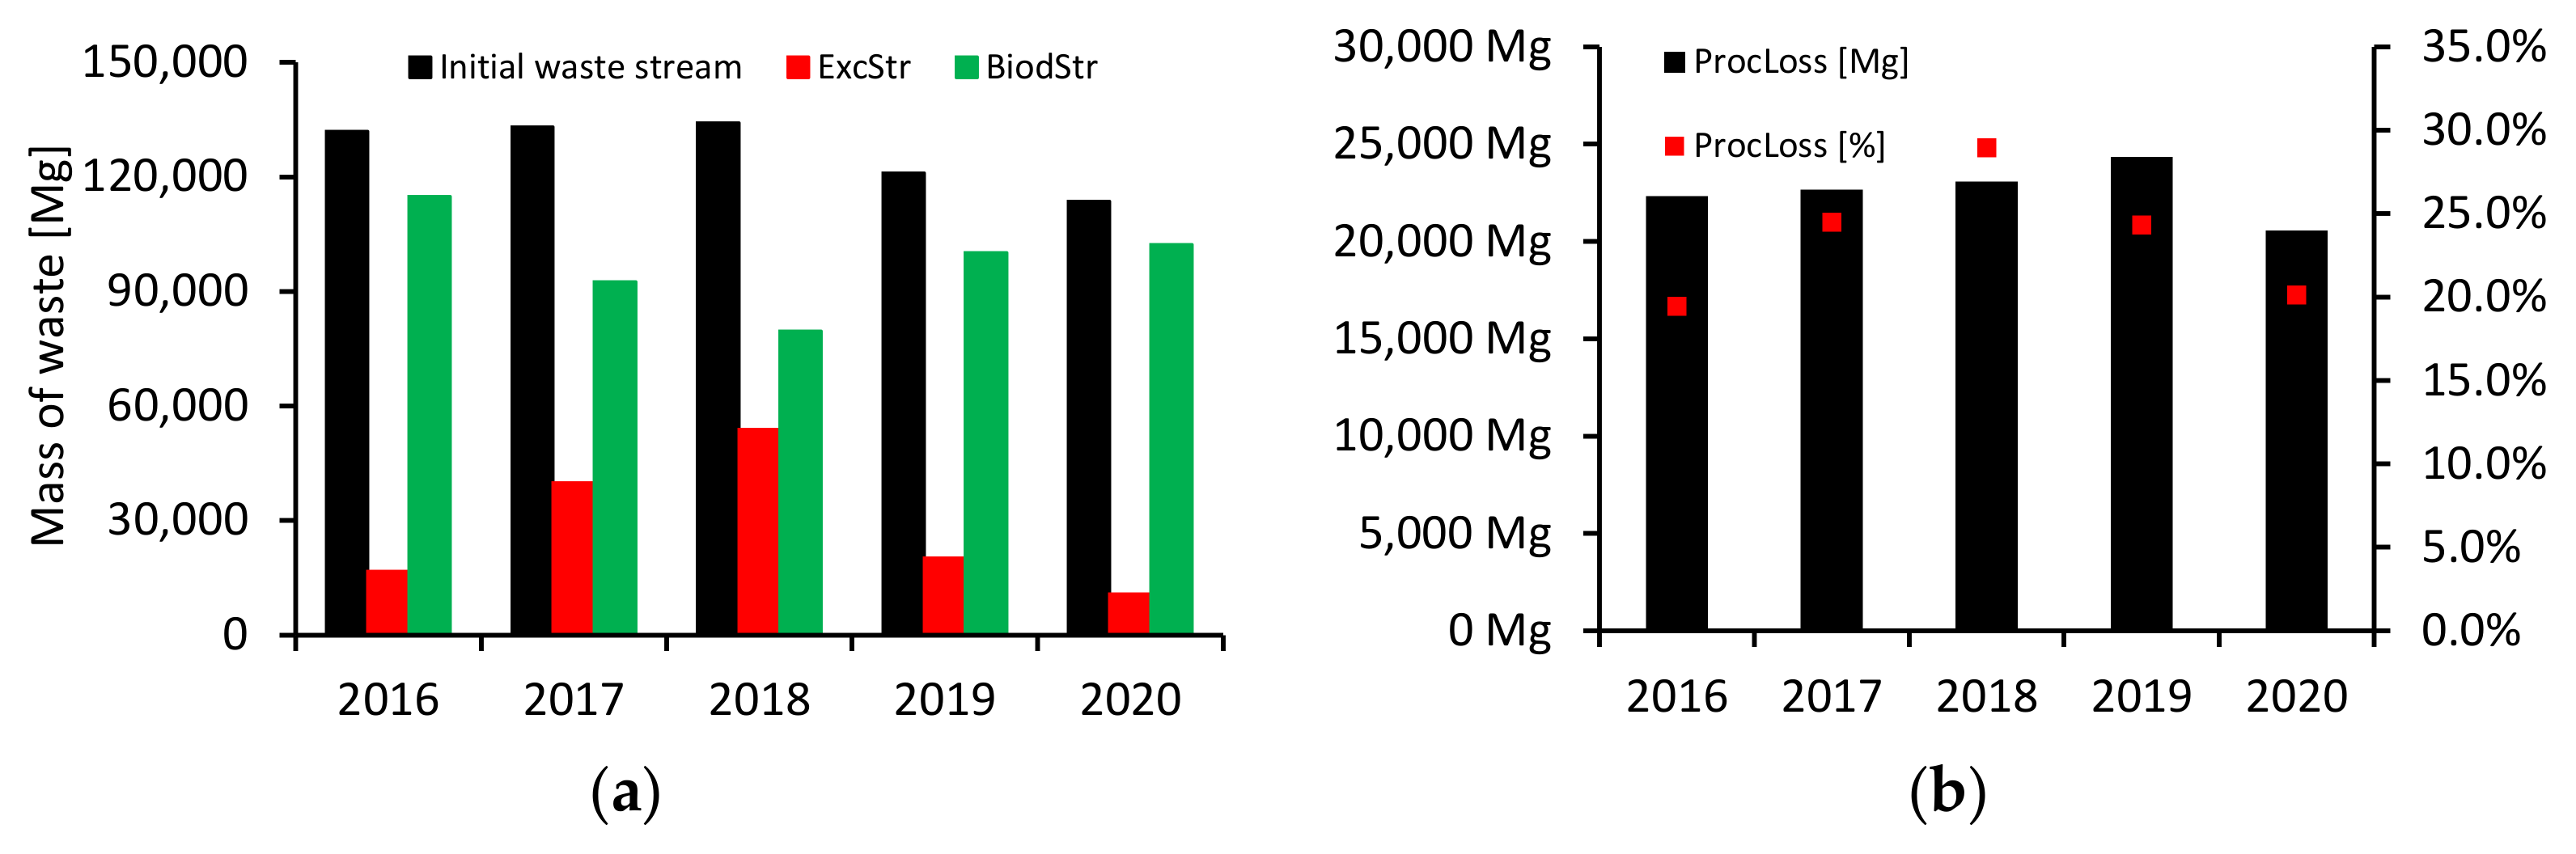
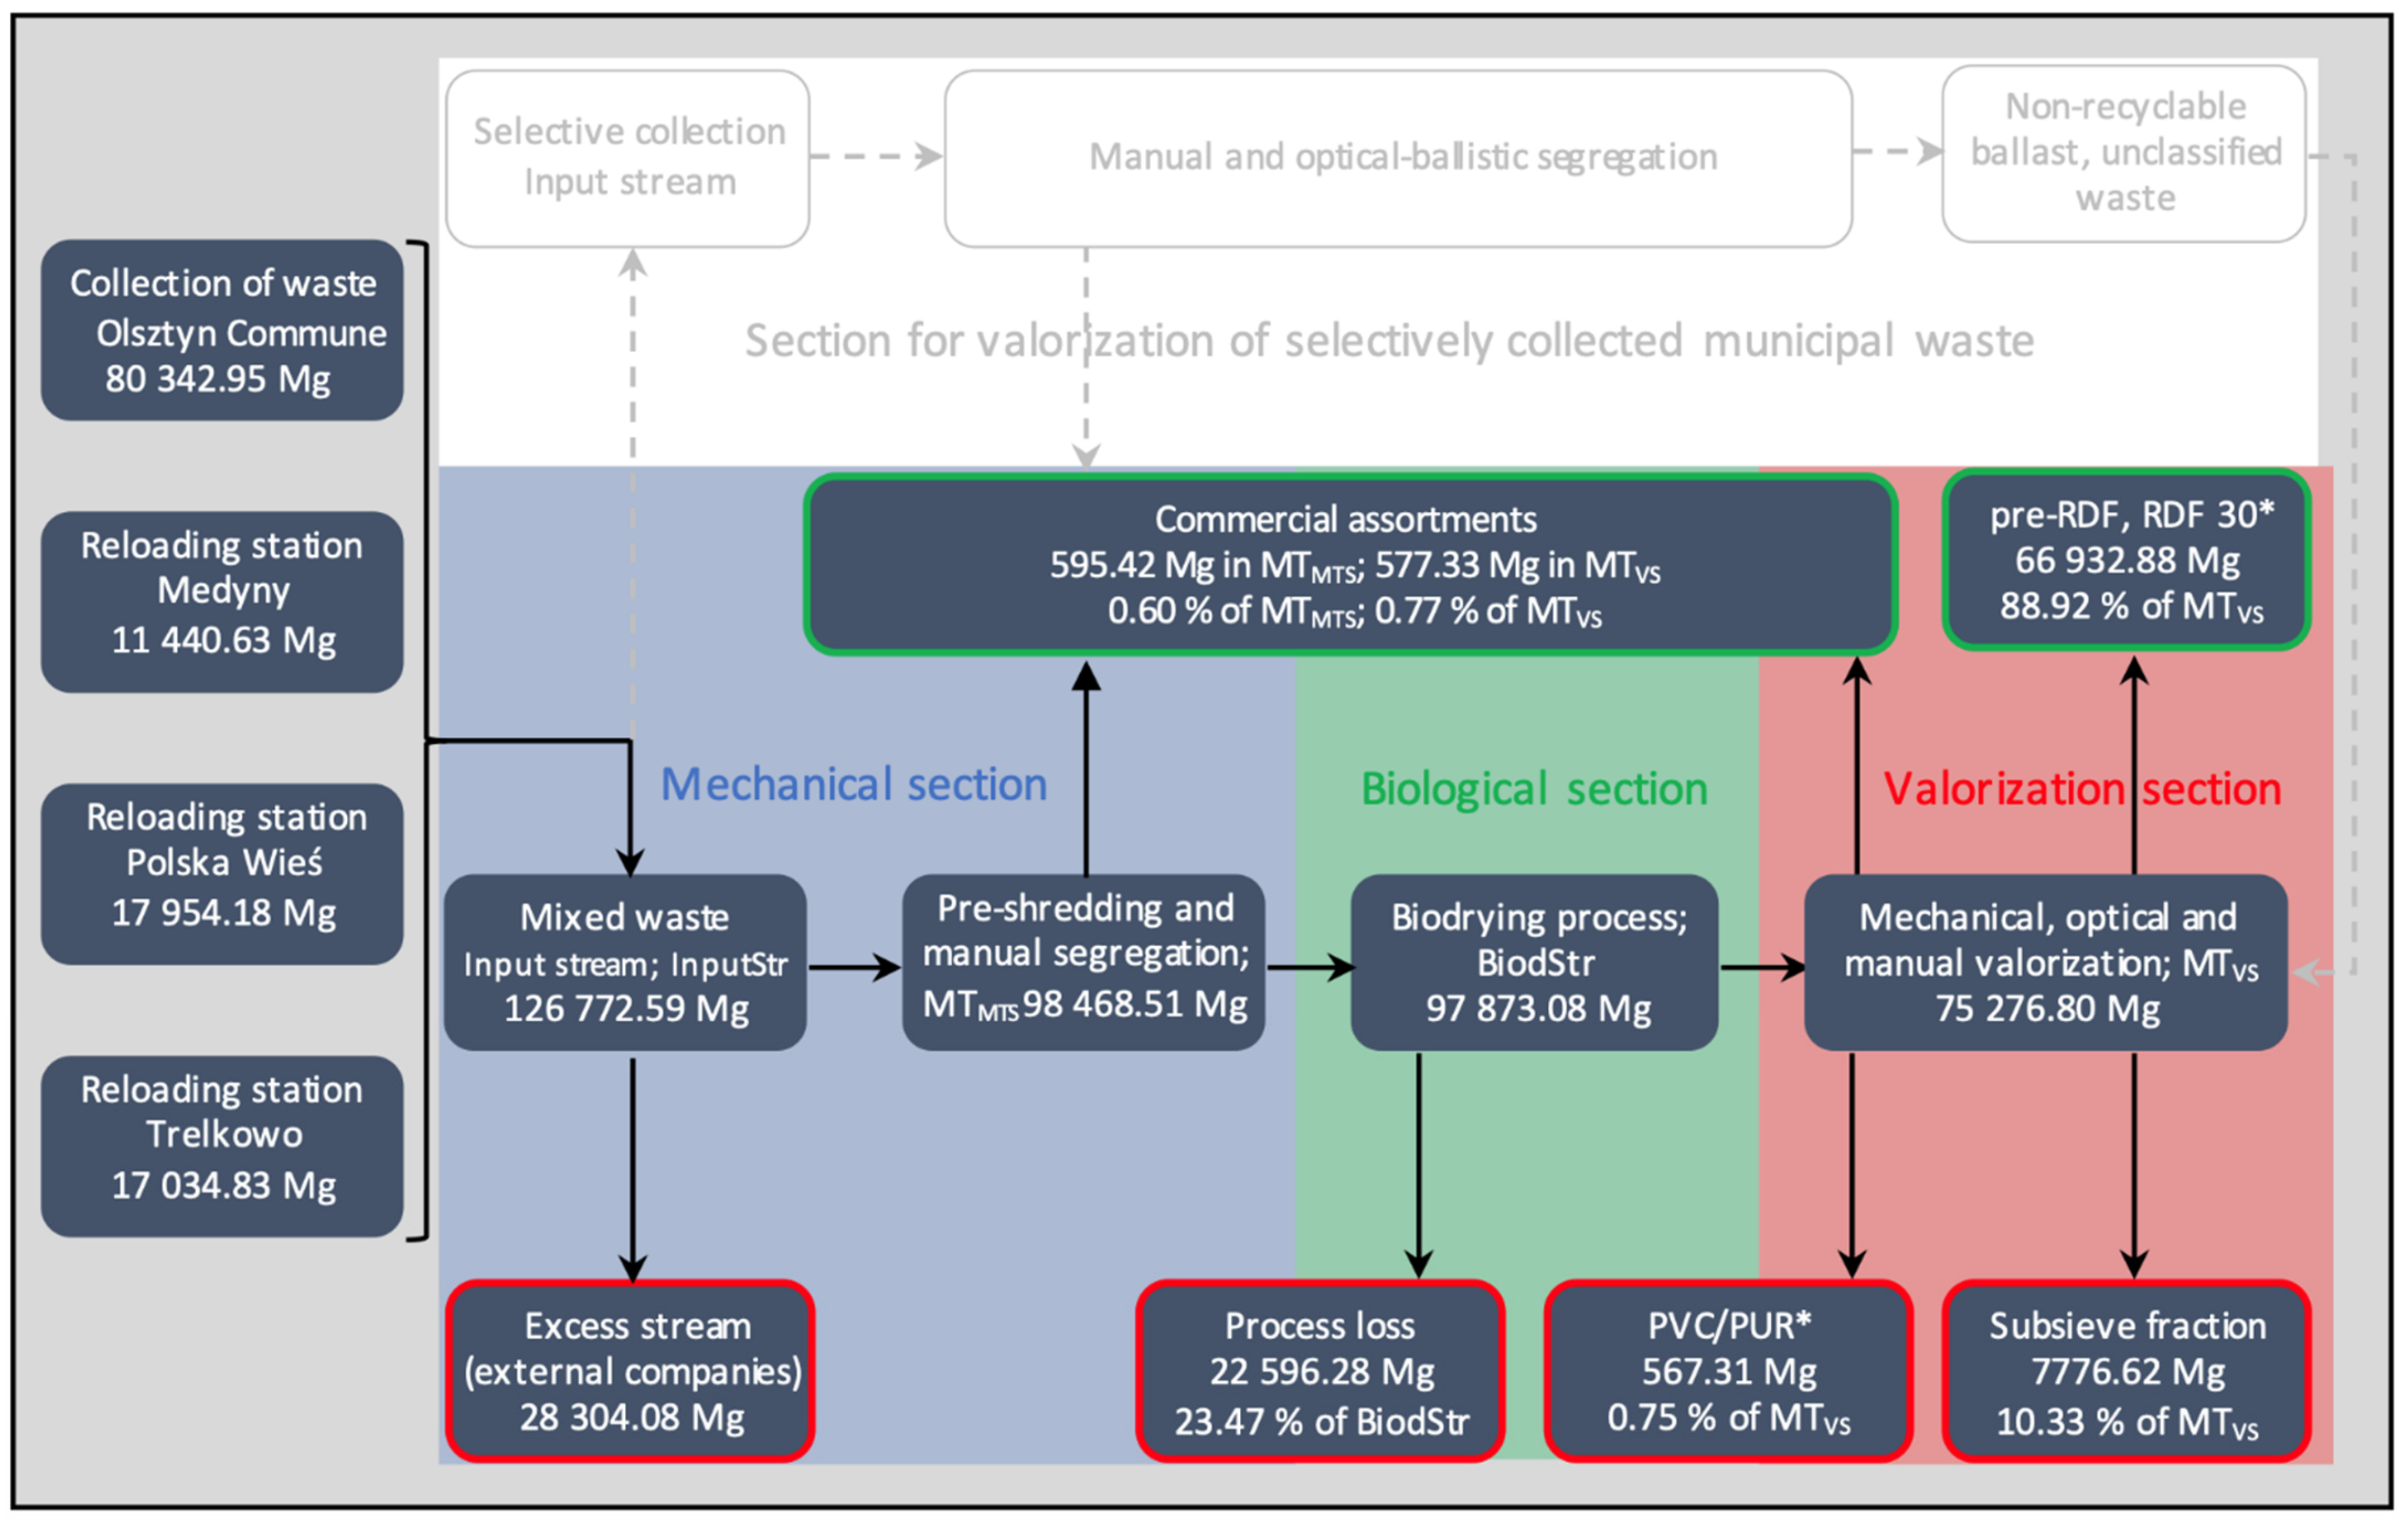
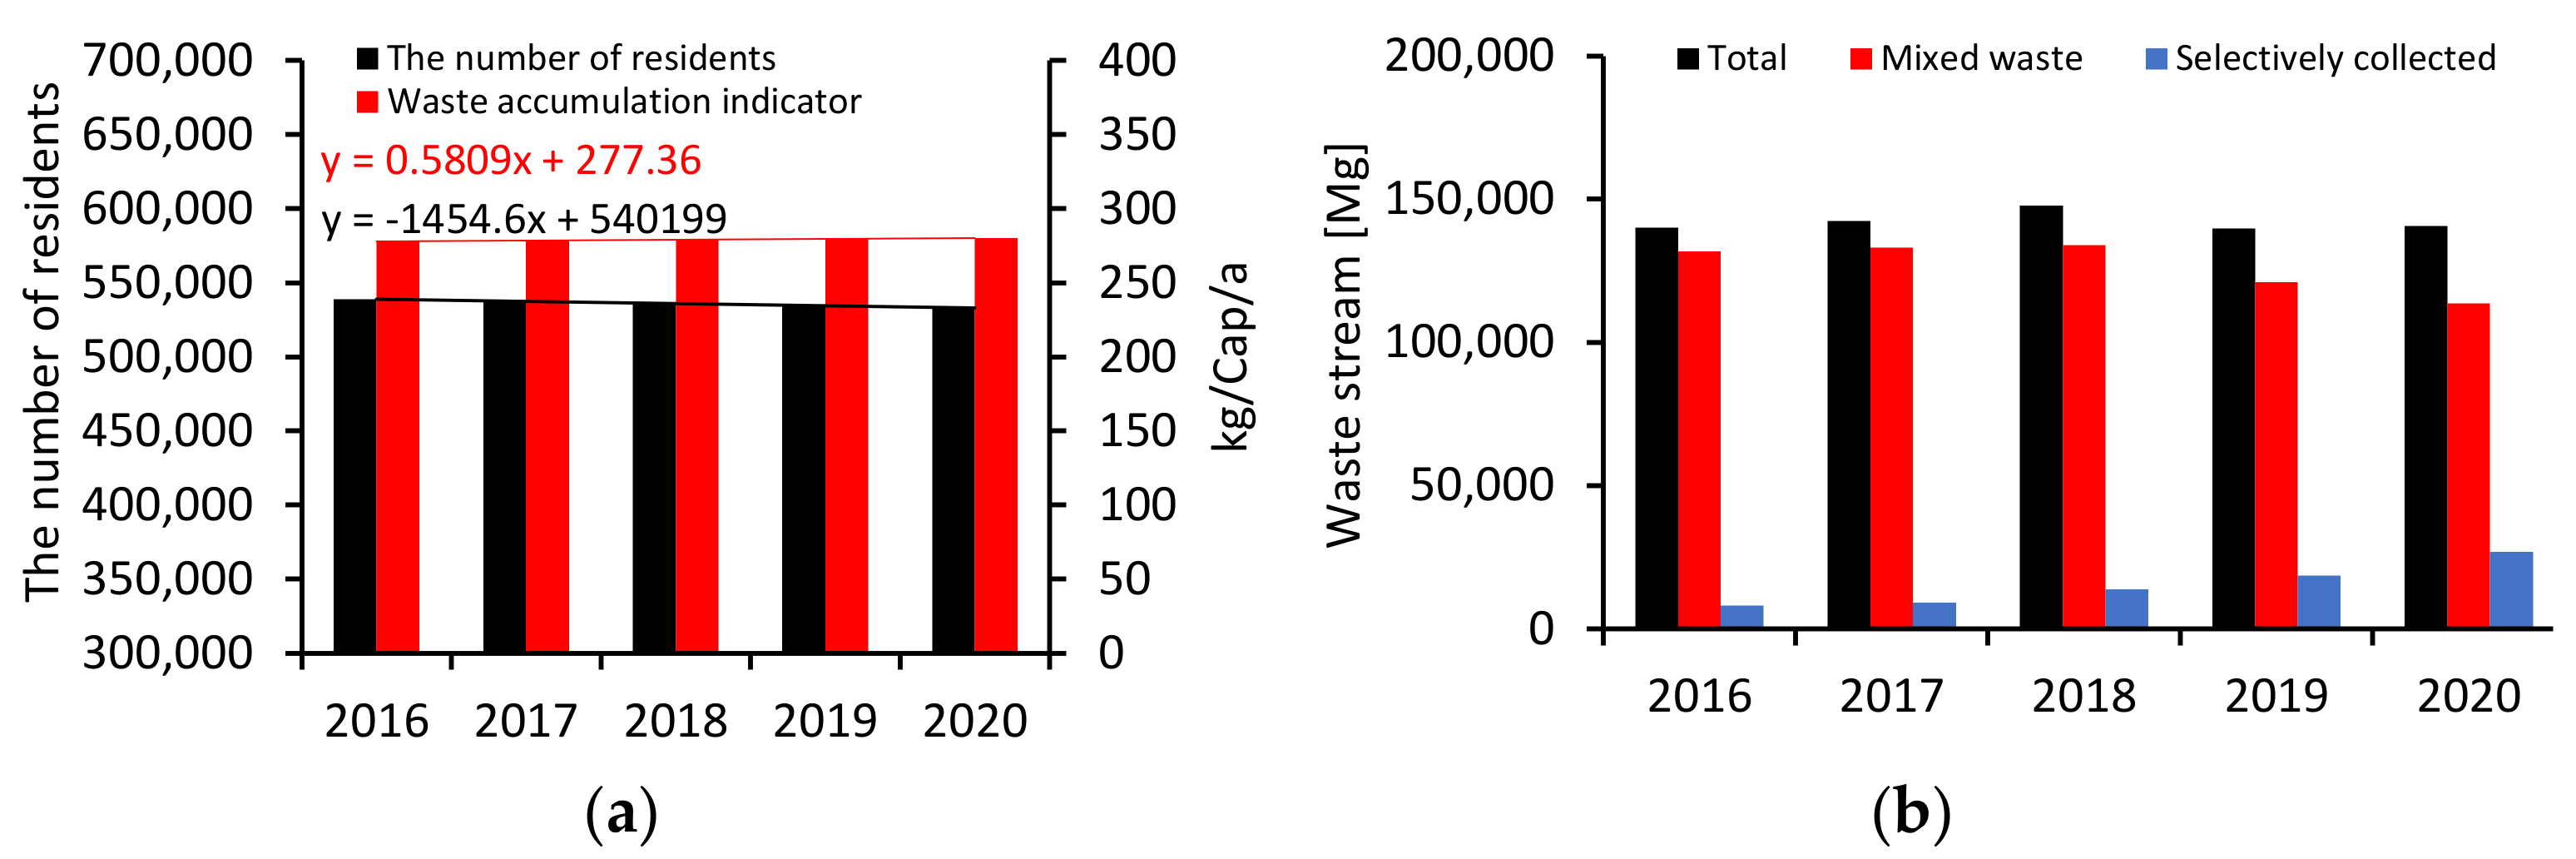
3.1.1. Primary Mass Flow of The Raw Waste Stream in The Municipal Waste Management Plant

The amount of mixed municipal waste generated in the region served was over 130,000 Mg in 2016–2018, 121,000 Mg in 2019 and 113,000 Mg in 2020; this amount exceeded the allowable processing capacity of the installation throughout the analyzed period. As a result, the excess stream had to be transferred to commercial companies for further management. The amount of waste disposed of by external companies was highest in 2018, approximately 53,956 Mg. As a result, the stream of waste directed to the biodrying process in 2018 amounted to 79,616 Mg. In the remaining years, it was at least 92,000 Mg/year (Figure 4a).
The process loss in the biological section remained constant until 2019, when it increased from 22,338 Mg to 24,345 Mg. In 2020, it decreased to 20,571 Mg, most likely caused by a decrease in the hydraulic efficiency of the biofilter. The percent efficiency was highest in 2018, 29%, and lowest in 2016, around 20%. The relatively weak correlation between the process loss expressed in Mg and the process loss expressed as a percentage (0.569) may be particularly important in the analysis of the effectiveness of the biodrying process (Figure 4b). The weight of PVC ballast obtained during the valorization of the waste stream after biodrying was relatively constant, averaging 0.75% per year.

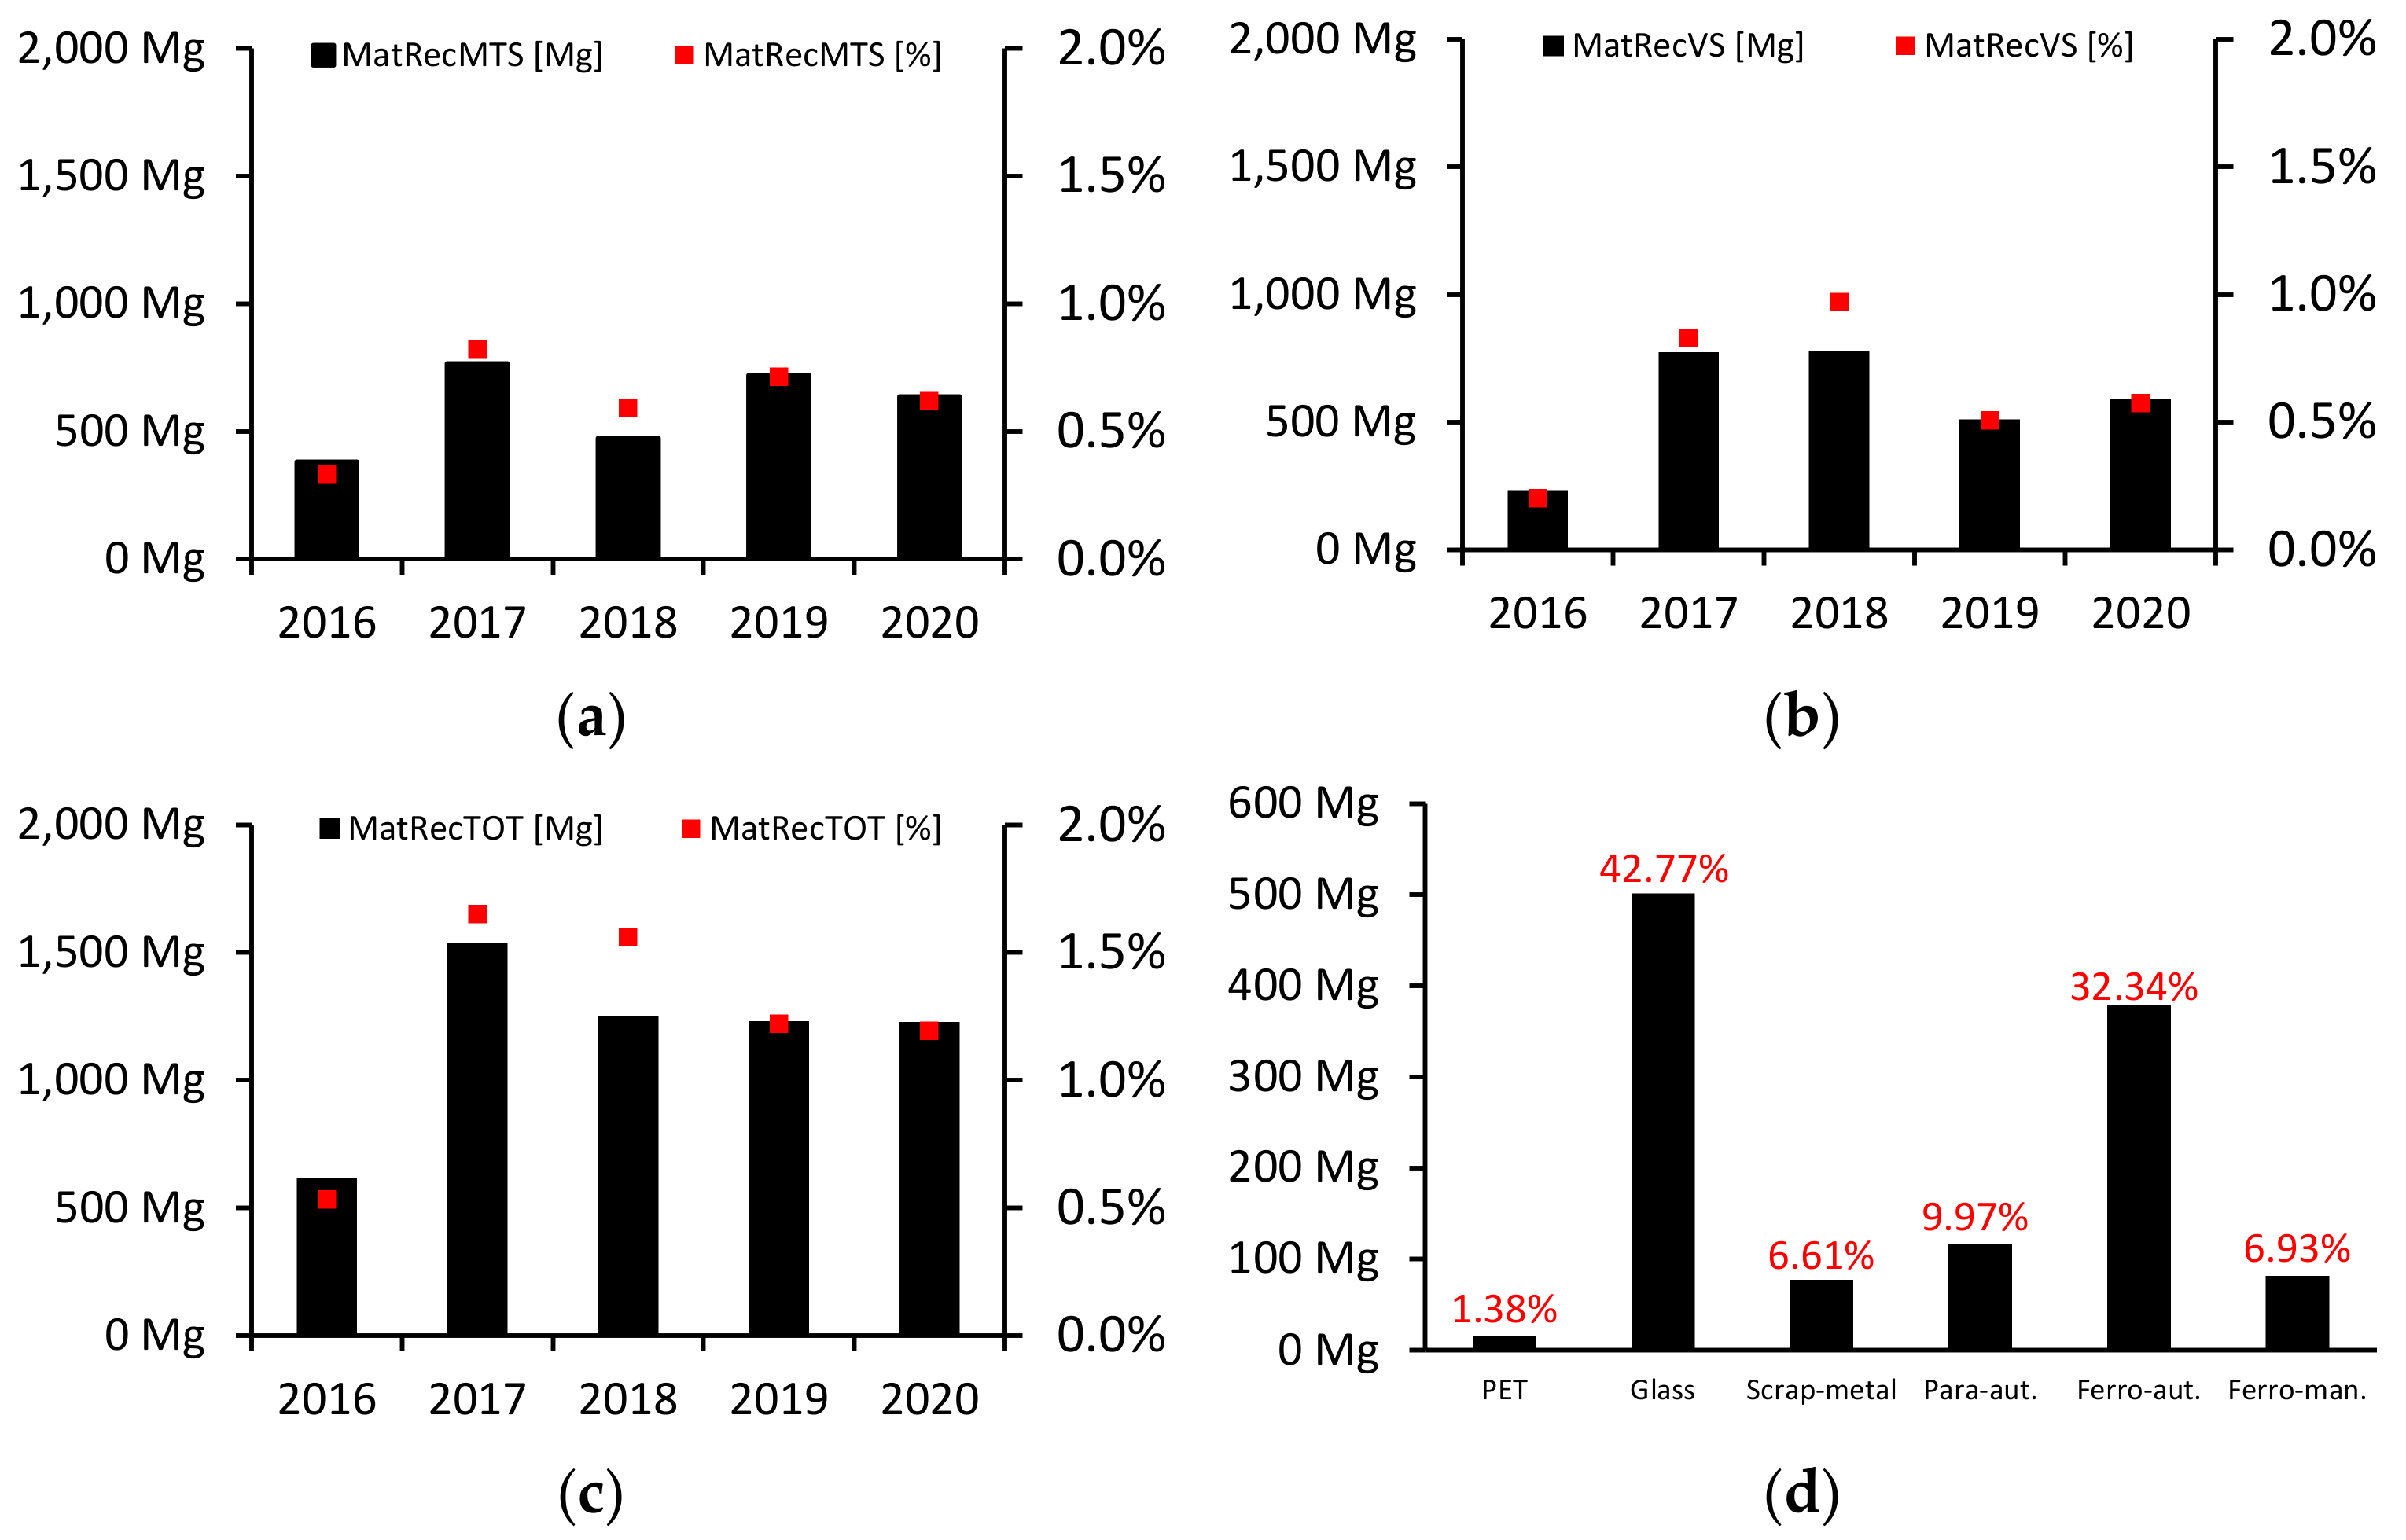
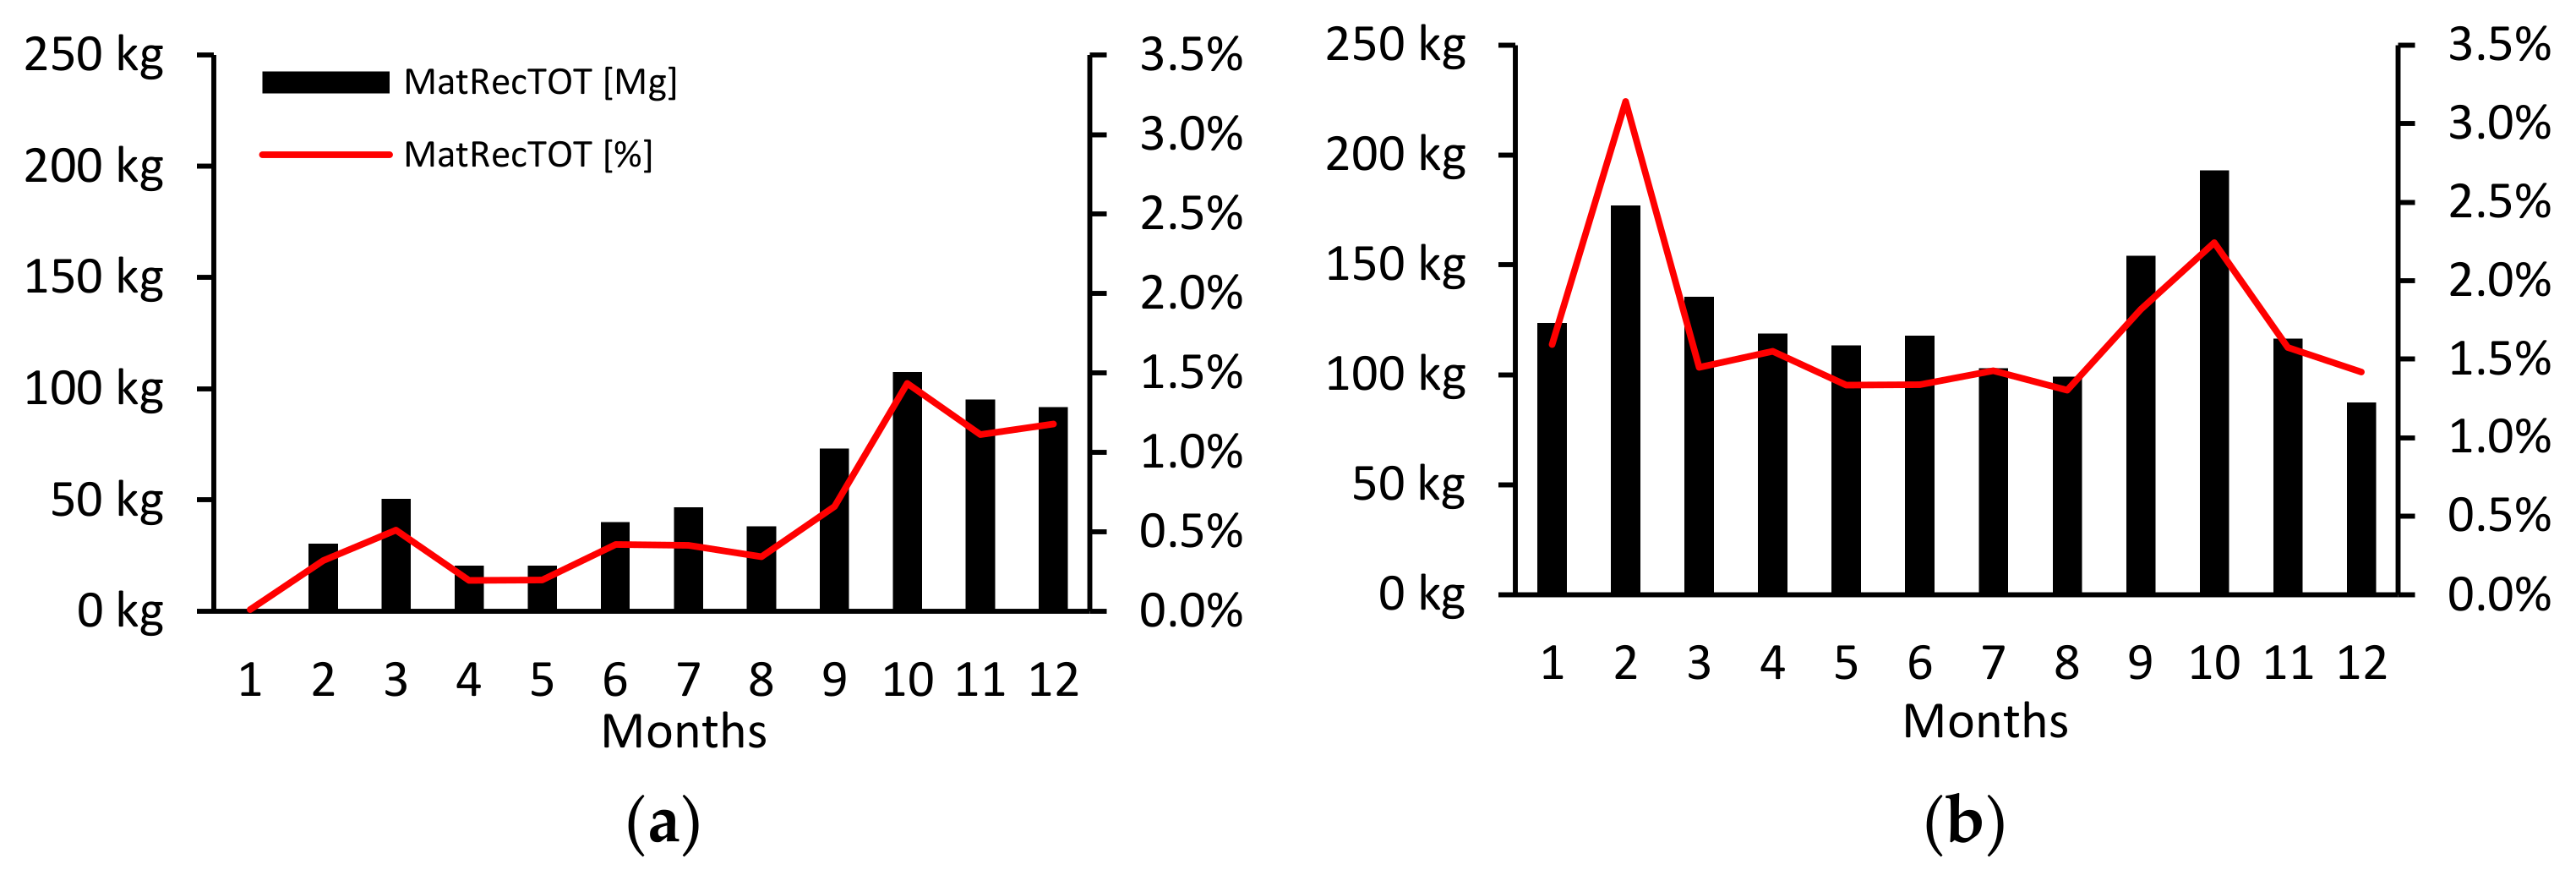
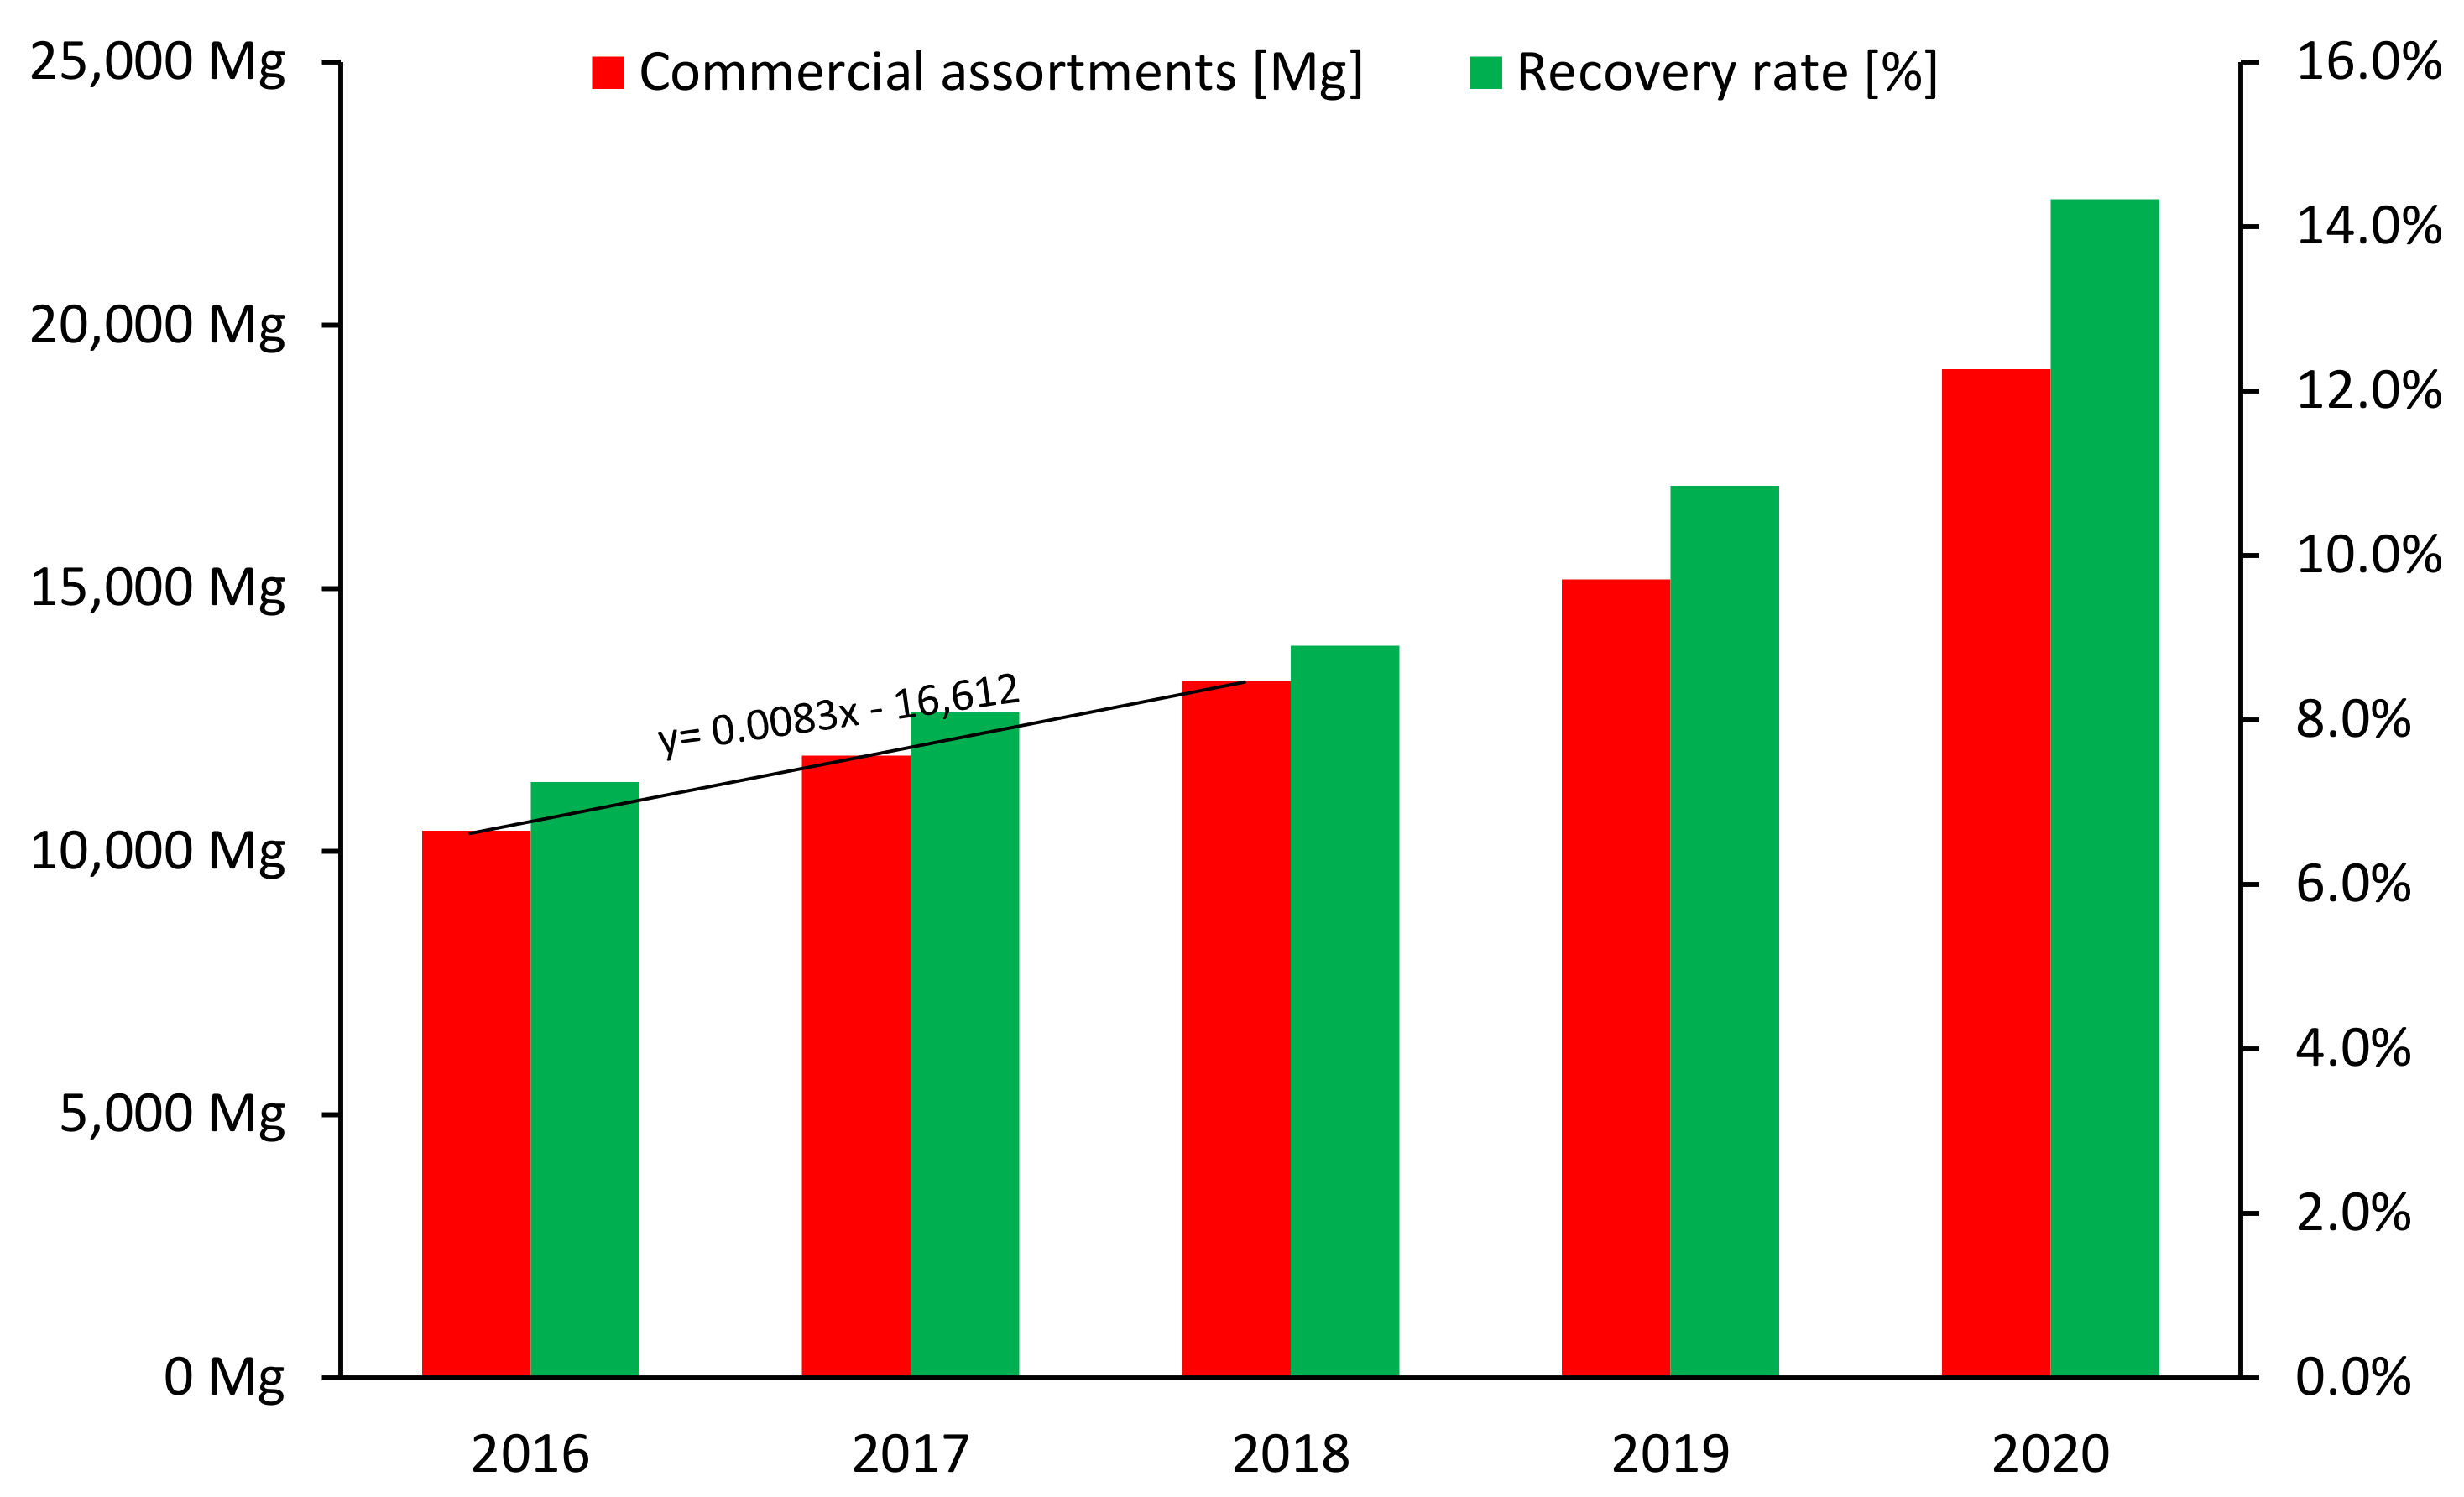
3.1.2. Recovery of Commercial Assortments during the Mechanical-Biological Treatment of Municipal Solid Waste

The selection of commercial assortments for recovery took place in two places on the Mechanical-Biological Treatment line: in the mechanical section and in the valorization section. In the pre-sorting cabin in the mechanical section, manual selection was made directly from the mixed waste, from which PET, glass and scrap metals were separated. In the valorization section, assortments were selected from the pre-RDF stream both automatically, by paramagnetic (Para-aut.) and ferromagnetic (Ferro-aut.) separators, and manually, in the secondary segregation cabin section (Ferro-man.).
In the analyzed period, the total mass of commercial assortments separated in the mechanical section (MatRecMTS) ranged from 381.60 kg to 765.33 kg per year, constituting 0.33–0.71% of the [InputStr—ExcStr] stream, respectively. For comparison, the weight of commercial assortments separated during the valorization of pre-RDF fuel (MatRecVS) ranged from 233.13 kg per year to 777 kg per year, constituting 0.20–0.97% of the [InputStr—ExcStr] stream, respectively. In both cases, the highest values were obtained in 2017, when the total mass of commercial assortments prepared for the recovery process (MatRecTOT) was 1539.28 Mg, i.e., 1.65% of the [InputStr—ExcStr] stream (Figure 5a–c).
The average morphological composition of MatRecTOT over the years 2016–2020 is presented in Figure 5d. On average, the total mass of commercial assortments consisted mostly of glass (42.77% of MatRecTOT) and ferromagnetic metals (32.34% of MatRecTOT).
Figure 6 shows the change in MatRecTOT (quantity of commercial assortments recovered from the mixed waste stream) in 2016–2020. Figure 6a6–e show the total monthly levels of commercial assortment recovery in particular years, Figure 6f represents the average monthly values of these levels in a five-year term (i.e., over the entire period under examination). When analyzing the levels of recovery on an annual basis, the lowest values of recovery of commercial assortments were recorded in the first 9 months of 2016, in which the weight of assortments amounted to 20–70 kg per month. The highest recovery values were recorded in 2017, when the average monthly level of recovery of commercial assortments amounted to 128 kg. For comparison, the average monthly level of recovery in the following years ranged from 102 to 104 kg. Considering the five-year recovery level (Figure 6f), the recovery of commercial assortments was the lowest in May (72.6 kg on average). A high correlation was observed between the mass of recovered commercial assortments in tonnes (MatRecTOT [Mg]) and the level of recovery expressed as a percentage (MatRecTOT [%]). The correlation coefficient in 2016–2019 amounted to 0.98, 0.81, 0.89 and 0.92, respectively. In 2020, the correlation coefficient was lower and amounted to 0.58. The highest levels of recovery of commercial assortments were achieved in the periods of February–April and September–November.

3.1.3. Mass balance of the Mechanical-Biological Treatment Line

The mass balance of the Mechanical-Biological Treatment line presented in Figure 7 shows the average values for 2016–2020, calculated at each stage of the technological chain. The average mass of waste collected in the analyzed period was 126,772.59 Mg, of which approximately 63% was collected in the Olsztyn commune, and 37% in the remaining 36 communes. Due to the limited processing capacity, 28,304.08 Mg of waste required external management. This resulted in mechanical-biological processing of 98,468.51 Mg in average (with a nominal processing capacity of the line of 95,000 Mg/year). In the analyzed period, the average process loss was 23.47% of the BiodStr stream. On average, 88.9% of waste produced by biodrying consisted of pre-RDF fraction. In total, out of 98,468.51 Mg of municipal waste, 1172.75 Mg of commercial assortment was segregated and sent for recycling. Ultimately, the average weight of pre-RDF fuel obtained during valorization of the waste stream after biodrying was 66,932.88 Mg.

3.2. Selectively Collected Waste Valorization Line

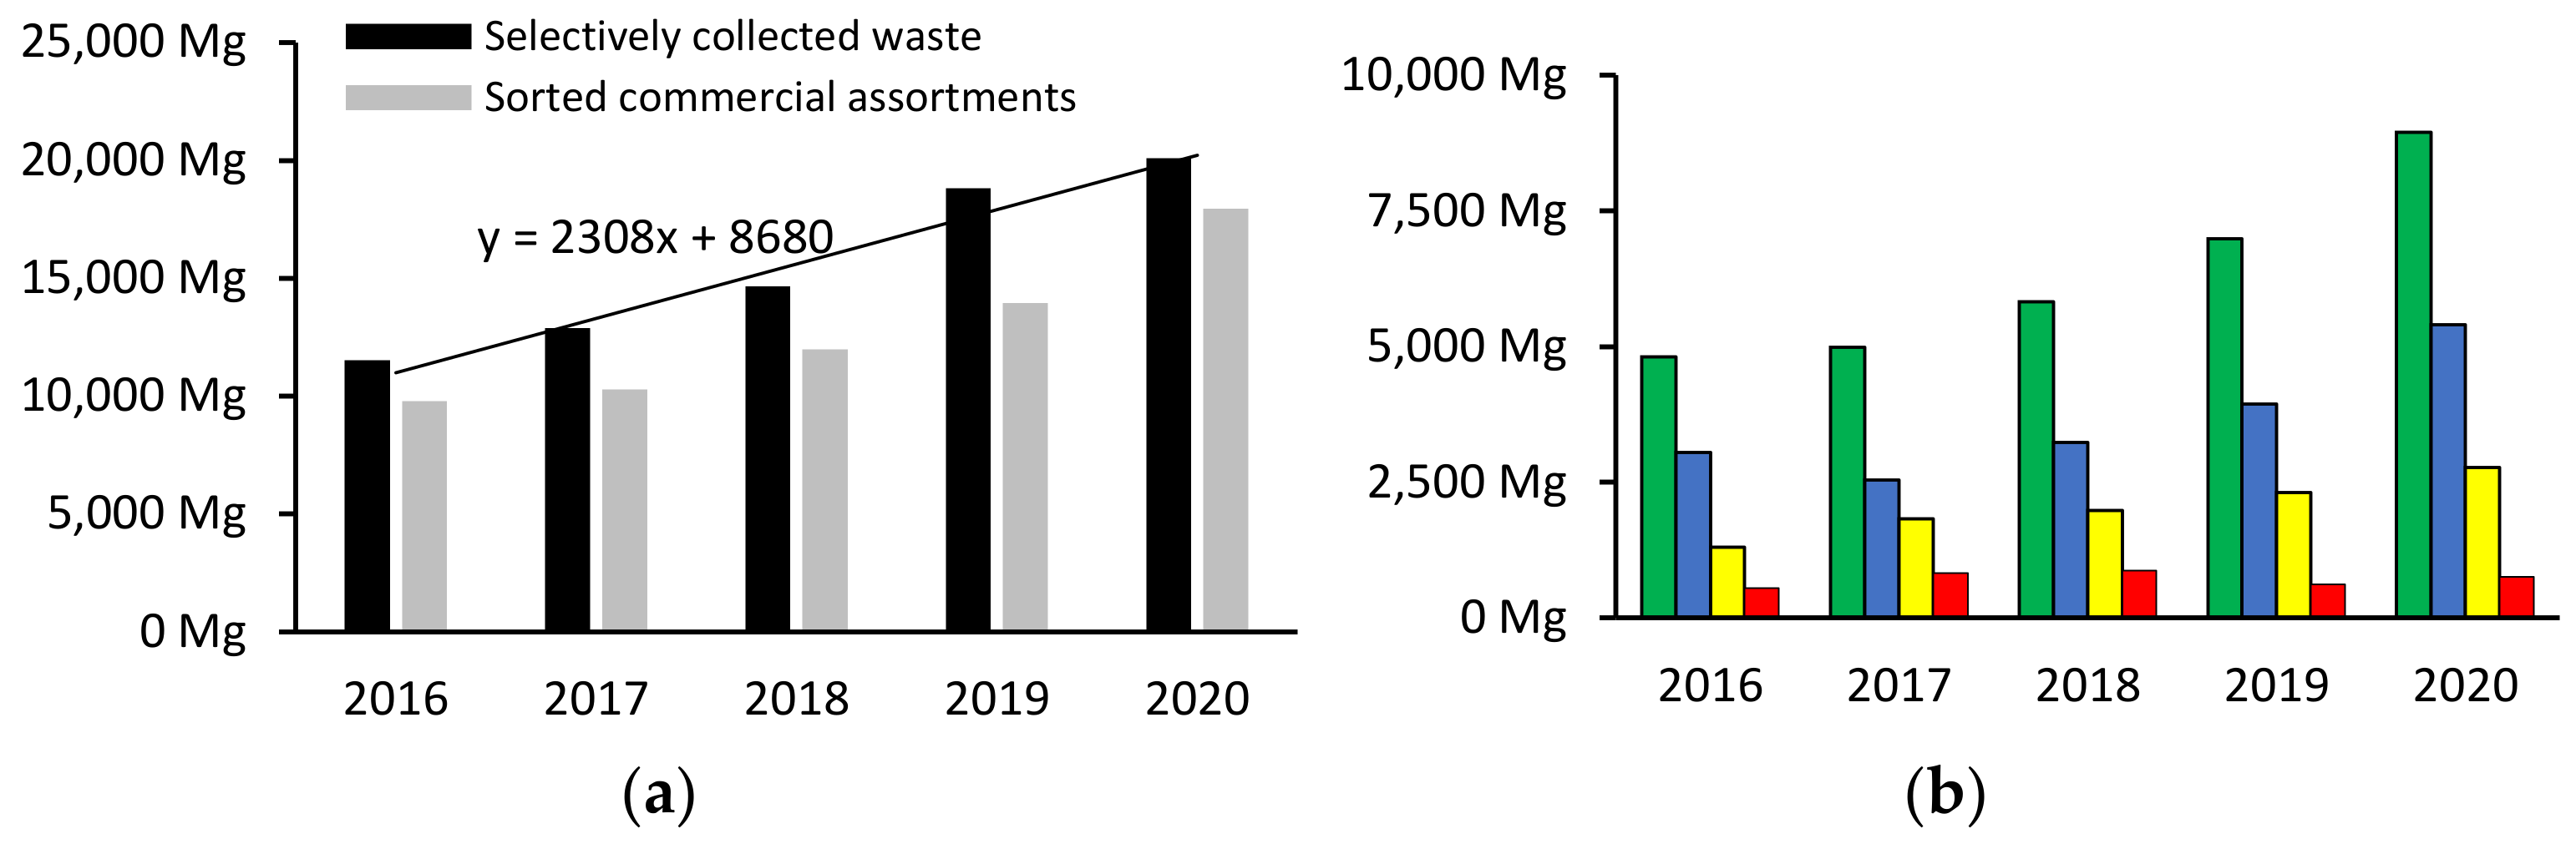
3.2.1. Characteristics of the Generated Stream of Selectively Collected Waste

In the analyzed period of 2016–2020, the section for valorization of selectively collected municipal waste accepted an amount of waste exceeding its design capacity. In 2016, the amount of the selectively collected stream (paper, glass, plastics and metals) was 11,530 Mg. Since 2016, the average annual increase of the selectively collected waste stream was 2308 Mg. In 2020, the amount of selectively collected waste in the analyzed region was 20,100 Mg. A separate issue is the quality of selective collection, understood as the share of recyclable packaging (commercial assortments) in the selectively collected waste. In 2016, the share of commercial assortments in the stream averaged 84.82%; in 2018, it was 81.73%; and in 2021, only 74.04%. In 2020, this ratio increased to 89.26% due to the large increase in the glass and paper streams, which have a high degree of recovery (99% for glass and approx. 85% for paper). The changes described above are presented in detail in Figure 8a. The degree of recovery of individual commercial assortments is presented in the next subsection.
During the analyzed period, the amount of glass in the separately collected waste stream increased the most (4140 Mg), followed by paper (2350 Mg) and plastics (1470 Mg). However, when thinking about the volume of waste, it should be remembered that the bulk density of selectively collected plastic waste is low (about 100 kg/m3). The mass of selectively collected metal waste did not change much in comparison to the other materials (Figure 8b).

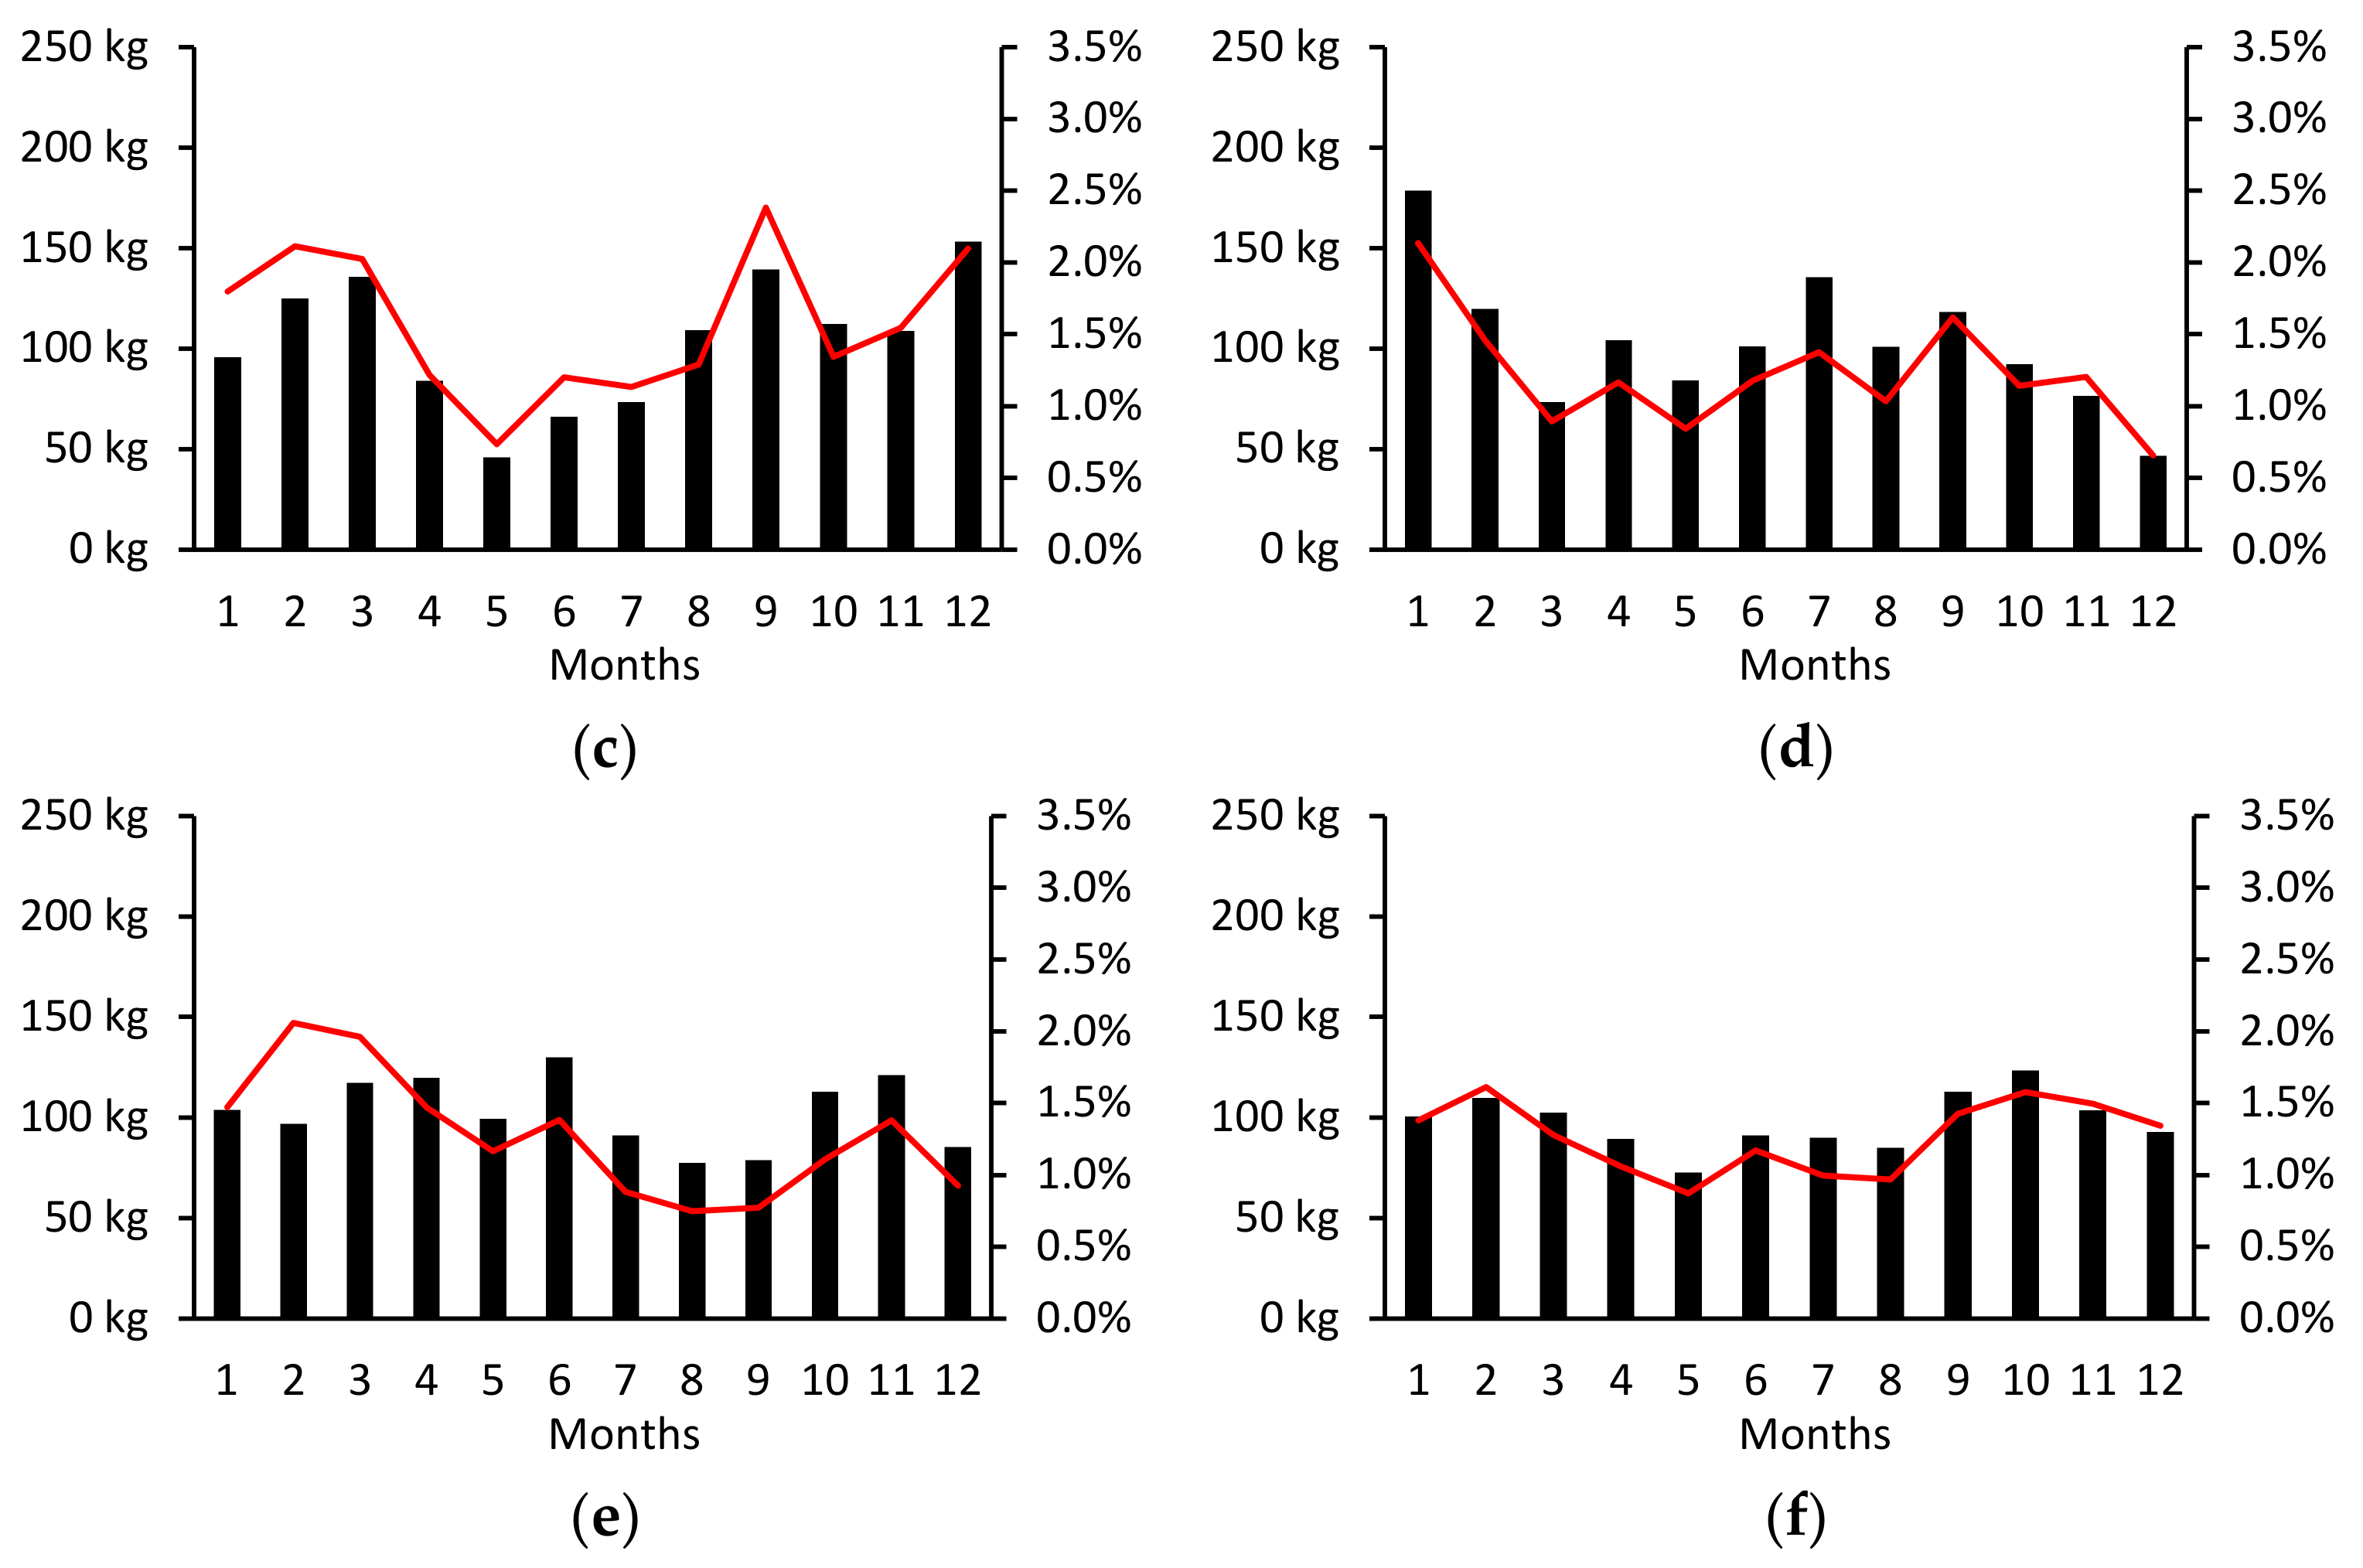
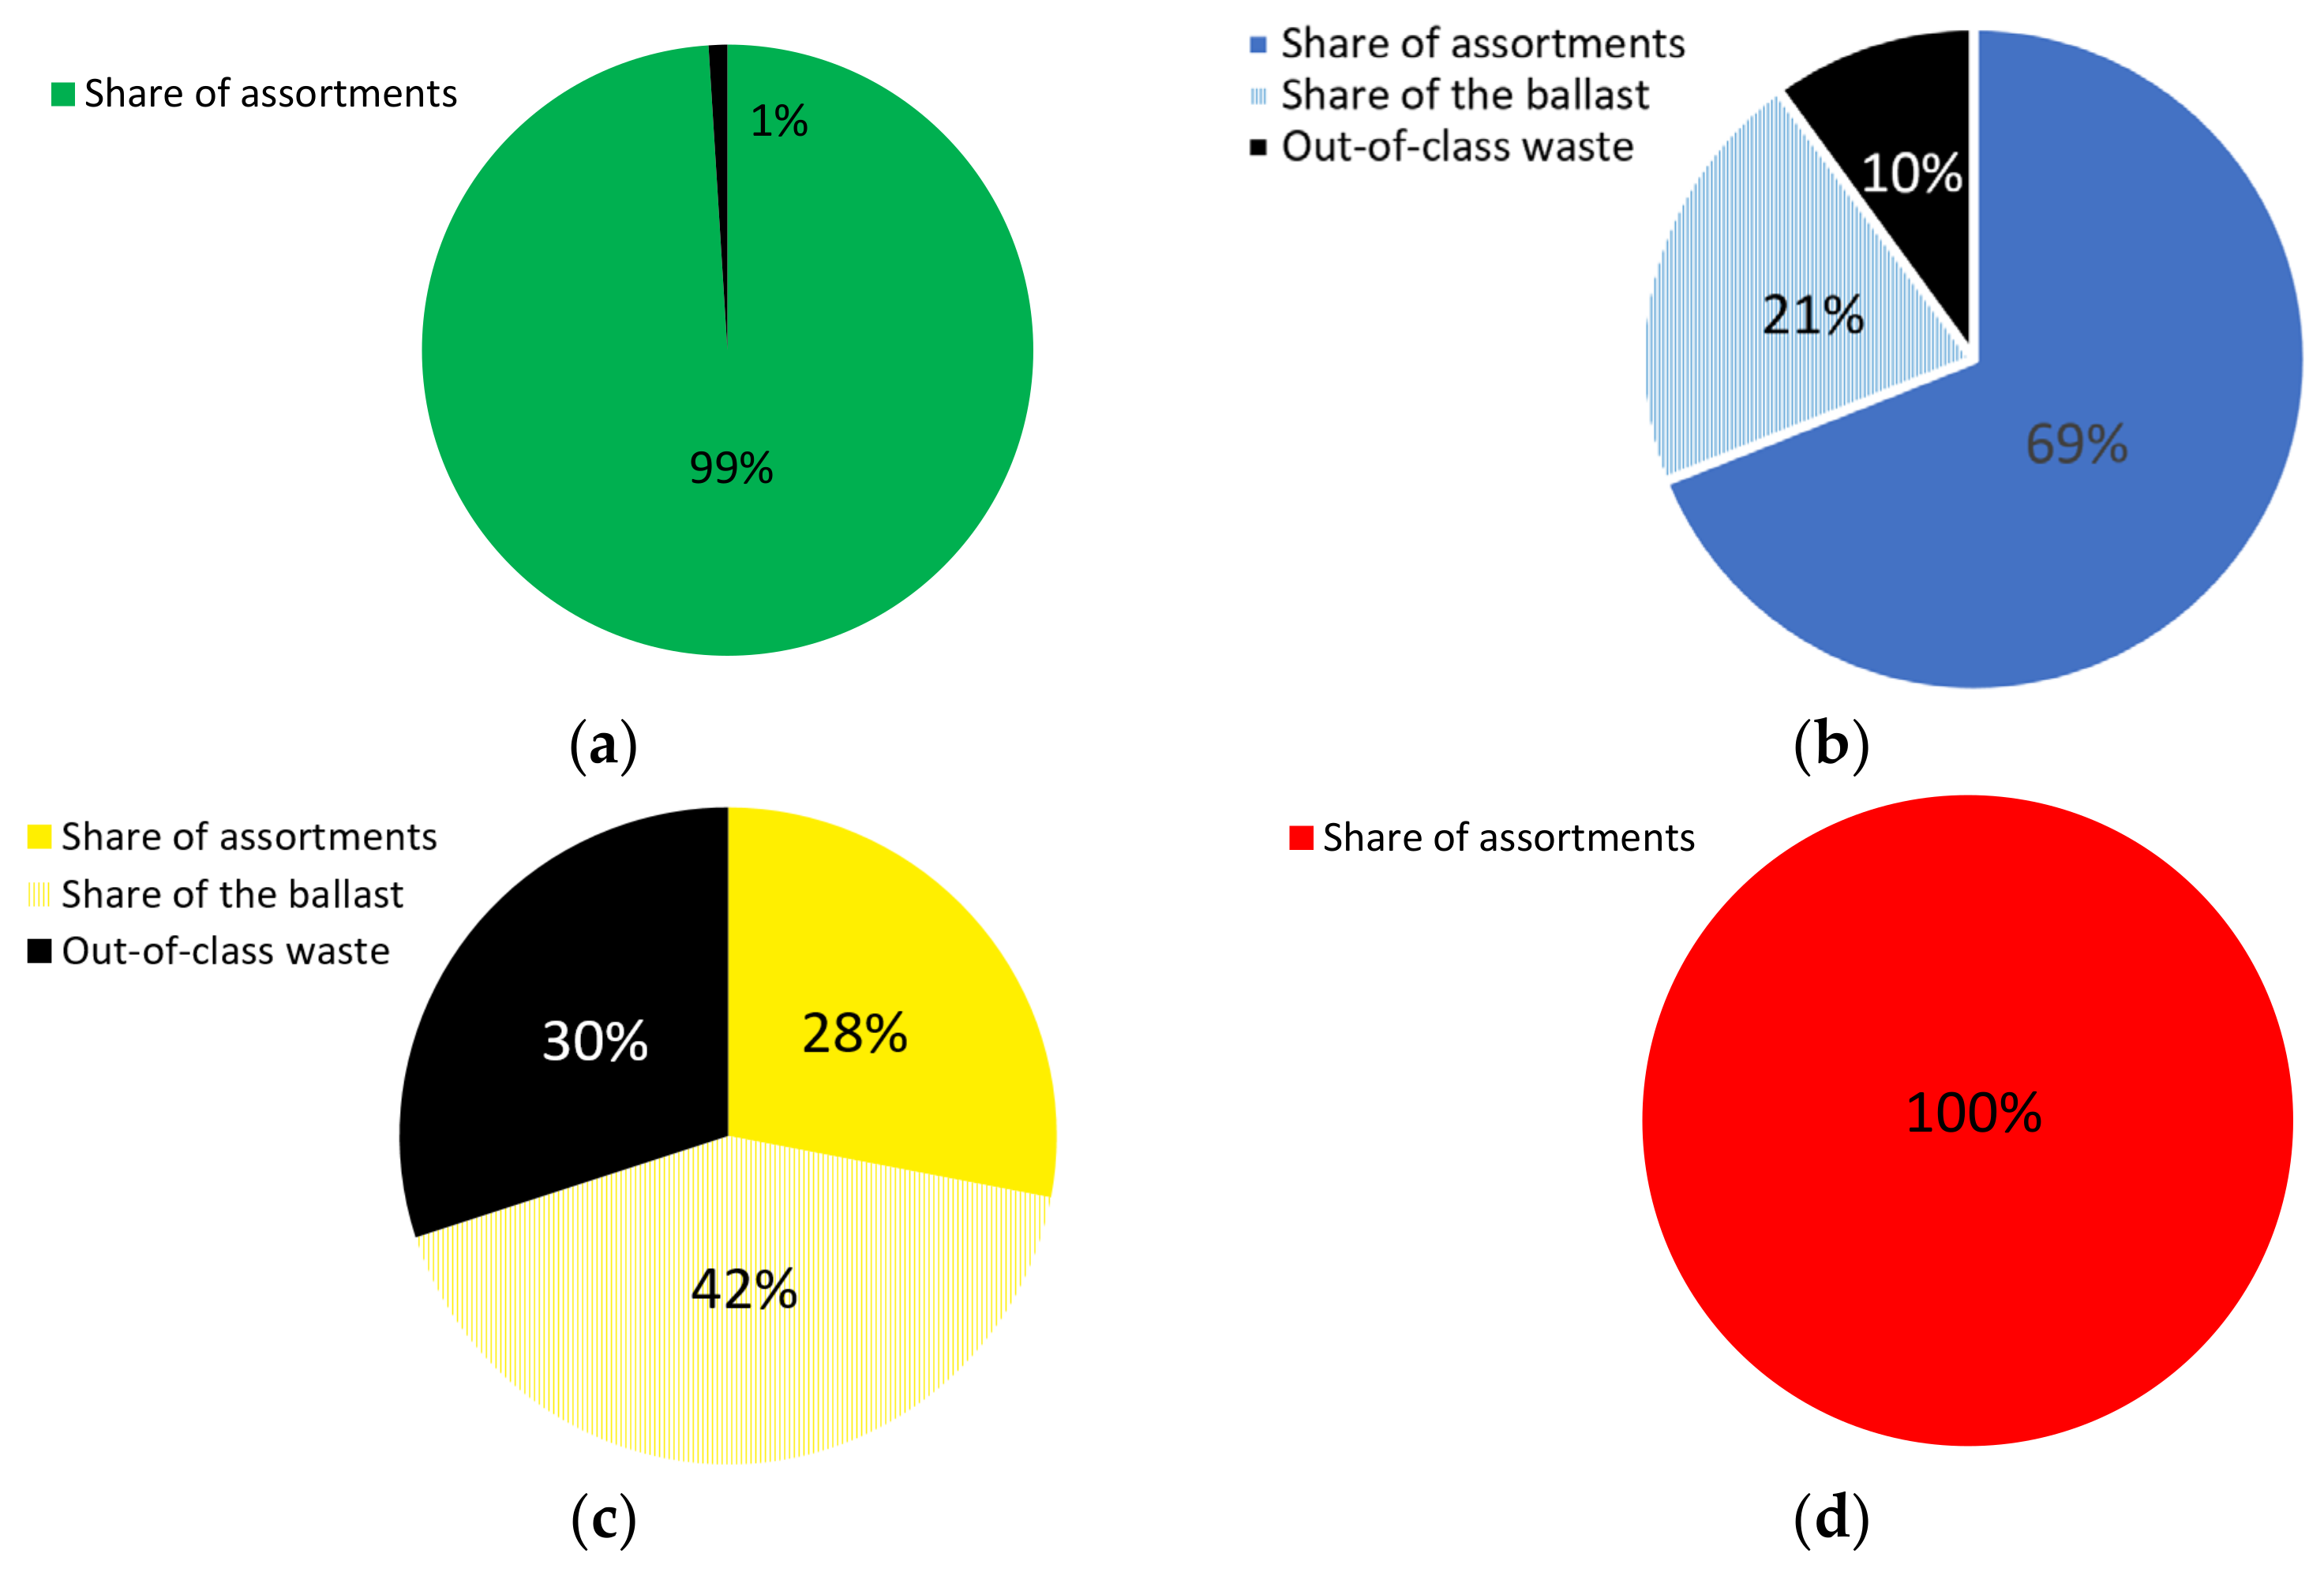
3.2.2. Recovery of Individual Commercial Assortments from Selectively Collected Waste

The stream of selectively collected waste can be divided into:
-
A stream of correctly segregated waste (commercial assortments);
-
A waste stream that is correctly segregated, but not suitable for recycling (ballast);
-
A waste stream that is incorrectly segregated (out-of-class waste stream).
The stream of correctly segregated waste, or commercial assortments, is in most cases the predominant stream in terms of mass. After the process of mechanical processing, ballast no longer contains commercial assortments and, after valorization, becomes a high-calorific component of the fuel. It should be noted, however, that it is possible to recycle ballast, but this depends mainly on the technological capabilities of the local recycling companies. Therefore, a gradual increase in the management of this stream is possible. The share of the out-of-class waste stream is not constant, and it is largest in the stream of plastics (about 30% of the stream) and paper (about 10% of the stream) (Figure 9).

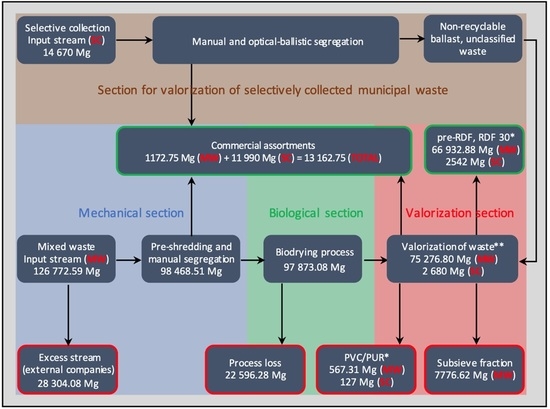
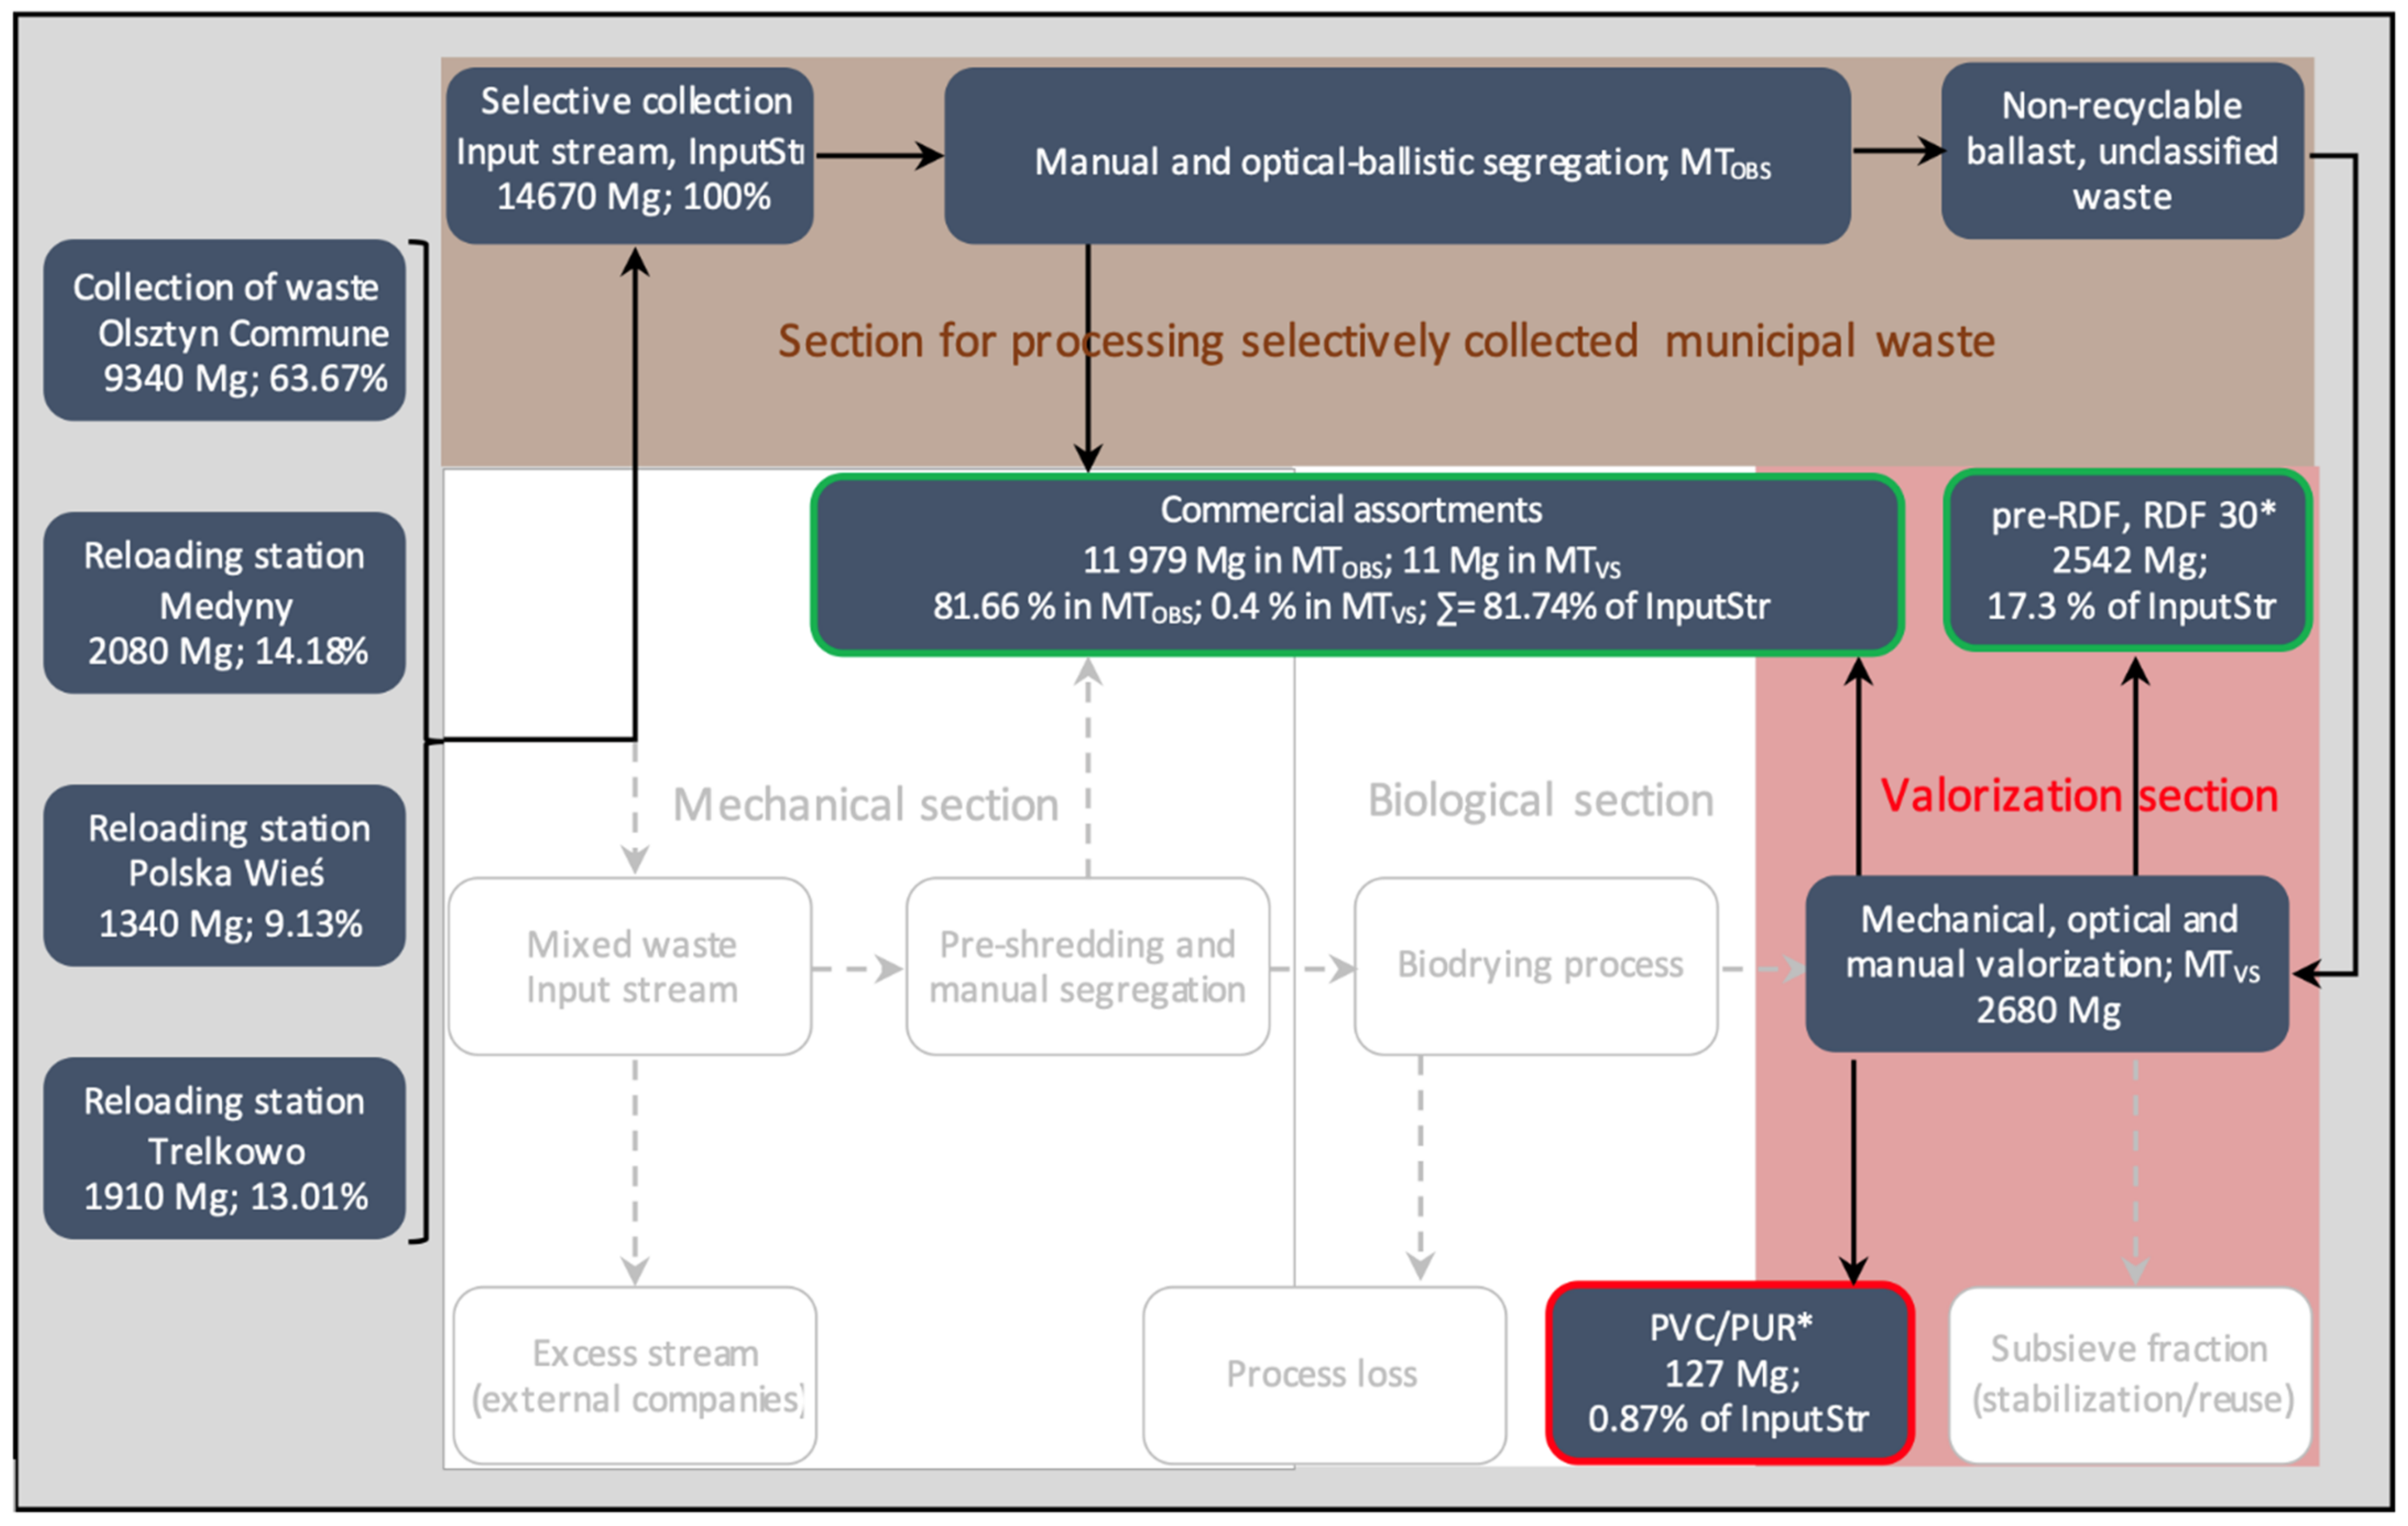
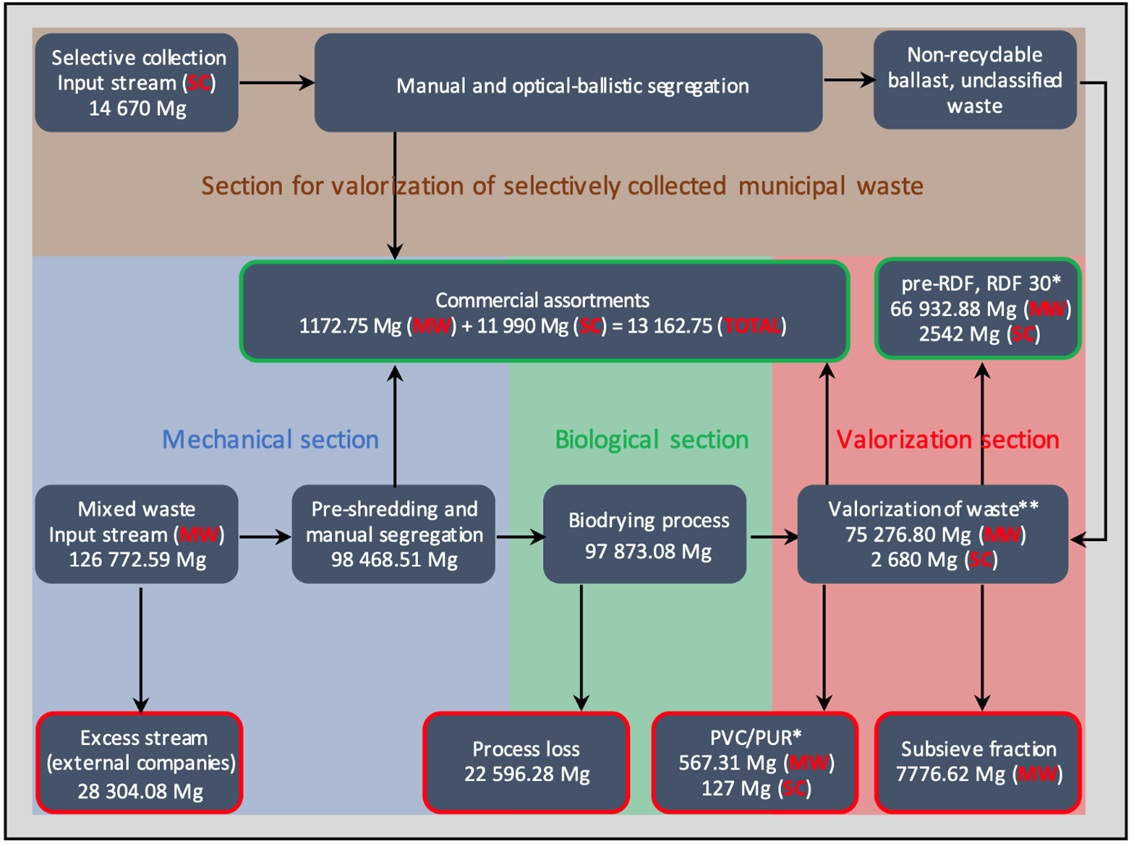
3.2.3. Mass Balance of the Selectively Collected Waste Valorization Line

The average mass of selectively collected waste during 2016–2020 was 14,670 Mg, of which about 63% was collected in the Olsztyn commune, and 37% in the remaining 36 communes, similarly to what was observed with the mixed waste. As presented in Section 3.2.1, most of the selectively collected waste was a commercial recyclable assortment (81.74% by weight of InputStr). The main source of the products was the manual and optical-ballistic part of the line, labelled in Figure 10 as MTOBS. The MTVS valorization line received additional assortments amounting to 0.4% of InputSTr. Ballast waste and out-of-class waste accounted for 2542 Mg. It should be noted that, apart from PVC/PUR waste, the entire stream of selectively collected waste was managed by recycling or energy recovery.

4. Discussion

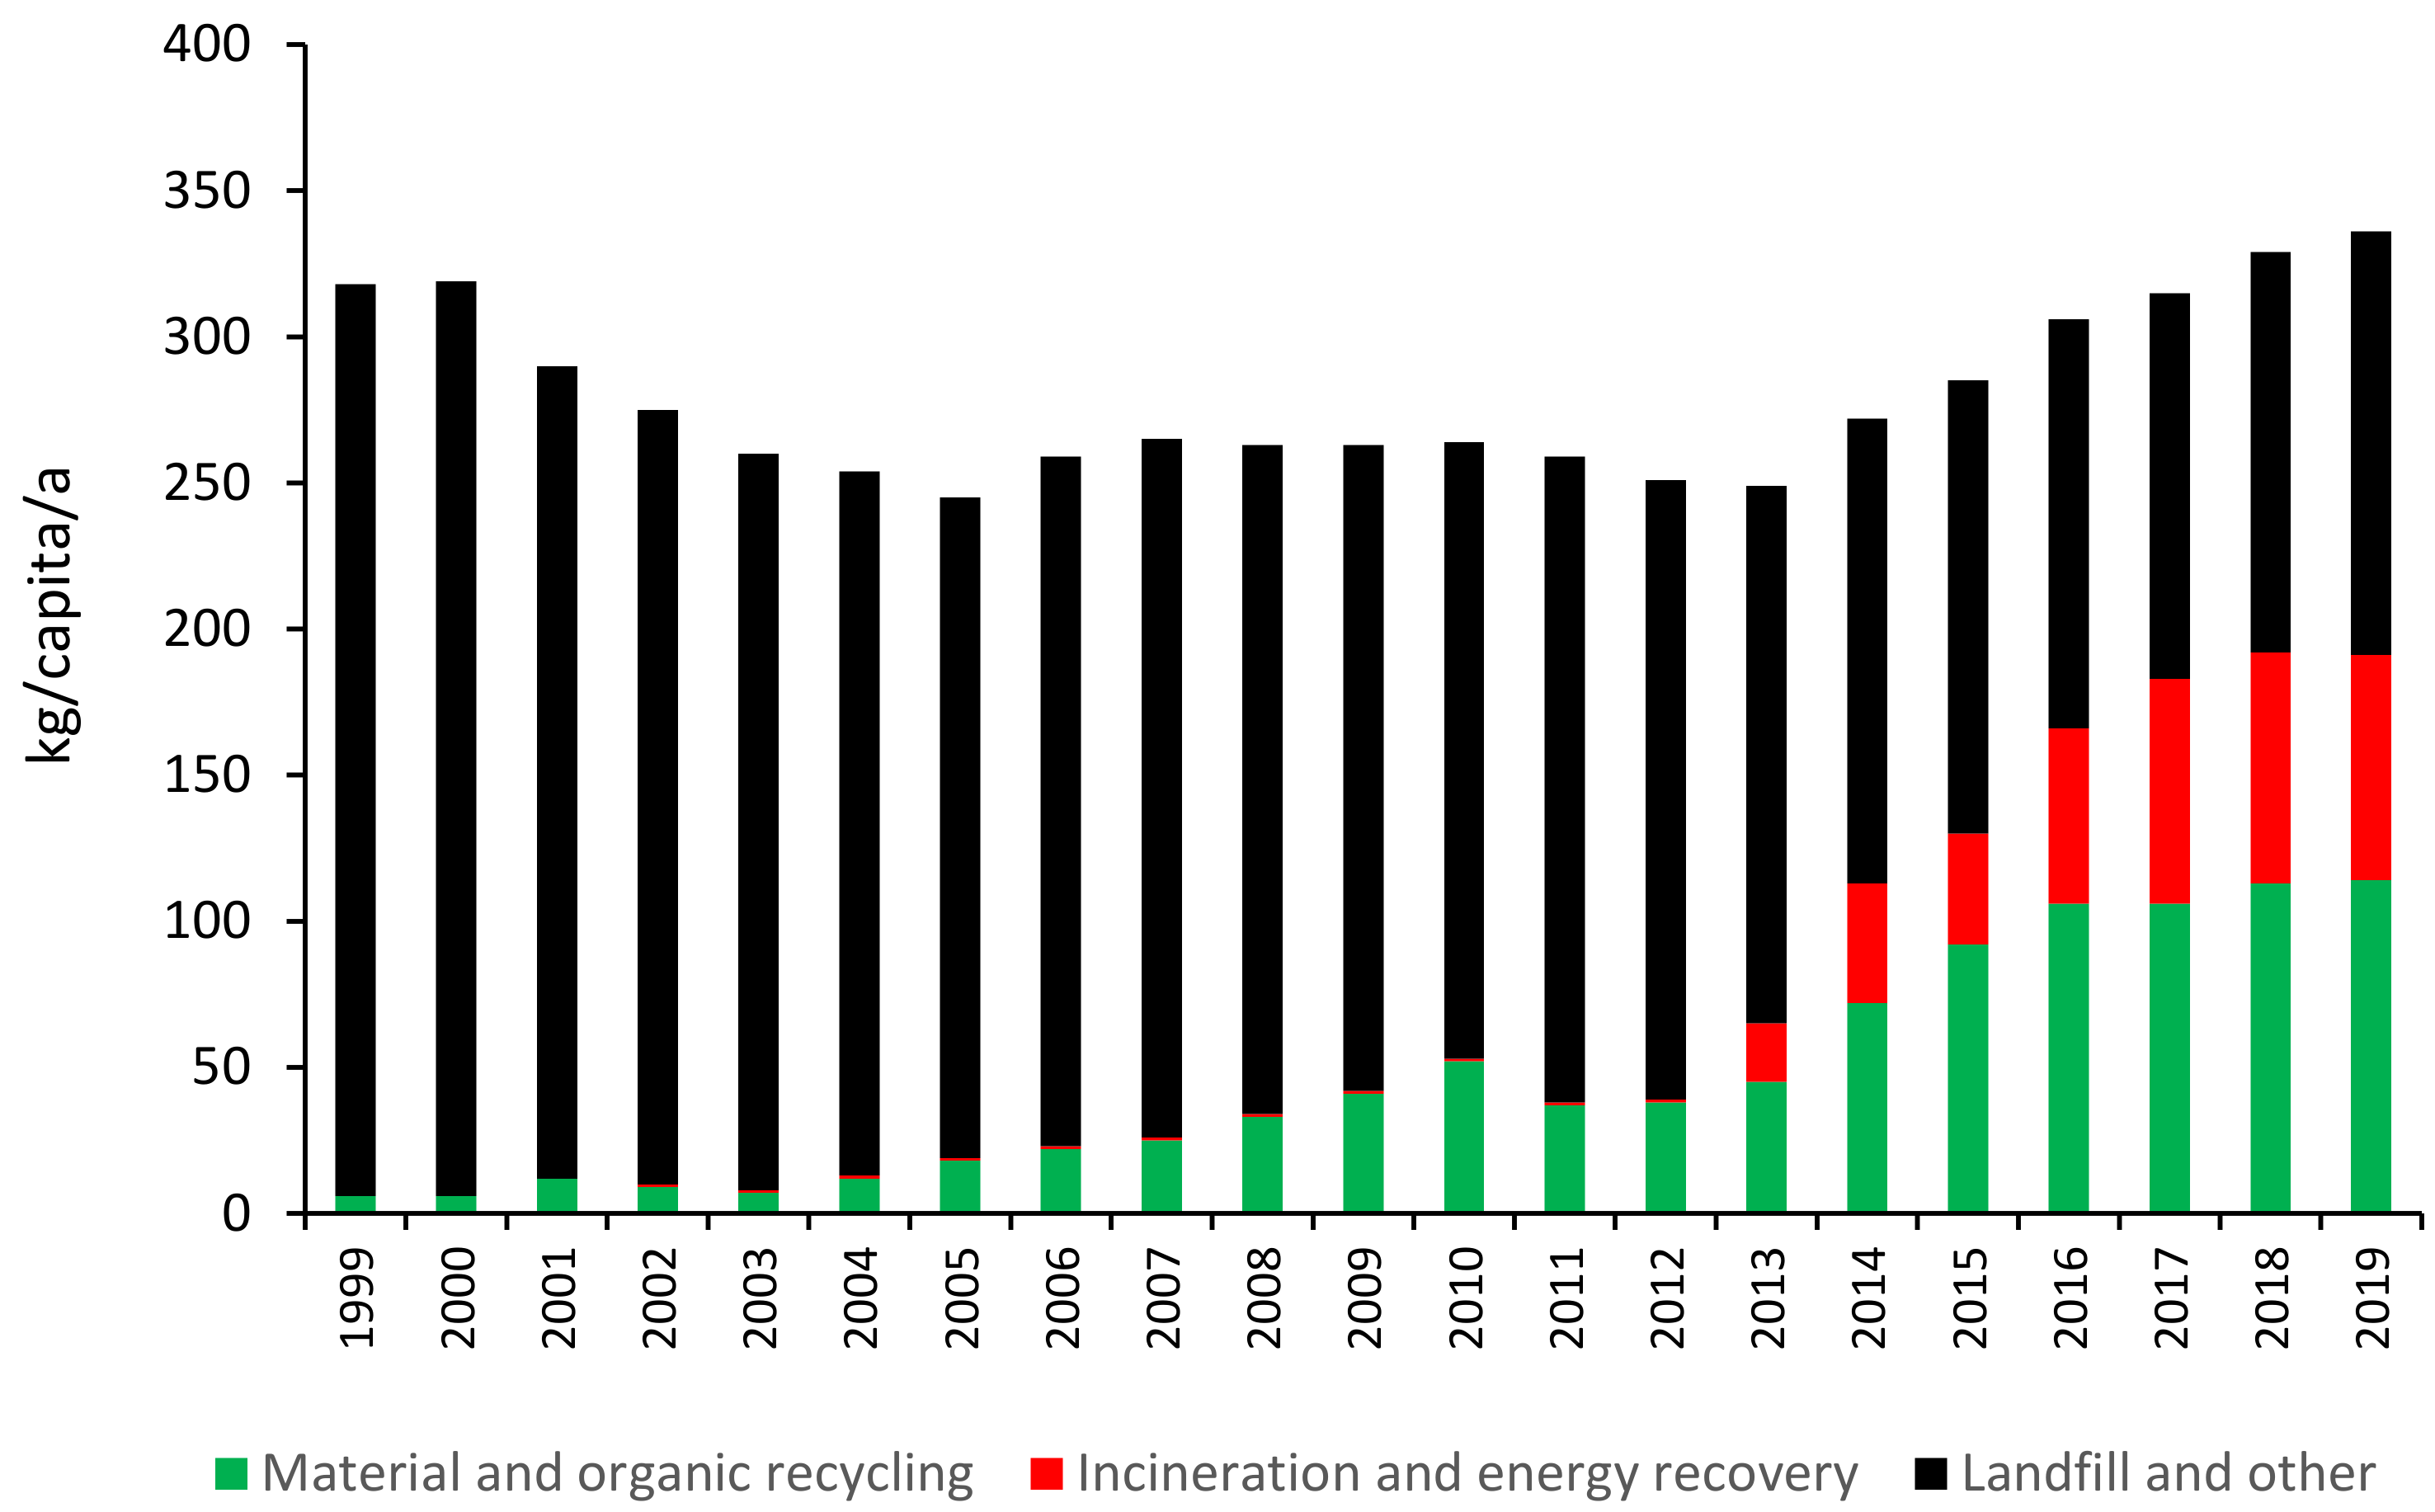
4.1. Change Trends in Municipal Waste Stream

In the analyzed period, the stream of collected raw mixed waste decreased from 140,155 Mg in 2016 to 113,647 Mg in 2020. This may be due to demographic reasons as well as changes in waste collection methods. In the recent years, the region’s population decreased by an average of 1454.6 inhabitants per year, but at the same time, the unit waste accumulation index increased by 0.5809 kg/cap/a on average (Figure 11a), which kept the waste stream relatively constant. The data in the graph are averaged for all types of building densities, hence, the linear character of the graph. According to Malinauskaite et al. [28], the unit waste accumulation rate also increased from 2005 to 2019 in the Baltic countries of Latvia, from 320 to 439 kg/cap/a, and Lithuania, from 387 kg/cap/a to 472 kg/cap/a. An additional factor influencing the change in the structure of generated waste could be the outbreak of the COVID-19 pandemic. According to Filho et al. [29], one of the effects of the pandemic was the increase in the accumulation of municipal waste associated with the need to stay at home, including an increase in the generated food and packaging waste by 43% and 53%, respectively. In the studied area (Olsztyn), these factors seem to have similar characteristics. It is also worth emphasizing that Poland still has among the lowest levels of waste generated in Europe, with an average of 319 kg per person in 2005 and 329 kg per person in 2018, whereas the EU-28 produced 506 kg per capita on average in 2005 and 492 kg per person in 2018 [30].
The amount of collected waste is presented in Figure 11b, which takes into account the data from the dispersion reports. As the mass of the mixed waste stream decreases, that of the stream from separate collection increases, hence, there was a strong negative correlation (correlation coefficient = −0.93). As this negative correlation suggests, the total mass of generated waste remained relatively constant, averaging 142,000 Mg during the examined period. It should be noted that Poland is a developing country, which could explain the observed increase in waste accumulation. Further increase in the unit waste accumulation index is expected in both Poland and other European countries as the consequence of increasing urbanization, a rising standard of living, and changing patterns of social habits and behavior that are mainly related to higher consumption [31]. The association between economic factors and the production of municipal waste has been known for years and widely described in the scientific literature [32,33,34,35]. Zaleski and Chawla [36] reported that 3.5% GDP growth is associated with a 1.5% increase in the mass of municipal waste. In several studies, the amount of MW has been connected with household-level factors (i.e., economic status, per-capita income, size of household, employment rate, or location of household in rural or urban areas), commune-level factors, or with individual consumption patterns [37,38,39,40].

4.2. Selective Waste Collection and a Circular Economy

Achieving the requirements of a Circular Economy would be impossible if the mass of waste susceptible to material and organic recycling that was contained in the municipal waste stream did not exceed 65% w/w. The case of Germany shows that these requirements are achievable; however, the morphological composition of municipal waste in the European Union countries (and not only in the EU) is not identical. Moreover, in individual countries, the morphological composition may be related to certain internal demographic factors. Table 1 shows the shares of the components of raw material waste in areas of different building density in the Warmińsko-Mazurskie Voivodship, as well as their average shares in the waste generated by the entire region included in this study. This analysis of the morphological composition of the waste was based on the data in the Waste Management Plan for the Warmińsko-Mazurskie Voivodeship for 2016–2022 [41] and the fact that the mass balance analysis (above) showed that waste collected in the Olsztyn commune (city > 100,000 inhabitants) account for 63% w/w of the total waste stream generated in the region.
As the total share of raw material and organic waste is 81.61%, the requirements of a Circular Economy could be met in this region. For comparison, the share of these morphological components in the Świętokrzyskie Voivodeship was 77.68% at approximately the same time [42].
On average, the selectively collected waste stream provided 94.1% of all commercial assortments obtained by the Municipal Waste Management Plant, which means it was the main source of waste sent for recycling. Moreover, the changes in this waste stream (marked in blue in Figure 11b) correlated strongly (0.9937) with the weight of the acquired commercial assortments (marked in red in Figure 12). The effectiveness of selective waste collection in a Circular Economy is therefore a key factor in Poland and, it seems, in the other EU countries with a similar degree of advancement in waste management. According to the data provided by Latosińska et al. [39], the average level of selective collection in the European Union is 47.7%. The highest values are found in Germany, Slovenia, the Netherlands and Belgium: 66.7%, 59.2%, 56.9% and 54.7%, respectively. In Central Europe, however, the results are worse, with levels of 33.3% in the Czech Republic, 30.8% in Estonia, 38.5% in Slovakia, 35.9% in Hungary, 31.5% in Bulgaria and 30.2% in Croatia [8].
Figure 12 shows the change in weight and the degree of recovery of all commercial assortments obtained from municipal waste in 2016–2020 in the analyzed region. The share of commercial assortments grew linearly until 2018, at about 0.83% per year, and then increased exponentially, reaching over 14% of the mass of the entire municipal waste stream in 2020. Assuming that this rate of increase remains constant, in 2035, the degree of recovery of commercial assortments would be about 40% of the mass of the municipal waste stream, which is insufficient to meet the requirements for a Circular Economy. Therefore, a growth rate of selective waste collection that is too low may be an obstacle to achieving a Circular Economy. Abis et al. [43] reached similar conclusions in their work, which attempted to assess the synergy between recycling and thermal treatment in municipal waste management in Europe. Those authors considered the need to increase the recycling quotas for specific MSW fractions via separate collection to be one of the crucial issues in the achievement of Circular Economy action plan targets.
Benefits associated with new business models are indeed substantial. Meyer [44] estimated that resource efficiency improvements across different value chains could provide raw material savings of 17–24% and costs savings of around €630 million in Europe. Based on product-based modelling, EMF [45] suggested that boosting circular economy business models could increase the EU GDP by 3.9% by 2030.

4.3. Biodrying and the Achievement of a Circular Economy

This paper proposes an empirical method for estimating the process loss during bio-drying. Based on the analysis of 120 dispersion reports, the average process loss in 2016–2020 was estimated at 23.47%. These results are consistent with those presented by Economopoulos [46], who reported the efficiency of the biodrying process in a Mechanical-Biological Treatment installation to be about 25%, and the share of alternative fuel production to be 73%. An interesting issue is the lack of a correlation between the process loss expressed in mass units and the process loss expressed as a percentage (Figure 4b). It is also important to consider the technological aspects of the biodrying process, and in particular, the possibilities for optimizing the hydraulic properties of the system. In 2019, for example, the bed filling the biofilter chambers at the Municipal Waste Management Plant in Olsztyn was depleted. The reduction of process loss during this period suggests that optimization of a biodrying process should begin with a basic technical review of the installation.
According to some authors, the key factor in meeting the requirements of a Circular Economy is increasing the selective collection of organic waste [47]. This is associated with a gradual decrease of recyclable waste in the mixed waste stream. From a technological point of view, the question then arises as to what is the minimum share of organic waste that would still allow the biodrying process to be carried out. The data presented by Rada et al. [48] indicate that the biodrying of municipal waste is still exothermic with a share of organic matter over 29% w/w. Those authors also obtained satisfactory production of alternative fuel during biodrying with a share of organic matter of 8% w/w. According to those authors, drying of municipal waste with such a low share of the organic fraction is mainly based on physical, not biological, effects. Even if we assumed that, in the case presented here, the share of organic matter directed to the biodrying process is at a minimum level of 8%, the share of waste subjected to material and organic recycling processes would amount to (81.61–8 %) × 81.74%, which gives 60.11%. On the one hand, the results presented here indicate that it is not possible to meet the requirements of a Circular Economy at present, but on the other hand, they indicate that achieving 65% recycling is “within reach”. The question, however, is what activities should be undertaken to make this possible by 2035 [49].

5. Conclusions

The technological results of the biodrying process presented here seem to be consistent with those presented in the literature. Thus, this analysis allows for the assessment of the possibility of using an installation based on biodrying of municipal waste in modern waste management. The results seem to indicate that there is a strong possibility of reconciling municipal waste management based on the WtE technology with management based on recycling.
The requirements for a Circular Economy, including 65% recycling of the generated municipal waste stream by the end of 2035, may be difficult to achieve for many European Union countries. In many places around the world, conversion to a Circular Economy will require intensive educational and modernization efforts. The key factor in a Circular Economy seems to be the efficiency of selective waste collection, and a constant increase in selective collection of municipal waste is required around the world.

Author Contributions

Conceptualization, S.K. and M.D.; data curation, M.R.; formal analysis, S.K., M.D. and M.R.; funding acquisition, S.K., M.D. and M.R.; investigation, M.O. and M.R.; methodology, M.D. and M.O.; project administration, S.K. and M.D.; resources, M.O.; software, M.O; supervision, M.D.; validation, M.O.; visualization, M.O. and M.R.; writing—original draft, S.K. and M.D.; writing—review and editing, S.K., M.D., M.O. and M.R. All authors have read and agreed to the published version of the manuscript.

Funding

This study was financed by the statutory fund of the faculty of Geoengineering, University of Warmia and Mazury in Olsztyn (number 29.610.024.110). Project was financially co-supported by Minister of Education and Science in the range of the program entitled “Regional Initiative of Excellence” for the years 2019–2022, project No. 010/RID/2018/19, amount of funding 12.000.000 PLN.

Institutional Review Board Statement

Not applicable.

Informed Consent Statement

Not applicable.

Data Availability Statement

Not applicable.

Conflicts of Interest

The authors declare no conflict of interest.

References

  1. Pearce, D.W.; Turner, R.K. Economics of Natural Resources and the Environment; Harvester Wheatsheaf: London, UK, 1990. [Google Scholar]
  2. Van Buren, N.; Demmers, M.; Van der Heijden, R.; Witlox, F. Towards a Circular Economy: The Role of Dutch Logistics Industries and Governments. Sustainability 2016, 8, 647. [Google Scholar] [CrossRef] [Green Version]
  3. Kazimierowicz, J.; Dzienis, L.; Dębowski, M.; Zieliński, M. Optimisation of methane fermentation as a valorisation method for food waste products. Biomass Bioenergy 2021, 144, 105913. [Google Scholar] [CrossRef]
  4. Kazimierowicz, J. Depletion Efficiency of Selected Expired Food Products in the Process of Methane Fermentation. J. Ecol. Eng. 2019, 20, 132–137. [Google Scholar] [CrossRef]
  5. Kazimierowicz, J.; Zieliński, M.; Dębowski, M. Influence of the Heating Method on the Efficiency of Biomethane Production from Expired Food Products. Fermentation 2021, 7, 12. [Google Scholar] [CrossRef]
  6. Dajian, Z. Background, Pattern and Policy of China for Developing Circular Economy. Chin. J. Popul. Resour. Environ. 2008, 6, 3–8. [Google Scholar] [CrossRef]
  7. Pesce, M.; Tamai, I.; Guo, D.; Critto, A.; Brombal, D.; Wang, X.; Cheng, H.; Marcomini, A. Circular Economy in China: Translating Principles into Practice. Sustainability 2020, 12, 832. [Google Scholar] [CrossRef] [Green Version]
  8. Eurostat Statistics. Available online: https://ec.europa.eu/eurostat/statistics-explained/index.php?title=Municipal_waste_statistics#Municipal_waste_treatment (accessed on 10 November 2021).
  9. Wang, W.; Themelis, N.J.; Sun, K.; Bourtsalas, A.C.; Huang, Q.; Zhang, Y.; Wu, Z. Current influence of China’s ban on plastic waste imports. Waste Dispos. Sustain. Energy 2019, 1, 67–78. [Google Scholar] [CrossRef] [Green Version]
  10. Marks, D. Southeast Asia’s Plastic Waste Problem. In East Asia Forum, June 2019. Available online: https://www.eastasiaforum.org/2019/06/26/southeast-asias-plastic-waste-problem (accessed on 10 November 2021).
  11. Saidani, M.; Yannou, B.; Leroy, Y.; Cluzel, F.; Kendall, A. A Taxonomy of Circular Economy Indicators. J. Clean. Prod. 2019, 207, 542–559. [Google Scholar] [CrossRef] [Green Version]
  12. Kasztelan, A. How circular are the European economies? A taxonomic analysis based on the INEC (index of national economies’ circularity). Sustainability 2020, 12, 7613. [Google Scholar] [CrossRef]
  13. Competition in the Market of Communal Waste. Report of UOKiK, Warsaw, 2012. Available online: http://uokik.gov.pl/publikacje (accessed on 10 November 2021).
  14. Estimation of Investment Costs in the Field of Installations and Facilities for Municipal Waste Management in Poland in 2011–2020; Ministry of the Environment: Warsaw, Poland, 2010.
  15. Kepys, W.; Jaszczura, K. Waste Thermal Treatment Installations in Poland. Inżynieria Miner. 2020, 1, 47–50. [Google Scholar] [CrossRef]
  16. Council Directive 1999/31/EC of 26 April 1999 on the landfill of waste. Off. J. L 1999, 182, 1–19.
  17. Ecoprog GmbH. Waste to Energy 2019/2020: Technologies, Plants, Projects, Players and Backgrounds of the Global Thermal Waste Treatment Business. Extract. 12th ed. Cologne. 2019. Available online: https://www.ecoprog.com/fileadmin/user_upload/extract_market_report_WtE_2020-2021_ecoprog.pdf (accessed on 10 November 2021).
  18. Ragazzi, M.; Rada, E.C.; Panaitescu, V.; Apostol, T. Municipal solid waste pre-treatment: A comparison between two dewatering options. WIT Trans. Ecol. Environ. 2007, 102, 7. [Google Scholar] [CrossRef] [Green Version]
  19. Psaltis, P.; Komilis, D. Environmental and economic assessment of the use of biodrying before thermal treatment of municipal solid waste. Waste Manag. 2019, 83, 95–103. [Google Scholar] [CrossRef]
  20. Database of Waste Management Technologies. Available online: http://www.epem.gr/waste-c-control/database/html/case_study-20.htm (accessed on 10 November 2021).
  21. Hood, P.; Smith, S.R.; Skourides, I. A Method and System for Treating Mixed Municipal and Selected Commercial Waste; International Publication Number: WO 2008/065452 A2, 5-06-08; World Intellectual Property Organisation: Geneva, Switzerland, 2008; p. 17. [Google Scholar]
  22. Archer, E.; Baddeley, A.; Klein, A.; Schwager, J.; Whiting, K. Mechanical-Biological Treatment: A Guide for Decision Makers, Processes, Policies and Markets; Juniper Consultancy Services Ltd.: März, Austria, 2005. [Google Scholar]
  23. Velis, C.A.; Longhurst, P.J.; Drew, G.H.; Smith, R.; Pollard, S.J. Biodrying for mechanical–biological treatment of wastes: A review of process science and engineering. Bioresour. Technol. 2009, 100, 2747–2761. [Google Scholar] [CrossRef] [Green Version]
  24. Adani, F.; Baidoa, D.; Calcaterrab, E.; Genevini, P. The influence of biomass temperature on biostabilization—Biodrying of municipal solid waste. Bioresour. Technol. 2002, 83, 173–179. [Google Scholar] [CrossRef]
  25. Tambone, F.; Scaglia, B.; Scotti, S.; Adani, F. Effects of biodrying process on municipal solid waste properties. Bioresour. Technol. 2011, 102, 7443–7450. [Google Scholar] [CrossRef]
  26. Evangelou, A.; Gerassimidou, S.; Mavrakis, N.; Komilis, D. Monitoring the performances of a real scale municipal solid waste composting and a biodrying facility using respiration activity indices. Environ. Monit. Assess. 2016, 188, 302. [Google Scholar] [CrossRef]
  27. Rada, E.C.; Ragazzi, M.; Zardi, D.; Laiti, L.; Ferrari, A. PCDD/F enviromental impact from municipal solid waste bio-drying plant. Chemosphere 2011, 84, 289–295. [Google Scholar] [CrossRef]
  28. Malinauskaite, J.; Jouhara, H.; Czajczyńska, D.; Stanchev, P.; Katsou, E.; Rostkowski, P.; Thorne, R.J.; Colon, J. Ponsa, S.; Al.-Mansour, F.; et al. Municipal solid waste management and waste-to-energy in the context of a Circular Economy and energy recycling in Europe. Energy 2017, 141, 2013–2044. [Google Scholar] [CrossRef]
  29. Leal Filho, W.; Voronova, V.; Kloga, M.; Paço, A.; Minhas, A.; Salvia, A.L.; Ferreira, C.D.; Sivapalan, S. COVID-19 and waste production in households: A trend analysis. Sci. Total Environ. 2021, 777, 145997. [Google Scholar] [CrossRef]
  30. Antczak, E. Regionally Divergent Patterns in Factors Affecting Municipal Waste Production: The Polish Perspective. Sustainability 2020, 12, 6885. [Google Scholar] [CrossRef]
  31. Grodzińska-Jurczak, M. Management of industrial and municipal solid wastes in Poland. Resour. Conserv. Recycl. 2001, 32, 85–103. [Google Scholar] [CrossRef]
  32. Dennison, G.; Dodd, V.; Whelan, B. A socio-economic based survey of household waste characteristics in the city of Dublin, Ireland. I & II. Waste composition. Resour. Conserv. Recycl. 1996, 17, 227–257. [Google Scholar] [CrossRef]
  33. Daskalopoulos, E.; Badr, O.; Probert, S. Municipal solid waste: A prediction methodology for the generation rate and composition in the European Union countries and the United States of America. Resour. Conserv. Recycl. 1998, 24, 155–166. [Google Scholar] [CrossRef]
  34. Bandara, N.J.; Hettiaratchi, J.P.A.; Wirasinghe, S.; Pilapiiya, S. Relation of waste generation and composition to socio-economic factors: A case study. Environ. Monit. Assess. 2007, 135, 31–39. [Google Scholar] [CrossRef]
  35. Gellynck, X.; Jacobsen, R.; Verhelst, P. Identifying the key factors in increasing recycling and reducing residual household waste: A case study of the Flemish region of Belgium. J. Environ. Manag. 2011, 92, 2683–2690. [Google Scholar] [CrossRef]
  36. Zaleski, P.; Chawla, Y. Circular Economy in Poland: Profitability analysis for two methods of waste processing in small municipalities. Energies 2020, 13, 5166. [Google Scholar] [CrossRef]
  37. Beigl, P.; Lebersorger, S.; Salhofer, S. Modelling municipal solid waste generation: A review. Waste Manag. 2008, 28, 200–214. [Google Scholar] [CrossRef]
  38. Oribe-Garcia, I.; Kamara-Esteban, O.; Martin, C.; Macarulla-Arenaza, A.M.; Alonso-Vicario, A. Identification of influencing municipal characteristics regarding household waste generation and their forecasting ability in Biscay. Waste Manag. 2015, 9, 26–34. [Google Scholar] [CrossRef] [Green Version]
  39. Ramachandra, T.; Bharath, H.; Kulkarni, G.; Han, S.S. Municipal solid waste: Generation, composition and GHG emissions in Bangalore, India. Renew. Sustain. Energy Rev. 2018, 82, 1122–1136. [Google Scholar] [CrossRef]
  40. Hage, O.; Söderholm, P. An econometric analysis of regional differences in household waste collection: The case of plastic packaging waste in Sweden. Waste Manag. 2008, 28, 1720–1731. [Google Scholar] [CrossRef]
  41. Waste Management Plan for the Warmian-Masurian Voivodeship for 2016–2022 (Polish). Available online: https://bip.warmia.mazury.pl/114/plan-gospodarki-odpadami-dla-wojewodztwa-warminsko-mazurskiego-na-lata-2016-2022.html (accessed on 10 November 2021).
  42. Latosińska, J.; Miłek, D.; Komór, A.; Kowalik, R. Selective Collection of Municipal Waste in a Residential District with Multi-Family Buildings—Case Study from Poland. Resources 2021, 10, 83. [Google Scholar] [CrossRef]
  43. Abis, M.; Bruno, M.; Kuchta, K.; Simon, F.G.; Grönholm, R.; Hoppe, M.; Fiore, S. Assessment of the Synergy between Recycling and Thermal Treatments in Municipal Solid Waste Management in Europe. Energies 2020, 13, 6412. [Google Scholar] [CrossRef]
  44. Meyer, B. Macroeconomic Modelling of Sustainable Development and the Links between the Economy and the Environment; Final Report of the MacMod project (ENV. F. 1/ETU/2010/0033) to the European Commission; European Commission: Brussels, Belgium, 2011. [Google Scholar]
  45. MacArthur, E. Towards the circular economy. J. Ind. Ecol. 2013, 2, 23–44. [Google Scholar]
  46. Economopoulos, A.P. Technoeconomic aspects of alternative municipal solid wastes treatment methods. Waste Manag. 2010, 30, 707–715. [Google Scholar] [CrossRef]
  47. Rolewicz-Kalińska, A.; Lelicińska-Serafin, K.; Manczarski, P. The Circular Economy and organic fraction of municipal solid waste recycling strategies. Energies 2020, 13, 4366. [Google Scholar] [CrossRef]
  48. Rada, E.C.; Ragazzi, M.; Badea, A. MSW Bio-drying: Design criteria from a 10 years research. UPB Sci. Bull. Ser. D 2012, 74, 209–216. [Google Scholar]
  49. Kazimierowicz, J. Legal Regulations and Methods Neutralising Expired Food Products. J. Ecol. Eng. 2018, 19, 217–224. [Google Scholar] [CrossRef]
Figure 1. Methods of municipal waste management in European countries, * data from 2018; source: Eurostat database [8].
Energies 14 07711 g001
Figure 2. Municipal waste management in Poland; source: Eurostat database [8].
Energies 14 07711 g002
Figure 3. Technological flow of the Municipal Waste Management Plant in Olsztyn, Poland; * RDF—Residual Derived Fuel, RDF 30—Residual Derived Fuel of <30 mm, PVC—Polyvinyl chlorine, PUR—Polyurethane.
Energies 14 07711 g003
Figure 4. Characteristics of mixed municipal waste stream accepted at the Municipal Waste Management Plant in Olsztyn; (a) input stream components; (b) process loss resulting from the biodrying process.
Energies 14 07711 g004
Figure 5. Technological flow of the Municipal Waste Management Plant in Olsztyn; (a) recovery of commercial assortments in the mechanical processing section; (b) recovery of commercial assortments in the valorization section; (c) recovery of commercial assortments in total; (d) average composition of segregated commercial assortments for 2016–2020.
Energies 14 07711 g005
Figure 6. Monthly mass of commercial assortments sorted during the mechanical and biological treatment of municipal waste in 2016–2020; (a) 2016; (b) 2017; (c) 2018; (d) 2019; (e) 2020; (f) average for 2016–2020.
Energies 14 07711 g006aEnergies 14 07711 g006b
Figure 7. Average mass balance of the Municipal Waste Management Plant in Olsztyn for years 2016–2020 in the Mechanical-Biological Treatment Section; * RDF—Residual Derived Fuel, RDF 30—Residual Derived Fuel of <30 mm, PVC—Polyvinyl chlorine, PUR—Polyurethane.
Energies 14 07711 g007
Figure 8. Characteristics of the selective waste stream generated in 2016–2020; (a) mass of selective waste and of recovered commercial assortments; (b) mass of different waste fractions; Energies 14 07711 i001- glass, Energies 14 07711 i002 - paper, Energies 14 07711 i003- plastic, Energies 14 07711 i004- metal.
Energies 14 07711 g008
Figure 9. Quality of selectively collected individual waste fractions—values for 2020; (a) glass; (b) paper and carboard; (c) plastic; (d) metals.
Energies 14 07711 g009
Figure 10. Average mass balance of the Municipal Waste Management Plant in Olsztyn for the years 2016–2020 in the section for processing selectively collected waste (integrated with the valorization section of the MBT line); * RDF—Residual Derived Fuel, RDF 30—Residual Derived Fuel of <30 mm, PVC—Polyvinyl chlorine, PUR—Polyurethane.
Energies 14 07711 g010
Figure 11. Change in the amount of municipal waste collected, demographic factors and the level of selective collection in the 37 municipalities served by the Municipal Waste Management Plant in Olsztyn, Poland; (a) demographic factors; (b) selective collection of waste.
Energies 14 07711 g011
Figure 12. Change in the weight and the degree of recovery of commercial assortments obtained from municipal waste in 2016–2020 in the Municipal Waste Management Plant in Olsztyn, Poland.
Energies 14 07711 g012
Table 1. Morphological content of recyclable waste in the municipal waste stream generated in the analyzed region.
ComponentLocation
Larger CitySmall CommunitiesAnalyzed Region
AB63%·A + 37%·B
Paper and carboard19.10%9.70%15.62%
Glass10.00%10.20%10.07%
Metals2.60%1.50%2.19%
Plastics15.10%11.00%13.58%
Tetra Pak2.50%4.00%3.06%
Kitchen/garden waste28.90%36.70%31.79%
Green waste5.30%5.30%5.30%
Total81.61%
Publisher’s Note: MDPI stays neutral with regard to jurisdictional claims in published maps and institutional affiliations.

