
Structure of Remuneration as Assessed by Employees of the Energy Sector—Multivariate Correspondence Analysis

 , , and
Abstract
:1. Introduction
2. Literature Review
3. Materials and Methods
- —distance between h and in a row,
- —elements of the row profile,
- —elements of the average row profile,
- while for the columns from the formula:
- —distance between j and column,
- —elements of the column profile,
- —elements of the average column profile,
- —distance between row and centroid,
- —mass of the row (the sum of frequencies in the row of the correspondence matrix),
- and for columns from the formula:
- —distance between column and centroid,
- —mass column.
- —marker matrices of successive variables,
- Q—number of variables.
4. Results and Discussion
5. Discussion and Conclusions
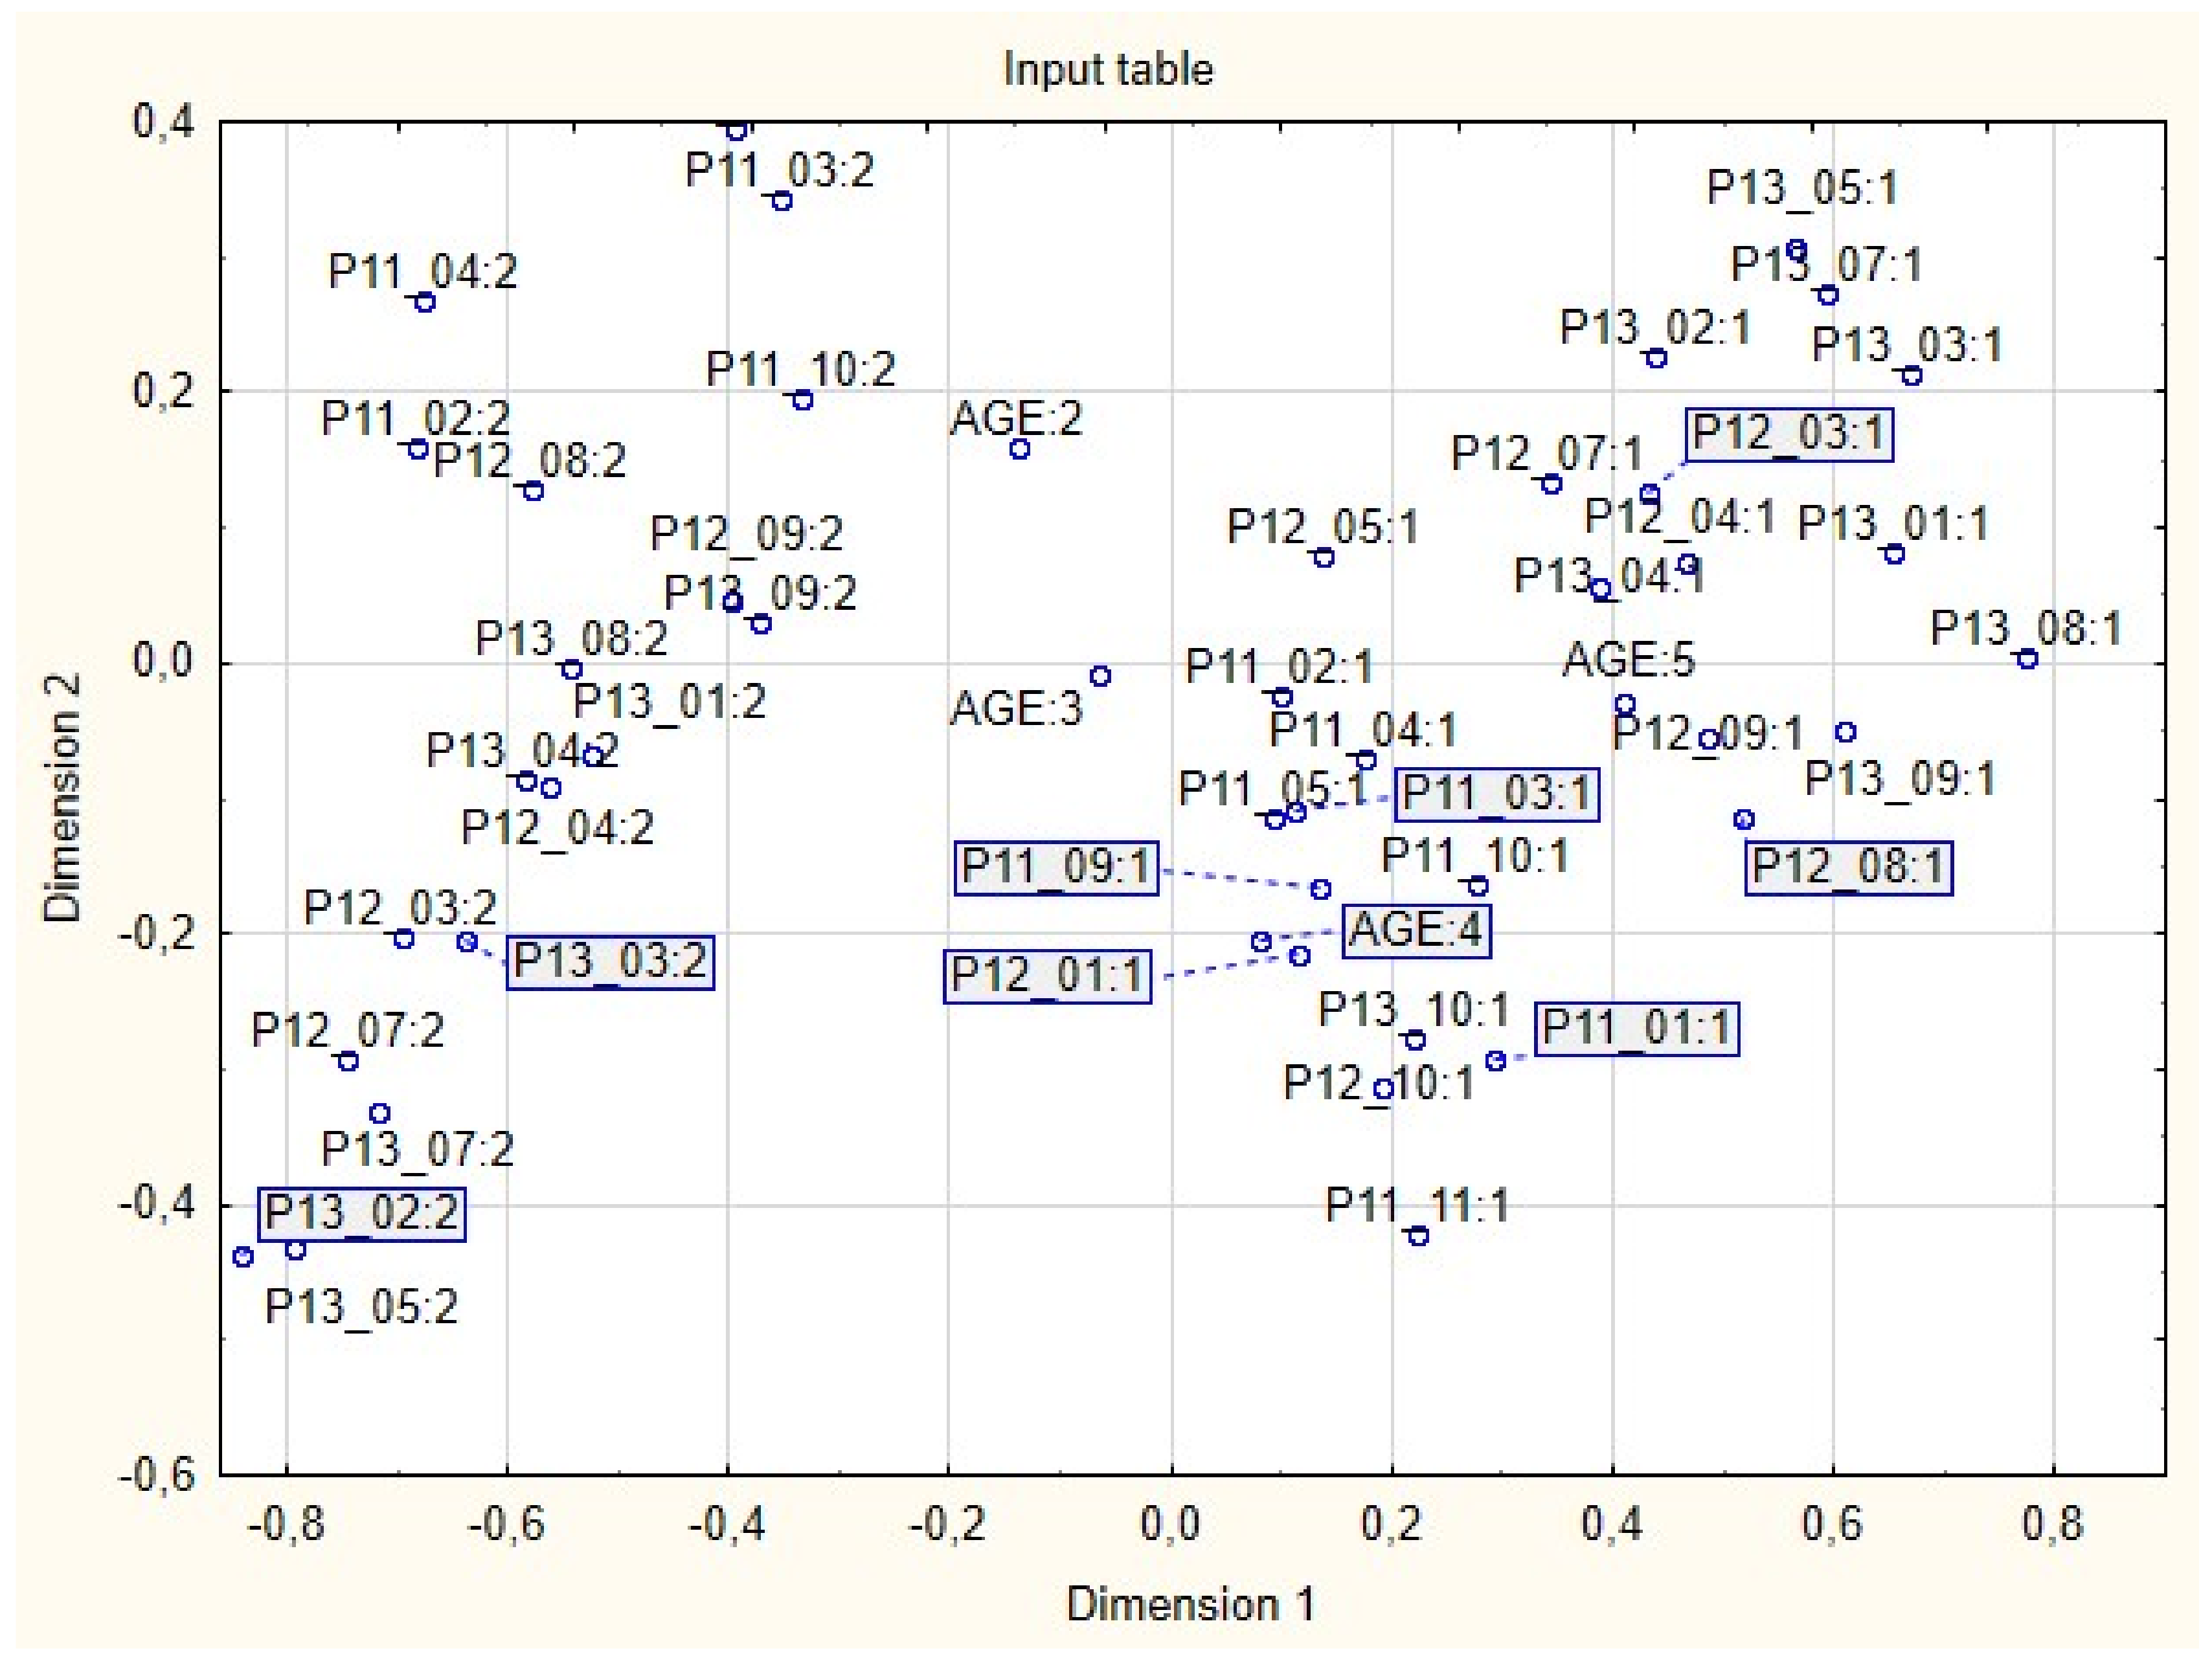
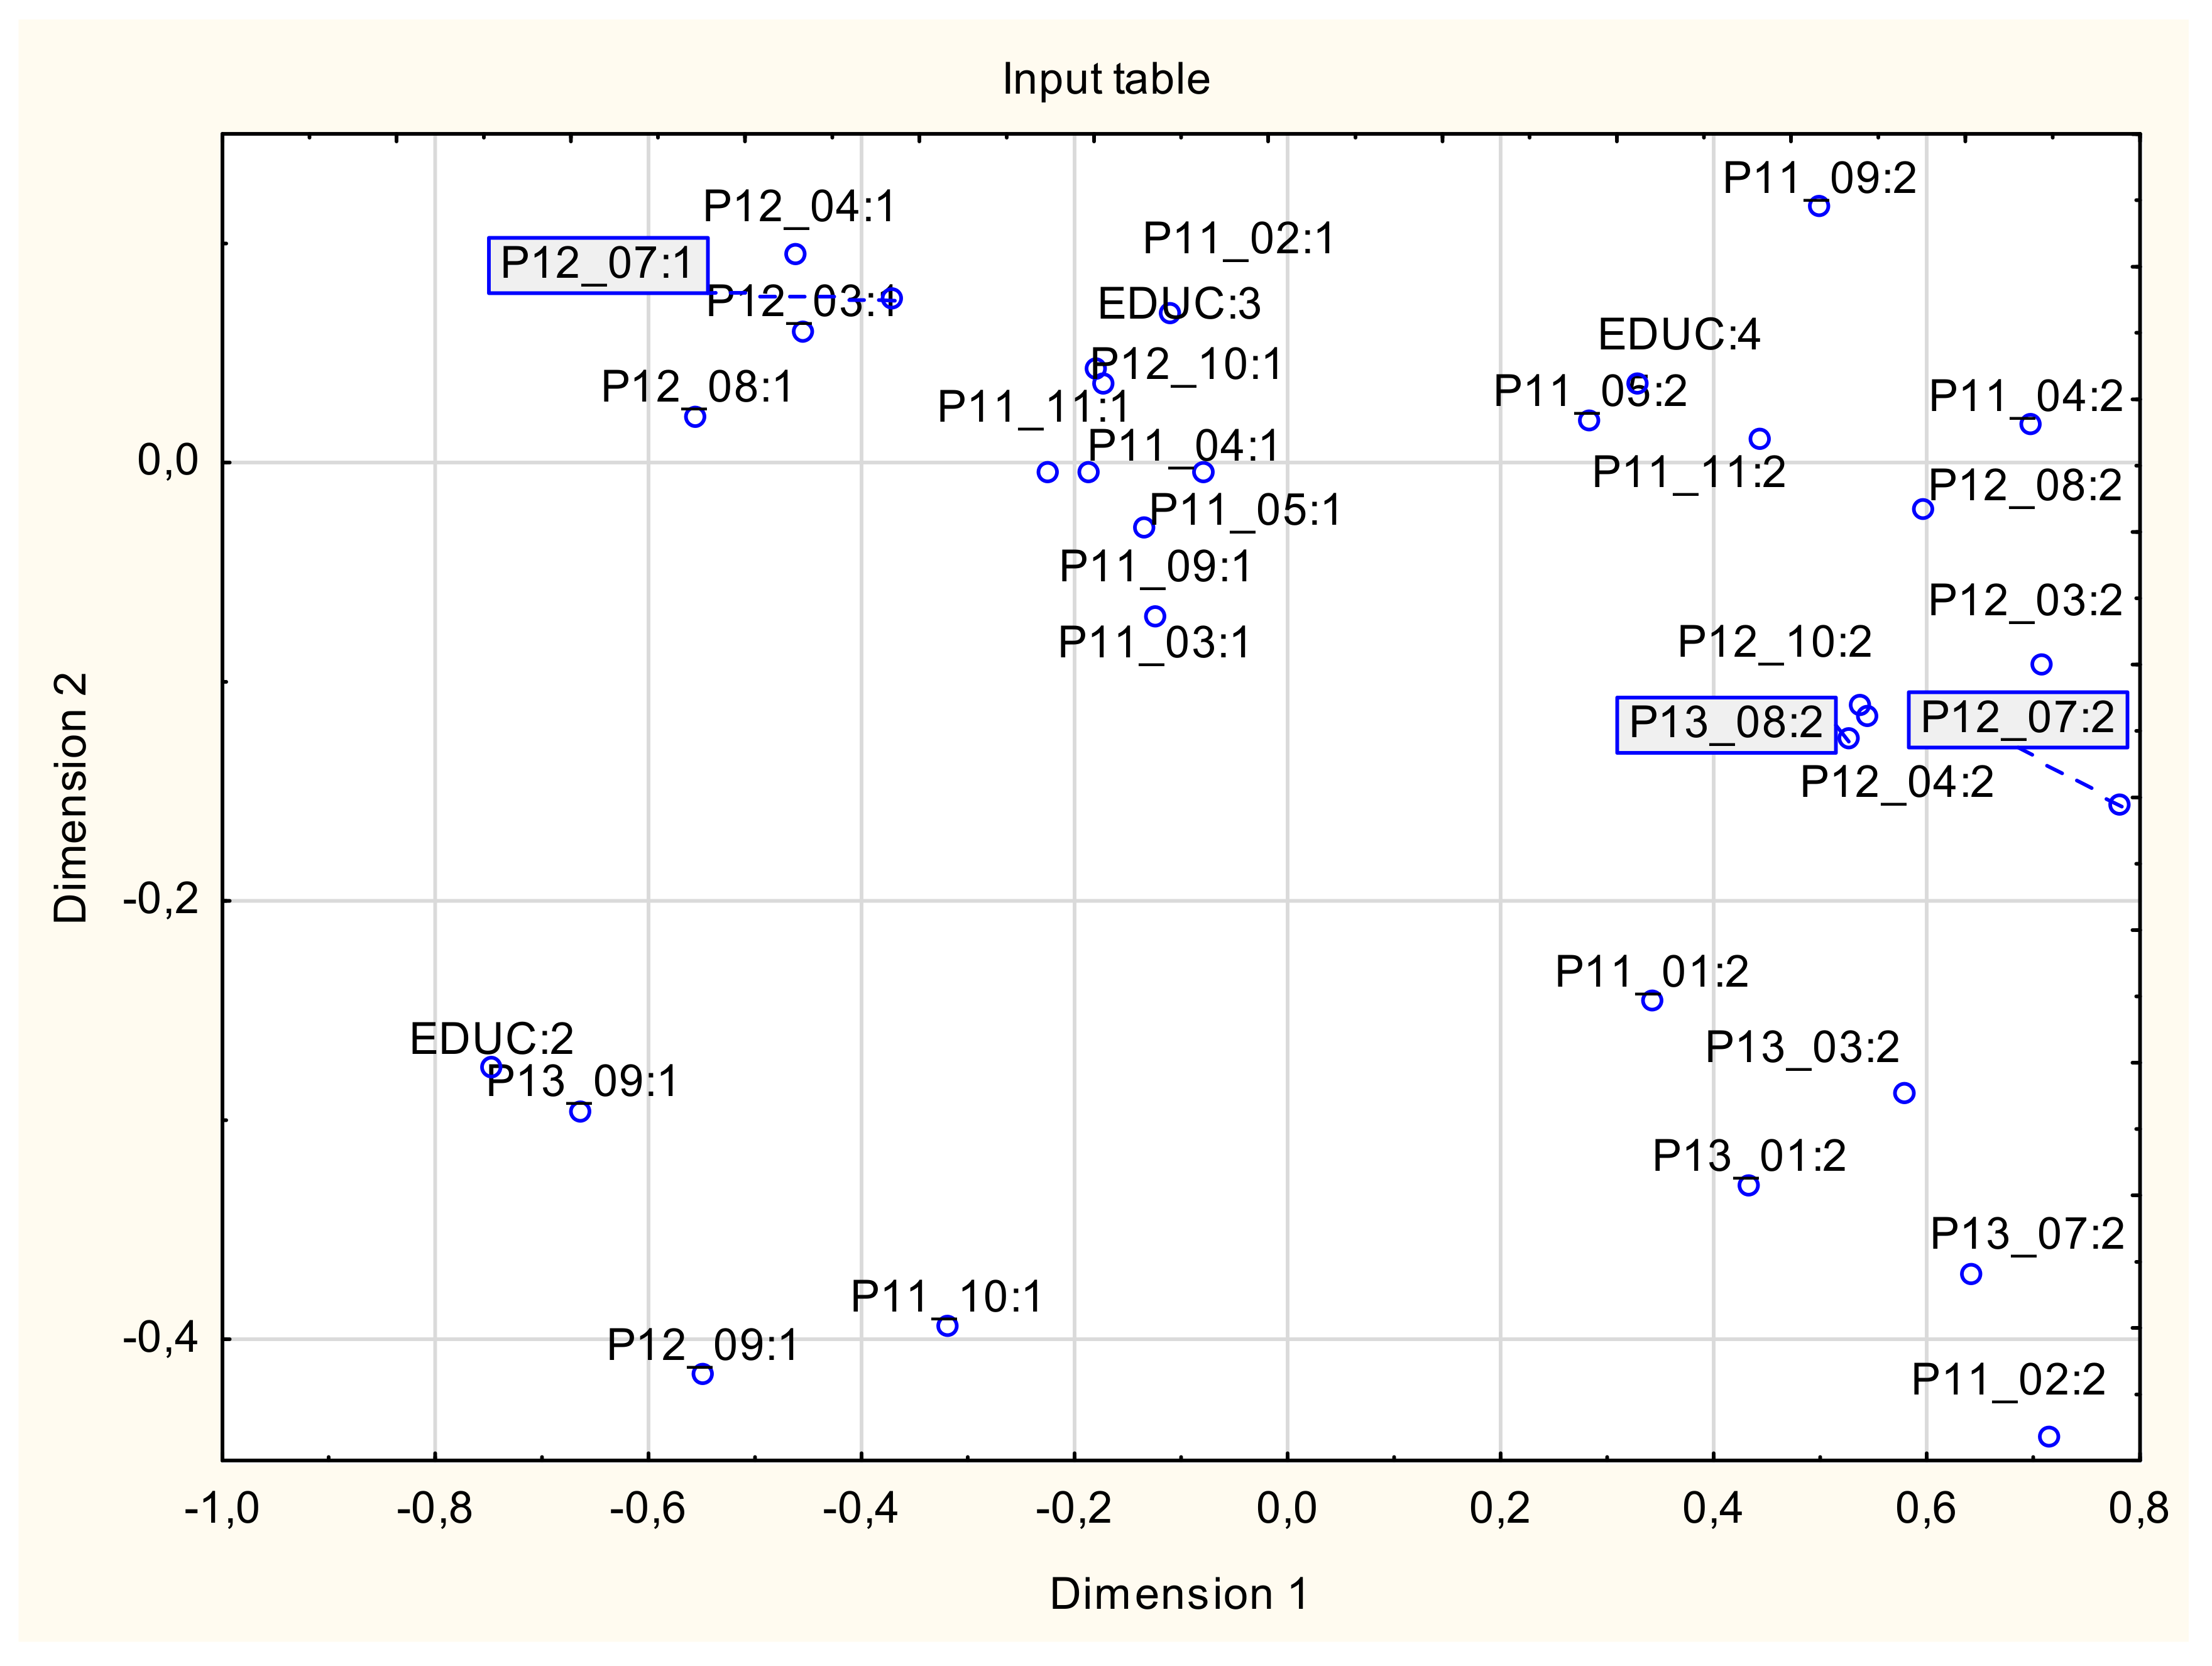
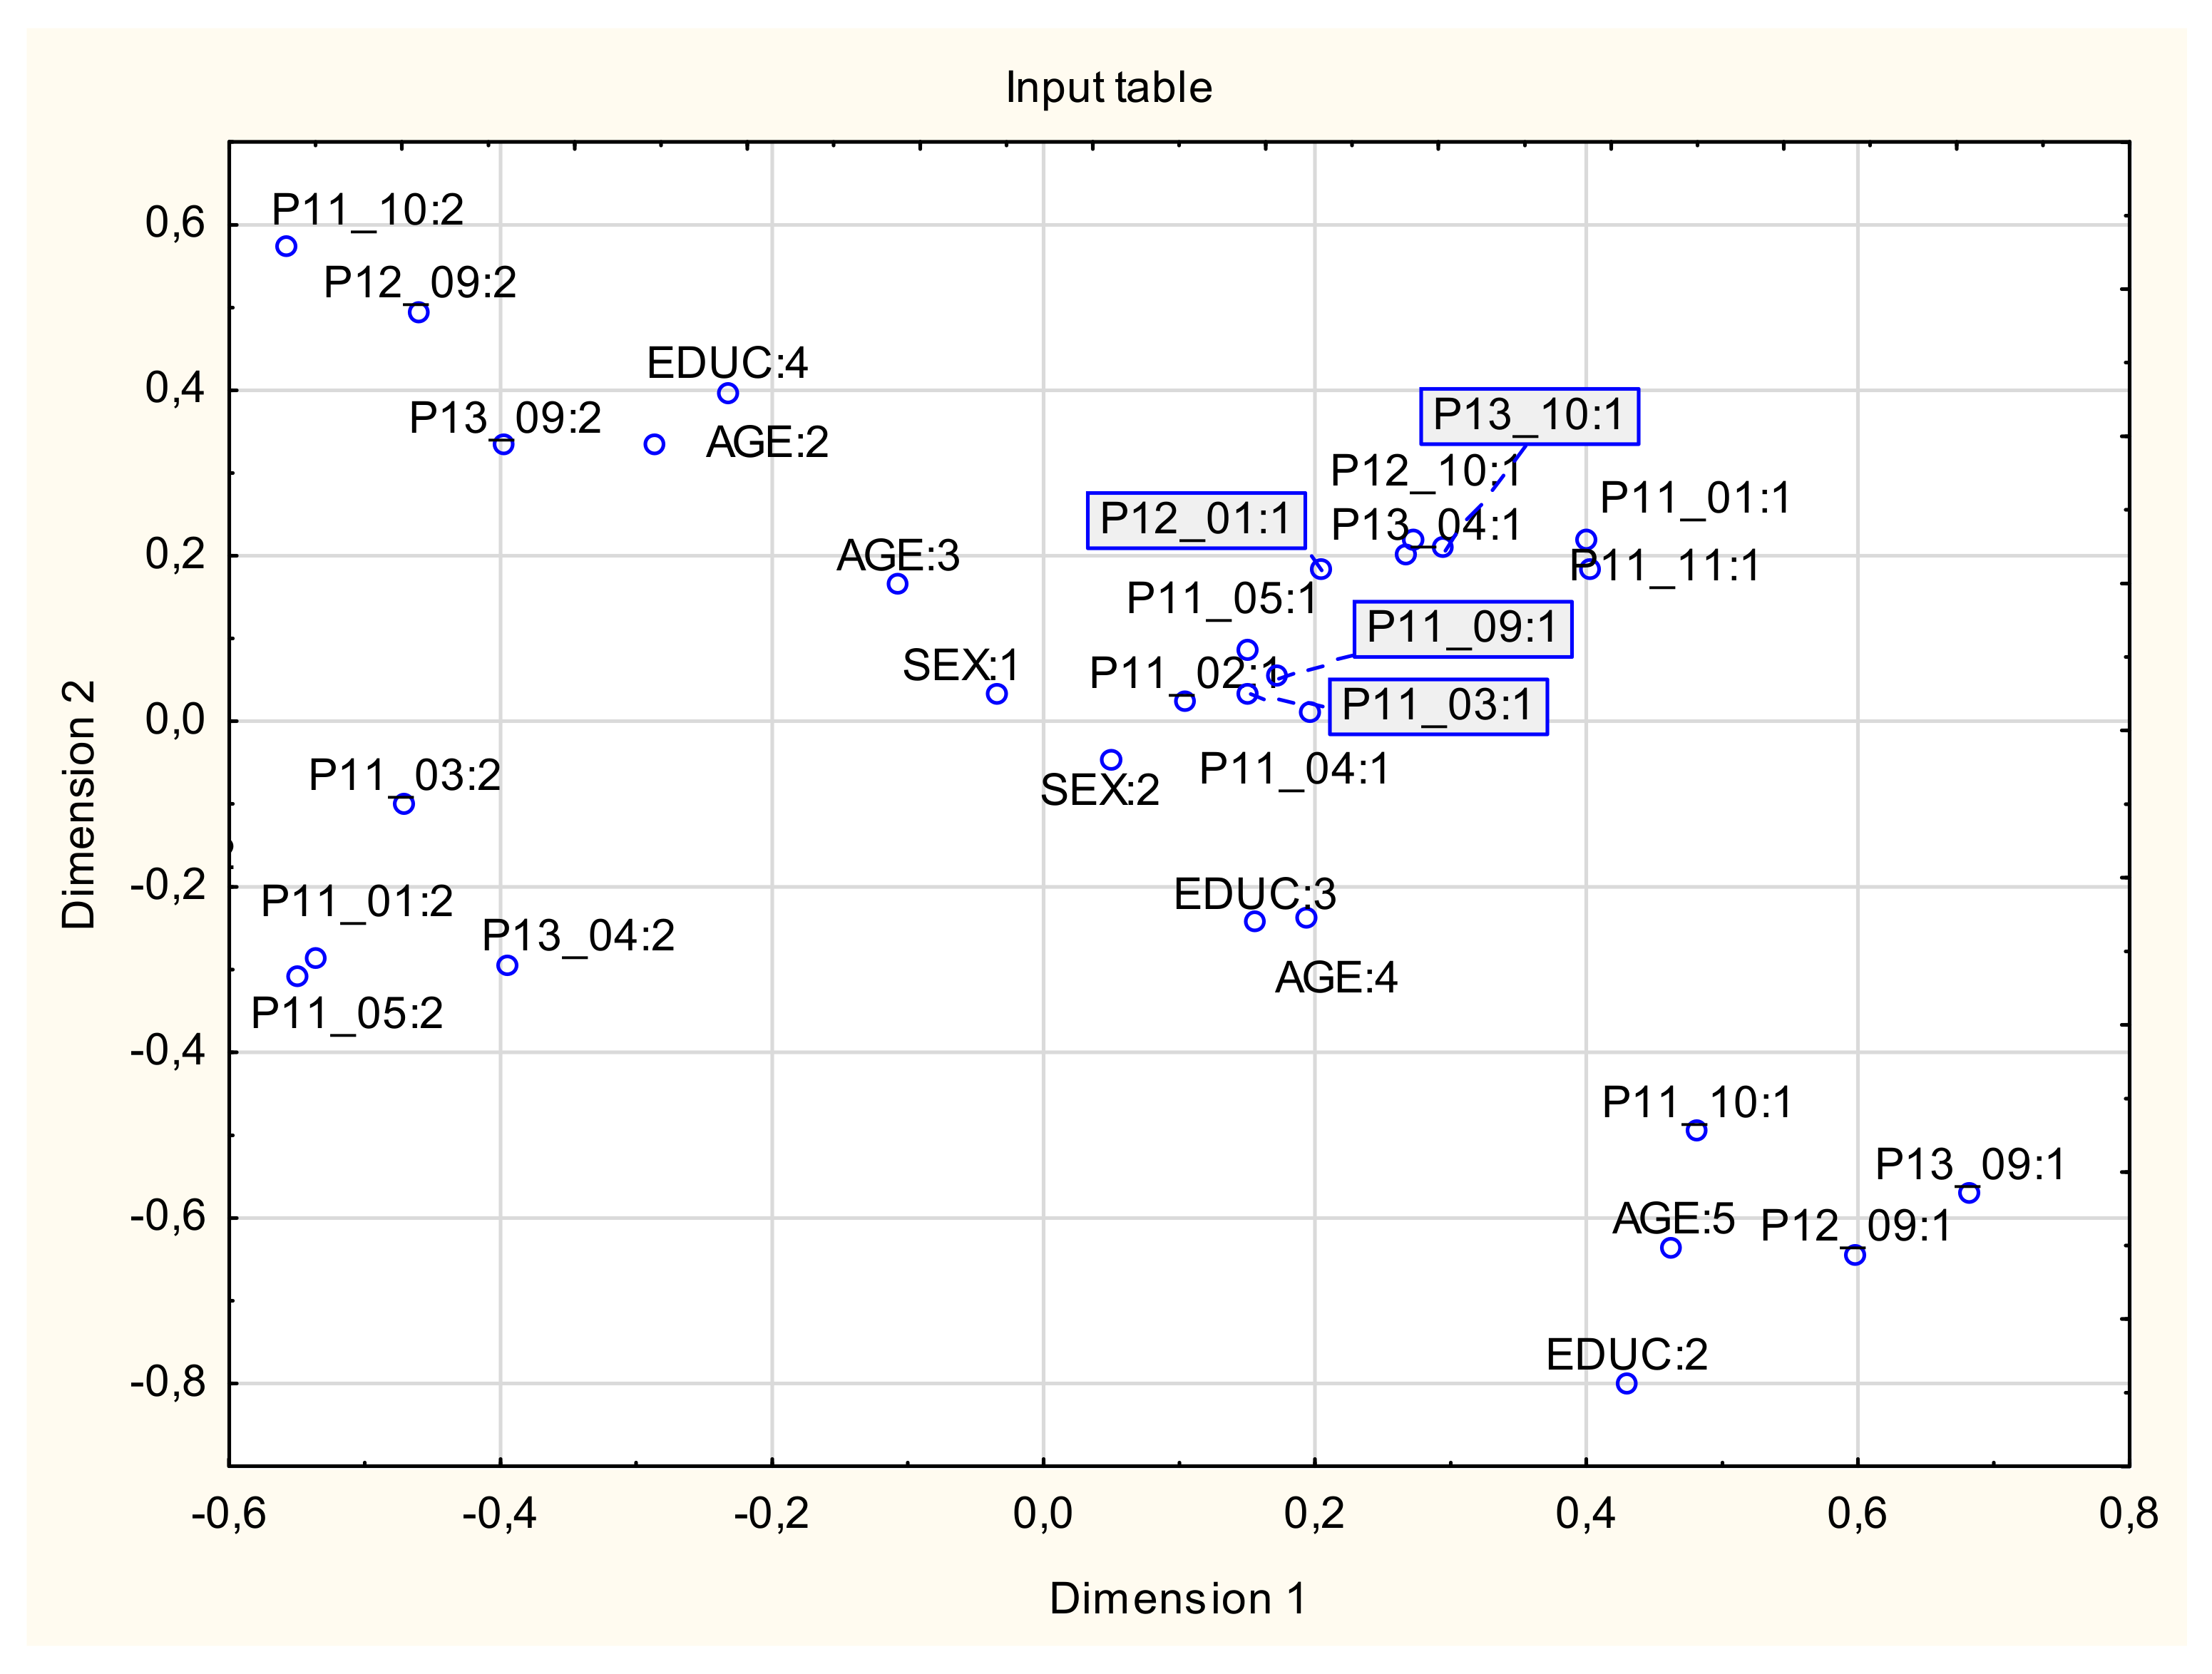
- People aged 25–34 (AGE 2) with higher education (EDU 4) are of the opinion that the granting of additional benefits (e.g., a passenger car) should not be affected by collective bargaining agreements (P13_09:2). The same group is also inclined to the opinion that the fixed part of the salary (P11_10:2) and the variable part of the salary (P12_09:2) should not depend on collective agreements.
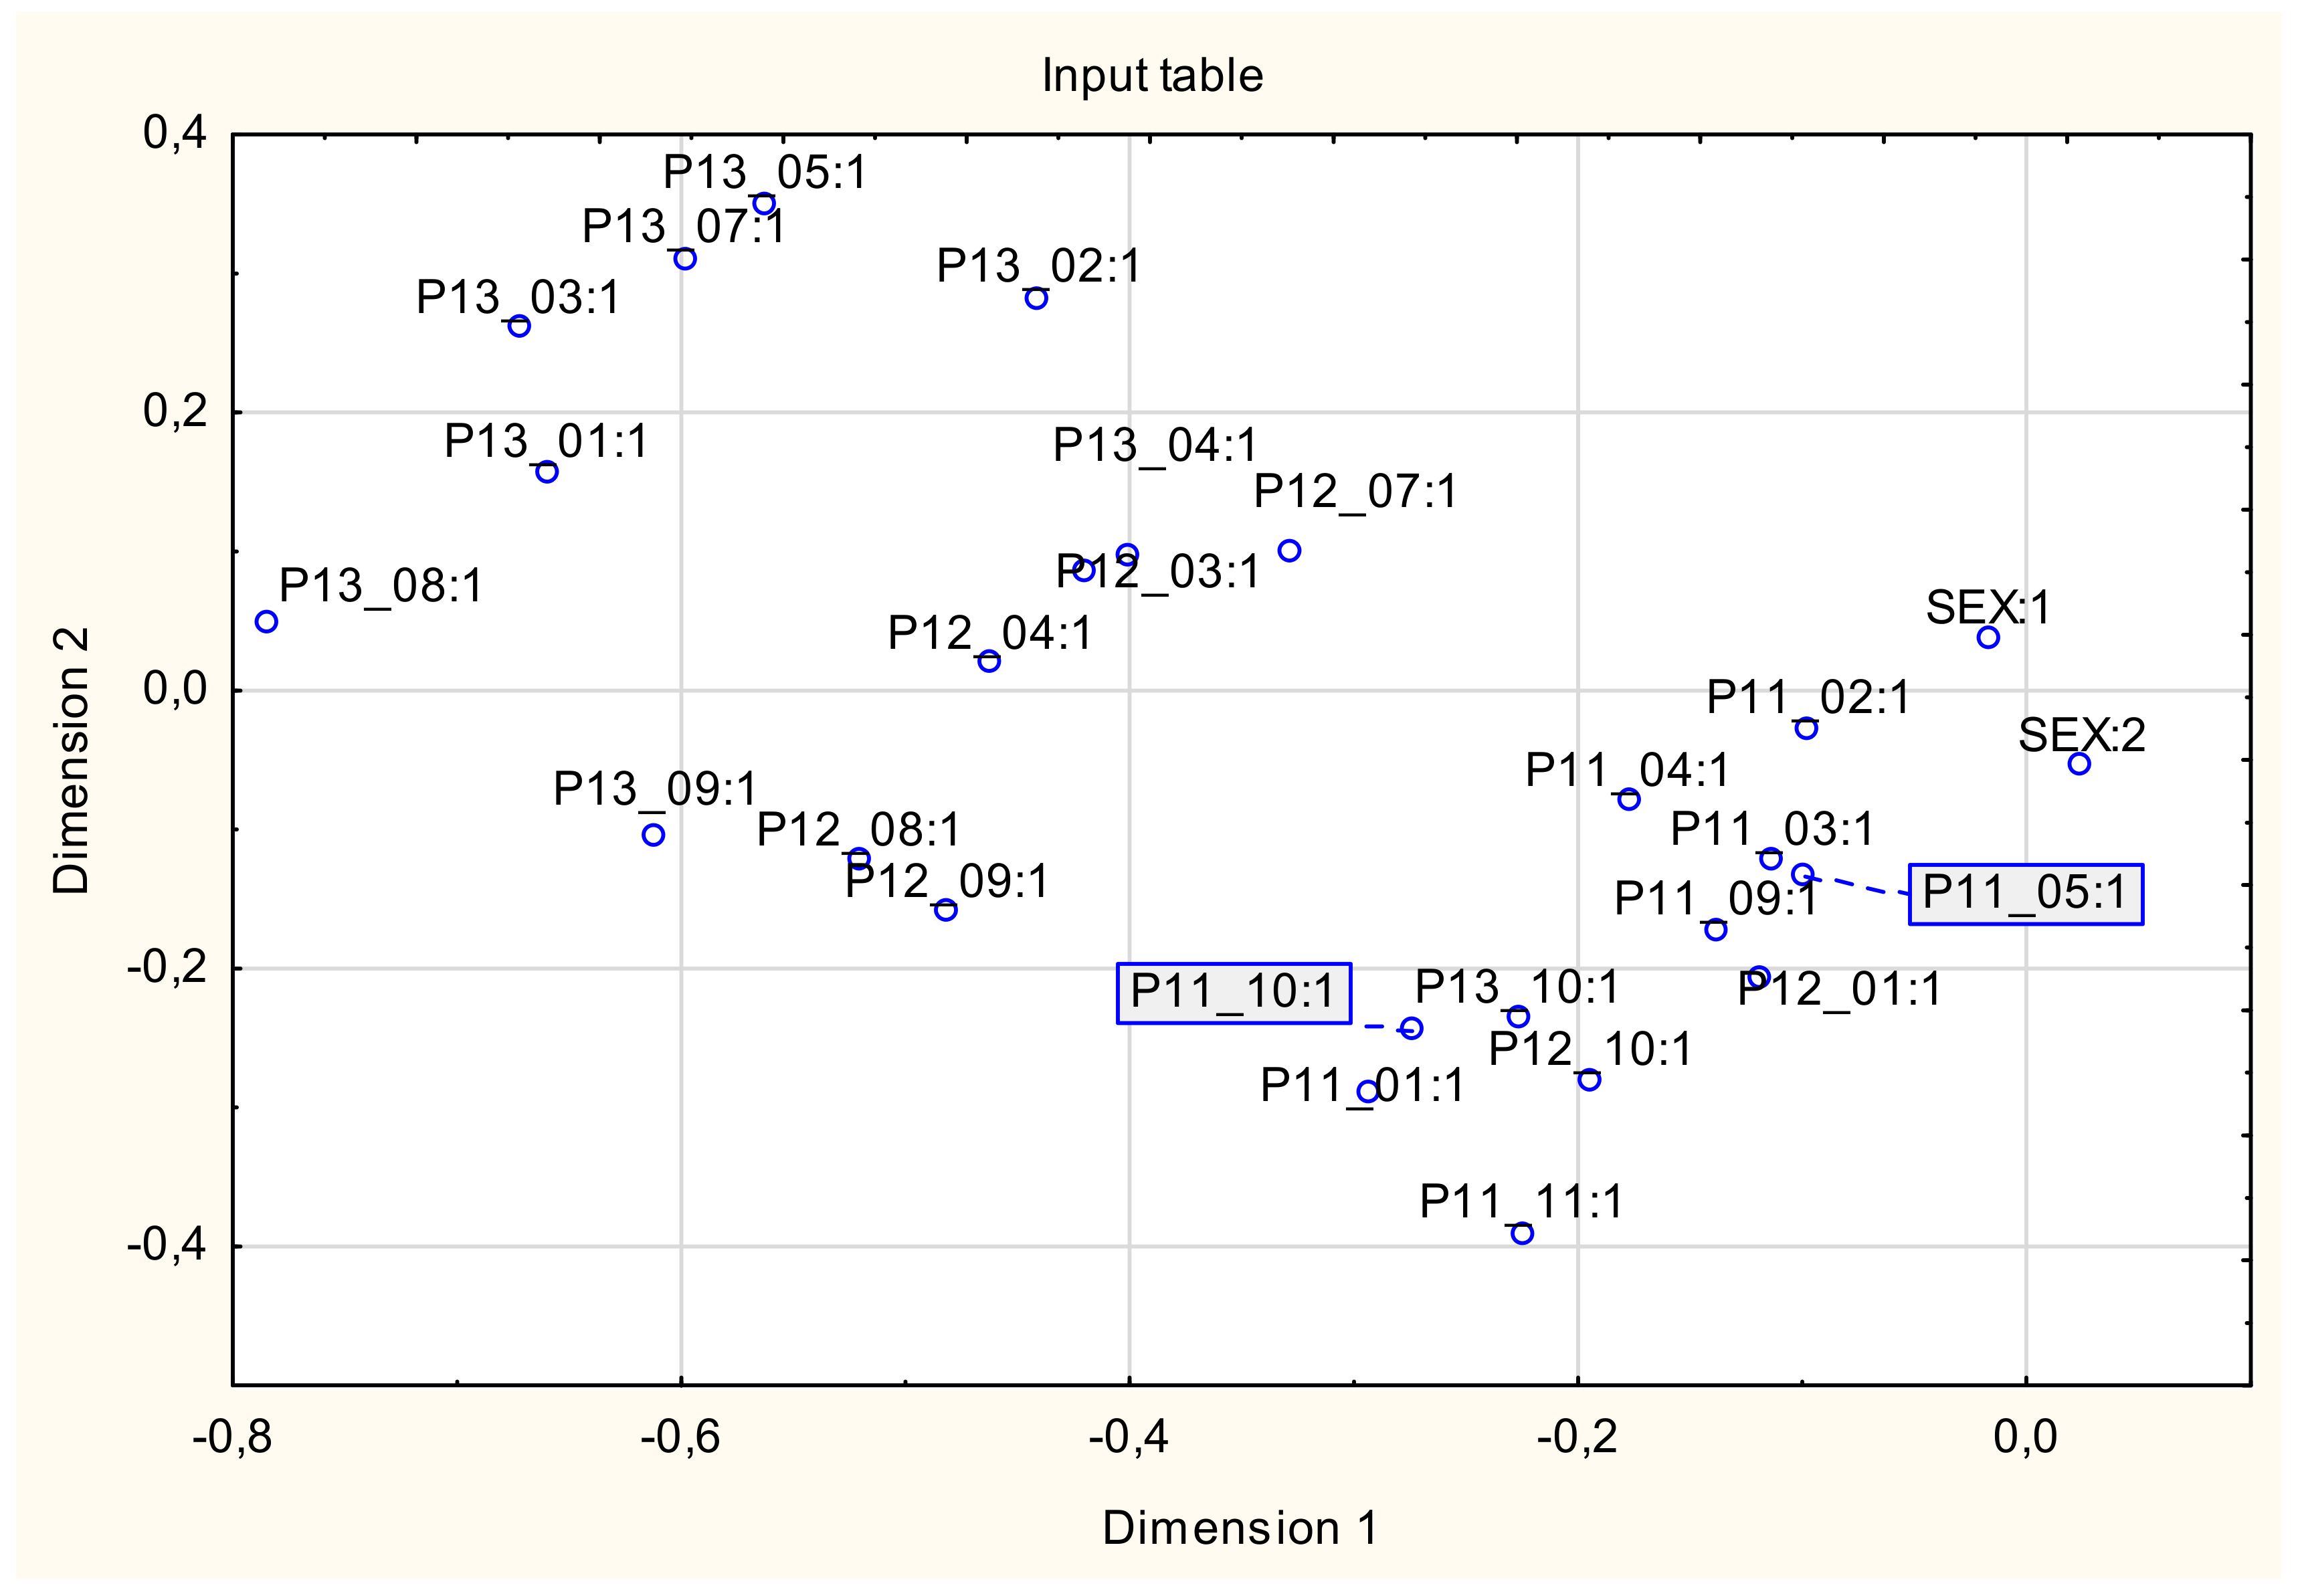
- Both men (SEX 1) and women (SEX 2) believe that the amount of the fixed part of remuneration should be influenced by elements such as work efficiency (P11_02:1), education (P11_03: 1), seniority in the current place of employment (P11_04:1), position in the hierarchy of the position held (P11_05:1), as well as the level of wages in the labor market (P11_09:1).
- People aged 60 and over with vocational education incline to the opinion that the amount of the fixed part of remuneration should be influenced by collective labor agreements (P11_10: 1). This group is inclined to the same opinion in the case of the variable part of remuneration (P12_09:1) and additional benefits (P13_09:1).
Author Contributions
Funding
Institutional Review Board Statement
Informed Consent Statement
Data Availability Statement
Conflicts of Interest
References
- Beck-Krala, E. Wynagrodzenia Pracowników w Organizacji: Teoria i Praktyka; Wydawnictwo AGH: Kraków, Poloand, 2013; pp. 3–4. [Google Scholar]
- Staňková, M. Analysis of remuneration systems in small and medium enterprises. Acta Univ. Agric. Silvic. Mendel. Brun. 2010, 58, 473–482. [Google Scholar] [CrossRef] [Green Version]
- Malambe, L.; Bussin, M. Short-term incentive schemes for hospital managers. SA J. Hum. Resour. Manag. 2013, 11. [Google Scholar] [CrossRef]
- Prince, J.B.; Lawler, E.E. Does salary discussion hurt the developmental performance appraisal? Organ. Behav. Hum. Decis. Process. 1986, 37, 357–376. [Google Scholar] [CrossRef]
- Delery, J.; Gupta, N.; Shaw, J.; Jenkins, G.D.; Ganster, D. Unionization, compensation, and voice effects on quits and retention. Ind. Relat. 2000, 39, 625–646. [Google Scholar] [CrossRef]
- Rynes, S.L.; Gerhart, B.; Minette, K.A. The importance of pay in employee motivation: Discrepancies between what people say and what they do. Hum. Resour. Manag. 2004, 43, 381–394. [Google Scholar] [CrossRef] [Green Version]
- Rynes, S.L.; Gerhart, B.; Parks, L. Personnel Psychology: Performance Evaluation and Pay for Performance. Annu. Rev. Psychol. 2005, 56, 571–600. [Google Scholar] [CrossRef] [Green Version]
- Shaw, J.D. Pay Dispersion. Annu. Rev. Organ. Psychol. Organ. Behav. 2014, 1, 521–544. [Google Scholar] [CrossRef] [Green Version]
- Li, Z.; Daspit, J.J.; Marler, L.E. Executive pay dispersion: Reconciling the differing effects of pay inequality and pay inequity on firm performance. Int. J. Hum. Resour. Manag. 2021. [Google Scholar] [CrossRef]
- Borkowska, S. Skuteczne Strategie Wynagrodzeń—Tworzenie i Zastosowanie; Oficyna Wolters Kluwer: Warszawa, Poland, 2012; pp. 72–74. [Google Scholar]
- Thierry, H.; de Jong, J.R. Job Evaluation. In Handbook of Work and Organizational Psychology; Drenth, J.D., Thierry, H., de Wolff, C.H., Eds.; Publisher Psychology Press ltd.: East Sussex, UK, 1998. [Google Scholar]
- Juchnowicz, M.; Sienkiewicz, Ł. Jak Oceniać Pracę? Wartość Stanowiska i Kompetencji; Difin: Warszawa, Poloand, 2006. [Google Scholar]
- Armstrong, M. Job Evaluation Handbook: A Guide to Achieving Fairness and Transparency in Pay and Reward; Kogan Page: London, UK, 2018. [Google Scholar]
- El-Hajji, M.A. The hay system of job evaluation: A critical analysis. J. Hum. Resour. Manag. Labor Stud. 2015, 3, 1–22. [Google Scholar] [CrossRef] [Green Version]
- Hay, E.N.; Purves, D. A New Method of Job Evaluation: The Guide—Profile Method. Pers. Am. Manag. Assoc. 1954, 31, 72–80. [Google Scholar]
- Hay, E.N.; Purves, D. The Profile Method of High-level Job Evaluation. Personnel 1951, 28, 162–170. [Google Scholar]
- Heneman, R.L.; Ledford, G.E., Jr. Competency Pay for Professionals and Managers in Business: A Review and Implications for Teachers. J. Pers. Eval. Educ. 1998, 12, 103–121. [Google Scholar] [CrossRef]
- Risher, H. Compensating Today’s Technical Professional. Res. Technol. Manag. 2000, 43, 50–56. [Google Scholar] [CrossRef]
- Wirtz, B.W. Business Models, Value Chains and Competencies in Media Markets—A Service System Perspective. Palabra Clave 2014, 17, 1041–1065. [Google Scholar] [CrossRef]
- Gupta, R. Salary and satisfaction: Private-public sectors in J&K. J. Indian Manag. 2011, 8, 71–77. [Google Scholar]
- Chaudhry, M.S.; Sabir, H.M.; Rafi, N.; Kalyar, M.N. Exploring the relationship between salary satisfaction and job satisfaction: A comparison of public and private sector organizations. J. Commer. 2011, 3, 1–14. [Google Scholar]
- Przychodzen, W.; Gómez-Bezares, F. CEO–Employee Pay Gap, Productivity and Value Creation. J. Risk Financ. Manag. 2021, 14, 196. [Google Scholar] [CrossRef]
- Banker, R.D.; Bu, D.; Mehta, M.N. Pay gap and performance in China. Abacus 2016, 52, 501–531. [Google Scholar] [CrossRef]
- Kovačević, M.; Blagojević, S.; Kuzmanović, B. Sustainability of the Motivation Policy Model for Employees in State Administration. Sustainability 2020, 12, 7974. [Google Scholar] [CrossRef]
- Fujisawa, R.; Lafortune, G. The Remuneration of General Practicioners and Specialists in 14 OECD Countries: What are Ten Factors Influencing Variations Across Countries? OECD Health Working Papers No. 41. 2008. Available online: https://ideas.repec.org/p/oec/elsaad/41-en.html (accessed on 24 September 2021).
- Adams, J.S. Towards an Understanding of Inequity. J. Abnorm. Soc. Psychol. 1963, 67, 422–436. [Google Scholar] [CrossRef] [PubMed]
- Xiong, M.; Xiao, L.; Ye, Y. Relative Deprivation and Prosocial Tendencies in Chinese Migrant Children: Testing an Integrated Model of Perceived Social Support and Group Identity. Front. Psychol. 2021, 8, 658007. [Google Scholar] [CrossRef] [PubMed]
- Herrera, J.; De Las Heras-Rosas, C. The Organizational Commitment in the Company and Its Relationship with the Psychological Contract. Front. Psychol. 2021, 14, 609211. [Google Scholar] [CrossRef] [PubMed]
- Maslow, A.H. A theory of human motivation. Psychol. Rev. 1943, 50, 370–396. [Google Scholar] [CrossRef] [Green Version]
- Herzberg, F.I. Work and the Nature of Man; World Publishing Company: Cleveland, OH, USA, 1966. [Google Scholar]
- Vroom, V.H. Management and Motivation; Penguin: London, UK, 1989. [Google Scholar]
- Stringer, C.; Didham, J.; Theivananthampillai, P. Motivation, pay satisfaction, and job satisfaction of front-line employees. Qual. Res. Account. Manag. 2011, 8, 161–179. [Google Scholar] [CrossRef]
- Syptak, J.M.; Marsland, D.W.; Ulmer, D. Job Satisfaction: Putting Theory into Practice. Fam. Pract. Manag. 1999, 6, 26–30. [Google Scholar]
- Green, C.; Heywood, J.S. Does Performance Pay Increase Job Satisfaction? Economica 2008, 75, 710–728. [Google Scholar] [CrossRef] [Green Version]
- Long, C.S.; Xuan, S.S. Human Resources Development Practices and Employees’ Job Satisfaction. Social Issues in the Workplace; IGI Global: Hershey, PA, USA, 2018; pp. 380–392. [Google Scholar] [CrossRef]
- Trotter, R.G.; Zacur, S.R.; Stickney, L.T. The new age of pay transparency. Bus. Horiz. 2017, 60, 529–539. [Google Scholar] [CrossRef]
- Heisler, W. Increasing pay transparency: A guide for change. Bus. Horiz. 2021, 64, 73–81. [Google Scholar] [CrossRef]
- Rostkowski, T.; Wasilewski, J. Modele narracji o sprawiedliwości systemu wynagradzania. Edukacja Ekonomistów i Menedżerów 2018, 49, 99–127. [Google Scholar] [CrossRef]
- Tahir, U. Impact of Salary Structure, Employee Perception and Working Conditions on the Organizational Commitment in SME. Eur. J. Bus. Manag. 2016, 8, 2222–2839. [Google Scholar]
- Bussin, M.; Deon, H. Factors Driving Changes to Remuneration Policy and Outcomes. J. Hum. Resour. Manag. 2004, 2, 45–54. [Google Scholar] [CrossRef]
- Amin, J.M.; Kamarudin, K.A.; Ismail, W.A.W.; Sarman, S.R. What determines directors’ remuneration in Malaysia? In Recent Trends in Social and Behaviour Sciences, 1st ed.; Gaol, F.L., Kadry, S., Taylor, M., Li, P.S., Eds.; Taylor and Francis: London, UK, 2014. [Google Scholar] [CrossRef]
- Rouziès, D.; Coughlan, A.T.; Anderson, E.; Iacobucci, D. Determinants of Pay Levels and Structures in Sales Organizations. J. Mark. 2009, 73, 92–104. [Google Scholar] [CrossRef] [Green Version]
- Schrock, W.A.; Zhao, Y.; Richards, K.A.; Hughes, D.E.; Amin, M.S. On the nature of international sales and sales management research: A social network–analytic perspective. J. Pers. Sell. Sales Manag. 2018, 38, 56–77. [Google Scholar] [CrossRef]
- Ren, T.; Fang, R.; Yang, Z. The impact of pay-for-performance perception and pay level satisfaction on employee work attitudes and extra-role behaviors: An investigation of moderating effects. J. Chin. Hum. Resour. Manag. 2017, 8, 94–113. [Google Scholar] [CrossRef]
- Abdi, H. Multivariate analysis. In Encyclopedia for Research Methods for the Social Sciences; Lewis-Beck, M., Bryman, A., Futing, T., Eds.; Sage: Thousand Oaks, CA, USA, 2003; pp. 699–702. [Google Scholar]
- Abdi, H.; Valentin, D. Multiple correspondence analysis. In Encyclopedia of Measurement and Statistics; Salkind, N.J., Ed.; Sage: Thousand Oaks, CA, USA, 2007; pp. 651–657. [Google Scholar]
- Abdi, H.; Williams, L.J.; Valentin, D. Multiple factor analysis: Principal component analysis for multi-table and multi-block data sets. Wiley Interdiscip. Rev. Comput. Stat. 2012, 5, 149–179. [Google Scholar] [CrossRef]
- Greenacre, M.J. Correspondence Analysis in Practice, 2nd ed.; Chapman & Hall/CRC: Boca Raton, FL, USA, 2007. [Google Scholar]
- Hwang, H.; Tomiuk, M.A.; Takane, Y. Correspondence analysis, multiple correspondence analysis and recent developments. In Handbook of Quantitative Methods in Psychology; Millsap, R., Maydeu-Olivares, A., Eds.; Sage: London, UK, 2010. [Google Scholar]
- Kroonenberg, P.M.; Greenacre, M. Correspondence Analysis. Wiley Interdiscip. Rev. Comput. Stat. 2004, 5, 613–619. [Google Scholar] [CrossRef]
- Rozmus, D. Analiza korespondencji. In Metody Statystycznej Analizy Wielowymiarowej w Badaniach Marketingowych; Gatnar, E., Walesiak, M., Eds.; Wydawnictwo Akademii Ekonomicznej im. Oskara Langego we Wrocławiu: Wrocław, Poland, 2004; pp. 285–302. [Google Scholar]
- Szopik-Depczyńska, K.; Dembińska, I.; Barczak, A.; Kędzierska-Szczepaniak, A.; Szczepaniak, K.; Depczyński, R.; Ioppolo, G. Does Crowdsourcing as Part of User-Driven Innovation Activity Affect Its Results? An Empirical Analysis of R&D Departments in Poland. Energies 2021, 14, 5809. [Google Scholar] [CrossRef]
- Szopik-Depczyńska, K.; Barczak, A.; Dembińska, I.; Wisniewska, J. The Impact of the Internet on User-Driven Innovation Usage in R&D Departments: A Case Study of Poland. Eur. Res. Stud. J. 2020, XXIII, 247–263. [Google Scholar] [CrossRef]
- Barczak, A.; Dembińska, I.; Marzantowicz, Ł. Analysis of the Risk Impact of Implementing Digital Innovations for Logistics Management. Processes 2019, 7, 815. [Google Scholar] [CrossRef] [Green Version]
- Barczak, A. The Expectations of the Residents of Szczecin in the Field of Telematics Solutions after the Launch of the Szczecin Metropolitan Railway. Information 2021, 12, 339. [Google Scholar] [CrossRef]
- Stanimir, A. Wykorzystanie Analizy Korespondencji w Badaniach Marketingowych. Zastosowania Metod Statystycznych w Badaniach Naukowych III; StatSoft Polska: Kraków, Poland, 2008; p. 337. [Google Scholar]
- Álvarez de Toledo, P.; Núñez, F.; Usabiaga, C. Matching in segmented labor markets: An analytical proposal based on high-dimensional contingency tables. Econ. Model. 2020, 93, 175–186. [Google Scholar] [CrossRef]
- Strenitzerová, M.; Achimský, K. Employee Satisfaction and Loyalty as a Part of Sustainable Human Resource Management in Postal Sector. Sustainability 2019, 11, 4591. [Google Scholar] [CrossRef] [Green Version]
- Clark, A.E. Job satisfaction and gender: Why are women so happy at work? Labour Econ. 1997, 4, 341–372. [Google Scholar] [CrossRef]
- Săveanu, T.; Săveanu, S.M. Do we really hate our jobs? Determinants of determinants of job satisfaction in Romania. Ann. Fac. Econ. 2011, 1, 723–729. [Google Scholar]
- Yousef, D.A. Organizational Commitment: A Mediator of the Relationships of Leadership Behavior with Job Satisfaction and Performance in a Non-Western Country. J. Manag. Psychol. 2000, 15, 6–24. [Google Scholar] [CrossRef]
- Mazurkiewicz, K. Analiza związku wynagrodzenia z efektywnością prowadzonej działalności gospodarczej przedsiębiorstw–Ujęcie sektorowe i sekcyjne. Zeszyty Naukowe Małopolskiej Wyższej Szkoły Ekonomicznej w Tarnowie 2019, 44, 121–130. [Google Scholar] [CrossRef]
- Dembińska, I. Analysis of the competency’s Polish logistics managers in the light of research. Ann. Oradea Univ. Fascicle Manag. Technol. Eng. 2013, 1, 71–74. [Google Scholar] [CrossRef]
- Hedija, V. Sector-specific gender pay gap: Evidence from the European Union Countries. Econ. Res. 2017, 30, 1804–1819. [Google Scholar] [CrossRef] [Green Version]
- Campos, M.M.; Depalo, D.; Papapetrou, E.; Perez, J.J.; Ramos, R. Understanding the public sector pay gap. IZA J. Labor Policy 2017, 6, 7. [Google Scholar] [CrossRef] [Green Version]
- Garcia-Perez, J.I.; Jimeno, J.F. Public sector wage gaps in Spanish regions. Manch. Sch. 2007, 75, 501–531. [Google Scholar] [CrossRef]
- Kirk, K. How Much Do Energy Industry Jobs Pay? A Look at the Data. 2021. Available online: https://yaleclimateconnections.org/2021/09/how-much-do-energy-industry-jobs-pay-a-look-at-the-data/ (accessed on 19 October 2021).

| Pairs of Questions | Statistic χ2 and Probabilities | |
|---|---|---|
| Sex | P10—remuneration should consist of | 59.3649 [0.0000] |
| P11_01—the amount of the fixed part of the remuneration should result from the assessment of the immediate supervisor | 56.2294 [0.0000] | |
| P11_02—the amount of the fixed part of the remuneration should result from work efficiency | 49.6077 [0.0000] | |
| P11_03—the amount of the fixed part of the salary should result from education | 56.6999 [0.0000] | |
| P11_04—the amount of the fixed part of the remuneration should result from the length of service in the current company | 49.1983 [0.0000] | |
| P11_05—the amount of the fixed part of the remuneration should result from the position in the hierarchy of the position held | 57.6528 [0.0000] | |
| P11_06—the amount of the fixed part of the salary should result from skills/knowledge | 51.2259 [0.0000] | |
| P11_07—the amount of the fixed part of the remuneration should result from the family situation | 51.7836 [0.0000] | |
| P11_08—the amount of the fixed part of the remuneration should result from the license and professional qualifications | 52.2075 [0.0000] | |
| P11_09—the amount of the fixed part of the remuneration should result from the level of remuneration in the labor market | 50.1141 [0.0000] | |
| P11_10—the amount of the fixed part of remuneration should result from collective labor agreements | 52.0606 [0.0000] | |
| P11_11—the amount of the fixed part of the remuneration should result from the company’s financial condition | 54.9032 [0.0000] | |
| P12_01—the amount of the variable part of the salary (the so-called bonus) should result from the assessment of the immediate supervisor | 50.8298 [0.0000] | |
| P12_02—the amount of the variable part of remuneration (the so-called bonus) should result from work efficiency | 50.3479 [0.0000] | |
| P12_03—the amount of the variable part of remuneration (the so-called bonus) should result from the length of service in the current company | 49.4863 [0.0000] | |
| P12_04—the amount of the variable part of the salary (the so-called bonus) should result from the position in the hierarchy of the position held | 49.2088 [0.0000] | |
| P12_05—the amount of the variable part of remuneration (the so-called bonus) should result from skills/knowledge | 49.4234 [0.0000] | |
| P12_06—the amount of the variable part of the salary (the so-called bonus) should result from the family situation | 49.4504 [0.0000] | |
| P12_07—the amount of the variable part of remuneration (the so-called bonus) should result from the license and professional qualifications | 52.2424 [0.0000] | |
| P12_08—the amount of the variable part of the salary (the so-called bonus) should result from the level of salaries in the labor market | 53.8284 [0.0000] | |
| P12_09—the amount of the variable part of remuneration (the so-called bonus) should result from collective labor agreements | 55.4769 [0.0000] | |
| P12_10—the amount of the variable part of the remuneration (the so-called bonus) should result from the financial condition of the company | 49.0709 [0.0000] | |
| P13_01—the amount of additional benefits (e.g., company car, private medical care) should result from the assessment of the immediate superior | 52.6768 [0.0000] | |
| P13_02—the amount of additional benefits (e.g., company car, private medical care) should result from work efficiency | 51.3618 [0.0000] | |
| P13_03—the amount of additional benefits (e.g., company car, private medical care) should result from the internship in the current company | 49.4968 [0.0000] | |
| P13_04—the amount of additional benefits (e.g., company car, private medical care) should result from the position in the hierarchy of the position held | 50.2859 [0.0000] | |
| P13_05—the amount of additional benefits (e.g., company car, private medical care) should result from skills/knowledge | 49.6081 [0.0000] | |
| P13_06 —the amount of additional benefits (e.g., company car, private medical care) should result from the family situation | 49.2375 [0.0000] | |
| P13_07—the amount of additional benefits (e.g., company car, private medical care) should result from the license and professional qualifications | 49.6235 [0.0000] | |
| P13_08—the amount of additional benefits (e.g., company car, private medical care) should result from the level of remuneration in the labor market | 52.8803 [0.0000] | |
| P13_09—the amount of additional benefits (e.g., company car, private medical care) should result from collective labor agreements | 49.4562 [0.0000] | |
| P13_10—the amount of additional benefits (e.g., company car, private medical care) should result from the company’s financial condition | 52.3487 [0.0000] | |
| Pairs of Questions | Statistic χ2 and Probabilities | |
|---|---|---|
| Age | P10 - remuneration should consist of | 704.3673 [0.0000] |
| P11_01—the amount of the fixed part of the remuneration should result from the assessment of the immediate supervisor | 695.3203 [0.0000] | |
| P11_02—the amount of the fixed part of the remuneration should result from work efficiency | 702.7950 [0.0000] | |
| P11_03—the amount of the fixed part of the salary should result from education | 713.8751 [0.0000] | |
| P11_04—the amount of the fixed part of the remuneration should result from the length of service in the current company | 693.9274 [0.0000] | |
| P11_05—the amount of the fixed part of the remuneration should result from the position in the hierarchy of the position held | 708.2438 [0.0000] | |
| P11_06—the amount of the fixed part of the salary should result from skills/knowledge | 693.4020 [0.0000] | |
| P11_07—the amount of the fixed part of the remuneration should result from the family situation | 697.5720 [0.0000] | |
| P11_08—the amount of the fixed part of the remuneration should result from the license and professional qualifications | 693.4843 [0.0000] | |
| P11_09—the amount of the fixed part of the remuneration should result from the level of remuneration in the labor market | 689.4919 [0.0000] | |
| P11_10—the amount of the fixed part of remuneration should result from collective labor agreements | 699.0921 [0.0000] | |
| P11_11—the amount of the fixed part of the remuneration should result from the company’s financial condition | 739.1309 [0.0000] | |
| P12_01—the amount of the variable part of the salary (the so-called bonus) should result from the assessment of the immediate supervisor | 697.3434 [0.0000] | |
| P12_02—the amount of the variable part of remuneration (the so-called bonus) should result from work efficiency | 696.4855 [0.0000] | |
| P12_03—the amount of the variable part of remuneration (the so-called bonus) should result from the length of service in the current company | 710.3193 [0.0000] | |
| P12_04—the amount of the variable part of the salary (the so-called bonus) should result from the position in the hierarchy of the position held | 690.0976 [0.0000] | |
| P12_05—the amount of the variable part of remuneration (the so-called bonus) should result from skills/knowledge | 694.5374 [0.0000] | |
| P12_06—the amount of the variable part of the salary (the so-called bonus) should result from the family situation | 692.7245 [0.0000] | |
| P12_07—the amount of the variable part of remuneration (the so-called bonus) should result from the license and professional qualifications | 704.8206 [0.0000] | |
| P12_08—the amount of the variable part of the salary (the so-called bonus) should result from the level of salaries in the labor market | 695.5331 [0.0000] | |
| P12_09—the amount of the variable part of remuneration (the so-called bonus) should result from collective labor agreements | 711.8998 [0.0000] | |
| P12_10—the amount of the variable part of the remuneration (the so-called bonus) should result from the financial condition of the company | 715.4453 [0.0000] | |
| P13_01—the amount of additional benefits (e.g., company car, private medical care) should result from the assessment of the immediate superior | 695.5007 [0.0000] | |
| P13_02—the amount of additional benefits (e.g., company car, private medical care) should result from work efficiency | 696.3688 [0.0000] | |
| P13_03—the amount of additional benefits (e.g., company car, private medical care) should result from the internship in the current company | 691.5819 [0.0000] | |
| P13_04—the amount of additional benefits (e.g., company car, private medical care) should result from the position in the hierarchy of the position held | 703.0117 [0.0000] | |
| P13_05—the amount of additional benefits (e.g., company car, private medical care) should result from skills/knowledge | 690.7300 [0.0000] | |
| P13_06—the amount of additional benefits (e.g., company car, private medical care) should result from the family situation | 693.7703 [0.0000] | |
| P13_07—the amount of additional benefits (e.g., company car, private medical care) should result from the license and professional qualifications | 692.2313 [0.0000] | |
| P13_08—the amount of additional benefits (e.g., company car, private medical care) should result from the level of remuneration in the labor market | 690.4739 [0.0000] | |
| P13_09—the amount of additional benefits (e.g., company car, private medical care) should result from collective labor agreements | 695.7477 [0.0000] | |
| P13_10—the amount of additional benefits (e.g., company car, private medical care) should result from the company’s financial condition | 704.6803 [0.0000] | |
| Pairs of Questions | Statistic χ2 and Probabilities | |
|---|---|---|
| Education | P10—remuneration should consist of | 178.2186 [0.0000] |
| P11_01—the amount of the fixed part of the remuneration should result from the assessment of the immediate supervisor | 156.0352 [0.0000] | |
| P11_02—the amount of the fixed part of the remuneration should result from work efficiency | 171.4600 [0.0000] | |
| P11_03—the amount of the fixed part of the salary should result from education | 156.0894 [0.0000] | |
| P11_04—the amount of the fixed part of the remuneration should result from the length of service in the current company | 158.3929 [0.0000] | |
| P11_05—the amount of the fixed part of the remuneration should result from the position in the hierarchy of the position held | 162.5205 [0.0000] | |
| P11_06—the amount of the fixed part of the salary should result from skills/knowledge | 150.8086 [0.0000] | |
| P11_07—the amount of the fixed part of the remuneration should result from the family situation | 224.9362 [0.0000] | |
| P11_08—the amount of the fixed part of the remuneration should result from the license and professional qualifications | 141.2188 [0.0000] | |
| P11_09—the amount of the fixed part of the remuneration should result from the level of remuneration in the labor market | 143.9158 [0.0000] | |
| P11_10—the amount of the fixed part of remuneration should result from collective labor agreements | 166.5771 [0.0000] | |
| P11_11—the amount of the fixed part of the remuneration should result from the company’s financial condition | 149.0056 [0.0000] | |
| P12_01—the amount of the variable part of the salary (the so-called bonus) should result from the assessment of the immediate supervisor | 145.4030 [0.0000] | |
| P12_02—the amount of the variable part of remuneration (the so-called bonus) should result from work efficiency | 140.9770 [0.0000] | |
| P12_03—the amount of the variable part of remuneration (the so-called bonus) should result from the length of service in the current company | 203.3143 [0.0000] | |
| P12_04—the amount of the variable part of the salary (the so-called bonus) should result from the position in the hierarchy of the position held | 158.3326 [0.0000] | |
| P12_05—the amount of the variable part of remuneration (the so-called bonus) should result from skills/knowledge | 177.4120 [0.0000] | |
| P12_06—the amount of the variable part of the salary (the so-called bonus) should result from the family situation | 176.7654 [0.0000] | |
| P12_07—the amount of the variable part of remuneration (the so-called bonus) should result from the license and professional qualifications | 208.0691 [0.0000] | |
| P12_08—the amount of the variable part of the salary (the so-called bonus) should result from the level of salaries in the labor market | 172.6457 [0.0000] | |
| P12_09—the amount of the variable part of remuneration (the so-called bonus) should result from collective labor agreements | 177.4111 [0.0000] | |
| P12_10—the amount of the variable part of the remuneration (the so-called bonus) should result from the financial condition of the company | 142.1100 [0.0000] | |
| P13_01—the amount of additional benefits (e.g., company car, private medical care) should result from the assessment of the immediate superior | 160.1367 [0.0000] | |
| P13_02—the amount of additional benefits (e.g., company car, private medical care) should result from work efficiency | 169.0443 [0.0000] | |
| P13_03—the amount of additional benefits (e.g., company car, private medical care) should result from the internship in the current company | 179.4261 [0.0000] | |
| P13_04—the amount of additional benefits (e.g., company car, private medical care) should result from the position in the hierarchy of the position held | 151.8898 [0.0000] | |
| P13_05—the amount of additional benefits (e.g., company car, private medical care) should result from skills/knowledge | 180.7753 [0.0000] | |
| P13_06—the amount of additional benefits (e.g., company car, private medical care) should result from the family situation | 170.8973 [0.0000] | |
| P13_07—the amount of additional benefits (e.g., company car, private medical care) should result from the license and professional qualifications | 176.9970 [0.0000] | |
| P13_08—the amount of additional benefits (e.g., company car, private medical care) should result from the level of remuneration in the labor market | 178.4516 [0.0000] | |
| P13_09—the amount of additional benefits (e.g., company car, private medical care) should result from collective labor agreements | 179.4310 [0.0000] | |
| P13_10—the amount of additional benefits (e.g., company car, private medical care) should result from the company’s financial condition | 143.1539 [0.0000] | |
Publisher’s Note: MDPI stays neutral with regard to jurisdictional claims in published maps and institutional affiliations. |
© 2021 by the authors. Licensee MDPI, Basel, Switzerland. This article is an open access article distributed under the terms and conditions of the Creative Commons Attribution (CC BY) license (https://creativecommons.org/licenses/by/4.0/).
Share and Cite
Barczak, A.; Dembińska, I.; Rostkowski, T.; Szopik-Depczyńska, K.; Rozmus, D. Structure of Remuneration as Assessed by Employees of the Energy Sector—Multivariate Correspondence Analysis. Energies 2021, 14, 7472. https://doi.org/10.3390/en14227472
Barczak A, Dembińska I, Rostkowski T, Szopik-Depczyńska K, Rozmus D. Structure of Remuneration as Assessed by Employees of the Energy Sector—Multivariate Correspondence Analysis. Energies. 2021; 14(22):7472. https://doi.org/10.3390/en14227472
Chicago/Turabian StyleBarczak, Agnieszka, Izabela Dembińska, Tomasz Rostkowski, Katarzyna Szopik-Depczyńska, and Dorota Rozmus. 2021. "Structure of Remuneration as Assessed by Employees of the Energy Sector—Multivariate Correspondence Analysis" Energies 14, no. 22: 7472. https://doi.org/10.3390/en14227472
APA StyleBarczak, A., Dembińska, I., Rostkowski, T., Szopik-Depczyńska, K., & Rozmus, D. (2021). Structure of Remuneration as Assessed by Employees of the Energy Sector—Multivariate Correspondence Analysis. Energies, 14(22), 7472. https://doi.org/10.3390/en14227472