1. Introduction
It is estimated that Europe will need investments of 350 billion euro to reach emission reduction in energy systems until 2030. An additional 130 billion euro will be required for achieving environmental objectives [
1]. The following decade and the decisions made in this field seem to be crucial for energetic transformation and managing environmental changes. Transforming traditional energy sources into green ones requires adequate investments and mobilizing funds for projects and technologies that contribute to the achievement of environmental goals. The scale of investment needs concerning the European Union climate objective caused the necessity to discuss what role banks should play in this process. Banks are the intermediary institutions channeling funds from savers to borrowers to facilitate business development and investment [
2]. Bank sustainability affects economic growth and business activities around the world [
3]. The new climate actions and challenges are becoming more and more critical. Thus, unsustainable investments and assets will probably remain deadlocked. As a result, the environmental regulations will be supplemented by sustainable and well-balanced financing. In the case of banks, sustainability means both the responsibility of the financial sector and banks’ performance, corporate governance, social, and environmental responsibility. The risks connected with the inadequate allocation of banks’ resources may result in the financial instability of the financial sector and influence enterprises and individuals. Additionally, banking system transformation, resulting from new technology adoption, causes an increase in banks’ energy consumption. All solutions incorporated into Banking 4.0, such as omnichannel banking, modular banking, open banking, smart banking, social media banking, and banking on the blockchain platforms [
4], influence banks’ energy usage. Still, globally, banks’ electricity consumption is more significant than the widely discussed Bitcoin network’s electricity usage [
5]. Both reasons cause the necessity to analyze how banks are prepared for energy challenges.
Banks’ role in achieving environmental objectives has been recognized relatively recently. However, commercial banks are aware of the necessity to match their portfolios to the Paris Agreement’s goals related to net-zero emissions. Banks’ Paris-aligned strategy should clarify to stakeholders what actions will be taken, as well as how and when they will change their relationships and offerings [
6]. Among others, such a strategy should include the procedures for collecting and managing data, setting goals of emissions reduction, monitoring energy use in the different kinds of divisions, including the energy aspects in credit policy and risk management, benchmarking clients’ emissions reduction performance, and preparing a clear policy for client engagement.
Today such information is usually presented in nonfinancial reports. They are commonly thought to be the primary communication tool used in building relationships with different stakeholders [
7,
8,
9]. An in-depth analysis of their content led to the conclusion that they may also be used for supporting ESG management, monitoring, and evaluation. To increase “the relevance, consistency, and comparability of information disclosed by certain large undertakings and groups across the Union”, the European Union (EU) introduced Directive 2014/95/EU (EU, 2014) in 2014 [
10,
11]. The commonly applied standards include the GRI [
12], ESG [
13], and SFDR [
14] recommendations. All of them incorporate energy into the environmental category.
The paper focuses on banks’ energy behavior related to those components and disclosed in nonfinancial reports. Banks’ energy behavior will be defined in the paper as energy-related activities aimed to reduce energy consumption, making them more efficient. As banks have not been obliged to present such data so far, the paper’s purpose is to analyze the ESC directive impact on disclosures of banks’ energy behavior, explicitly relating to behaviors towards energy use and its relationship with banks’ performance. Banks’ performance is measured by indexes referring to the banks’ characteristics, efficiency, and solvency. It addresses the following research questions:
RQ1: To what extent does the regulatory obligation impact the quantity and quality of banks’ nonfinancial disclosures related to energy?
RQ2: What is the relationship between banks’ energy behavior disclosed in nonfinancial reports and their performance?
The study develops a methodology that can provide an objective characteristic of banks’ energy behavior. The results are based on an analysis of the disclosures in nonfinancial reports retrieved from the Refinitiv Eikon database or presented in banks’ nonfinancial reports. The study has an exploratory and pilot character. To the best authors’ knowledge, it is the first study that sheds light on the role of banks in achieving energy goals, and which analyzes banks’ energy disclosures.
The paper includes five sections. The literature review follows the introduction and provides the ESG theoretical background with reference to energy disclosures. It is the foundation for hypothesis development. After that, the research methodology is explained. Then the results of the study and discussion are presented. The last section of the paper summarizes its contribution, addresses the research limitations, and suggests recommendations for future research.
2. Literature Review
Economies and societies’ financialization have made banks the main actors in the European financial market, taking into account financial institutions’ assets. Banks’ market activity impacts the functioning of other entities, such as firms and households. Both supporting other entities in achieving energy goals and the increased usage of energy caused by the banking sector, such as digitalization, make assessing banks’ energy behavior of critical importance.
Energy behavior in nonfinancial reporting standards is treated as an environmental category. Those standards establish guidelines to facilitate the execution of the organization’s reporting process. The most significant among them is the Global Reporting Initiative guidelines (GRI). The GRI guidelines contain rules and measures that enable designing a reporting system and preparing a report using quantified and comparable economic, environmental, and social results. Although they are currently one of the most popular reporting standards related to environmental, social, and governance issues, they are not the only standards supporting the disclosure of information about organizations’ nonfinancial activity. Other standards and documents that may be used in the process of nonfinancial reports’ preparation include the ISO norms concerning the social responsibility of organizations—CSR (ISO 26000), pro-environmental activities (ISO 14000), and the carbon footprint (ISO 14067)—as well as the SA8000 standard, the OECD guidelines, and a variety of industry guidelines (inter alia, for the fuel, automotive, clothing, or finance industries).
The European Union initiatives in this field resulted in implementing Directive 2014/95/EU. Following this directive, organizations can choose a minimum harmonization approach by providing at least a “package” of nonfinancial information considered unavoidable and comprehensive [
15]. According to the “comply or explain principle”, the data can be published in an annual report or separately. This principle represents an intermediate approach to regulation [
16]. As detailed rules and standards for collecting and processing the information were not presented, some authors pointed this out as a determinant of insignificant effects [
11,
17,
18,
19,
20,
21,
22]. In Poland, the directive’s requirements were also incorporated into the Act on Accounting in December 2016, at the minimum level [
23]. It should be noted that despite this, many companies operating in Poland implemented GRI standards voluntary before Directive 2014/95/EU came into force. Their number was significantly higher than in other former Eastern European Bloc countries [
24].
In 2019 the European Parliament and the European Council adopted the EU’s new regulation on environmental, social, and governance (ESG)-related disclosures in the financial services sector (the SFDR) [
25]. The SFDR aims to ensure that financial market participants, such as asset managers, financial advisors, and others, consider sustainability and ESG factors when making investment decisions and are disclosing such information about those investments. Article 4 of the SFDR undertakes financial market participants to inform on their websites how they incorporated ESG risks and their “principal adverse impacts” in investment decision-making and how they do the due diligence to understand those risks. Additionally, more detailed periodic disclosure regimes are also implemented. The SFDR mandatory obligations are combined with the risk of regulatory action, including fines. As a result, the SFDR will impose on banks’ new responsibilities.
Evidence can be found that companies under pressure disclose more information [
26,
27]. Based on the previous findings, in reference to the first research question, we formulated the first hypothesis:
Hypothesis 1 (H1). The regulatory obligation increased the quantity and quality of energy information disclosures.
Nowadays, conducting responsible business means involvement in achieving the Sustainable Development Goals (SDGs) specified by the United Nations in 2015 [
28] and obligating all nations. Banks should primarily promote and implement the SDGs as entities that significantly influence the whole economy and society. Their additional investments in environmental activities, such as reducing carbon emissions, using renewable energy, preventing air and water pollution, etc., disclosed in the reports, may increase banks’ expenditures and impact their performance. Many banks implemented environmental activities due to government requirements that need to be considered when evaluating the performance of listed firms [
29]. The question of whether banks’ energy behavior is related to satisfactory financial performance remains unanswered in the literature. The research conducted so far led to the conclusion that they instead focus on all environmental issues, and their findings varied. Some stated that environmentally friendly activities improved a bank’s financial performance [
29,
30,
31,
32]. Other studies proved the negative impact of disclosure of environmental activities on banks [
33,
34,
35]. To the best of the authors’ knowledge, this is the first attempt to focus on the energy issues disclosed by banks. Referring to research conducted in the industry, we posted the second hypothesis:
Hypothesis 2 (H2). There is a relationship between the quantity and quality of energy disclosures and bank performance.
The literature review led to the conclusion that the current surveys on nonfinancial reports were conducted in the management sciences from a resource theory perspective, referring to the employees and the company’s intellectual capital [
36,
37] in the context of communication with the stakeholders [
38,
39], in the context of tools for expanding the financial information reported by the companies to their stakeholders [
40,
41], as well as from the perspective of the stakeholder theory and the company legitimacy [
42,
43,
44]. The research presented in this article develops the issues of the stakeholder theory. It contributes to developing communication tools with the stakeholders, which help assess the impact of energy disclosures on banks’ performance.
3. Research Design and Methods
3.1. Research Design
The quality of the energy KPIs disclosures will be measured by the banks’ energy index designed for that purpose. The concept of developing the bank’s energy behavior (BEB) index may be used for banks operating in different countries, but in this paper, only Poland is depicted. The BEB index provides an aggregated measure that aims to assess the quality of energy KPIs disclosures.
First, the indicators that characterize the banks’ energy behavior were selected based on the GRI [
12], ESG [
13], and SFDR standards [
14]. The BEB index takes into account two perspectives—the quality of the disclosures, such as the bank’s quantitative (hard) energy behavior KPIs, and the narrative (soft) management items referring to the banks’ energy behavior (
Table 1). The division into hard and soft items was based on the typology presented in the literature and tested by Clarkson et al. [
45]. The hard disclosure includes information concerning energy usage, including renewable energy, and the ISO or EMS norms. The soft disclosures aim to present the importance of energy management in a bank’s strategy and operational policy. When presented clearly and in detail, they enable assessing both the quantity and quality of energy disclosures. Following Zarzycka and Krasodomska [
24], all items have the same significance. If adequate information is disclosed in the bank’s nonfinancial report, the item is valued at 1. If it is not available, its value equals 0. The index value is a ratio of all points granted for each item mentioned in the reports to the total number of points. Thus, the maximum index value is 1.
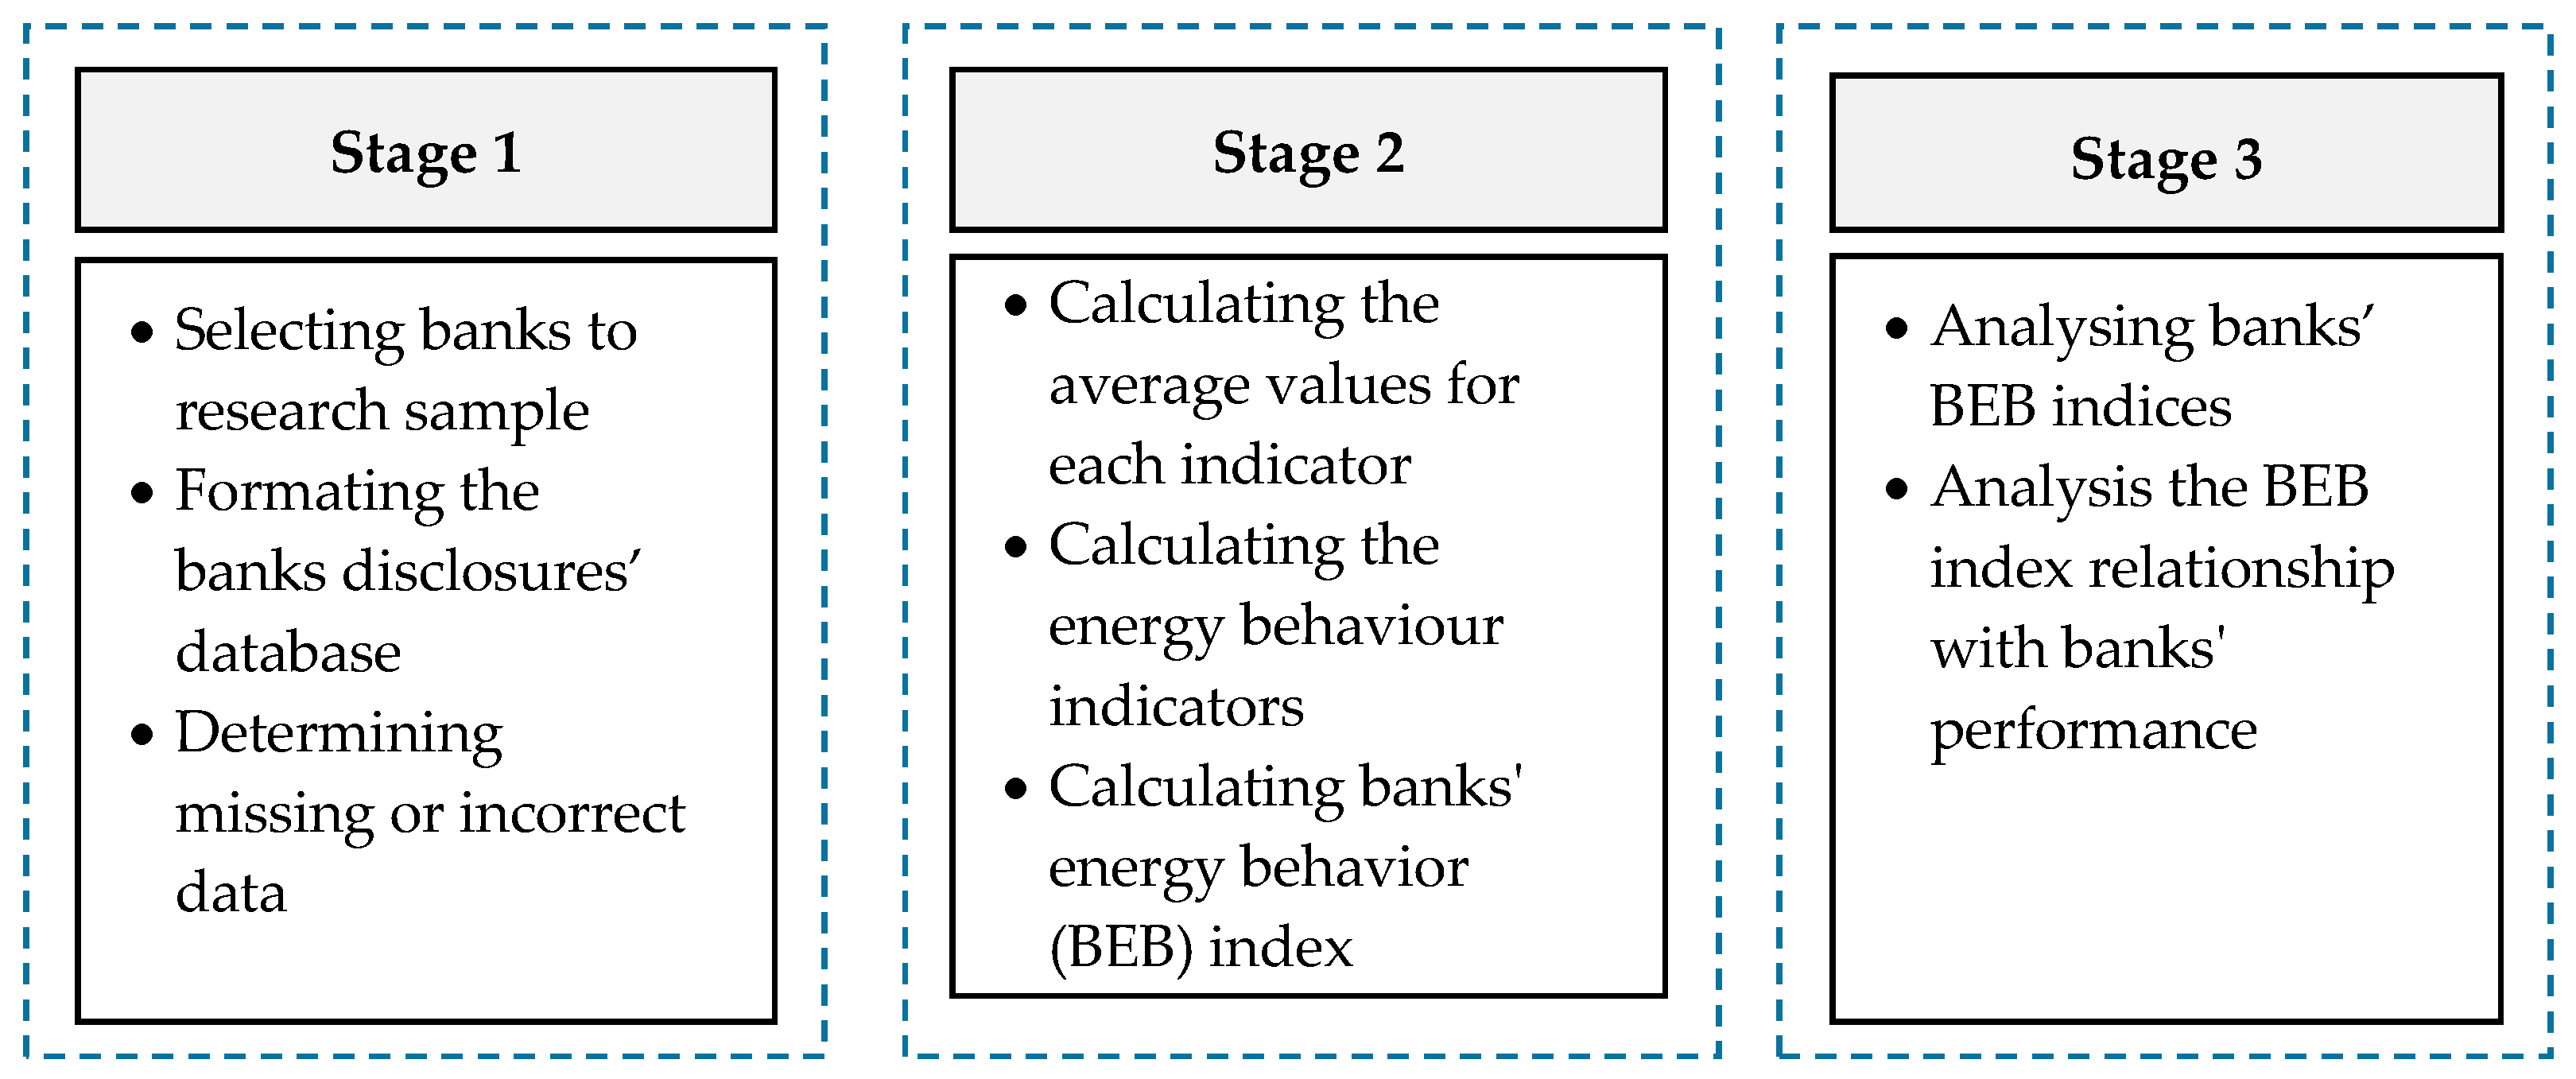
Schematically, the banks’ energy index calculation was carried out in several stages, adapting Stavytskyy [
46] to the banking market characteristics (
Figure 1).
To identify the banks subject to our analysis, we considered the Polish banks listed in the WIG-ESG index. A reliable reflection of the market situation by WIG-ESG-Index is provided through assigning appropriate weightings to shares in portfolios based on the adopted parameterization data. The parameterization data relate to numerical assessment (scoring) of the degree to which individual companies comply with the principles of responsible business in terms of the ESG (environment, social, and governance) areas [
47].
Data used to assess banks’ energy behavior (hard disclosures) were retrieved from nonfinancial reports available in the Refinitiv Eikon database. The Refinitiv Eikon database is an open-technology solution providing access to industry-leading data. Thomson Reuters launched it in 2010 as Eikon and transferred it into Refinitiv in 2018 [
48]. For the assessment of soft disclosure, nonfinancial reports available on banks’ websites were used. The analysis includes data for 2013, 2016, and 2019, which presents the state of a year before implementing new regulatory requirements concerning nonfinancial reporting. 2013 was the reference year for the period when there was no formal obligation to disclose ESG information. Although ESG reporting was not yet mandatory in Poland at the time, many companies disclosed nonfinancial data voluntarily before EU Directive 2014/95/EU was entirely enforced. The landmark year for Polish reporting was 2017, when the amendment to the Accounting Act came into force. Large companies, including banks, were required to disclose ESG-related data. Therefore, reports from 2016 were selected for the study as preceding the year when the amendment came into force. The last set of reports are from 2019, the last year before the pandemic. The data included in the reports still refer to the banks’ activities in the pre-pandemic environment, which makes the data collected from these three years comparable. 2019 was also a time when banks were already mandatorily reporting ESG indicators and a time when there was a discussion on the possibility and relevance of detailing the guidelines for mandatory reporting at the level of EU regulations.
The initial step of the empirical research included analyzing data retrieved from the Refinitiv Eikon database and performing a content analysis of the downloaded corporate reports. For coding, the information on the energy KPIs included in a nonfinancial statement were transferred to an observation sheet created in an Excel file. The content analysis of the reports focused not only on the type and number of nonfinancial KPIs disclosed but also on how they are disclosed. Each sampled bank was assessed manually by three independent researchers. Then, the obtained scores were compared, and the differences were discussed to agree with the final scoring. The co-authors performed the coding procedure from June 2021 to August 2021. After completing the coding process, the BEB index was calculated.
The BEB index value was used to assess the relationship between the banks’ energy behavior and their characteristics, profitability, and solvency. The characteristics refer to the banks’ size measured by assets, market share, and previous voluntary sustainability reporting. Banks’ profitability is measured by their return on equity (ROE), return on assets (ROA), cost to income ratio (CI), and net interest margin (NIM), while banks’ solvency is measured by the Tier 1 capital ratio (CET1) and total capital adequacy ratio (TCR).
Table 2 presents the indexes used for measuring banks’ profitability and solvency.
3.2. Sample Characteristic
The sample consists of commercial banks operating in the Polish banking market. In this paper, the term “commercial banks”, “bank”, or “credit institution” refers to banks established as joint-stock companies in Poland or one of the European Union countries. They offer a broad range of deposit, credit, and payment products for corporate entities, individual clients, and small and medium-sized enterprises. The number of commercial banks operating in the Polish banking market was 69 in 2016, 63 in 2016, and 62 in 2019. The authors selected as the sample set all banks included in the WIG-ESG index. Among them are the following commercial banks: Powszechna Kasa Oszczedności Bank Polski SA (PKOBP), Bank Polska Kasa Opieki SA (PEKAO), Santander (SANPL), ING Bank Śląski SA (INGBSK), mBank SA (MBANK), Bank Millenium SA (MILLENIUM), Alior Bank SA (ALIOR), and Bank Handlowy w Warszawie SA (HANDLOWY). The characteristics of the sample, including the size of the bank as well as performance and solvency ratios, are presented in
Table 3. Altogether, their assets represented 65.1% of total Polish banking sector assets. The financial data were retrieved from banks’ annual reports. If any information was not presented in the report, it is referred to as n/a in the table.
3.3. Methods
The assessment of the quality of the banks’ energy KPIs disclosure captured by the BEB index and the identification of determinants of the differences in the disclosures related to banks’ energy behavior required thorough data analysis, content analysis, descriptive statistics, linear regression, and selected statistical tests.
The energy disclosure index (BEB index) is an aggregated measure of the quantity and quality of KPIs disclosures communicated in banks’ nonfinancial reports. It enables to facilitate a cross-sectional disclosures analysis between them [
40]. Each item has the same significance. If the information is available, the item is valued at “1”, and if it is not available, its value is equal to “0”. The index is calculated as the ratio of the sum of the bank’s energy disclosures to the maximum number of disclosures, which is 16 (it can take the value from 0 to 1). The BEB index was calculated for 2013, 2016, and 2019.
The relationship between banks’ energy behavior and their characteristics, profitability, and solvency were analyzed using a regression model. Bank’s characteristic includes the banks’ size (SIZ) and market share (SHA). The previous voluntary sustainability reporting (EXP) was excluded from the regression model as all sample banks have declared such an experience in their reports; it was analyzed separately. Banks’ profitability is measured by the return on equity (ROE), return on assets (ROA), the cost to income ratio (CI), and net interest margin (NIM), while banks’ solvency is measured by the Tier 1 capital ratio (CET1) and total capital adequacy ratio (TCR). The sample of eight banks does not enable a determination of the regression parameters for all financial indicators simultaneously. For such a sample, the maximum number of explanatory variables ranges between 3 and 7. Considering the number of available data, we decided to analyze three regression models with reference to the three dimensions of banks’ performance. The first model refers to banks’ size and market share. The second one analyzes the relationships between banks’ energy usage and profitability, while the third focuses on solvency. The following equation shows the regression models:
Due to missing data, models were estimated only for 2019.
A visual data analysis was used to test the first hypothesis (time series plots change in phenomenon over time), and a series of Wilcoxon signed-ranks tests were performed. In order to verify the second hypothesis, a linear regression analysis was applied to check all possible combinations of indicators within each model. The regression analysis could not take into account the banks’ experience as all banks reported from 2018; the experience in relation to 2016 was also checked. Contrary to previous findings, which state that the company’s size significantly impacts the nonfinancial disclosures, the regression analysis did not reveal this. Therefore, the relationship was analyzed in a division based on assets. As a result, additionally, two dichotomies were created:
Banks with publication experience before 2017 and without experience;
Large (>=200,000) and small banks (<200,000).
Then using the Mann–Whitney U test (Wilcoxon sum of ranks), differences in the BEB index values were checked in the separated clusters. Due to the target sample size, the analysis results cannot be extrapolated to the whole population, but they give some insights and inspiration for further research.
5. Discussion and Conclusions
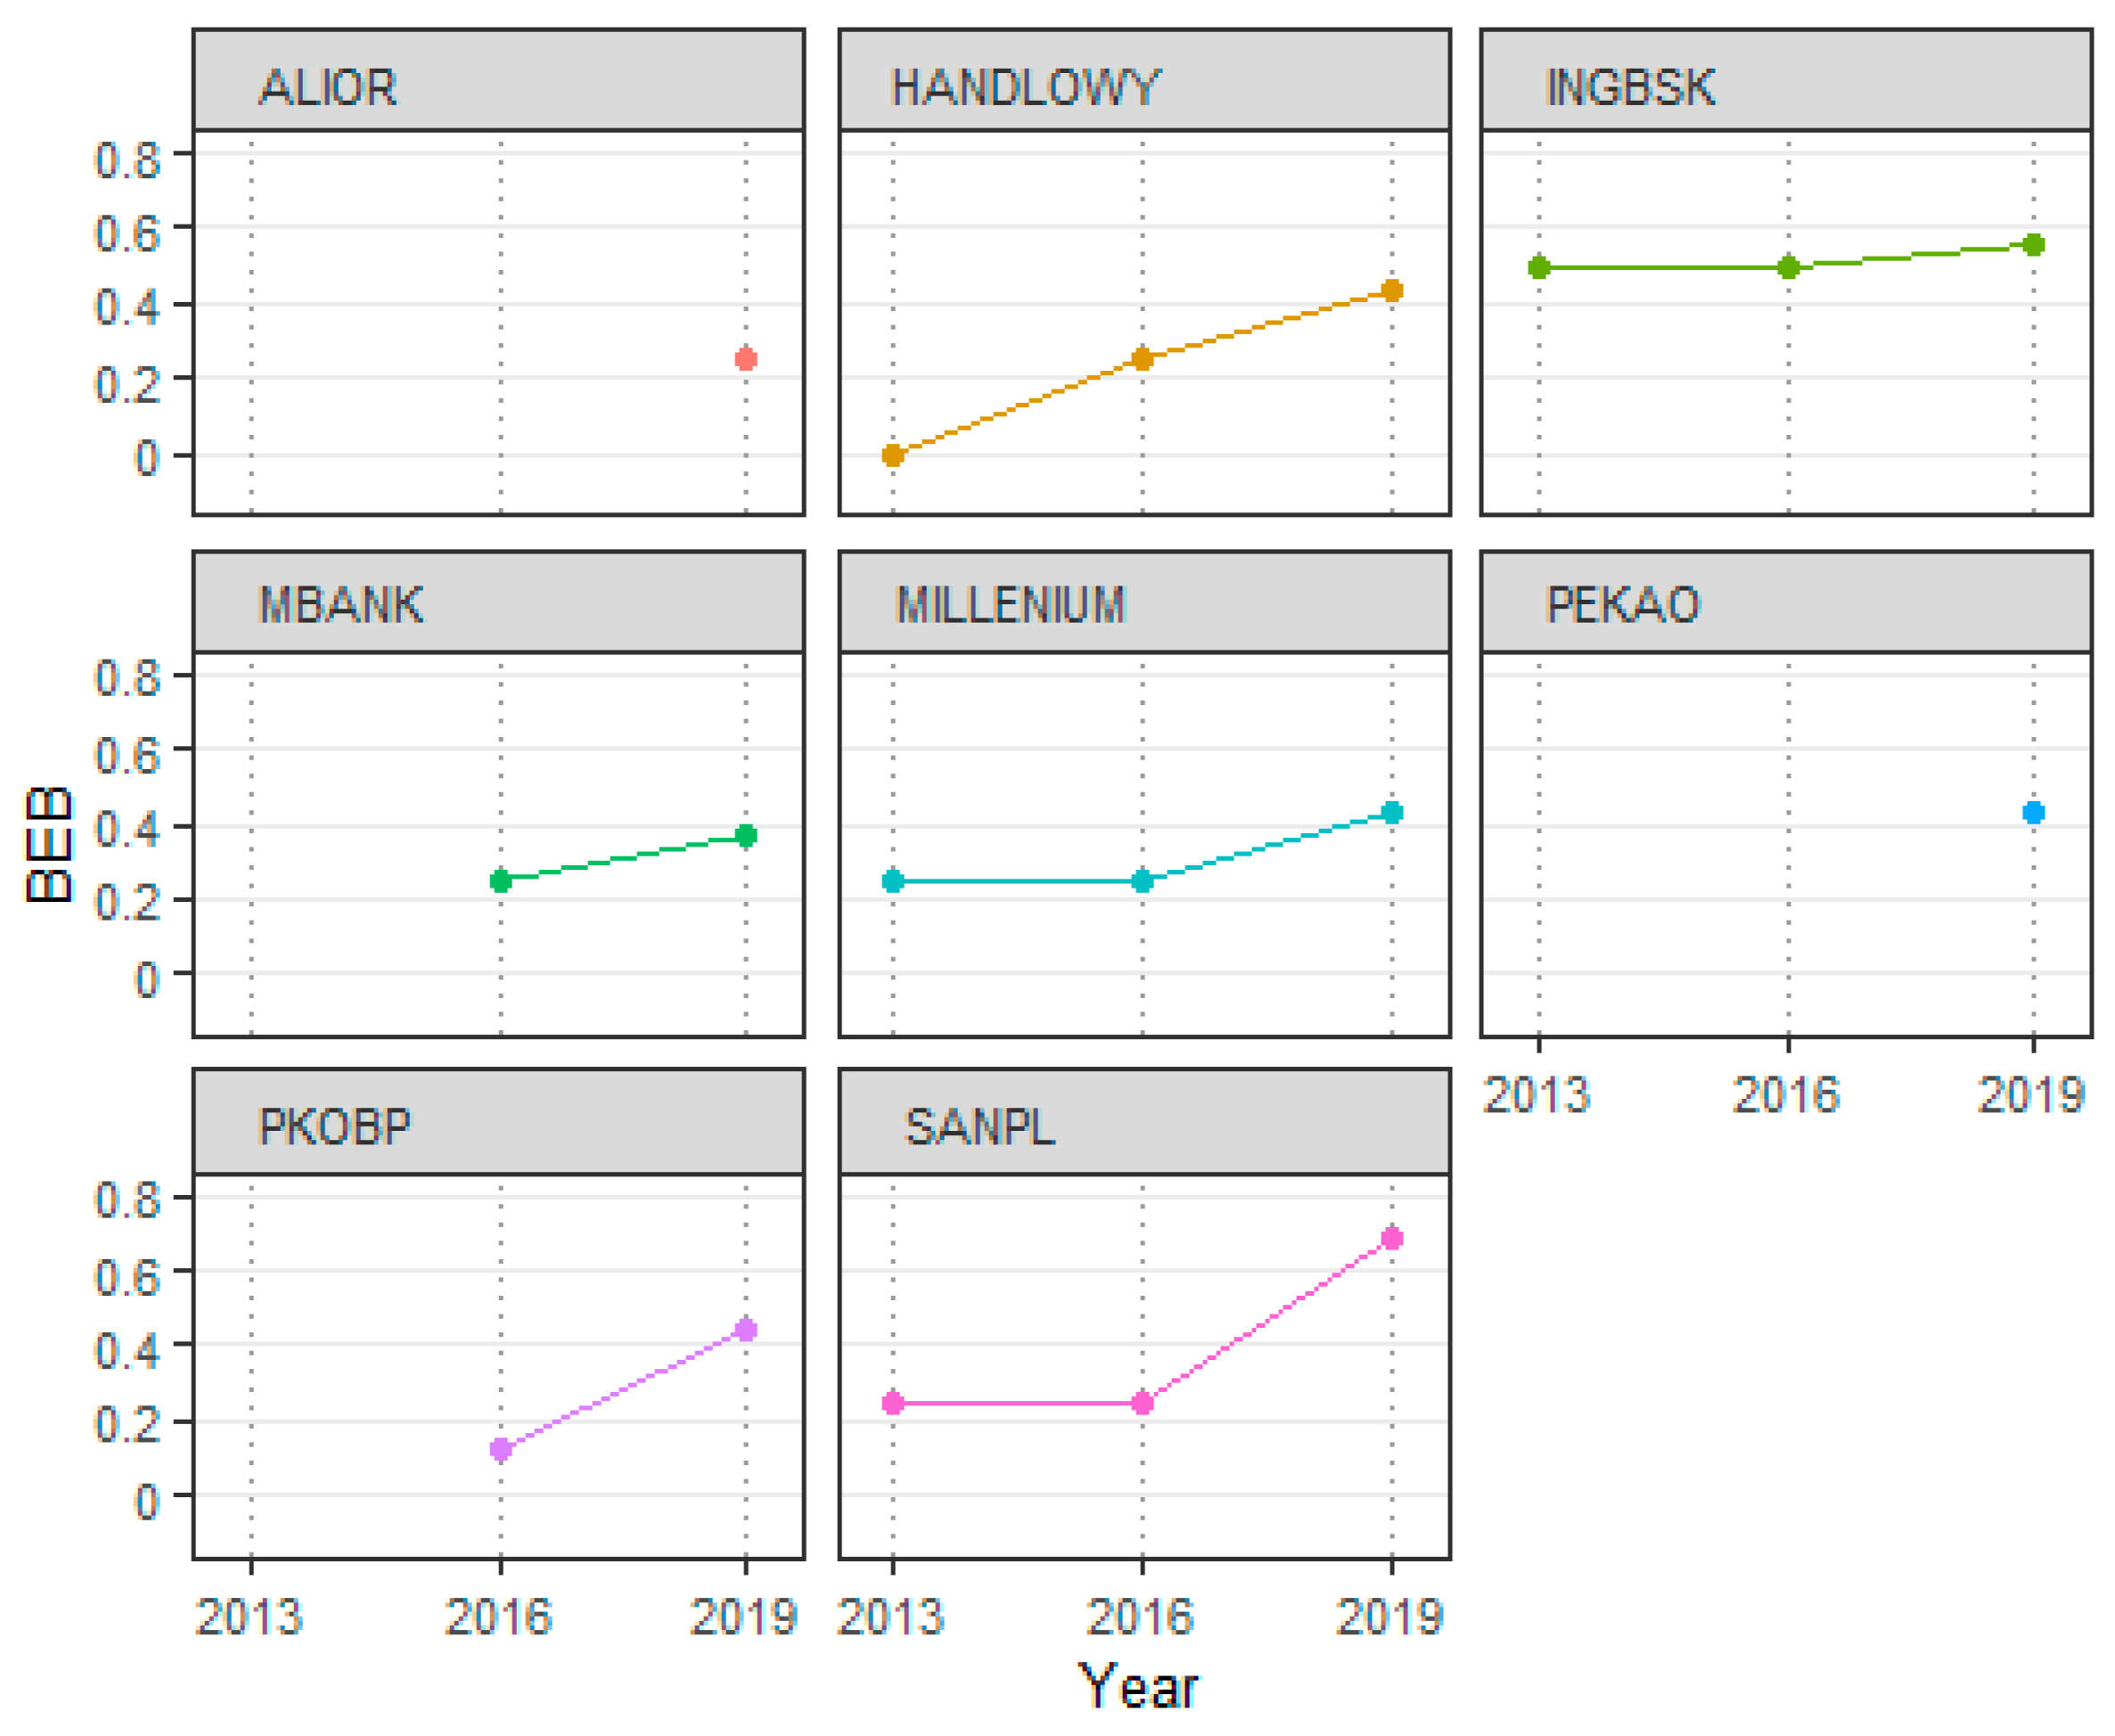
An analysis of banks’ disclosures referring to energy behavior, measured by the BEB index, led to the conclusion that a significant change in disclosures was observed in 2019 after implementing the regulatory obligations. They also indicate that banks with previous experience in publishing nonfinancial reports, such as ING Bank, achieve high BEB index values, but the index changes are negligible. The most significant improvement in disclosure of information was recorded by Santander (
Table 4). The descriptive statistics analysis clearly shows an increase in the BEB index in the analyzed years, with a significant increase after 2016 (
Table 5). The results are in line with Gamerschlag and Chen [
26,
27], who found some evidence that companies under pressure disclose more environmental information. The results also allow to positively verify the assumption that the regulatory obligation increases the quantity and quality of energy information disclosures (first hypothesis).
A relationship between banks’ energy behavior and performance was proved only in the case of banks’ profitability. The results contribute to previous findings, which found a relationship between nonfinancial disclosure and financial performance measured by ROE and ROA [
31,
49]. Still, they cannot be compared directly with the previous research results as none of them focused on energy disclosures. The results show that banks’ characteristics and solvency do not impact the quantity and quality of energy disclosures. It may result from the role banks play in the economy, the characteristic of the banking market, the character of their operational activity, or the sample characteristic, which should be verified in further research. As a result, the second hypothesis was verified, but only partly so.
This paper develops the sustainable energy accounting literature in several ways. The research is part of an ongoing discussion on the appropriateness of broadening the set of entities that should mandatorily report ESG indicators and detailing the requirements for nonfinancial data disclosure [
50]. Findings indicate that existing guidelines and legislation obliging banks to report improve the communication with investors, which is more precise in ESG areas. This paper presents one area of research, which is the energy behavior of banks. Meeting energy reduction targets is becoming increasingly important for banks. In the investment strategies of many funds in the mature markets of Europe and the United States, the criteria for assessing investment risks concerning issues such as energy use play an increasingly important role.
There are also few studies presenting data from Polish banks on energy behavior. In particular, to the best of our knowledge, there is a lack of research into how the quality of these specific disclosures has changed over the years.
Another contribution to the literature is the BEB index, which was developed by the authors and may inspire further studies conducted in other countries on a larger sample of banks. The index can also be supplemented or transformed, taking into account the specifics of the industry in which subsequent studies will be conducted.
The results also have some managerial implications. The BEB index may be added to a set of measures used for benchmarks by banks’ stakeholders, especially customers and governmental agencies focused on energy targets. As a simple tool for comparing banks, it will help in assessing their energy behavior. Additionally, when used by customers in the decision-making process, it will motivate banks to incorporate energy behavior into their strategies. Bank managers can apply it, making the general energy target measurable.
This study has an exploratory character and a pilot nature, which results in some limitations. The indirect purpose of the research was to find if the information published in nonfinancial reports is satisfactory for assessing banks’ energy behavior. The main limitation is the sample size resulting from the number of commercial banks operating in Poland and listed in the WIG-ESG index and the inconsistency of descriptions in presenting the energy behaviors and financial indicators observed before 2016. Such a sample size makes it impossible to generalize the results. Thus, it is recommended that in subsequent stages of investigating the level of disclosure of energy behavior, to (1) analyze nonfinancial reports published after 2016; (2) extend the sample by including not only banks from the WIG-ESG Index but also banks established in other countries; and (3) test the BEB index on a larger sample with more data, which could enable the generalization of the study results. Increasing the sample will enable to use of advanced statistical methods, allowing for a deeper study of this phenomenon, such as panel data analysis for both the size of the entities (banks) and the time dimension; the item response theory method, to analyze the internal consistency of the BEB Index, in particular, to verify the question whether hard and the soft indicators should have the same weight in the BEB index; and the cluster analysis method, to verify the question whether it is justified to analyze the hard and soft indicators separately, in particular, to detect whether, based on each of the factors set, other groups of similar banks are created. The disclosure verification method turned out to be effective. Still, it may be further developed to reduce the subjective opinion of researchers. Thus, it is recommended to use natural language processing. Automating the process of obtaining information about disclosures using text mining methods (selected topic modelling and classification algorithms) will be necessary when the sample size increases.


