Article

Feasibility Conditions for Demonstrative Peer-to-Peer Energy Market

1
Department of Technology Management for Innovation, The University of Tokyo, Tokyo 113-8656, Japan
2
Faculty of Business Sciences, University of Tsukuba, Tokyo 112-0012, Japan
*
Author to whom correspondence should be addressed.
Energies 2021, 14(21), 7418; https://doi.org/10.3390/en14217418
Submission received: 10 October 2021 / Revised: 25 October 2021 / Accepted: 2 November 2021 / Published: 8 November 2021
(This article belongs to the Special Issue Forecasting and Risk Management Techniques for Electricity Markets)

Abstract

:
Distributed energy resources (DERs) play an indispensable role in mitigating global warming. The DERs require flexibility owing to the uncertainty of their power output when connected to the power grid. Recently, blockchain technology has actualized peer-to-peer (P2P) energy markets, promoting efficient and resilient flexibility in the power grid. This study aimed to extract insights about the contribution of the P2P energy markets to ensuring flexibility through analyzing transaction data. The data source was a demonstration project regarding the P2P energy markets conducted from 2019 to 2020 in Urawa-Misono District, Japan. The participants in the project were photovoltaic generators (PVGs), convenience stores (CSs), and residences equipped with battery storage as the only flexibility in the market. We quantitatively analyzed the prices and volumes ordered or transacted by each participant. The execution prices purchased by the residences were lower than those purchased by CSs; the differences between execution prices and order prices of the residences were narrower than those of PVGs and CSs; the lower state-of-charge (SoC) in the storage battery induced the higher purchasing prices. Thus, P2P energy markets, where holding flexibility resulted in the advantageous position, can promote installing flexibility through market mechanisms.

1. Introduction

Decarbonization is an essential process for mitigating global warming, which causes natural disasters, such as lethal heatwaves and extreme precipitation [1]. Nowadays, various pathways to reduce carbon dioxide emissions are being explored, and distributed energy resources (DERs) are attracting significant attention [2]. However, DERs have several disadvantages, including power grid disturbances, such as duck curves and dark doldrums, stimulating the need for flexibility [3,4,5].
Blockchain technology is expected to develop efficient and resilient flexibility and contribute to the realization of peer-to-peer (P2P) energy markets [6]. In these markets, generators and consumers recognize each other, conduct one-to-one power transactions, and act as aggressive players in the power distribution network. The P2P energy markets enable participants to trade directly without mediation and seek a better outcome, that is, buying sides can save costs while selling sides profit in trading electricity [7].
Research on P2P energy markets has been conducted from various perspectives [8]. Transmission system operators in Japan and system integrators have entered into strategic partnerships, such as the Tokyo Electric Power Company Holdings, Inc. and Innogy (currently integrated into RWE AG [9]) [10]; the Chugoku Electric Power Co., Inc. and IBM Japan, Ltd. [11]; Tohoku Electric Power Co., Inc. and Toshiba Corporation [12]; Kansai Electric Power Co., Inc. (KEPCO) and Power Ledger Pty. Ltd. [13]; and Shikoku Electric Power Co., Inc. and LO3 energy, Inc. [14]. Several energy management system providers in Japan, such as ENERES Co., Ltd. [15], UPDATER, Inc. (formerly Minna-Denryoku, Inc.) [16], and Hitachi, Ltd. [17,18] have commercialized blockchain-based systems to actualize and trace non-fossil fuel energy values. In addition to tracing power on blockchain-based databases, several studies have attempted to seamlessly access devices [19] and control electricity delivery according to P2P-matched results [20,21]. Moreover, demonstration projects implementing the P2P energy market on real power grids have gradually increased. One of the earliest projects was the Brooklyn Microgrid [22], operated by LO3 Energy, Inc. [23], and projects in Japan include the DC-based Open Energy System initiated by Sony Computer Science Laboratories, Inc. and Okinawa Institute of Science and Technology [24,25]; the EV charging project co-conceptualized by the Chubu Electric Power Co., Inc., Nayuta, Inc., and Asteria Corporation (formerly Infoteria Corporation) [26]; the Tatsumi Research Center Project demonstrated by KEPCO and Nihon Unisys, Ltd. [27]; and the Higashi-Fuji project carried out by the Toyota Motor Corporation, TRENDE, Inc. and the University of Tokyo [28].
This study focuses on a demonstration project conducted by Digital Grid Co., in Urawa-Misono District, Japan, from August 2019 to March 2020, financially supported by the Ministry of the Environment, Japan [29,30,31,32] (see Acknowledgments). This project featured a digital grid and blockchain-based platform, in which the digital grid allows for the acceptance of the high penetration of DERs [33]. Controlling power flow [34,35] and routing algorithms [36] with a digital grid have been researched previously.
This study aims to analyze the transaction data recorded in the Urawa-Misono demonstration project and extract insights about the contribution of P2P to ensuring flexibility. It represents the first attempt to quantitatively investigate the details of transaction data after the project completion. Various attributes of transaction data enable us to comprehend the benefits of holding flexibility for each facility in the market, which addresses information regarding the order, executions, and the timing of P2P electricity trading in the project as follows. The order data specify the facilities responsible for posting the order data, order volumes, order prices, keys to link to the executed data, and time intervals of electricity delivery. The executed data specify the suppliers, consumers, executed volumes, executed prices, keys to link to the order data, and time intervals of electricity delivery.
The purpose of this study is to analyze the extent to which flexible facilities are advantageous in the market. The featuring indicators were the volume-weighted averages of the order and execution prices, associated with the time intervals of electricity delivery, durations of electricity delivery, and the state-of-charge (SoC) of battery storage.
The remainder of this paper is organized as follows: In Section 2, we provide an overview of the project; in Section 3, we depict the overall trends among the executed and order volumes and prices, associating them with the time intervals of electricity delivery and the duration of electricity delivery; in Section 4, we summarize the findings and limitations.

2. Overview of the Demonstration Project

This section describes the Urawa-Misono demonstration project [31,32].

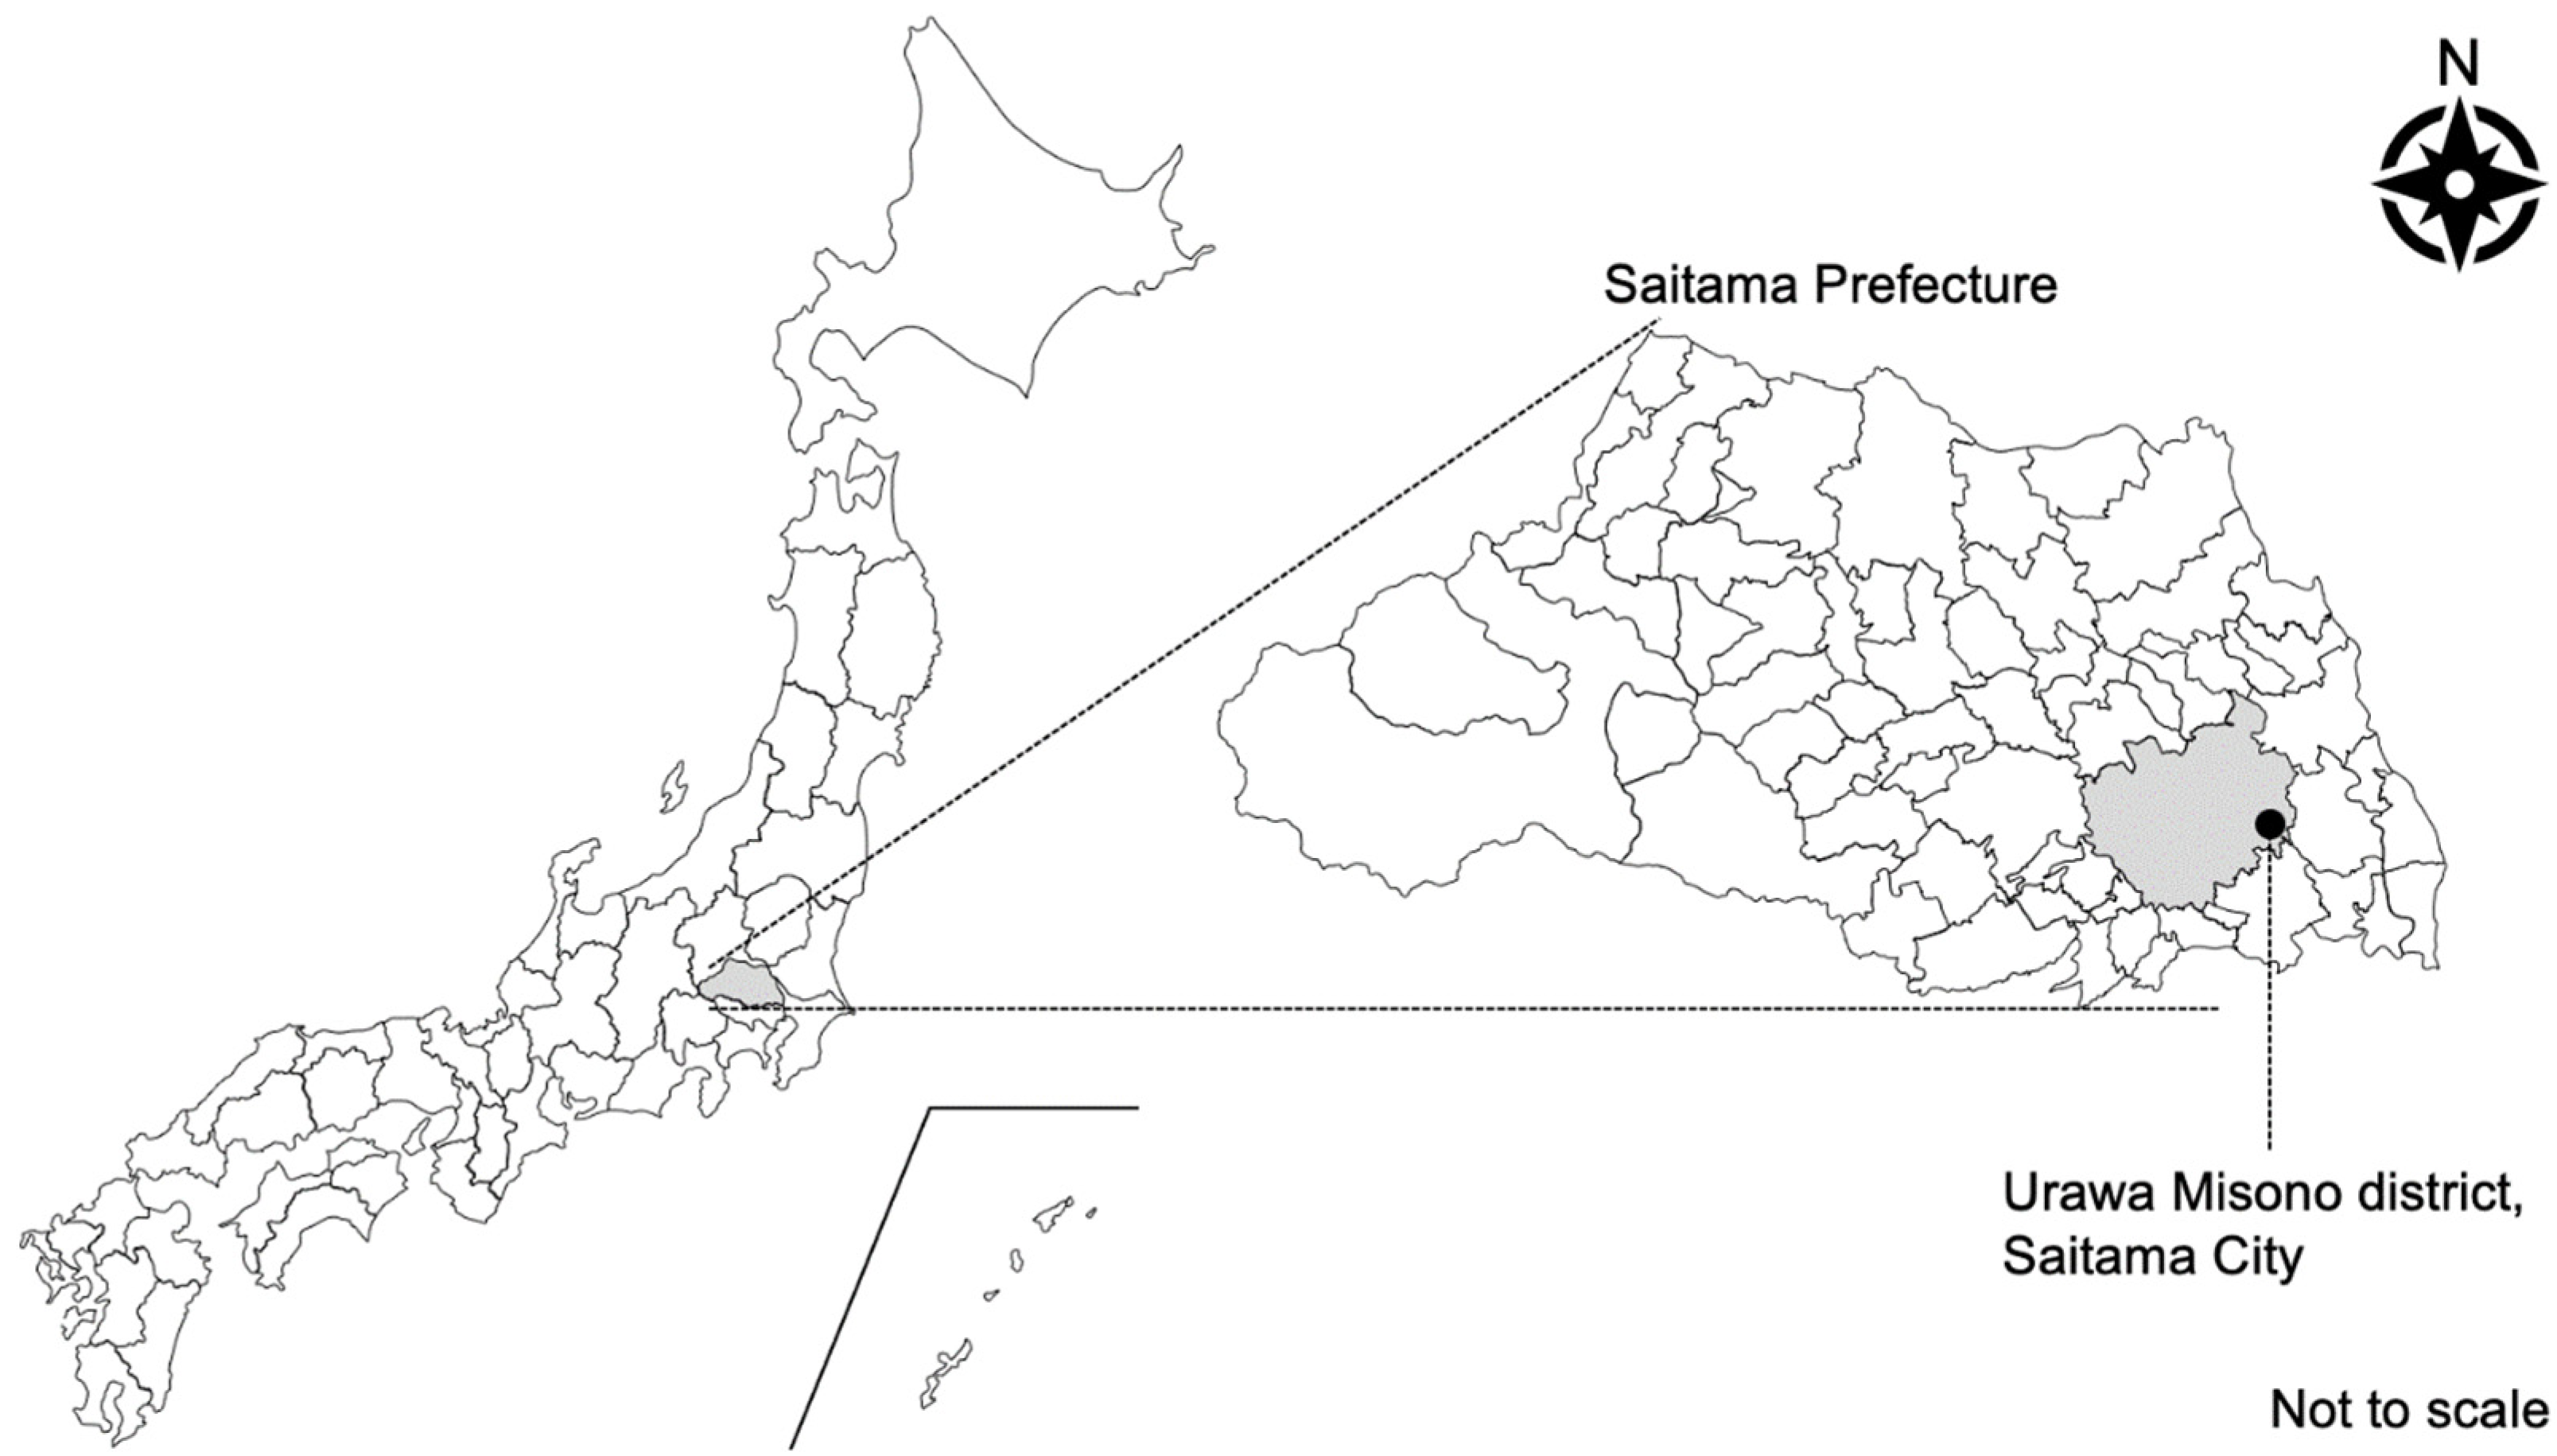
2.1. Location of the Demonstration Project

Figure 1 shows the location of the Urawa-Misono District. The district, a metropolitan suburb of Japan situated in the southeastern part of Saitama Prefecture, is built around Urawa-Misono Station, operated by the Saitama Railway Corporation.
The climate in the Saitama Prefecture is regulated by the Pacific Ocean [37]. In the winter, the air is dry, with numerous sunny days due to the northwest monsoon. Figure 2 shows the weather conditions (precipitation, temperature, and daylight duration) during the demonstration project period in the city of Saitama [38]. Daylight duration is defined as the duration of direct solar radiation of 0.12 kW/m2 or more [39]. In particular, from February to March, the weekly total precipitation was below 50 mm, the weekly mean temperature was approximately 9 °C, and the weekly daylight duration was more than 20 h.

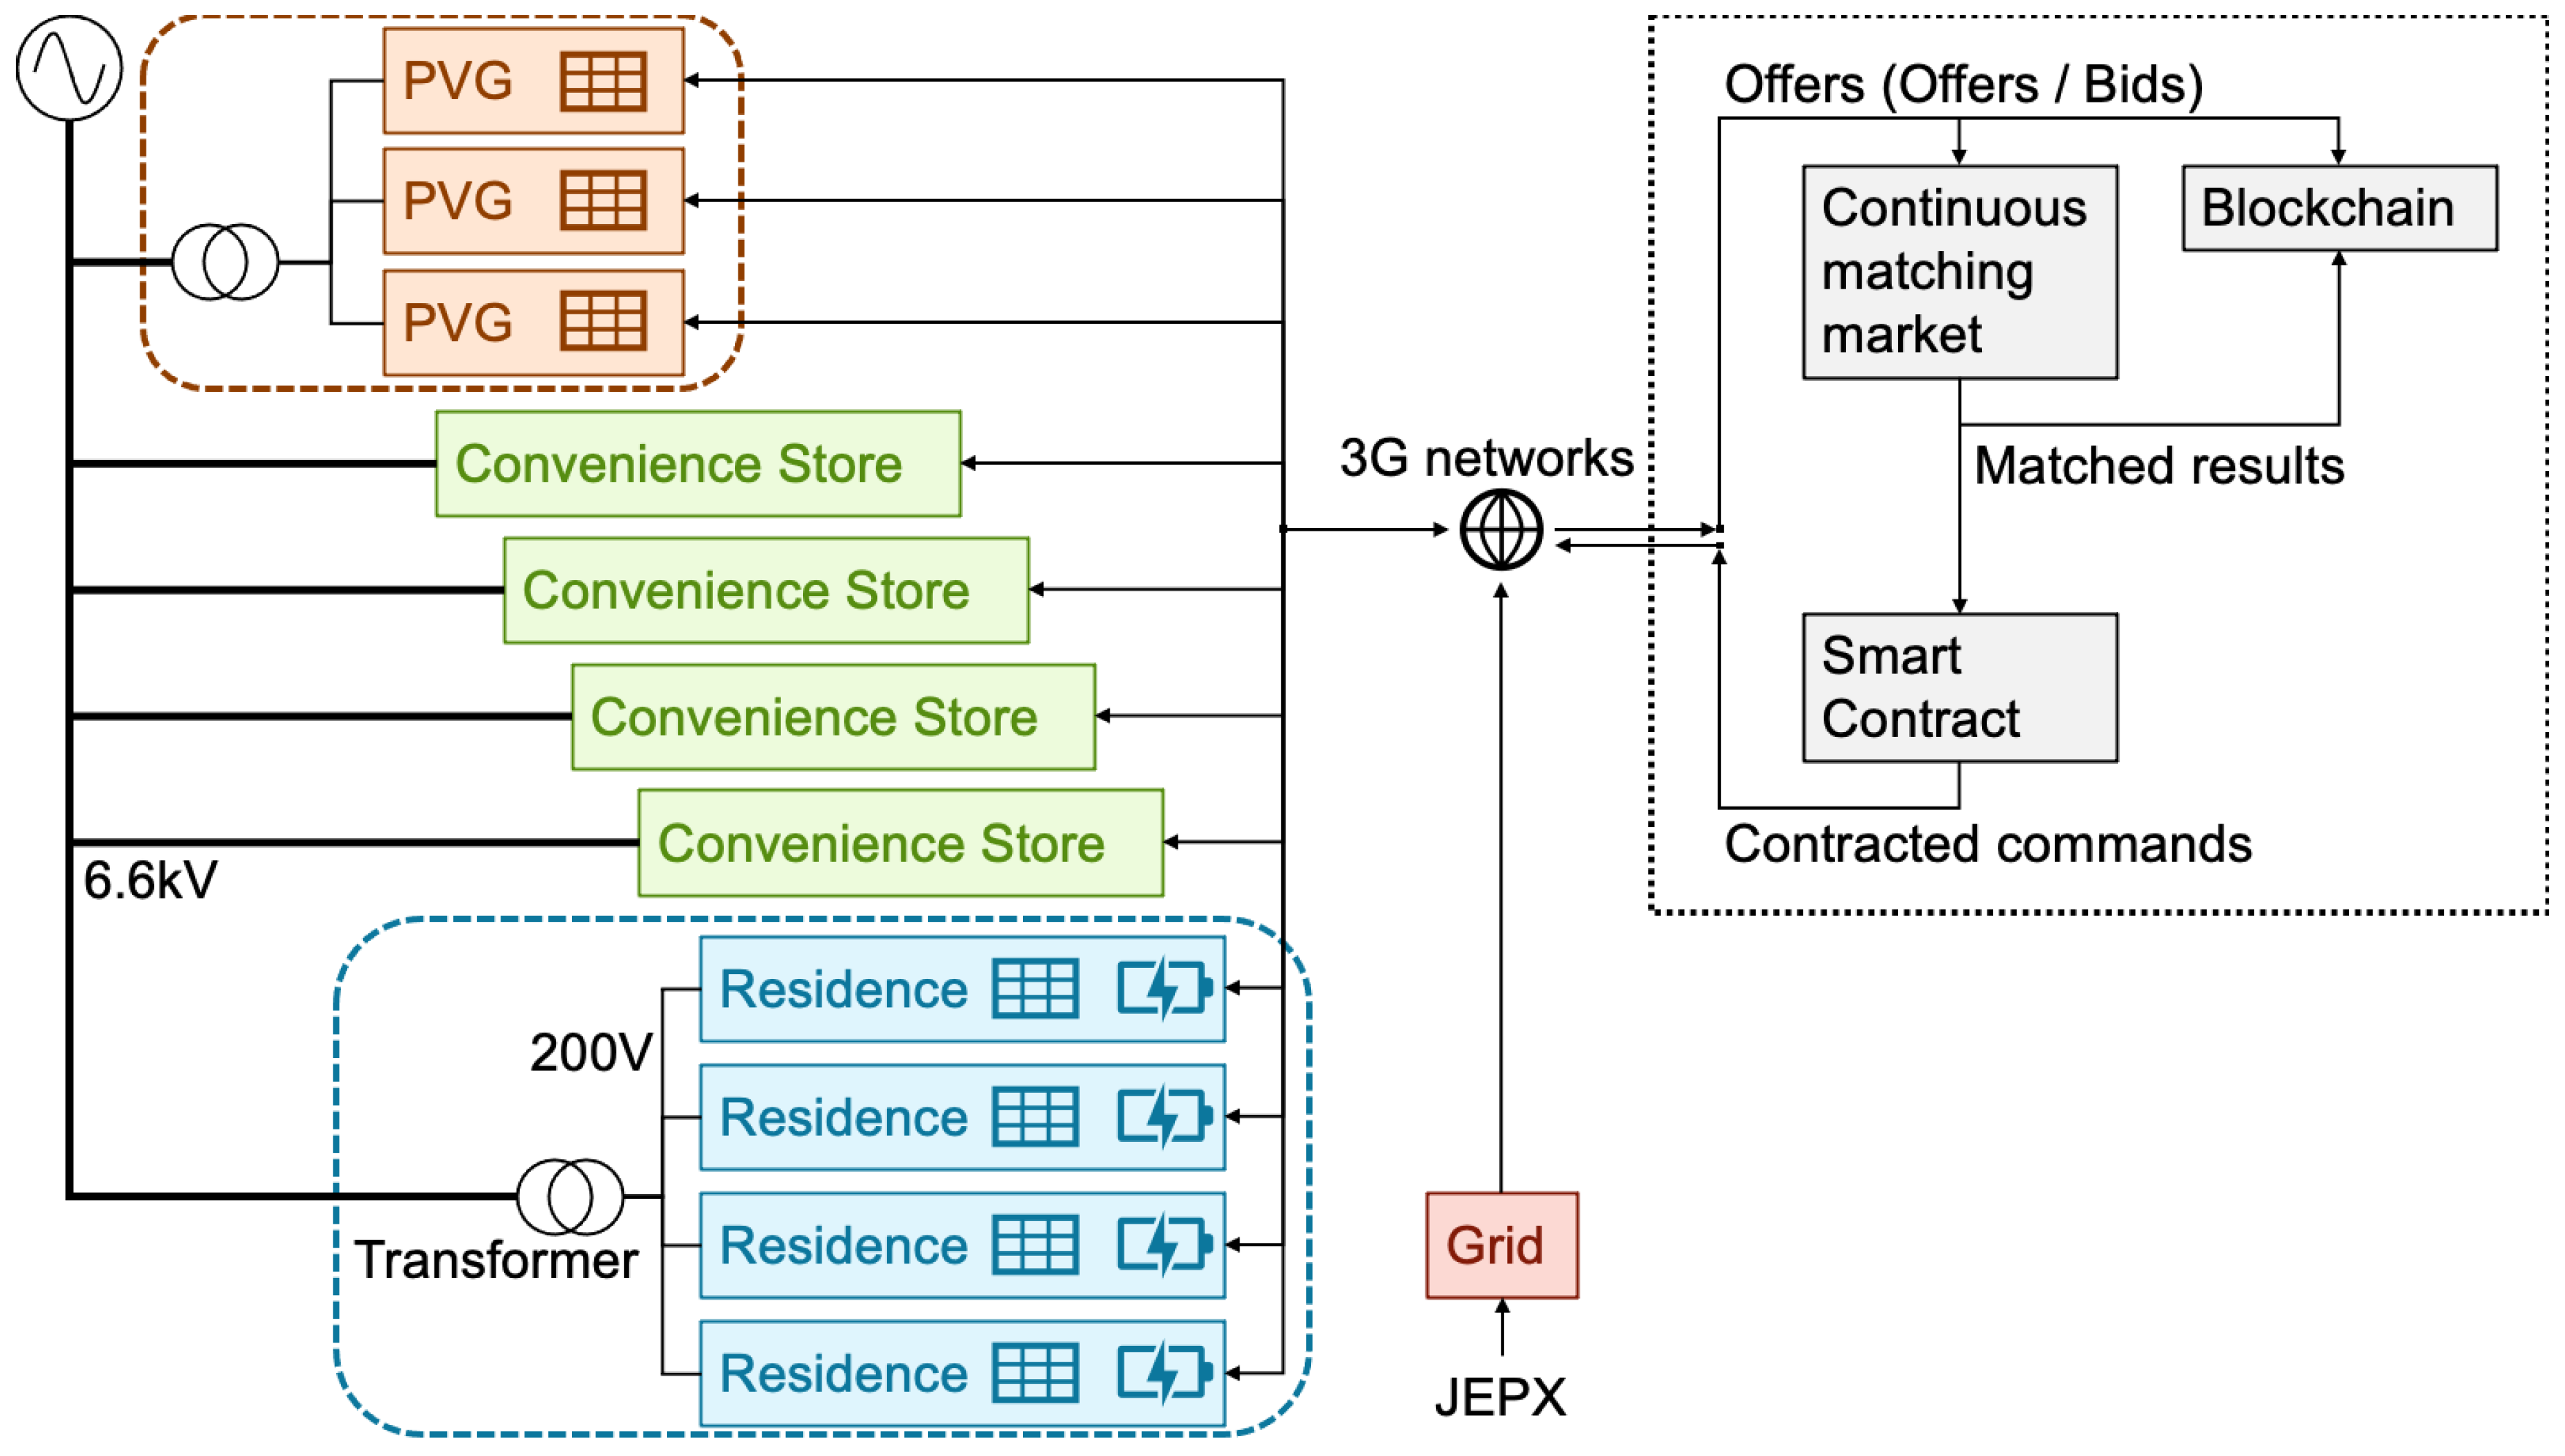
2.2. Demonstration Project System

Figure 3 shows the system applied for the demonstration project. Digital Grid, Co. (Tokyo, Japan) designed the facility configurations [31]. Tanaka conceptualized the electricity trading market and bidding algorithms in each agent [32]. The project participants were individual power producers (suppliers), consumers (demanders), and prosumers (both producers and consumers), represented by actual infrastructural facilities: three photovoltaic generators (PVGs), four convenience stores (CSs), and four residences. All the PVGs, equipped with 18 kW panels and located on the roof of the same shopping center, behaved as a supplier in the market. The CSs were separated from each other and behaved as consumers in the market. Incidentally, a convenience store in Japan is a retail open almost 24 h a day, seven days a week, and sells a large variety of food and daily sundries. The residences were situated in the same block, contained ≤5.5 kW panels and 12 kWh lithium-ion batteries, and behaved as prosumers.
The PVGs and CSs were connected to a 6.6 kV distribution line operated by TEPCO Power Grid, Inc. [40]. The residences were connected to the distribution line via a transformer and a 200 V private line operated by Digital Grid, Co. [41].
The main procedure for order and execution was as follows [31,32]: First, each facility individually posted orders on the market. Each facility was equipped with a digital grid controller (DGC) [42]. DGCs are programmable devices for reading smart meters and communicating with the market via 3G networks, which can forecast the demand and supply for the facilities and schedule orders. The order schedules of DGCs for the PVGs and CSs were based on the forecasted demand and supply, while those for the residences were based on the SoC of their battery storage. Orders were either offers (selling orders) or bids (purchasing orders). The Ethereum blockchain preserved all the posted requests. Attributes of the posted requests included the time at which the requests are posted, volumes and prices, and the requesting facility. In addition to the existing facilities, it was imperative that the power grid agent offer electricity at a price of 30 JPY/kWh or higher than the JEPX [43], which is the wholesale electricity exchange market in Japan.
Second, each market was kept open 24 h before the start time of electricity delivery and accepted orders in continuous sessions. The participants placed orders in the books executed according to the principle of time and price priority. The market detected an offer coupled with a bid on the condition that the bid price is greater than the offered price. All offers with prices exceeding those of bids and all bids with prices lower than those of the offers remained on the board. If the offered volumes and bid volumes differed, the market would set the matched volumes to a smaller one. If multiple requests with the same price existed, the earliest request was given priority. The Ethereum blockchain preserved all matched results. Attributes of the matched results included times when the results were matched, matched volumes and prices, start times and end times of electricity delivery, and a matched supplier and consumer pair.
Third, the market notified each facility when its orders were executed. The market converted each of the matched results into a smart contract, an Ethereum-based program that is automatically executed on the occurrence of a defined event and transmits these results to each of the facilities.
Fourth, each facility supplied or consumed power according to the contract. In addition to a DGC, each of the PVGs and residences was equipped with a Digital Grid Router (DGR), a multifunctional inverter capable of measuring and controlling power according to the attached DGC; at the time of electricity delivery, the DGRs installed in the PVGs supplied as much power as the matched volumes, even if a room capable of generating more power than the matched volumes existed.

3. Analysis of Traded Data

This section mentions the results of quantitative analysis of the traded data. The quantitative analysis was implemented in the Python programming language and numerical libraries such as pandas [44].

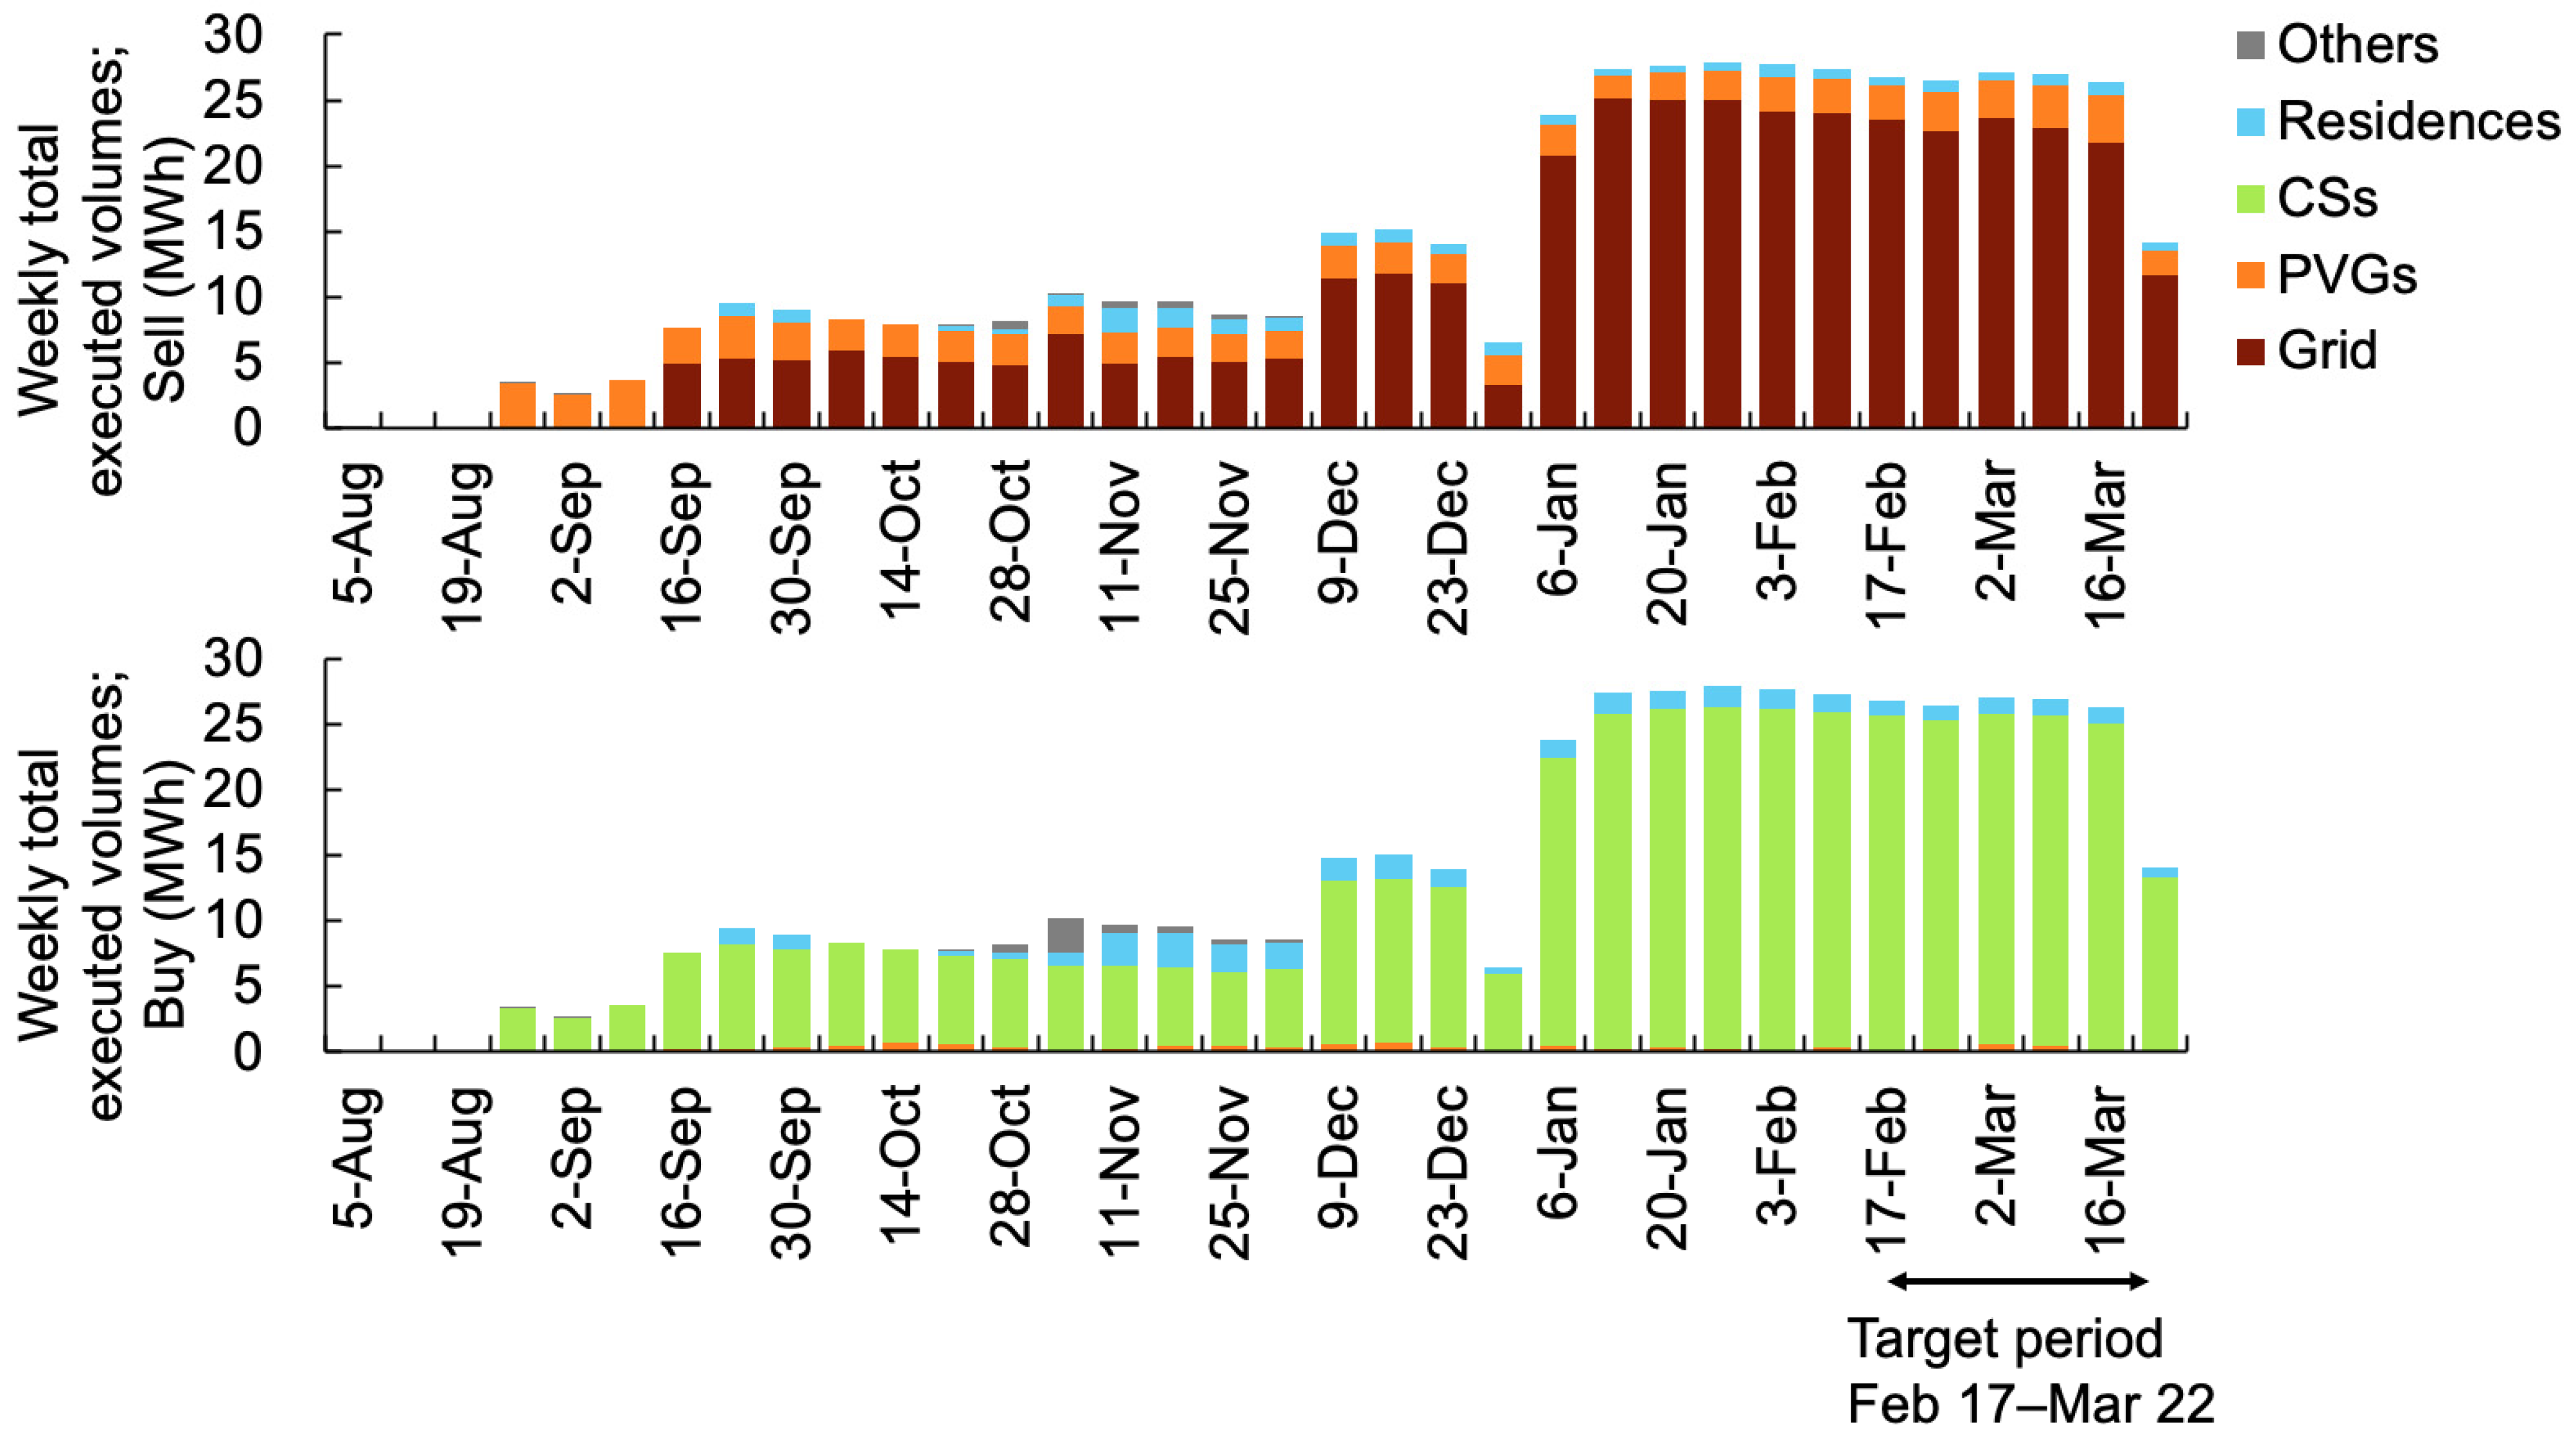
3.1. Selection of Target Period

The number of participants was not always the same, meaning several participants withdrew in the middle of the demonstration project. Here, we will focus on the data period from 17 February to 22 March (target period), during which all the participants were involved in the demonstration project. Figure 4 shows the weekly total executed volumes, where the horizontal axes represent the weekly periods starting from these dates. The average total executed volume in the target period was approximately 25 MWh per week, higher than in the first half of the demonstration period.

3.2. Analysis of Executed Volumes and Prices in the Target Period

3.2.1. Executed Volume Shares among Each Agent

Figure 5 illustrates the share of the executed volumes of each agent with eight Sankey diagrams. The left side of each Sankey diagram represents the share of the supplied volumes, and the right side represents the share of the purchased volumes during the time interval shown at the bottom of the diagram, for example, “00:00–03:00” indicates the executed volumes from 0:00 to 3:00 a.m. in the target period. “PVGs”, “CSs”, and “Residences” each represent the total volumes executed by the respective facilities, for example, “PVGs” are the total volumes executed by the three PVGs.
From Figure 5, it can be seen that each Sankey diagram pertains to a different time interval of electricity delivery. At night (00:00–03:00, 03:00–06:00, 18:00–21:00, and 21:00–24:00), the grid was dominant on the supply side and the CSs were dominant on the purchase side. During the daytime (09:00–12:00 and 12:00–15:00), the PVGs accounted for a large share (34% at 09:00–12:00 and 35% at 12:00–15:00). Moreover, the PVGs accounted for 31% of the total volumes purchased by the CSs in the daytime, and 93% at 09:00–12:00 and 86% at 12:00–15:00 of the total volumes purchased by the residences.

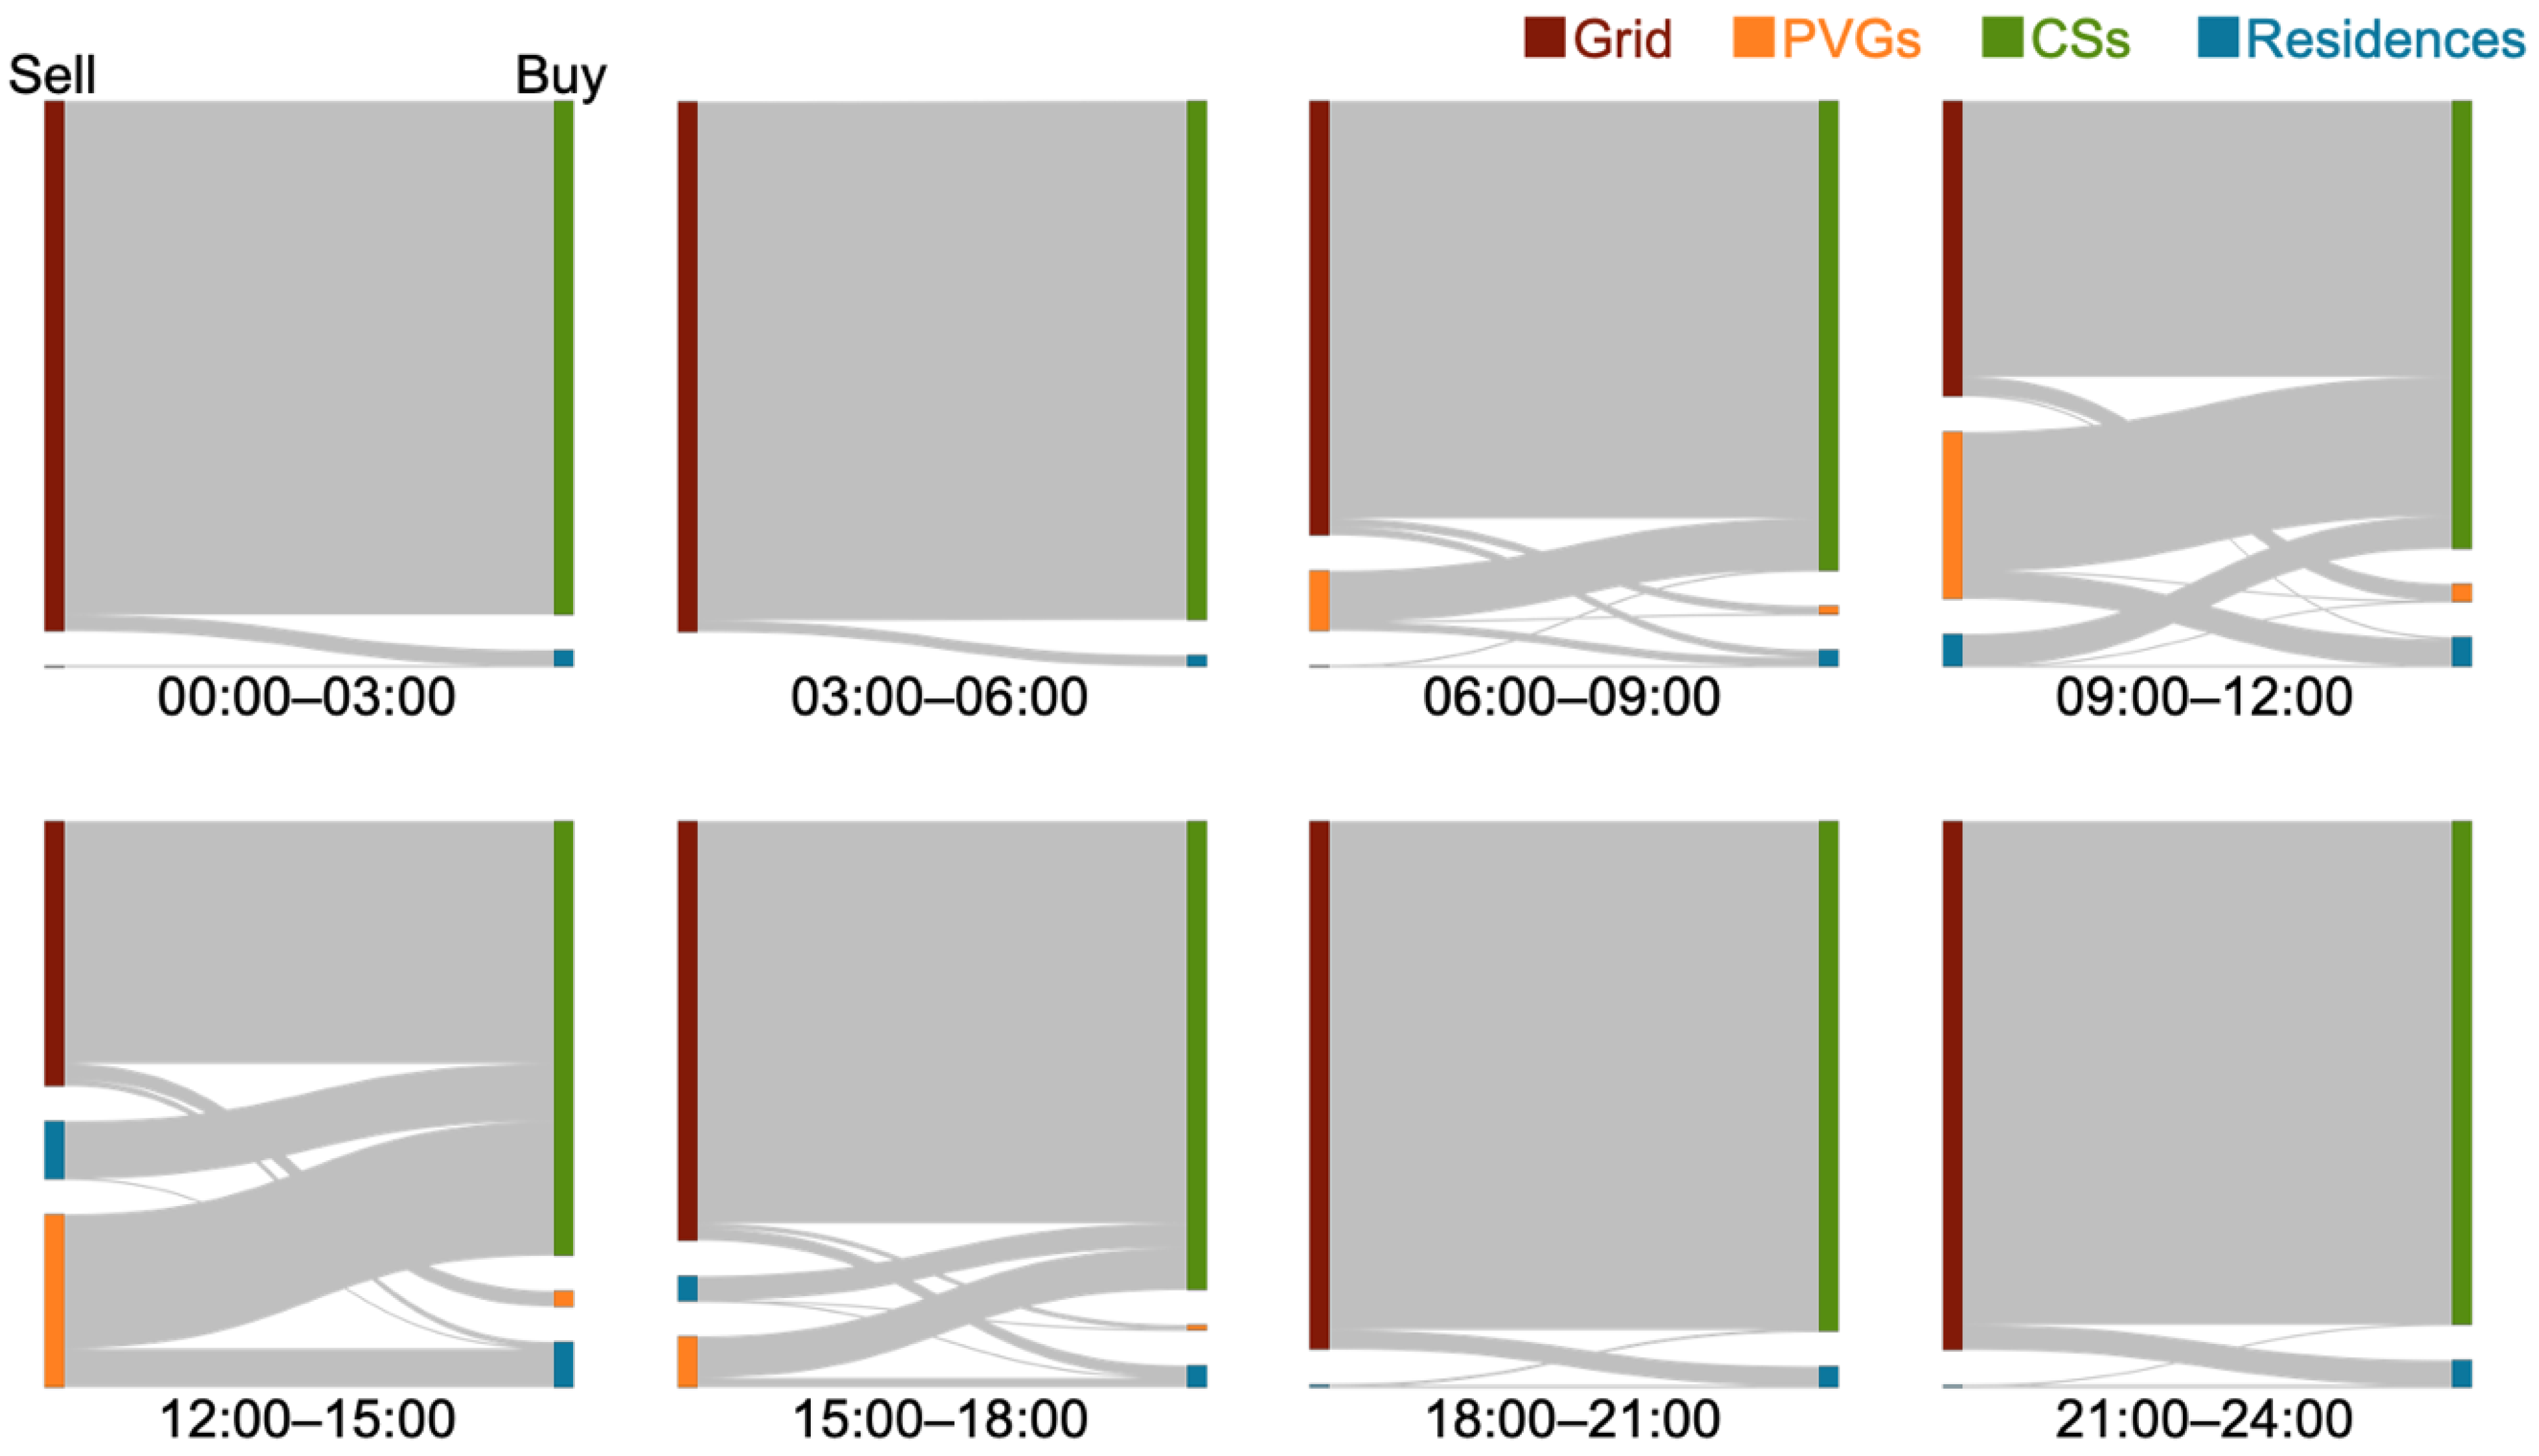
3.2.2. Executed Volumes and Prices Associated with Electricity Delivery Time Intervals

Figure 6 shows the total executed volumes for each time interval of electricity delivery in the target period, where the upper panel represents the breakdown of the executed volumes on the supplying side, and the lower panel indicates the breakdown of the executed volumes on the purchasing side. The horizontal axes denote the time intervals of electricity delivery, for example, “00–01” represents the total volumes transacted from 0:00 to 1:00 in the target period.
Figure 7 shows the mean price, that is, the weighted average of the executed prices by the executed volumes for each time interval of electricity delivery in the target period, where the upper and lower panels represent the supplied and purchased price, respectively, and the horizontal axes denote the time intervals of electricity delivery, similar to Figure 6.
Several observations were made based on Figure 6. Here, the trend of the total executed volumes was approximately steady at 5.3–6.0 MWh and the mean executed prices supplied by the grid were steady at 36–39 JPY/kWh throughout the day. Moreover, during the daytime (9:00–10:00, 10:00–11:00, 11:00–12:00, 12:00–13:00, and 14:00–15:00), the mean executed prices supplied by the PVGs were steady at 27–29 JPY/kWh, while the mean executed prices supplied by the residences were steady at 29–32 JPY/kWh. The mean executed prices purchased by the CSs were steady at 34–39 JPY/kWh throughout the day, and in the daytime, the mean executed prices purchased by the residences were 9–19 JPY/kWh, significantly lower than those purchased by the CSs.

3.2.3. Executed Volumes and Prices Associated with the Durations of Electricity Delivery

Next, we compared the durations of electricity delivery with the total executed volumes and mean executed prices. The upper panel in Figure 8 represents the breakdown of the executed volumes on the supplying side and the lower panel represents the purchasing side. The horizontal axis in each plot denotes the duration of the electricity delivery. Note that the duration period is indicated in decreasing order; therefore, “24–21” represents the duration from 24 to 21 h before delivery.
Figure 9 shows the mean executed prices for each duration period, where the mean prices are the weighted averages of the executed prices by the executed volumes. The upper panel represents each supplied price, and the lower panel represents each purchased price. The horizontal axes represent the durations of electricity delivery, similar to Figure 8.
The executed volume within the last 6 h period (i.e., 06–03 and 03–00) covers the highest volume of electricity delivery. The mean executed prices at 06–03 were approximately the same, whereas the mean executed prices at 03–00 varied. The mean executed price supplied by the PVGs (23 JPY/kWh) was significantly lower than that supplied by the residences (31 JPY/kWh) at 03–00. Moreover, the mean executed price purchased by the CSs (39 JPY/kWh) was significantly higher than that purchased by the residences (24 JPY/kWh) at 03–00.

3.3. Analysis of Order Volumes and Prices during the Target Period

3.3.1. Order Volumes and Prices for Electricity Delivery

Figure 10 shows the total order volume for each time interval of electricity delivery, where the upper panel represents the offered volumes, and the lower panel represents the bid volumes. The horizontal axes denote the time intervals of electricity delivery. For example, “00–01” represents the total order volumes delivered from 0:00 to 1:00. The total offers from the grid, which were 70 GWh at each bar and significantly higher than the other offers, are intentionally invisible. Note that the volumes and prices here are based on all orders accepted for the given time intervals of electricity delivery.
Figure 11 shows the mean order prices for the time intervals of electricity delivery. The upper panel represents the mean offered prices, and the lower panel represents the mean bid prices. The horizontal axes represent the time intervals of electricity delivery, similar to Figure 10. In this figure, the mean prices denote the averages of the order prices weighted by the order volumes.
Comparing the mean order prices depicted in Figure 11 with the mean executed prices in Figure 7. The order volumes of the PVGs were higher than those supplied. For example, at 12–13 (ordered between 12:00 and 13:00), the order volumes were 19 MWh, while the executed volumes were 2 MWh. Moreover, the CSs’ order volumes were higher than those purchased. For example, at 12–13, the order volume was 42 MWh, while only 5 MWh was executed.
The mean order prices of the PVGs and CSs tended to deviate from the executed prices. For example, the mean prices offered by the PVGs (40–42 JPY/kWh) were significantly higher than the mean executed prices supplied by the PVGs (27–29 JPY/kWh). Moreover, the mean order prices bid by CSs (26–28 JPY/kWh) were significantly lower than the mean executed prices purchased by CSs (34–39 JPY/kWh)
The mean order prices for residences were relatively similar to those executed, at least during the daytime (from 9:00 to 15:00). The mean order prices offered by residences were between 28 and 31 JPY/kWh, whereas the mean executed prices supplied by the residences were between 29 and 32 JPY/kWh, as shown in Figure 7. Moreover, the mean order prices bid by the residences were between 6 and 11 JPY/kWh, and the mean executed prices were between 9 and 19 JPY/kWh (see Figure 7).

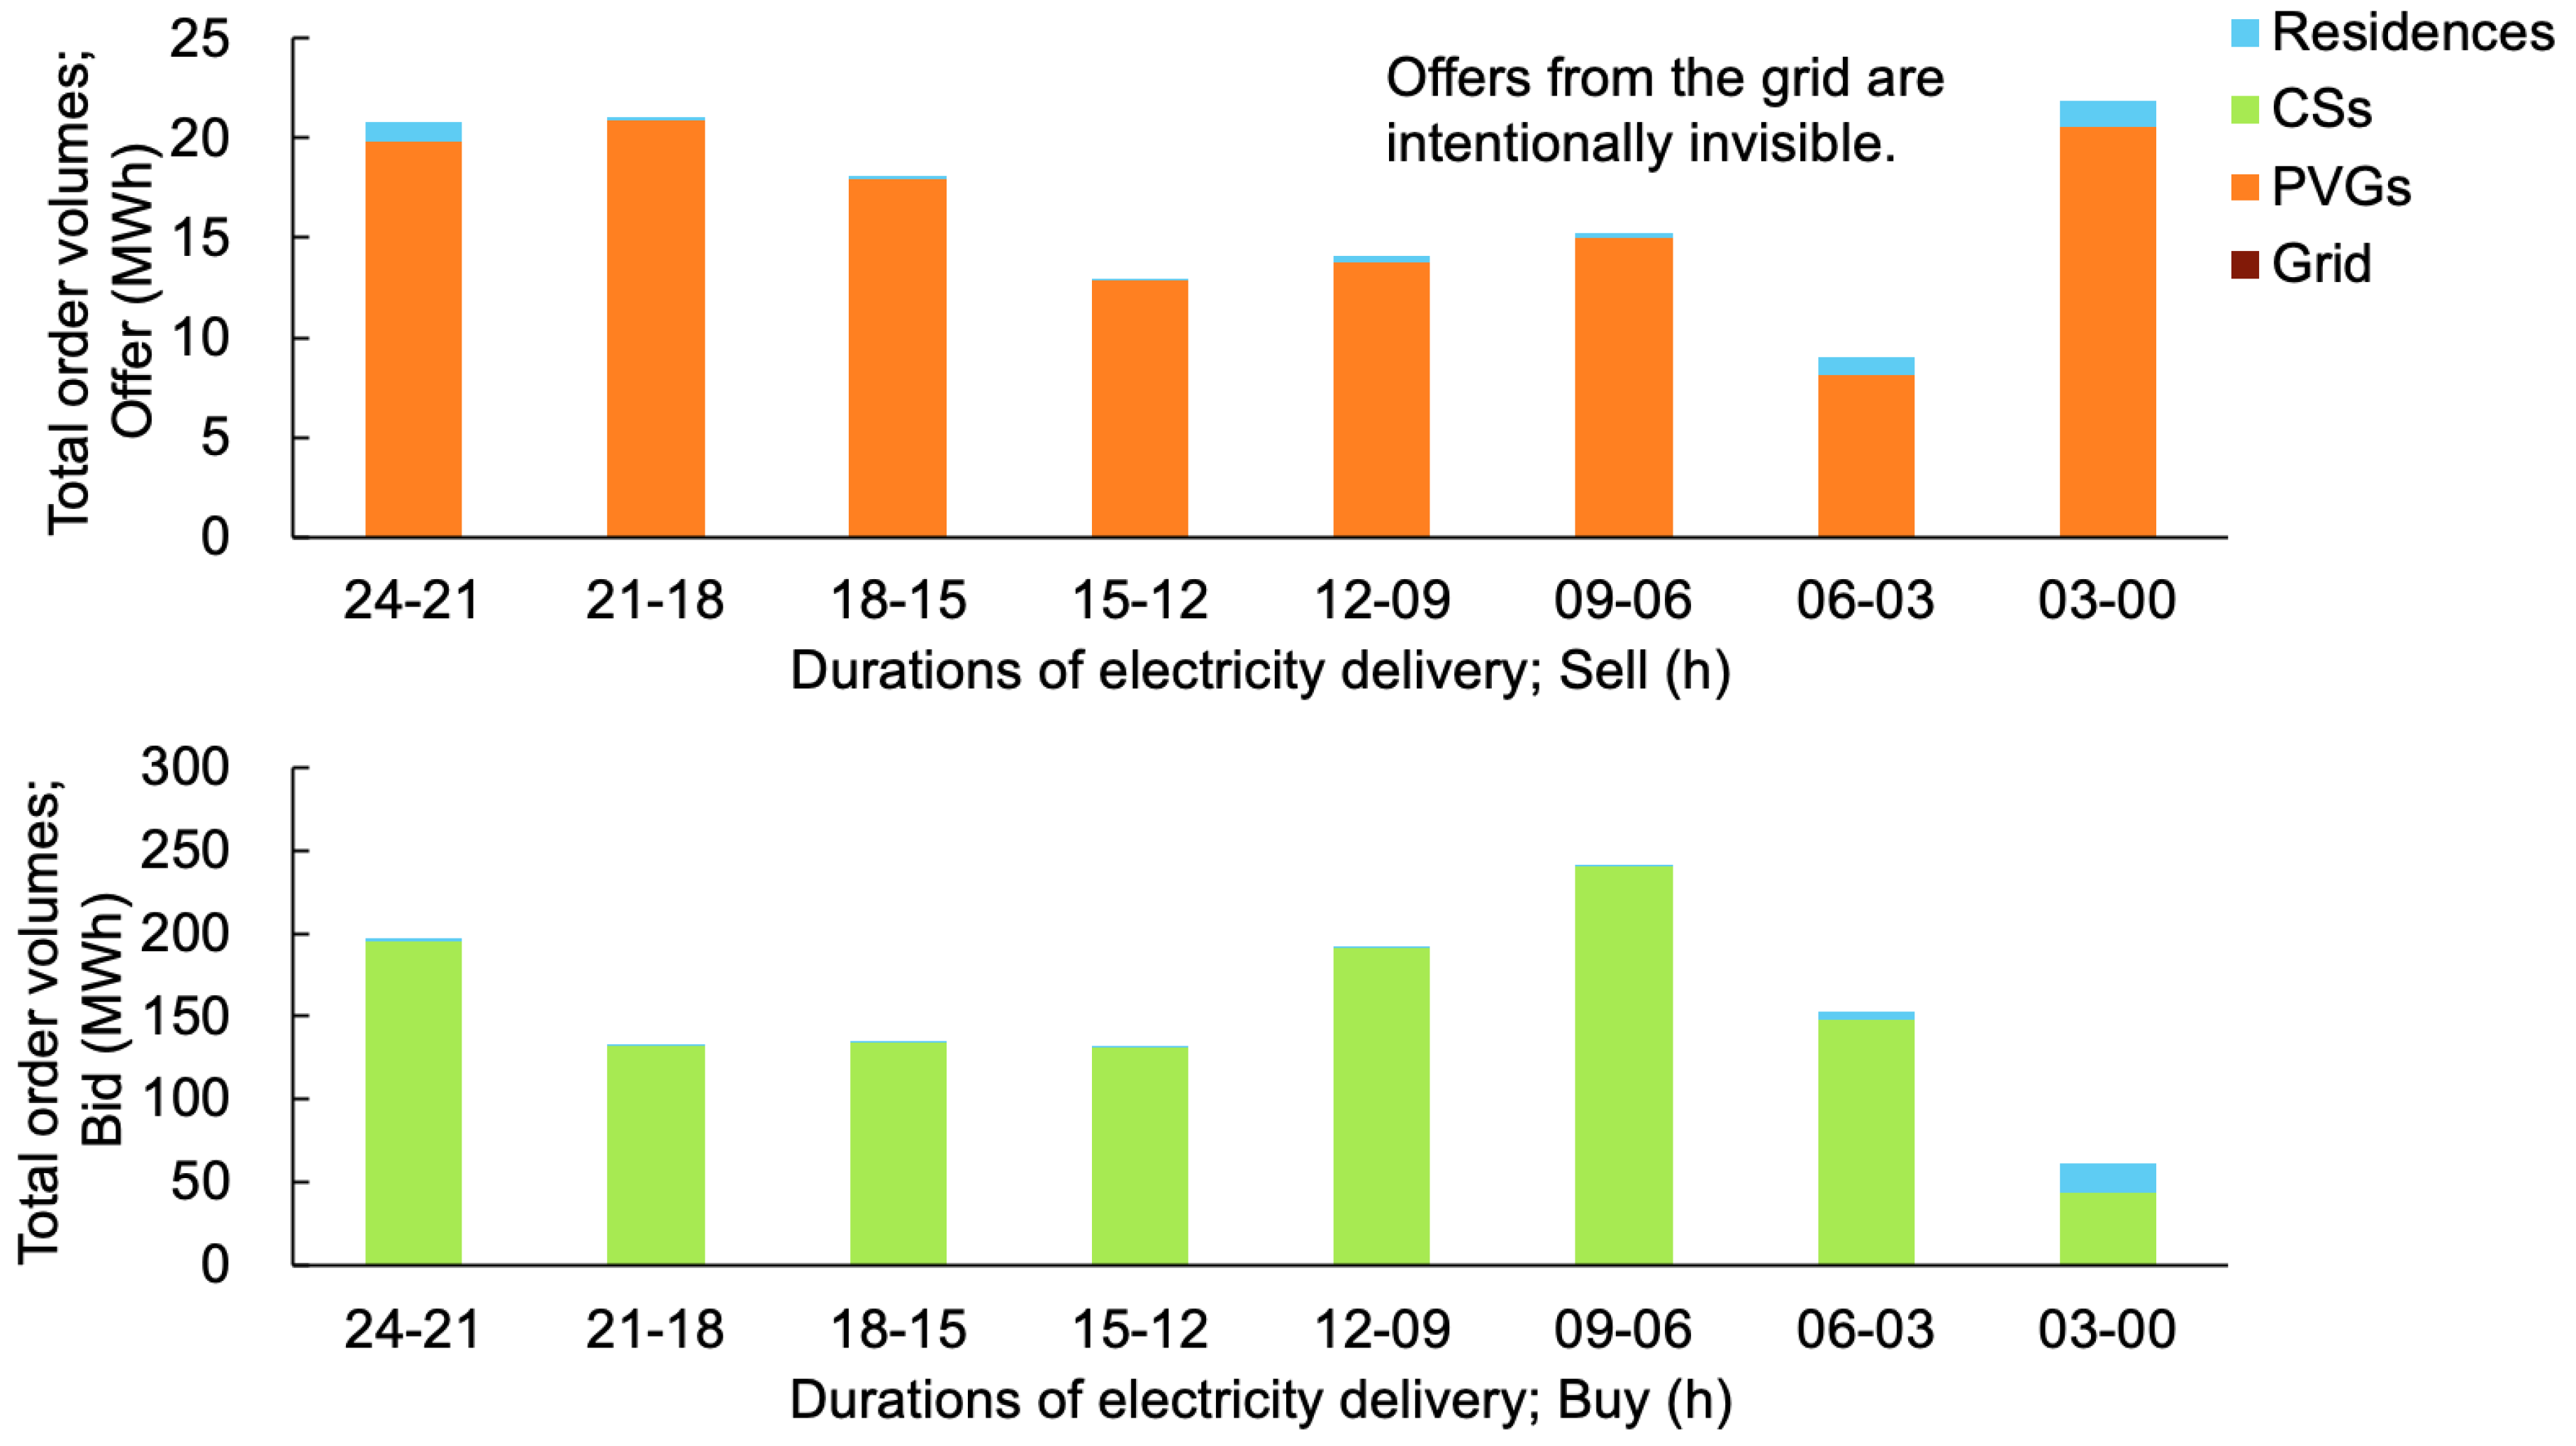
3.3.2. Order Volume and Price as Compared with Electricity Delivery Duration

Figure 12 shows the total order volumes for durations of electricity delivery; the upper panel represents the breakdown of the offered volumes, and the lower panel represents the breakdown of the bid volumes. Here, the total volumes offered from the grid, which are significantly higher than the other offers, are invisible.
Figure 13 shows the relationship between the mean order prices and electricity delivery duration, where the upper and lower panels represent the offered and bid prices, respectively. Similar to Figure 12, the mean prices are the average of the order prices weighted by the order volumes.
The total bid volumes (131–241 MWh) were more abundant than the executed ones (0–10 MWh) until six hours before delivery (24–21, 21–18, 18–15, 15–12, 12–09, and 09–06), as shown in Figure 8. The trend in order prices for duration diverges. The prices offered by the PVGs steadily decreased, whereas those offered by the residences gradually increased. Moreover, the prices bid by the CSs steadily increased, whereas those bid by residences gradually decreased.

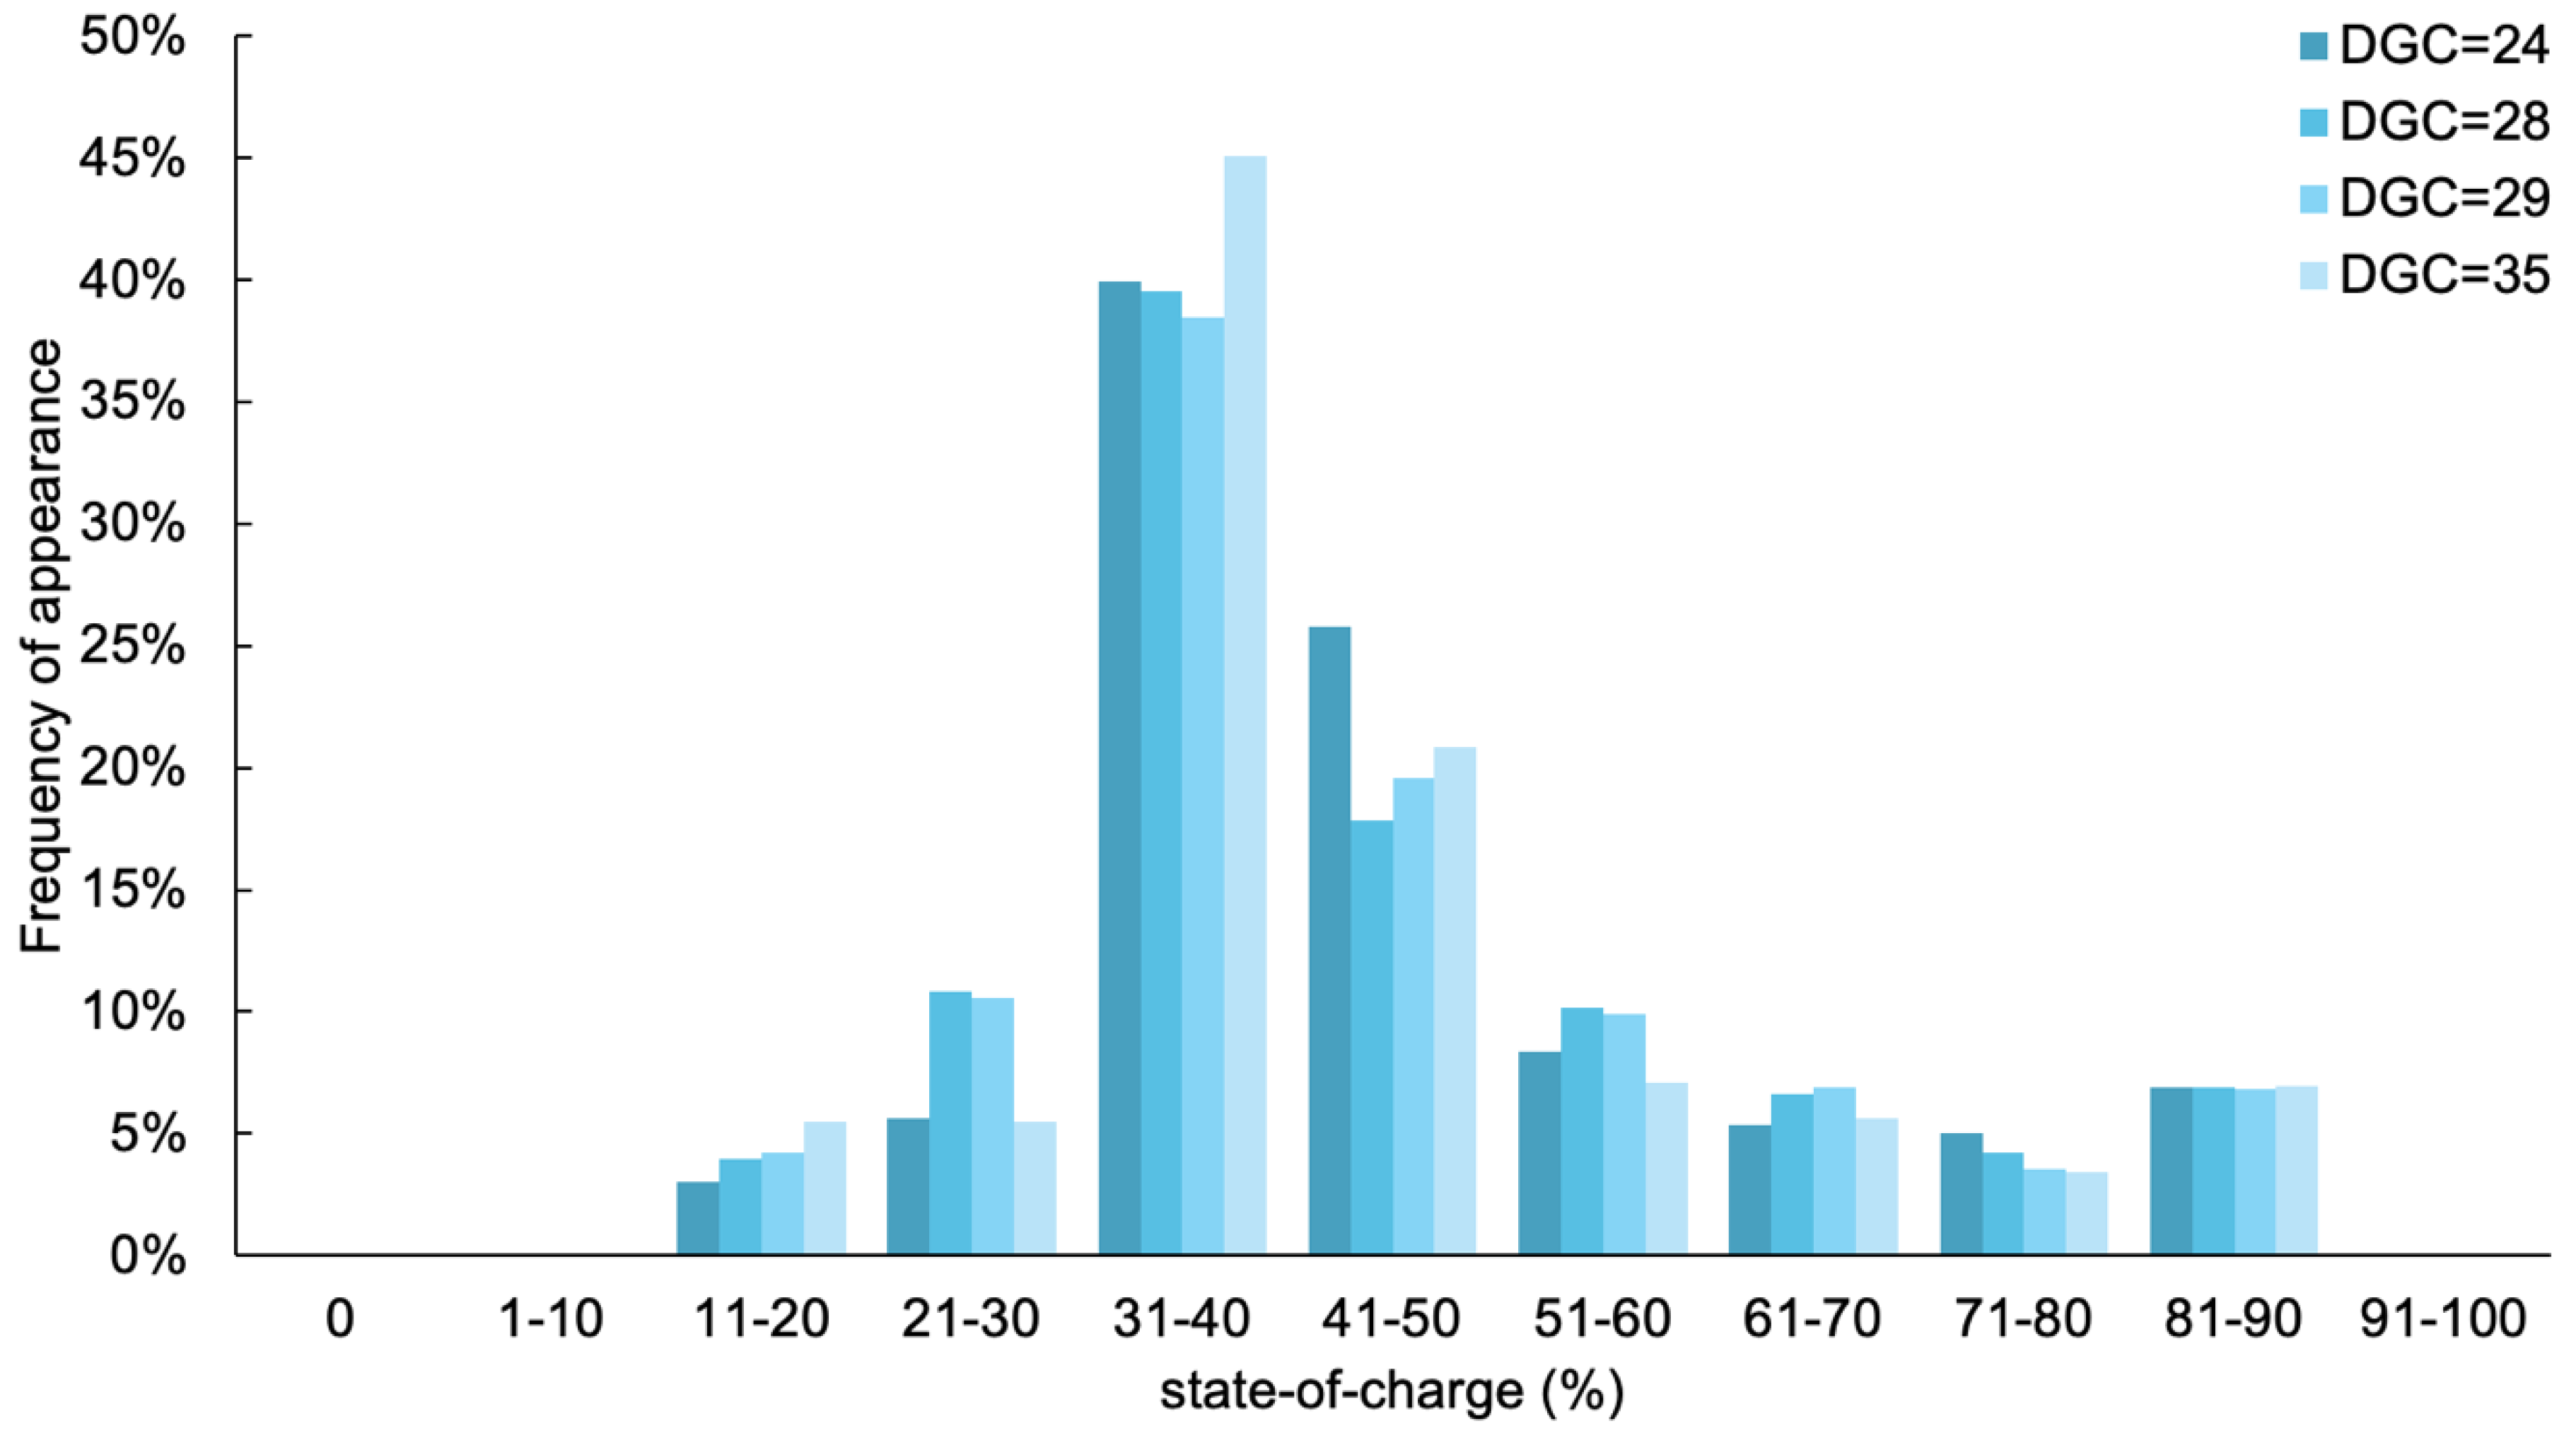
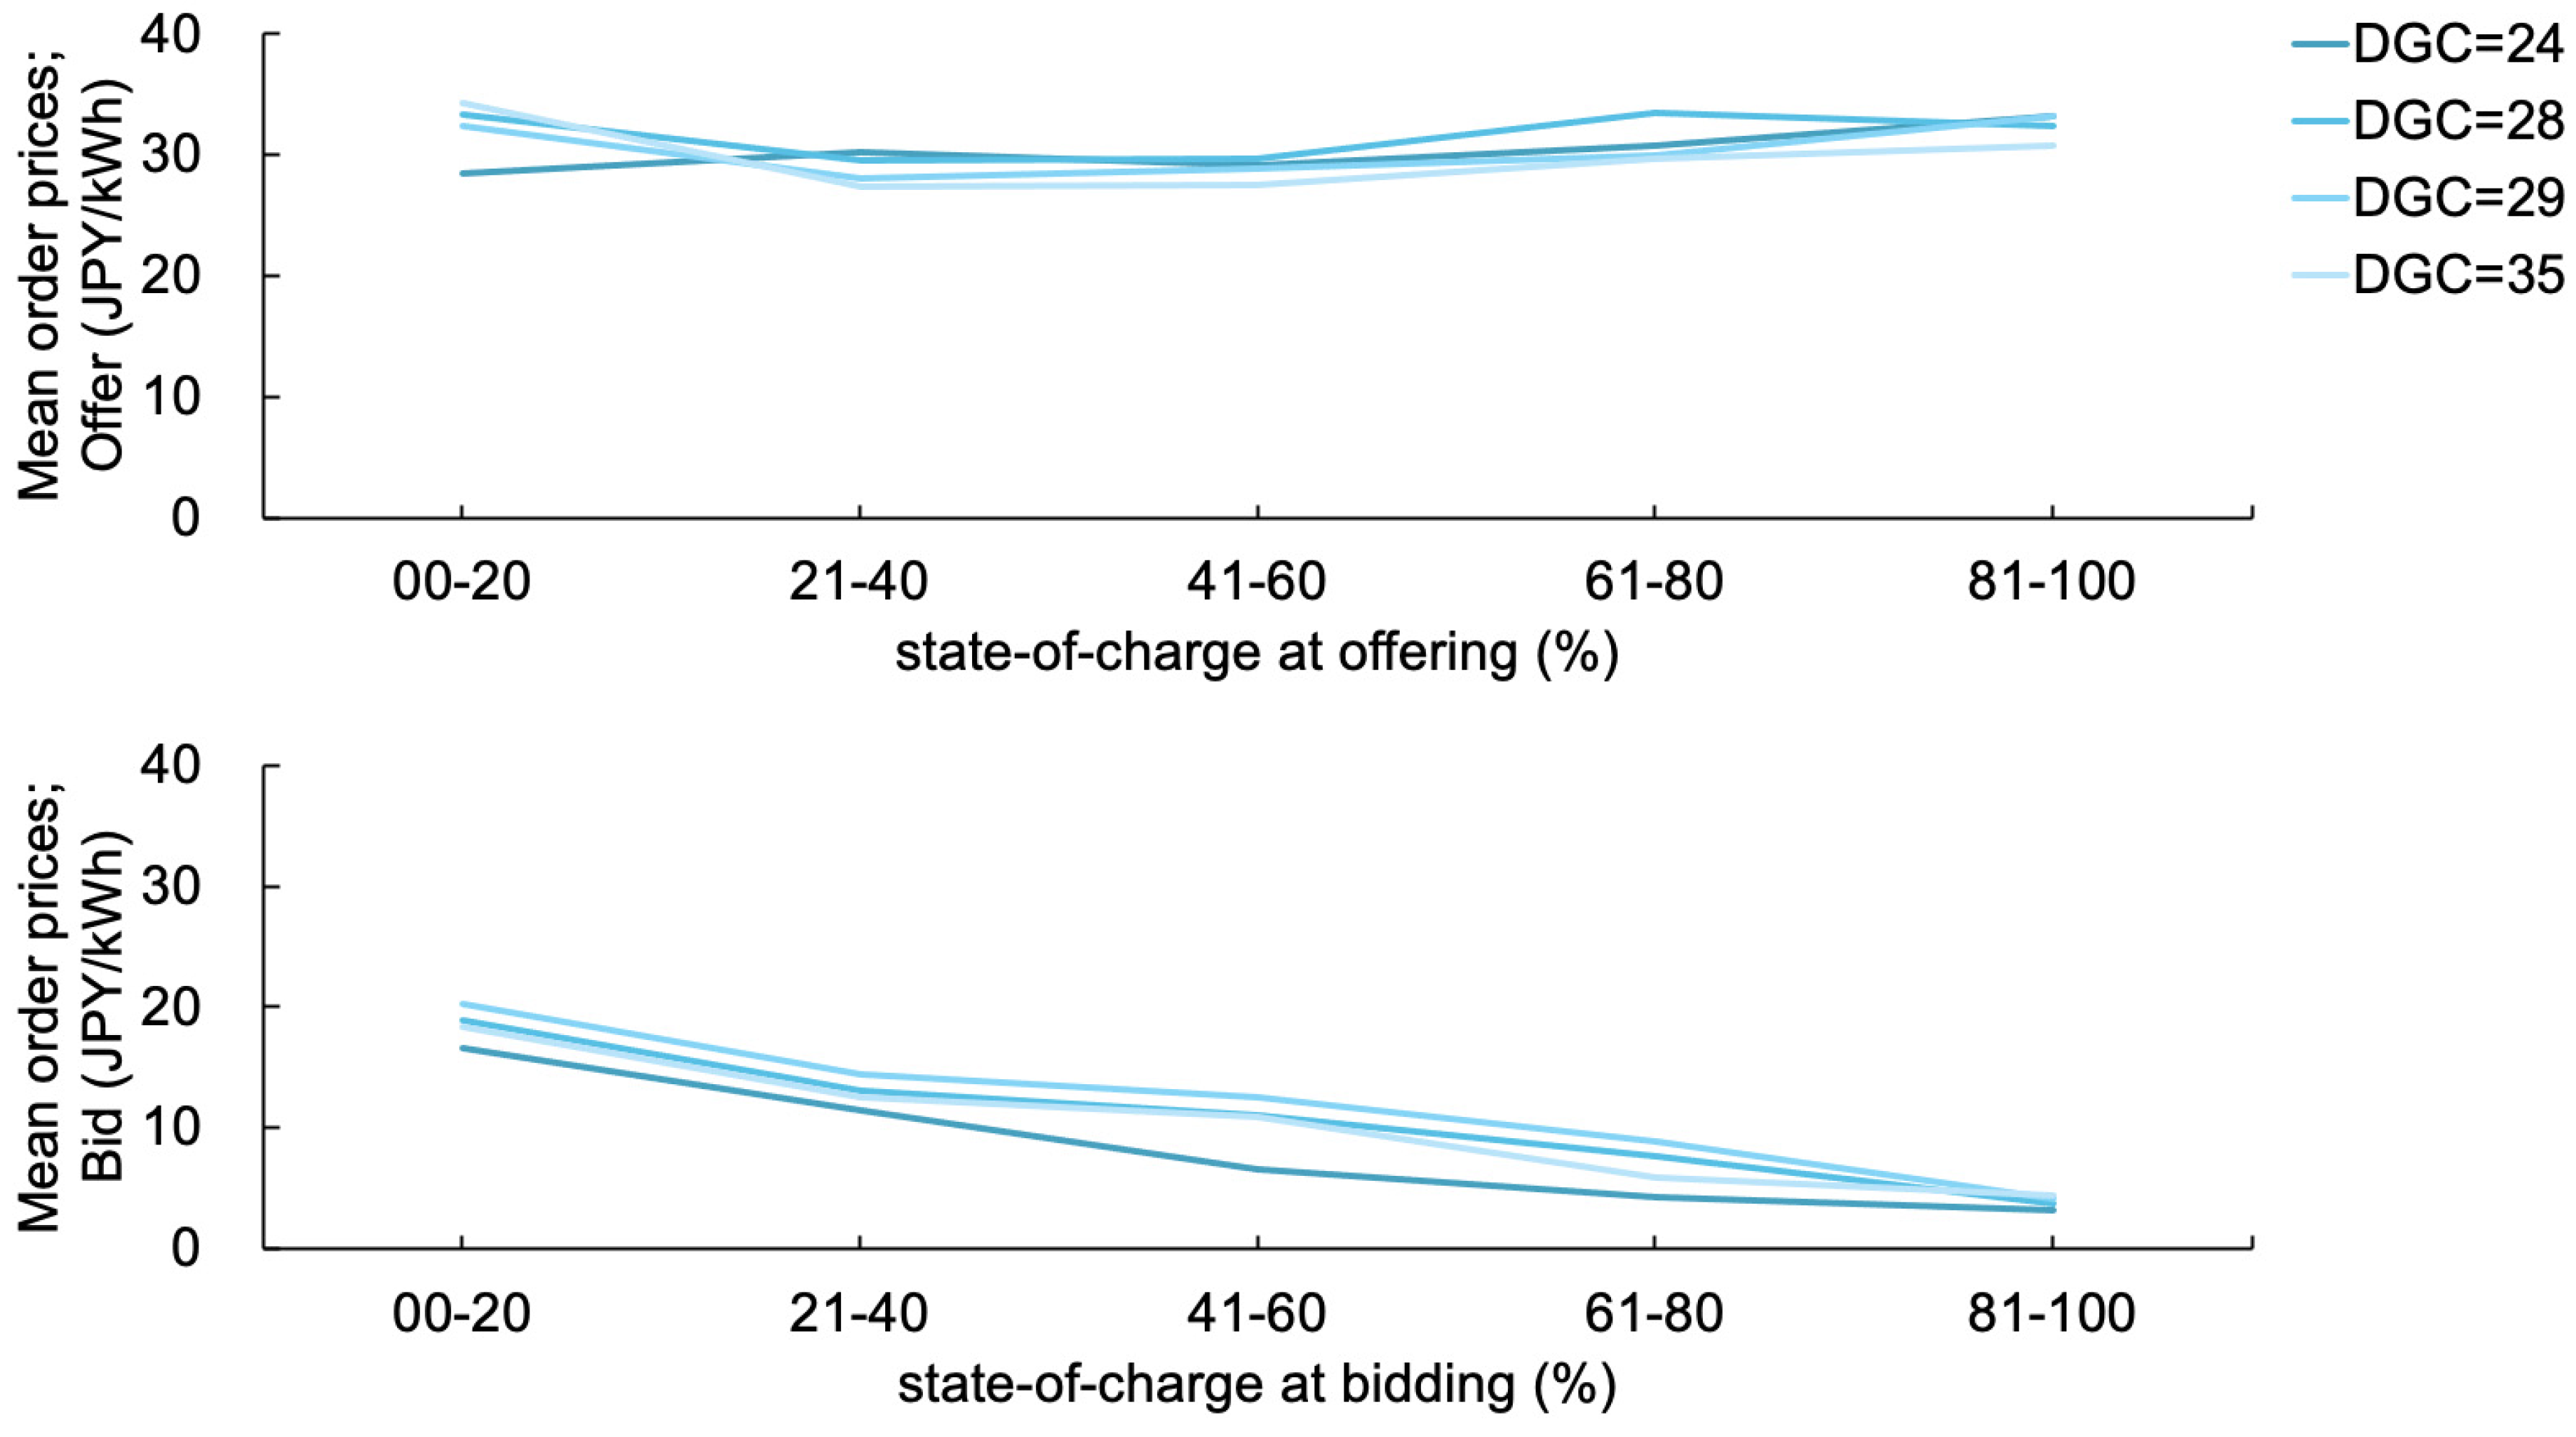
3.3.3. Relation between Order Volumes/Prices and State-of-Charge (SoC) of Battery Storages

Each of the residences analyzed in this study had a lithium-ion battery. The SoC is the ratio of the residual charges remaining in the battery storage to the battery capacity. The SoC is expressed in percentage points, where 0% indicates an empty SoC and 100% indicates a full SoC. Figure 14 shows the appearance frequencies of each SoC during the target period. Moreover, residences were distinguished using DGR identifiers (24, 28, 29, and 35). Overall, the trends were similar; for example, mid-level SoC (31–40 and 41–50) was a frequent occurrence, whereas high SoC (91–100) and low SoC (0 and 1–10) occurrences were rare.
Figure 15 shows the total order volumes for each SoC during the target period. The upper panel represents the total offer volumes for each SoC, and the lower panel represents the total order volumes for the bids.
Figure 16 shows the mean order prices for each SoC in the target period, where the upper panel represents the mean offer prices for each SoC, and the lower panel represents those for the bids. The mean order prices are the averages weighted by the order volumes. Both horizontal axes represent the ranges of SoC; for example, “00–20” indicates that the SoC was between 0% and 20% when the order was placed. Overall, we observed four different volumes and prices because each residence posted orders individually.
The total offer volumes were small when the SoC at the time of the ordering offers was low (00–20), and the total offer volumes were steady at 0.2–0.4 MWh when the SoC was higher than 20% (21–40, 41–60, 61–80, and 81–100). The total bid volumes were also small when the SoC at the time of the ordering bids was low (00–20) and gradually declined when the SoC was higher (21–40, 41–60, 61–80, and 81–100). The total bid volumes were more numerous than the offer volumes. Moreover, the differences were more significant when the SoC values were in the middle (21–40 and 41–60), and less significant when the SoC values were high (61–80 and 81–100; offer volumes were between 0.27 and 0.30 MWh, whereas the bids volumes were between 0.30 and 0.33 MWh).
Compared to the bid prices, the offered prices were relatively steady at 27–34 JPY/kWh. Moreover, the overall trend for the bid prices was: the higher the SoC values, the lower the price (for example, 12–14 JPY/kWh at 21–40 and 3–4 JPY/kWh at 81–100).

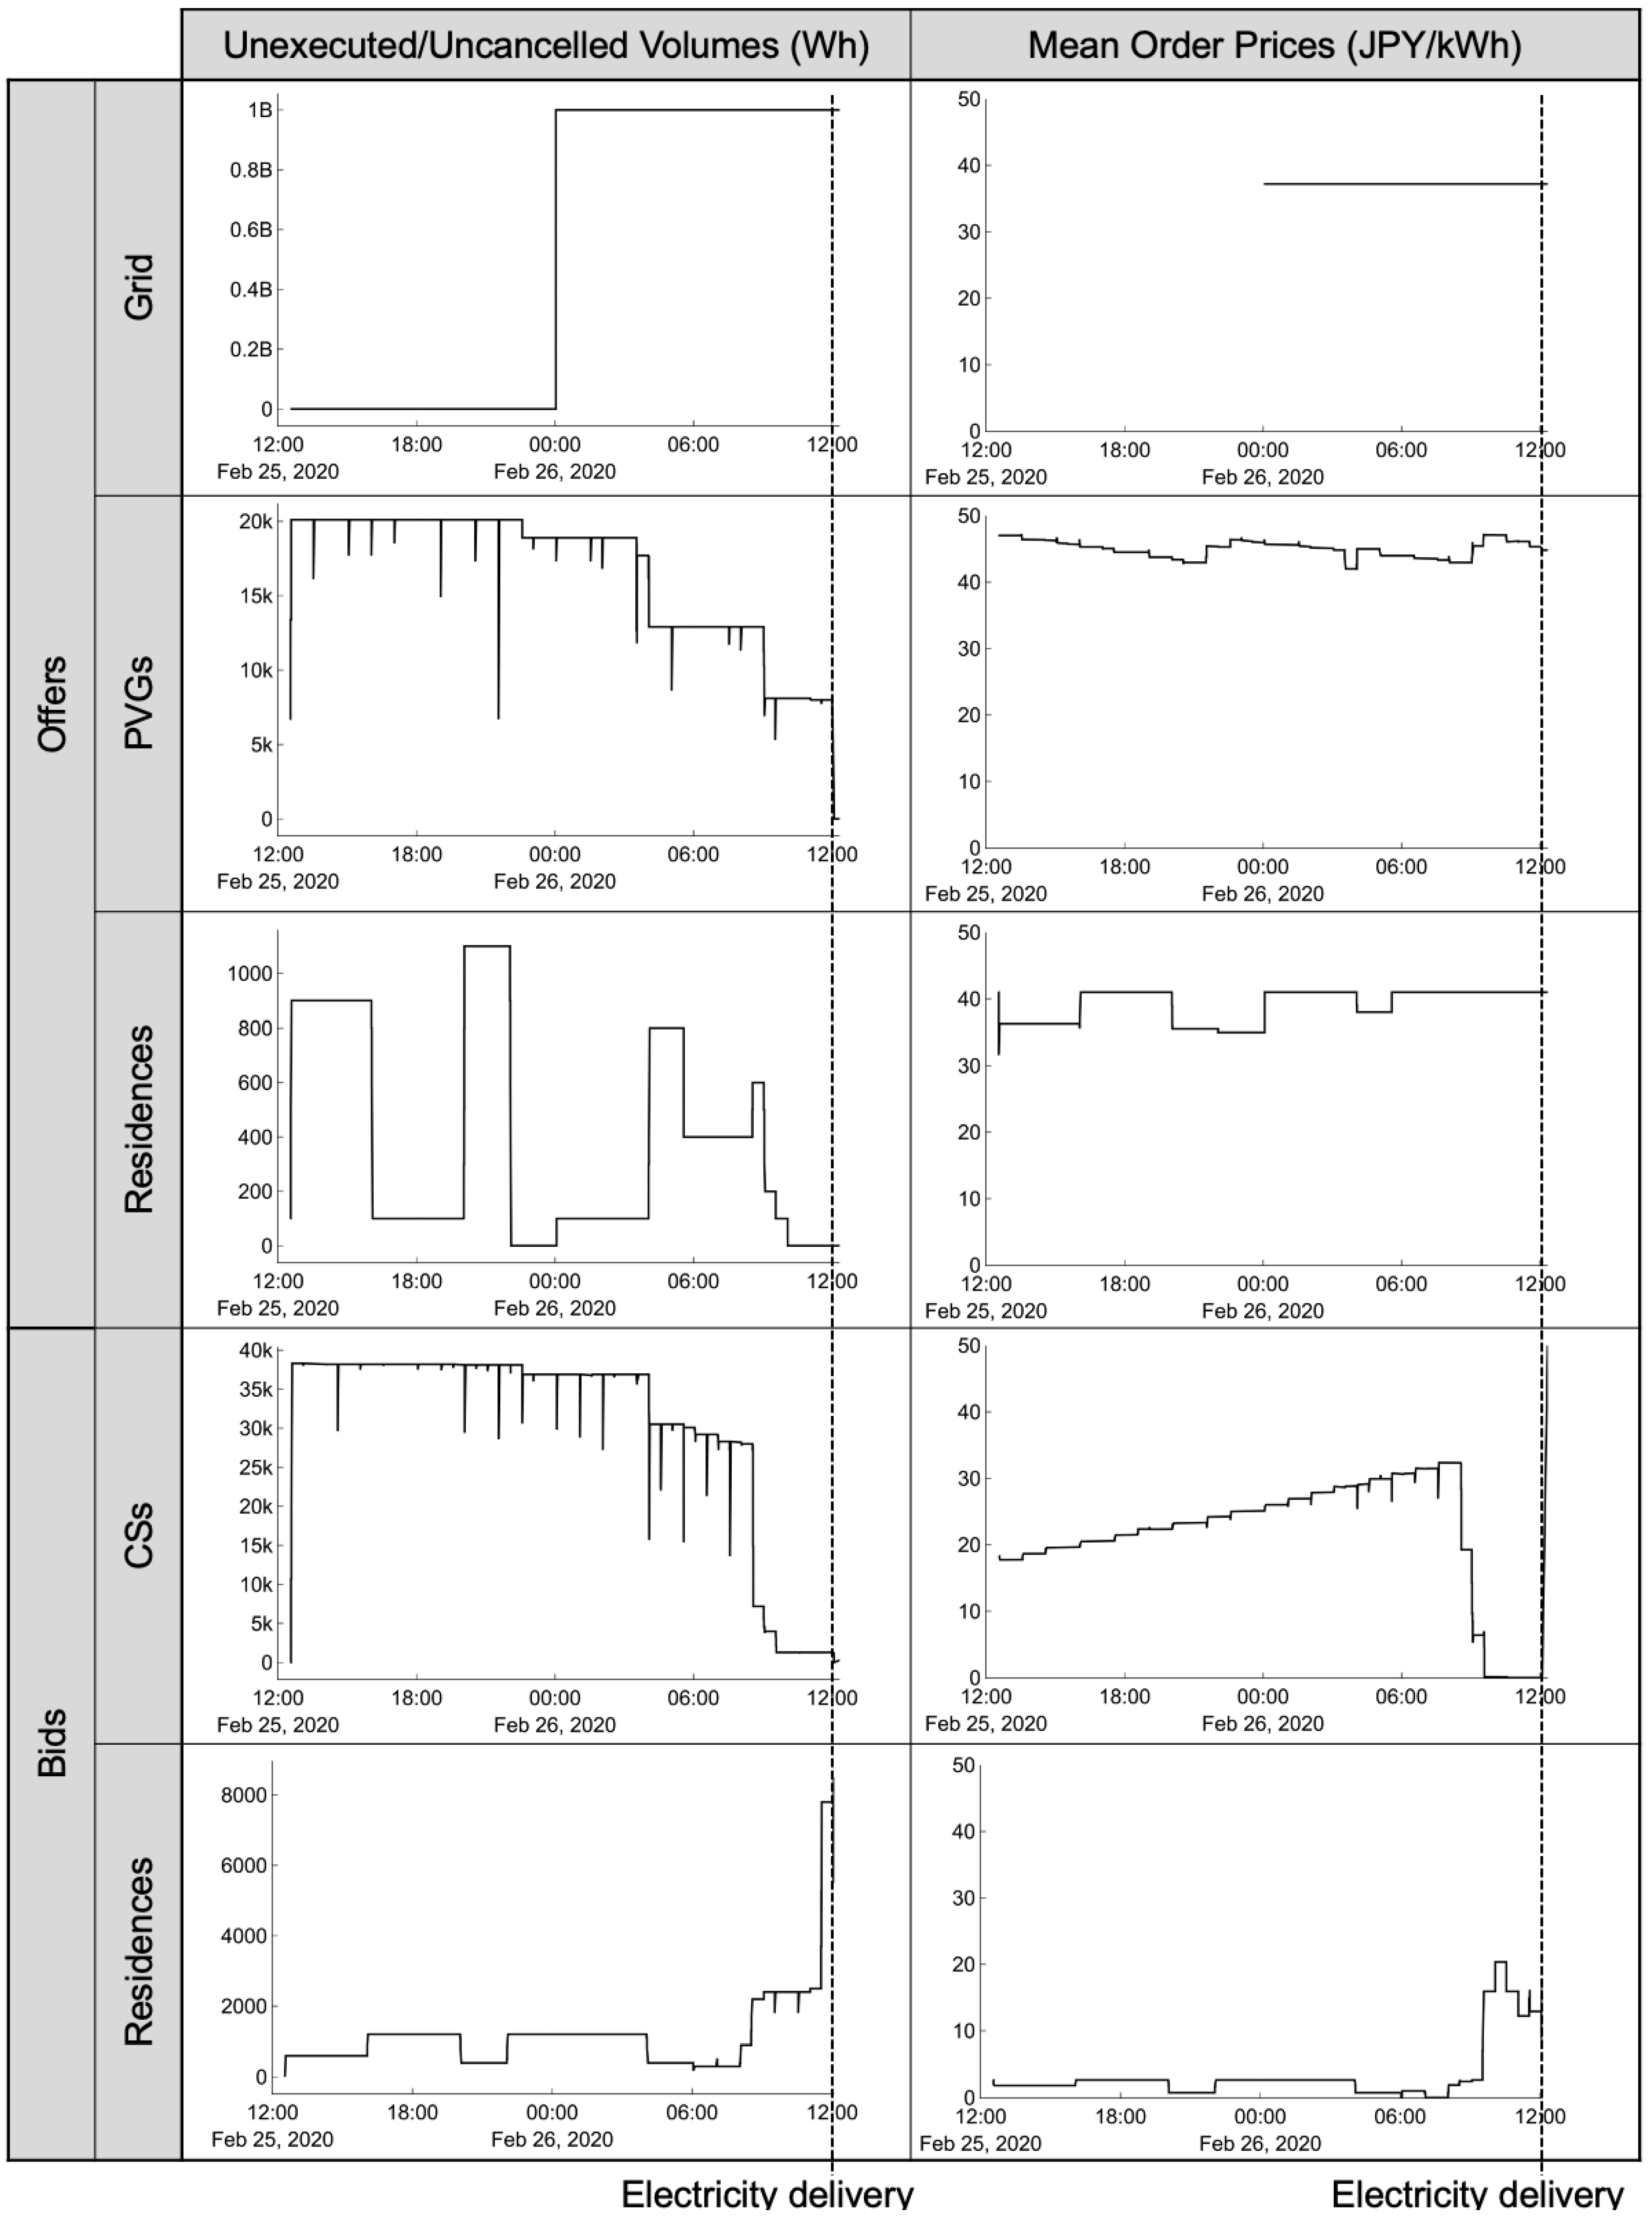
3.4. Chronological Analysis of Unexecuted/Uncancelled Volumes and Prices

This section analyzes the variations in the unexecuted/uncancelled volumes and prices in the order book at certain time intervals during the target period. Figure 17 shows the unexecuted/uncancelled volumes and prices for the delivery period of 12:00 to 12:30 on 26 February 2020. The left column depicts the variations in such volumes, while the right column denotes the mean prices during this period. The mean prices are the weighted averages of unexecuted/uncancelled volumes. The rows indicate the grid offers, PVG offers, residence offers, CS bids, and residence bids.
The volumes offered by the grid were significantly higher than the other requests, and the prices offered by the grid were flat. The volumes offered by the PVGs gradually decreased, and the mean prices offered by the PVGs declined with fluctuations as the time to electricity delivery approached zero. The volumes offered by the residences oscillated significantly, whereas the mean prices they offered were steady. The volumes bid by the CSs gradually decreased, and the mean prices bid by the CSs gradually increased until 9:00, three hours before electricity delivery was expected. The volumes and mean prices bid by the residences rapidly increased after 9:00, and the mean prices bid by the residences were lower than those bid by the grid and PVGs.

4. Discussion

4.1. Principal Findings

P2P energy markets, which prepare the opportunity for buying sides to purchase electricity at lower prices, and the chances for selling sides to supply electricity at higher prices, are expected to enhance the penetration of DERs [7]. Recently, demonstration projects featuring P2P energy markets on the physical power grids have increased [22,23,24,25,26,27,28]. One of them was the project conducted in Urawa-Misono District, Japan [29,30]. Although some studies have described the concept and the facilities of the project, few of them have quantitatively analyzed the prices and volumes transacted in the project [31,32]. Based on the results of our analysis, the following primary observations were noted:
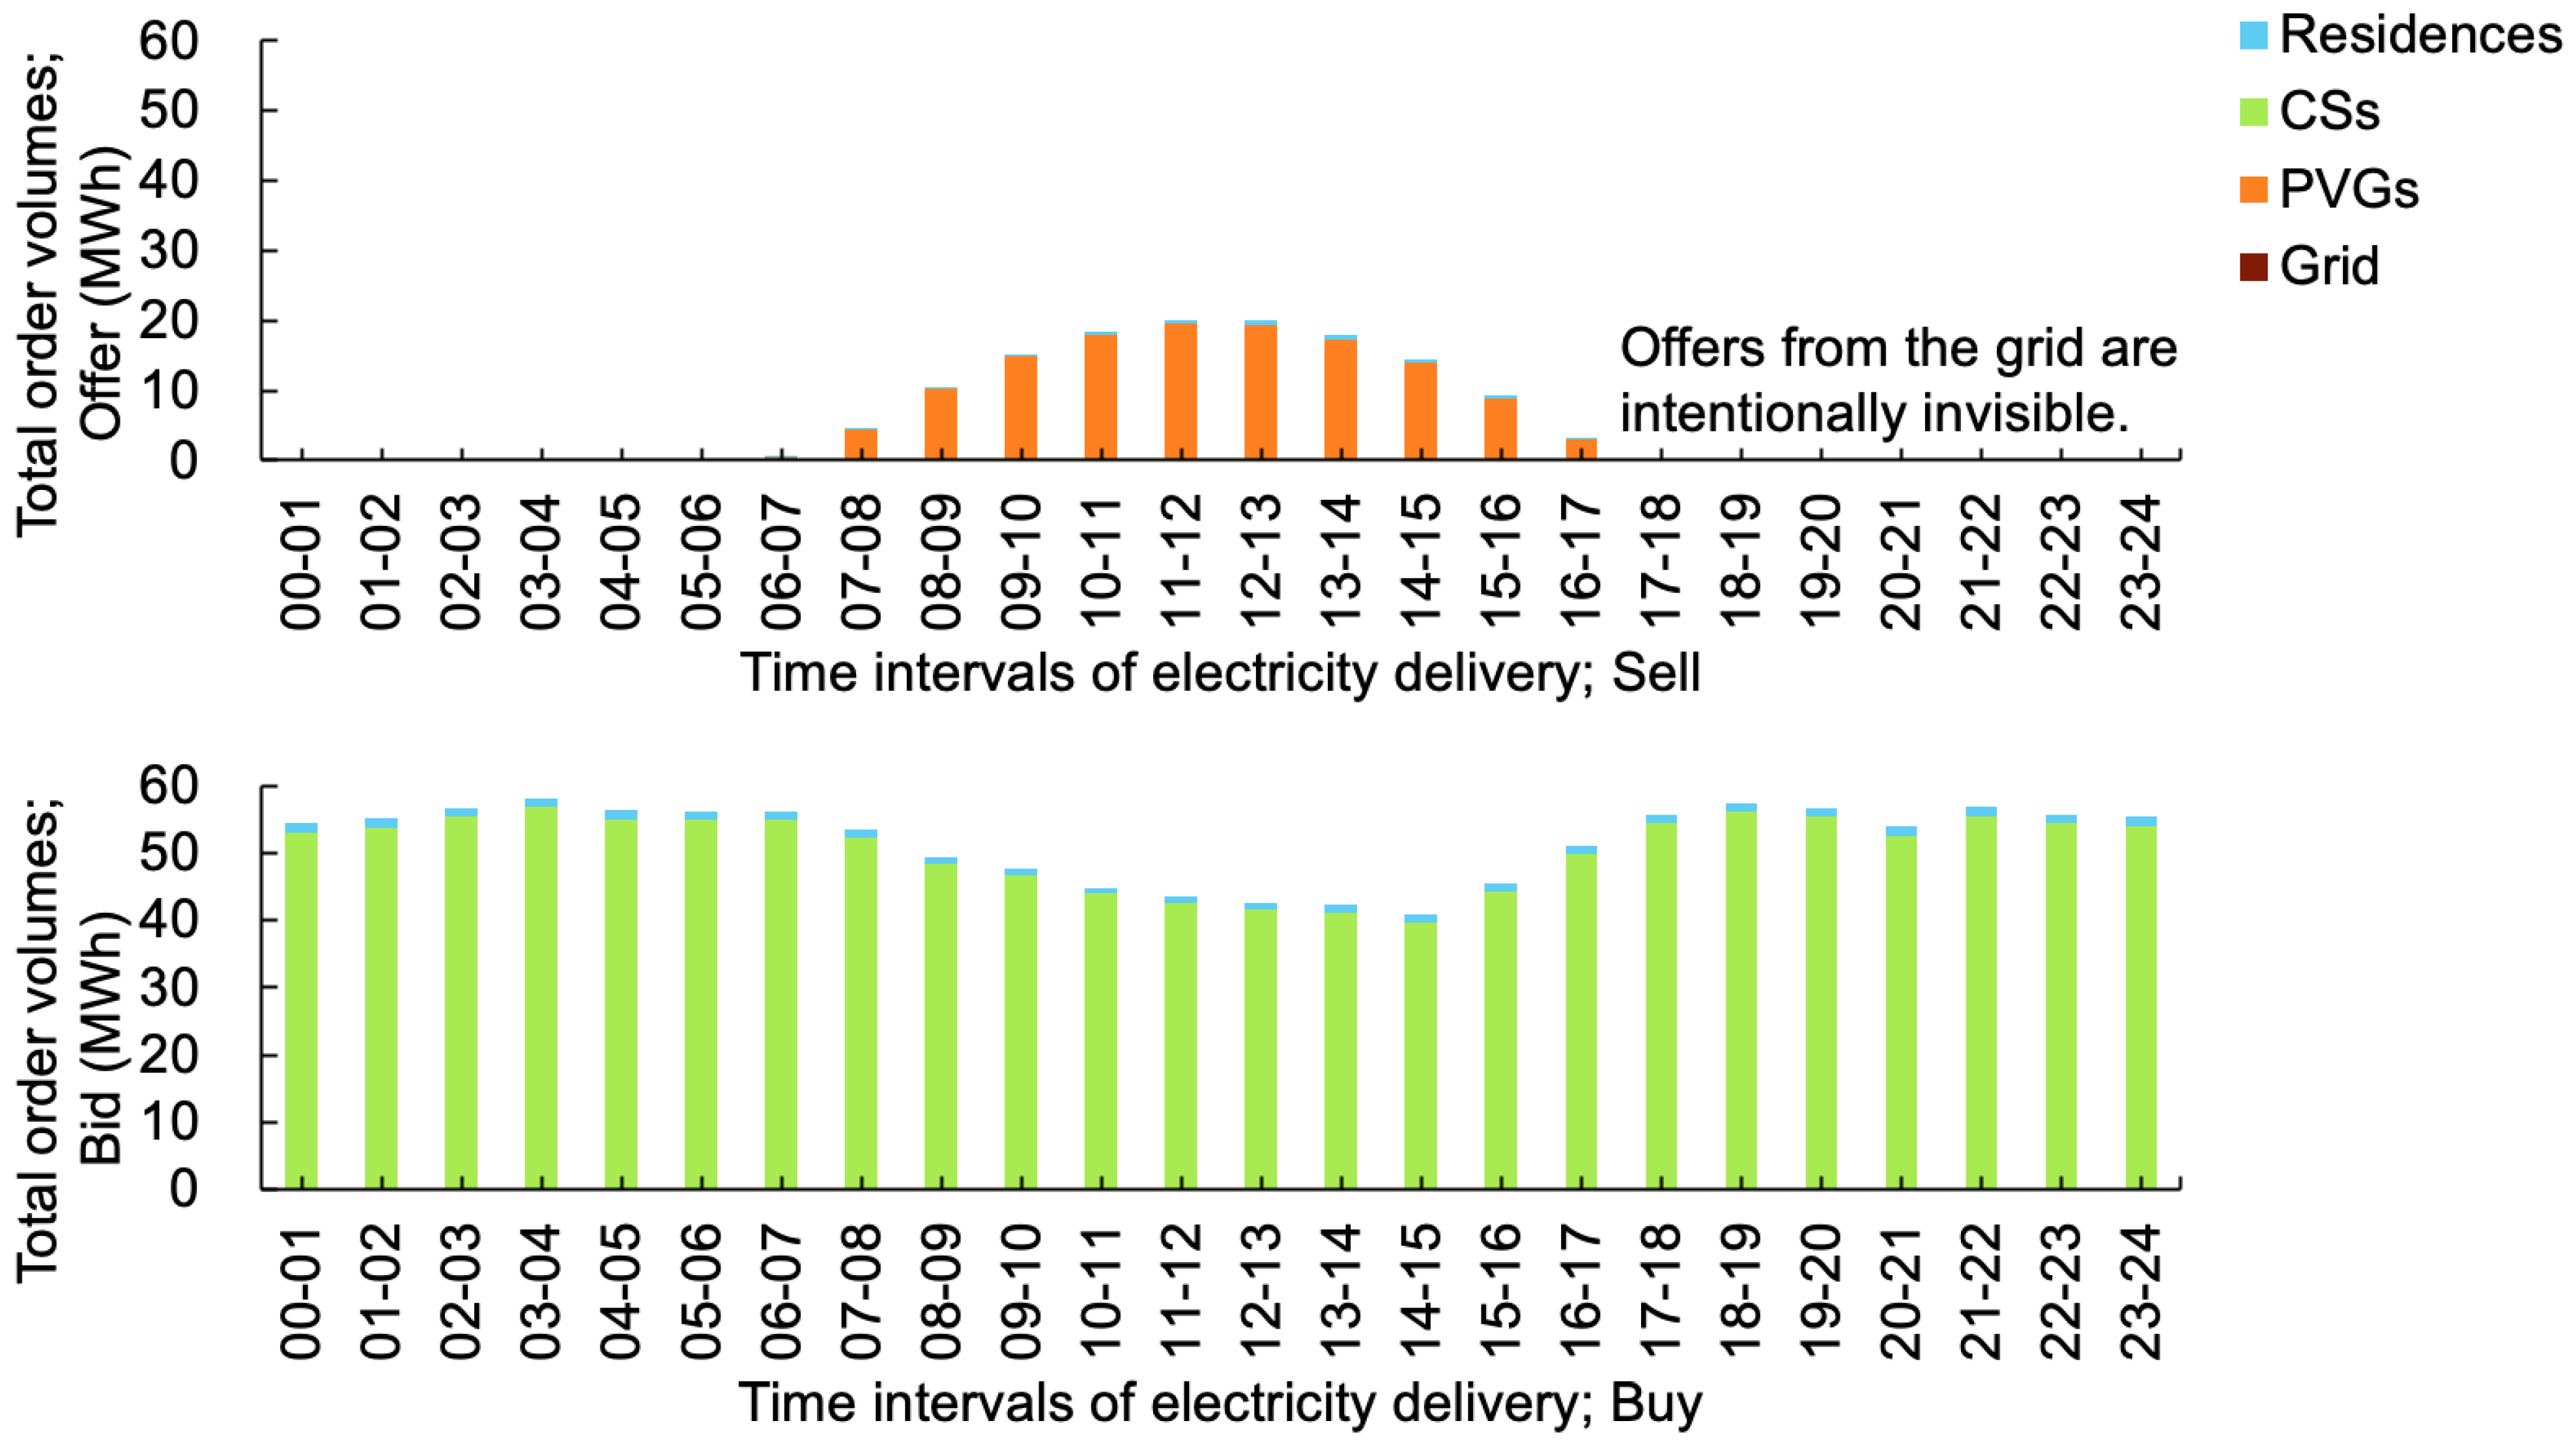
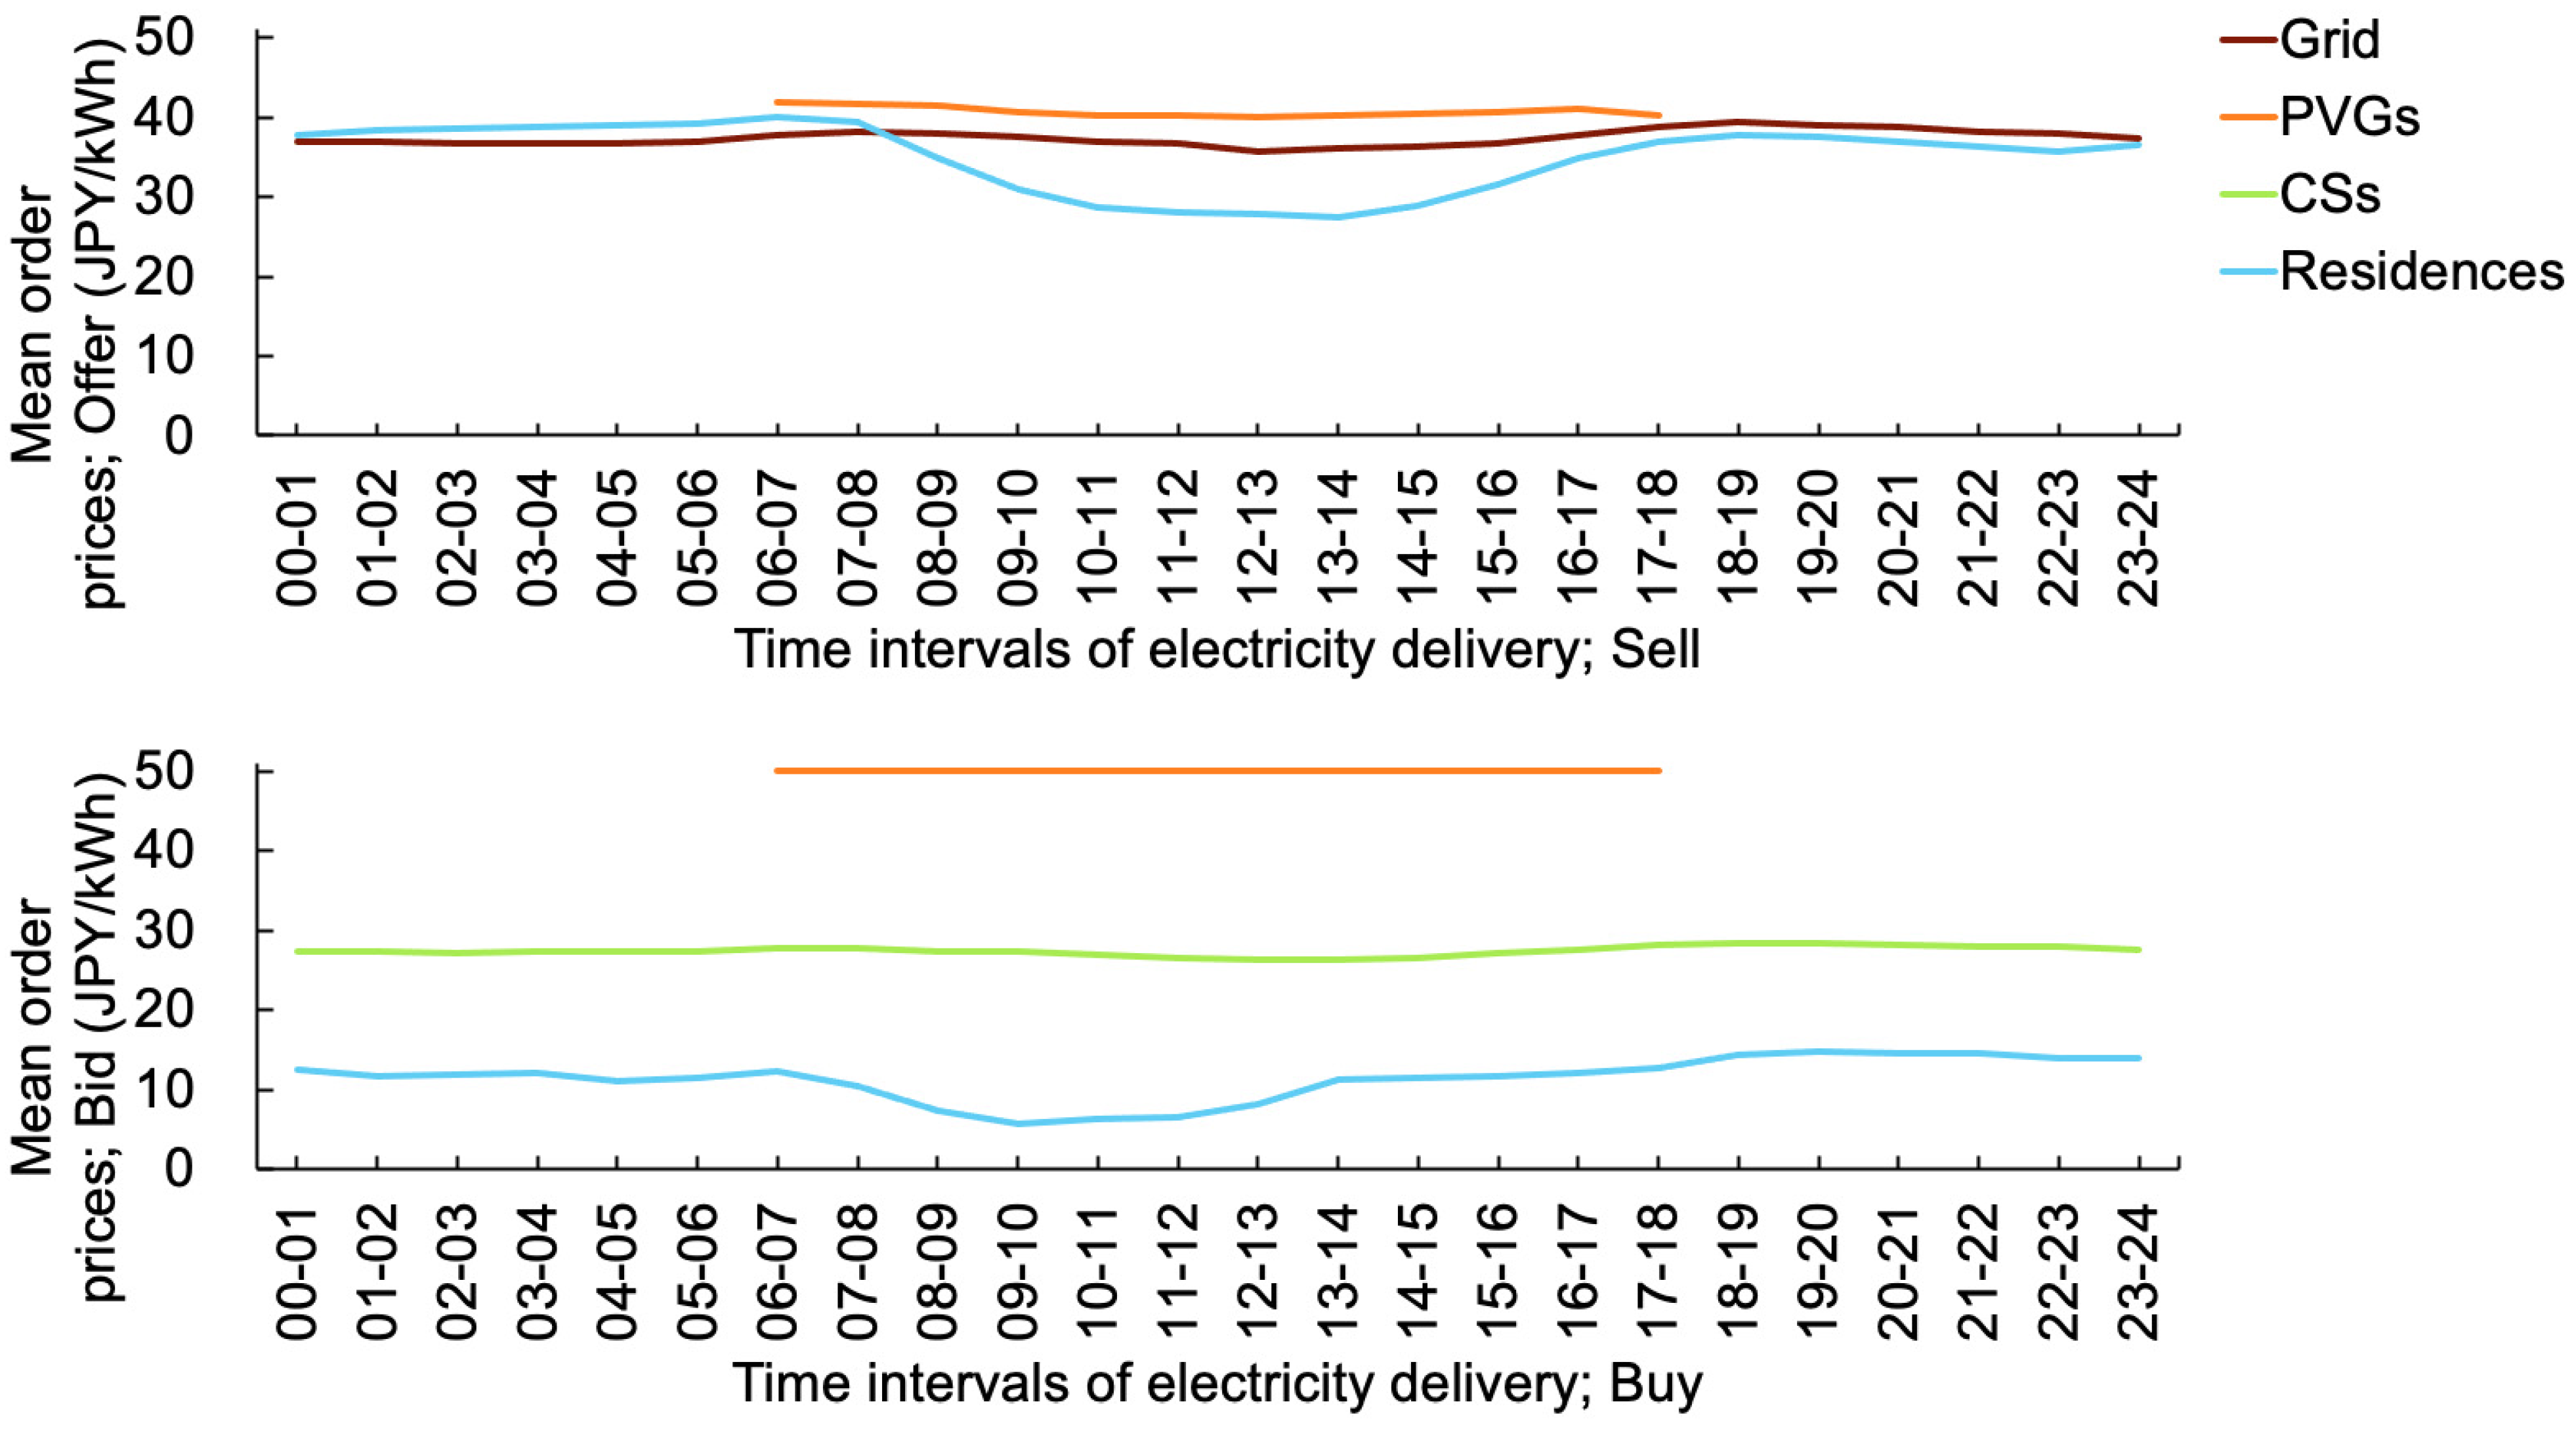
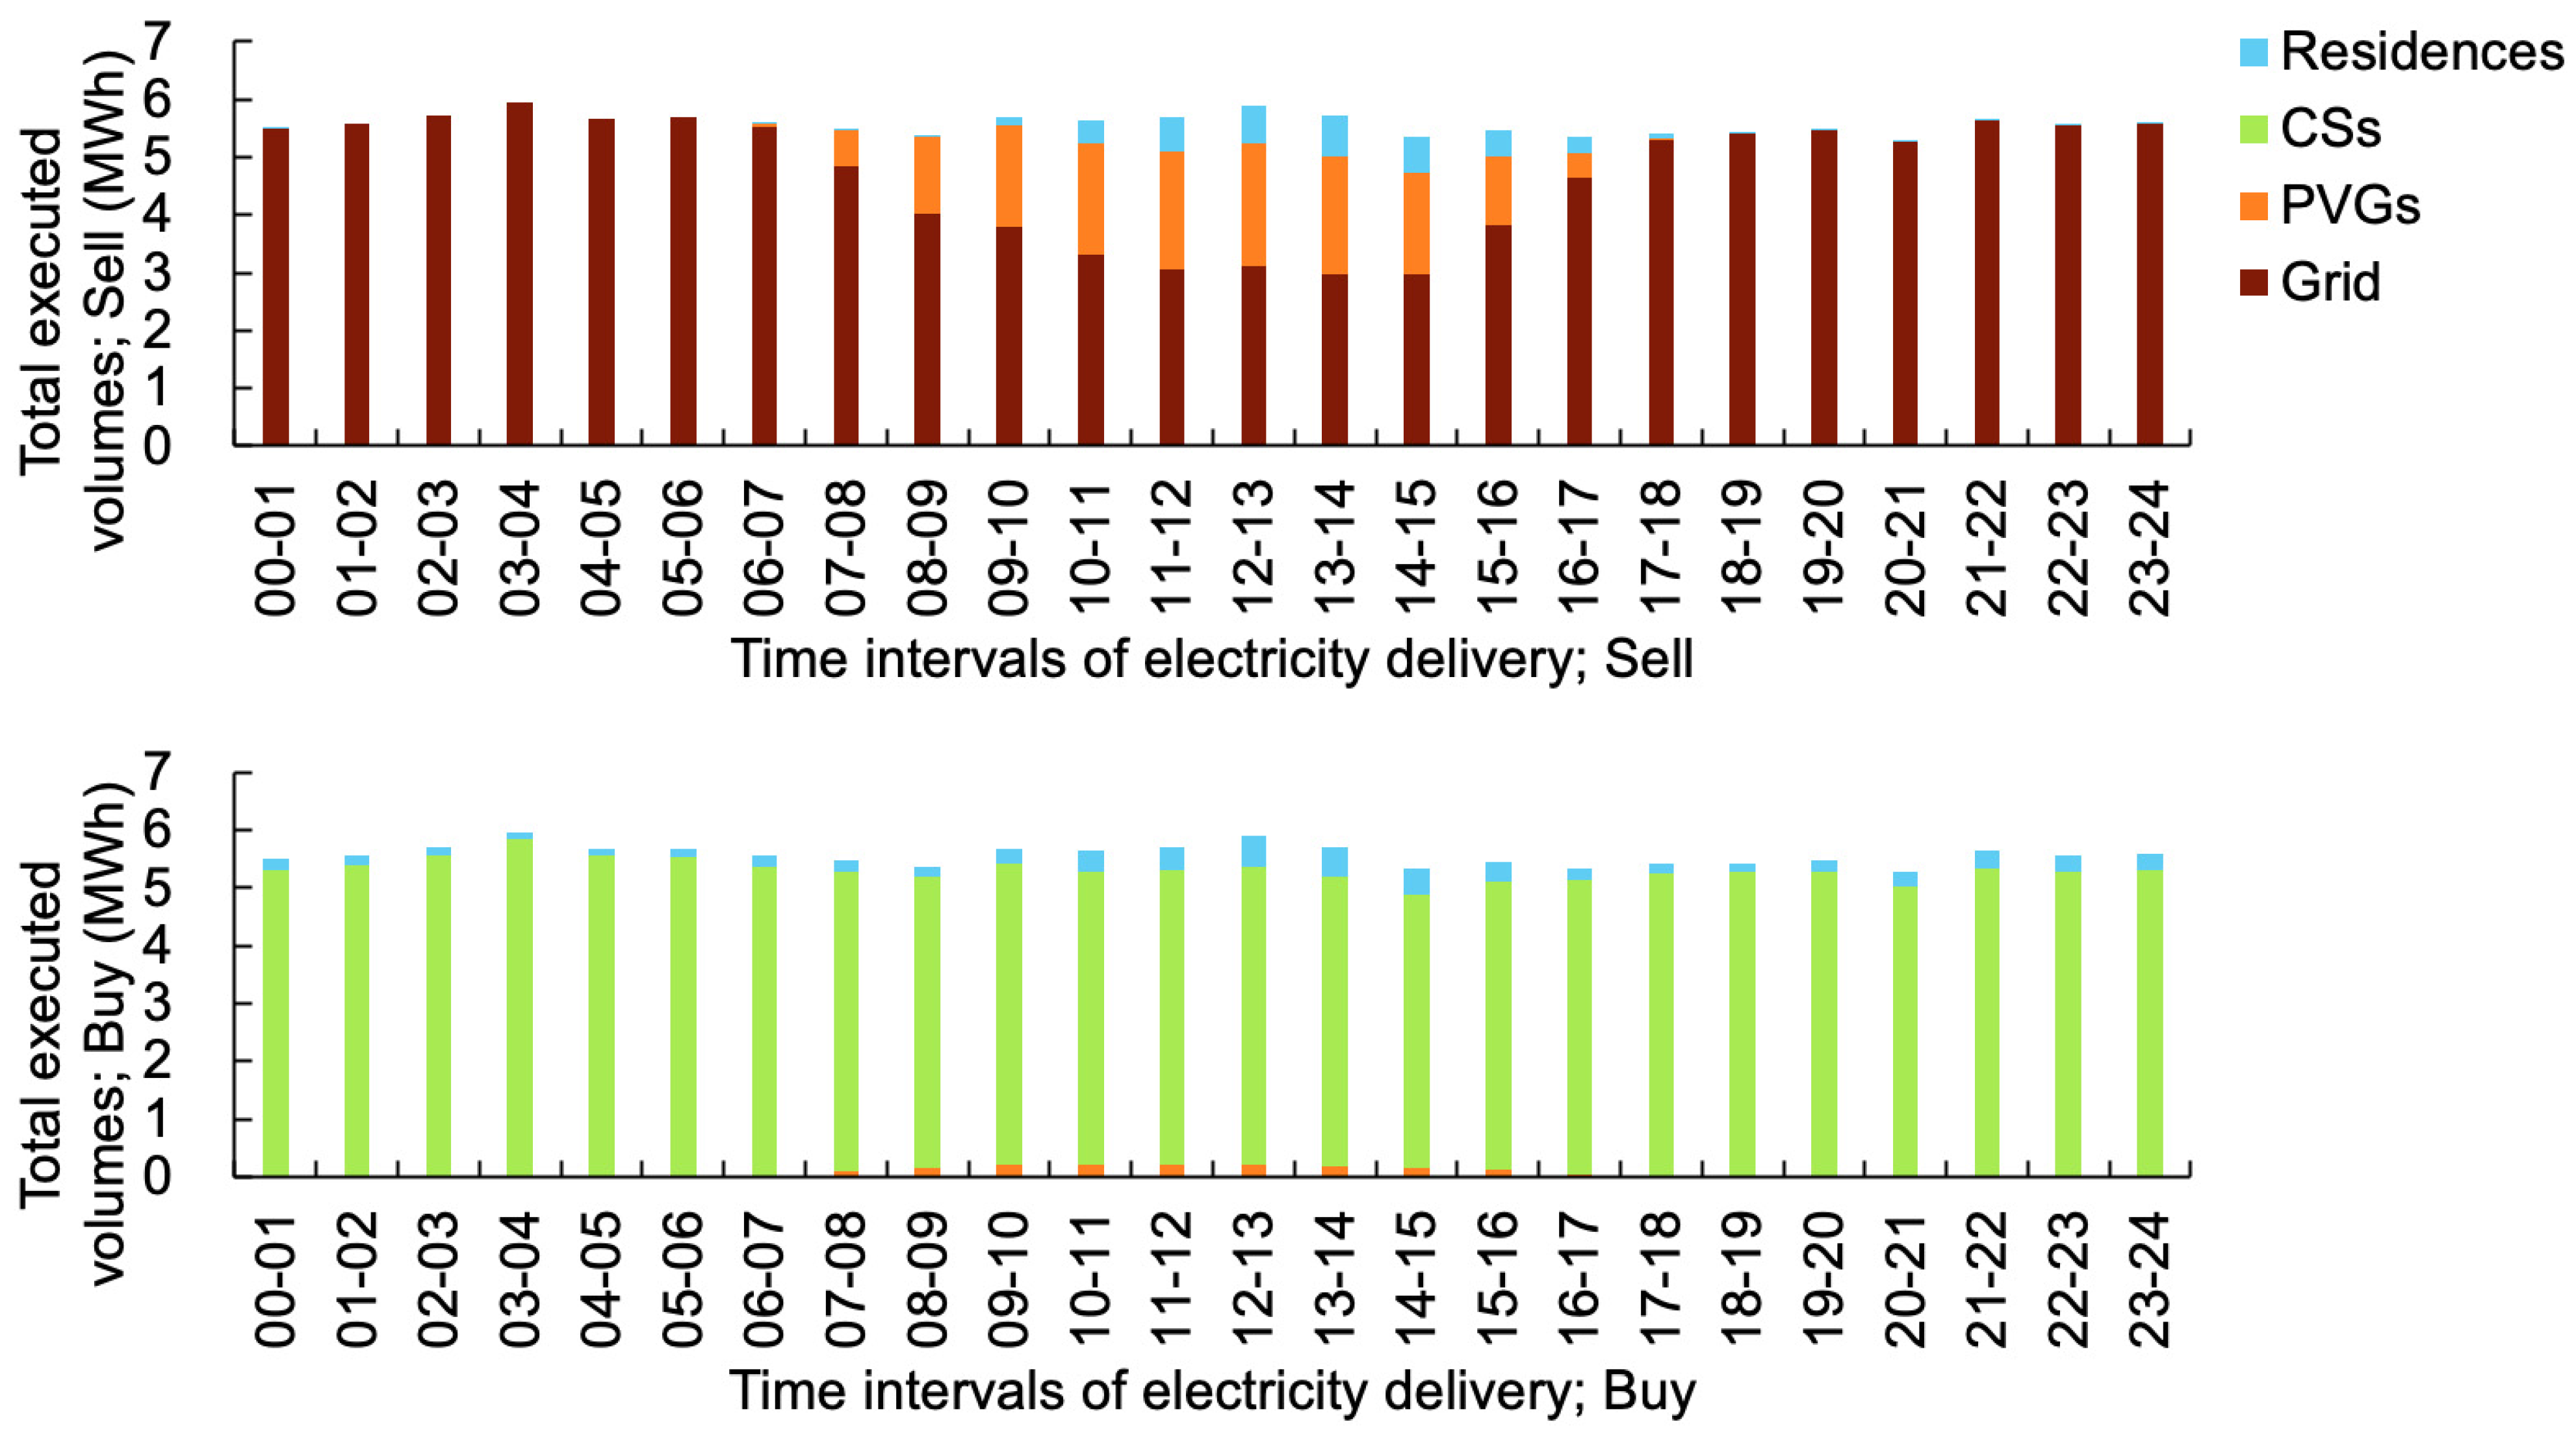
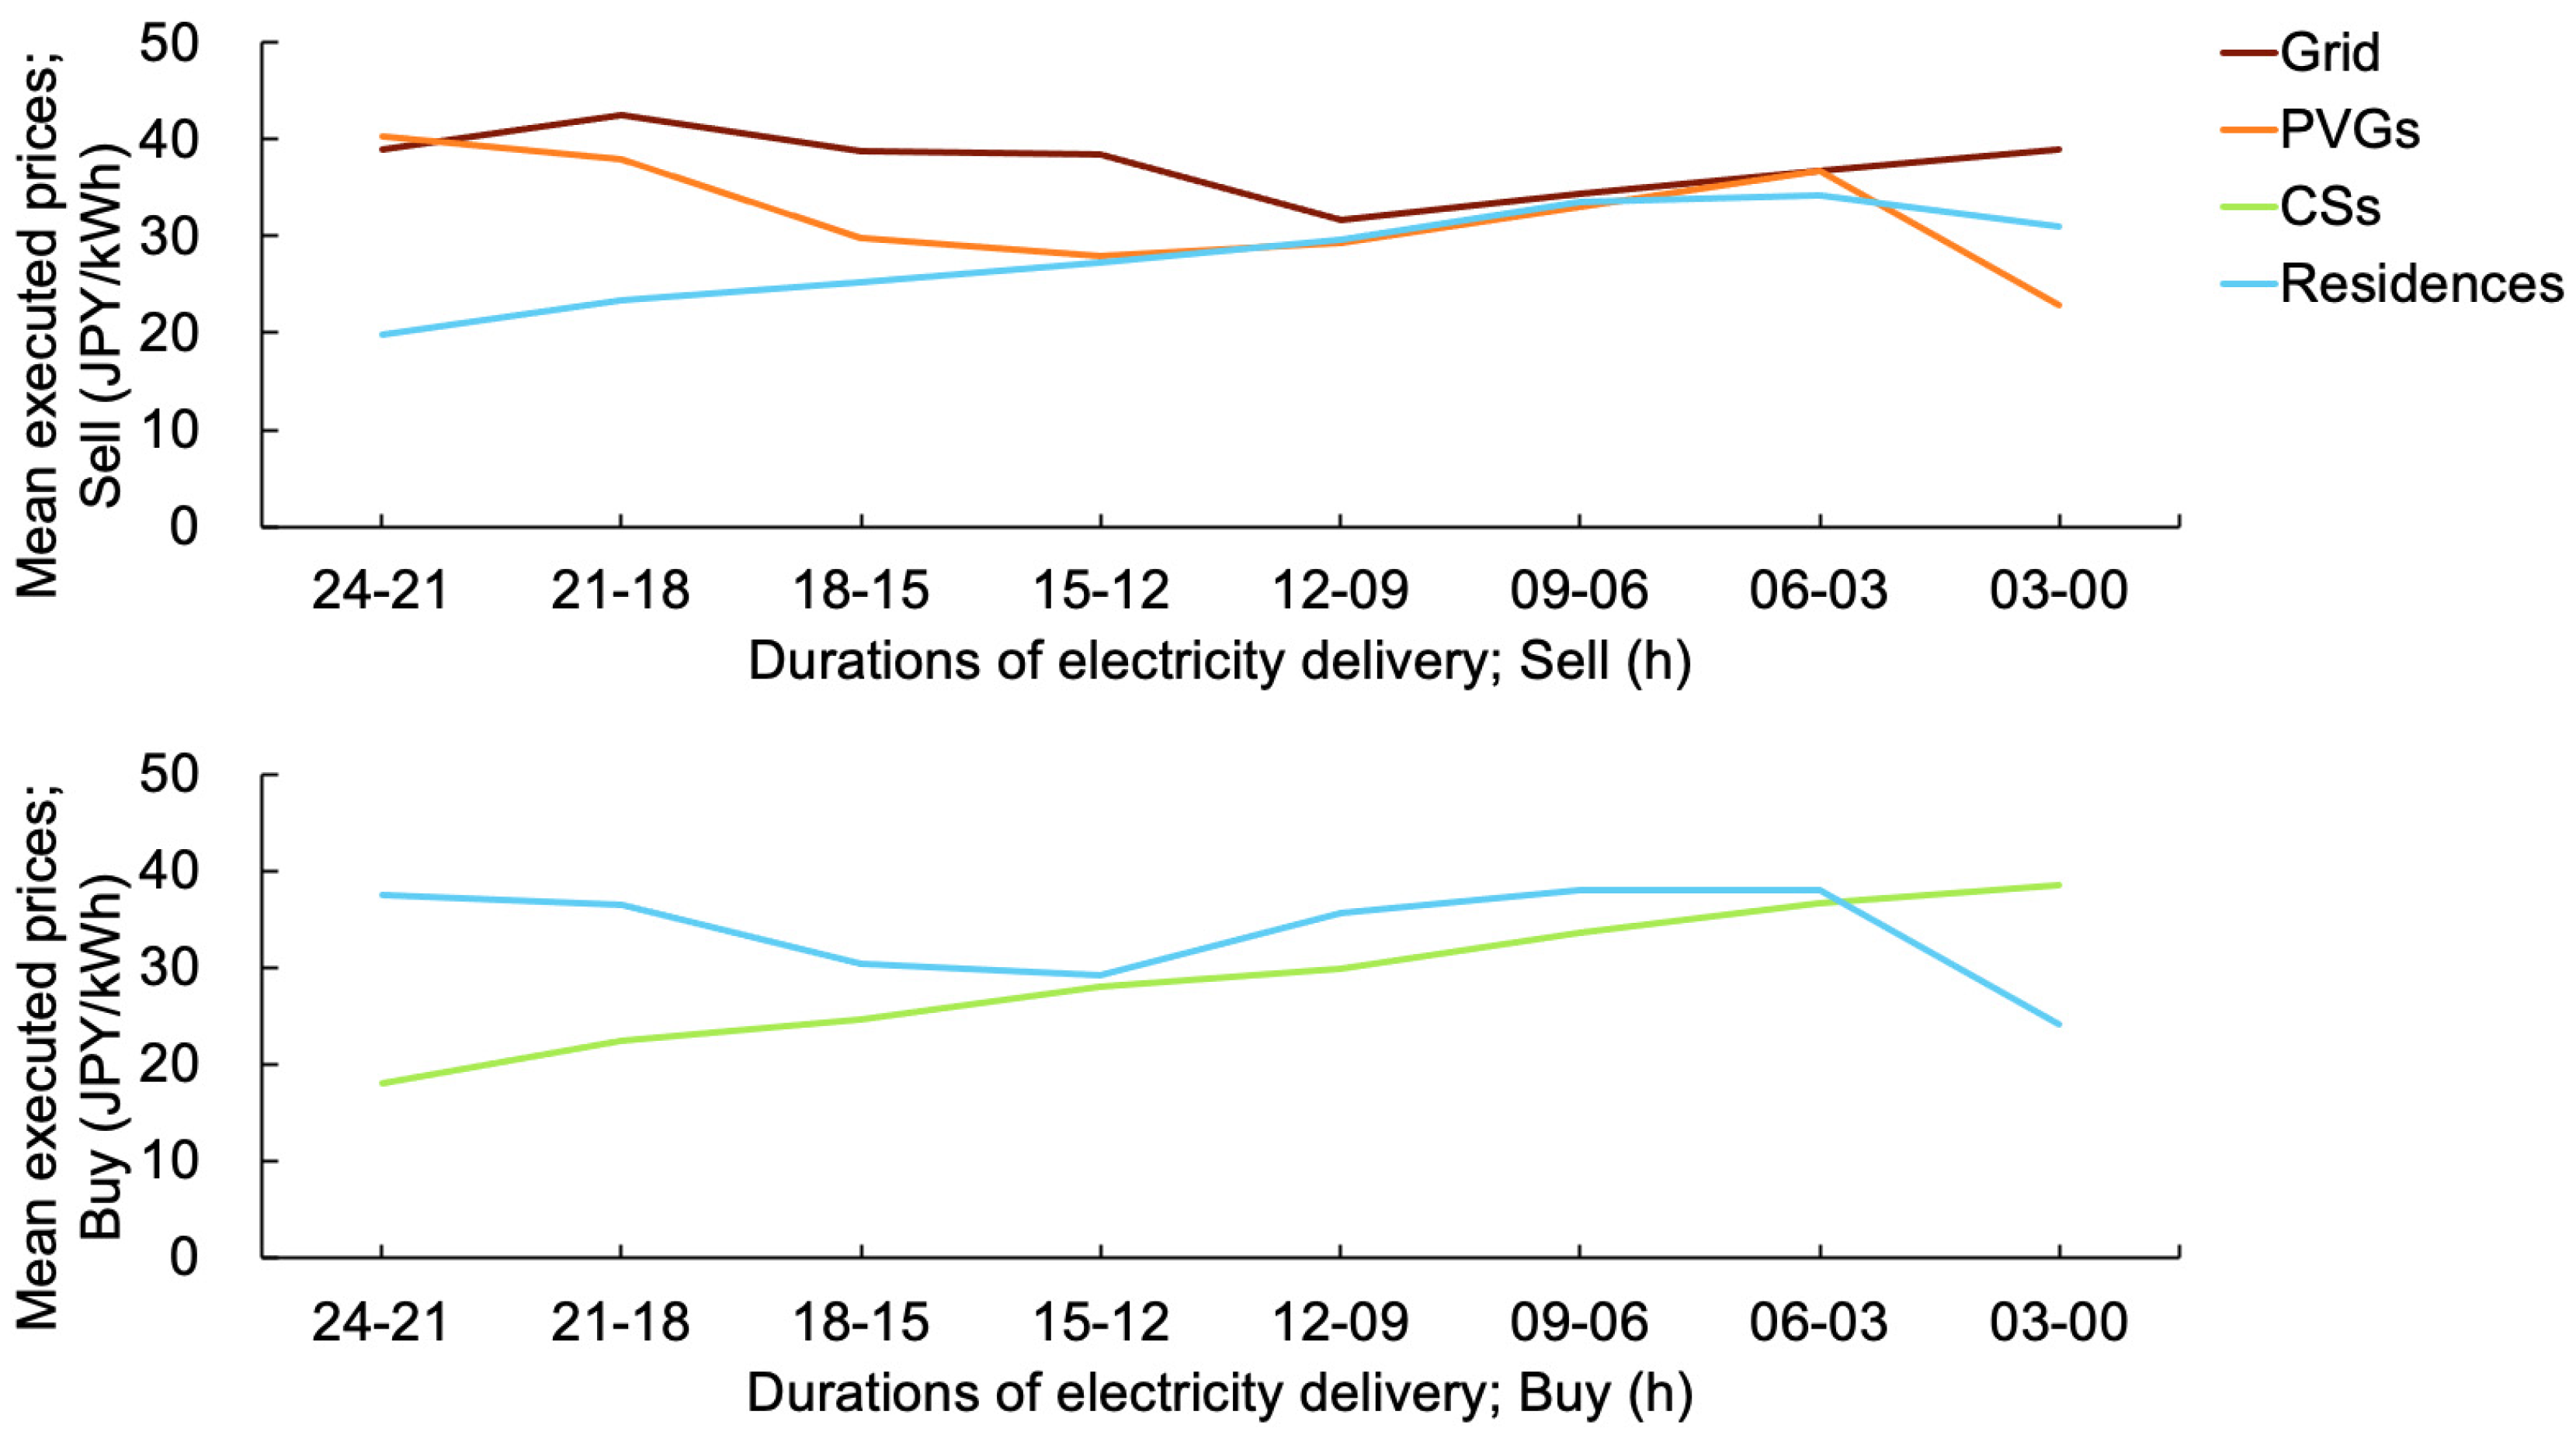
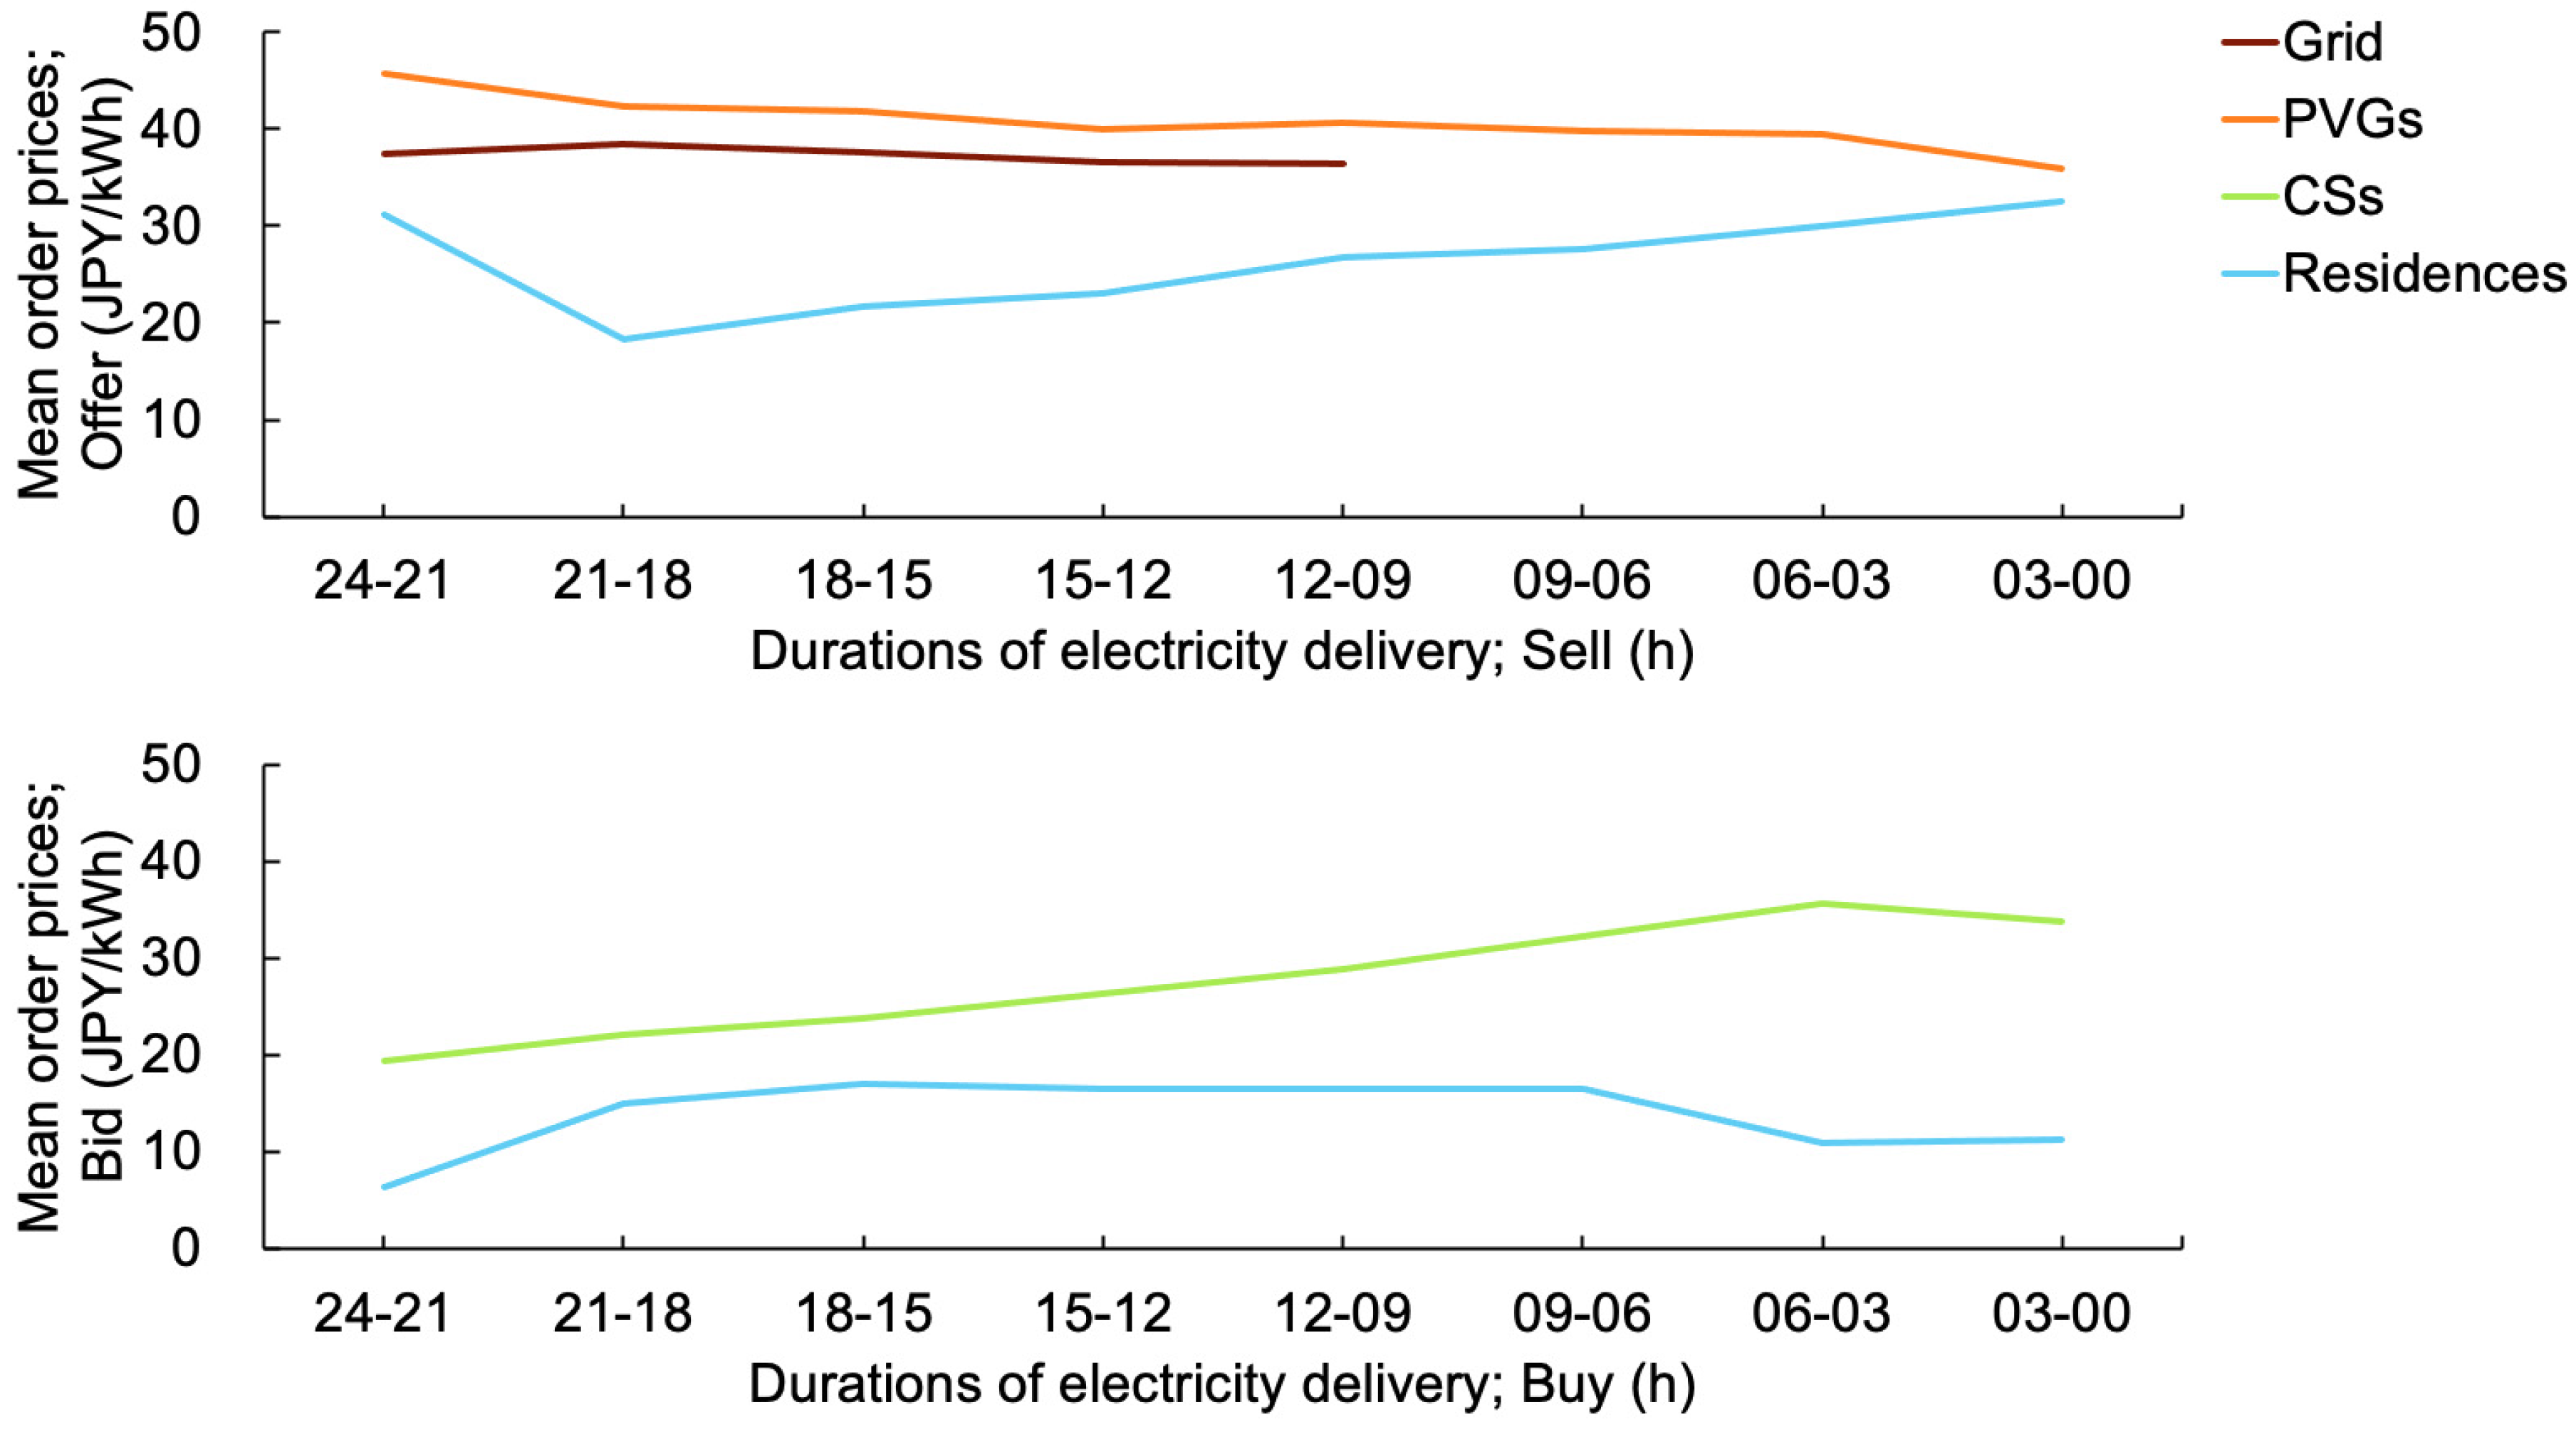
  • Since the main power source for the supply participants (expect grid) in the P2P electricity market is solar power, offer volumes tended to increase predominantly during the day (Figure 10). Therefore, the demand participants, such as the CSs and residences, probably expected to procure electricity at a lower price during the daytime. However, the residences were more successful in purchasing electricity at reasonable prices than CSs. Moreover, the order prices bid by the residences were lower than those bid by the CSs, regardless of the time intervals of electricity delivery (Figure 11). In the daytime, most of the volumes purchased by the residences were supplied by the PVGs (Figure 5), and the mean prices purchased by the residences were lower than those purchased by the CSs (Figure 7).
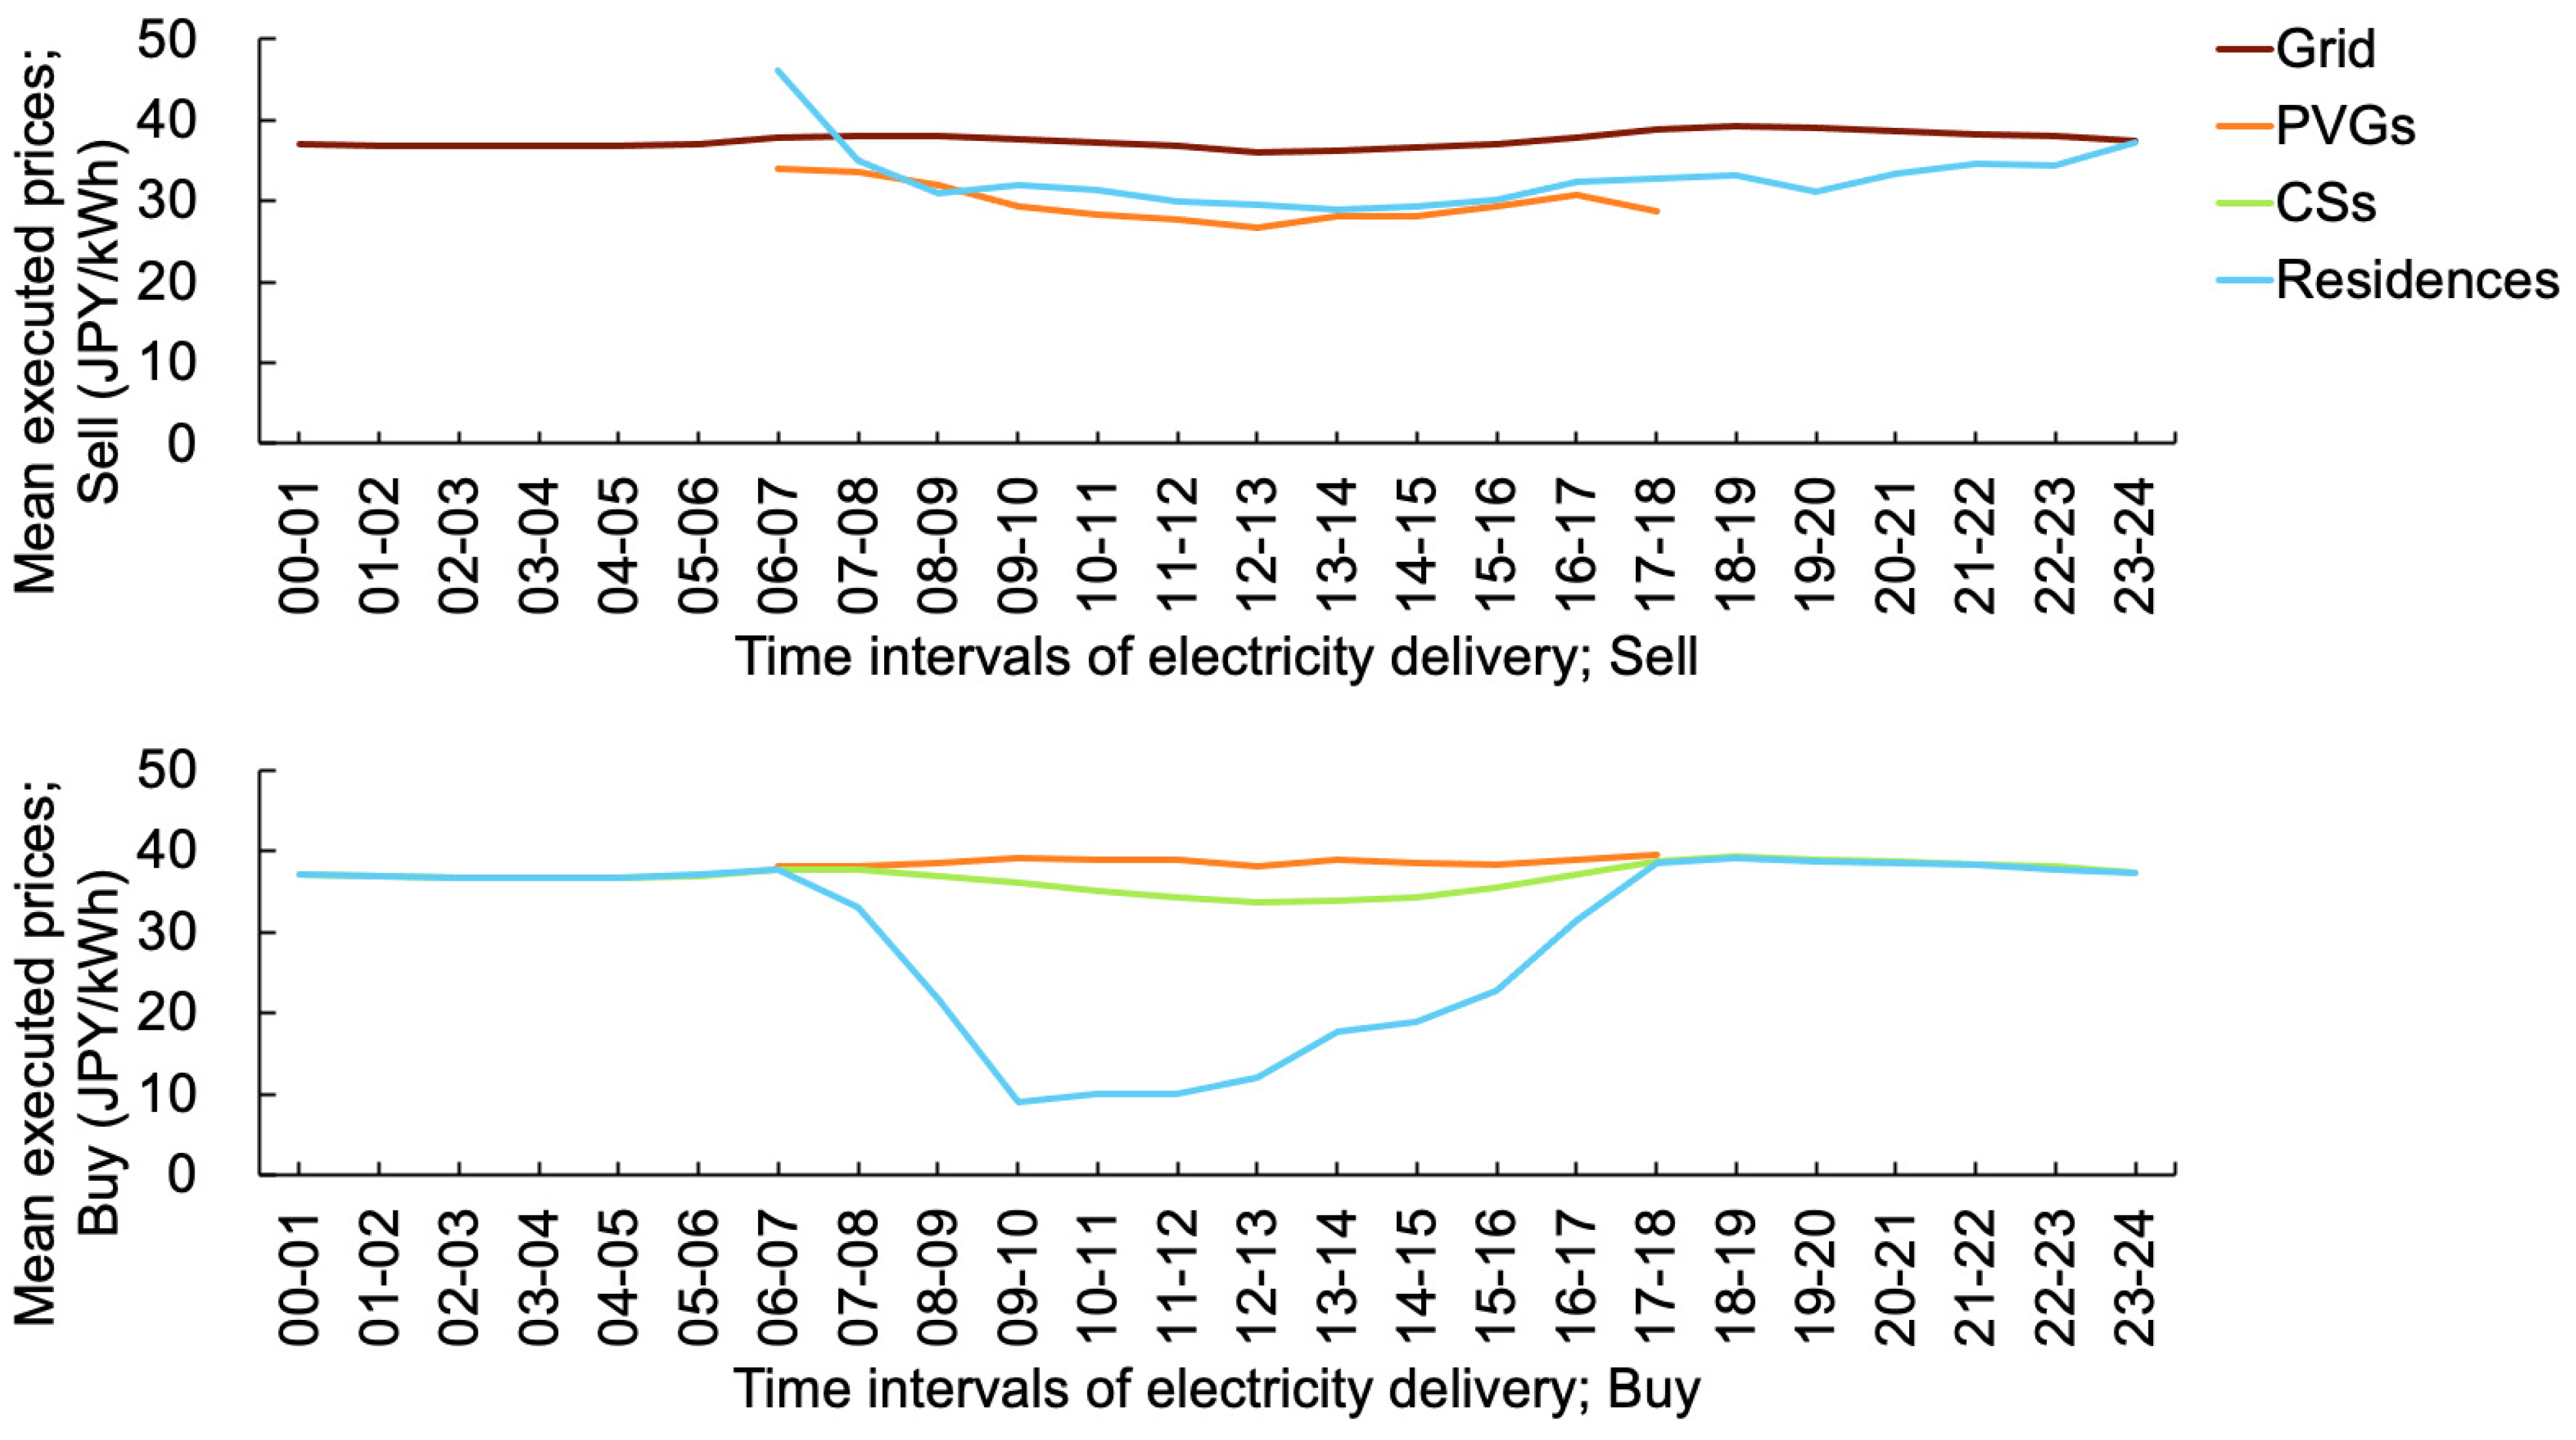
  • The residences appeared to continue executing more advantageous prices than the PVGs and CSs with the onset of the electricity delivery time. Moreover, the mean prices supplied by the residences were higher than those supplied by the PVGs, while the mean prices purchased by the residences were lower than those purchased by the CSs when the time of electricity delivery approached (Figure 9).
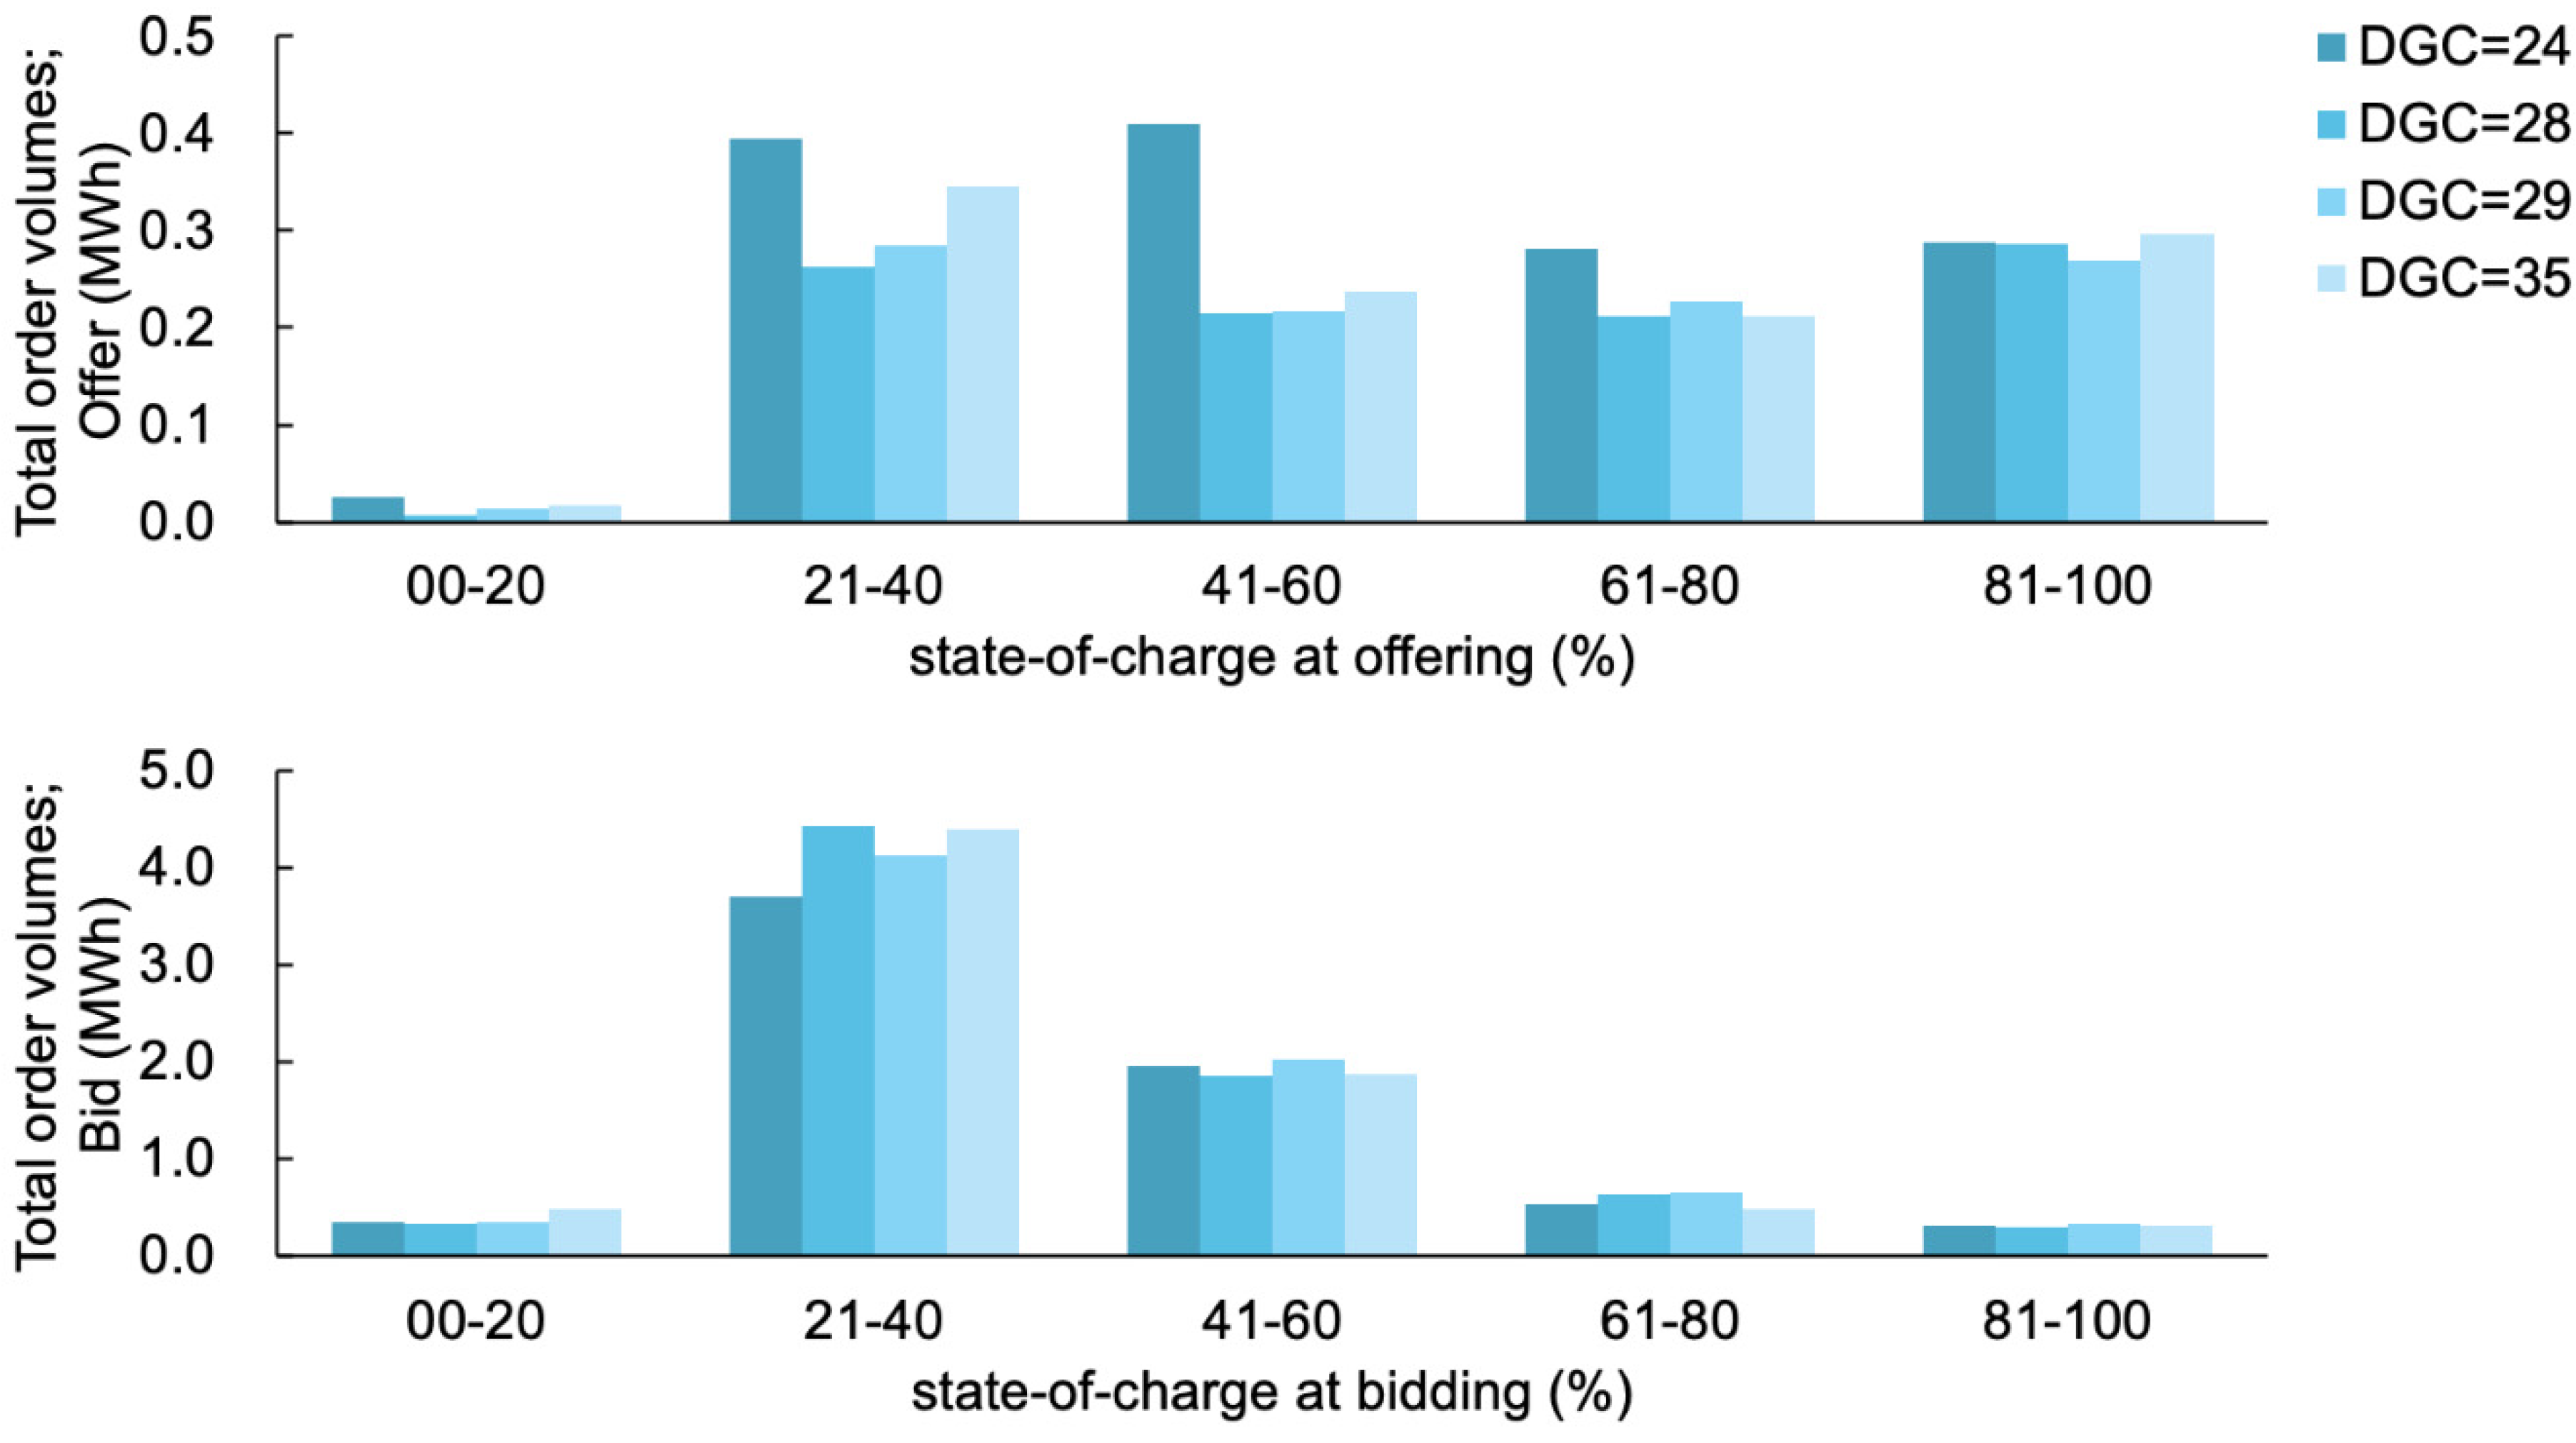
  • Even though the holding storages were advantageous, a lower SoC induced higher bidding prices, that is, the decline in flexibility resulted in disadvantageous conditions (Figure 16).
We noted that battery storage was, in fact, the only flexible factor in this market; therefore, the residences were able to execute more advantageously than the facilities without flexibility, that is, the PVGs and CSs. Moreover, the facilities with flexibility could execute more reasonable prices (i.e., supply at higher prices and purchase at lower prices) than those without flexibility. Even when facilities posted requests individually without considering the possibility of grid disturbances, the market mechanism, in which more flexibility is likely to increase the profit, implicitly enhanced the flexibility.

4.2. Limitations

Several limitations were noted during this study. First, because the analysis depended on limited transaction data in the demonstration projects, different configurations may have altered the overall trends; however, this change was small. Such a variation may occur with other types of DERs, such as wind turbines, micro-hydro plants, and biomass-fueled co-generation systems, and other types of consumers, such as schools and offices, whose energy consumption in the daytime differs from that in the nighttime. Second, prices may change when non-fossil energy resources and fossil energy resources are traded in different markets. Eco-friendly consumers may prefer non-fossil energy resources and willingly pay significantly higher prices than fossil energy resources. Lastly, even though holding flexibility, such as battery storage, enables its owner to earn a profit on the market, it does not necessarily guarantee that it is sufficient to cover the initial cost of installing the flexibility.

4.3. Recommendations for Future Research

This study focused thoroughly on the Urawa-Misono project, where battery storage is the only type of flexibility. In the future, we will investigate other types of flexibility and risk management techniques, such as demand responses, vehicle-to-grid with electric vehicles, fuel cells, and weather derivatives, which may have affected the results.
As the orders of the grid agent were derived from JEPX, the executed prices and volumes were partly affected by a conventional power grid. A further comprehensive comparison between the conventional power grid and peer-to-peer electricity trading will be a future issue.
Further investigation may be required to provide a more efficient bidding strategy based on flexibility. Battery storages in this study ordered their bids/offers according to their SoC. Maintaining the SoC within an adequate range—high enough to discharge and low enough to charge—is necessary. In addition to battery storage, even agents without battery storage can hold flexibility; for example, consumers can achieve flexibility through the demand response, which is the concept of controlling their consumption. Additionally, because offering and bidding prices and volumes are partially based on the weather forecast, repositioning prices and volumes according to the changes in weather forecast may be addressed.

4.4. Implications

P2P energy markets enable DERs to trade without the mediation of the incumbents such as conventional transmission system operators. Conversely, the incumbents may resist P2P energy markets because an increase in the P2P energy markets may take away their role in the power grids from them. However, the regulatory authority should rationalize the existing regulations and restrictions related to P2P energy markets. Since the high penetration of DERs stimulates unprecedented needs for flexibility, any available mechanisms to increase flexibility should be addressed. As the technological components of P2P energy markets have matured, and P2P energy markets contribute to installing flexibility, the regulatory obstacles may require mitigation.

4.5. Summary

Blockchain technologies and P2P energy markets are believed to realize efficient and resilient flexibility in power grids. This study focused on a demonstration project conducted in Urawa-Misono District, Japan. The project featured multifunctional inverters called Digital Grid Routers, a continuous matching market, and an automatic execution system implemented with blockchain to actualize P2P energy markets. The analysis of the traded results quantitatively revealed that holding flexibility results in advantageous conditions for the market; thus, P2P energy markets have the potential to induce flexibility through market mechanisms.

Author Contributions

Conceptualization, R.K., K.T. and Y.Y.; methodology, R.K.; software, R.K.; validation, R.K.; formal analysis, R.K.; investigation, R.K.; resources, K.T.; data curation, K.T.; writing—original draft preparation, R.K.; writing—review and editing, R.K. and Y.Y.; visualization, R.K.; supervision, K.T. and Y.Y.; project administration, K.T. and Y.Y.; funding acquisition, Y.Y. All authors have read and agreed to the published version of the manuscript.

Funding

The third author was supported by a Grant-in-Aid for Scientific Research (A) 20H00285.

Acknowledgments

The demonstration project, “Digital grid router (DGR) and power interchange settlement system to accelerate the introduction of renewable energy,” was financially supported by the Ministry of the Environment, Government of Japan’s Low Carbon Technology Research, Development and Demonstration Program. We express our sincere gratitude to Digital Grid Co., and other related companies.

Conflicts of Interest

The authors declare no conflict of interest.

References

  1. IPCC, Intergovernmental Panel on Climate Change. Headline Statements from the Summary for Policymakers. In Climate Change 2021: The Physical Science Basis, the Working Group I Contribution to the Sixth Assessment Report; IPCC: Geneva, Switzerland, 2021; Available online: https://www.ipcc.ch/report/ar6/wg1/downloads/report/IPCC_AR6_WGI_Headline_Statements.pdf (accessed on 15 August 2021).
  2. IEA, International Energy Agency. Net Zero by 2050. Available online: https://www.iea.org/reports/net-zero-by-2050 (accessed on 15 August 2021).
  3. CAISO, California Independent System Operator. Fast facts: What the Duck Curve Tells us about Managing a Green Grid. Available online: https://www.caiso.com/documents/flexibleresourceshelprenewables_fastfacts.pdf (accessed on 15 August 2021).
  4. Matsuo, Y.; Endo, S.; Nagatomi, Y.; Shibata, Y.; Komiyama, R.; Fujii, Y. Investigating the economics of the power sector under high penetration of variable renewable energies. Appl. Energy 2020, 267, 113956. [Google Scholar] [CrossRef]
  5. Ogimoto, K.; Wani, H. Making Renewables Work: Operational Practices and Future Challenges for Renewable Energy as a Major Power Source in Japan. IEEE Power Energy Mag. 2020, 18, 47–63. [Google Scholar] [CrossRef]
  6. Ahl, A.; Yarime, M.; Goto, M.; Chopra, S.S.; Kumar, N.M.; Tanaka, K.; Sagawa, D. Exploring blockchain for the energy transition: Opportunities and challenges based on a case study in Japan. Renew. Sustain. Energy Rev. 2020, 117, 109488. [Google Scholar] [CrossRef]
  7. IRENA, International Renewable Energy Agency. Innovation Landscape Brief: Peer-to-Peer Electricity Trading. Available online: https://irena.org/-/media/Files/IRENA/Agency/Publication/2020/Jul/IRENA_Peer-to-peer_trading_2020.pdf (accessed on 15 August 2021).
  8. Tushar, W.; Saha, T.K.; Yuen, C.; Smith, D.; Poor, H.V. Peer-to-peer trading in electricity networks: An overview. IEEE Trans. Smart Grid 2020, 11, 3185–3200. [Google Scholar] [CrossRef] [Green Version]
  9. RWE AG. Press Release (1 July 2020): RWE Closes Deal with E.ON. Available online: https://jp.rwe.com/en/press/2020-07-01-rwe-closes-deal-with-eon (accessed on 1 September 2021).
  10. Tokyo Electric Power Company Holdings, Incorporated. Press Release (10 July 2017): Launching a Direct Power Trading Platform Business in Cooperation with Germany’s Leading Power Company Innogy Leveraging Advanced IT to Develop Power Trading Business in Germany. Available online: https://www.tepco.co.jp/press/release/2017/1443908_8706.html (accessed on 1 September 2021). (In Japanese).
  11. Chugoku Electric Power Company, Incorporated. Press Release (25 April 2019): Implementation of a Demonstration Test on Electricity Flexibility Using Blockchain Technology. Available online: https://www.energia.co.jp/press/2019/11766.html (accessed on 1 September 2021). (In Japanese).
  12. Tohoku Electric Power Company, Incorporated. Press Release (26 April 2019): Conclusion of Contract for Joint Research on Direct Power Trading Using Distributed Power Sources (P2P Power Trading). Available online: https://www.tohoku-epco.co.jp/pastnews/normal/1201039_1049.html (accessed on 1 September 2021). (In Japanese).
  13. Kansai Electric Power Company, Incorporated. Press Release (9 December 2019): Commencement of a Demonstration Study of Environmental Value Trading Using Blockchain Technology by Power Ledger Australia. Available online: https://www.kepco.co.jp/corporate/pr/2019/1209_1j.html (accessed on 1 September 2021). (In Japanese).
  14. Shikoku Electric Power Company, Incorporated. Press Release (12 March 2021): Investment in U.S. Venture Company LO3 Energy. Available online: https://www.yonden.co.jp/press/2020/__icsFiles/afieldfile/2021/03/12/pr002.pdf (accessed on 1 September 2021). (In Japanese).
  15. ENERES Company, Limited. Press Release (4 December 2020): Launch of a Demonstration Project to Build a P2P Power Trading Platform for Next-Generation Power Systems—Issuing Blockchain-Based Environmental Value Tokens to Examine a New Renewable Energy Trading Scheme for RE100 Companies. Available online: https://www.eneres.co.jp/news/release/20201204.html (accessed on 1 September 2021). (In Japanese).
  16. UPDATER, Incorporated. Press Release (29 June 2021): Launching Sales of P2P Power Tracking System to Other Companies, Enabling the Designation of Power Plants When Purchasing Power—We Aim to Spread the Use of Origin-Guaranteed Renewable Energy with our SaaS. Available online: https://minden.co.jp/news/2021/06/29/4456 (accessed on 1 September 2021). (In Japanese).
  17. Hitachi, Limited. Press Release (22 January 2021): Development of a System to Visualize the Use of Renewable Energy for Each Facility and Service for the Realization of a Decarbonized Society—Operation of a System to Certify the Use of 100% Renewable energy as Powered by Renewable Energy Started. Available online: https://www.hitachi.co.jp/New/cnews/month/2021/01/0122.html (accessed on 1 September 2021). (In Japanese).
  18. Hitachi, Limited. Powered by Renewable Energy. Available online: https://www.powered-by-re.com/ (accessed on 1 September 2021). (In Japanese).
  19. Nakamura, Y.; Zhang, Y.; Sasabe, M.; Kasahara, S. Exploiting smart contracts for capability-based access control in the internet of things. Sensors 2020, 6, 1793. [Google Scholar] [CrossRef] [PubMed] [Green Version]
  20. Tokyo Institute of Technology. Press Release (18 January 2021): Development of Blockchain Technology to Optimize P2P Electricity Trading According to the Trading Needs of Consumers—Contributing to the Effective Use of Surplus Electricity by Realizing a Flexible Trading Environment. Available online: https://www.titech.ac.jp/news/2021/048738 (accessed on 1 September 2021). (In Japanese).
  21. Nagatsuka, T.; Sano, M.; Yamaguchi, N. Decentralized Transaction System of Surplus PV Output Using Blockchain. In Proceedings of the Grand Renewable Energy Proceedings Japan council for Renewable Energy (2018), Yokohama, Japan, 20–22 June 2018; Japan Council for Renewable Energy: Tokyo, Japan, 2018; p. 304. [Google Scholar] [CrossRef]
  22. Brooklyn Microgrid. Available online: https://www.brooklyn.energy/ (accessed on 1 September 2021).
  23. LO3 Energy, Incorporated. Available online: https://lo3energy.com/ (accessed on 1 September 2021).
  24. Werth, A.; Kitamura, N.; Tanaka, K. Conceptual Study for Open Energy Systems: Distributed Energy Network Using Interconnected DC Nano Grids. IEEE Trans. Smart Grid 2015, 6, 1621–1630. [Google Scholar] [CrossRef]
  25. Sony Computer Science Laboratories, Incorporated. Press Release (1 December 2020): Microgrid System Core Module (Power-Interchange Management Software) Going Open Source—Promote Locally Produced & Consumed Renewable Energy, Work towards a Sustainable Society. Available online: https://www.sonycsl.co.jp/press/prs20201201/ (accessed on 1 September 2021).
  26. Chubu Electric Power Company, Incorporated. Press Release (1 March 2018): Implementation of a Demonstration Experiment for a New Service for Recharging Electric Vehicles and Other Vehicles Using Blockchain. Available online: https://www.chuden.co.jp/publicity/press/3267230_21432.html (accessed on 1 September 2021). (In Japanese).
  27. Kansai Electric Power Company, Incorporated. Press Release (9 December 2019): Launch of a Demonstration Project on Environmental Value Trading Using Blockchain Technology, Including the Determination of Trading Prices for Environmental Values. Available online: https://www.kepco.co.jp/corporate/pr/2019/1209_2j.html (accessed on 1 September 2021). (In Japanese).
  28. Toyota Motor Corporation. Press Release (13 November 2020): Joint Demonstration Experiment on P2P Power Trading System Confirms Its Effectiveness—Exploring Further Partner Collaboration to Provide New Value. Available online: https://www.toyota.co.jp/jpn/tech/partner_robot/news/20201113_01.html (accessed on 1 September 2021). (In Japanese).
  29. Ministry of the Environment. Brief summary: Digital grid router (DGR) and Power Interchange Settlement System to Accelerate the Introduction of Renewable Energy. Available online: http://www.env.go.jp/earth/ondanka/cpttv_funds/pdf/db/202.pdf (accessed on 15 August 2021). (In Japanese)
  30. Ministry of the Environment. Low Carbon Technology Research, Development and Demonstration Program. Available online: https://www.env.go.jp/earth/ondanka/cpttv_funds/pdf/pamph_e2019.pdf (accessed on 15 August 2021).
  31. Wencong, S.; Huang, A. (Eds.) The Energy Internet: An Open Energy Platform to Transform Legacy Power Systems into Open Innovation and Global Economic Engines; Woodhead Publishing: Cambridge, UK, 2018; pp. 241–264. [Google Scholar] [CrossRef]
  32. Tanaka, K.; Abe, R.; Nguyen-Van, T.; Yamazaki, Y.; Kamitamari, T.; Sako, K.; Koide, T. A Proposal on an Electricity Trading Platform Using Blockchain. In Transdisciplinary Engineering Methods for Social Innovation of Industry 4.0; IOS Press: Amsterdam, The Netherlands, 2018; pp. 976–983. [Google Scholar] [CrossRef]
  33. Abe, R.; Taoka, H.; McQuilkin, D. Digital grid: Communicative electrical grids of the future. IEEE Trans. Smart Grid 2011, 2, 399–410. [Google Scholar] [CrossRef]
  34. Nguyen-Van, T.; Abe, R.; Tanaka, K. Digital Adaptive Hysteresis Current Control for Multi-Functional Inverters. Energies 2018, 11, 2422. [Google Scholar] [CrossRef] [Green Version]
  35. Hayashi, K.; Kato, R.; Torii, R.; Taoka, H.; Abe, R. Bi-directional power flow through a digital grid router. J. Int. Counc. Electr. Eng. 2015, 5, 42–46. [Google Scholar] [CrossRef]
  36. Shibano, K.; Kontani, R.; Hirai, H.; Hasegawa, M.; Aihara, K.; Taoka, H.; McQuilkin, D.; Abe, R. A Linear programming formulation for routing asynchronous power systems of the Digital Grid. Eur. Phys. J. Spec. Top. 2014, 223, 2611–2620. [Google Scholar] [CrossRef]
  37. Kumagaya Meteorological Office. Characteristics of the Climate in Saitama. Available online: https://www.jma-net.go.jp/kumagaya/shosai/chishiki/tokutyou.html (accessed on 15 August 2021). (In Japanese).
  38. Japan Meteorological Agency. Historical Weather Observations. Available online: https://www.data.jma.go.jp/obd/stats/etrn/index.php?prec_no=43&block_no=0363 (accessed on 15 August 2021). (In Japanese)
  39. Japan Meteorological Agency. Frequently Asked Questions about Humidity, Barometric Pressure, and Daylight Duration. Available online: https://www.jma.go.jp/jma/kishou/know/faq/faq5.html (accessed on 15 August 2021). (In Japanese)
  40. TEPCO Power Grid, Incorporated. Available online: https://www.tepco.co.jp/pg/ (accessed on 15 August 2021). (In Japanese).
  41. Digital Grid, Corporation. Available online: https://www.digitalgrid.com/ (accessed on 15 August 2021). (In Japanese).
  42. ECHONET Consortium. Digital Grid Controller|ECHONET. Available online: https://echonet.jp/introduce_en/qz-000069/ (accessed on 15 September 2021). (In Japanese).
  43. JEPX, Japan Electric Power Exchange. Available online: http://www.jepx.org/ (accessed on 15 August 2021). (In Japanese).
  44. McKinney, W. Data structures for statistical computing in python. In Proceedings of the 9th Python in Science Conference, Austin, TX, USA, 28 June–3 July 2010; Volume 445, p. 51. [Google Scholar]
Figure 1. Location of the demonstration project in Urawa-Misono District.
Energies 14 07418 g001
Figure 2. Weather conditions during the time of the demonstration project.
Energies 14 07418 g002
Figure 3. System used for the demonstration project.
Energies 14 07418 g003
Figure 4. Selection from the target period for trade data analysis.
Energies 14 07418 g004
Figure 5. Share of the executed volumes among each agent in the target period.
Energies 14 07418 g005
Figure 6. Total executed volumes for each time interval of electricity delivery in the target period.
Energies 14 07418 g006
Figure 7. Mean executed prices for each time interval of electricity delivery in the target period.
Energies 14 07418 g007
Figure 8. Total executed volumes for each duration of the electricity delivery in the target period.
Energies 14 07418 g008
Figure 9. Mean executed prices for each duration of electricity delivery in the target period.
Energies 14 07418 g009
Figure 10. Total order volumes for each time interval in the target period.
Energies 14 07418 g010
Figure 11. Mean order prices for each time interval in the target period.
Energies 14 07418 g011
Figure 12. Total order volumes for each electricity delivery duration in the target period.
Energies 14 07418 g012
Figure 13. Mean order prices for each electricity delivery duration in the target period.
Energies 14 07418 g013
Figure 14. The appearance frequencies of each SoC in the target period.
Energies 14 07418 g014
Figure 15. Total order volumes for each (SoC) in the target period.
Energies 14 07418 g015
Figure 16. Mean order prices for each SoC in the target period.
Energies 14 07418 g016
Figure 17. Offers and bids for electricity delivery from 12:00 to 12:30 on 26 February 2020.
Energies 14 07418 g017
Publisher’s Note: MDPI stays neutral with regard to jurisdictional claims in published maps and institutional affiliations.

