1. Introduction
Microgrids (MG) can be defined as distributed power systems that operate either in grid-connected or island mode [
1]. An MG’s most commonly recognized factors are the control framework for generation and demand, well-defined limits, and islanding capabilities [
1,
2]. MGs are primarily electrical, including AC, DC, or hybrid systems, but they can also include thermal components for heating. Because the difference of load generation points is small, the system’s norms are less than the main network. MGs enable the combined operation of distributed energy resources (DERs) and energy storage systems considering system reliability [
3]. MGs enable the combined operation of distributed energy resources (DERs) and energy storage systems considering system reliability. Integration of MG is expected to solve most of the technical problems caused by the integration of DERs. As a result, the necessity for central coordination will reduce, and the realization of the smart grid will be more straightforward.
Control and operation in an MG are critical factors in the success of electrical systems due to numerous restrictions, such as control functionality in islanded operation or power exchange with the main grid. This system layer may be composed of only the software or both software and hardware. In MG control, a hierarchical control including primary, secondary, and tertiary levels should be followed.
Primary control is the fastest control mechanism, thanks to its local measurements and communication-free approach. Therefore, control of unit connection status, output voltage control, and output power balance control is achieved with this control method [
4,
5]. While the main grid controls the voltage magnitude and frequency, the main control parameters are the active and reactive power output of the DERs in grid-connected mode. However, in island mode, there is no reference voltage for DERs, so this mode is quite challenging. Even a short duration of voltage and frequency inconsistency may result in large current circulation [
6,
7].
Secondary control is a more sophisticated control step. Second level control is responsible for supervising and monitoring the system and adjusting for voltage and frequency abnormalities. Indeed, the secondary control guarantees that the frequency and voltage variations in the MG are controlled towards zero after each load or generation fluctuation [
8]. This level of control hierarchy can also be denoted as the energy management system (EMS) [
9]. This control level can have centralized, decentralized, or distributed architectures. [
10].
Most of the existing MG control test benches focus on one specific function, and the tests are conducted without regard to a recognized standard. The MG energy management system coordinates the active and reactive power dispatch setpoints for the inter-dispatch intervals with the local primary power control loops used by the DERs [
3]. In [
11], an MG control system (MGCS) is validated with a dispatch function on a real-time testbed, but offline optimization is still performed. Similarly, Manson et al. [
12] present dispatch and protection functions, but no complete tests are undertaken. For grid-connected and islanded operation modes, Manson et al. propose [
12] a control technique that uses an energy storage system (ESS) for power smoothing, keeping the state of charge (SOC) around 50%. Although the SOC can be tightly regulated, it is relatively conservative because the capabilities of ESS as an energy buffer for peak shaving and valley filling are not fully explored. In [
13], a comparison of load-following control and cycle-charging control is performed on an islanded PV-diesel-ESS MG, where the ESS and diesel generator are used as the primary sources to achieve power balance. It has been discovered that using ESS to track load change might minimize fuel usage, although the energy stored in the system may be depleted sooner than expected [
14]. The lifespan of ESS will be shortened by using a traditional cycle-charging approach with repeated deep discharges. Bo Zhao et al. [
15] describe a hybrid adaptive rule-based dispatch for a realistic stand-alone MG that used a diesel generator and energy storage to address power shortfall in several SOC ranges. The control approach, on the other hand, is still unable to achieve its objectives.
Standards contribute to the advancement of MG installation and configuration by having a comprehensive technical basis for interconnection and interaction with the utility grid at the point of interconnection. There are six main standards related to MGs [
16]. The IEC 62898 series includes IEC 62898-1 [
17] and IEC 62898-2 [
18]. IEC 62898-1 covers the technical requirements and guidelines for the MG planning stage. IEC 62898-1 is intended to provide the principles and requirements related to components, operation, and transitions. The IEEE 1547.4 standard [
19] provides a reference for the design, operation, and transition of DER, such as the transition to island mode, island mode operation, or the reconnection mode, which can be referred to as an MG. A new version of this standard, IEEE 1547-2018 [
20], was published in 2018. The IEEE 2030.7 standard [
21] defines and specifies the MGCS as a critical element of the MG that regulates every aspect of the MG at the POI with the distribution system. This system consists of control functions that present the MG as a single entity that can operate autonomously in an island or grid-connected mode. The detailed description of this document is presented in the following subsection. The IEEE 2030.7 standard cites the IEEE 2030.8 [
22] standard to qualify, verify and evaluate the recommended specifications and functionalities. As a result of these tests, MG controllers may be adopted more broadly.
Razeghi et al. [
23] proposed the idea of a generic MG controller-based IEEE 2030.7 standard in their report for the U.S. Department of Energy; however, no details of the dispatch function are disclosed. A model-driven generic controller is presented in [
24]. This controller is independent of the model of a specific MG system. A digital twin is the byproduct of a model-driven product that may be utilized as a genuine model of an MG controller within simulations. Nonetheless, the details of the utilized model and optimization in their study are missing, and the core-level functions do not include transition functions.
Sun et al. [
25] developed a core-level rule-based dispatch function that is in compliance with the IEEE 2030.7 standard. Their proposed controller consists of a weighted and queuing (W&Q) algorithm to apportion the required load shedding or renewable curtailment among the corresponding assets. This algorithm utilizes forecasts of load and generation. However, the IEEE 2030.7 standard does not allow the use of forecasts as part of core-level functions. Additionally, the diesel generator is kept ON unless it is in the force-discharging mode. However, the diesel generator can be utilized to decrease the amount of probable load shedding. In their other work, Sun et al. [
26] have proposed a centralized MG control system with rule-based dispatch and seamless transition functions. The control strategy has been implemented with control hardware in the loop (C-HIL) test bench. The method keeps the BSS SOC around 50% for the sake of MG resiliency and reliability and to extend the BSS lifetime. Moreover, a dispatchable DG is kept ON during the operating modes of the MG Load management strategy, but it is not clearly described whether loads are restored after shedding.
The ubiquitous nature of real-time monitoring and control across the nodes of the system differentiates a smart MG from a conventional system. This requires relevant MG nodes to have the capability of generating real-time data and the capability of communicating with other nodes across the system, regardless of where these nodes are or what their functions may be. In other words, monitoring and control within a smart MG system must be an end-to-end exercise encompassing (preferably) all network nodes. That requirement calls for command and control strategies capable of dealing with MG events through localized intelligence. Besides, individual components, such as energy converters, batteries, etc., may have their dedicated management and control intelligence interfacing with the higher-level control systems and applications to receive setpoints and inform them of their status and events [
27].
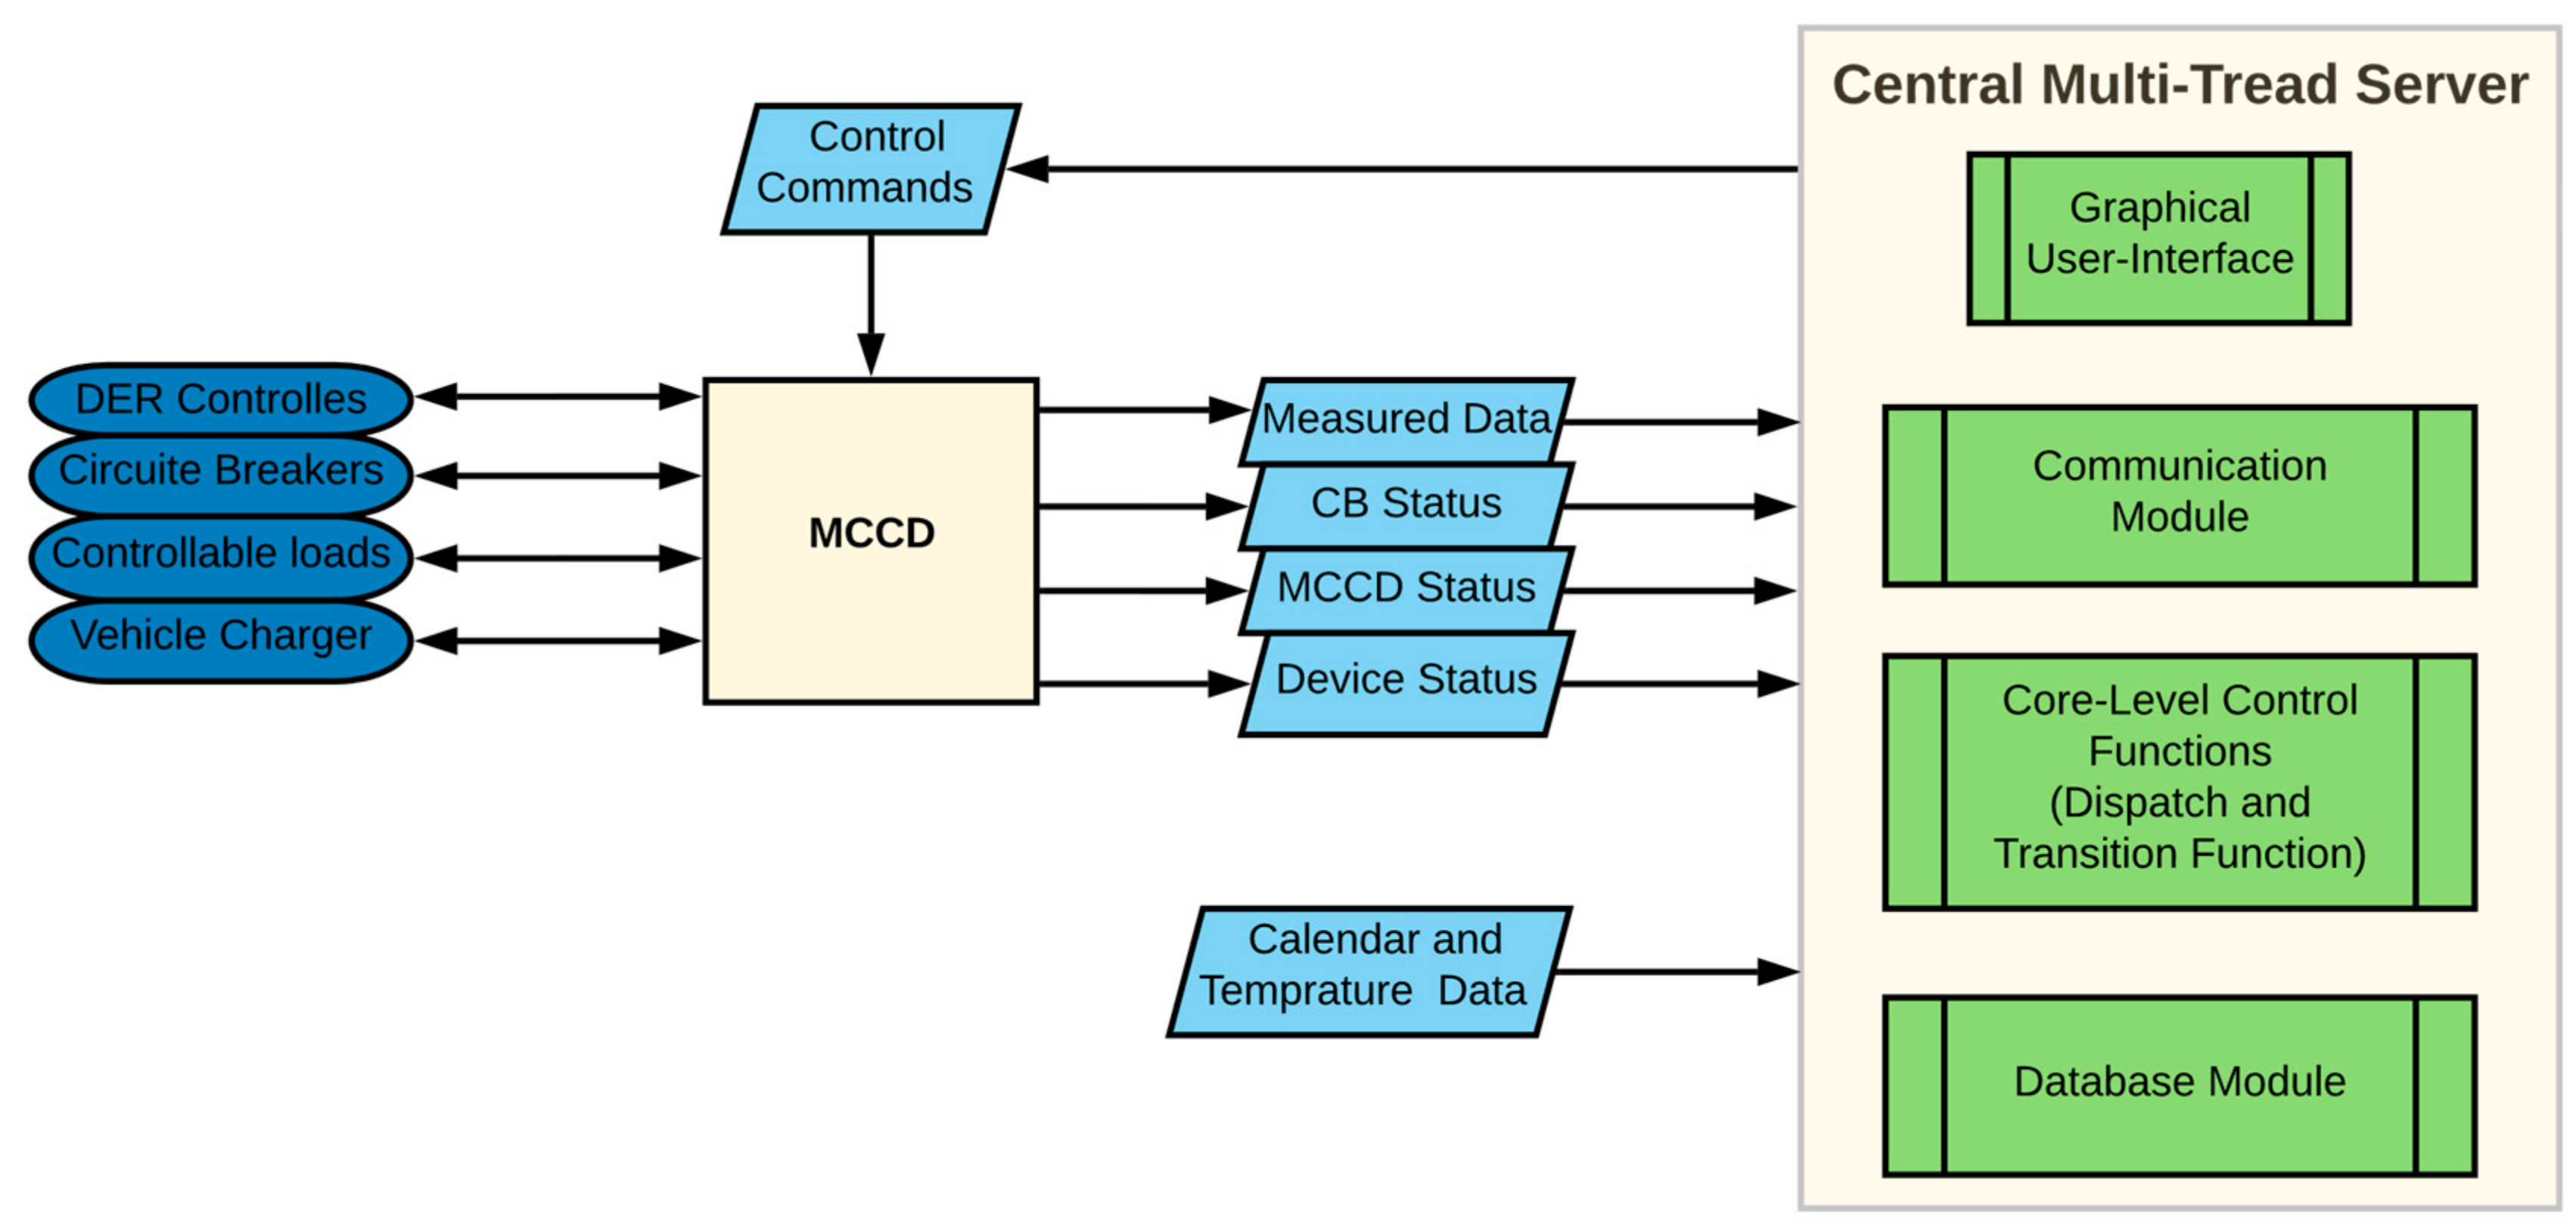
In our approach, the real-time monitoring and control action will be performed through the developed advanced field unit, namely the MG control and communication device (MCCD) and controller multi-thread server (CMTS). The CMTS processes the received data through the novel control functions. These control functions are dispatch and transition core-level functions. The generic dispatch function is established based on SOC-following dispatch rules and load management strategy. The load management strategy sheds and restores the determined amount of load regarding the criticality and controllability of loads. It should be noted that there are load management approaches in other studies; however, those are not in compliance with the specifications of IEEE standards for core-level functions. These control functions make the proposed MGCS flexible for different MGs regardless of an MG’s size and application.
In the proposed MGCS, CMTS communicates with MCCDs located in the field through the TCP/IP sockets. Additionally, a graphical user interface (GUI) is provided to the users in the control center.
The main objectives and contributions of this study are as follows:
The MG control and communication device is designed and implemented. This device measures the required electrical quantities and applies executed digital and analog commands to the MG assets;
Reliable operation for the prioritized (critical) loads rather than the economic operation is of the MG is realized during island mode steady-state by the MG central control system;
Loads are classified regarding criticality and controllability, and load management strategy has been developed based on this classification;
The proposed method performs successful transition modes, including unplanned islanding (T1) and planned islanding (T2);
A proper communication framework between the CMTS and MCCD is implemented;
The proposed system provides a graphical user interface for data visualization and manual control for MG operators.
The design details of all corresponding components will be given in the second section and
Appendix A. The presented central MG control system is examined through the test cases based on the IEEE 2030.8 standard [
22] and the results in the third section.
IEEE 2030.7 Standard
This standard addresses the functions higher than the component control level related to the proper operation of the MG energy management system common to all MGs, regardless of the application, topology, configuration, or administration. This standard levels the control functions into the high, core, and low levels. The scope of this standard is to address the functions above the component control level associated with the proper operation of the MG energy management system that is common to all MGs, regardless of topology, configuration, or jurisdiction. There is a single limitation on MG topology: the MG shall connect to the distribution grid at the POI. The standard declared three distinct characteristics for any system to be considered as an MG:
Clearly defined electrical boundaries;
A control system to manage and dispatch resources as a single controllable entity;
The installed generation capacity exceeds the critical load.
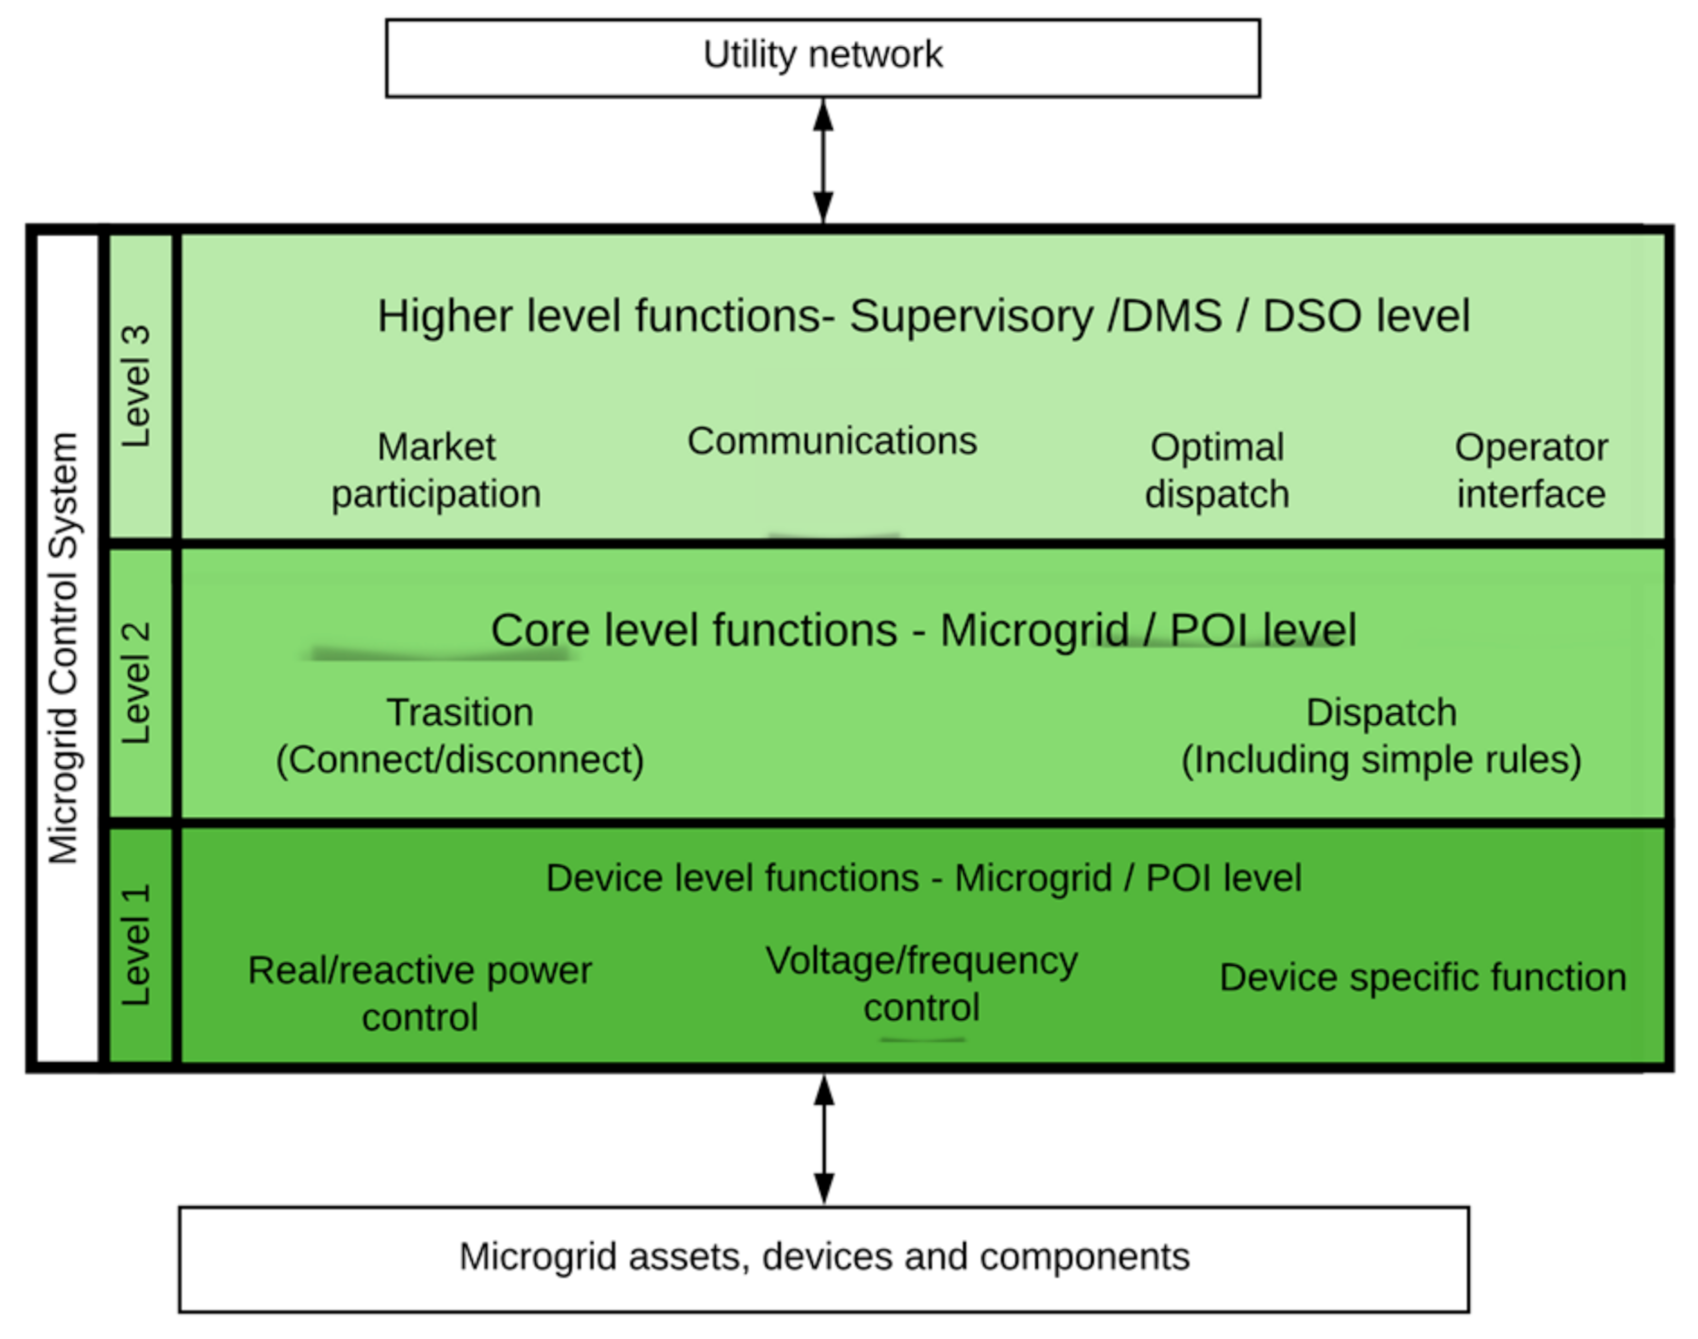
The MGCS includes the control functions that define the MG as a system that can manage itself, operate autonomously or grid-connected, and seamlessly connect to and disconnect from the main distribution grid to exchange power. It satisfies the interconnection requirements using functions at the high level, core level, or low level of its function, and the corresponding stack is given in
Figure 1. The lower level, or device-related control action, is performed via the network components’ local control.
The main goal of building the core functions is to provide a framework in order to have a modular design of the MG control system employing the platform-independent interfaces. This standard defines functions and their interrelationships that allow modularity and interoperability in physical implementations. It deals with the operation of the MG control system and defines those aspects that need to be standardized; others can remain proprietary. The core-level functions include:
The dispatch function: dispatches individual devices in given operating modes and with specified setpoints;
The transition function: supervises the transitions between connected and disconnected states and ensures the dispatch is appropriate for the given state.
The dispatch function computes its dispatch order based on a dispatch rule. In the simplest case, this rule is static and set up by the operator at the beginning. A value-added dispatch optimizer engine would be considered a higher-level function and optimizes dispatch by editing the dispatch rule in real-time. This modularizes the optimizer and dispatch functions, making modifications and upgrades of the optimizer easier.
3. The Microgrid Control System
The interaction between the two main components of the proposed MGCS and corresponding data flow is illustrated in
Figure 3. The main data flow is among the MCCD and the CMTS. The MCCD provides frequency, phasor, power measurements, circuit breaker (CB) status, MCCD status, and controlled devices’ status. MCCDs are not the single information source for the MGCS. The distribution system operator (DSO) can also send information to the MGCS.
Commands executed through the control functions or user interface are transmitted from the CMTS to the MCCD by a communication module. In addition, information such as formal calendar, academic calendar, and weather conditions are also provided to the CMTS. The description of the MCCD and core-level functions will be illustrated in the following subsections. Details on the database, communication modules, and user interface are given in
Appendix.
The MGCS includes the control functions that define the MG as a system that can autonomously manage itself, either in islanded or in grid-connected mode. It satisfies the interconnection requirements using functions at the high, core, or low level of its function stack. The lower-level functions representing DER/load/devices level functions are not considered in the proposed MGCS because related control actions are performed via network components’ local control.
Control system core level functions designate the MG as an independent autonomously controllable system satisfying the DSO and MG operator’s (MGO) requirements. The main aim of establishing this function is to have a functionality-driven controller emphasizing the modularity of MGCS. This feature is achieved via platform-independent interfaces. MGCS’s functional framework, determined by the IEEE 2030.7 standard, is shown in
Figure 1. The functions designated as core functions in this standard pave the way for a modular design of MG control systems.
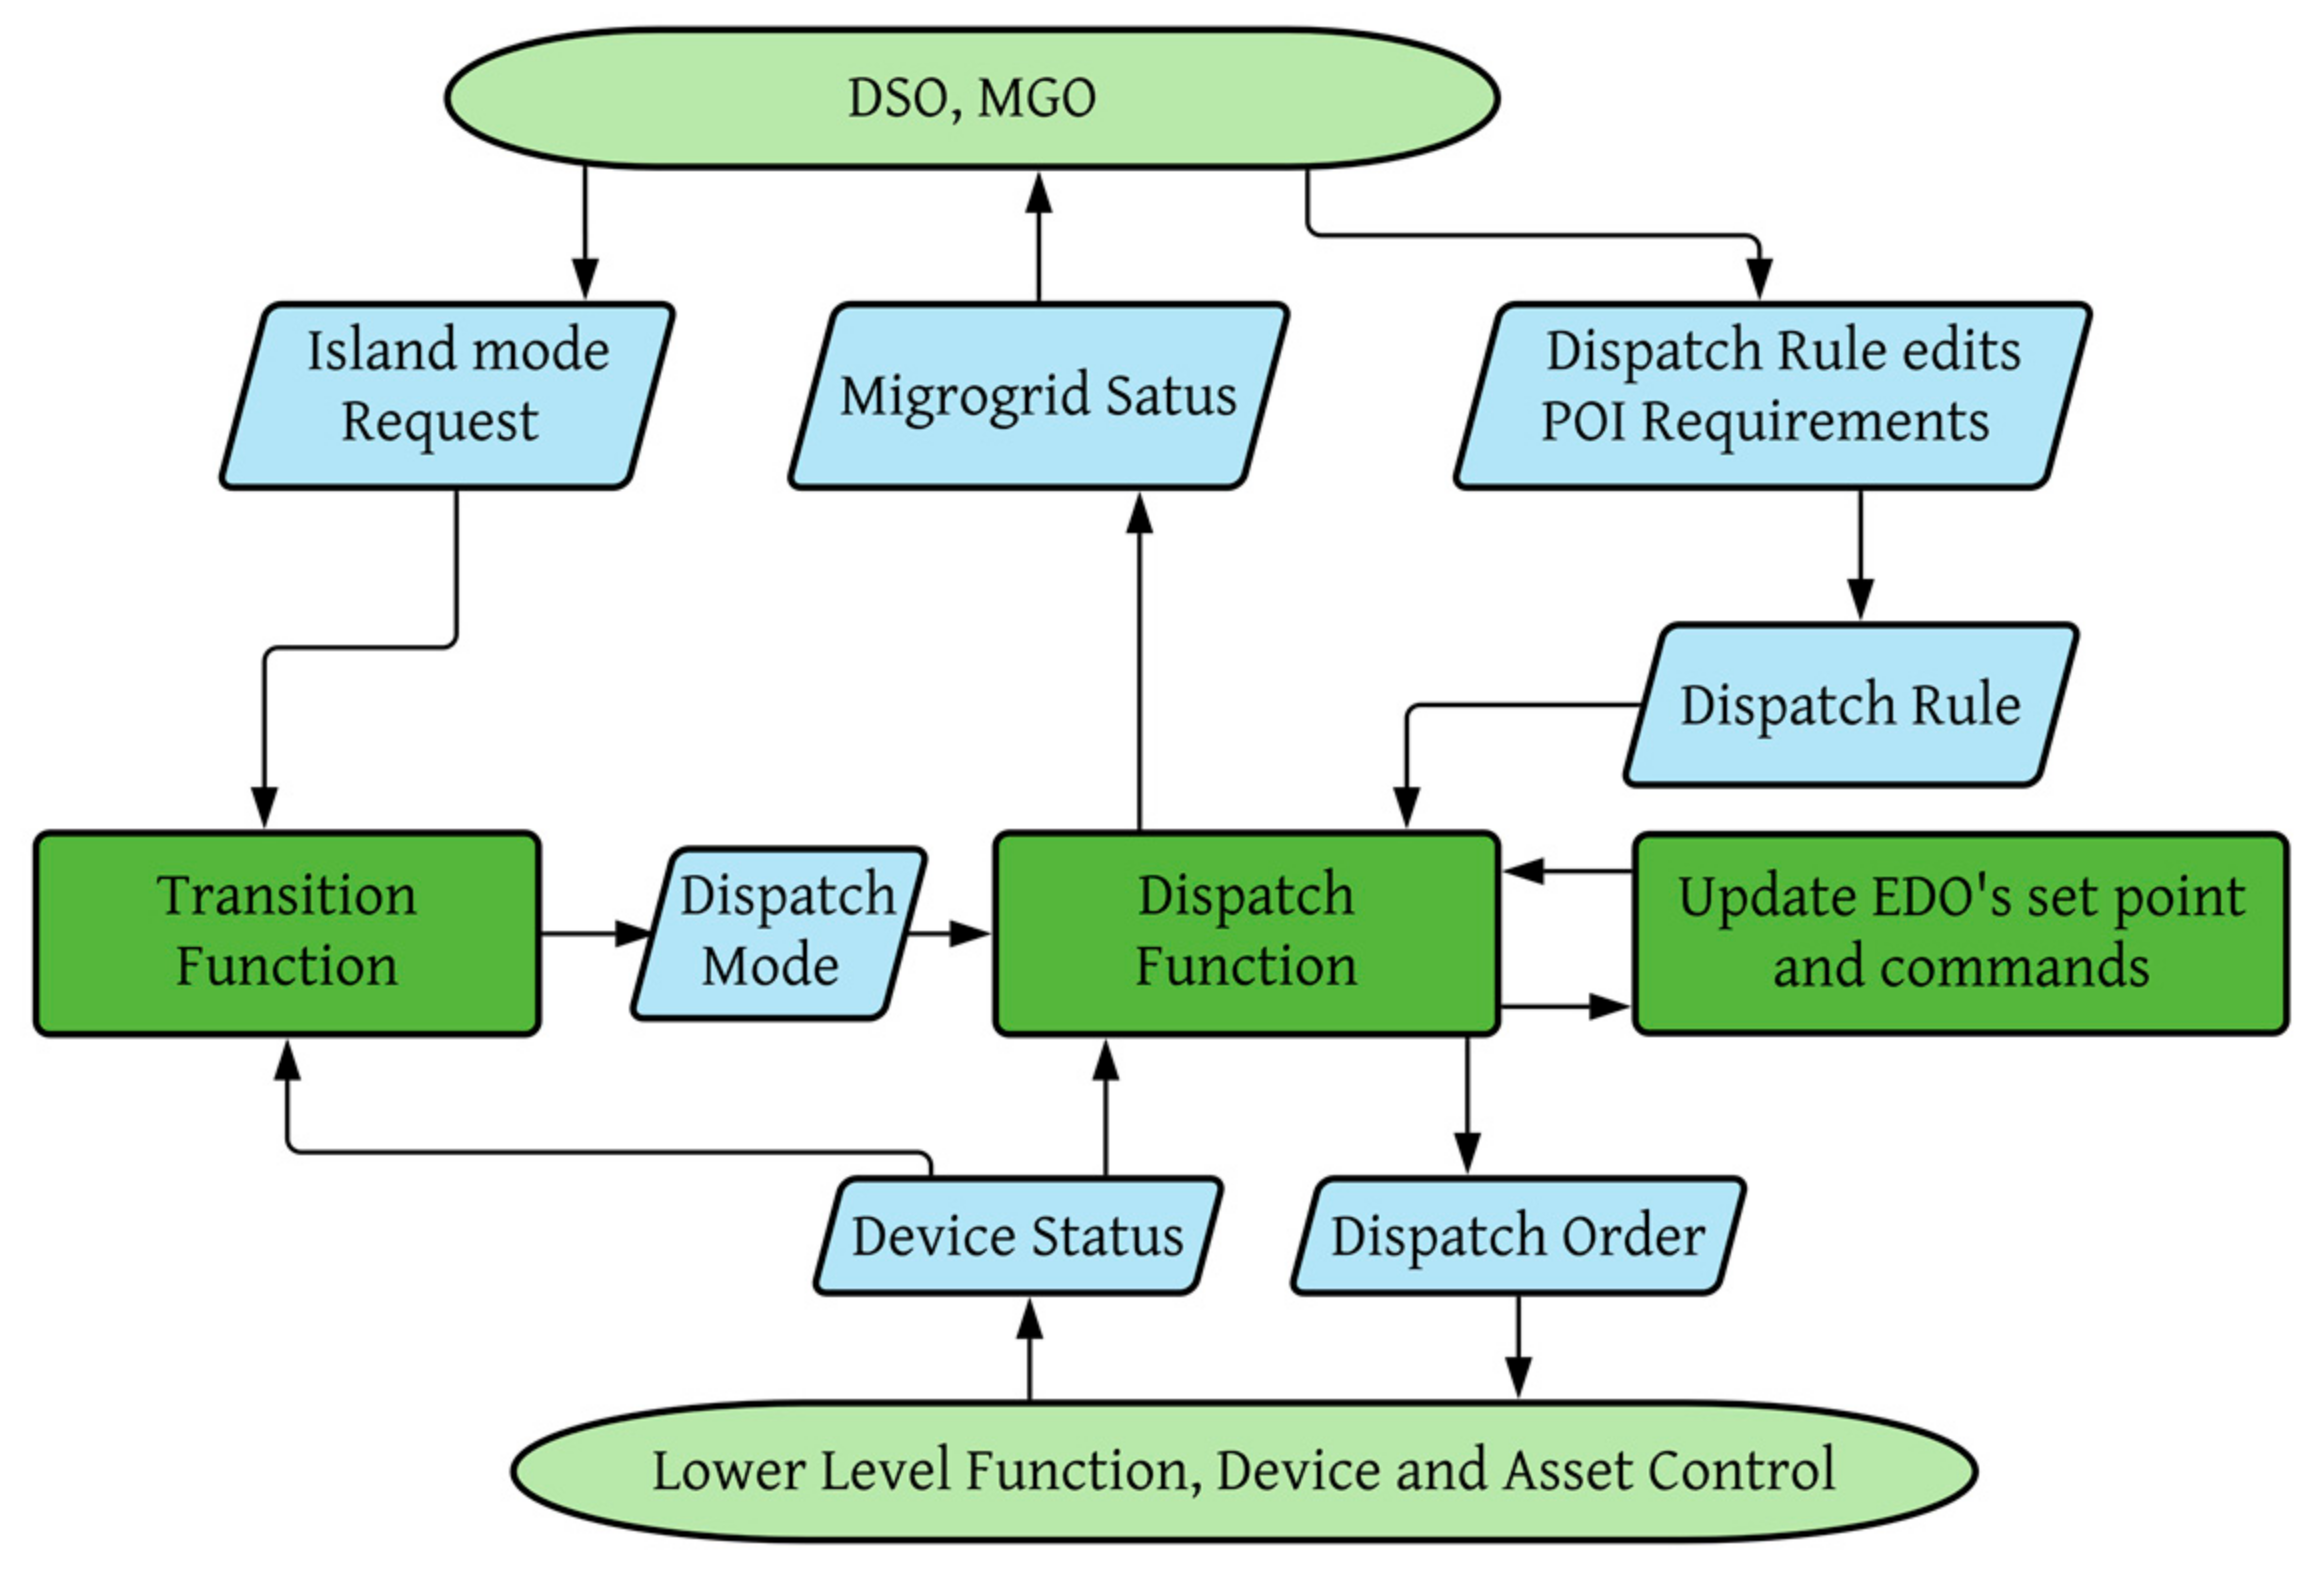
Two core functions are specified in this standard: the dispatch function and the transition function. The dispatch function operates on a longer time frame than the transition function of the MG, typically in minutes, compared to milliseconds for the transition function. The relationship and interaction between the dispatch and transition functions and control levels are illustrated in
Figure 4.
In the present approach, the dispatch rule is a set of rules for four dispatch modes, which are:
Steady-state grid-connected mode (SS1);
Steady-state islanded mode (SS2);
Unplanned islanding (T1);
Planned islanding (T2).
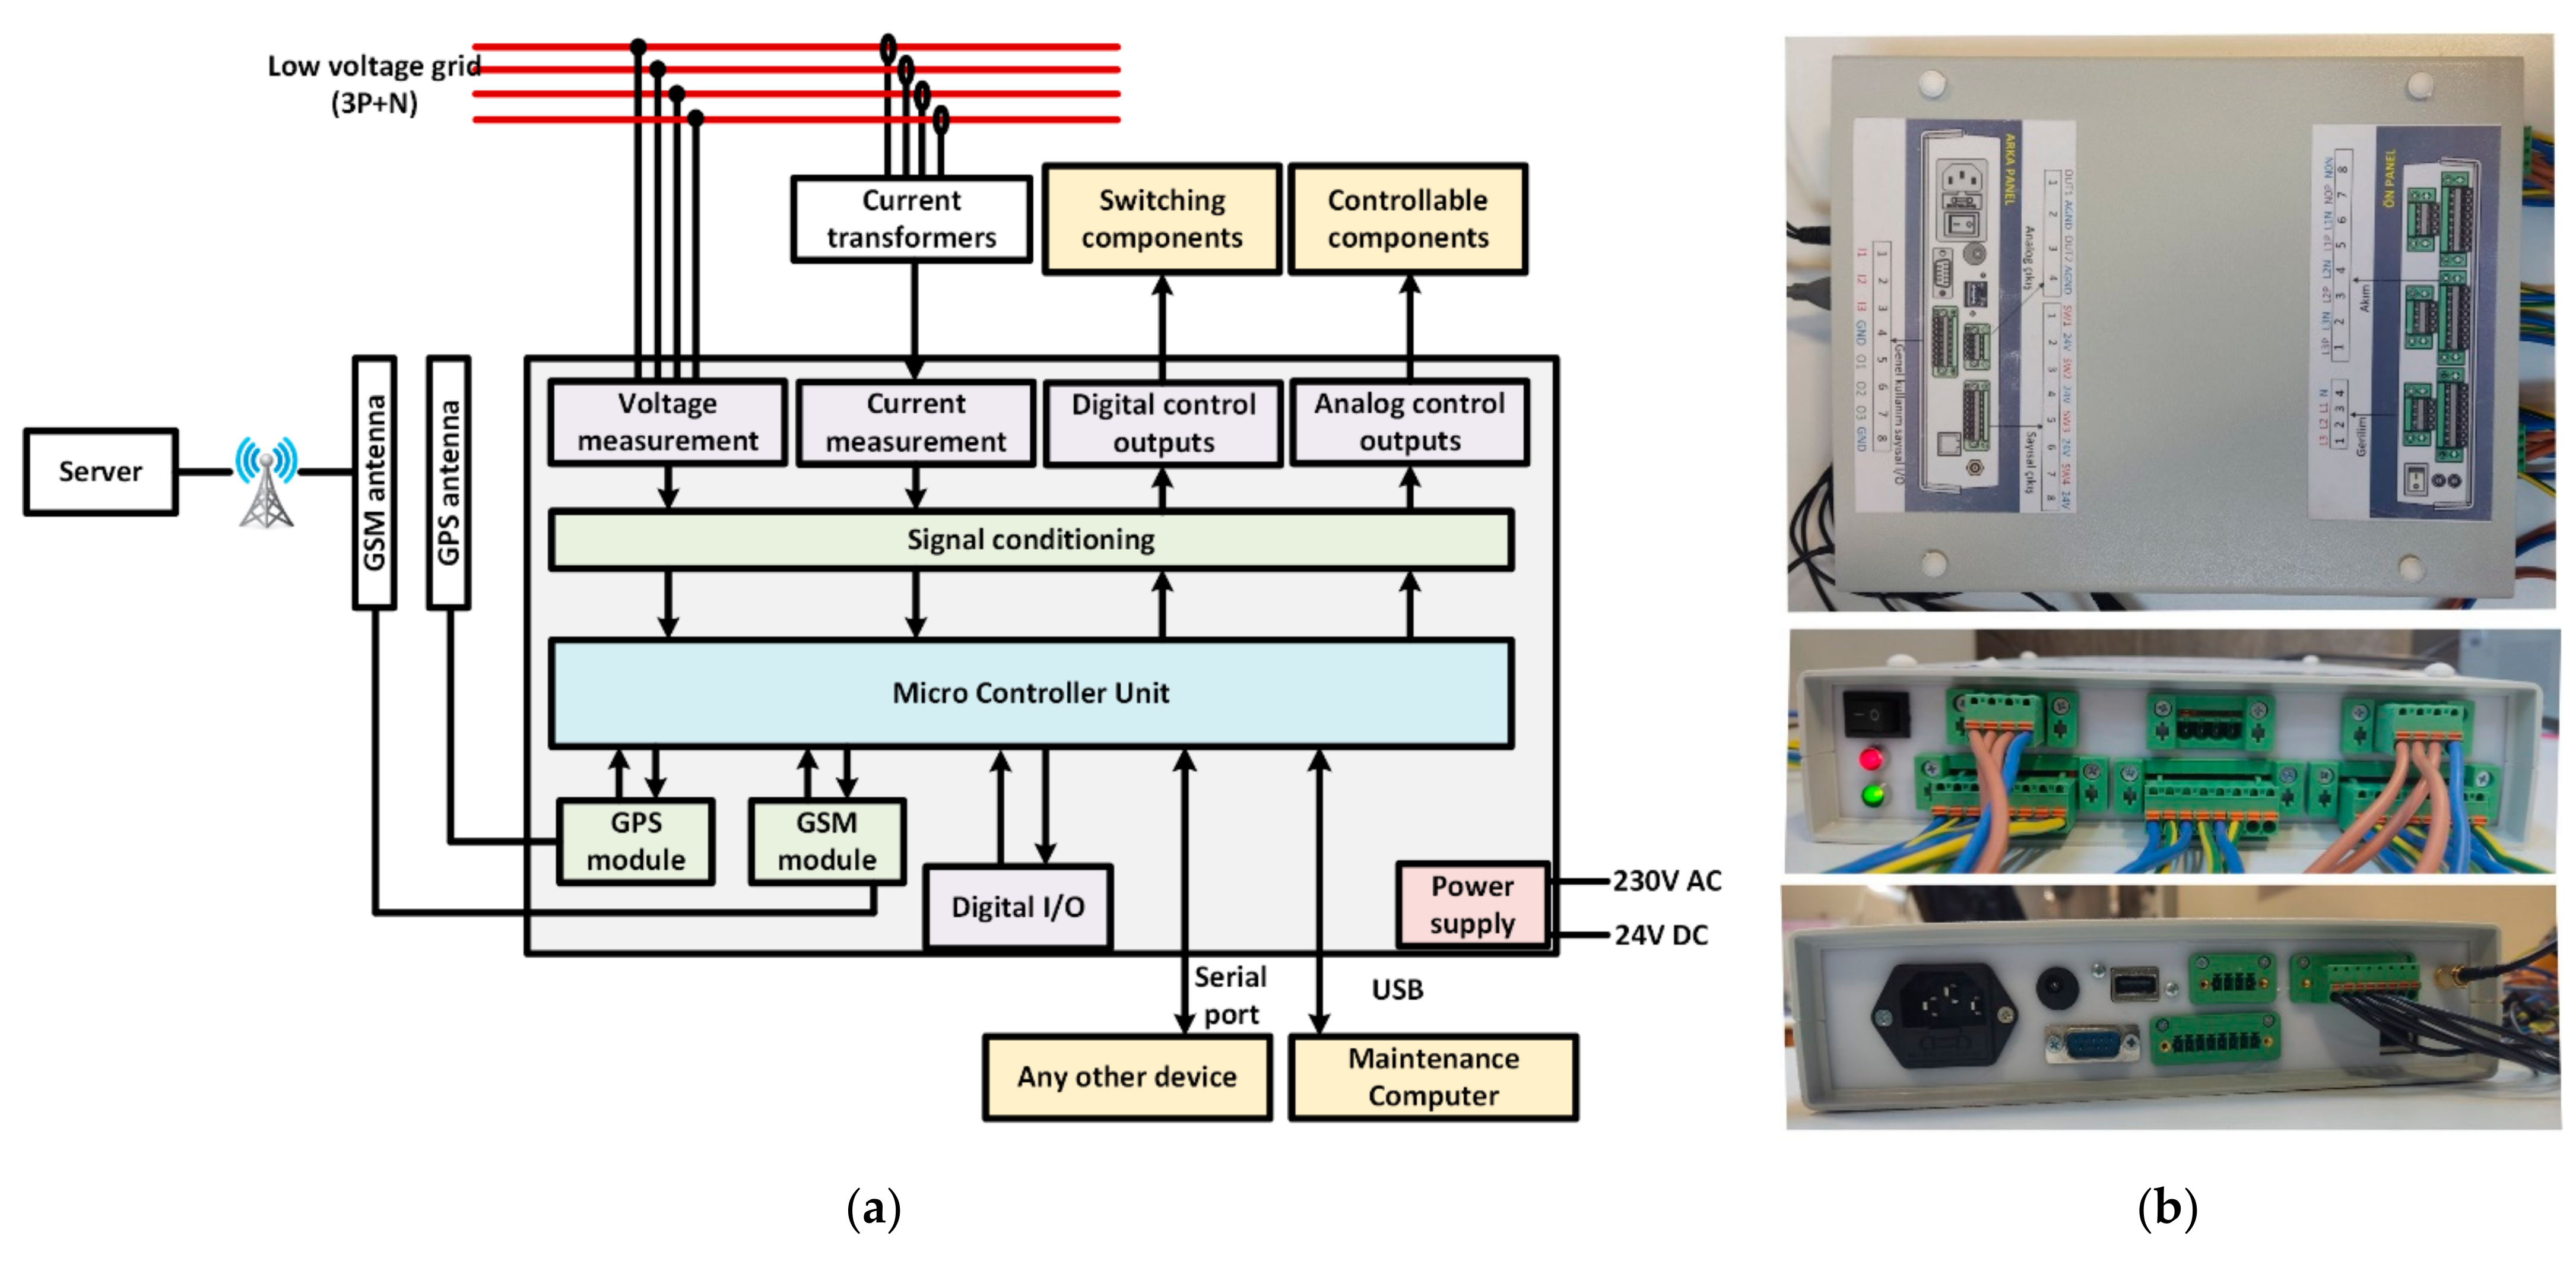
3.1. The Developed Microgrid Control and Communication Device
A field unit is necessary to collect the essential measurements from the MG assets and transmit the required commands from the CMTS. The received commands by the field unit include the control commands that are applied by the MCCD or the MG components, including the CB control command and DER setpoints for dispatchable assets.
Based on those requirements, the MCCD is designed, and a prototype is fabricated. The components and modules of MCCD are illustrated in
Figure 5. This device can be energized using a 1-phase AC socket or a 24 V DC supply. The power consumption of the device is 12 W max. MCCD consists of a synchro-phasor measurement unit to measure and collect data from different MG nodes and components. This device has three measurement channel groups, and each one is intended to be used for a three-phase system. Each group can measure frequency, three fundamental line-to-neutral voltage, and four fundamental current phasors. In total, the device can measure nine voltages and twelve currents with a sampling rate of 15,625 Hz. The measurement range of this device is given in
Table 2. It should be noted that the measurement range of current magnitude depends on the ratio of the utilized current transformer.
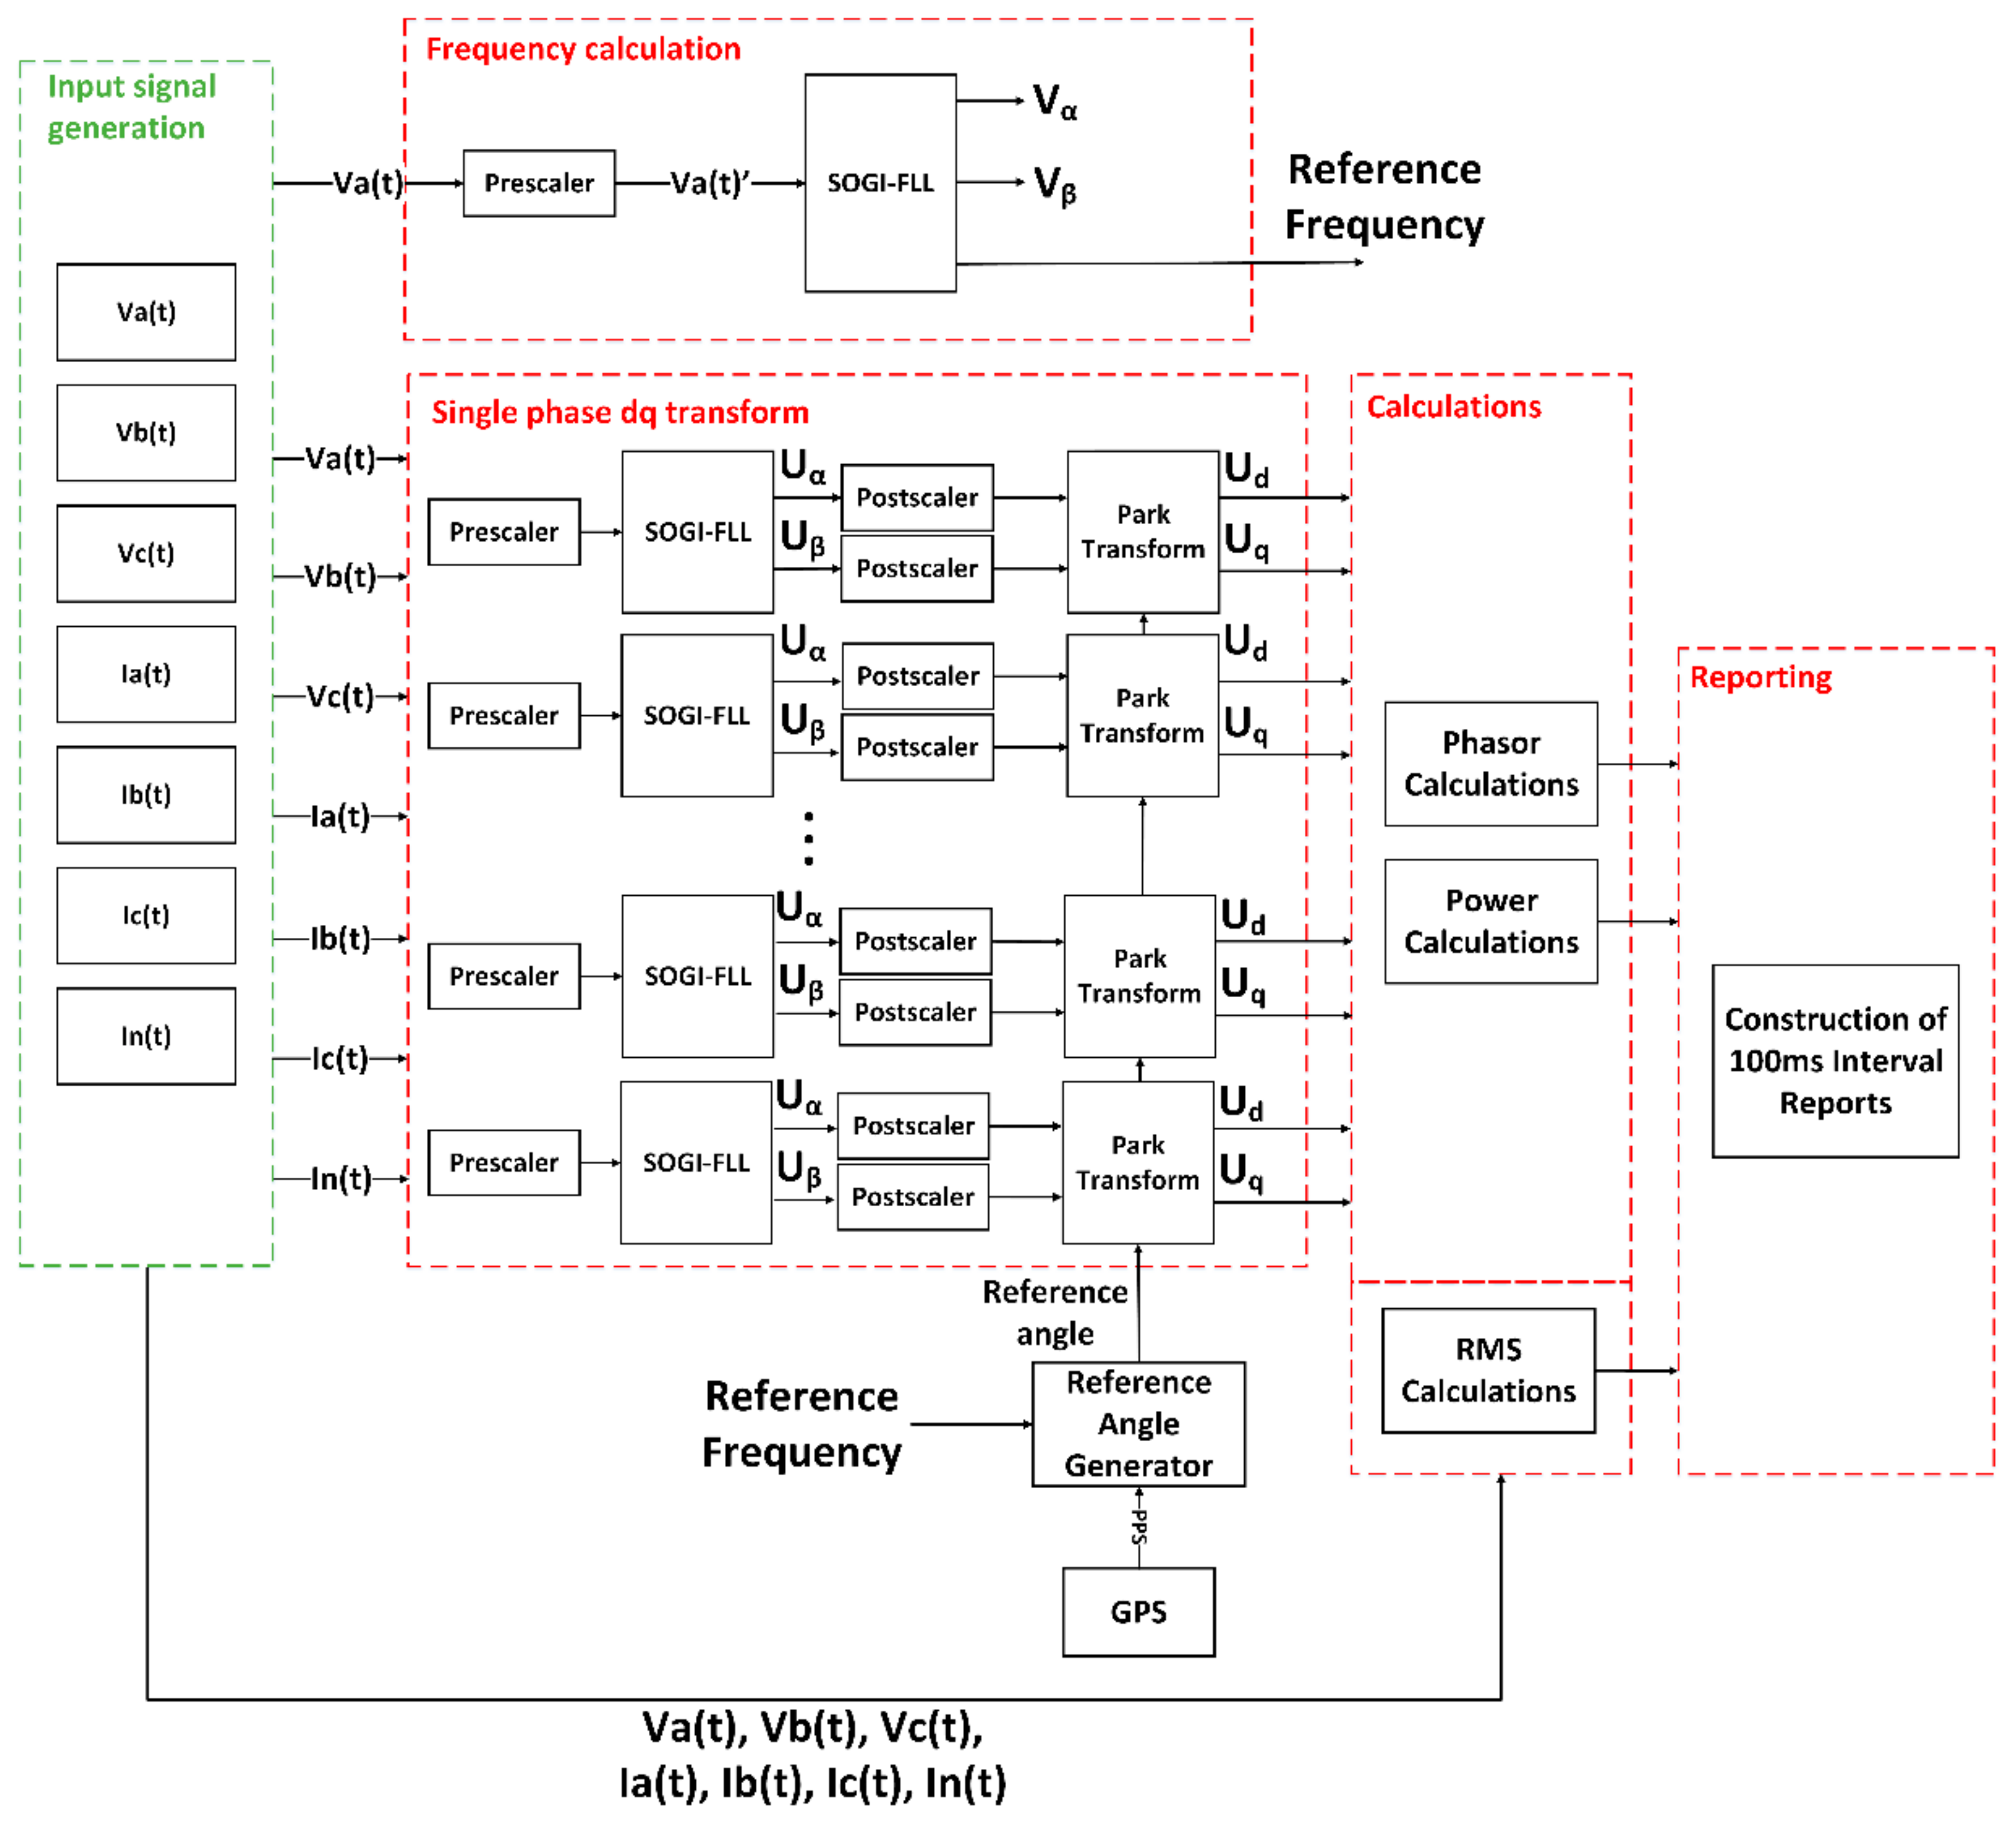
The GPS module enables the device to determine its global location and a time reference for phase angle calculation. Phasor angle calculations are based on the frequency, and the real GPS clock received via the GPS module. The reference system of each device will be the same in terms of phase angle in case of the installation of multiple MCCDs. The block scheme for the measured values calculation algorithm is presented in
Figure 6. Frequency is calculated using one of the phase voltages using the second-order generalized–frequency locked loop (SOGI-FLL) algorithm. The calculated frequency is used later to determine the reference angle for the calculation of phasors. The direct and quadrature (D and Q) components of each voltage and current that are referenced to the primary frequency are calculated in the single-phase DQ transform block. All voltage and current quantities are considered independent from each other. Therefore, in-phase and orthogonal signals are calculated for each quantity using SOGI-FLL. Using these orthogonal signals, the D and Q components are found using the Park transformation. The reference angle used in this transformation is obtained using a real-time clock (from GPS) and the aforementioned reference frequency.
3.2. The Dispatch Function
The dispatch function computes and executes the dispatch orders, which are setpoints of DERs and controllable loads, and CB status based on a dispatch rule. This function acquires the MG operating mode and assets information from the transition function and MCCD, respectively. In summary, the desired functionality of dispatch core function can be expressed as follows [
21]:
During SS2, load and generation are balanced;
During SS1 and SS2, controllable assets are re-dispatched in reaction to the inside events related to the load and generation status;
During SS1 and SS2, external commands and events, including MG operator and DSO, are handled, and if necessary, controllable assets are re-dispatched.
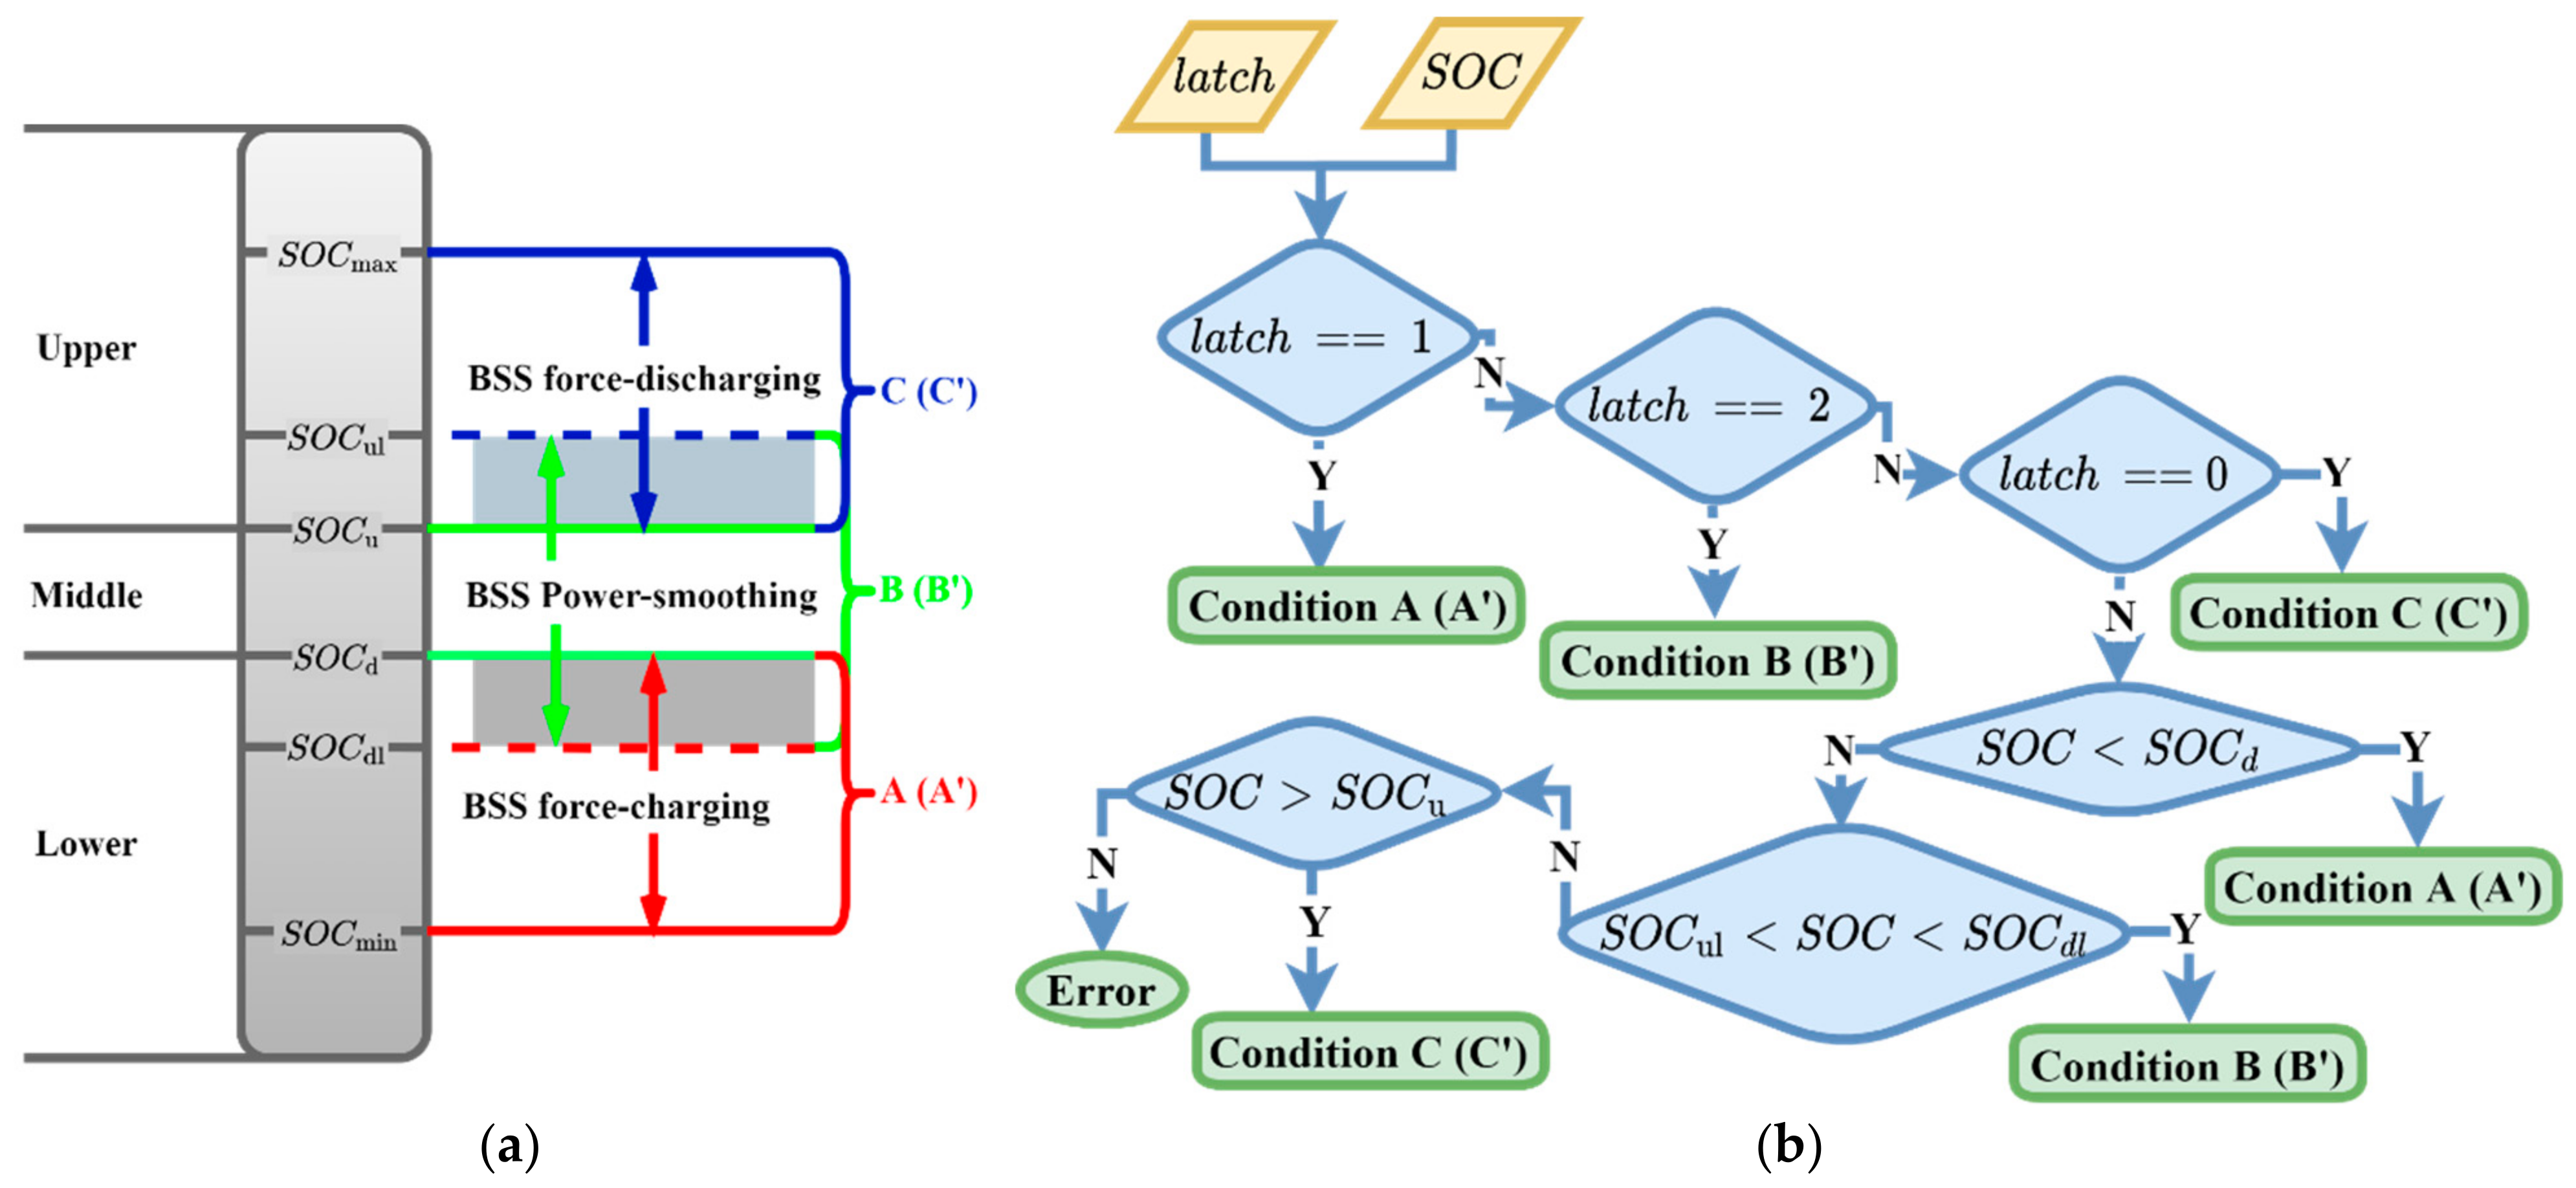
Chu Sun et al. [
26] developed a hybrid rule-based dispatch strategy as an MG central controller. The method keeps the BSS SOC around 50% for the sake of MG resiliency and reliability and to extend the BSS lifetime. Moreover, a dispatchable DG is kept ON during the operating modes of the MG. Three control modes for the dispatch strategy are allocated based on overlapped SOC ranges. In the proposed approach, a similar control allocation is adopted; however, the DG is not dispatchable, and it is off during SS1, and if necessary, it can be switched ON or OFF to decrease load shedding or renewable curtailment during SS2. Three SOC overlapped ranges are illustrated in
Figure 7a. Four adjustable parameters (
, and
) are used to define SOC ranges. Each SOC range corresponds to a control rule, which are force-charging, power-smoothing, and force-discharging. This control allocation logic is applied for dispatch function in SS2 (Conditions A, B, and C) and SS1 (
, and
). In the algorithm shown in
Figure 7b, another parameter named
is utilized to avoid rapid control mode switching in the boundaries of the SOC ranges, shown as gray-colored areas in
Figure 7a. The control rules in both SS1 and SS2 are determined considering the imbalance between the load and renewable shown in Equation (1), alongside the limits of all assets of MG, which are given in
Table 1 and
Table 3. Moreover, the prioritized load management strategy is designed and utilized in the SS2 dispatch function.
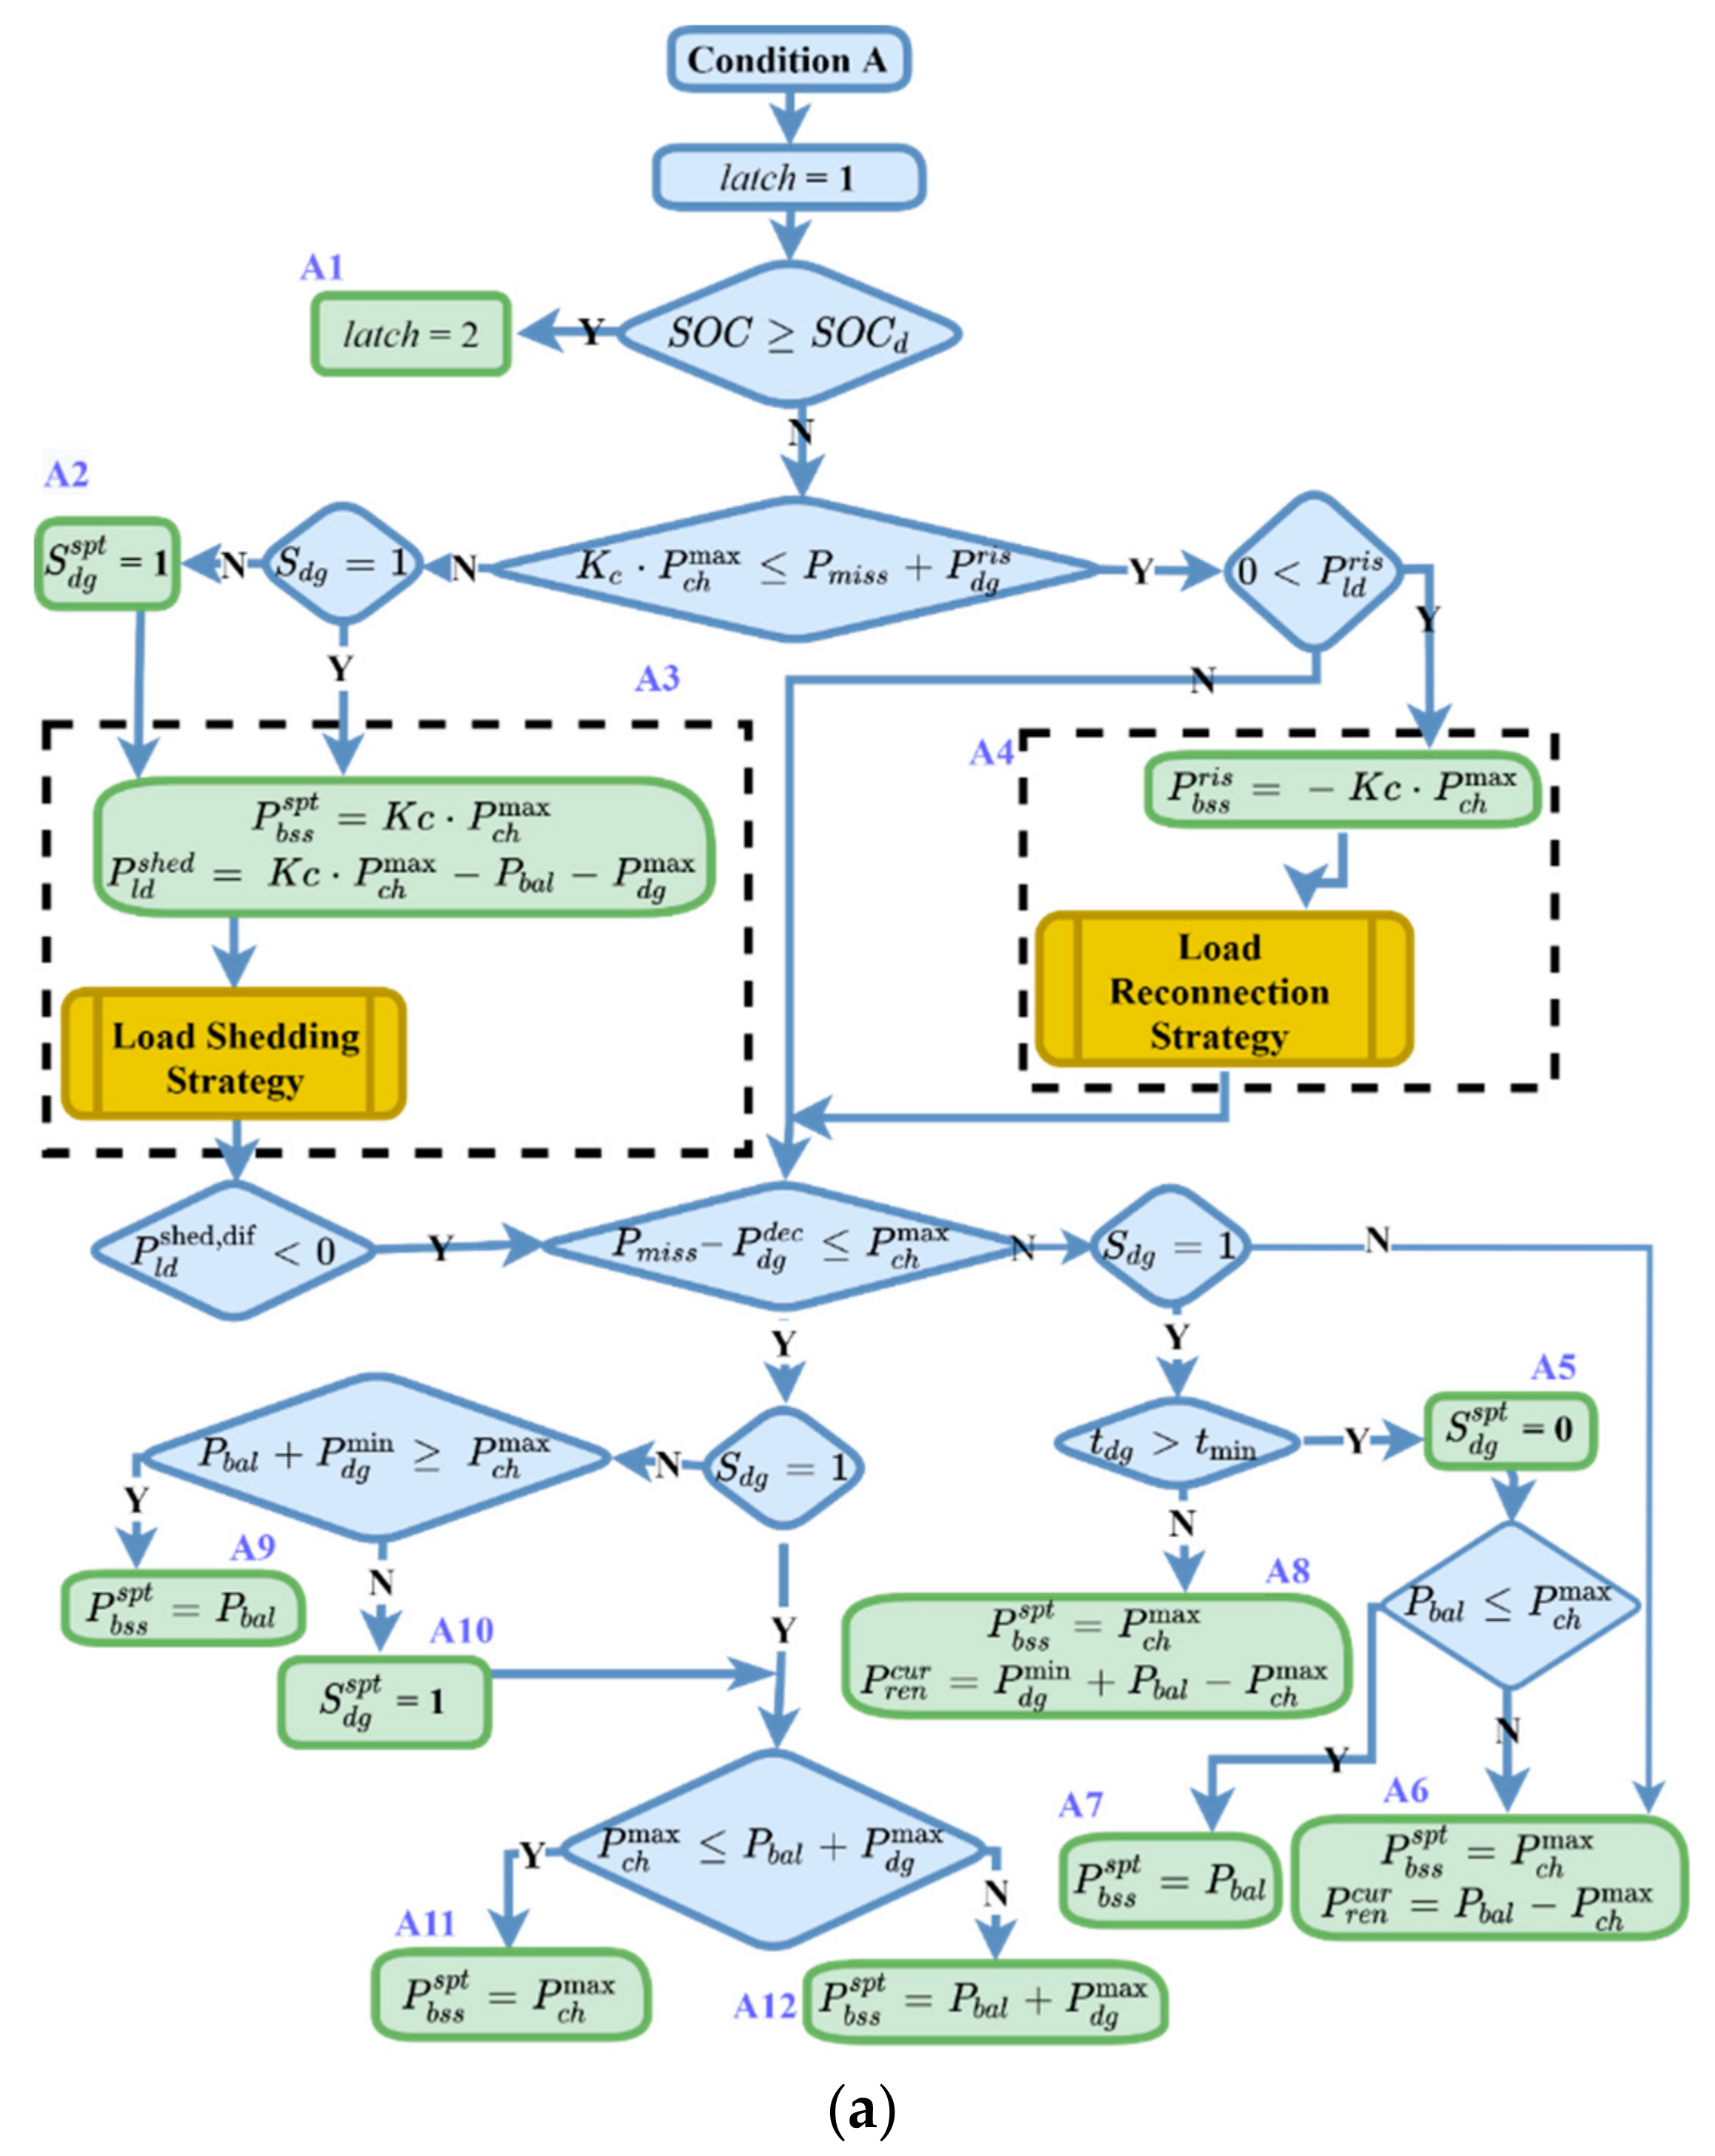
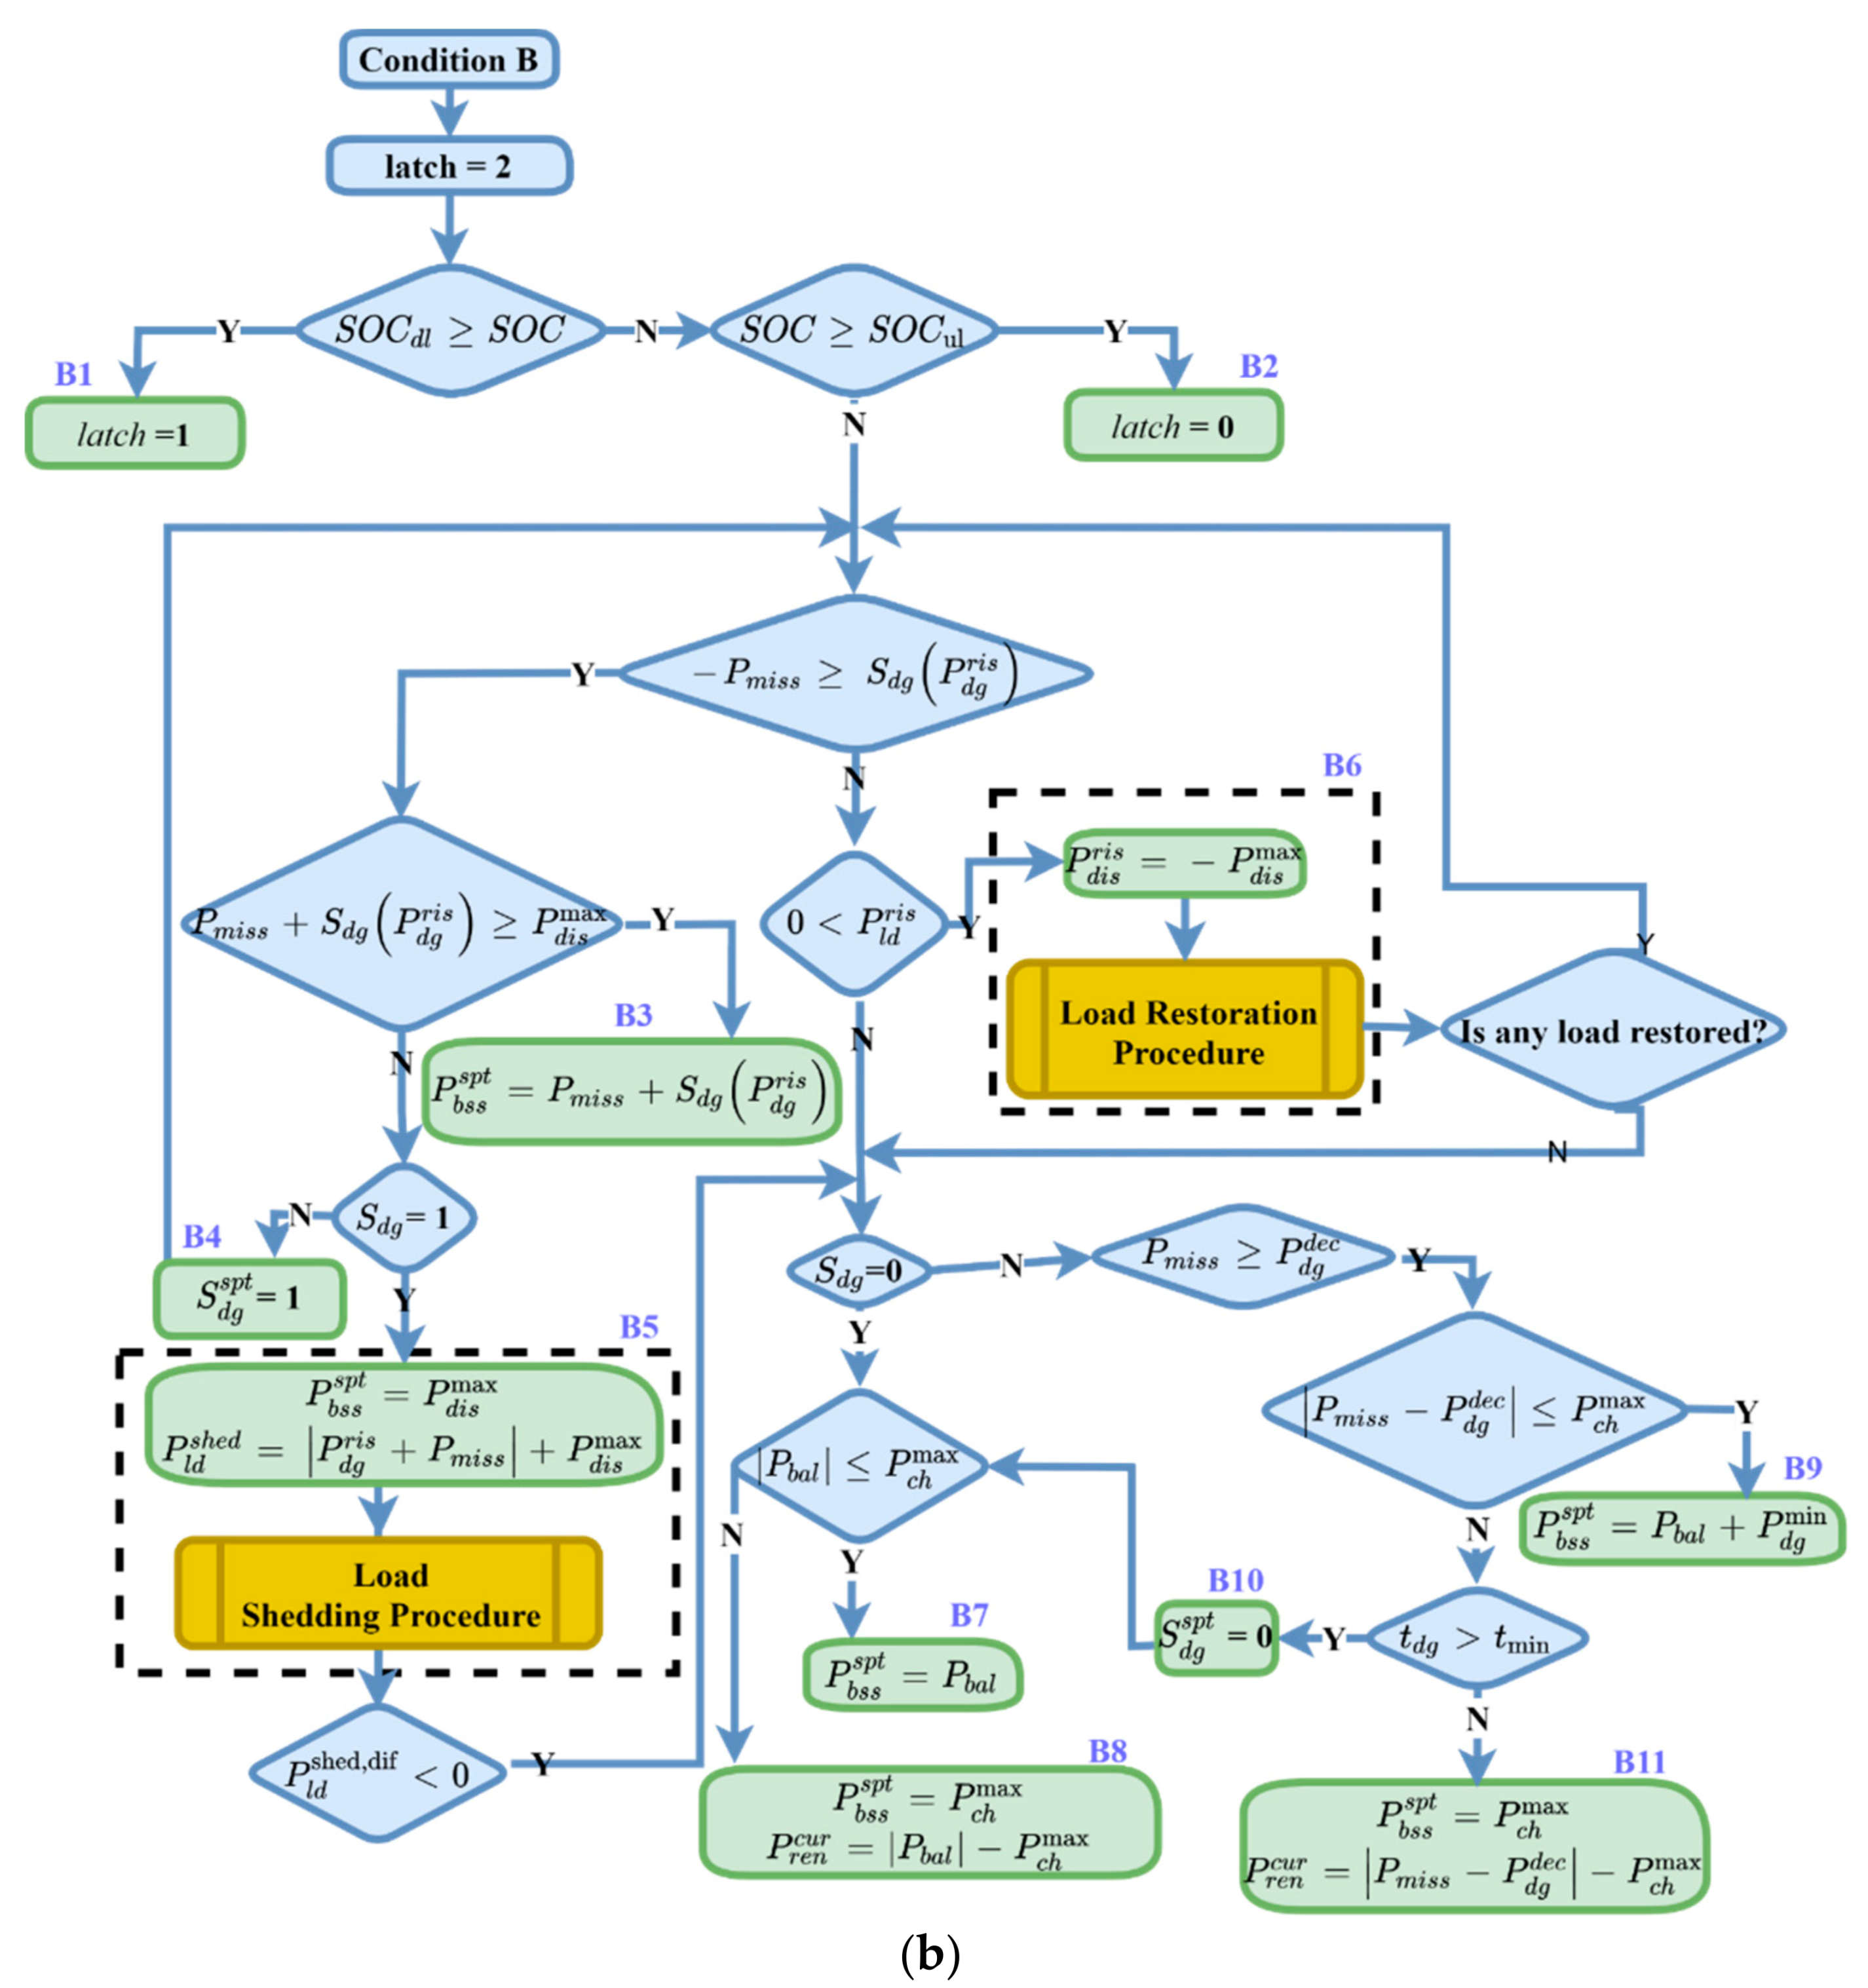
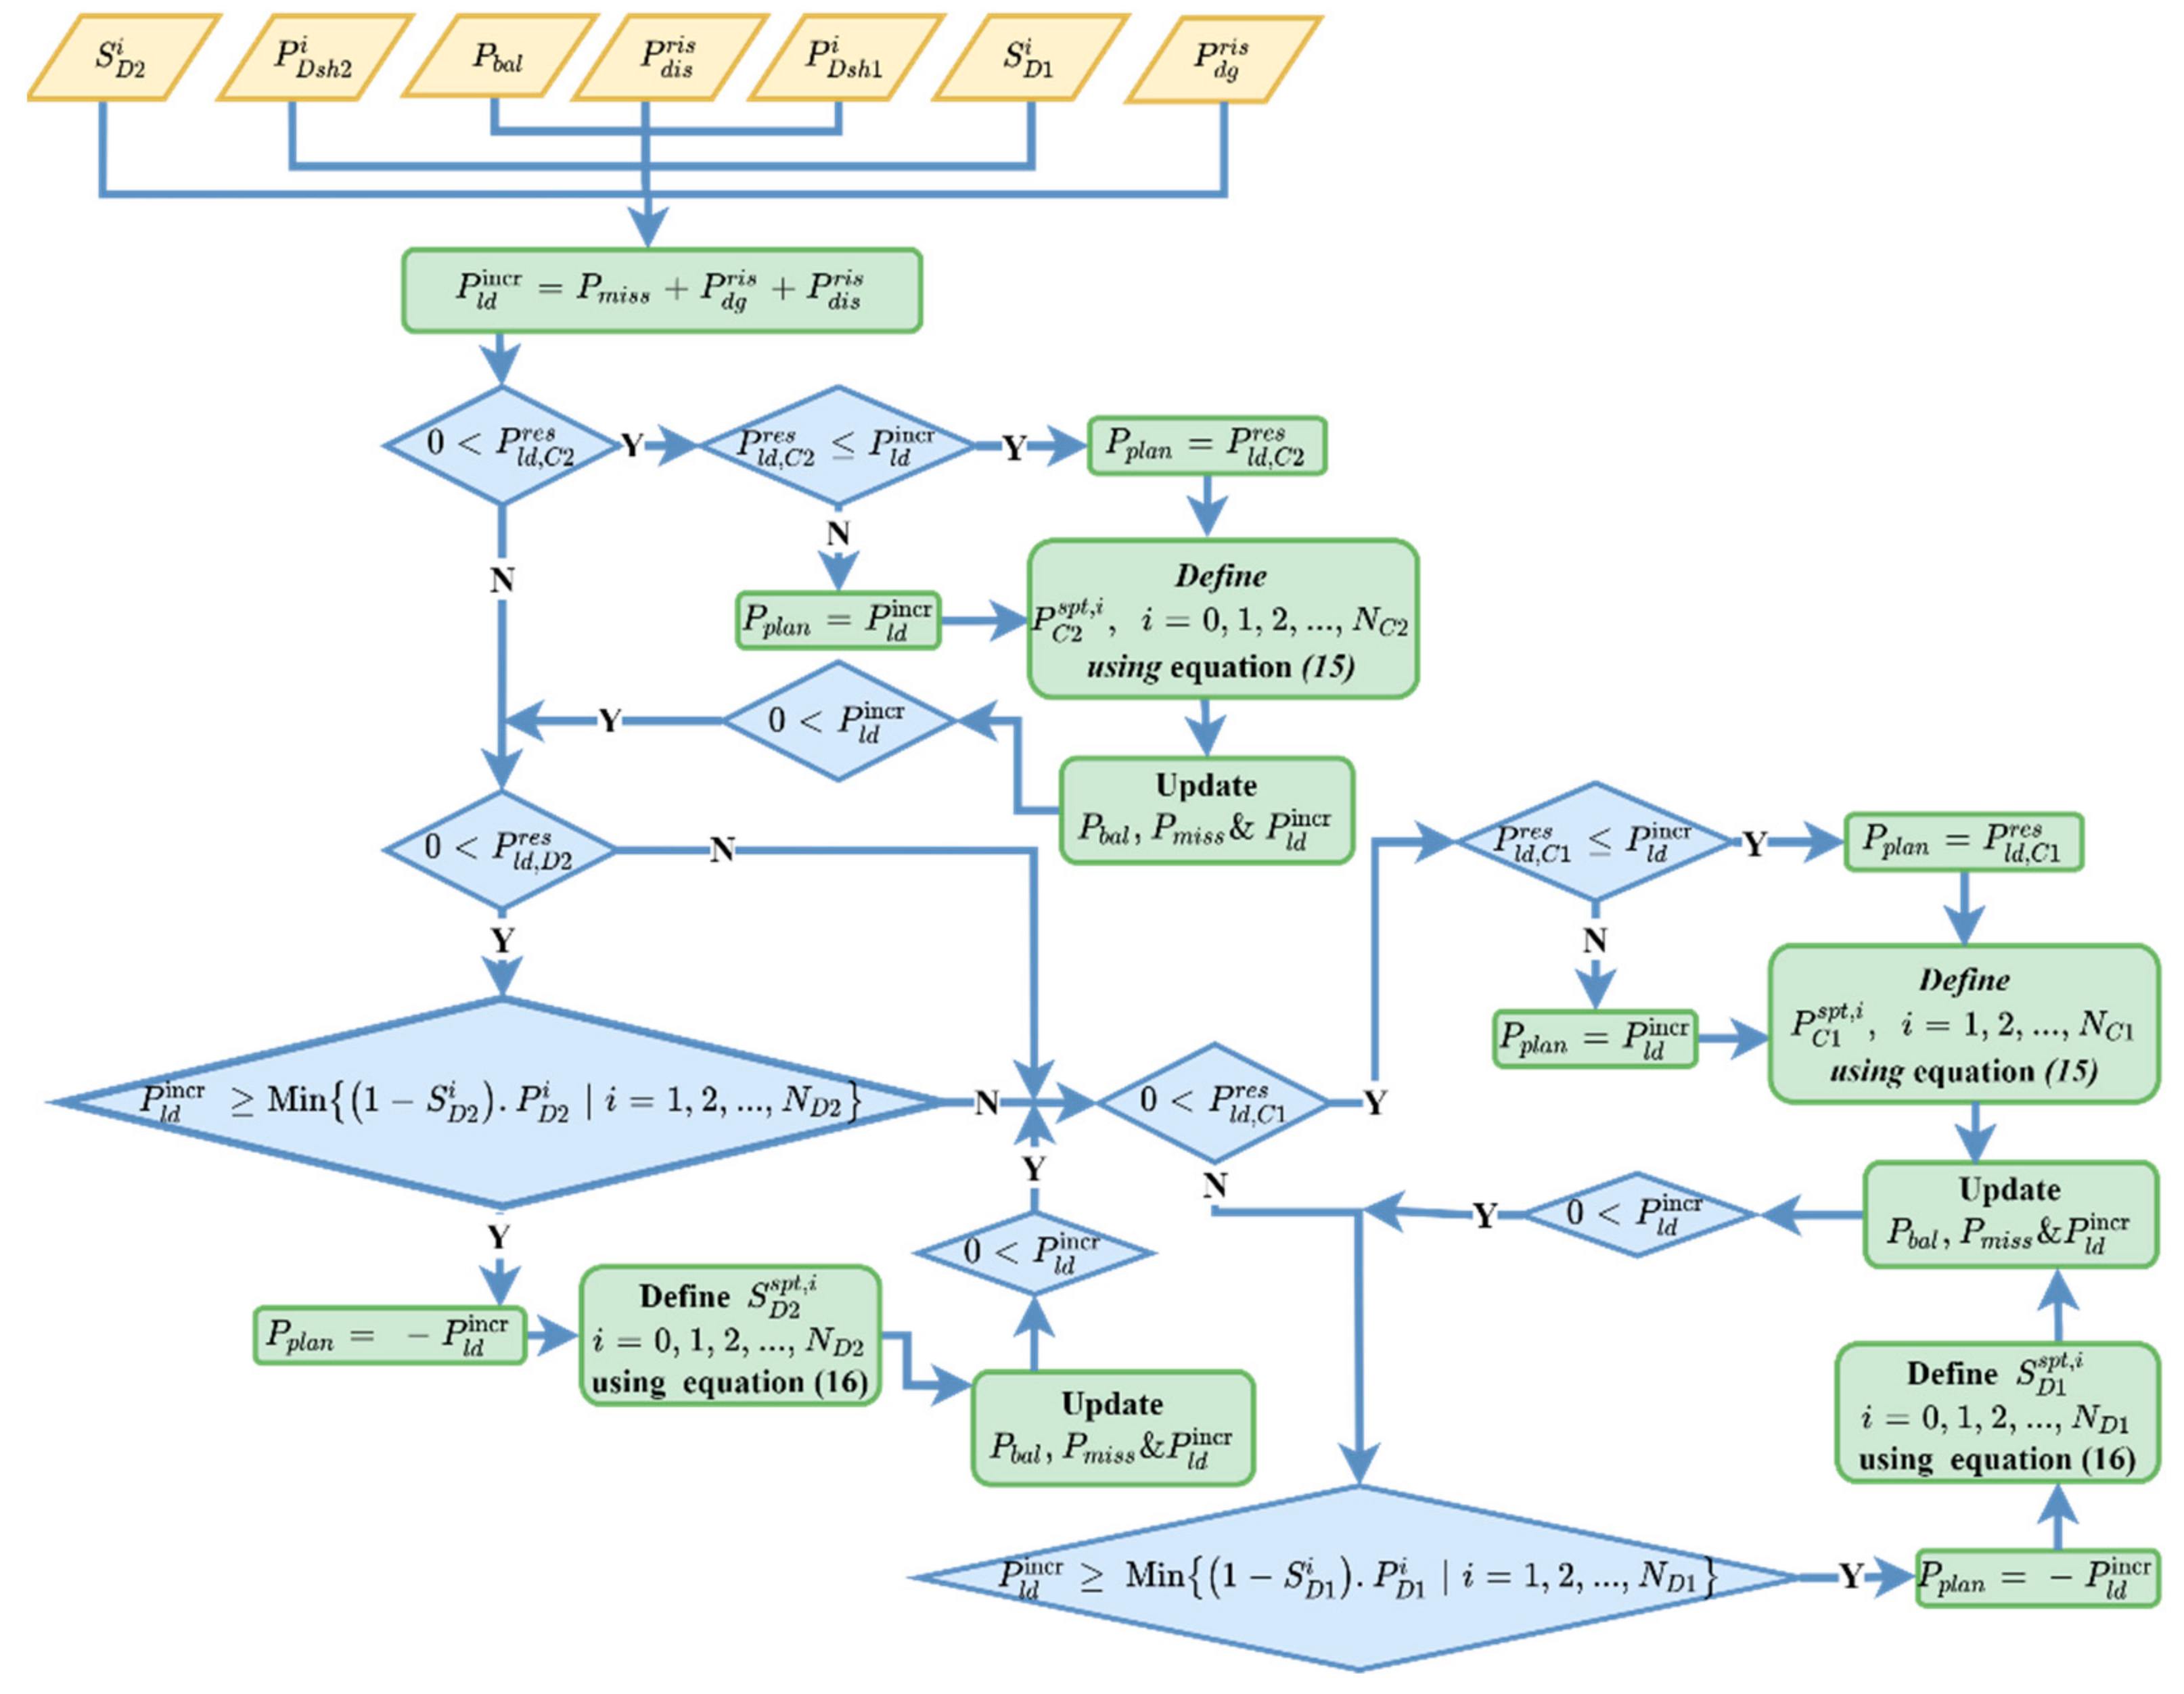
The dispatch rules associated with SS2 dispatch mode are illustrated in
Figure 8. The commands of dispatch rules will be cited by corresponding, blue-colored labels in
Figure 8. In these dispatch rules, the first priority is to define the power setpoint of BSS regarding the SOC ranges, which makes BSS avoid discharge and charge in force-charging and force-discharging conditions, respectively. The second priority is to avoid renewable curtailment and load shedding.
For the force-charging rule, given in
Figure 8a, the allowed operational interval of BSS and DG are given in Equations (2) and (3). Considering these intervals, Equation (5) is derived. This interval indicates the upper and lower limits of
, in which load shedding or renewable curtailment is not necessary.
is the power mismatch between the generation and load, which is to be compensated by the BSS. In the case of
being less than the lower boundary of Equation (5), the operational status of DG has checked whether it is ON. If the DG is OFF, it will be turned ON (A2), then the BSS charging power will be minimum. The required amount of load to be shedded (
) will then be determined (A3), and the OFF/ON command of the DCLs and CCL’s setpoints is determined through the load shedding procedure. Because of the discretely controlled loads, the shedded load might be more than the required amount, which will be checked by
. If this variable is equal to zero, the process will be terminated; otherwise, this difference will be compensated by charging BSS or renewable curtailment.
where:
If the
satisfies the lower boundary interval presented in Equation (5), and the restorable load (
), given in Equation (8), is available, the load restoration procedure (A5) is executed to update the power and status set point of the loads. Additional to the generation and load imbalance, the possible BSS’s share (
) in the incremental load (
) is
for this dispatch rule. This means that the minimum BSS charging power is reduced from the incremental load.
Following this, the execution of each of the load management strategy procedures, and values, are updated. The upper boundary interval given in Equation (5) is then checked. If this condition is fulfilled, considering the status and operational limitation of DG, BSS is charged as much as possible (A9, A11, and A12). DG is turned ON (A10) if it is necessary to fulfill this aim. However, if exceeds the upper boundary of the interval, renewables are needed to be curtailed, and BSS power setpoint is (A6, and A8). The DG might be turned OFF (A5), considering and to avoid (A7) or reduce the renewable curtailment.
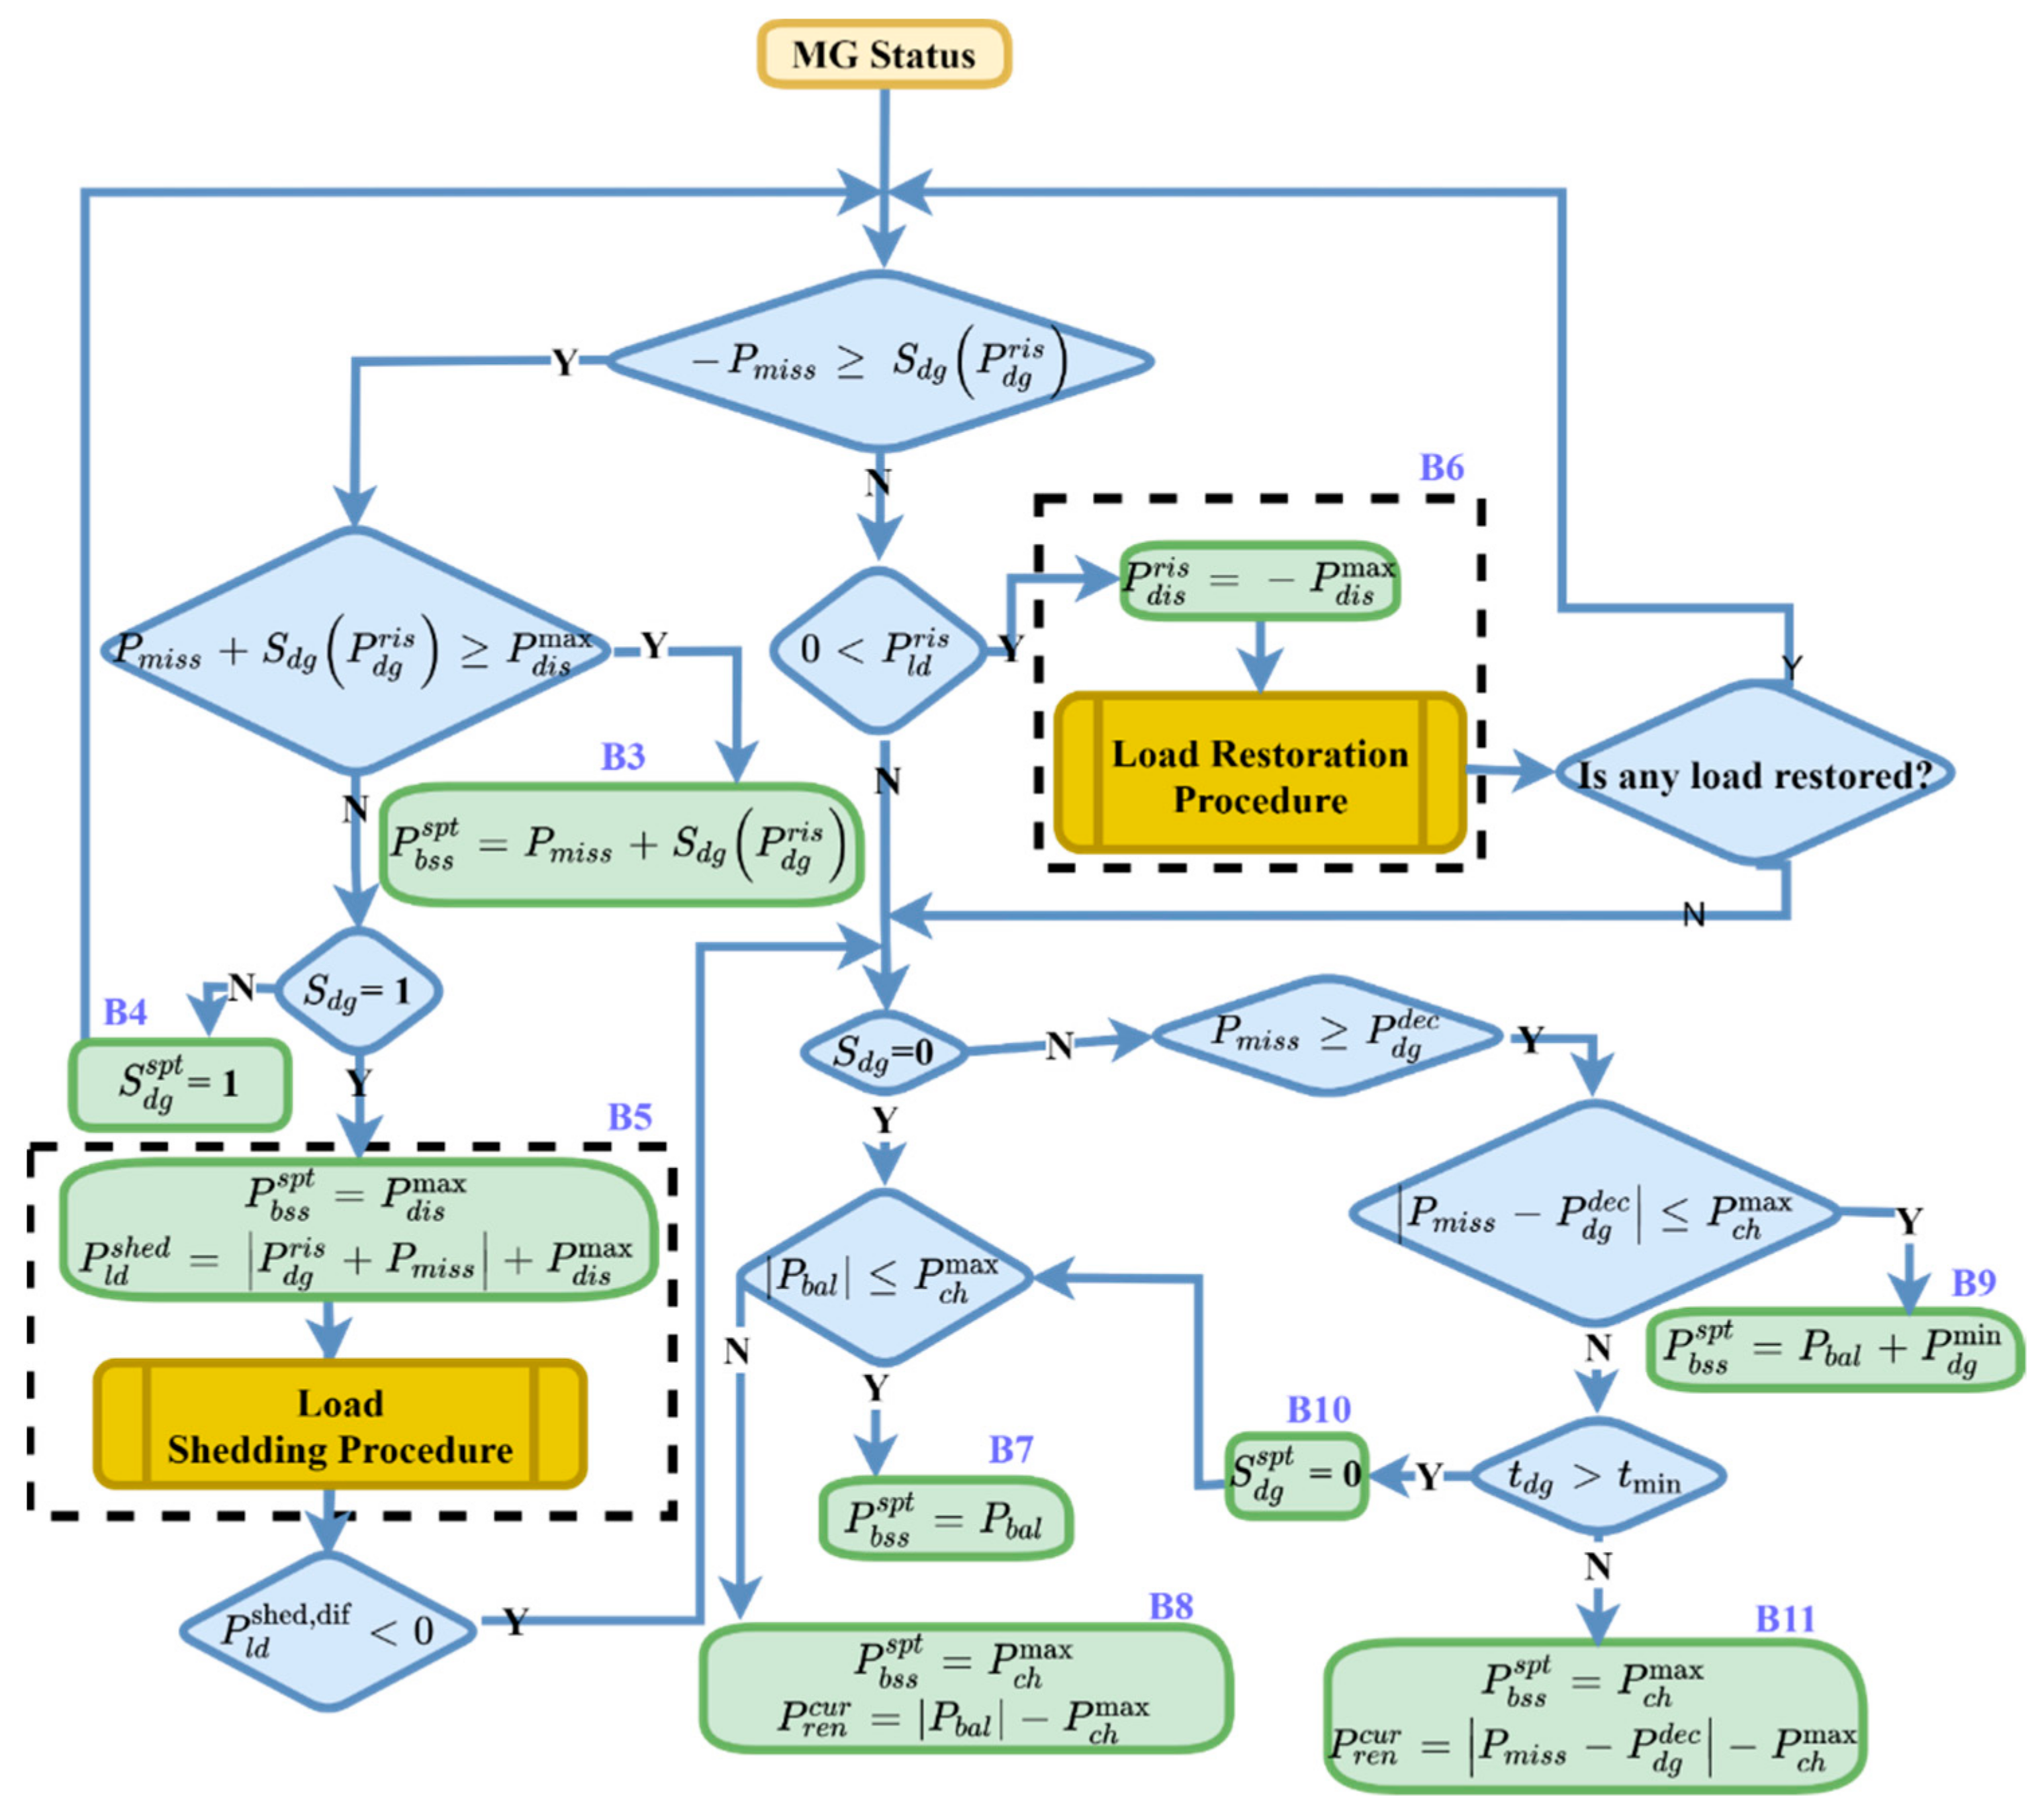
In dispatch rule B, shown in
Figure 8b, the average BSS power is zero, and DG power variations alongside (B3, B7, and B9) with DG status switching will balance the generation and load (B4 and B10). However, BSS and DG might not be able to compensate for the imbalance. Therefore, the load shedding (B5) procedure or renewable curtailment (B8 and B10) will be applied. As in dispatch rule A, the load restoration procedure (B6) can be utilized depending on the assets’ operational conditions. For this rule,
is equal to
, which does not mean BSS will discharge at the maximum rate, and
is determined in the further steps.
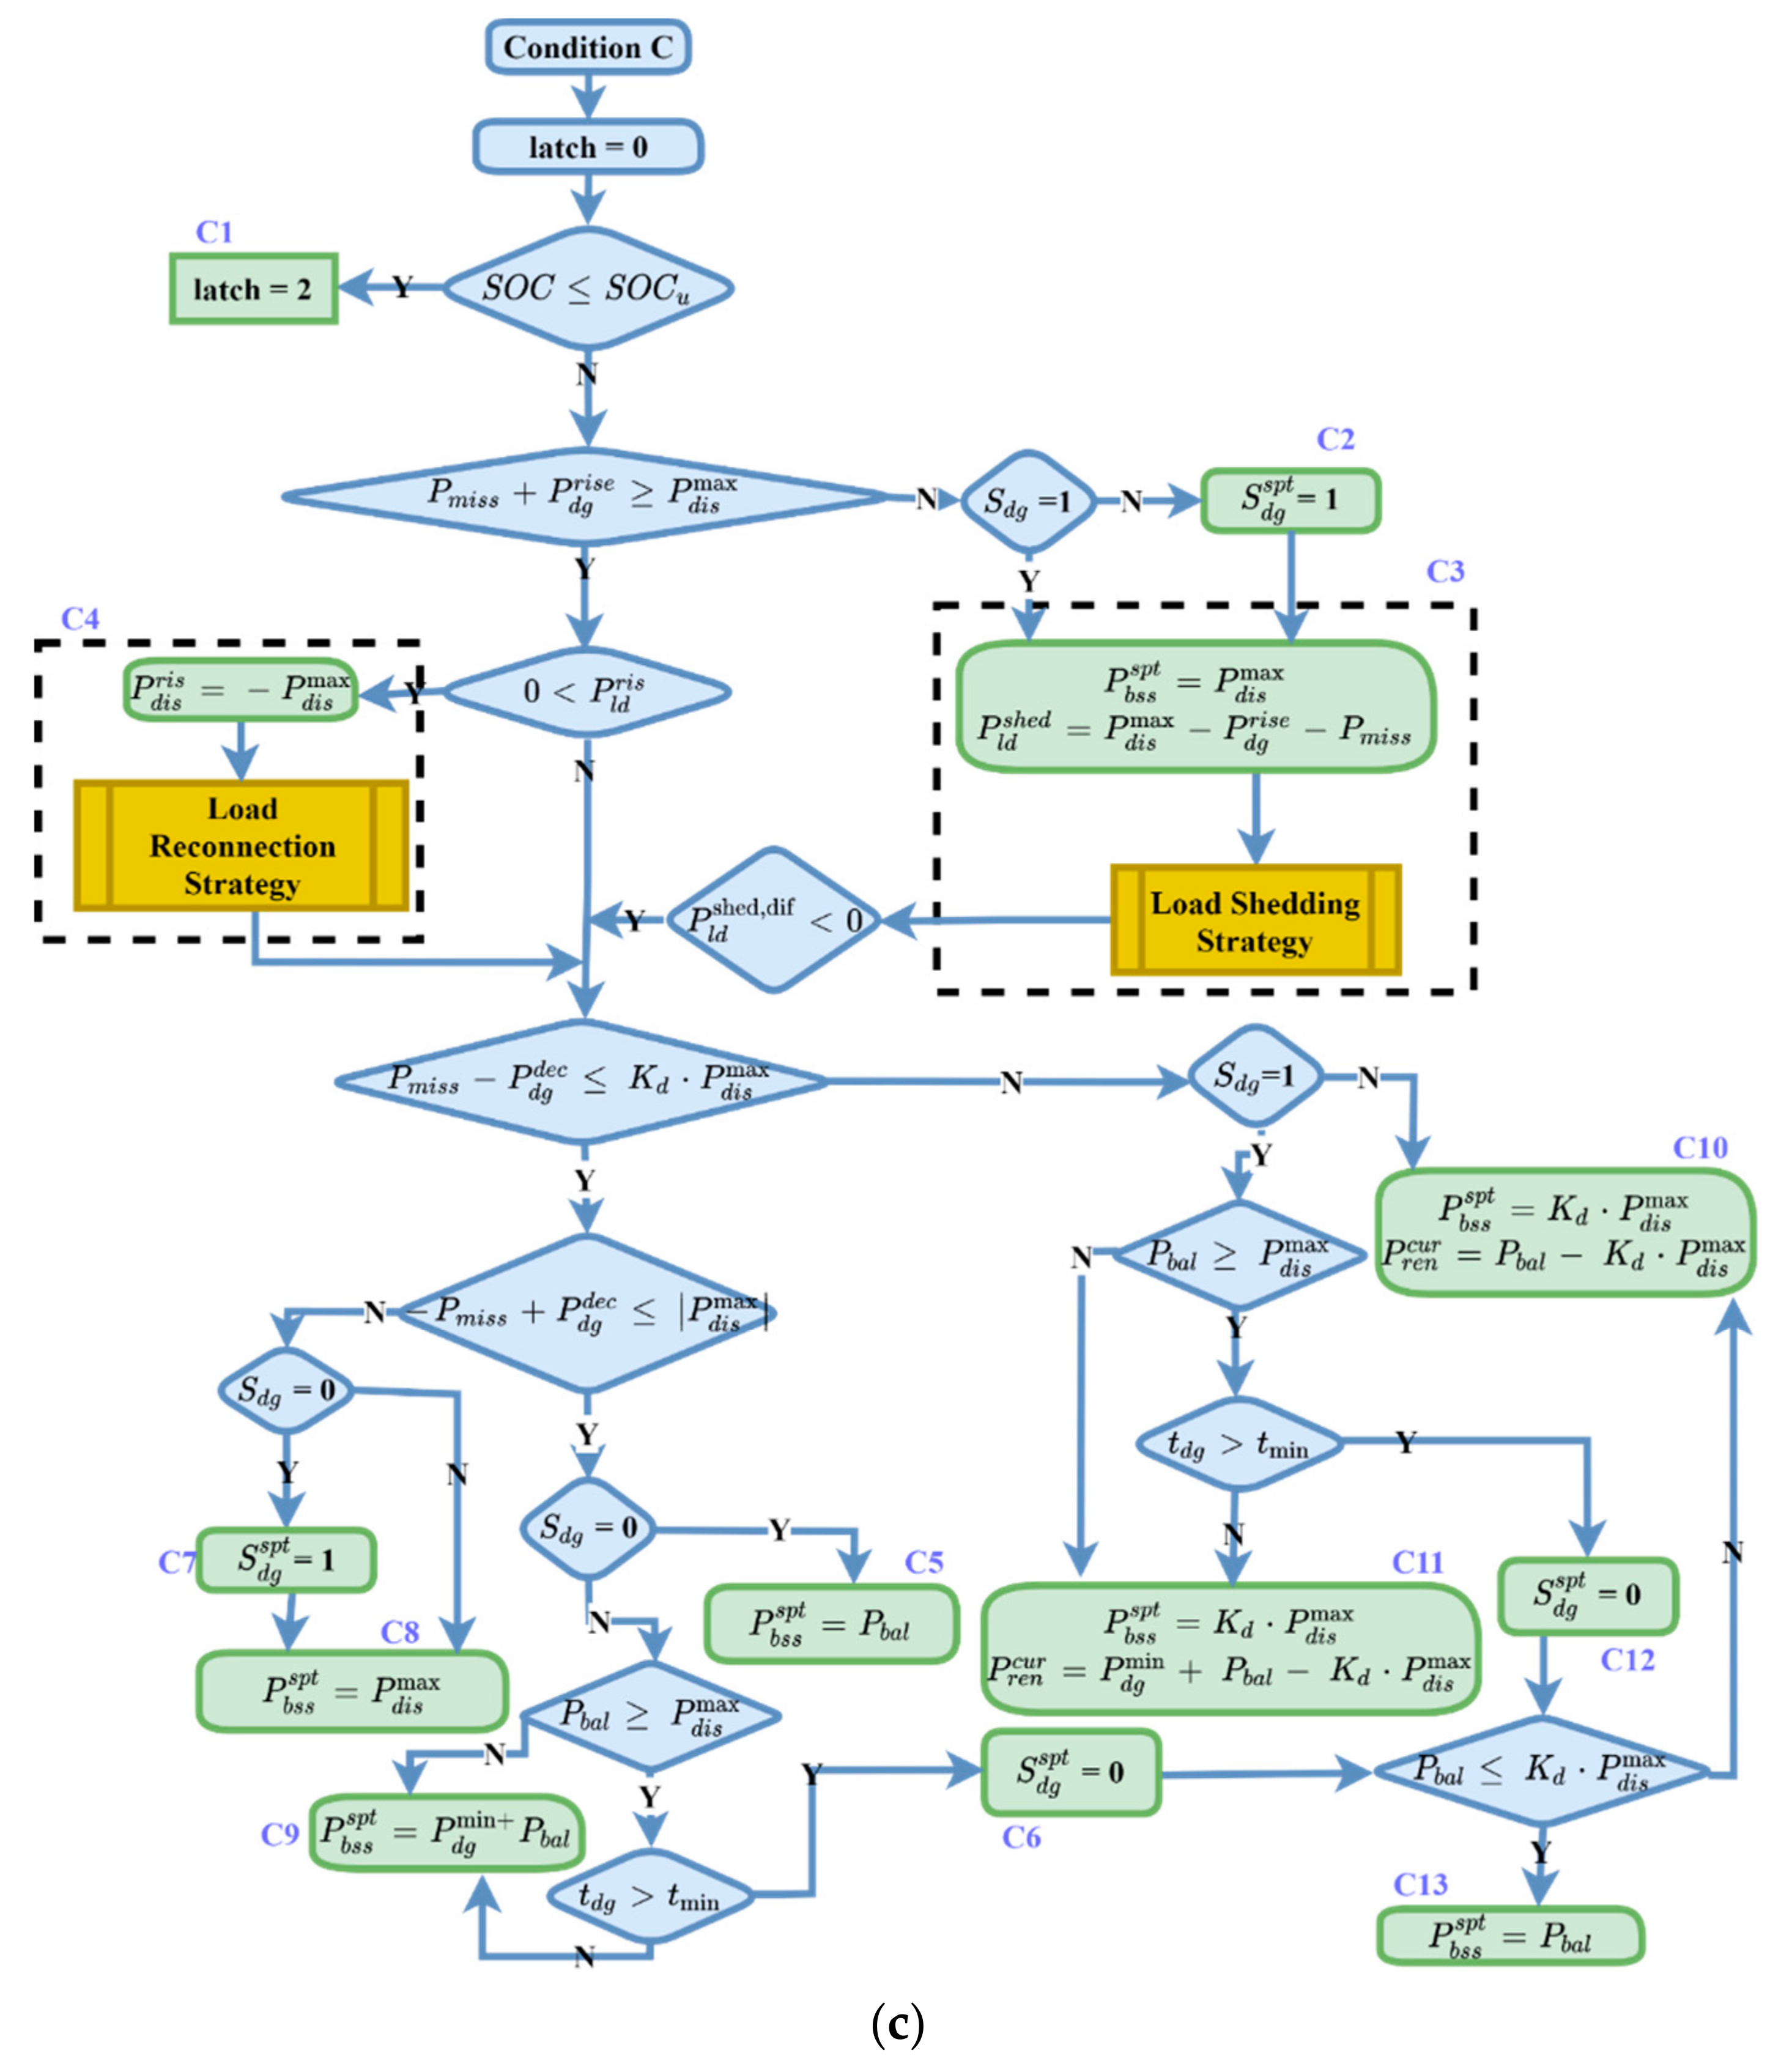
Similar to dispatch rule A, the force-discharging rule can be derived by applying interval analyses to Equations (1), (2) and (9) and reveals the interval given in Equation (10). If
does not satisfy the lower or upper boundaries of the interval presented in Equation (10), load shedding (C3), and renewable curtailment (C10 and C11) will be obtained and
will be set to discharge as much as possible (C5, C8, C9, and C13). However, DG might be turned ON (C2) or OFF (C12), considering
and
to reduce load shedding and renewable curtailment, respectively. The main priority of this dispatch rule is to discharge the BSS;
is set to be
for load restoration (C4).
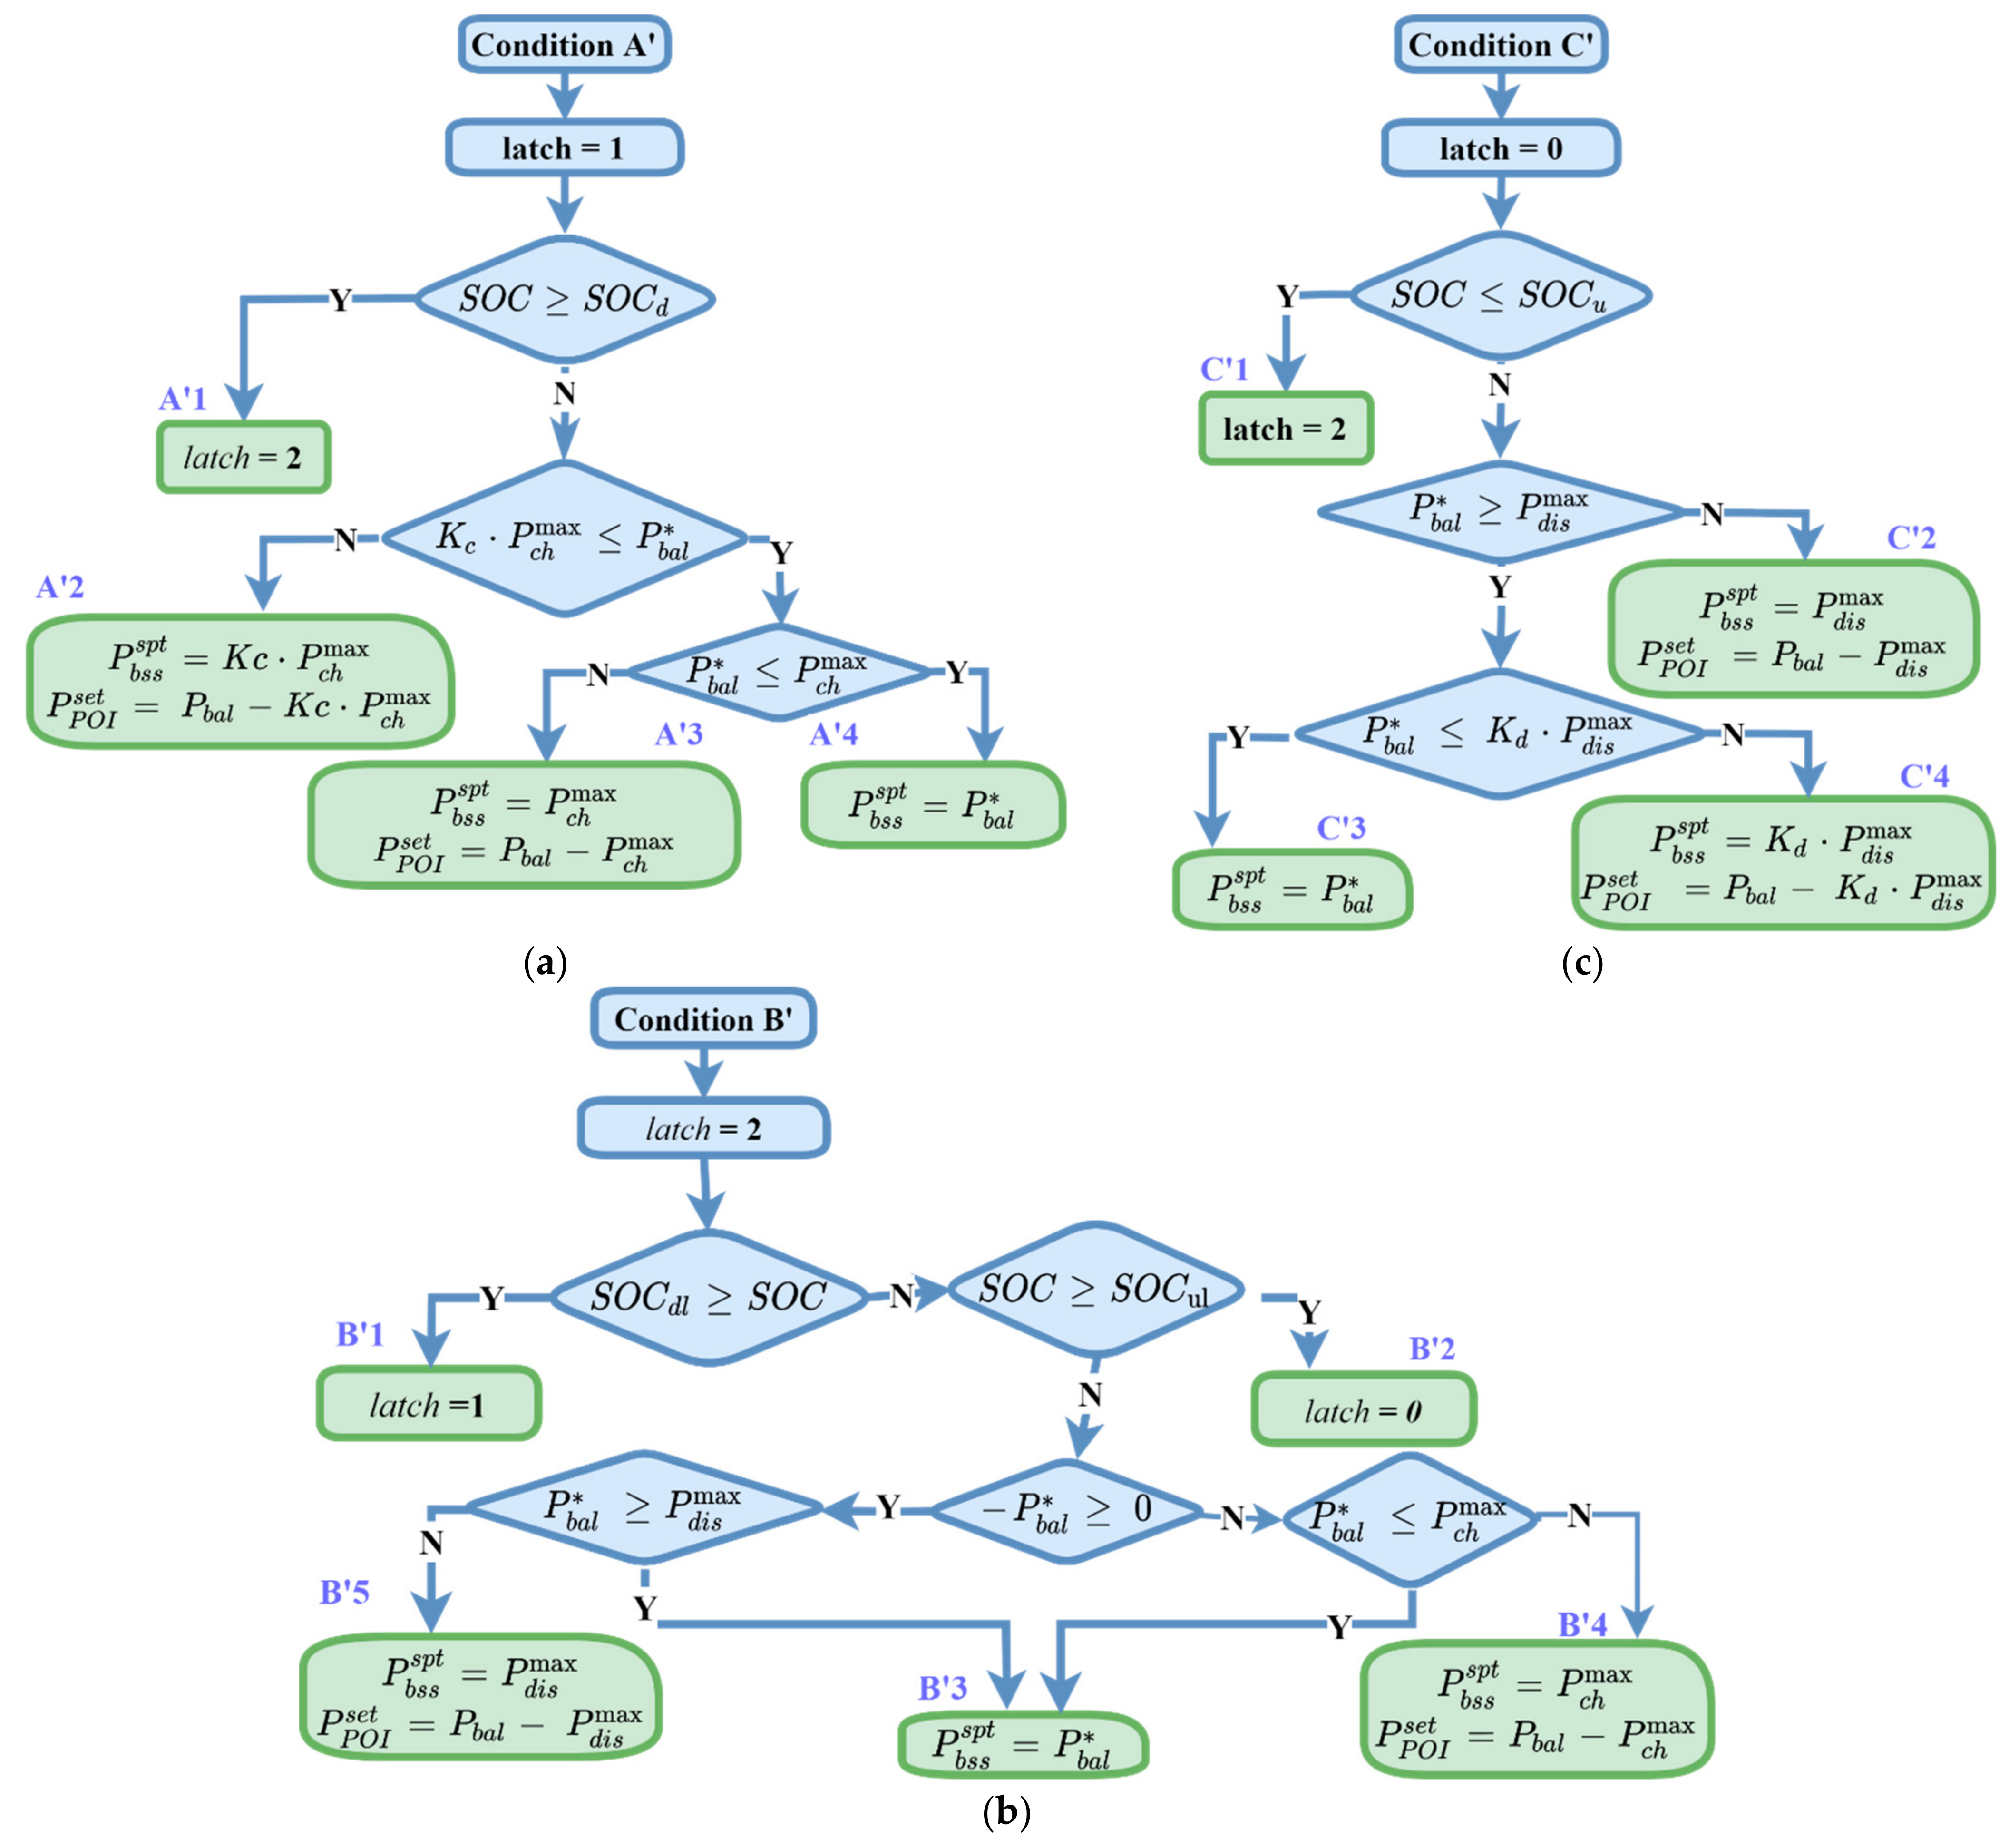
The dispatch rules for SS1 dispatch mode (A’, B’, and C’) are illustrated in
Figure 9. The main differences between these sets of rules and the previous set are that DG is kept OFF, and instead of load shedding, renewable curtailment, or load restoration, POI active power requirement (
) is updated. For this purpose, Equation (1) has been modified to Equation (11), and Equations (12) and (13), corresponding to A’ and C,’ respectively, are derived.
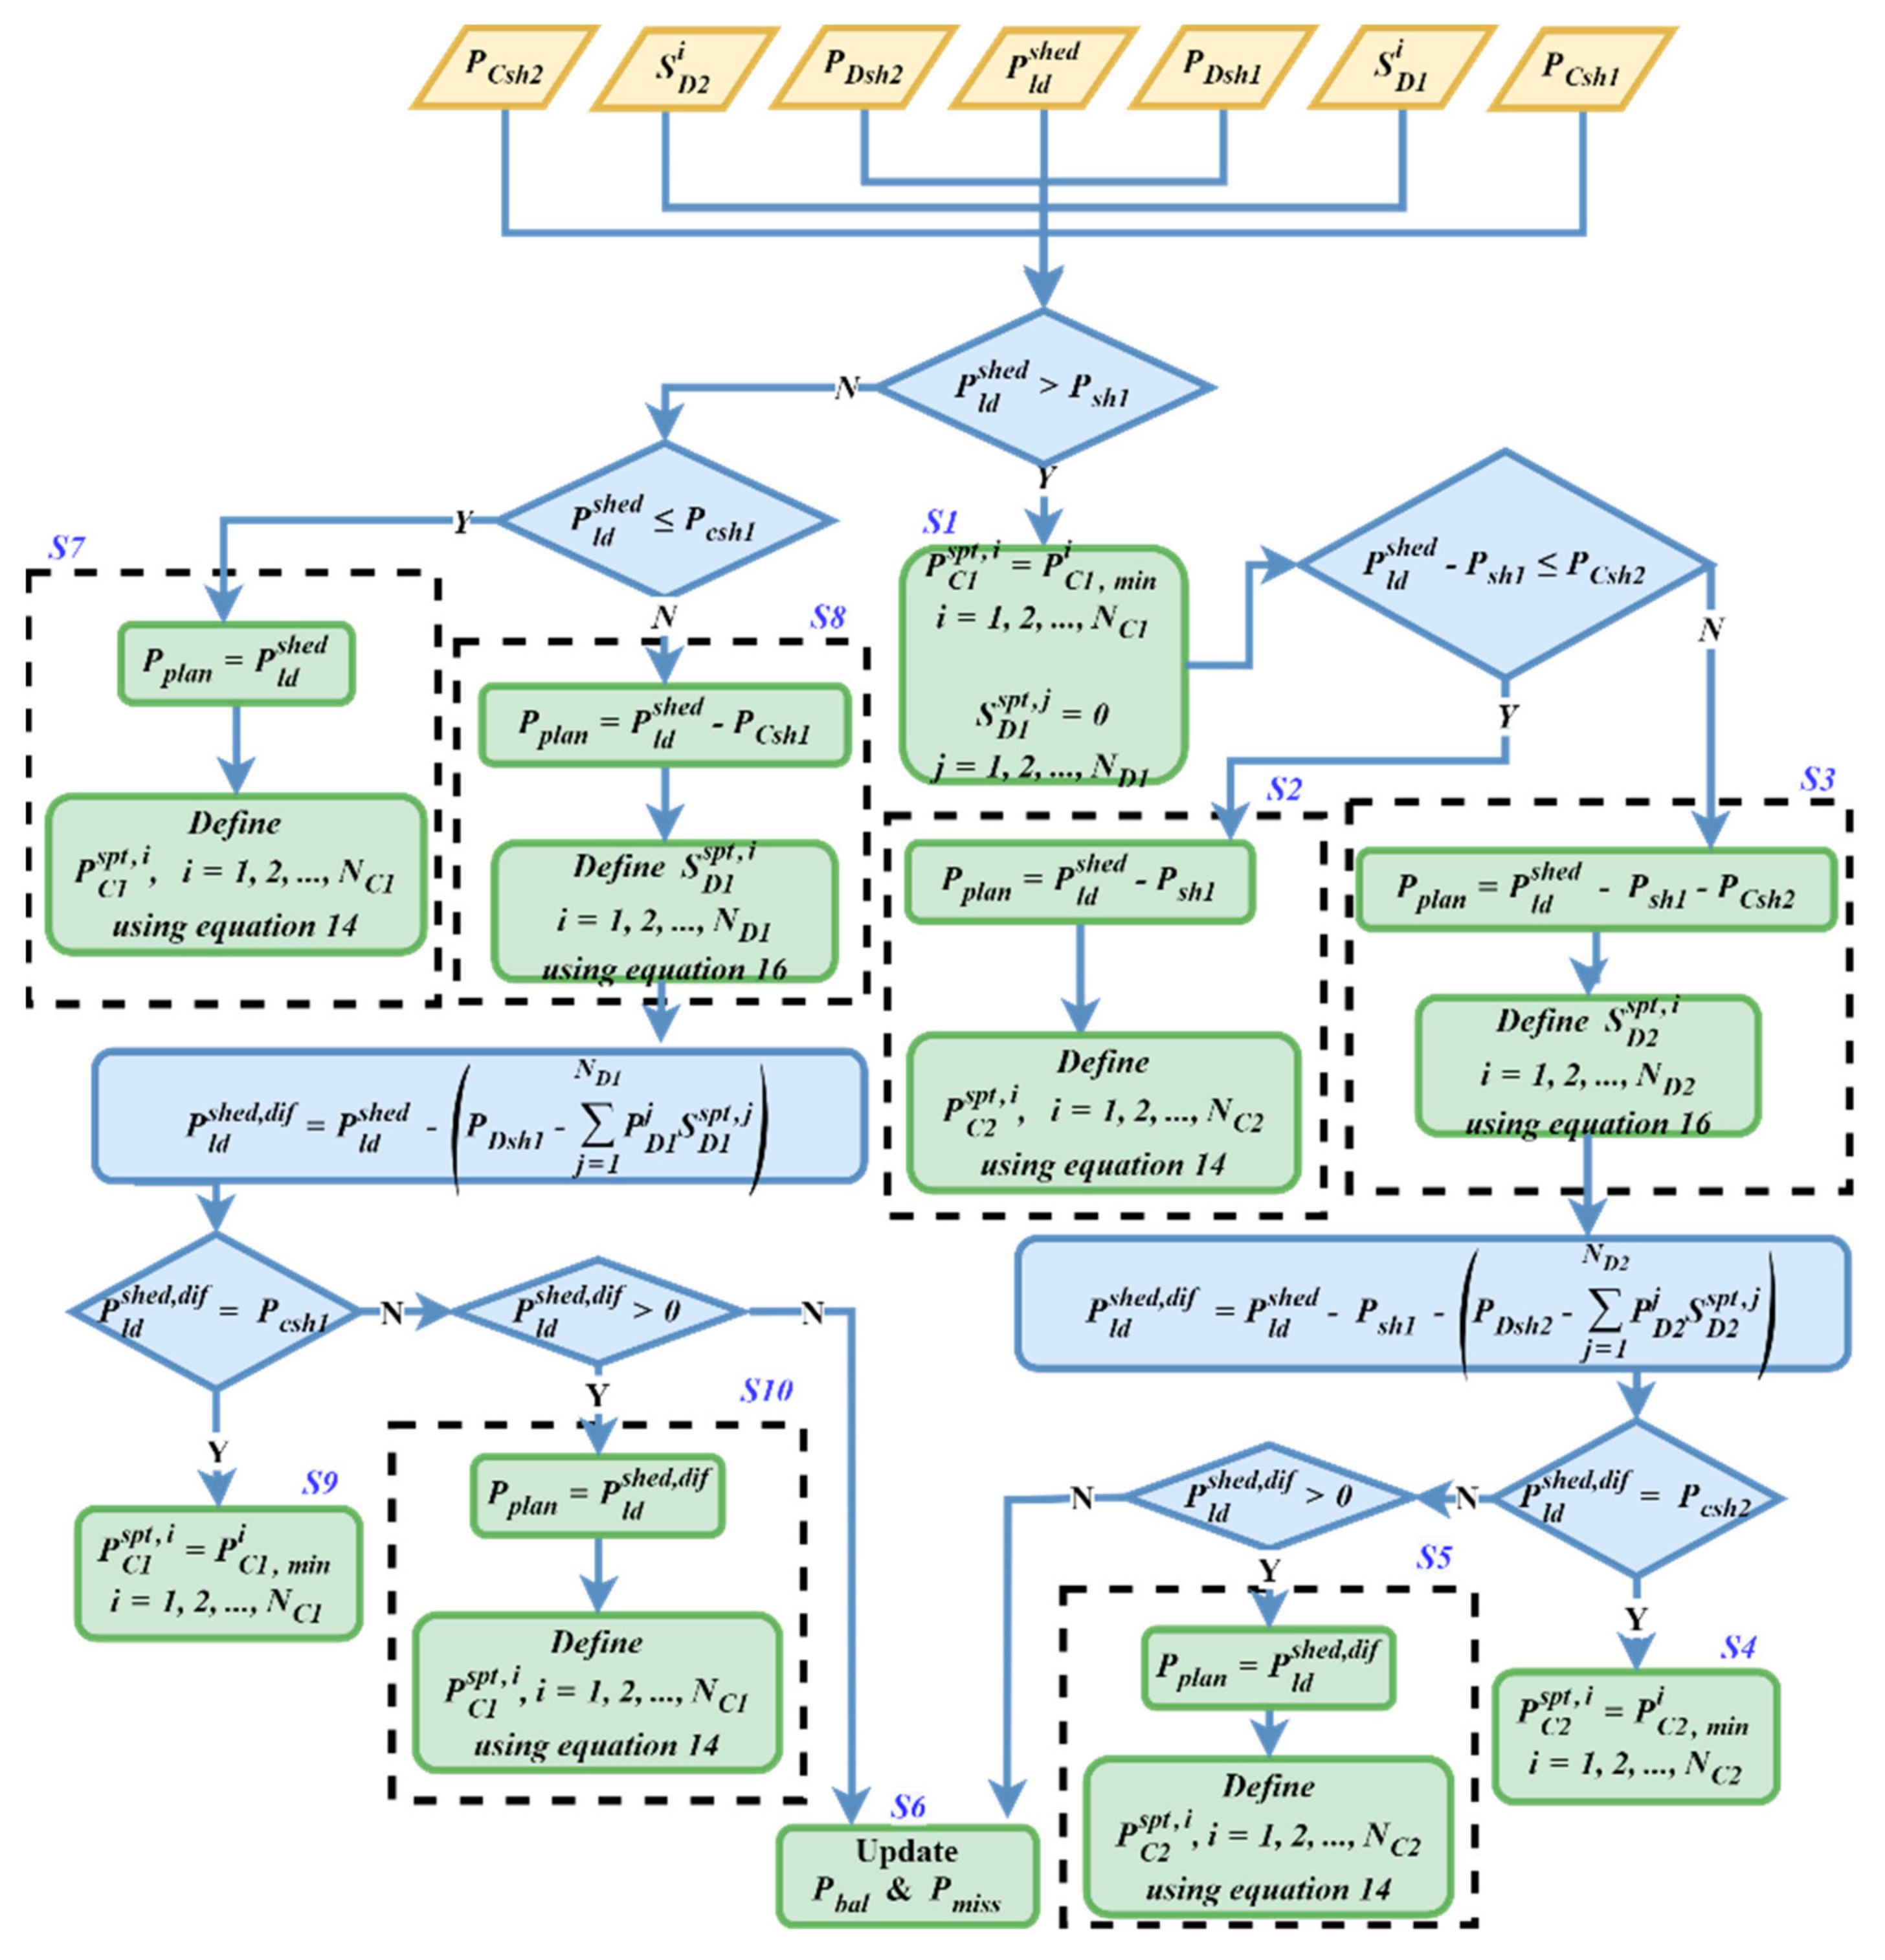
3.2.1. Load Management Strategy
Load management strategy consists of two procedures, which are load shedding and load restoration. Both of these procedures are designed regarding the criticality and controllability of loads. Increment or decrement in load might be due to the fluctuations of the renewable resources. Thus, modification is applied first on the CCLs of the considered load category to reduce the ON/OFF actions impacts. Corresponding flow charts to these procedures are presented in
Figure 10 and
Figure 11, and details of related parameters are explained in
Table 3. It should be noted that the load management strategy is designed to be flexible, and the presence of any kind of load is not necessary for this strategy.
In these procedures, the weighing methods given in (14) and (15) and the queuing methods given in (16) are utilized to determine setpoints for CCLs and DCLs, respectively. Equation (16) is an optimization problem aiming to determine the ON/OFF status commands for DCLs such that the total power of that set load becomes less or equal to the desired value with the difference minimum difference. This optimization is utilized for both load shedding and restoration procedures.
is positive for load shedding and is negative for restoration. Accordingly, the total shedded DCL might be more than the required amount. Therefore, in the case of partially shedding both CCL and DCL, it is first supposed that all CCL is shedded (S3 and S8 in
Figure 10). If the resultant shedded DCL is less than the desired, the mismatch is compensated by CCL (S5 and S10 in
Figure 10). In the restoration procedure, a similar logic compared to the load shedding is obtained. Similarly, the CCL loads is considered in this algorithm to avoid rapid load switching due to renewable intermittency. However, the priority load group is restored first.
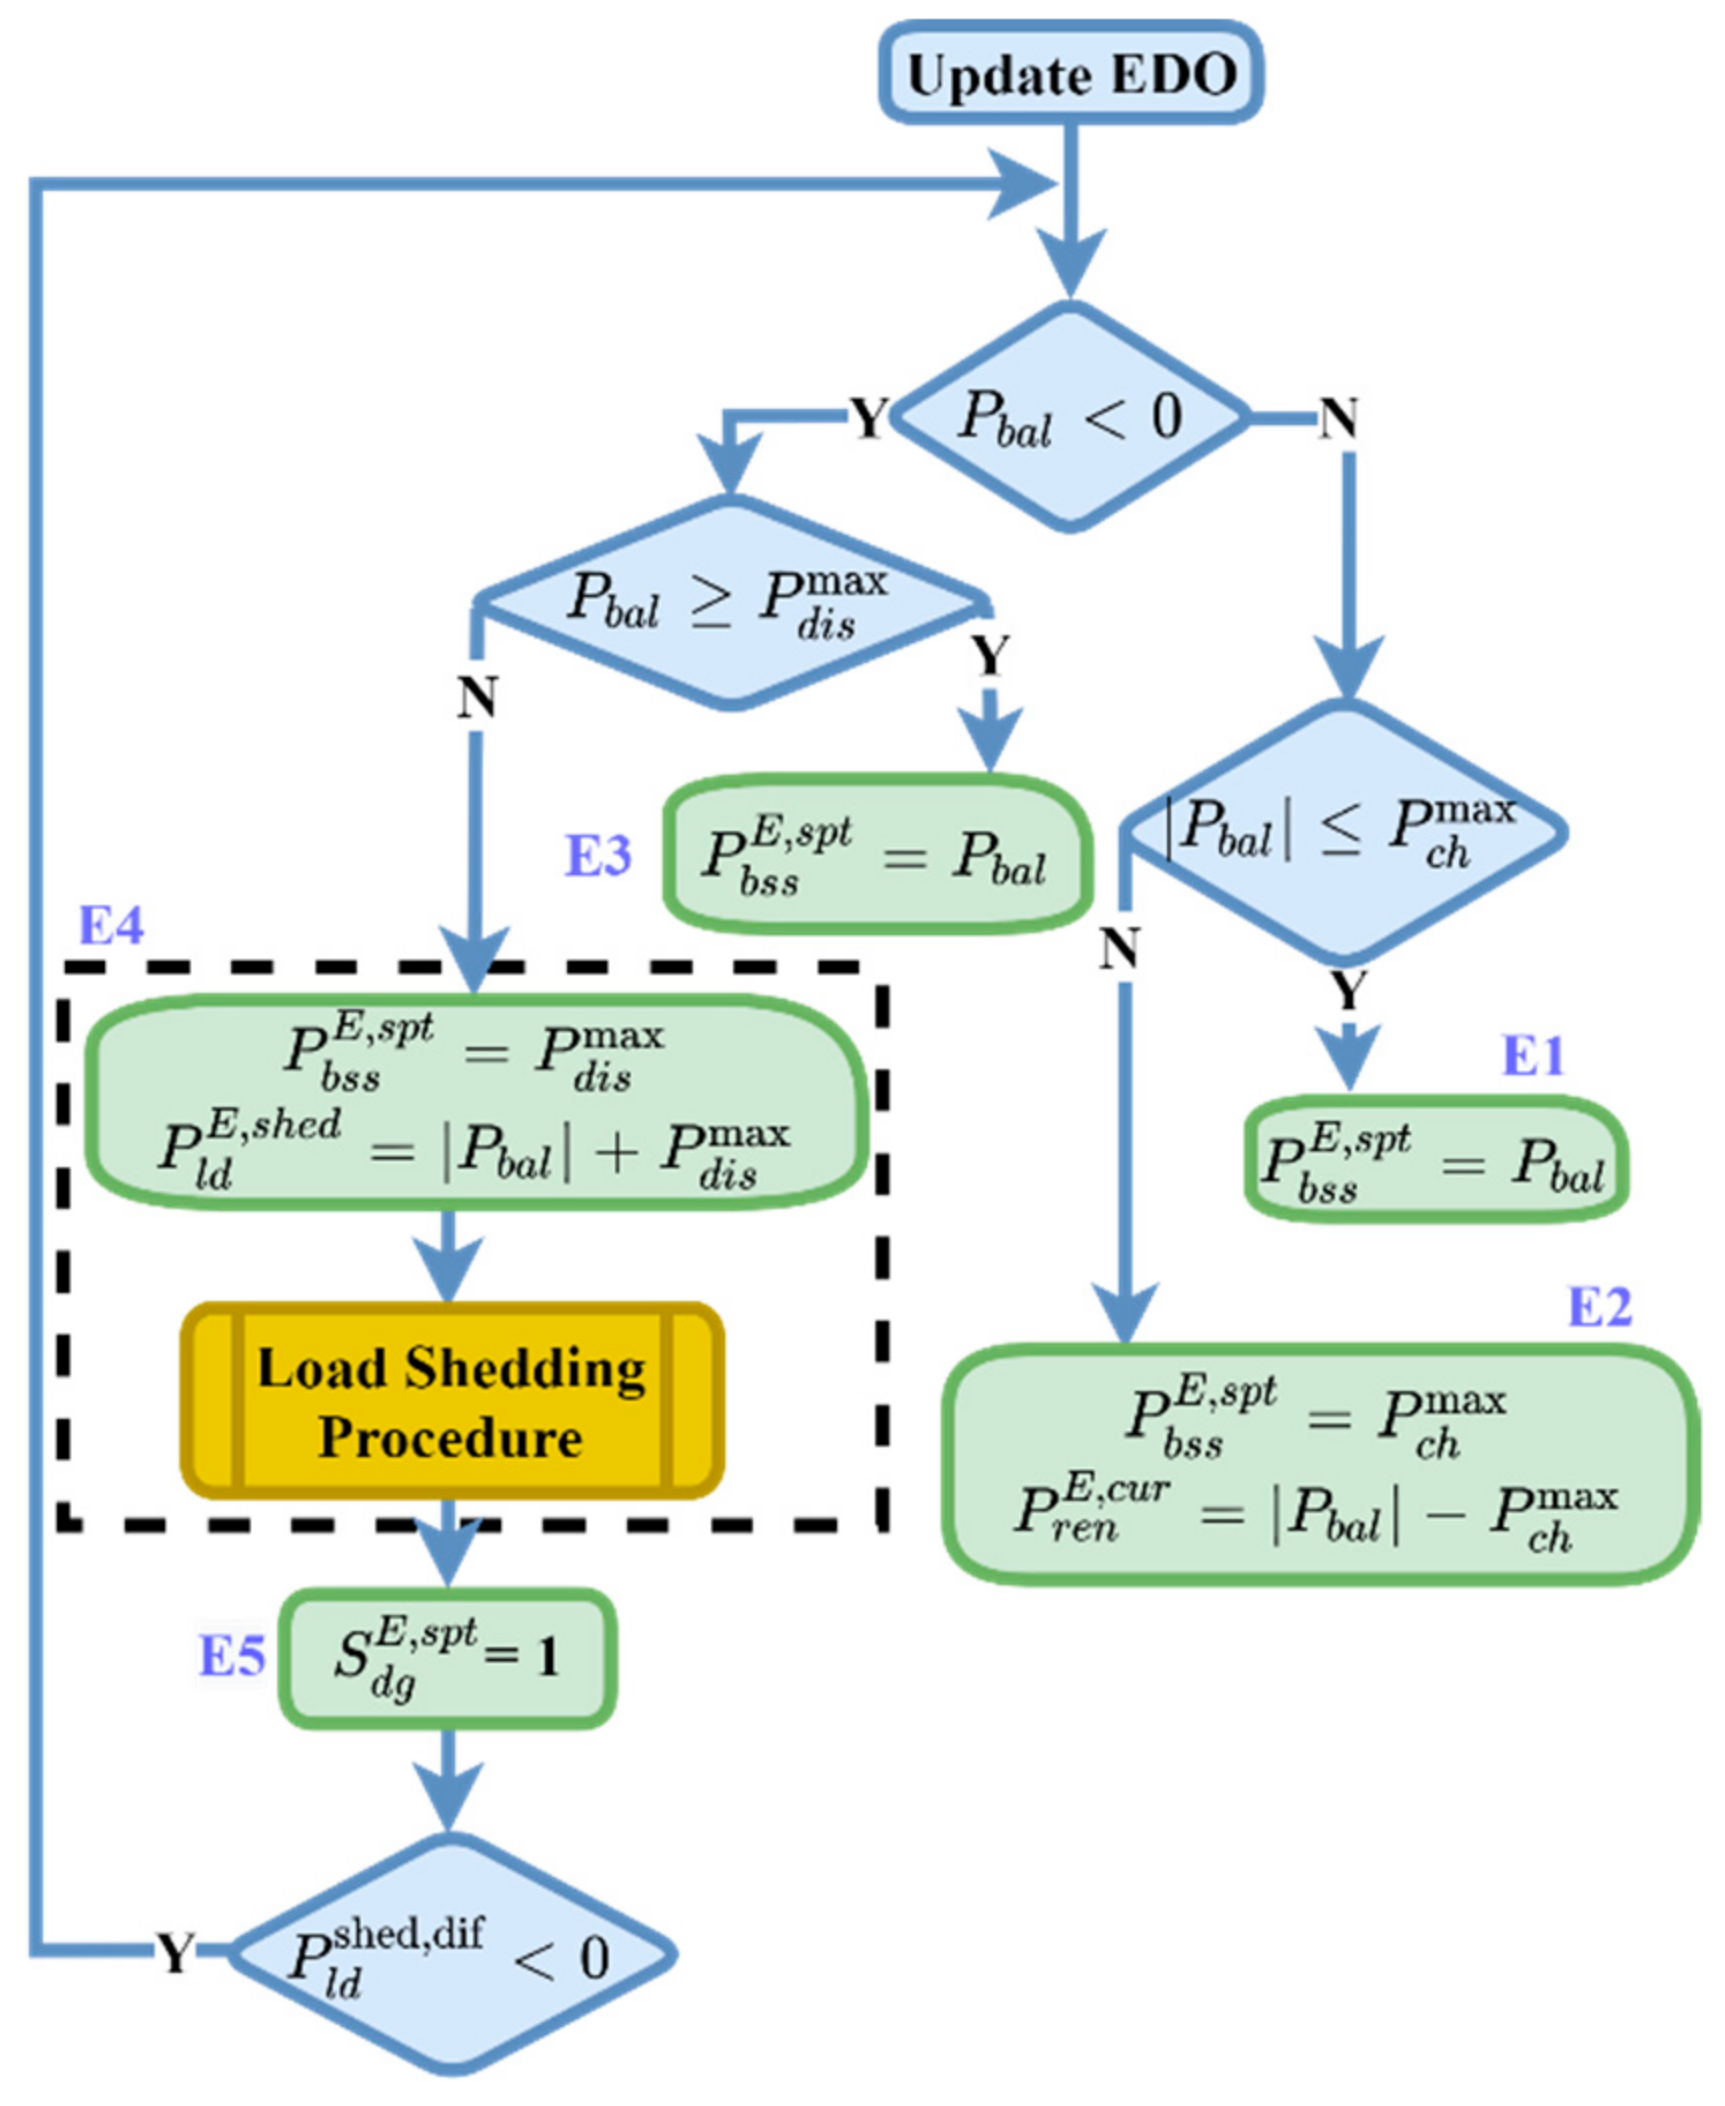
3.2.2. The Emergency Dispatch Order (EDO)
There is an exception for dispatching the MG assets. When the unplanned islanding event is detected, EDO will be executed directly by the transition function. Unplanned islanding, unlike planned islanding, makes it impossible to alter the DER controller set point or operating point in real-time. Because of the low inertia of power electronic converters, the voltage and current output of DER may experience substantial deviations in this circumstance. Therefore, this order is continuously updated as conditions change, and MG status is updated and is available for execution without waiting to be computed. The calculation process of this rule is shown in
Figure 12. DG is off during SS1, and grid forming will be performed via BSS during SS2. Therefore, depending on the MG status, DG is turned on via EDO (E5). The presence of DG is not counted in load shedding (E4) because of the limited response speed of diesel generators.
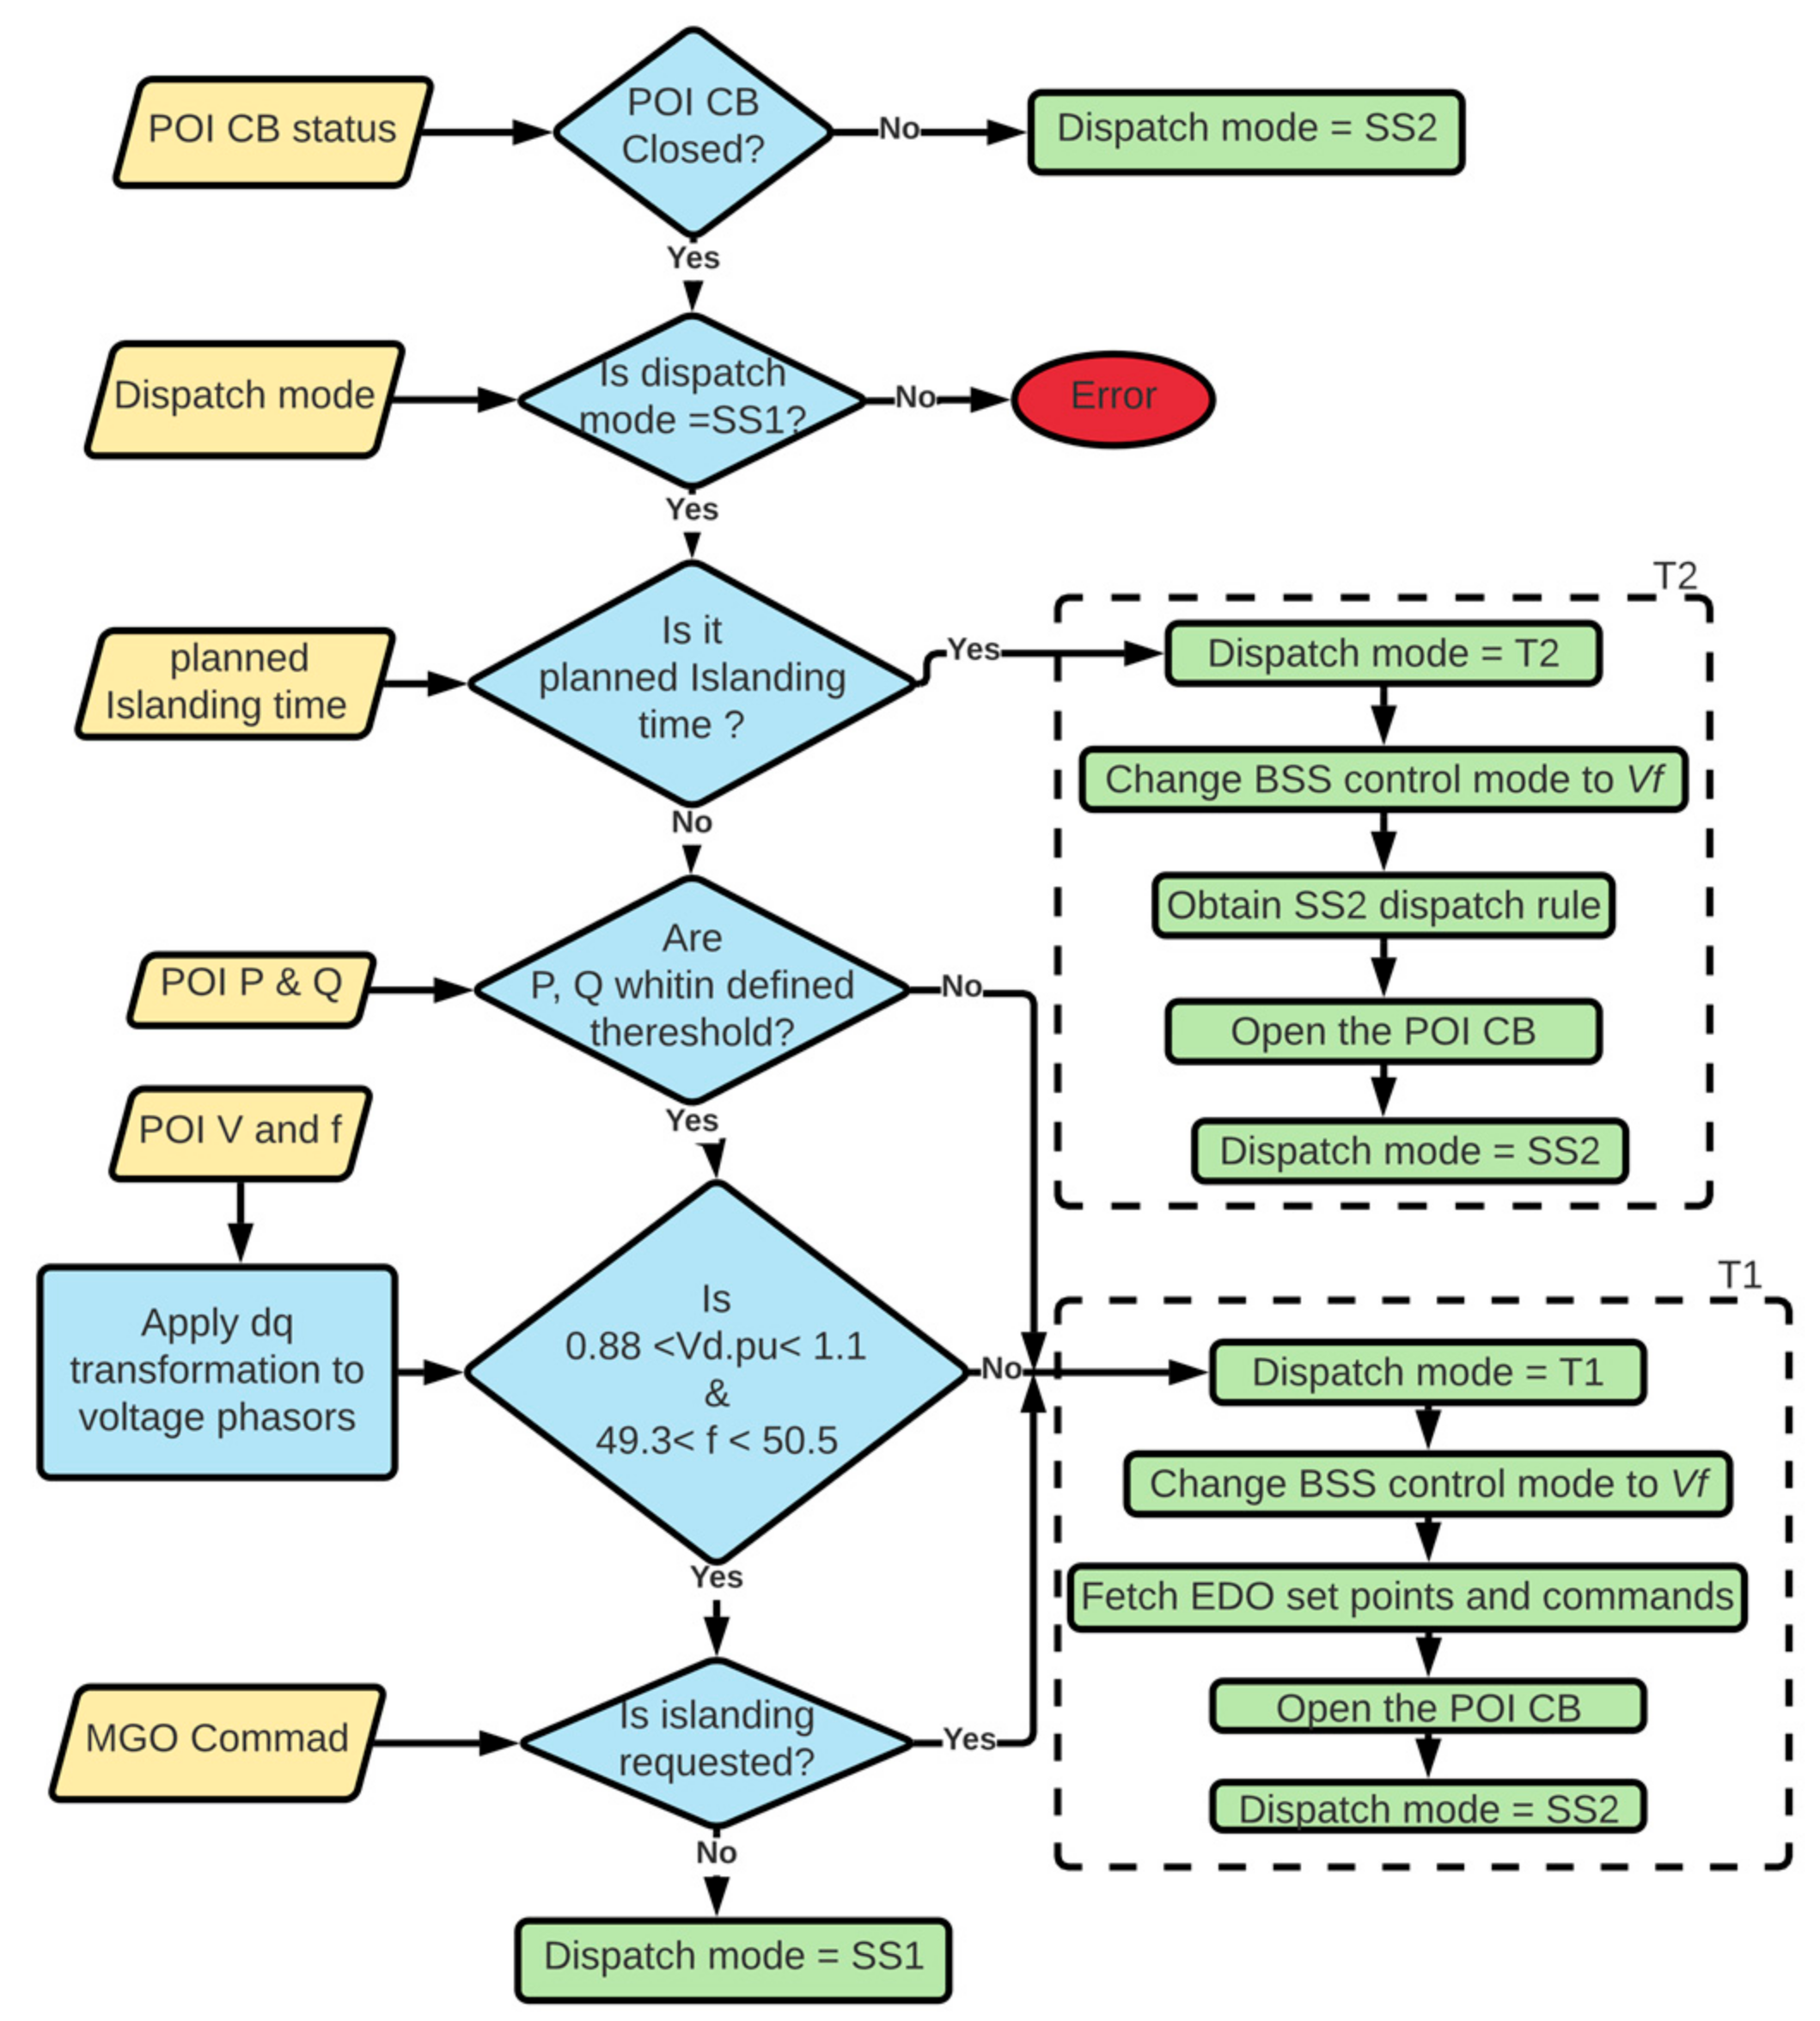
3.3. The Transition Function
The transition function contains the logic for shifting the dispatch function between one of the essential dispatch modes to prevent or to delay a disconnection in a way that violates the interconnection requirement. In the recent approach, the transition function consists of planned and unplanned islanding transitions. The determined dispatch mode is fed to the dispatch function, and the dispatch function applies the dispatch based on this. However, during T1 and T2, the dispatch orders are executed by the transition function, and the dispatch mode returns to SS1 or SS2. In both T1 and T1, the POI CB will be opened, and BSS control will be shifted to
Vf control mode by the transition function. The flowchart corresponding to this function is presented in
Figure 13.
The first step in this procedure is to check the status of POI’s CB. The planned islanding transition requirement is then assessed. This process began to be obtained
seconds before the planned time.
is an adjustable variable depending on the response speed of the MG’s assets. As the planned event is detected, the transition function will determine the assets’ setpoints based on SS2 dispatch rules, and algorithms are given in
Figure 7b and
Figure 8. In this manner, the exchanged power at POI will be set at zero by implementing essential load shedding or renewable curtailment. Then dispatch mode will switch to SS2.
The MG remains connected to the grid if required criteria by DSO or MGO are satisfied [
21]; otherwise, MG will be islanded. In this approach, unplanned islanding is achieved by monitoring the total active power, frequency, and voltage at the POI. However, instead of three-phase voltage,
[
29,
30] should be within the specified interval.
is calculated based on Equation (17), where
, and
are phase voltages and MG nominal frequency, respectively. In addition, unplanned islanding events could be initiated by an external or internal command from DSO or MGO. If any of the mentioned conditions are satisfied, an unplanned islanding event will take place. In this regard, the calculated EDO will be executed by the transition function immediately, then the rest of the required actions stated will be performed.
4. Test Results
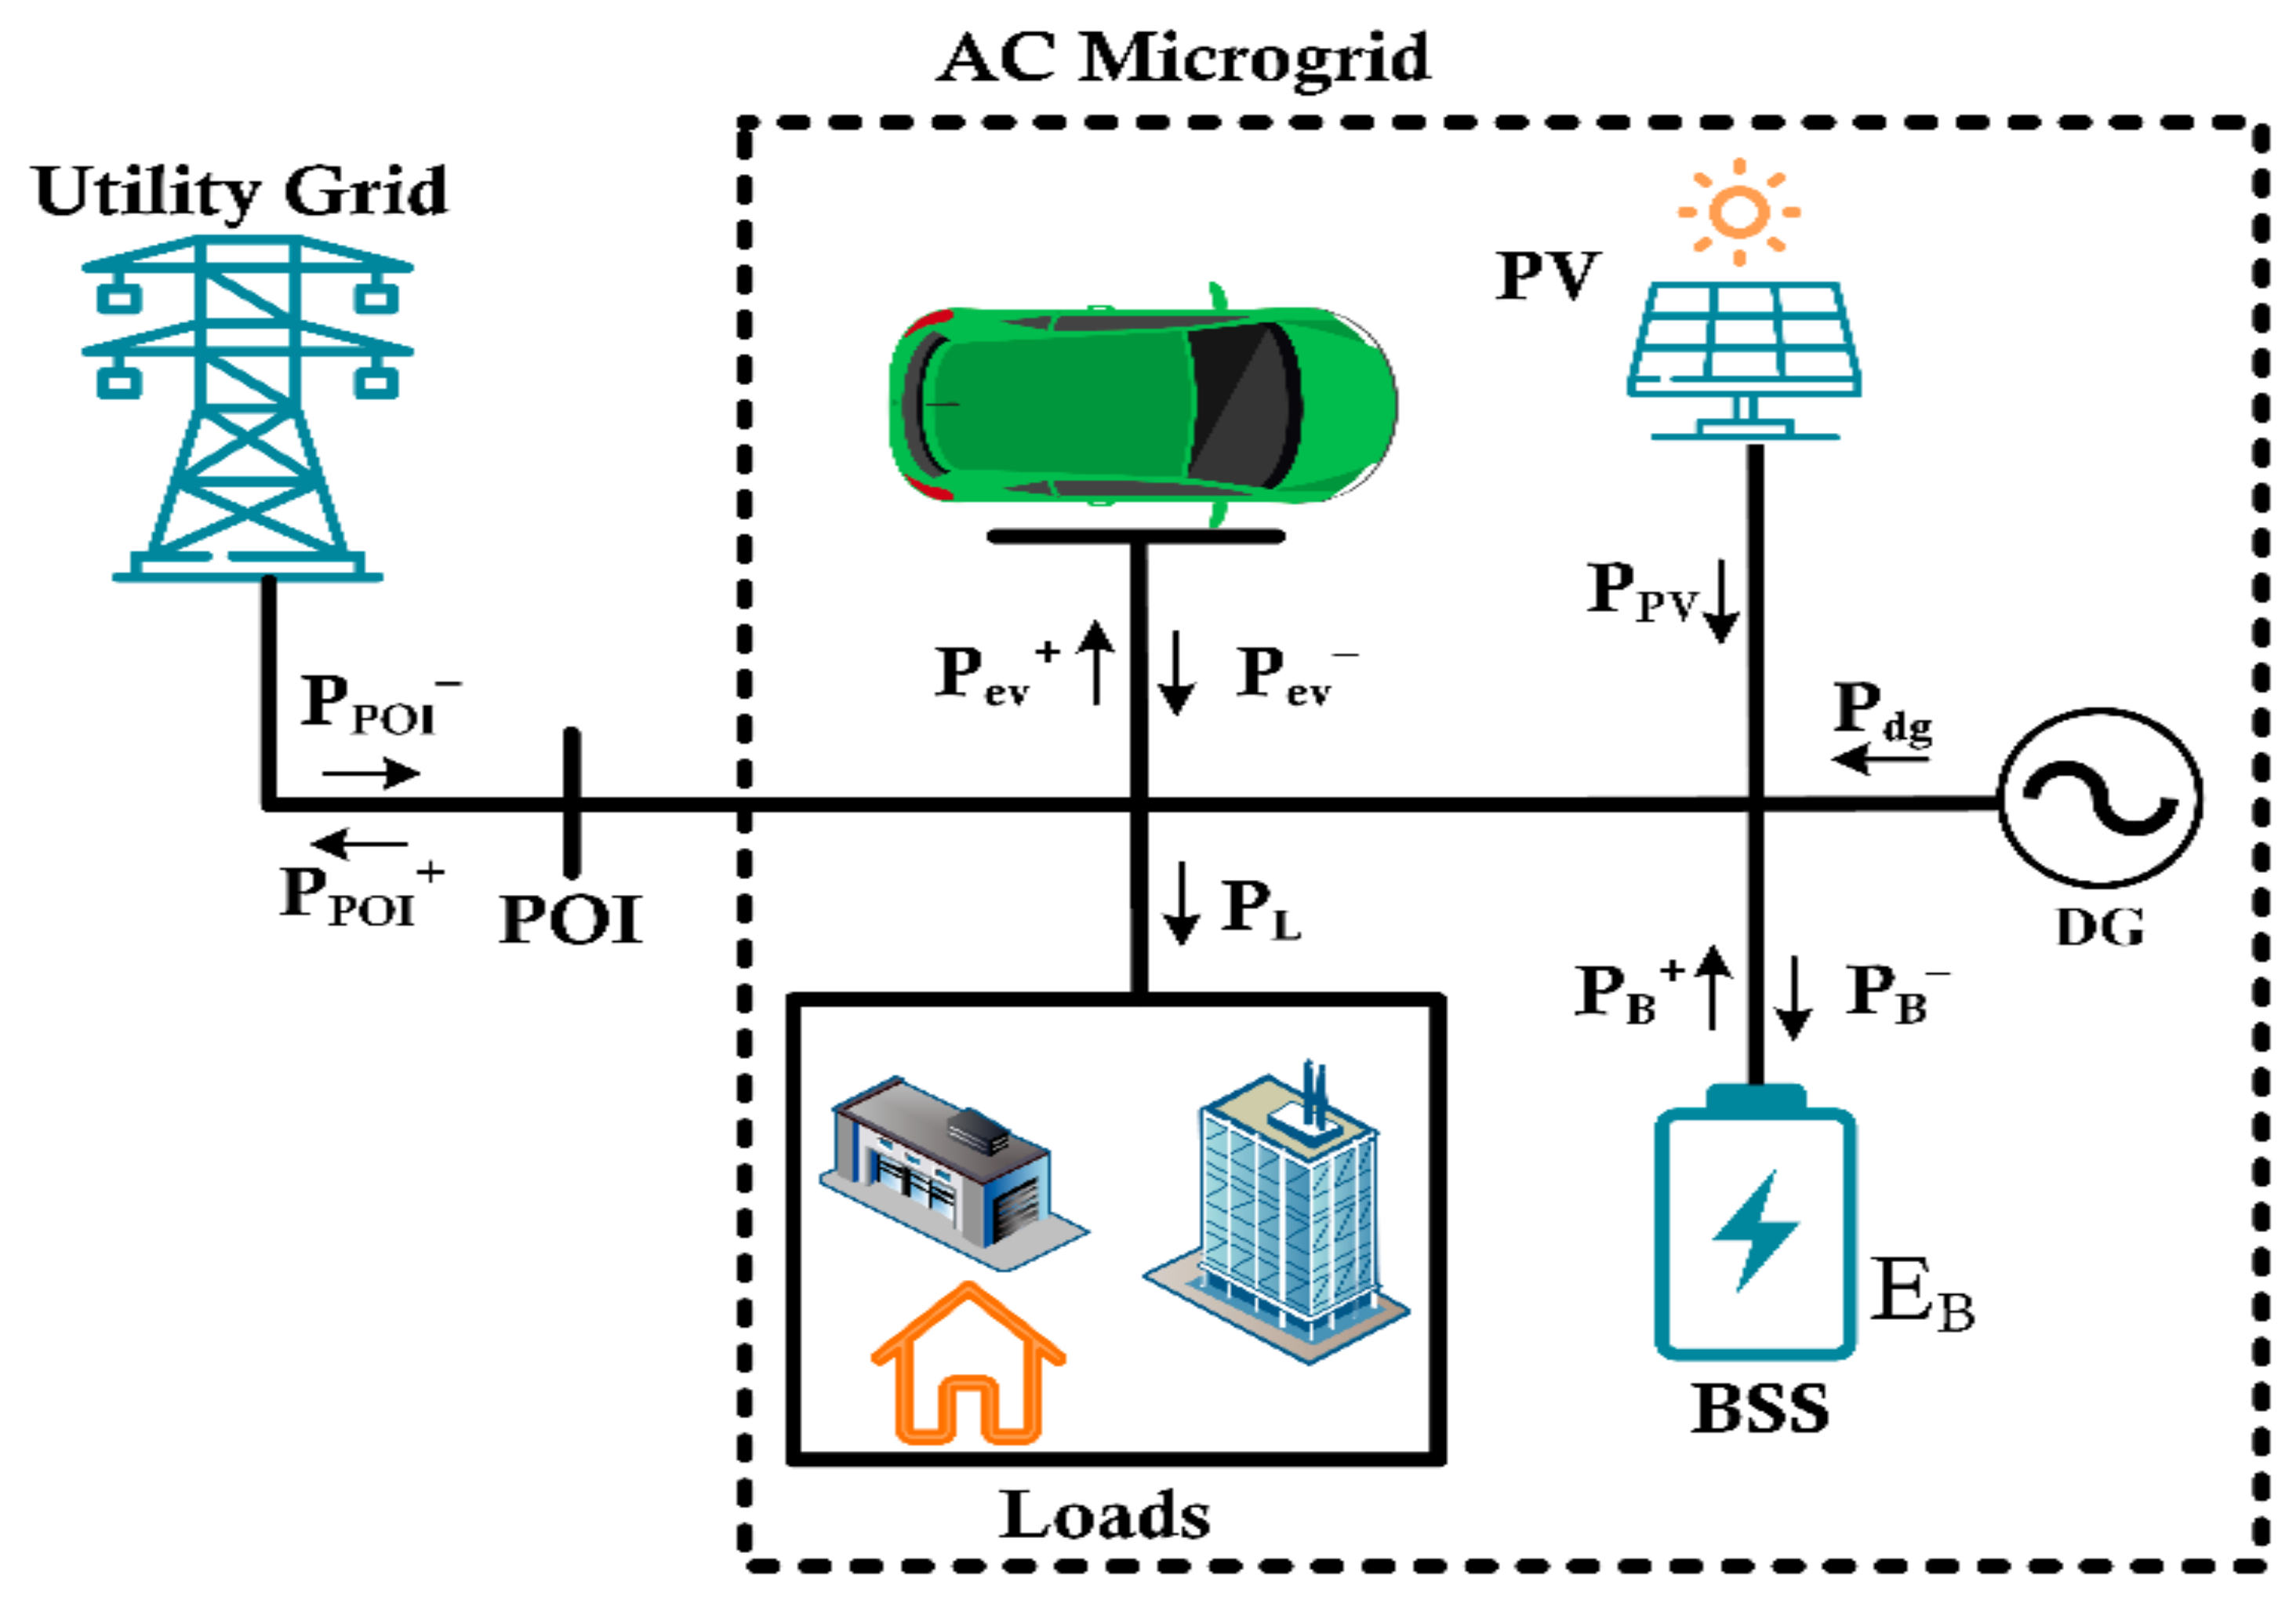
In this section, the test results are presented. The considered system is presented in
Figure 2, in which the positive directions of power flows are illustrated. Noncritical loads consist of both continuously and discretely controllable ones. The tests are based on the actual setup at the Middle East Technical University. The parameters related to the considered system are presented in
Table 4.
The primary purpose of forming cases is to cover all dispatch rules in both dispatch modes in various conditions. The IEEE 2030.8 standard [
22] specifies tests to test the pertinent operation of the dispatch function. In this regard, three test cases are formed, and details related to the assets for each case are given in
Table 5.
Case-a: This case is prepared to investigate the advantage of keeping the BSS around 50%. For this purpose, a dispatch rule regardless of BSS’s SOC is utilized in which the determined BSS power can be any value greater and lower than
and
respectively. The related flowchart of this rule is illustrated in
Figure 14. The same system is considered for both methods, and the results are compared. The time step related to this test and the dispatch function is 5 min.
Case-b: In this case, the proposed dispatch function is compared with the dispatch functions presented by Sun et al. in [
25], in which DG is only turned OFF by initiation of the force-discharging rule, regardless of MG status. The main objective is to show how proper control of the DG can affect the controller’s performance during SS2. The initiation SOC is 55%, making both dispatch functions obtain the power-smoothing dispatch rule.
Case-c: In this case, the performance of the dispatch function in normal conditions during SS1 mode is tested. For this purpose, tests cover two sequential days to observe the control mode switching properly. The time step related to this test and the dispatch function is 5 min. The variance of load and renewable generation in the collected dataset is low from sunset to sunrise. Therefore, all tests started at 5 AM. In addition, the initial required was set to −100 kW.
Case-d: In this case, the consequent performance of the dispatch function to the start and stop of the largest load will be assessed. The duration of the test is 6 h, and MG is in islanded mode. The time step related to this test and the dispatch function is 1 min.
Case-e: This case is performed to observe the proper reaction of dispatch function to temporary loss of the PV system during SS2. The duration of the test is 6 h. The time step related to this test and the dispatch function is 1 min.
Case-f: In this case, DG is not connected to the system, where upper and lower boundaries of this are considered to be zero. The time step related to this test and the dispatch function is 5 min.
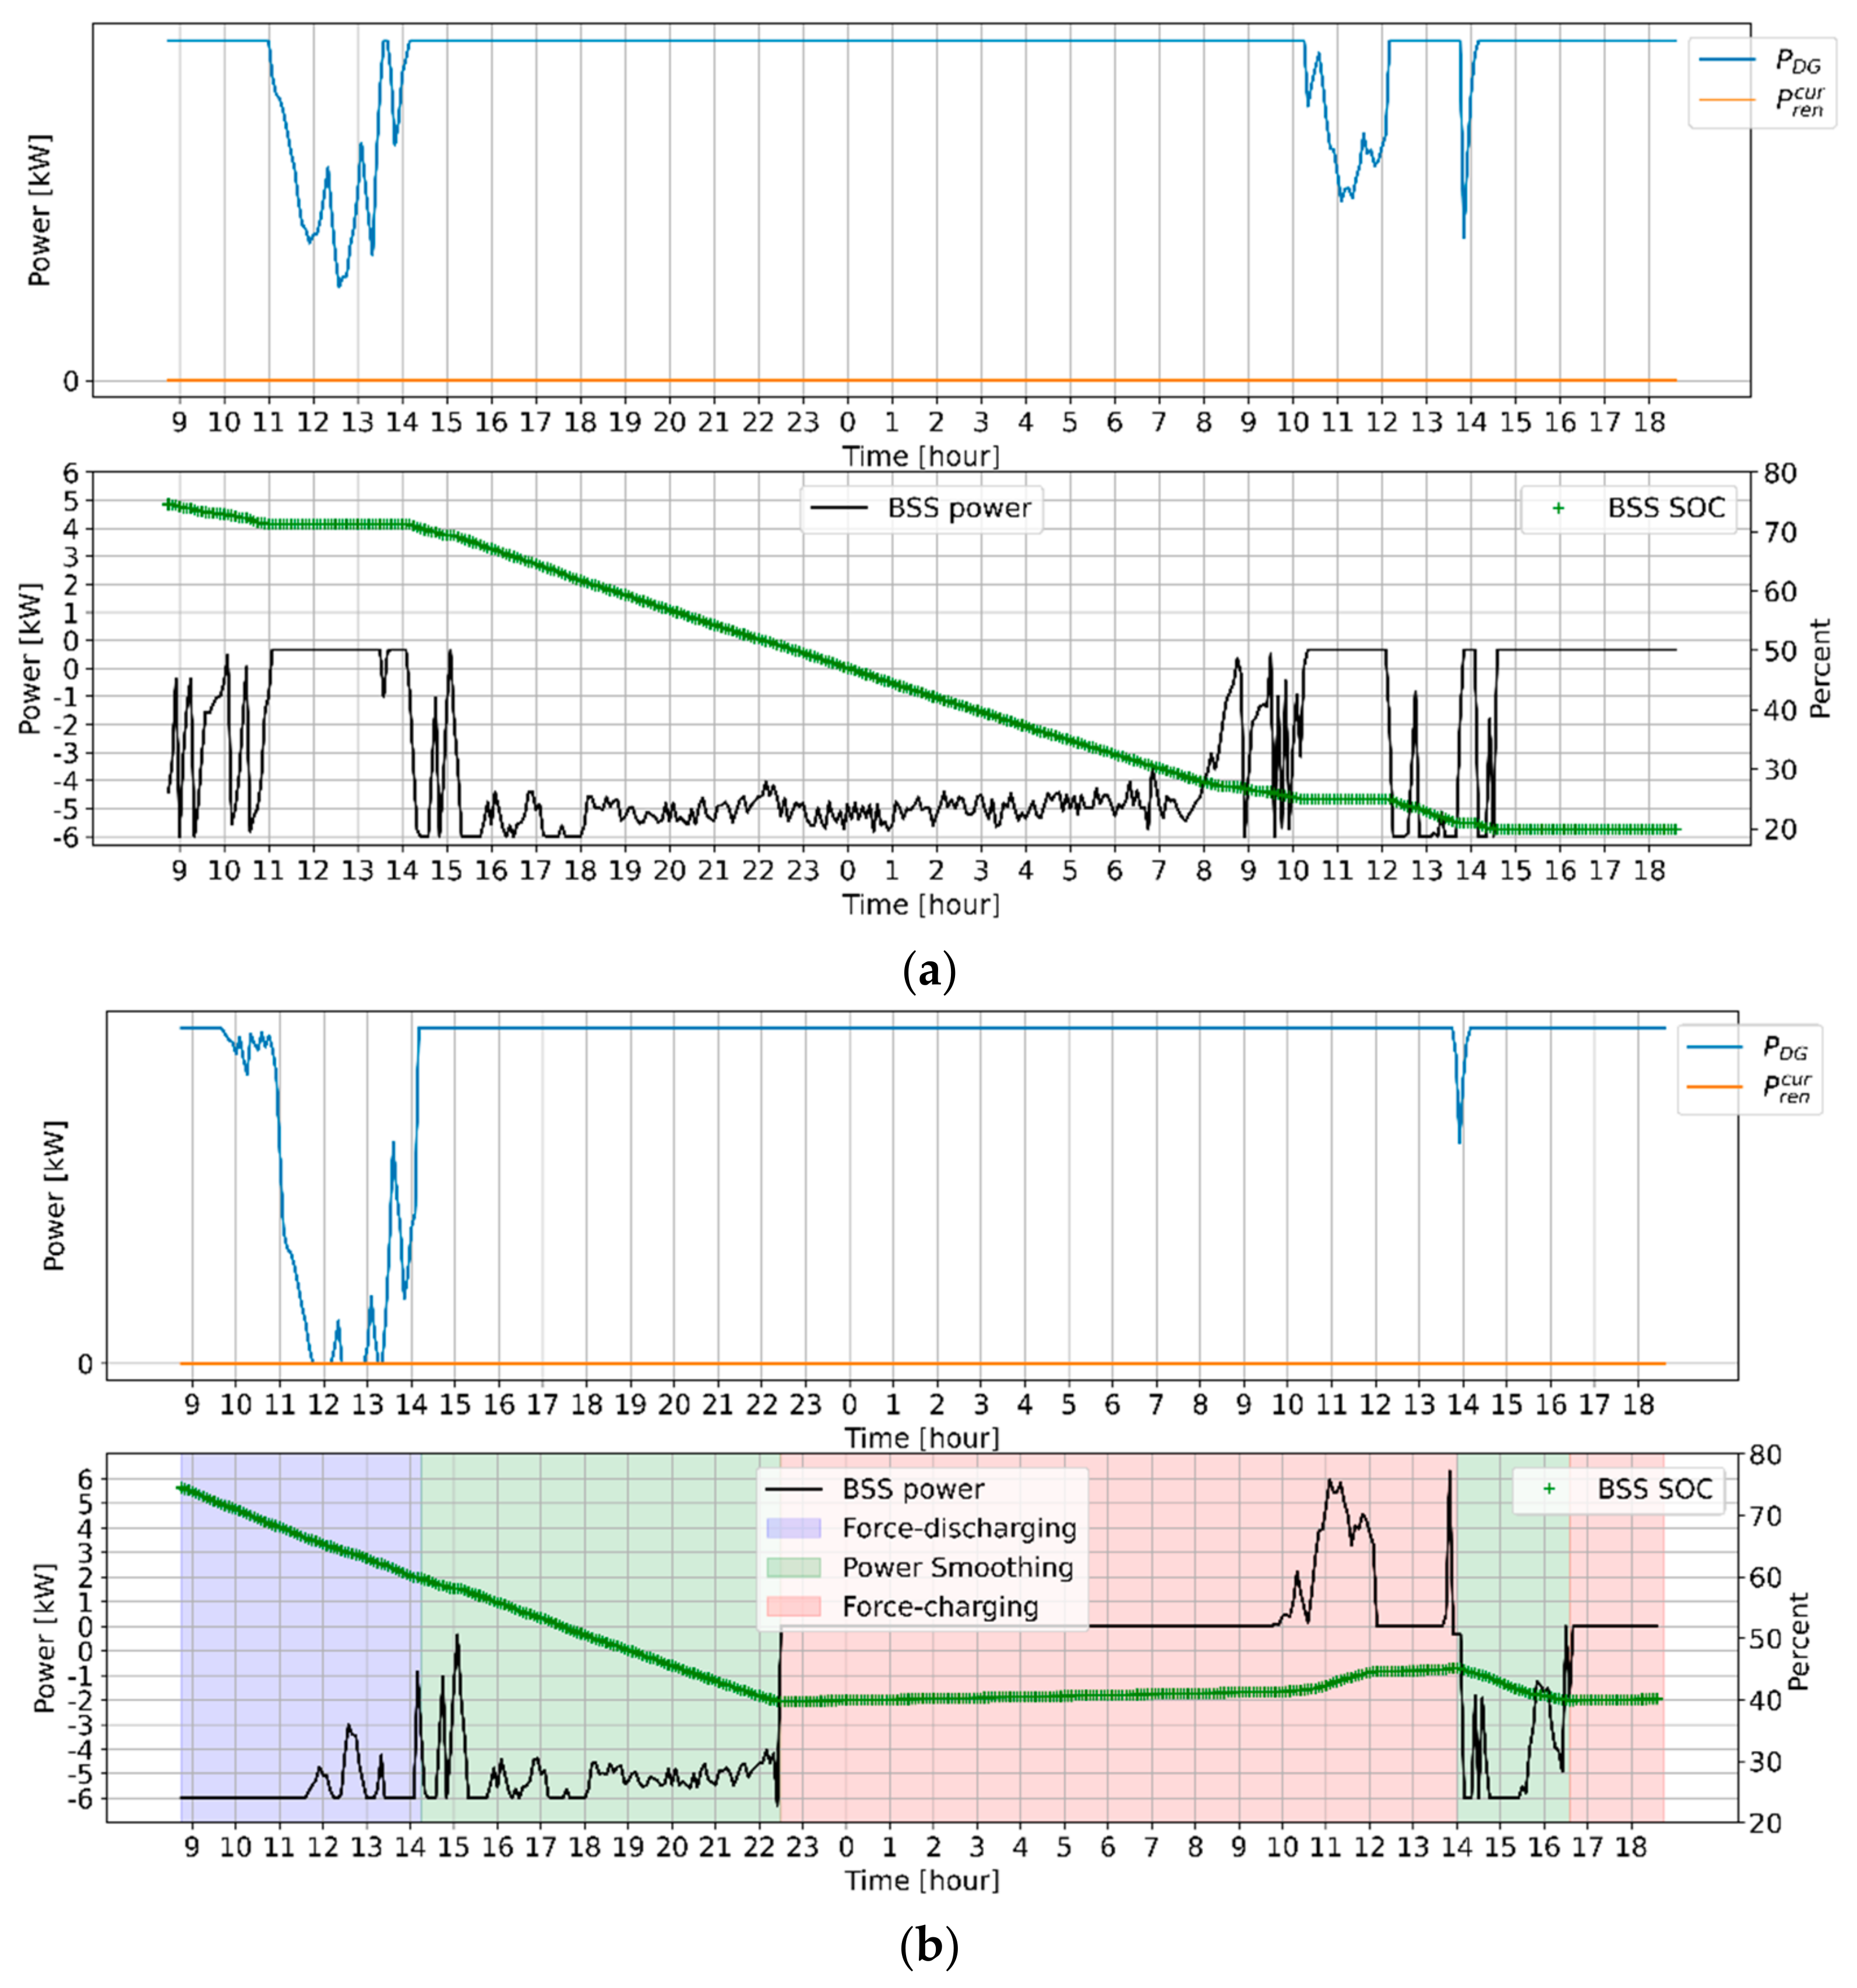
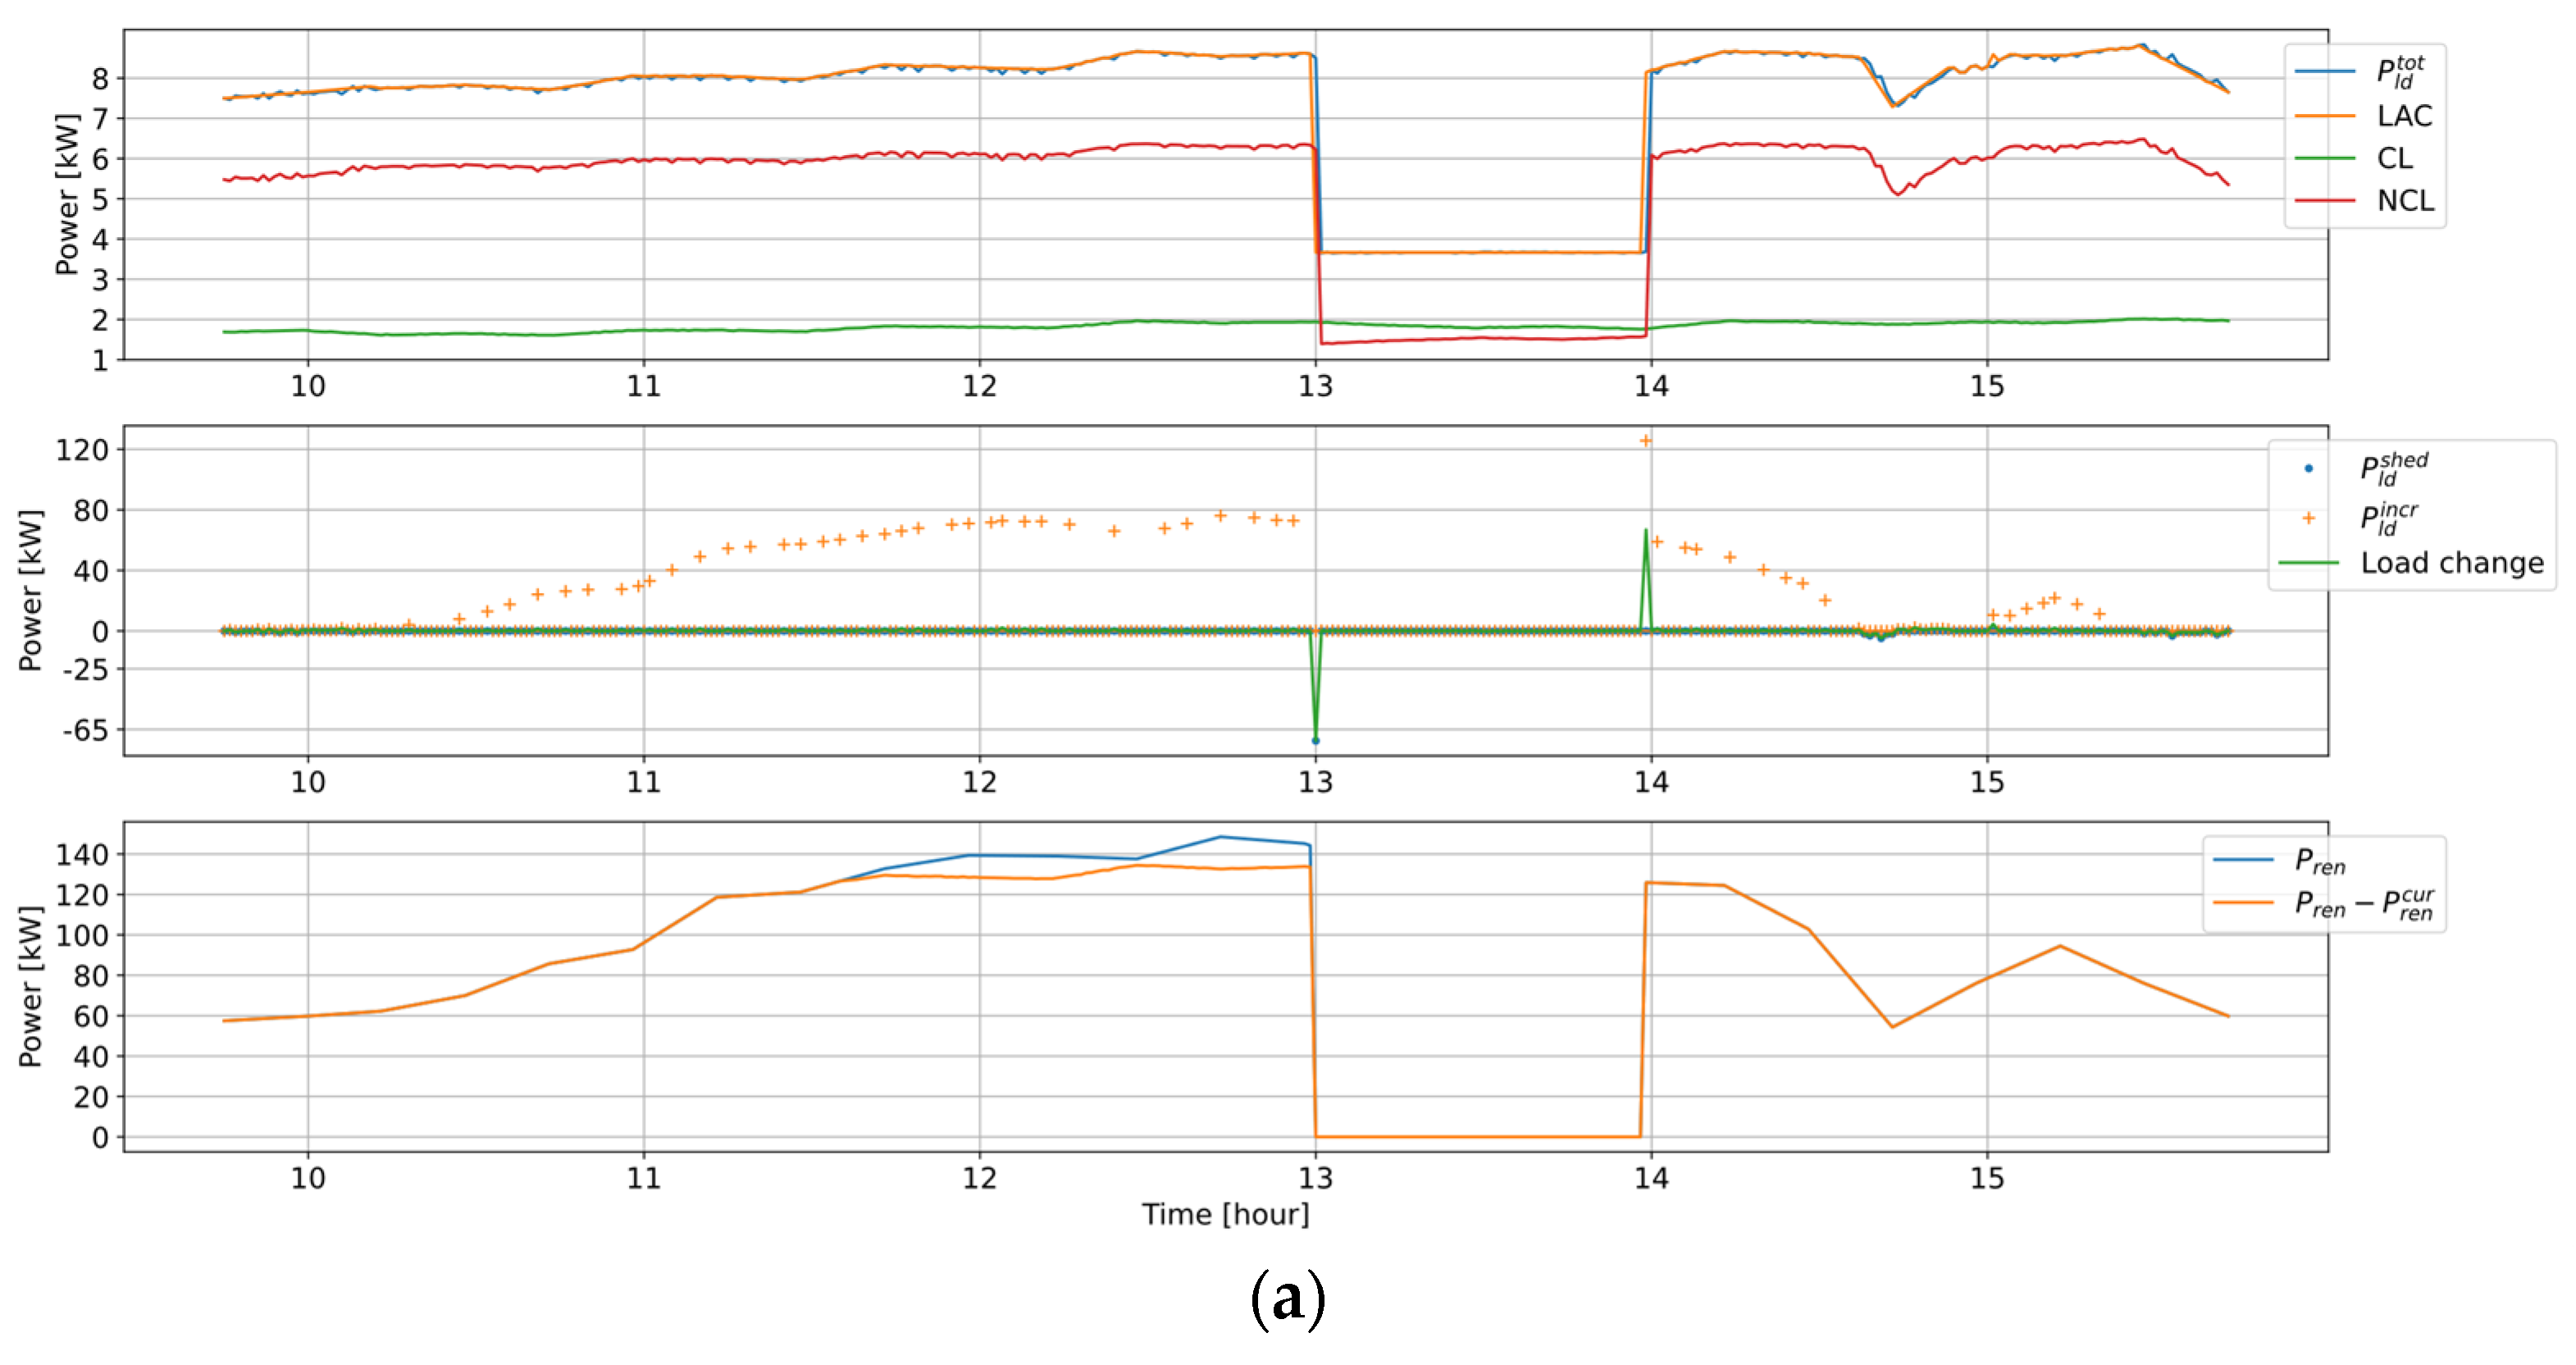
The test results for Case-a are shown in
Figure 15. According to
Figure 15a, when dispatch is fulfilled, regardless of SOC, the BSS SOC has decreased to the desired minimum value. Therefore, BSS is not able to inject any power to the MG, and support of the critical loads is completely dependent on the DG. This situation can cause an unreliable supply of the MG’s critical loads such that, in case of DG failure, those loads will be shedded. On the contrary, as can be seen in
Figure 15b, the proposed dispatch function maintains to SOC around 50% and avoids continuous discharge of BSS.
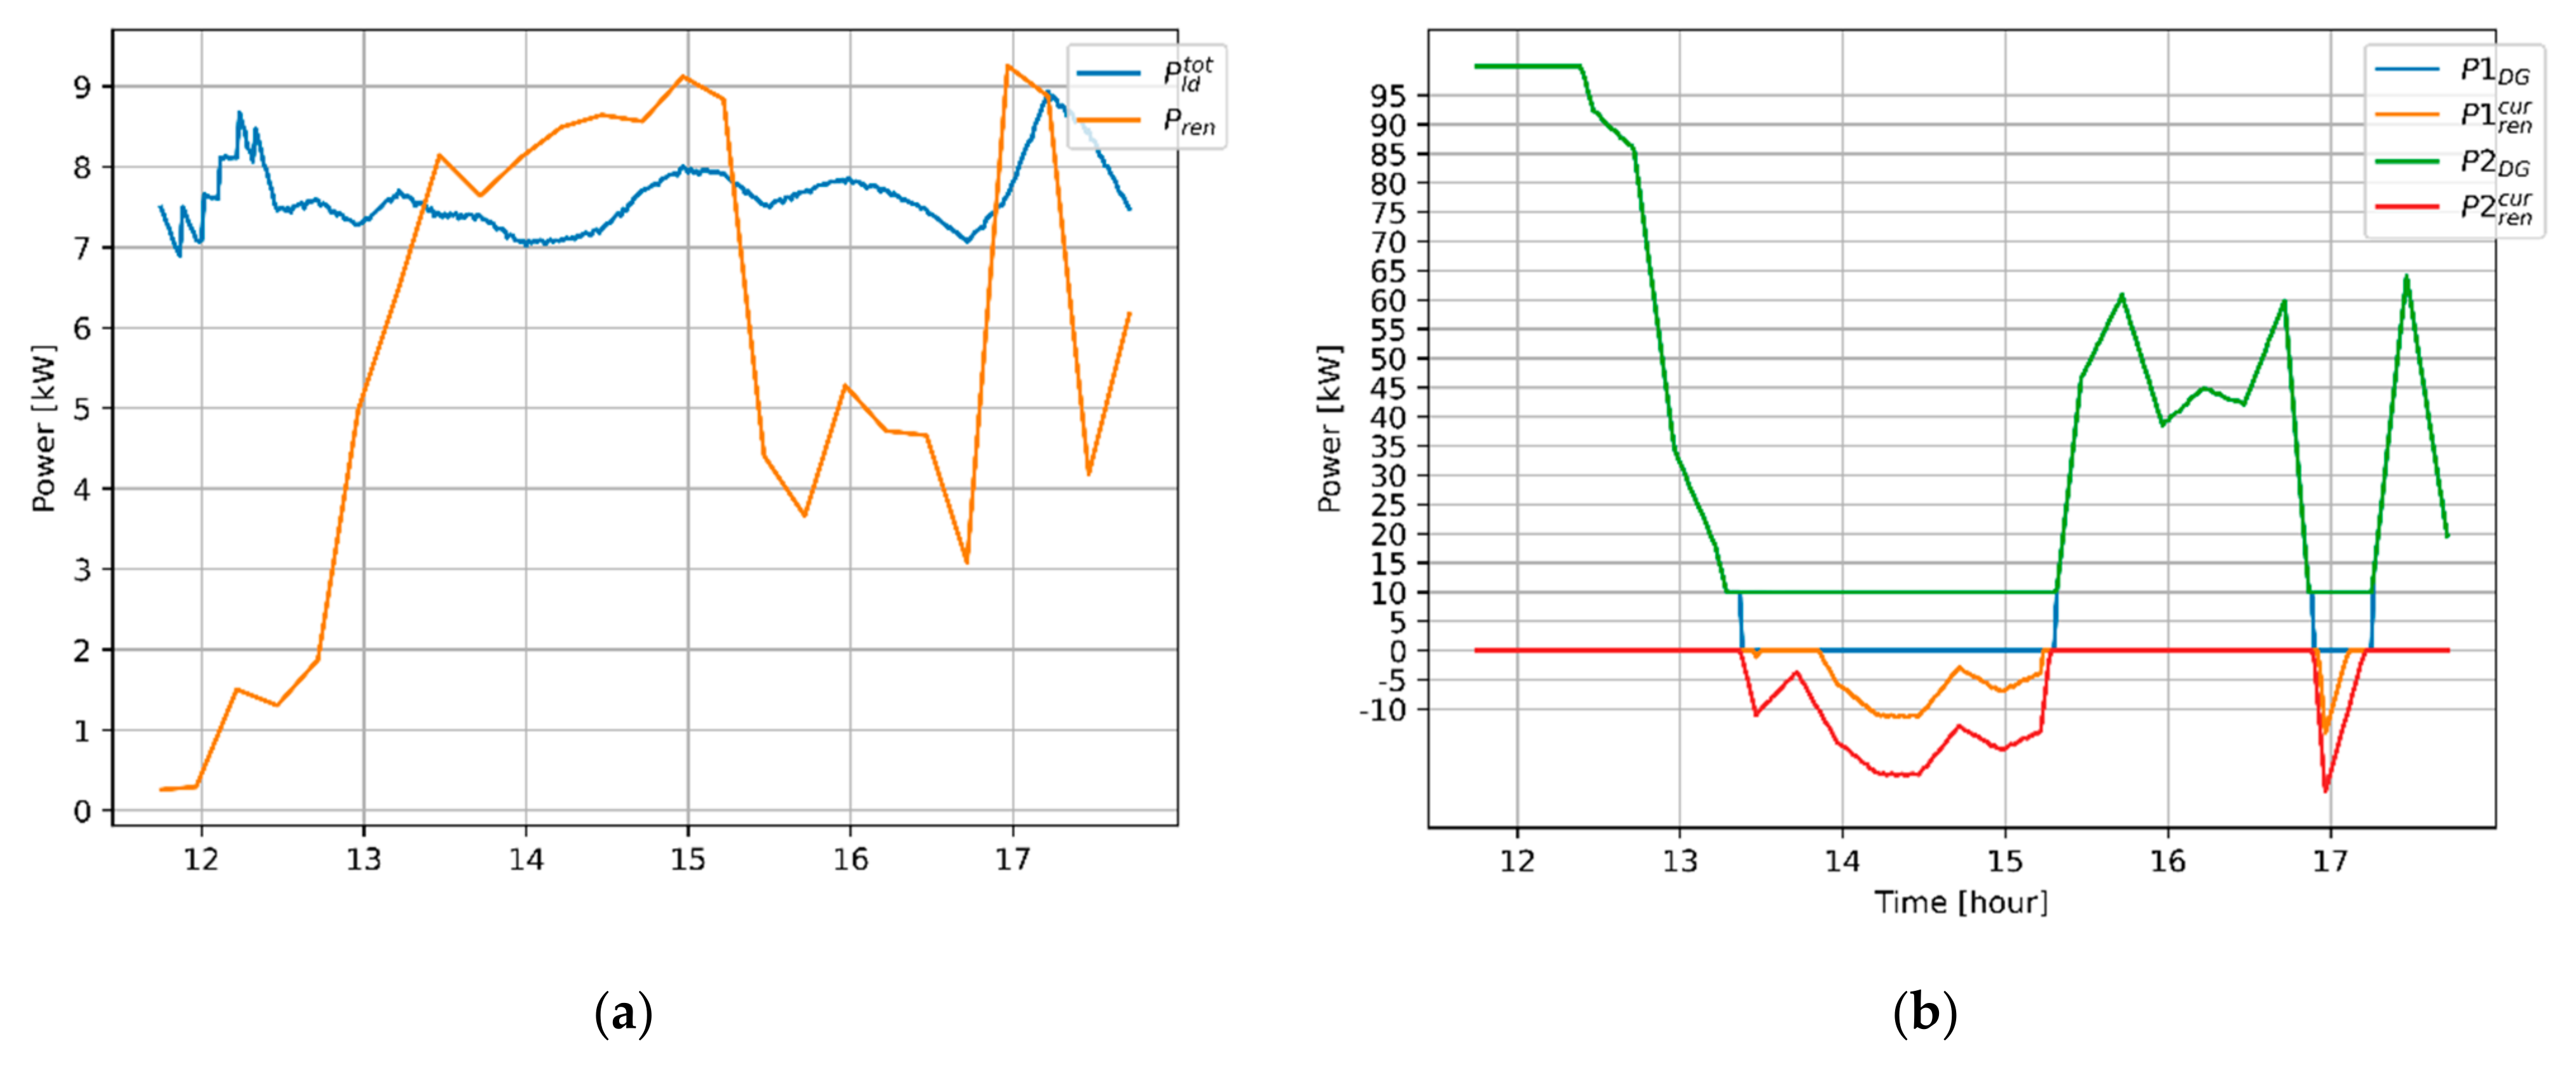
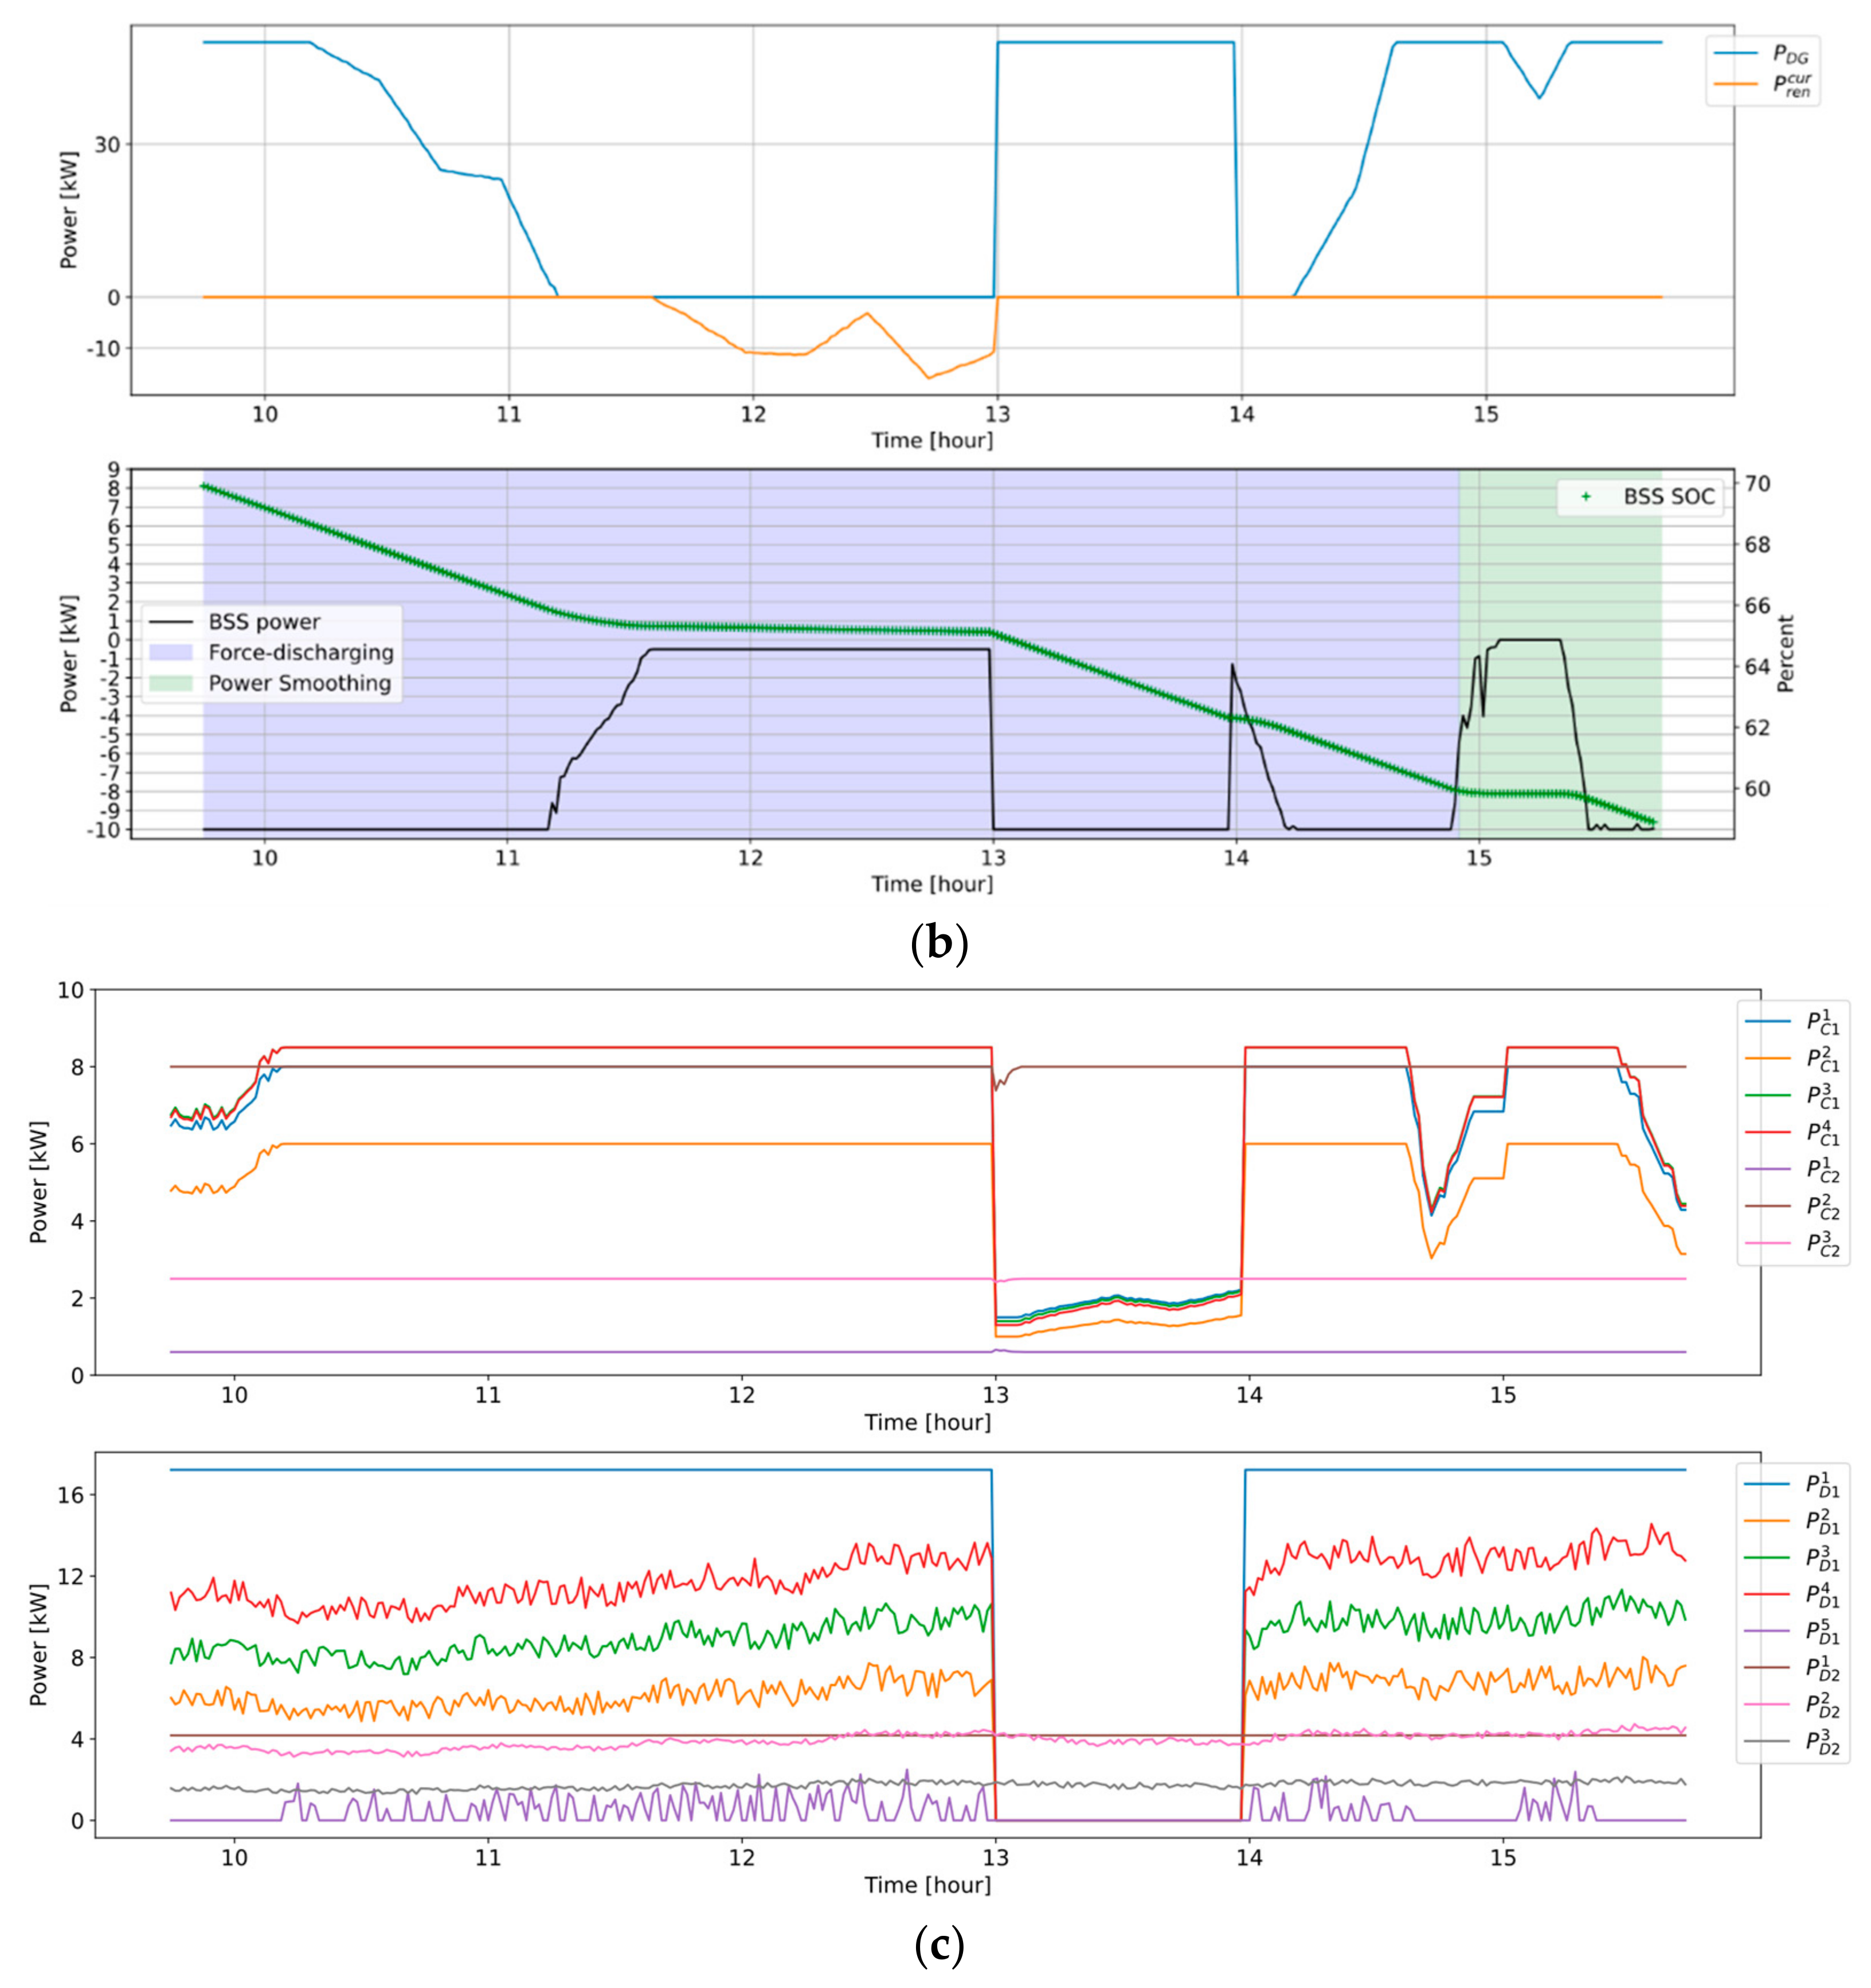
In Case-b, the performance comparison of the proposed dispatch function (Method 1) and the method of Sun et al. [
25] (Method 2) is illustrated in
Figure 16. In this Figure,
,
,
, and
are resultant DG powers of Method 1 and Method 2 and the resultant curtailed renewable power powers of Method 1 and Method 2, respectively. Based on
Figure 16a, the generation surpasses the load around 13 for two hours. Accordingly, renewable curtailment is required, and DG power is decreased in both methods. While
has been kept at 10 kW, as DG cannot be turned OFF,
became 0 as Method 1 has turned DG OFF. In this manner, curtailed renewable power was 10 kW less.
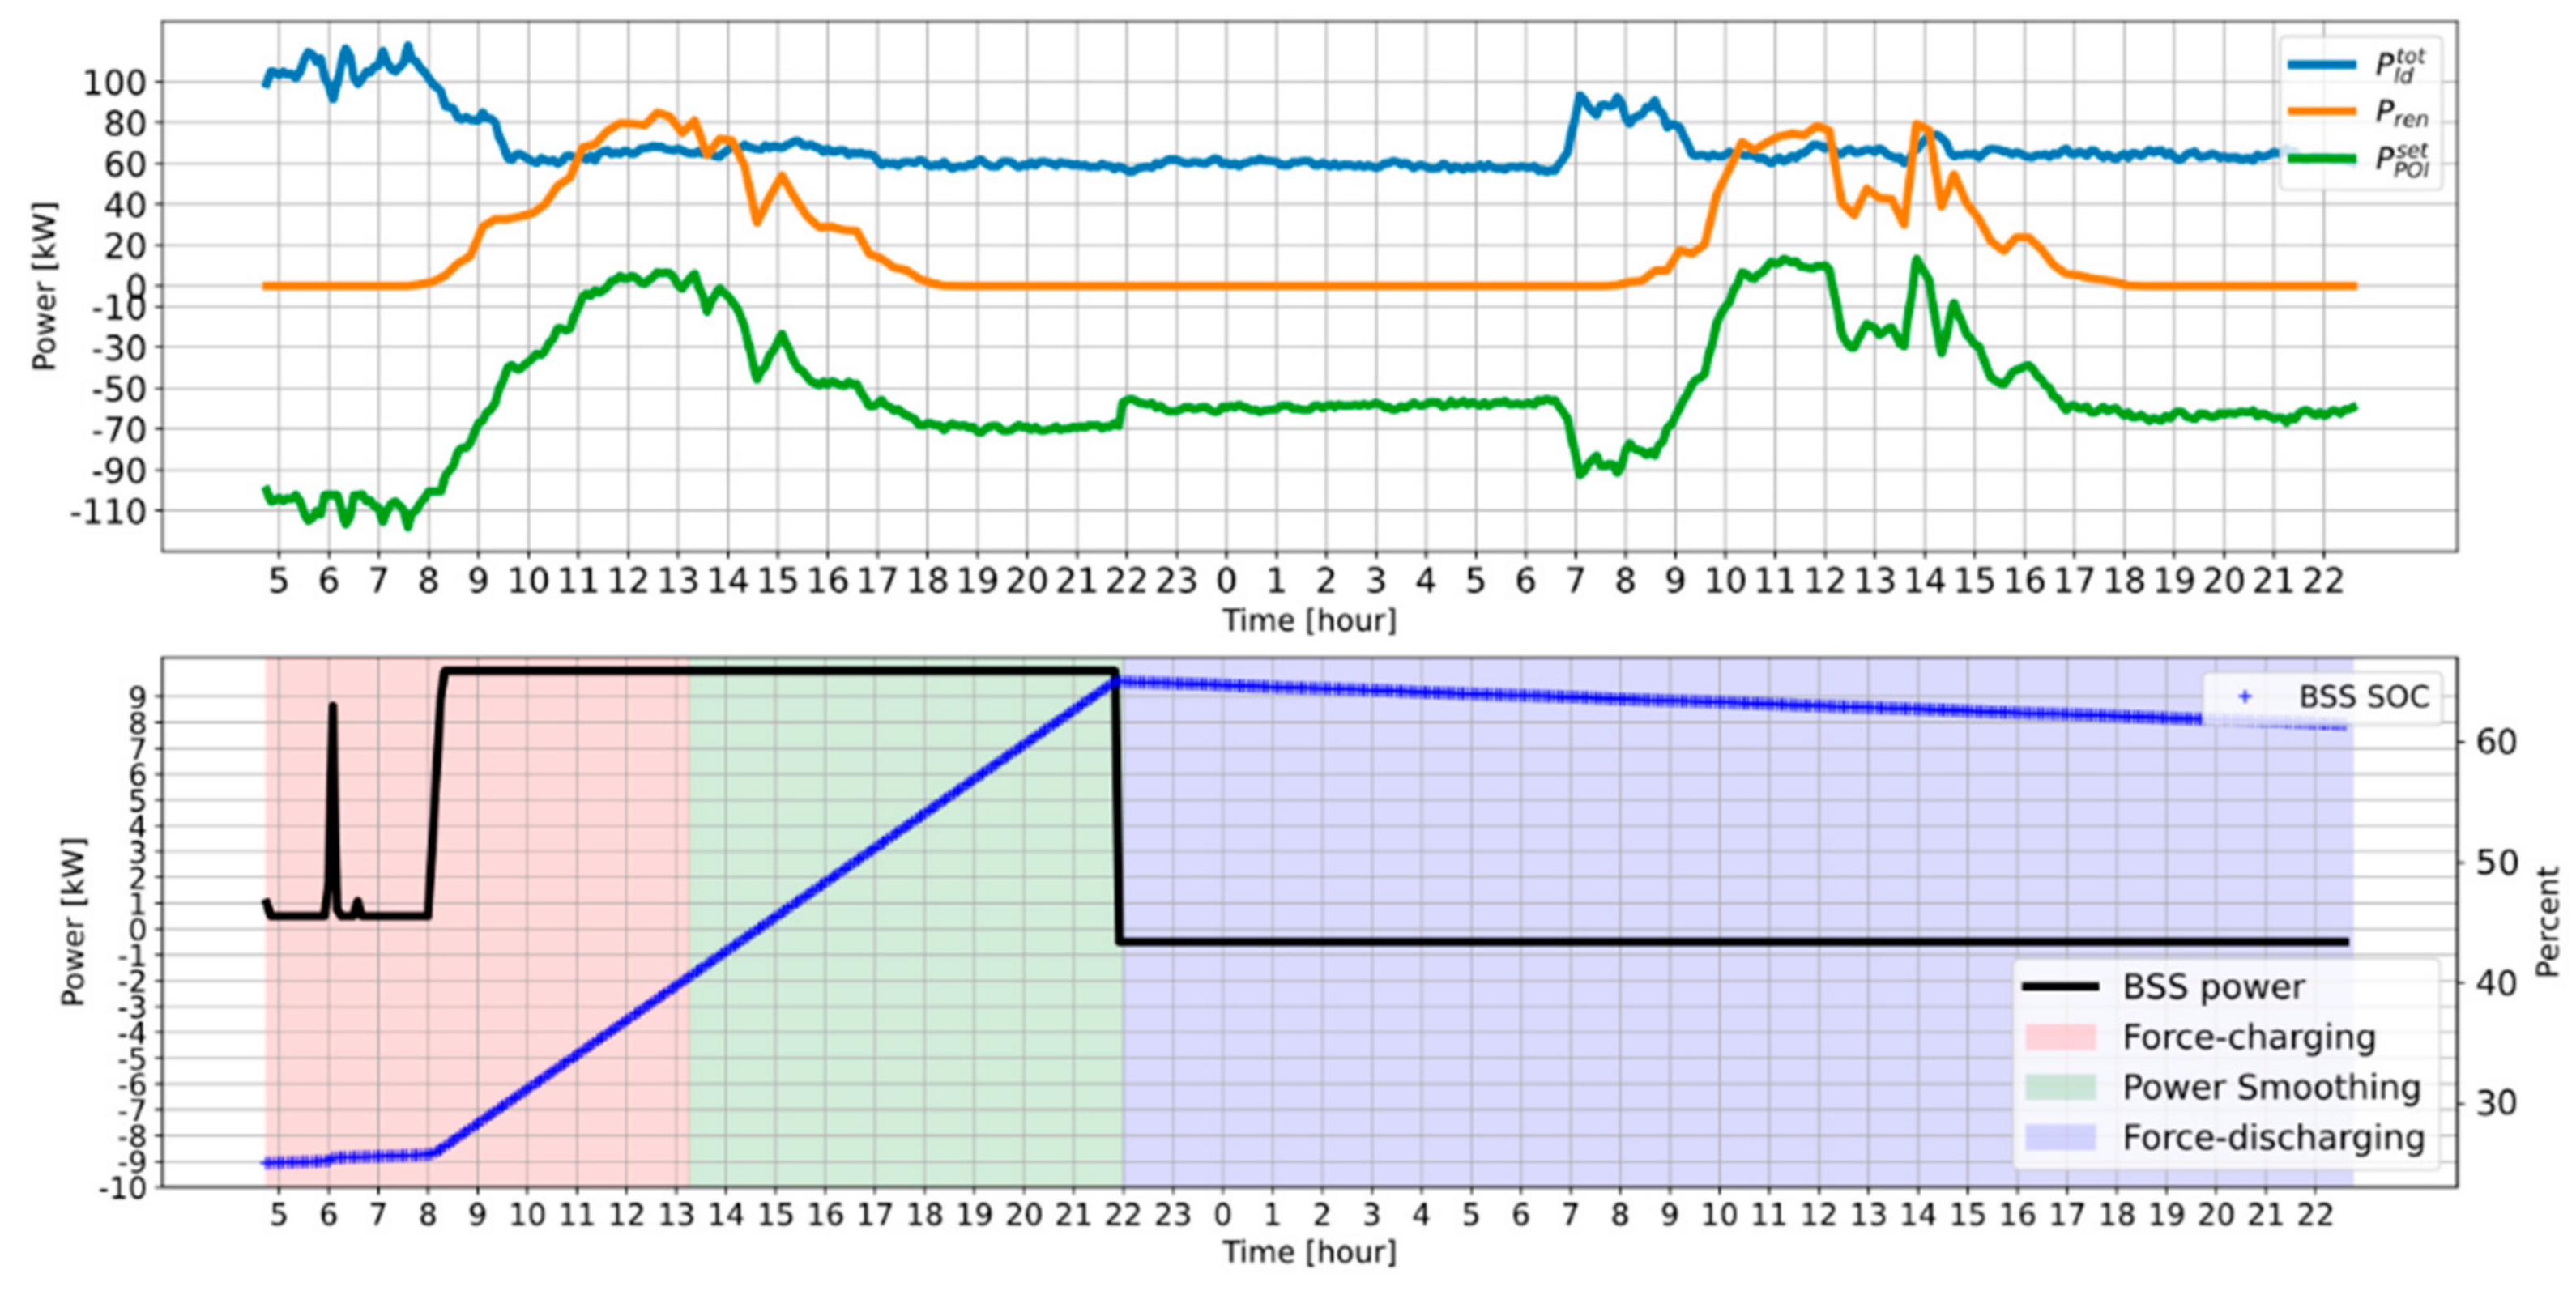
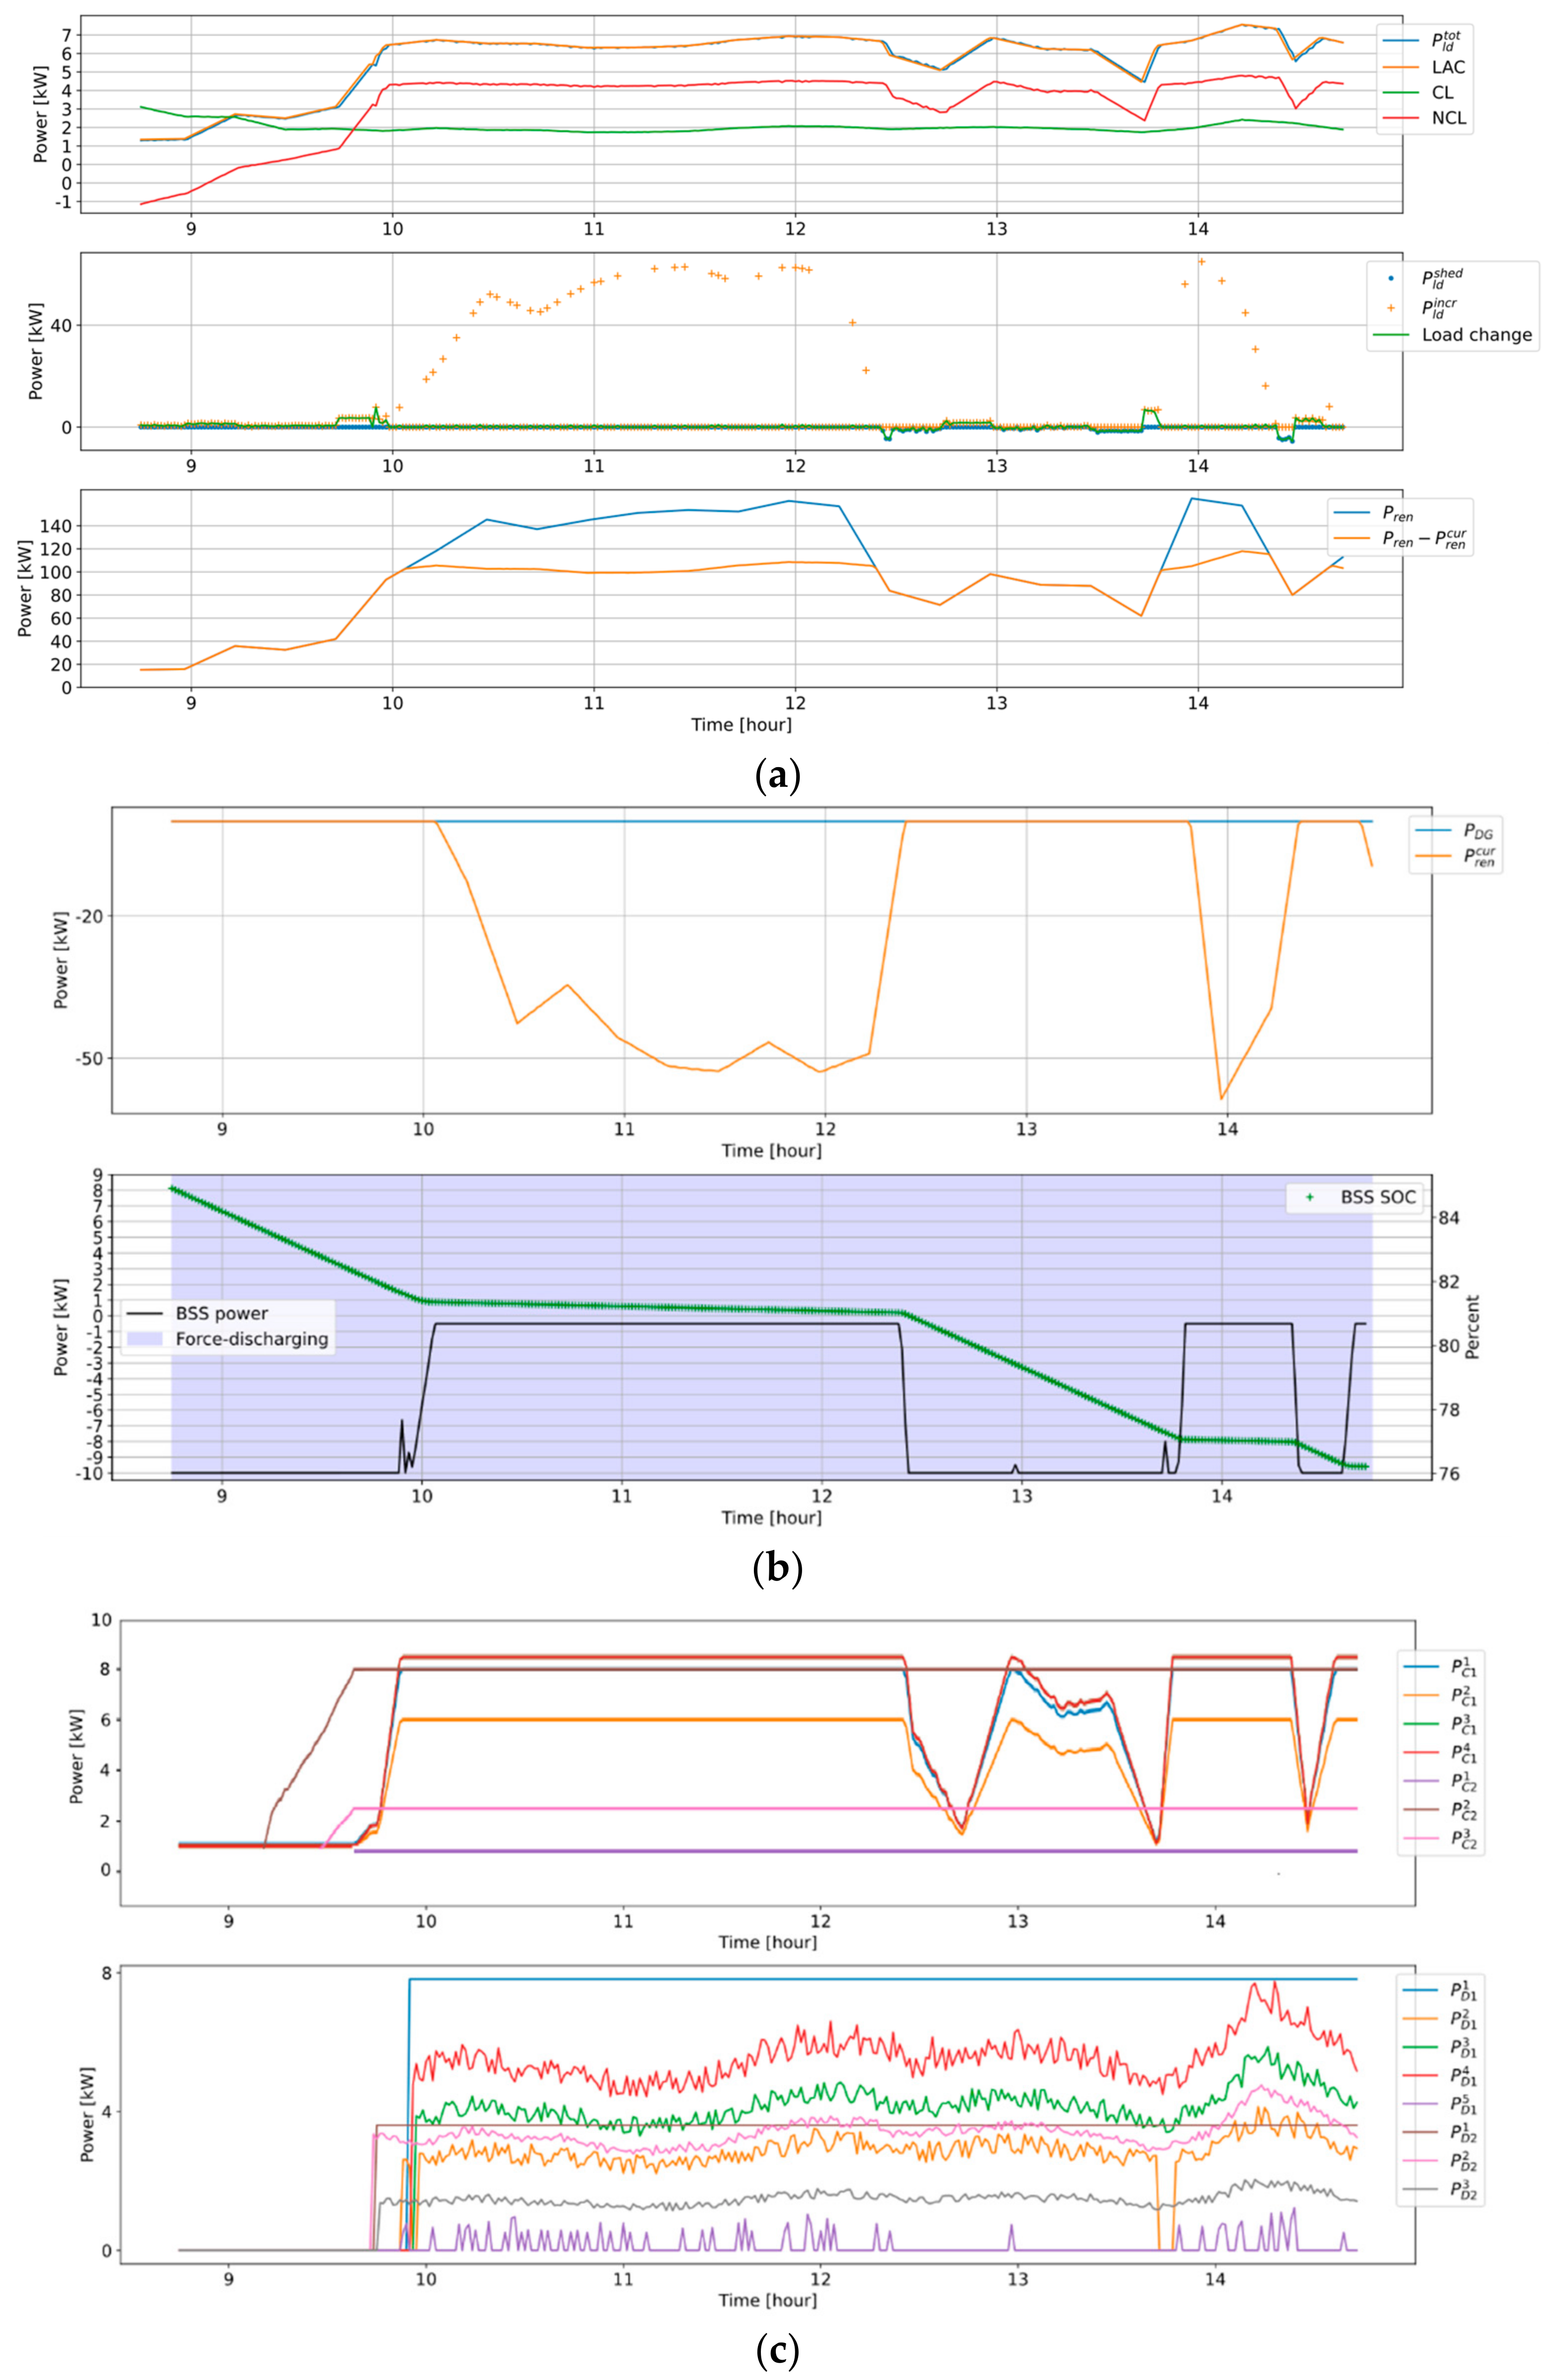
The results of Case-c are illustrated in
Figure 17. The initial SOC is 25%, which makes the dispatch rule force-charging. However, the power exchange is less than the set value. Accordingly, BSS power is set to be the minimum charging power tile at sunrise (8 AM). After sunrise, renewable power increases, which increases the
up to more than −100 kW. Starting from this point, BSS power increases up to the maximum. As SOC crosses
, the control mode is switched to power-smoothing. After 10 PM, SOC enters the force-discharging region. Because of the zero renewable generations and defined dispatch rule, BSS is discharged at the minimum rate. In this test case, both aims are achieved to minimize charge–discharge cycles and avoid rapid control rule switching.
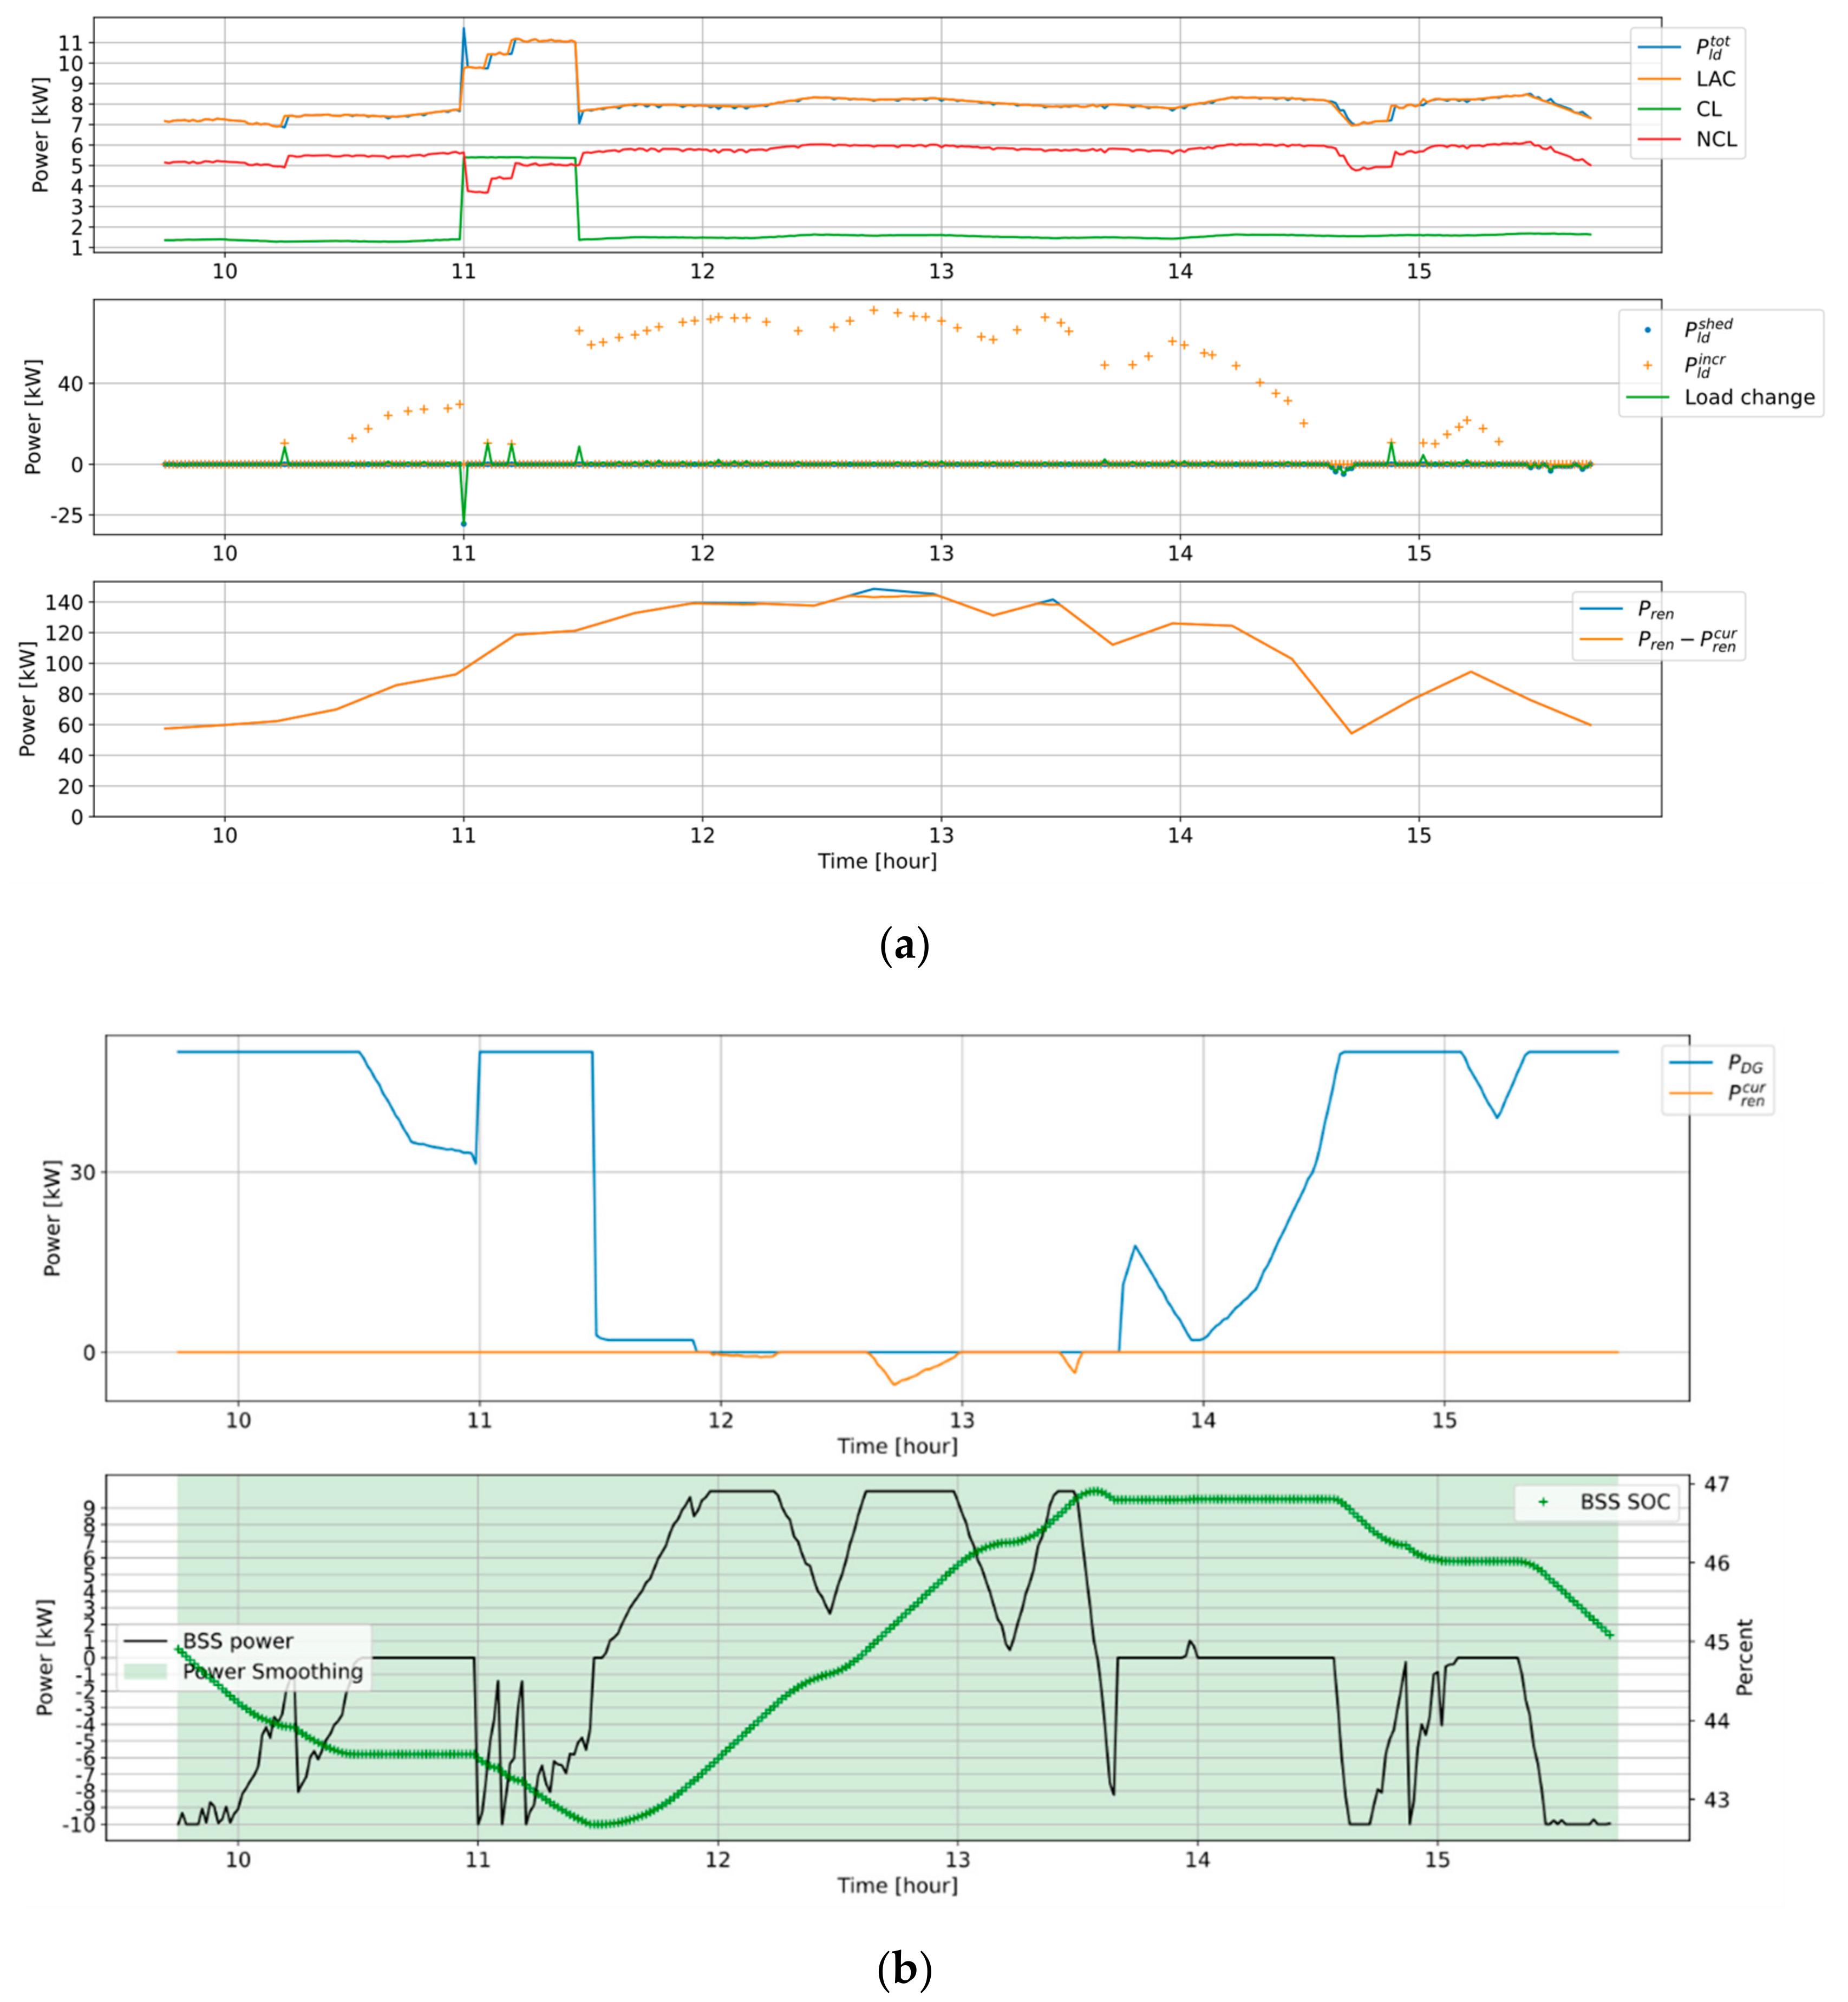
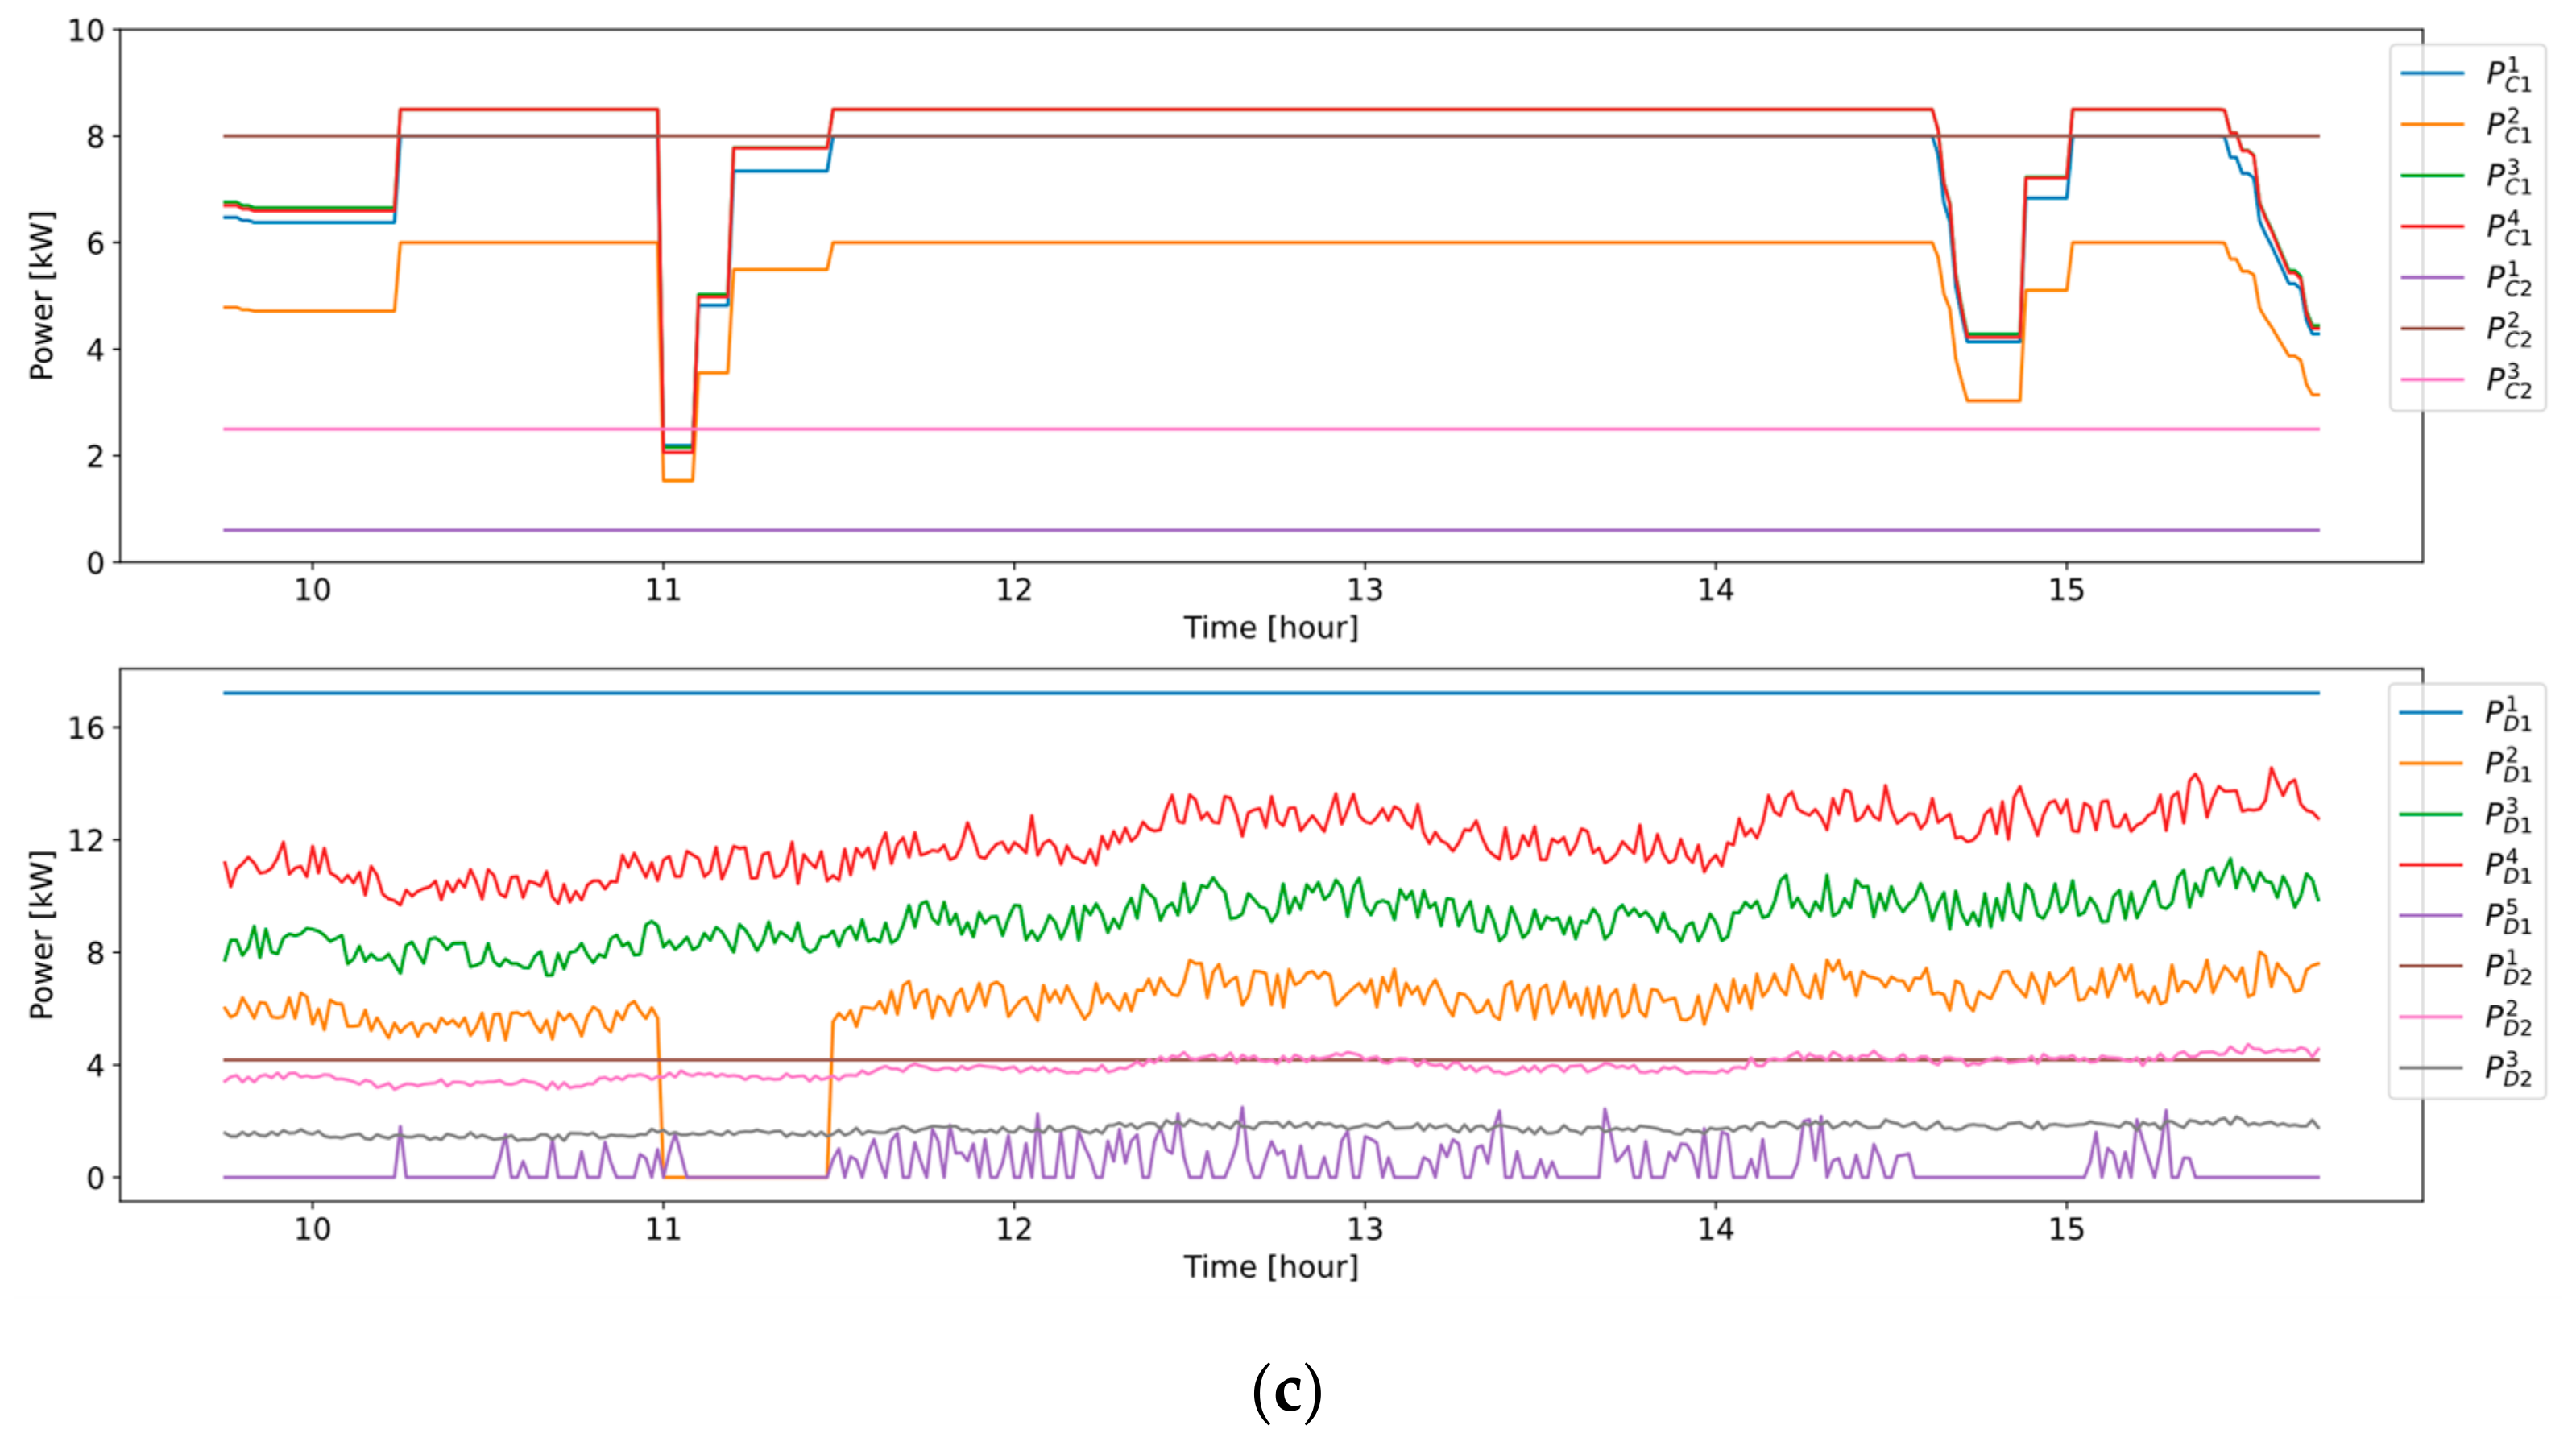
Figure 18 illustrates the test results of Case-d. In this test, a 45 kW load, larger than all other loads, is connected to the system at 11 AM and disconnected 30 min later. This load is considered as the critical load (CL) to avoid its shedding. Based on
Figure 18a, the necessary amount of the noncritical load (NCL) is shedded to compensate for the generation and load mismatch immediately after the surge in load. Accordingly, available generation power, BSS discharge power, and load after control (LAC) are balanced. As can be seen in
Figure 18c, a single interruptible DCL and both priority and interruptible CCLs are shedded. This means that priority CCLs are shedded instead of shedding extra interruptible DCL. After a couple of minutes, shedded loads are restored as PV power output increases. Moreover,
Figure 18b shows, around 30 min before the event, DG power and BSS discharging rate have started decreasing in response to PV power output rise. Precisely after the event, both of these variables are set to corresponding maximums to minimize the shedded load. The SOC remained within the power-smoothing range during the test. If the dispatch was force-charging before the event or because of the event, the power balance might fail. This issue entirely depends on the sizing of the MG assets and should be contemplated in MG planning.
The results of
Case-e are illustrated in
Figure 19. The initial SOC is 70%, indicating dispatch rule force-discharging. The PV system is lost at 1 PM and is returned to the system after one hour. Before this event, the DG is turned off, even renewable generation is partially curtailed, and BSS discharging is at a minimum rate. Immediately after the PV system’s tripping, the DG system is turned on and operated at maximum rated power. BSS discharging power increased, and the rest of the power mismatch is compensated by the shedding of NCL.
Figure 19c shows that interruptible DCLs and CCLs are shedded entirely. CCLs are then minorly restored during the event in response to priority DCL and CL’s variances. After the event ends, DG has turned off again, and BSS power is decreased.
The test results related to Case-f are given in
Figure 20. Within this test, DG is not available and generation is balanced via PV and BSS power. As the BSS is in force-discharging mode, its power output is set to maximum discharging rate up to around 10 AM, where renewable power significantly rises and it is partially curtailed. Meanwhile, all possible loads are restored. However, in the case of a major fall in PV power, load shedding is observed. According to this test, it can be deduced that MGCS can manage the MG without the DG.


 and
and 
