Article

Aerial Thermographic Image-Based Assessment of Thermal Bridges Using Representative Classifications and Calculations

Karlsruhe Institute of Technology (KIT), Institute for Industrial Production (IIP), Hertzstr. 16, 76187 Karlsruhe, Germany
*
Authors to whom correspondence should be addressed.
Energies 2021, 14(21), 7360; https://doi.org/10.3390/en14217360
Submission received: 18 August 2021 / Revised: 1 October 2021 / Accepted: 22 October 2021 / Published: 5 November 2021
(This article belongs to the Special Issue Energy Efficiency Improvements in Buildings to Achieve Climate Goals)

Abstract

:
Since the middle of the 20th century many any buildings were built without any energy standards and still have a comparably poor energy quality. To obtain an overview of the current thermal quality of buildings in a whole city district, it may be promising to work with thermographic images obtained by unmanned aerial vehicles (UAV). Aerial thermography represents a fast and cost-efficient approach compared to traditional terrestrial thermography. In this paper, we describe an approach to finding thermal bridges on aerial thermographic images and characterizing them in terms of their risk of mold formation, energy losses, retrofit costs, and retrofit benefits. To identify thermal bridge types that can be detected reliably on aerial thermographic images, we use a dataset collected with a UAV in an urban district of the German city of Karlsruhe. We classify and characterize 14 relevant thermal bridge types for the German building cohorts of the 1950s and 1960s. Concerning the criterion of mold formation, thermal bridges of window components, basement ceiling slabs, balcony slabs, floor slabs, and attics are found to be particularly relevant to retrofit projects. Regarding energy savings, the retrofit of thermal bridges of window sills, window lintels, and attics shows high potential. The retrofit of attics seems to be less attractive, when also taking into account the necessary retrofit costs.

1. Introduction

A significant share of global greenhouse gas and in particular CO2 emissions comes from the building and real estate sector [1]. Most greenhouse gas emissions are not emitted during the construction phase, but during building operation, especially for heating [2]. In many European countries (e.g., Greece, Italy), a major part of the building stock was built without any energy standards [3,4]. In Germany, about 75% of the building stock was built before adoption of the first German thermal insulation regulation of 1979 (“Wärmeschutzverordnung”) and, hence, often is of low energy quality [5,6]. Even today, more than 50 years after the construction of these buildings, their energy quality is significantly worse than that of newer buildings [7].
Buildings that have not yet been retrofitted consume up to five times more heating energy than modern buildings [2]. This is mainly caused by a lack of thermal insulation and thermal bridges. A thermal bridge is an area of the building envelope where heat is transported considerably faster from the warmer inside to the colder outside than in adjacent areas. Reasons are different thermal conductivities of materials, geometries of constructions and components, and air leaks [8,9]. Thermal bridges cause energy losses of up to one third of the transmission heat loss of an entire building [8]. Additionally, they lead to the collection of moisture, which can degrade the building fabric or cause mold formation [8].
To identify weak points of the building envelope such as thermal bridges, an analysis of the thermal quality of buildings is required for an effective and efficient energy retrofit. Infrared thermal imaging allows conclusions to be drawn with respect to thermal radiation, air leaks, and moisture permeability [10] and, thus, also provides good information for detecting thermal bridges [11]. Thermography for the energy audit of individual buildings is a well-proven technique that has been in use since the early 2000s. Lucchi [12] provides a comprehensive overview of the history and applications of infrared thermography in the energy audit of buildings. Advantages and disadvantages of various thermography approaches are summarized by Kylili et al. [13], who review literature and research in the field of infrared thermography.
To reduce the energy demand of whole building stocks, it is essential to improve the thermal quality not just of individual buildings, but also of entire city districts [14]. Retrofit approaches that focus on districts (communities/neighborhoods) are gaining importance in international retrofit practice [14]. Examples of the simultaneous retrofit planning of many buildings in a district are Community Energy Strategic Planning (CESP) in the USA [15], Community Energy Planning (CEP) in Canada [16], Positive Energy Districts (PED) in Europe [17], and “energetische Quartierskonzepte” (EQ) in Germany [18].
Thermography can also be used for the analysis of buildings in a whole city district. In a detailed thermographic assessment of individual buildings, both exterior and interior images should be recorded in accordance with the German standard DIN EN 13187 (1999) [19] and taking into account background information, such as building materials and construction methods. For the simultaneous assessment of the thermal quality of a large number of individual buildings, such detailed analyses usually are not suitable, as they are very time-consuming and expensive [11].
Outdoor thermography without additional building background information still allows for the detection of thermal bridges, e.g., [10,20]. To audit many buildings within a short time and with high efficiency, moving thermography is gaining importance. However, there are only a few approaches [21,22,23,24,25] that analyze multiple buildings at one time (e.g., in a district) with respect to thermal bridges. Miller and Singh [21], Garrido et al. [22], and Macher et al. [23] placed an infrared camera on the top of a car for the camera to take several pictures of a building façade at an angle of 45°. Their studies focused on the automatic detection of thermal bridges using software. A main disadvantage of their approach is that only façades facing the street can be analyzed and that rooftops can be hardly recorded. According to Macher et al. [23], this approach is especially suited for detecting thermal bridges between floors and under balconies. Miño et al. [24] and Aguerre et al. [25] as well only focus on the street and terrestrial perspective.
For recording images from all different angles of buildings, including rooftops, unmanned aerial vehicles (UAV, pl. UAVs/drones) equipped with thermal cameras can be used [26]. Many scientific publications deal with the ideal framework conditions for recording thermographic images using drones. Vorajee et al. [27] wanted to find a qualified and lightweight infrared camera to detect thermal bridges with drones. Mavromatidis et al. [28] tried to identify possible uses and limits of the combination of thermography and drones regarding the distance between the camera and the object. Entrop and Vasenev [26] developed a protocol for drone flights for the energy audit of buildings based on thermography. Additionally, Benz et al. [29] used drones for the energy audit of buildings and defined a general framework for the assessment of the energy performance of buildings by estimating U-values. They worked with building close-up thermography and tested their approach for a single school building. Hou et al. [30] experimented with different flight patterns and angles for drones with thermographic cameras to record whole city districts as a basis for the analysis of the thermal quality of buildings.
Current publications dealing with the structured analysis of thermal bridges of multiple buildings on thermographic aerial panorama images are not known to the authors. Such a transferable procedure would be helpful in practice for an inexpensive and rapid analysis of a district’s building stock as a basis for the retrofit planning of multiple buildings intended by CESP, CEP, PED, and EQ. Thus, we develop an approach to identifying, classifying, and assessing thermal bridges of building envelopes recorded with thermographic aerial panorama images on a district scale. This approach is demonstrated for German buildings constructed in the 1950s and 1960s.

2. Methods and Materials

2.1. Procedure

This study aims to investigate how thermal bridges can be detected and assessed in terms of their impact on energy loss, mold growth, and retrofit costs by using outdoor thermographic aerial images of buildings recorded by UAV on the district scale. These recordings are characterized by an increased distance between the infrared camera and the measurement object, changing recording angles depending on UAV flight routes, and the absence of indoor images of buildings.
In the first step of the procedure, it is necessary to record thermographic images with an UAV. For this, an UAV can be programmed to pursue an automatic flight route (e.g., in a mesh grid or a Y-grid) to cover a whole city district from all four cardinal directions [30]. To enhance the quality of the collected images, preprocessing software, e.g., by FLIR [31], is used. With this software, the color scale of thermographic images can be adjusted homogeneously and with a high contrast.
In a next step, thermal bridges can be detected manually on the processed images taking into account different recording/capturing conditions. When selecting images, it should be ensured that the framework conditions for good thermographic practice are fulfilled. This includes suitable weather conditions and recording angles [32]. Good weather conditions means that rain, snow, sun, and wind have to be avoided. The best recording times for images are nights, early mornings, and late evenings of cold winter days. A temperature difference of at least 15 °C from normal indoor temperatures of buildings heated to about 20 °C should be ensured so that temperature gradients can be identified reliably by the human eye [33].
If thermographic images are recorded almost parallel to a building façade (acute angle), misinterpretations of thermal bridges are likely. It is therefore important to sort out images with a small angle (<70°) to the measurement object [10]. To detect thermal bridges, it is necessary to search for high temperature gradients on the buildings. The detected areas on the thermographic images are compared to normal RGB images (recorded with the same UAV or from map service providers) to assure that temperature gradients are not caused by trivial reasons such as open windows or metal constructions.
In order to develop a transferable assessment approach for thermal bridges on thermographic aerial panorama images, thermal bridge types need to be classified and characterized. If no additional information on the buildings in a district is available, assumptions are needed regarding their construction materials and architecture. Thus, this approach is designed for a certain building class with characteristic properties that are needed for the next steps.
This study focuses exclusively on German buildings constructed in the time between 1950 and 1969. Some typical characteristics of this German building age class follow: hardly any constructive thermal insulation; often plastered external walls made of masonry with small cross sections; concrete floors; often flat roofs made of concrete with just a small layer of insulation; wooden windows with small cross sections; and balconies with a continuous floor slab without thermal separation [34]. Buildings of this age class are easily identifiable on aerial images due to their specific characteristics and look.
Analyzing a comprehensive dataset of thermographic aerial UAV images of a German city (Karlsruhe), it was possible to manually identify 14 distinct and relevant thermal bridge types (for details on the dataset, see Section 4). This classification simplifies and is based on the 28 thermal bridge types according to the supplementary sheet 2 of DIN 4108:2019 [35].
In order to characterize the thermal bridge classes concerning the risk of mold growth and potential heat losses, simulation of representative thermal bridges is required. The length of a thermal bridge is defined as the reference value for the simulation (unit: linear meter). In this way, results can later be transferred to thermal bridges of different lengths, which can be measured, e.g., with measurement tools from map providers or photogrammetry approaches. In this study, the software ThermCad from ROWA-Soft [36] is used. Calculations using this software are based on DIN V 4108-6 [37] and take into account necessary framework conditions in accordance with the supplementary sheet 2 of DIN 4108 [35]. For the materials and quality of building envelope components, all assumptions for the simulation are listed in Appendix A. The simulation uses a relative indoor air humidity of 50% and a relative air humidity on the component surfaces of 80%.
Suitable retrofit options for each thermal bridge type can also be simulated with ThermCad. The individual retrofit recommendations in this study are based on the criteria of preventing mold formation, saving energy, and finding retrofit measures with minimal scope and costs. The cost calculations for retrofits in this study use the BKI database for both old and new buildings from 2020 [38,39], which is standard in Germany. All cost values have been checked by professionals and are based on statistical evaluations of more than 600 billed construction projects accounted in accordance with DIN 276 [40]. Then, all costs are converted to the unit (EUR/linear meter of thermal bridge retrofit) to also refer to the length of a thermal bridge. An overview of our research approach is given in Figure 1.

2.2. Database

The database of this study consists of thermal drone images recorded with a DJI Matrice 600 Pro drone [41], which is especially suitable for professional aerial photography, combined with the infrared camera DJI Zenmuse XT2 by FLIR [42,43]. This camera system is DJI gimbal combined with a FLIR Duo Pro R camera. The FLIR camera combines both thermal imager and visual camera. The thermal camera contains an uncooled VOx microbolometer working in the long wavelength range between 7.5 and 13.3 μm. It has a focal length of 13 mm, a sensor width of 10.88 mm and a spatial resolution of 640 × 512 pixels per image. [42,43]
The area studied is the city district “Innenstadt-Ost” of the German mid-size city Karlsruhe. It is characterized by a particularly large number of typical German multifamily and mixed-use buildings constructed in the 1950s and 1960s with a low thermal quality and a small retrofit progress. In the district, there are primarily apartment buildings for living, commercial and administrative buildings, and university buildings on the Campus South of Karlsruhe Institute of Technology. A map of the area studied is presented in Figure 2.
The image data were recorded during 16 drone flights carried out on three consecutive days, 19–21 March 2019. From 1–18 March 2019 in the morning, there were a total of 14 rainy days. In this time period, the average maximum daily temperature was 12 °C and the average minimum daily temperature was 5 °C. During the three days of flight, no rainfall was recorded. The air had relatively constant low temperatures between 2 °C and a maximum of 8.7 °C during the individual flights. In addition, wind speeds were steady at around 5 km/h on 19 March 2019 and around 17 km/h on 20–21 March 2019. The images were recorded in the morning and late evening with a low global radiation of less than 100 W/m2.
In sum, the data set contains around 10,000 thermal and RGB images each. The formats of the images are panorama images that cover many different objects in one image and were taken at a height of 60–80 m above ground with a considerable overlap between 80–90%. The extraction of the raw thermal information from the image files depends on the file format and camera manufacturer. Thus, for the processing of the thermographic images, we use the FLIR Tools [31] from FLIR systems. Here, the original gray scale thermal images are colored via the coloring scheme “rainbow” and a temperature scale between −8 and +8 °C. However, it must be noted that truly accurate temperature measurements are difficult to obtain owing to many influencing parameters. An example of a thermographic image of the data set with its corresponding RGB image is shown in Figure 3.

2.3. Classification and Assessment of Thermal Bridges in German Buildings Constructed between 1950 and 1969

2.3.1. Types of Thermal Bridges

In the dataset, we manually identified 14 different types of thermal bridges on thermographic images of German buildings constructed between 1950 and 1969. These types of thermal bridges can be categorized according to the building component in which they occur. Explicitly, we identified the types listed in Table 1.
An overview of the 14 thermal bridge types with the corresponding thermographic image excerpts of the dataset is given in Table 2. Detailed descriptions of these thermal bridge types with the panorama images from our database are listed in Appendix B. A list of thermal anomalies that repeatedly appear on thermographic images of our dataset and that should not be misinterpreted as thermal bridges of buildings is given in Appendix C.

2.3.2. Retrofits of Thermal Bridges

Every type of thermal bridge leads to a different energy loss and mold risk and requires individual retrofit measures. Current retrofits for thermal bridges usually include (1) a partial demolition/removal of the old construction components causing a thermal bridge, (2) the installation of new construction components, including insulation material or/and completely new components, and (3) ancillary measures such as the installation of a scaffold or moisture tests [45]. In this study, ancillary measures are not included, as they usually depend on the framework conditions of the individual buildings and on whether multiple retrofit measures are carried out at the same time.
For all types of thermal bridges in this study, common and simple retrofit measures are considered. For each thermal bridge, one retrofit recommendation is listed in Appendix B, including a list of all required retrofit measures and calculated costs per linear meter of thermal bridge.

2.3.3. Characteristic Values for Thermal Bridges

For the simulation and analysis of the different thermal bridge types and their effects, three characteristic technical values provide information on the risk of mold formation and the energy loss potential. These are:
-
The temperature factor f R , s i (-) for evaluating internal surface temperatures with regard to the risk of mold formation according to the supplementary sheet 2 of DIN 4108 [35]: A component can be assessed to be free from mold at a relative humidity of higher than 50% regardless of the indoor and outdoor temperatures, if f R , s i is higher than 0.7. For a simple assessment approach, it can thus be assumed that if f R , s i is lower than 0.7, a retrofit is necessary or should be considered because of a high risk of mold growth and building component deterioration. If f R , s i is higher than 0.7, it can be assumed that a retrofit is not necessary to prevent mold growth.
-
The thermal bridge loss coefficient Ψ (W/(m*K)) for determining additional heat losses caused by thermal bridges according to DIN EN ISO 10211 [46]: The coefficient Ψ quantifies the additional heat losses through the building envelope caused by a thermal bridge. It refers to linear thermal bridges and depends on the length of a thermal bridge.
-
The transmission heat loss per length of thermal bridge q (W/m) (not explicitly defined in standards): The heat loss q also refers to the length of linear thermal bridges and defines the total heat flow through a linear meter of thermal bridge.
Applying the ThermCad simulation tool, all three characteristic values for each type of thermal bridge can be derived both for the original state ( f R , s i , 0 , Ψ 0 , q 0 ) and after a retrofit of the thermal bridge according to Section 3 and Appendix B ( f R , s i , 1 , Ψ 1 , q 1 ). To quantify the benefit of the considered retrofit recommendation for the individual types of thermal bridges, the reduction of the thermal bridge loss coefficient Δ Ψ = Ψ 0 Ψ 1 (W/(m*K)) and the reduction of heat flow Δ q = q 0 q 1 (W/m) after a retrofit are calculated as well.

3. Results

As a result of our study, we provide in Appendix B a detailed thermal bridge catalog for German buildings constructed between 1950 and 1969. This catalog contains comprehensive information on the 14 relevant thermal bridge types identified in this study, provides exemplary aerial thermographic panorama images of each thermal bridge, and describes simple retrofit measures.
For representative thermal bridges (see Table 1), we quantified the characteristic values according to Section 2.3.3 for the 14 thermal bridge types before and after a retrofit, the estimated costs for a retrofit, and the reduction of heat flow per invested Euro of a retrofit (called herein the benefit–cost ratio). These values are listed in Table 3 in descending order of the cost–benefit ratio.
Considering the criterion of mold formation, two thermal bridge types can be assessed to be free from mold with a value of f R , s i , 0 that is significantly higher than 0.7. According to the assessment of examples from the dataset, seven thermal bridge types have a high risk of mold formation with a value of f R , s i , 0 that is clearly lower than 0.7. Five types of thermal bridges have a value of f R , s i , 0 that is very close to 0.7 and can also be assessed to be associated with the risk of mold formation. Figure 4 presents an overview of all thermal bridge types assessed and the criterion of mold formation. With the implementation of the retrofit measures suggested in this study, all simulation values f R , s i , 1 of the 14 thermal bridge types assessed are higher than 0.7 and can be assumed to be free from mold.
In the analysis, staggered stories and dormers have a comparably low risk of mold formation. The results, however, reveal that window sills and lintels, particularly, and that attics and floor, balcony, and basement ceiling slabs are prone to low temperature factors f R , s i , 0 with a comparably high risk of mold. Thermal bridges on window sills are mainly caused by the construction design for radiator niches—a reduced wall thickness below windows. In a retrofit, the whole area below the window should be insulated to avoid mold formation and heat loss. This would result in a very high improvement with respect to the mold formation risk and the cost–benefit ratio. Window lintels can cause thermal bridges owing to their material that contrasts with surrounding masonry. In a retrofit, insulation with a minimum height of 40 cm is placed onto the lintel and the transition to the surrounding masonry and window frame with an overlap of at least 3 cm on the building outside. Window reveals can cause thermal bridges when the window is not placed in the insulation layer of the building. Similar to thermal bridges at window lintels, they can be retrofitted with an additional outside insulation layer with a minimum 3 cm overlap to the window frame. Attics are the extensions of flat roofs and their connections and different materials used can lead to thermal bridges. In a retrofit, the attic has to be fully covered with insulation and must be placed 50 cm below the roof top. Floor slabs separate different stories and can produce thermal bridges when not properly insulated. A retrofit would incorporate insulation on the outside of façades where the floor slabs adjoin. Basement ceiling slabs separate the unheated basement from the heated ground floor. Without insulation, thermal bridges can also occur. A retrofit includes an 80 cm high insulation with 60 cm above and 20 cm below the lower edge of the basement ceiling slab. The main reason for thermal bridges on balcony slabs is cantilevered slabs that transmit heat to the outside. However, a retrofit is associated with a rather effortful and costly demolition of the balcony combined with an insulation and rebuild of a new balcony.
After the simulated retrofit, this value increases significantly for window sills, while for the other thermal bridges the value rises to above the 0.7 benchmark. The energy savings of a thermal bridge retrofit is determined by the reduction in the transmission heat flow Δ q caused by a retrofit. Besides window sills, the highest savings can be expected for window lintels and attics followed by floors and balcony slabs. With respect to the thermal bridge loss coefficient Ψ , the best retrofit simulation effects can be seen for window lintels, attics, and floor slabs.
The retrofit costs are calculated for the recommended retrofit measures per thermal bridge type. The costs include all retrofit costs per linear meter of the respective thermal bridge. Inflation, tax, depreciation, and interest rates for loans are not considered. Therefore, the expected retrofit costs are comparable with each other. Per linear meter, attics and window sills show the highest estimated retrofit costs, but at least for window sills the benefit–cost ratio is the highest for all thermal bridge types. By considering the retrofit costs of the different thermal bridge types, it becomes clear that retrofits with a high reduction in heat flow often also require higher costs. This relationship is shown in Figure 5 and Figure 6, e.g., by the cost–benefit ratio of the transmission heat flow reduction per invested Euro of a retrofit, sorted in descending order.
The energy savings after a thermal bridge retrofit are determined by the reduction of the transmission heat flow ∆q caused by a retrofit. By considering the retrofit costs of the different thermal bridge types, it becomes clear that retrofits with a high reduction of heat flow often require higher costs. This relationship is shown in Figure 5 and Figure 6, e.g., by the cost–benefit ratio of transmission heat flow reduction per invested Euro of a retrofit, sorted in descending order.
Summarizing, we find that for German buildings constructed in the middle of the 20th century, thermal bridges of window components, floor/basement ceiling/balcony slabs, and attics are particularly relevant to retrofit planning and the criterion of mold formation. Regarding energy savings, the retrofits of thermal bridges of window sills, window lintels, and attics show the highest potentials. When also taking into account the necessary costs for energy savings, the retrofits of window sills and window lintels seem to be most promising. The retrofit of attics seems to be less attractive in this context.
In order to make the approach developed in this paper more comprehensible, a case study for a German building located in the Karlsruhe city center is demonstrated (see also Appendix D). The selected reference building (Figure A29 and Figure A30) is an apartment building located in the Waldhornaße in Karlsruhe. The building consists of four full stories and a roof story with three dormers. The base of the building has a rectangular shaped base. On the west side of the building it is connected to a neighboring building, on the east side partly. There, five types of thermal bridges can be identified at the window, revealing dormers, floor slabs, balcony slabs, and the connection between an outside wall and a roof. By using Google maps and the “measure distance” function [47], we calculated the dimensions of the building and all its components (Table A32). For each component, a typical heat transfer coefficient (U-value) from the 1950s–1960s is determined according to Appendix A. Taking into account the corresponding temperature correction factor and applying the period balance approach (German “Periodenbilanzverfahren”) in accordance with DIN V 4108-6 [37], leads to an associated transmission heat loss per component (Table A33). To calculate the thermal bridge surcharge, we use the exact procedure (German “genaues Verfahren”) [37] (see Appendix D). To determine the state before and after a retrofit (Table A34), the length-related thermal bridge loss coefficients of the associated thermal bridge types (Table 3) are used. The transmission heat loss for the entire reference building is 1042 W/K. The loss due to the thermal bridge areas is around 99 W/K, which corresponds to a share of 9.63% of the heat loss of the entire building. The transmission heat loss of the entire reference building in the state after the thermal bridge retrofit is approximately 906 W/K. The retrofit measures reduce the transmission heat loss by around 136 W/K. This corresponds to a percentage reduction of the transmission heat loss of about 13%.

4. Discussion

This study shows that thermal bridges can be qualitatively detected and quantitatively assessed by analyzing aerial thermal panorama images without using additional building-specific background information.
We demonstrated a simple procedure for the assessment of thermal bridges of German buildings constructed in the decades of the 20th mid-century. For this, we used thermal bridge simulation software and technical standard values for building materials and constructions of the construction period to model and characterize representative thermal bridge types of this building class. As a result of our study, we provide a catalogue of 14 relevant thermal bridge types with exemplary aerial thermal panorama images of German buildings constructed in the 1950s and 1960s. This catalog also provides information on simple retrofit measures, the associated retrofit costs (for Germany), possible energy savings, and the risk reduction of mold formation, by removing a certain thermal bridge type. Similar studies are not known to the authors—only analyses on thermal images from terrestrial street-view and terrestrial perspectives are provided in literature. However, these are not capable for analyzing thermal bridges on rooftops and in upper building areas. Furthermore, in this study we classified the thermal bridges by hand. Inexperienced analyzers could misinterpret some thermal anomalies on the panorama images as thermal bridges (such as ventilation tiles, water pipe aerators, solar systems, lamps, heat build-ups or open windows (see Appendix C). To avoid such misinterpretations, further research could automate the thermal bridge detection with respect to the catalogue developed. Furthermore, in the case study we assume homogeneous construction of the building, meaning that a certain type of thermal bridge occurs at all comparable building components if it is clearly identifiable on at least one component part. This could be misleading in the case of partial retrofits on a building where some components may have been energetically retrofitted while others have not.
Additionally, we want to note that the thermal bridge surcharge has a negative sign after the retrofit. From a theoretical point of view, the surcharge should actually be approximately zero, as there should be no other thermal bridges after the retrofit. In practice, however, the length-related thermal bridge loss coefficient Ψ also has a negative sign in some cases. This is due to the fact that in this study we want to make sure that the criterion for mold formation of f R , s i , 1 > 0.7 is fulfilled. As a consequence, for some thermal bridge retrofits, some areas of the standard cross-section are also affected by the retrofit measures, so that transmission heat loss of the entire building decreases by more than the value of the thermal bridge surcharge in its current state.
The results of our analysis are easy to transfer. To assess a thermal bridge recorded on a thermographic aerial image, only three steps are necessary. First, it must be ensured that the building corresponds to the building class of the 20th mid-century. Second, the thermal bridge must be classified into one of 14 thermal bridge types, whereby our catalog with sample aerial thermal panorama images serves as a classification aid. In the third step, the length of the thermal bridge must be measured with photogrammetric approaches or using measurement tools such as those provided by map services. From this information, conclusions about the retrofit benefit of a thermal bridge for energy savings and avoidance of mold formation can be estimated.
For the planning of retrofits of the 14 thermal bridge types, we state that with regard to the criterion for mold formation, thermal bridges of window components, floor/basement ceiling/balcony slabs, and attics are the most relevant. To maximize energy savings, thermal bridges of window sills, window lintels, and attics are the most relevant.
Finally, we want to critically reflect our approach and results for German buildings constructed during 1950–1969. All quantitative statements in this section are based on theoretical and simplified assumptions. While the recorded infrared energy in a thermal image does originate from the panorama scenes’ effective emissivity, it is influenced by ambient temperature, moisture, general surrounding atmosphere, and reflective energy from the background. For the study at hand, however, thermal images are sufficient to qualitatively identify the thermal bridges and their spatial extent. Further studies should include simultaneous thermal images on individual buildings and direct temperature measurements via thermal images, but also incorporate inside and outside temperature measurements of buildings in the scene to quantitatively substantiate our results.
Further work should compare the results of this study with the actual state of buildings (e.g., via onsite inspections) and retrofit options and costs in practice (e.g., retrofit packages, funding schemes, availability of craftspeople, market prices for retrofit materials, and energy). We acknowledge that in practice, the characteristic values of the thermal bridges depend on additional factors such as architectural specifics. Retrofit costs can differ due to regional differences, economies of scale, and additional ancillary costs. It should also be noted that grants and tax benefits for energy retrofits are not taken into account when determining the costs for retrofit measures. It can be assumed that the German subsidy design for energy retrofits would improve the profitability of retrofit measures and be an incentive for more comprehensive retrofits.
We therefore want to point out that our approach is suitable for the quick and easy identification of interesting thermal bridge structures on district scale. We thus found our approach a good instrument for the preselection of relevant buildings and building parts in the context of retrofit planning. In the specific preparation of building retrofit measures, a more comprehensive detailed analysis with background information of each individual building is necessary and recommended.
In following studies, thermal bridge catalogs can be developed for other building classes in Germany and internationally. Due to the simplicity of our approach, we are convinced that our results can be used to automate the analysis of thermal bridges of buildings on district scale. Current research is already examining automated detection of thermal bridges on panorama drone images and their classification, e.g., [48]. Thus, information on thermal bridges of buildings in urban districts can be collected and assessed in an uncomplicated way as a basis for retrofits in large areas. These results can help to improve and simplify the simultaneous retrofit planning for multiple buildings, such as in the context of CEP, CESP, PED, and EQ.

5. Conclusions

Drone technology allows for the simplified recording of thermographic images of buildings. Compared to terrestrial thermography, aerial images can be recorded faster, at lower cost, and from all angles, including rooftop perspectives. Thermography with drones is therefore very well suited for analyzing buildings in entire districts/neighborhoods/communities. In practical use, aerial thermography has great potential for gaining information on building stocks to prepare retrofits of multiple buildings in the context of CEP, CESP, PED, and EQ. A disadvantage of large-area thermography with drones, however, is the lack of interior thermographic recordings of buildings and of detailed background information on individual building materials and construction methods. Building analysis approaches on the district scale such as the one introduced in this study therefore have to work with simplifying assumptions. Analysis results based on simplifying assumptions can be imprecise and deviate. For this reason, the procedure presented in this study is especially suitable for the identification of interesting thermal bridge structures. Our approach does not replace detailed analyses of buildings and comprehensive planning efforts for the retrofit of thermal bridges.
The results of our study, including a catalogue of 14 relevant thermal bridge types for German buildings from the 1950s and 1960s with exemplary thermographic panorama images, are suitable for practical use. Future studies could focus on developing catalogs for thermal bridges of other German and international building classes. In future, our simple approach will be usable for an automated evaluation of aerial thermal panorama images of buildings. For automation, it is necessary to detect and assign a building to a building class, to detect and assign a thermal bridge to a thermal bridge class, and to measure the length of the respective thermal bridge. For this, computer vision software (e.g., based on deep learning approaches) can be used.
We assume that both drone technology with thermographic cameras and the focus on the district scale will gain importance for the retrofit planning of buildings in future. We hope that with our study we have been able to make a relevant contribution in this field.

Author Contributions

Conceptualization and methodology, investigation, visualization, original draft preparation, writing and editing: Z.M. and J.H.; writing, review, editing, supervision: R.V. and F.S. All authors have read and agreed to the published version of the manuscript.

Funding

The paper was created during a doctoral project financed with a scholarship at Karlsruhe Institute of Technology (KIT) according to the Landesgraduiertenförderungsgesetz—LGFG (State Postgraduate Fellowship Program). And, we acknowledge support by the KIT-Publication Fund of the Karlsruhe Institute of Technology.

Institutional Review Board Statement

Not applicable.

Informed Consent Statement

Not applicable.

Data Availability Statement

The underlying data is referenced throughout the paper. Additional information can be found in the Appendix A and Appendix B, see Appendix C and Appendix D.

Acknowledgments

The authors appreciate the support of Yu Hou (University of Southern California) and Marinus Vogl (Air Bavarian GmbH) for the collection of drone images. Moreover, they thank Harald Schneider (Karlsruhe Institute of Technology) for advice.

Conflicts of Interest

The authors declare no conflict of interest. The funders had no role in the design of the study; in the collection, analyses, or interpretation of data; in the writing of the manuscript, or in the decision to publish the results.

Appendix A

Table A1. Typical U-values for German buildings constructed in the 1950s–1960s (based on: BMWi and BMU, 2015) [49].
ComponentU-Values (1950–1969)Size
Outer wall, made of vertically perforated brick (VPB)1.40.24 m
Outer wall, wooden structure (dormer)0.50.10 m
Radiator niches 2.80.24 m
Wooden windows, 2-layered2.90.07 m
Basement ceiling slab, including floor structure0.80.20 m
Flat roof, massive0.70.20 m
Gable roof, wooden structure0.70.07 m
Table A2. Assumptions for building materials (based on: [50]).
MaterialSizeThermal Conductivity λ
Vertically perforated brick (VPB)0.24 m0.460 W/mK
Wooddifferent sizes0.100 W/mK
Reinforced concrete0.20 m2.300 W/mK
Windows0.07 m0.400 W/mK
Façade insulationdifferent sizes0.035 W/mK
Perimeter insulationdifferent sizes0.040 W/mK
Table A3. List of heat transfer resistances according to the supplementary sheet 2 of DIN 4108 [35].
Heat Transfer ResistancesTemperature (°C)Rs (m2K/W)Illustration Color
Inside–heated200.25Red
Inside–not heated100.17Purple
Outside−50.04Blue

Appendix B

Appendix B.1. Thermal Bridge Types of Outer Walls

Basement ceiling slab
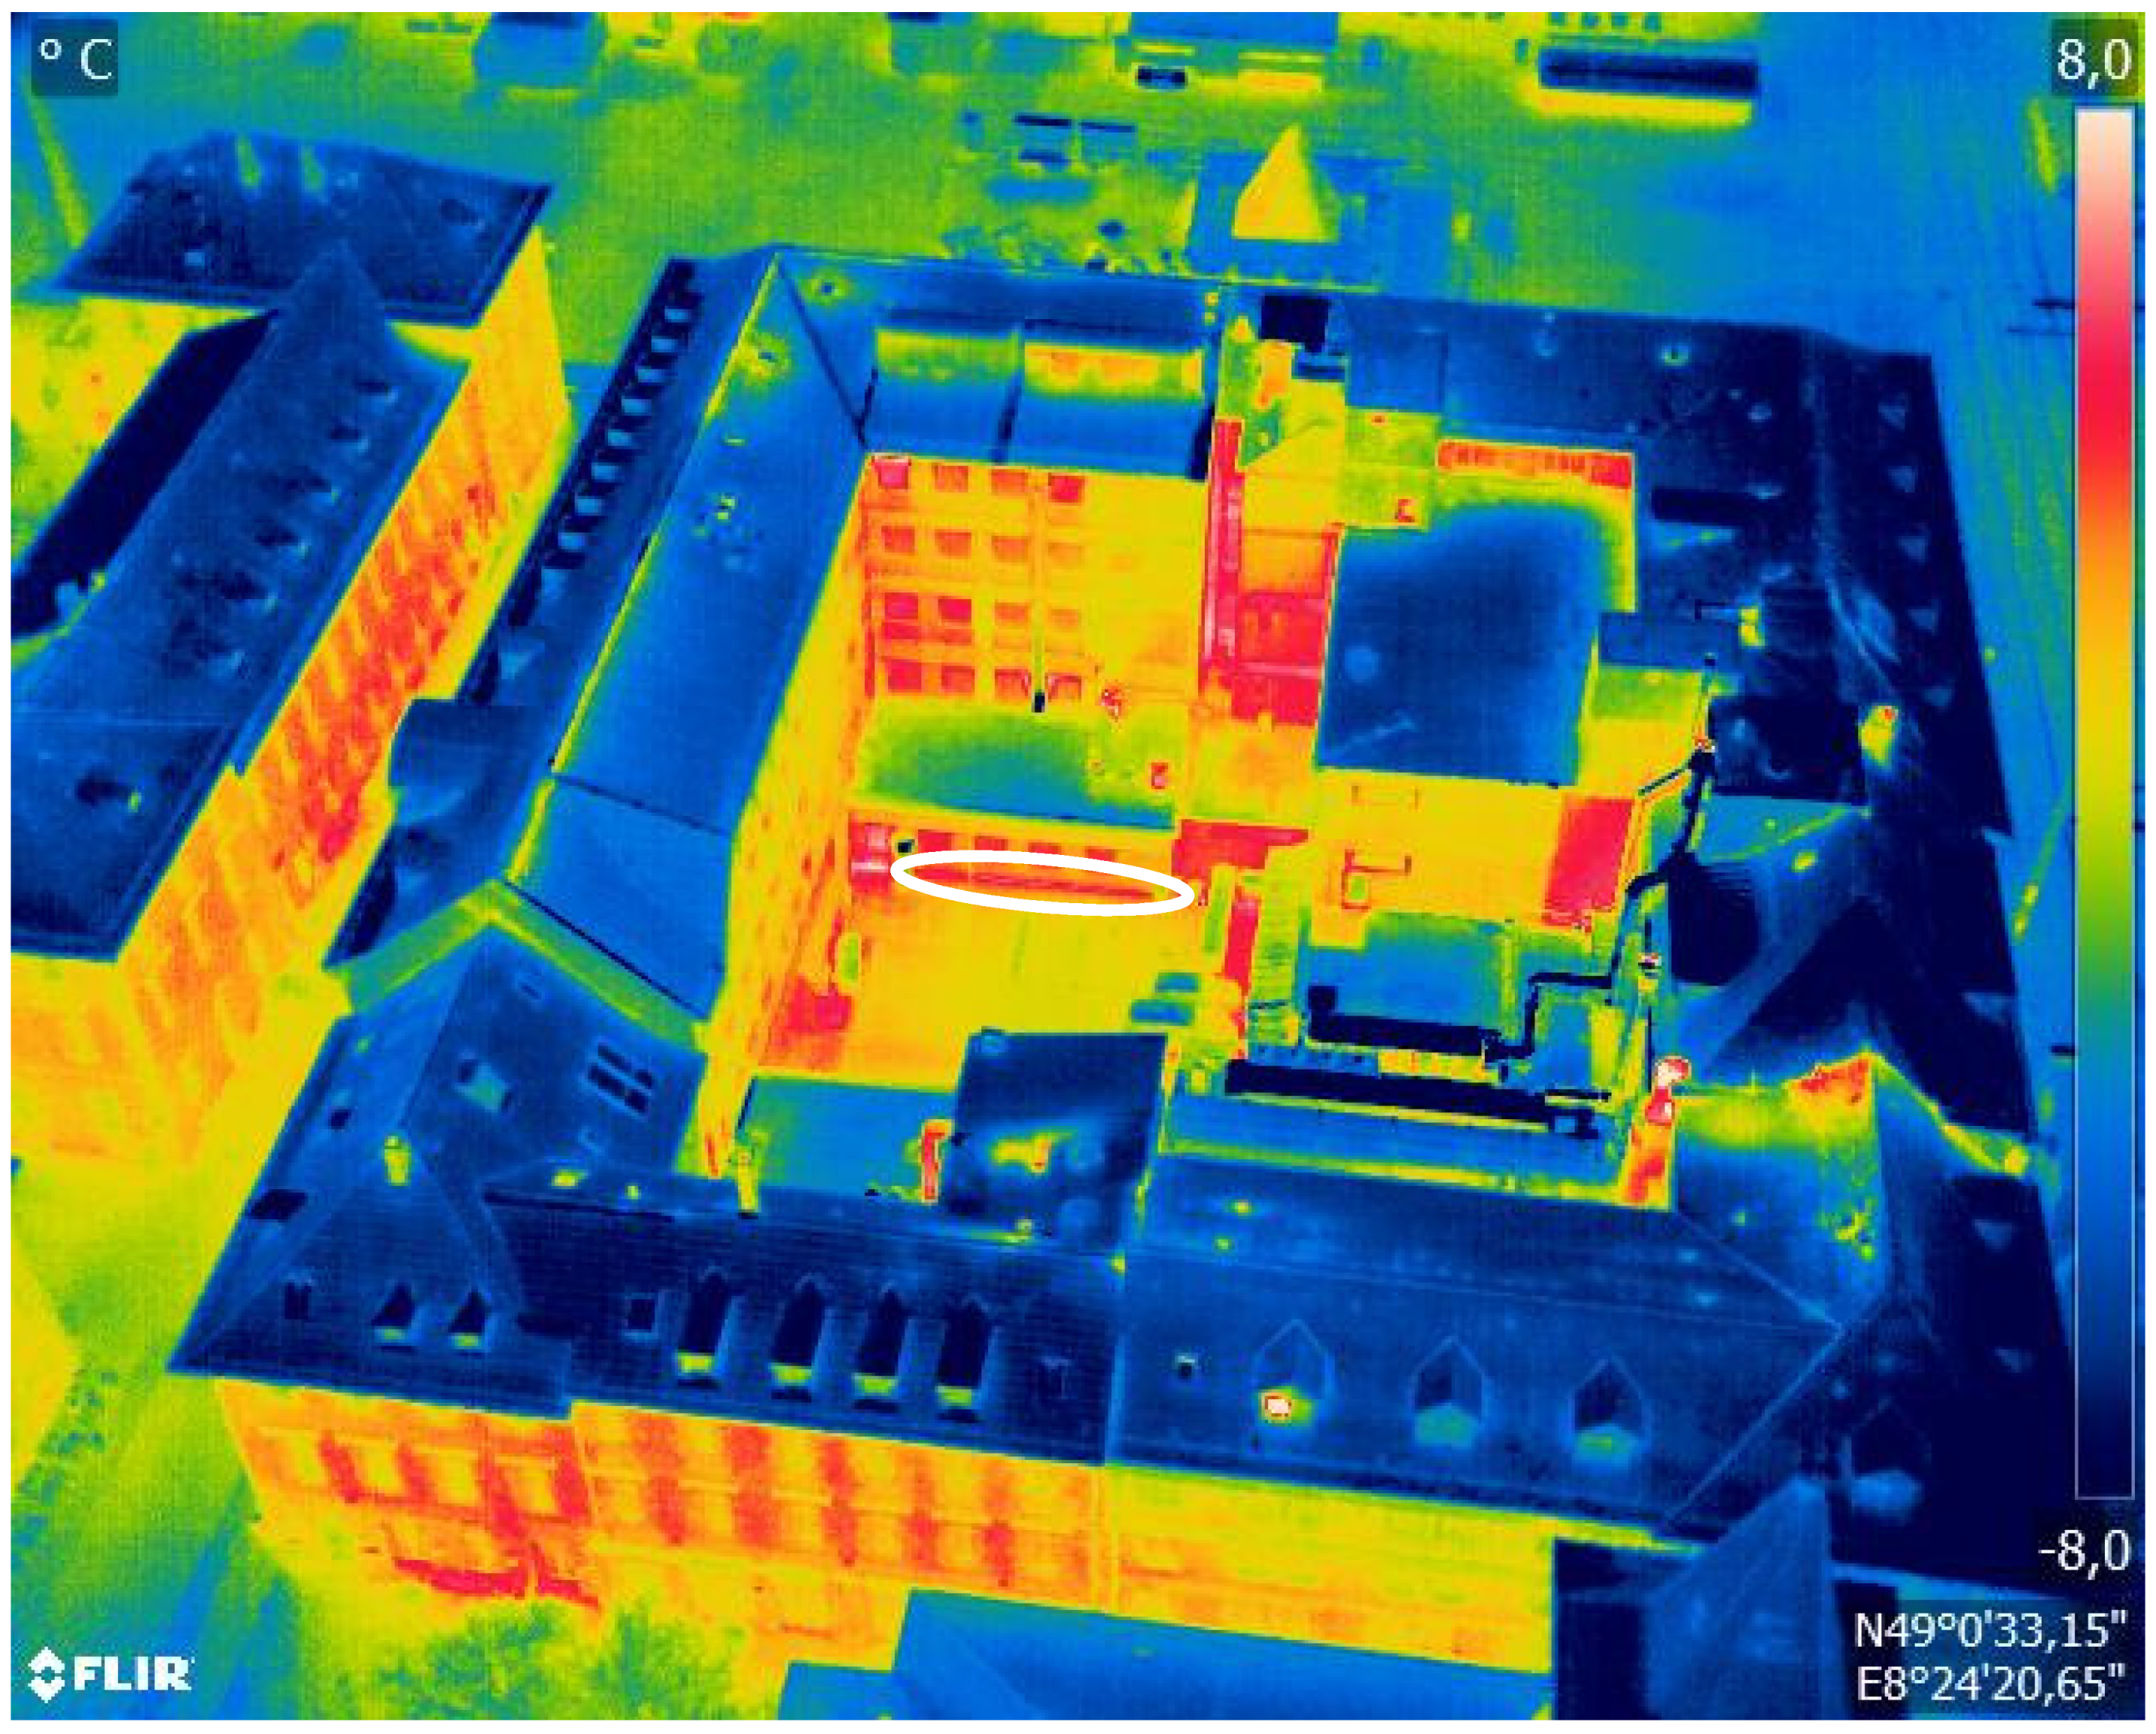
The basement ceiling slab is a horizontal building component that separates the usually unheated basement from the heated ground floor. This component transfers the loads from the ground floor onto the load-bearing basement walls. Therefore, the support of the outer walls is essential to transfer the load [51].
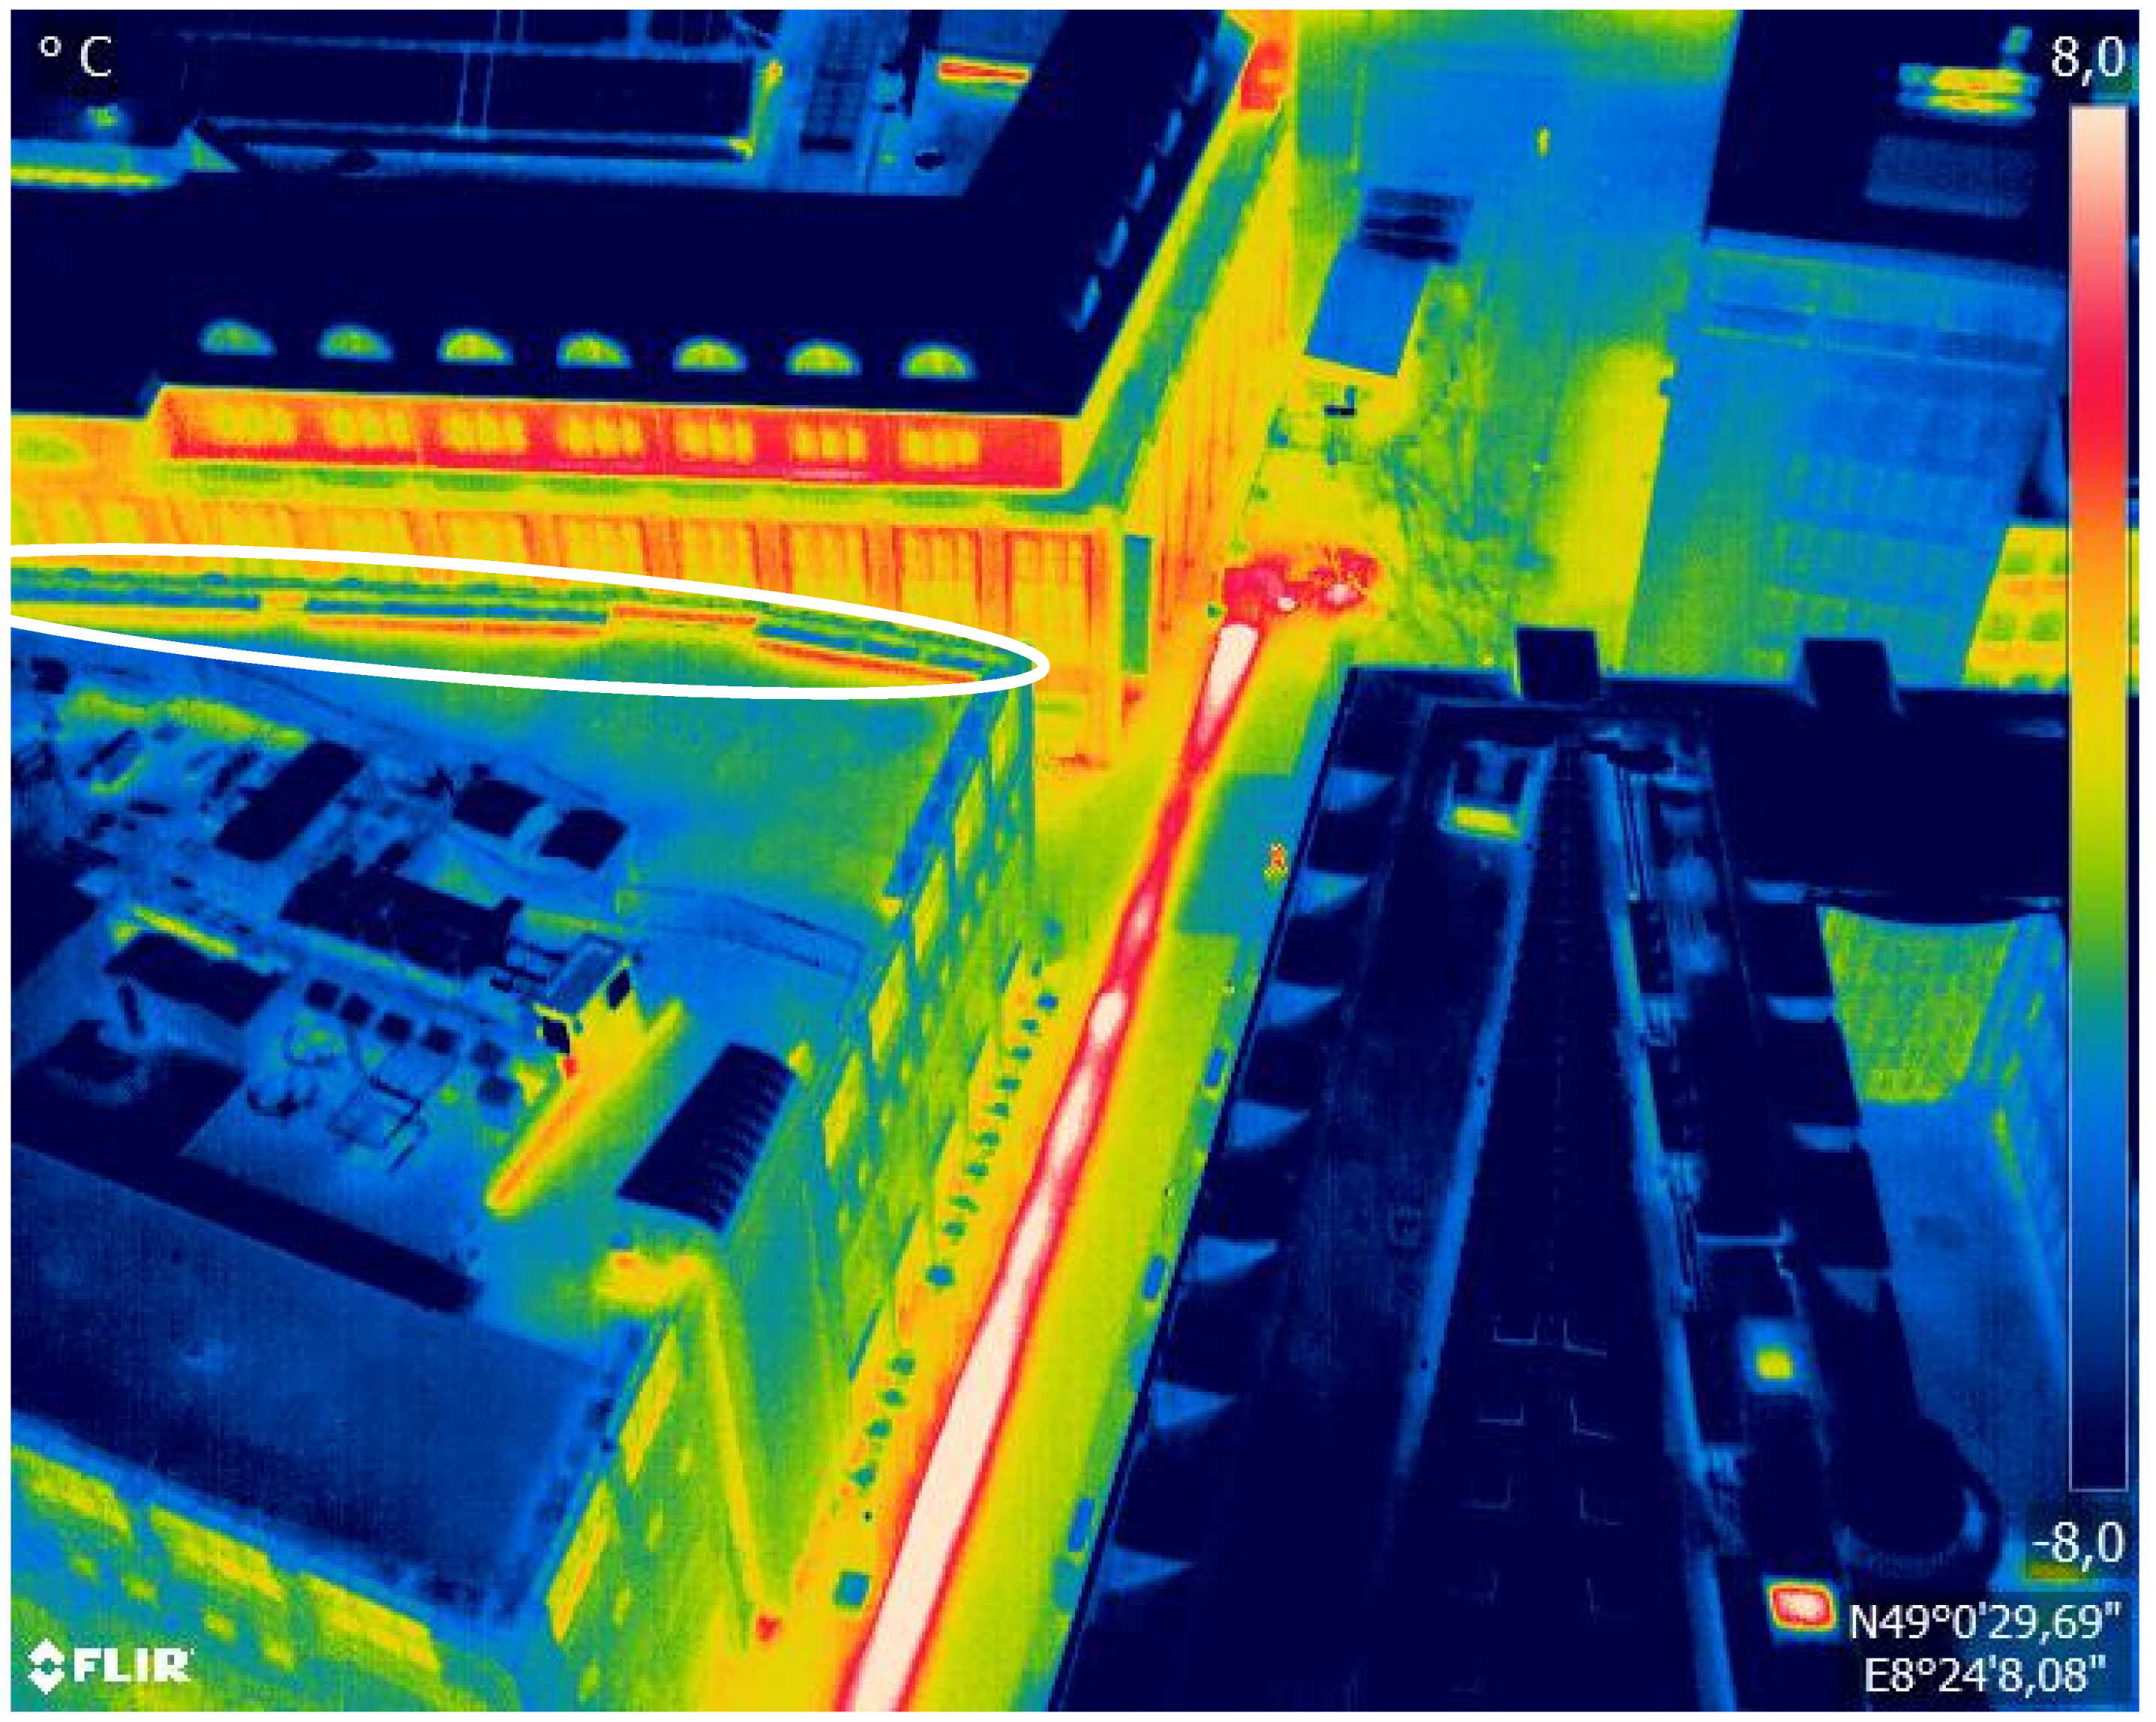
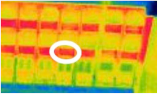
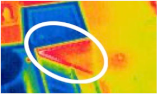
An example of a thermal panorama image shows a thermal bridge in a basement ceiling slab (
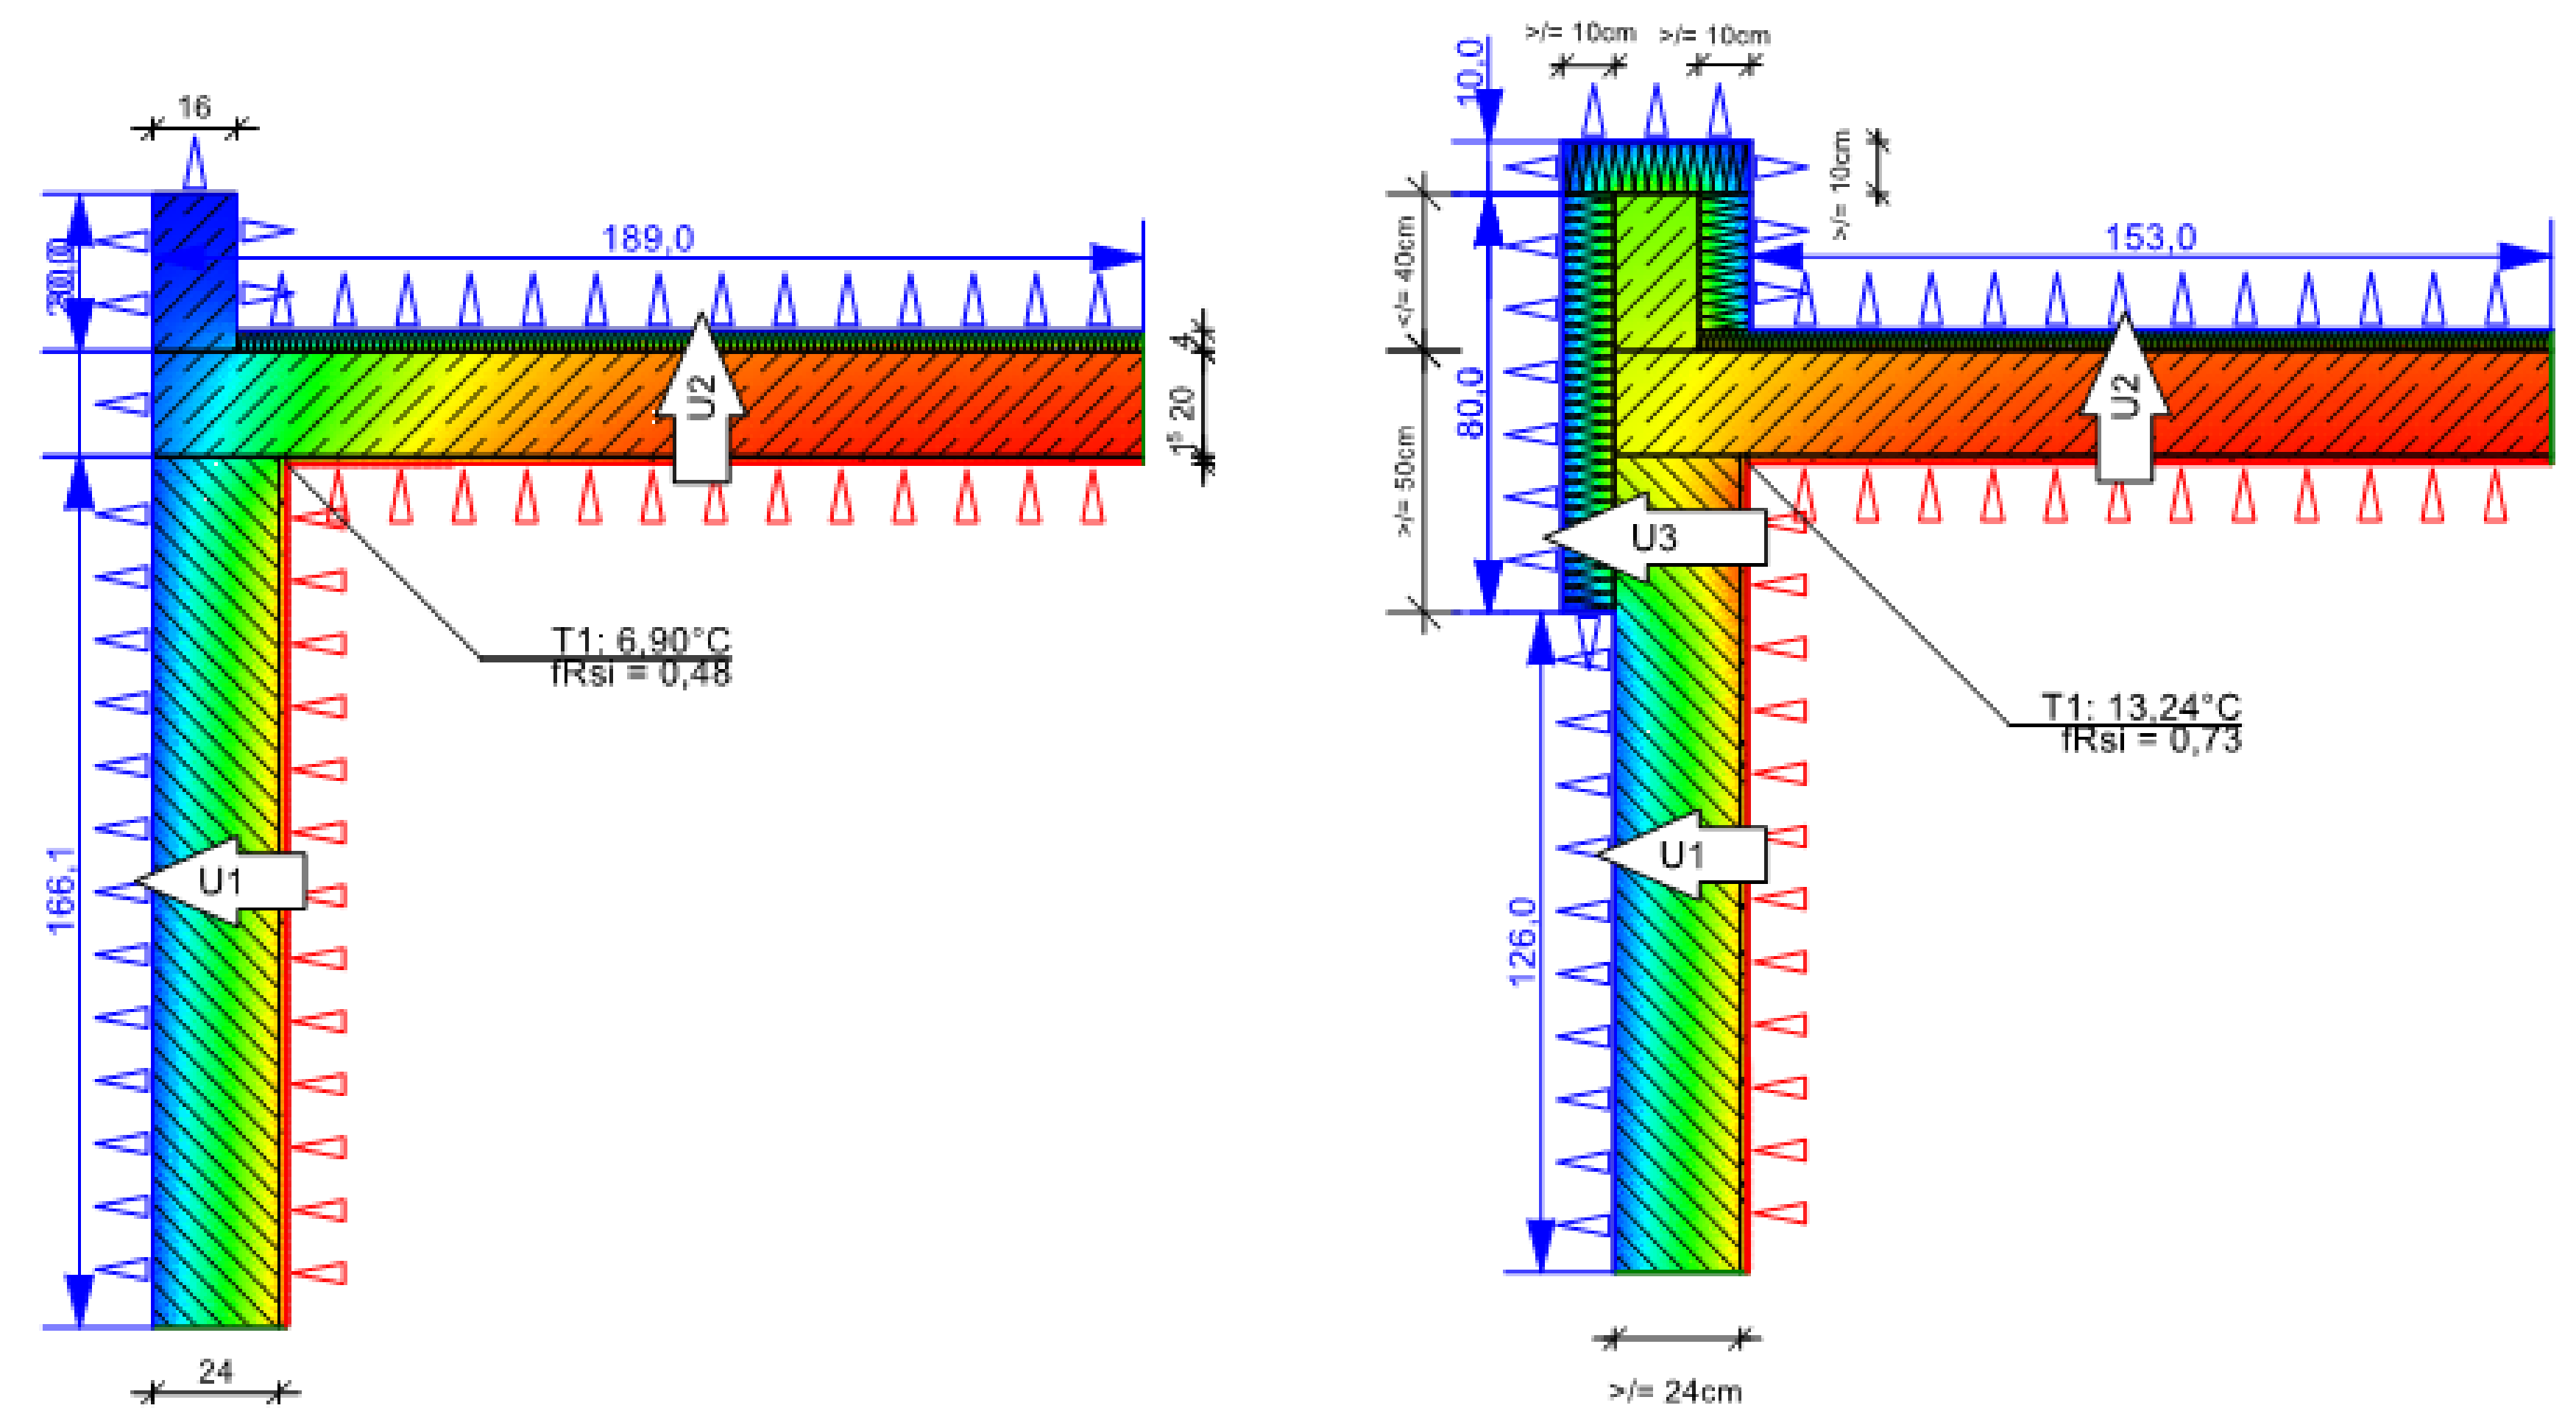
Figure A1). For the retrofit of this thermal bridge type, it is necessary to install a base insulation in the connection area. This serves to balance the effect of the different specific thermal conductivities and to reduce heat loss. The insulation should be 80 cm high, with 60 cm above and 20 cm below the lower edge of the basement ceiling. An illustration of this retrofit measure is shown in Figure A2. The costs for the retrofit of this thermal bridge type are listed in Table A4 and the change in the characteristic values of heat loss and mold formation of the building component before and after the retrofit is shown in Table A5.
Figure A1. Example: thermal bridge of a basement ceiling slab.
Energies 14 07360 g0a1
Figure A2. Before and after the thermal bridge retrofit of a basement ceiling slab (created with ThermCad thermal bridge simulation calculator).
Energies 14 07360 g0a2
Table A4. Retrofit components and costs of the thermal bridge retrofit of a basement ceiling slab [38,39].
Pos. No.Retrofit Measure *
Installation Height: 80 cm
Retrofit Costs per Linear Meter
LB 323-3Removing old plaster from the building base11.20 EUR/m
LB 323-6Removing old plaster base from the wall11.20 EUR/m
LB 323-68Preparing base for the thermal insulation system2.40 EUR/m
LB 323-97Building base insulation (XPS, 100 mm)40.00 EUR/m
LB 323-30Reinforcement fabrics (glass fiber)8.80 EUR/m
LB 323-67Plaster (undercoat and finishing plaster)32.80 EUR/m
Gross total106.40 EUR/m
* In retrofit practice, a check for possible moisture problems and the need of a base seal is also relevant.
Table A5. Quantifiable results of the thermal bridge retrofit of a basement ceiling slab (ThermCad thermal bridge simulation calculation).
Original State before RetrofitState after RetrofitImprovement
fRsi, 0Ψ0q0fRsi, 1Ψ1q1ΔΨΔq
(-)(W/mK)(W/m)(-)(W/mK)(W/m)(W/mK)(W/m)
0.570.0452.970.75−0.4646.890.506.08
Floor slab
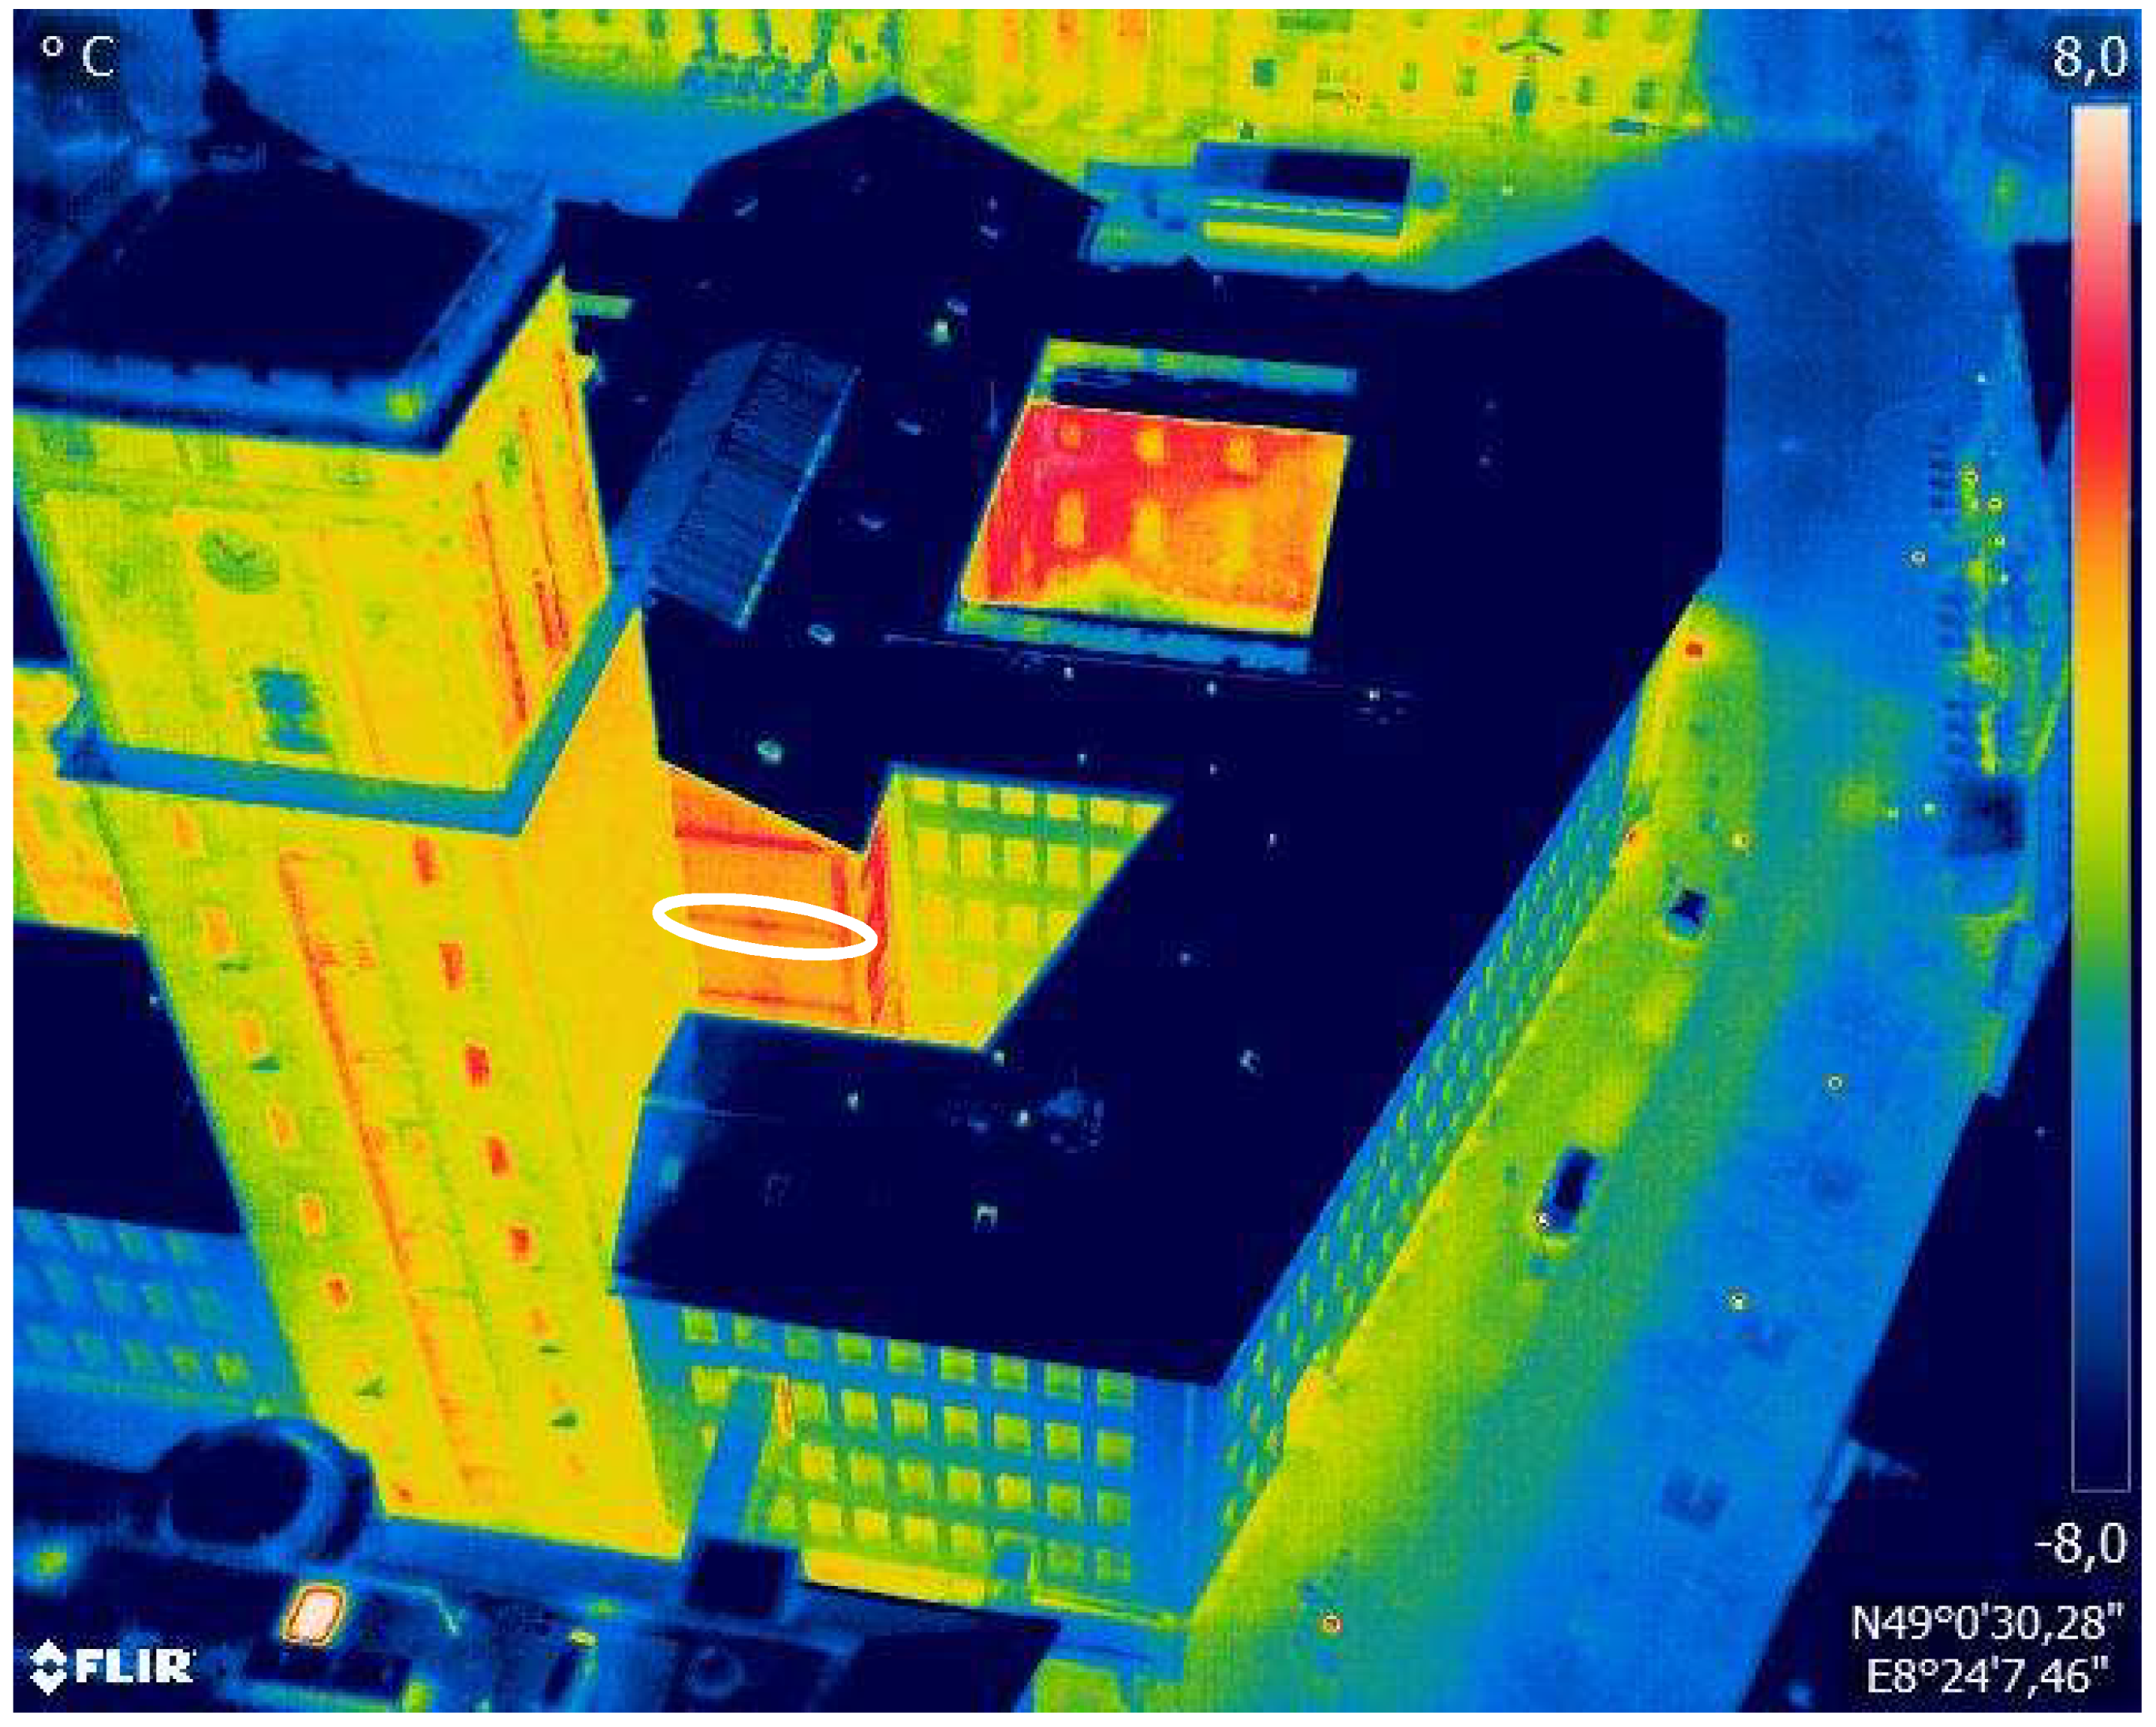
A floor slab is a horizontal building component that completes a room at the top and constitutes the base of the floor above. It transfers the loads from the stories above onto the load-bearing components and helps in thermal and noise protection. A thermal bridge occurs when the connection depth of the outer wall is not sufficient for the attachment of an additional insulation layer in the binding area. The connection area heats disproportionately more than the standard cross section, so that there is a considerable loss of heat of the reinforced concrete slab. Different materials (masonry and reinforced concrete) with different specific thermal conductivities increase the thermal bridge effect [2].
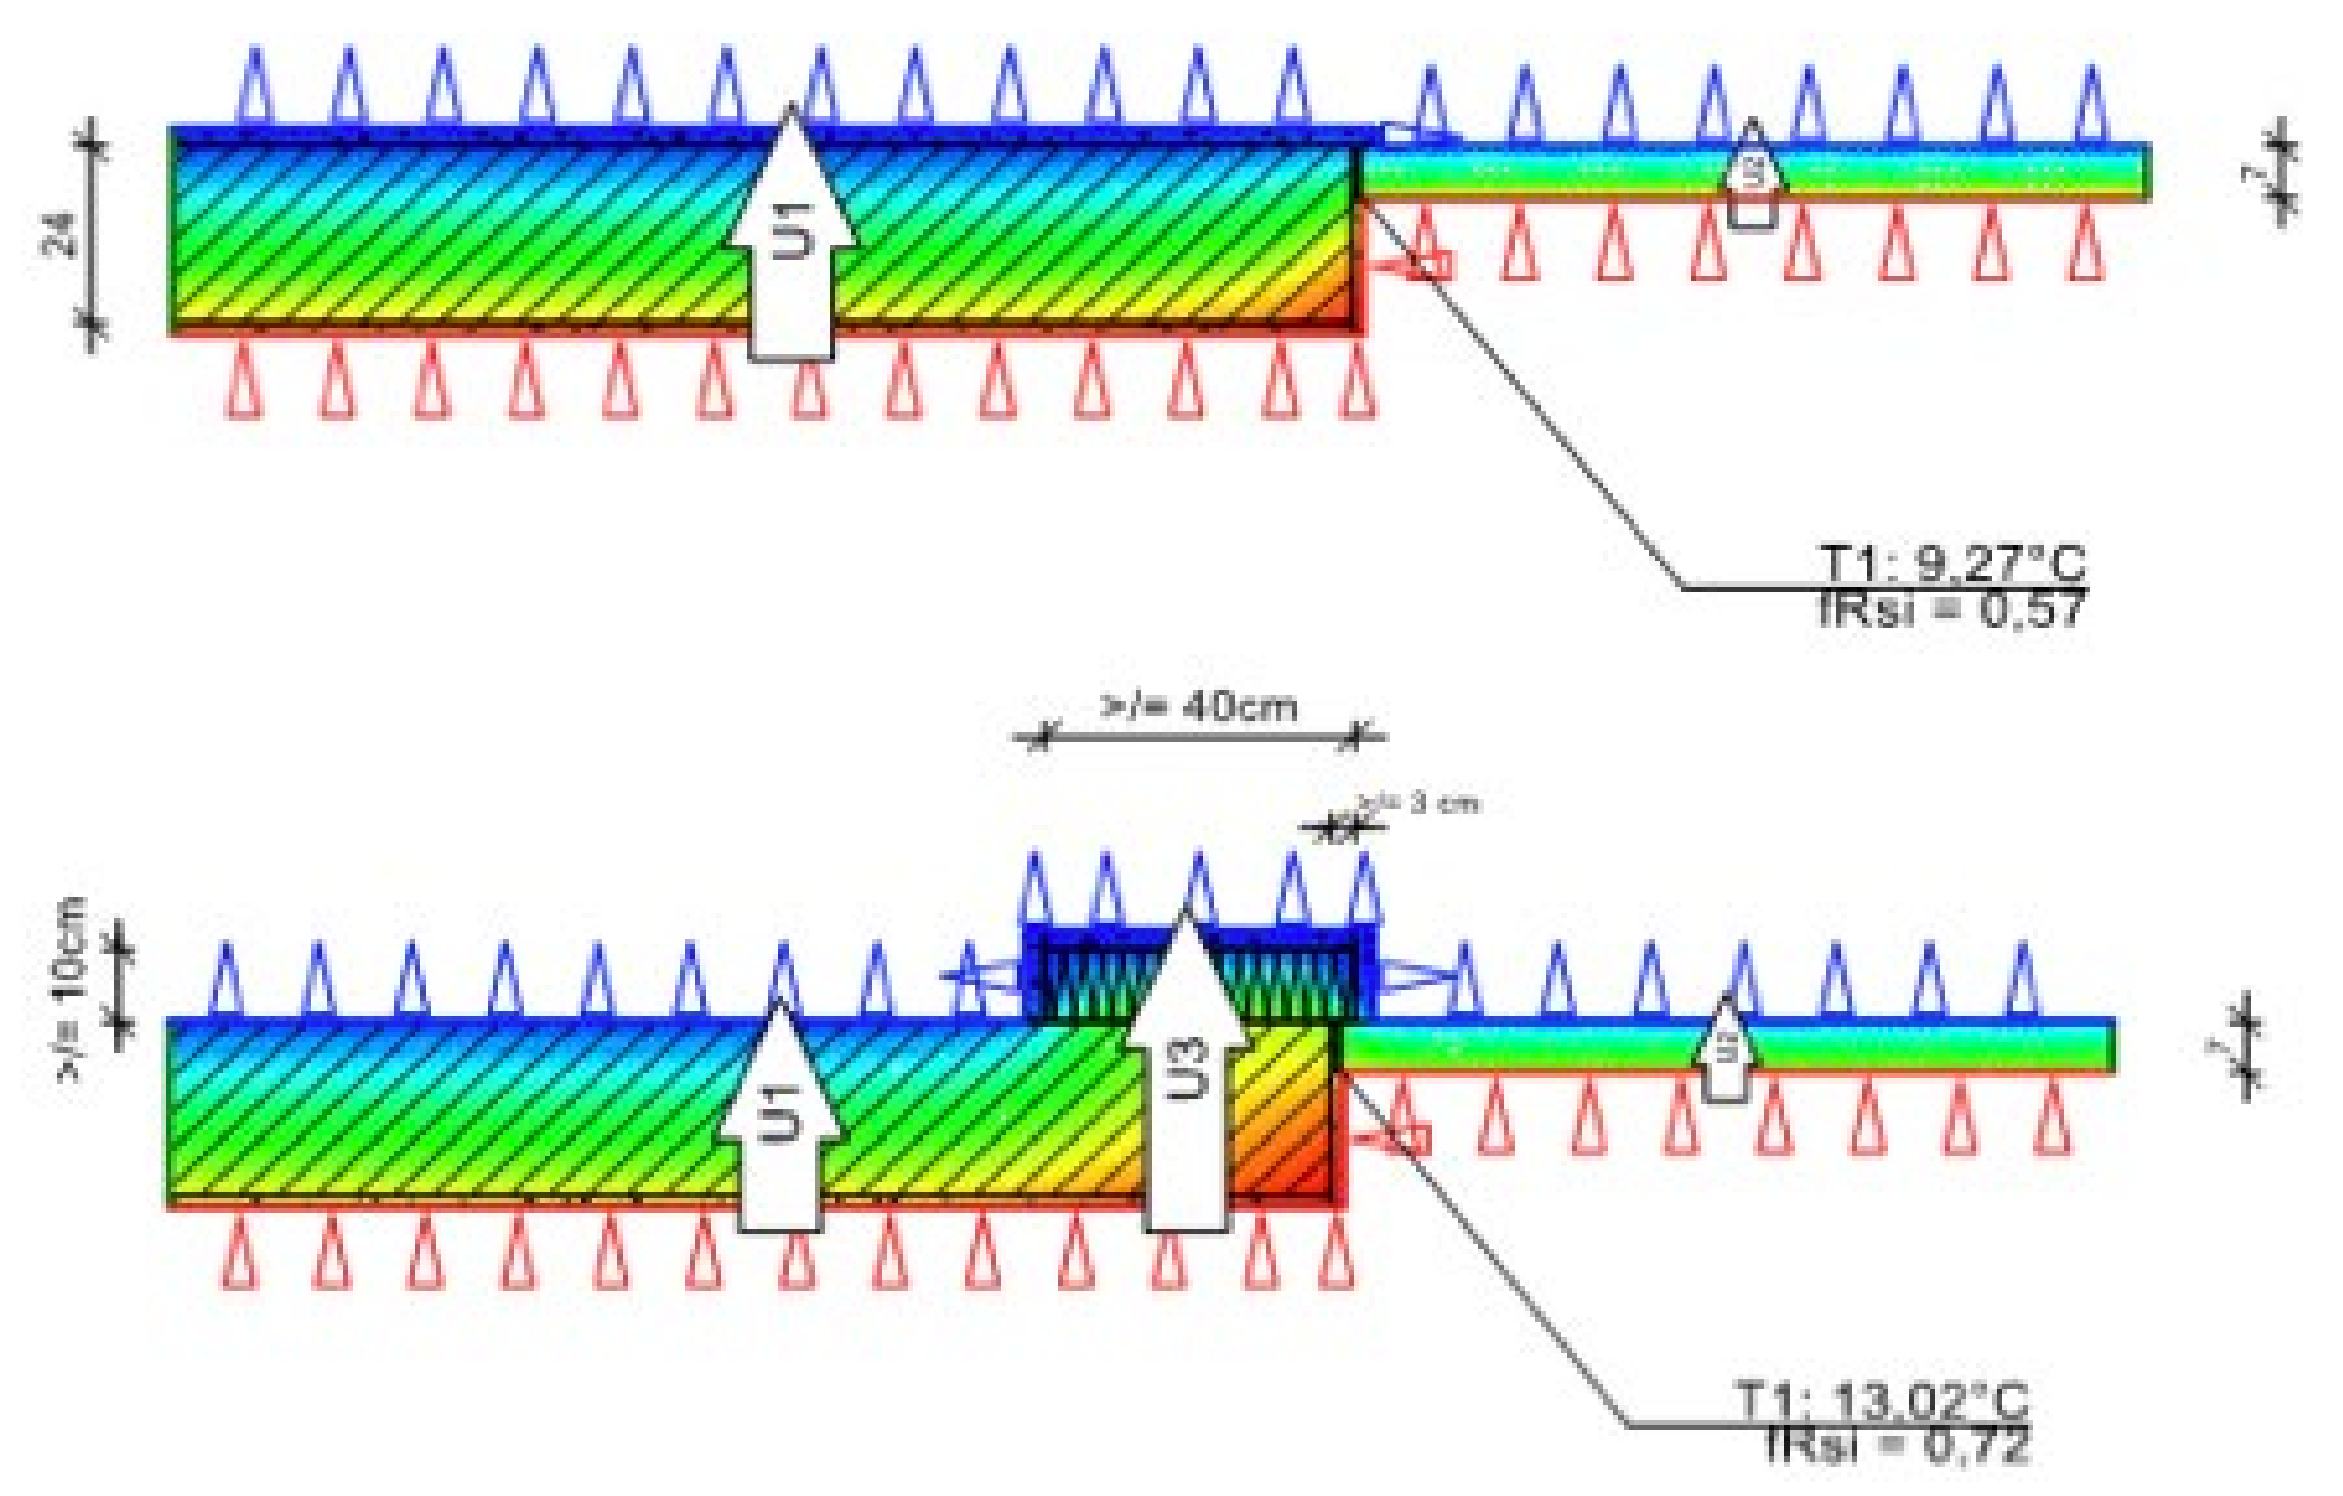
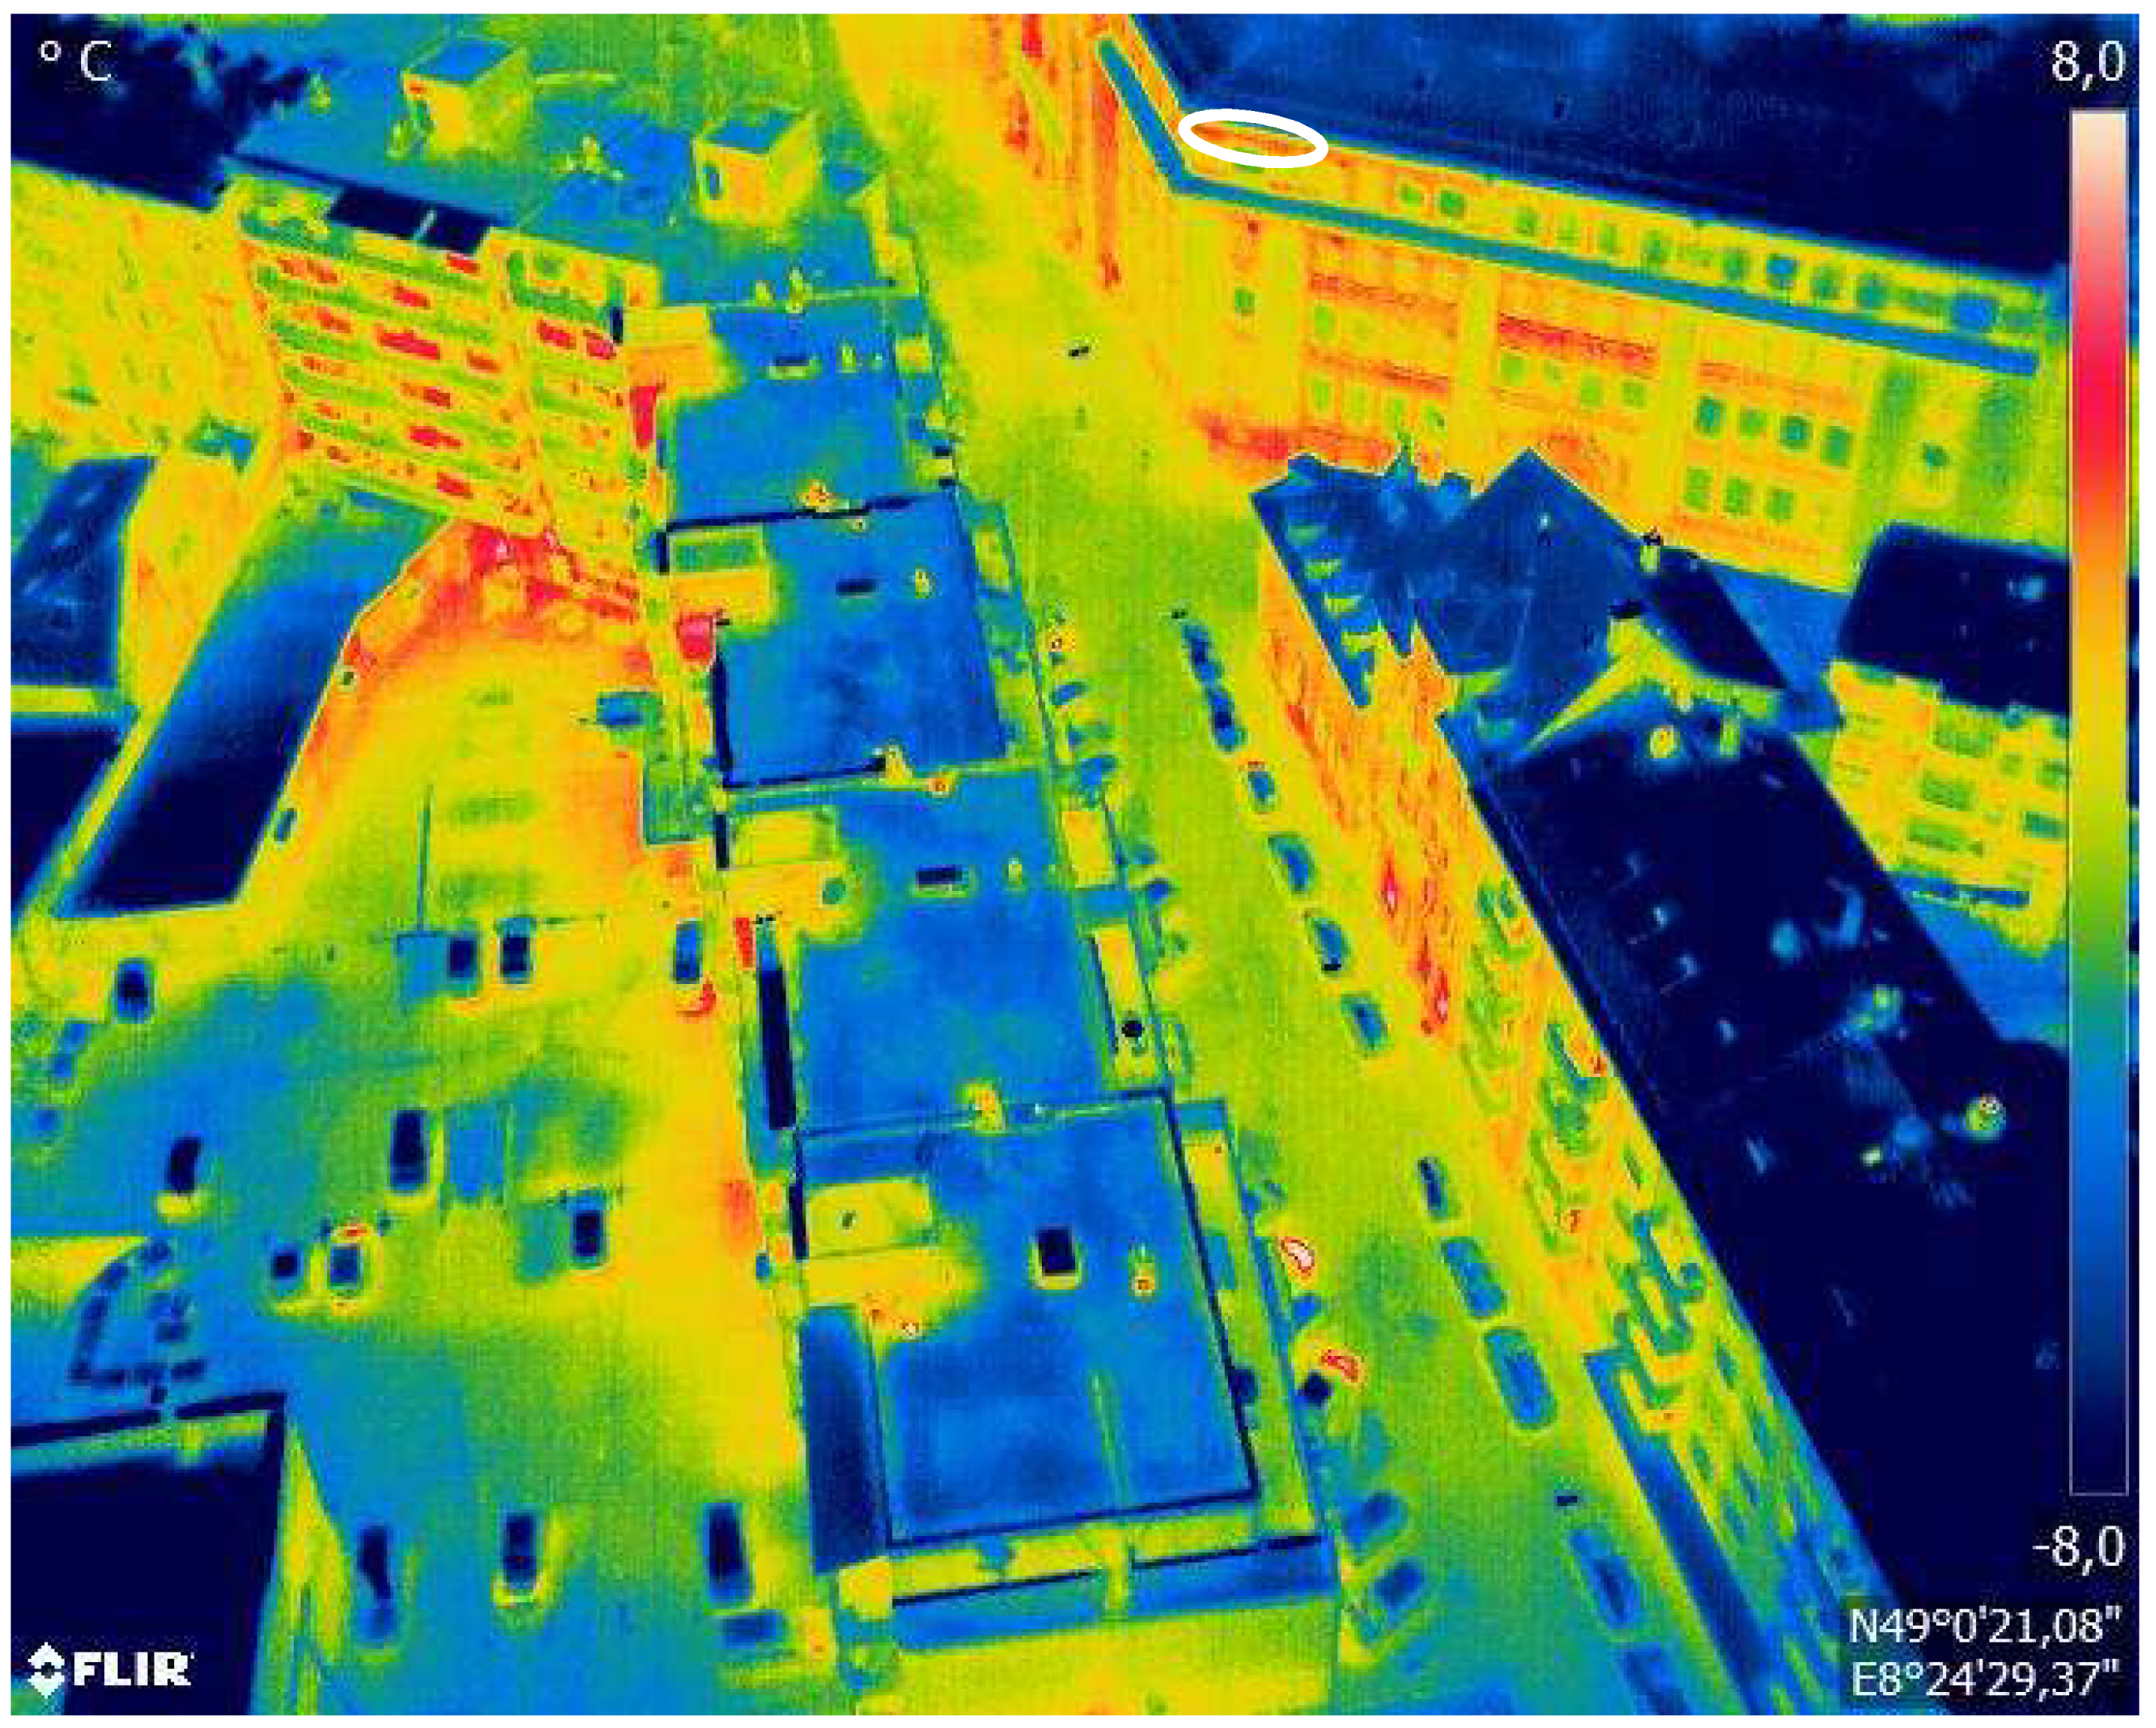
An example of a thermal bridge of a floor slab is presented in Figure A3. For the retrofit of this thermal bridge type, it is necessary to remove a part of the slab and add a layer of thermal insulation material. The thermal insulation compensates for the effect of the different specific thermal conductivities of masonry and reinforced concrete and, thus, reduces the heat loss. A sufficient embedment depth of the thermal insulation is 5 cm and the thermal insulation should be installed over the entire height of the reinforced concrete ceiling of 20 cm. An illustration of this retrofit measure is shown in Figure A4. The costs for the retrofit of this thermal bridge type are listed in Table A6 and the change in the characteristic values of heat loss and mold formation of the building component before and after the retrofit is shown in Table A7.
Figure A3. Example: thermal bridge of a floor slab.
Energies 14 07360 g0a3
Figure A4. Before and after the thermal bridge retrofit of a floor slab (created with ThermCad thermal bridge simulation calculator).
Energies 14 07360 g0a4
Table A6. Retrofit components and costs of the thermal bridge retrofit of a floor slab [38,39].
Pos. No.Retrofit Measure *
Installation Height: 20 cm
Retrofit Costs per Linear Meter
LB 323-2Removing old plaster from the partial area5.20 EUR/m
LB 323-6Removing old plaster base from the wall2.80 EUR/m
LB 313-14Demolishing old floor slab from the partial area23.00 EUR/m
LB 323-68Preparing base for the thermal insulation system0.60 EUR/m
LB 323-96Thermal insulation system up to 20 m, PS 50, bonding technique7.60 EUR/m
LB 323-30Reinforcement fabrics (glass fiber)2.20 EUR/m
LB 323-67Plaster (undercoat and finishing plaster)8.20 EUR/m
Gross total49.60 EUR/m
* In retrofit practice, costs for the scaffold are also relevant.
Table A7. Quantifiable results of the thermal bridge retrofit of a floor slab (ThermCad thermal bridge simulation calculation).
Original State before RetrofitState after RetrofitImprovement
fR,si,0Ψ0q0fR,si,1Ψ1q1ΔΨΔq
(-)(W/mK)(W/m)(-)(W/mK)(W/m)(W/mK)(W/m)
0.550.70105.160.720.0989.900.6115.26
Inside wall
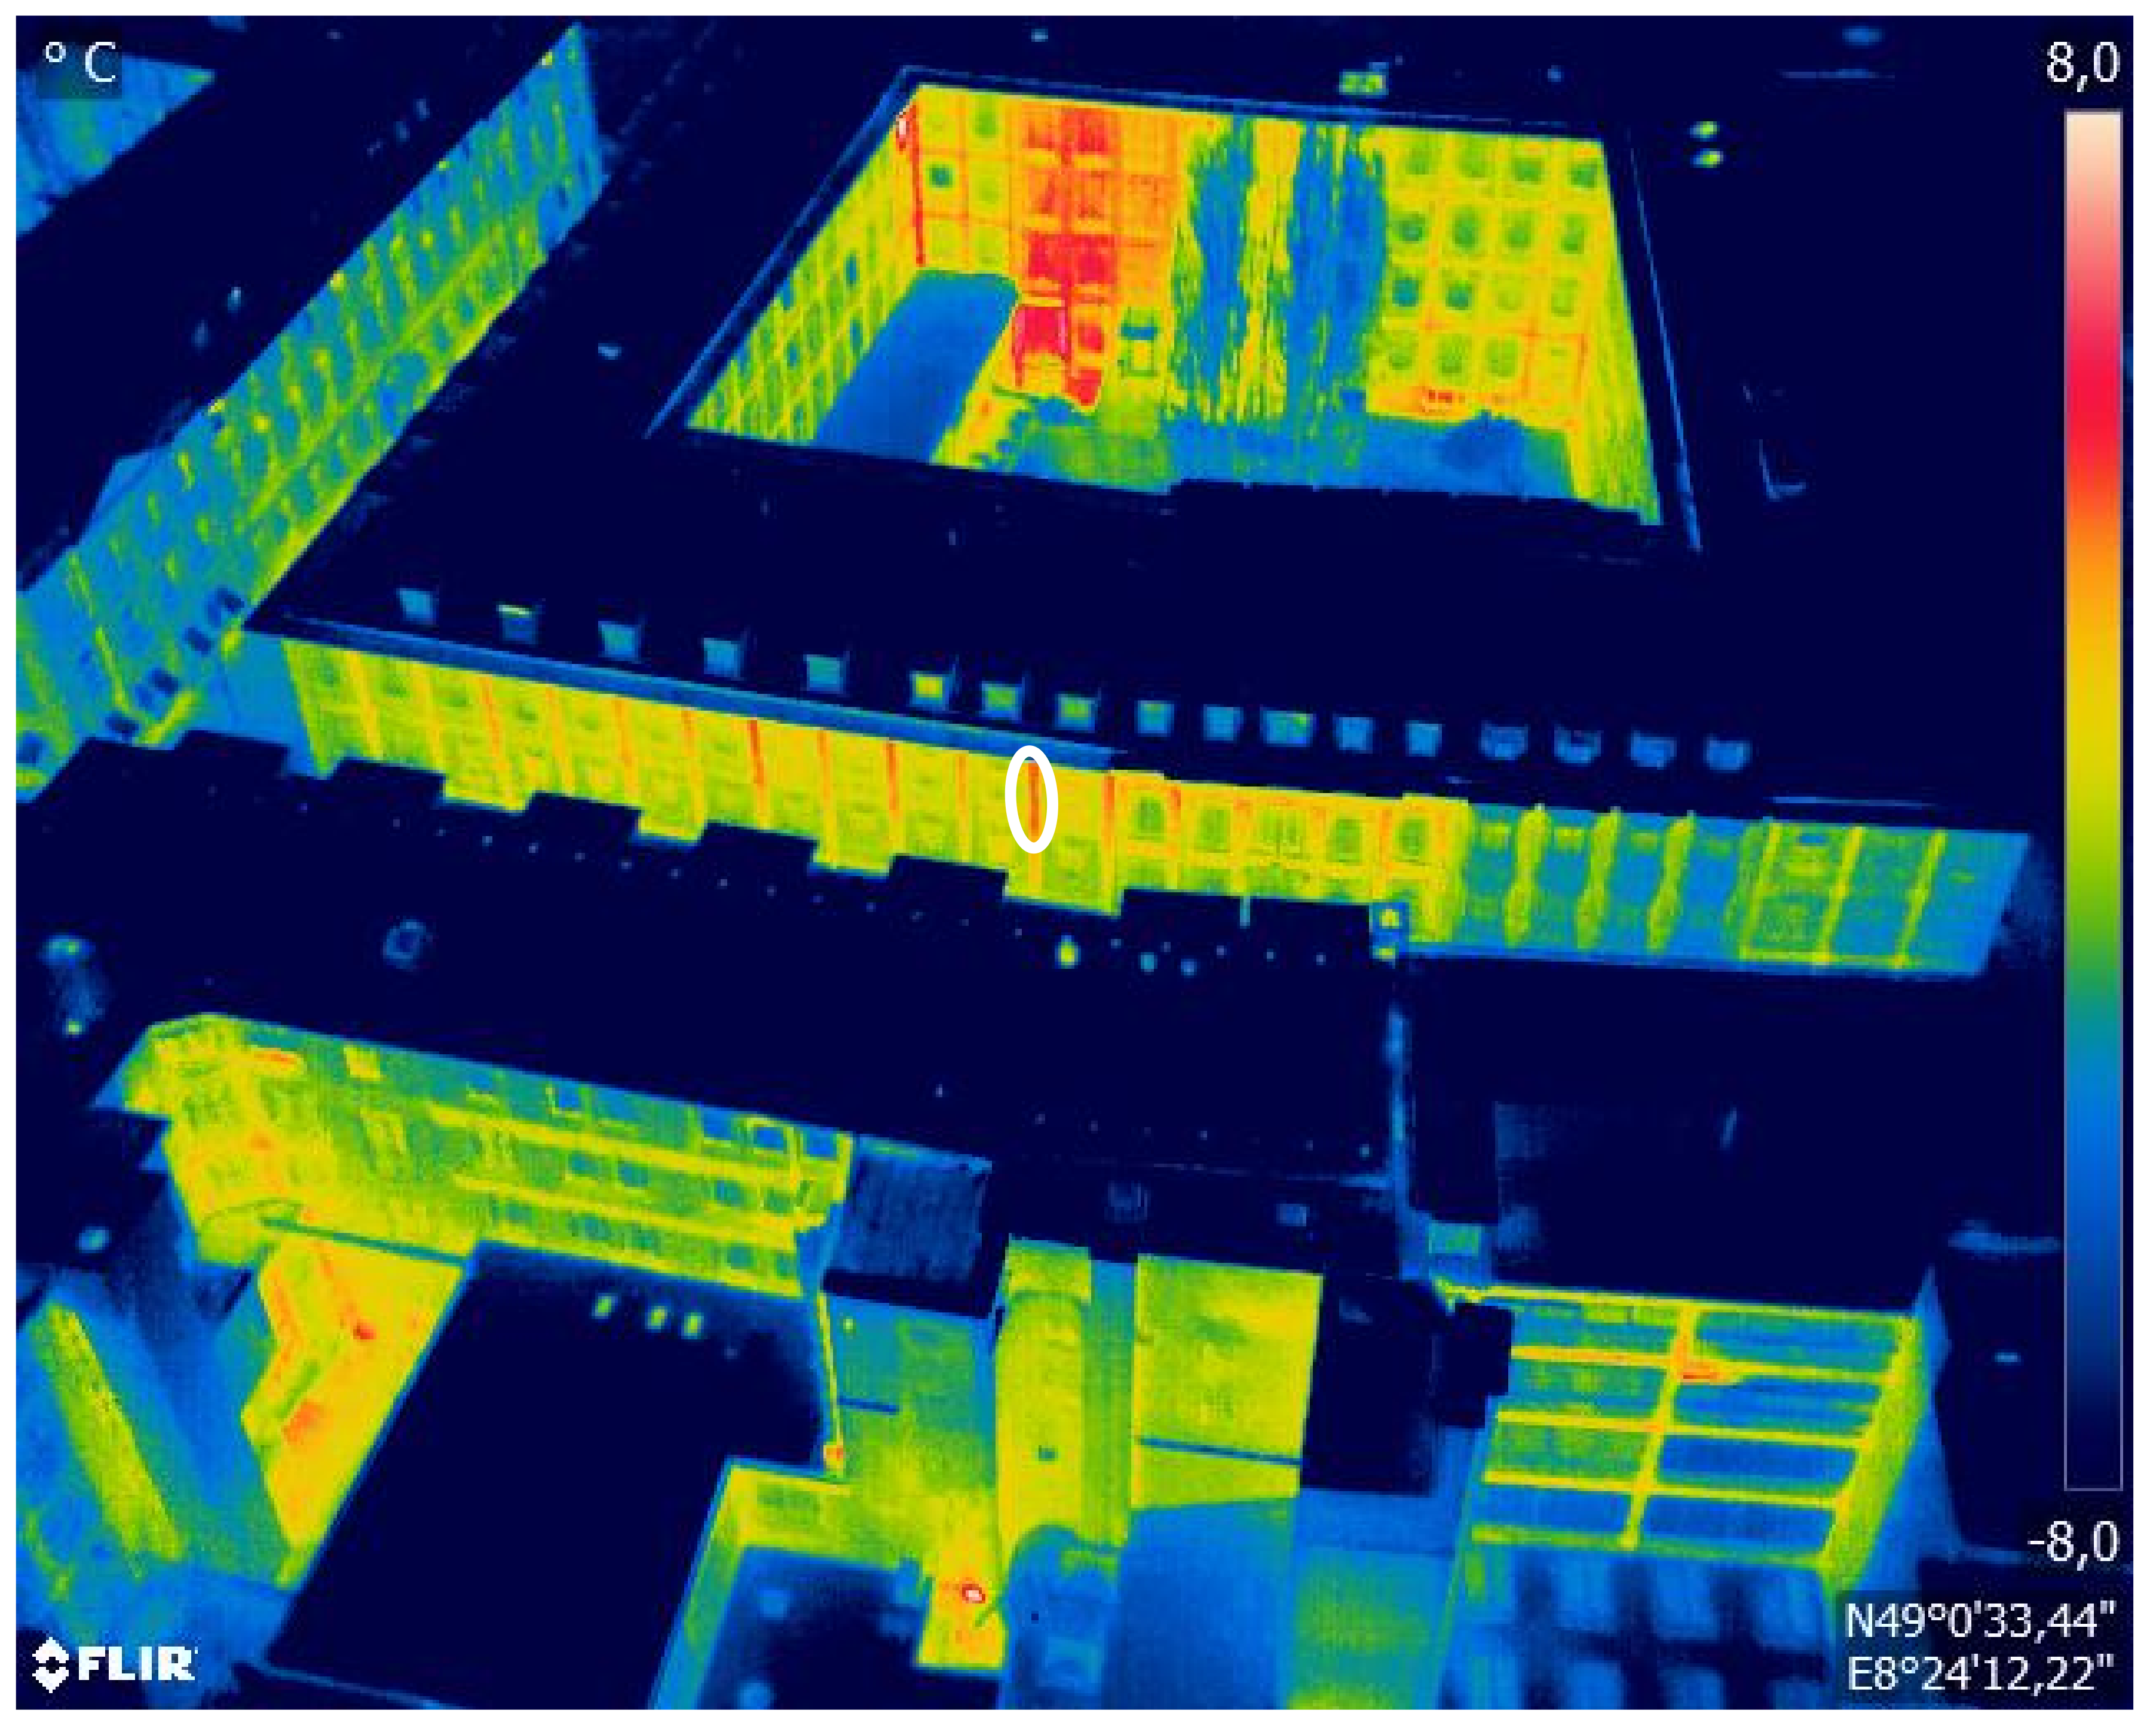
Inside walls are vertical components that transfer loads in the longitudinal direction from the components above. They can be attached directly to the outer wall or integrated into the outer wall. From a thermal point of view, the integration of the inner wall into the outer wall is crucial. The thermal bridge effect occurs due to the structural design of the connection details of the inner wall integration and different cross sectional dimensions. Columns integrated into the outer wall are constructively equivalent to inside walls in the outer wall, so that the results achieved here can also be projected and used for column connections [2].
An example of a thermal bridge of an inside wall/column is presented in 
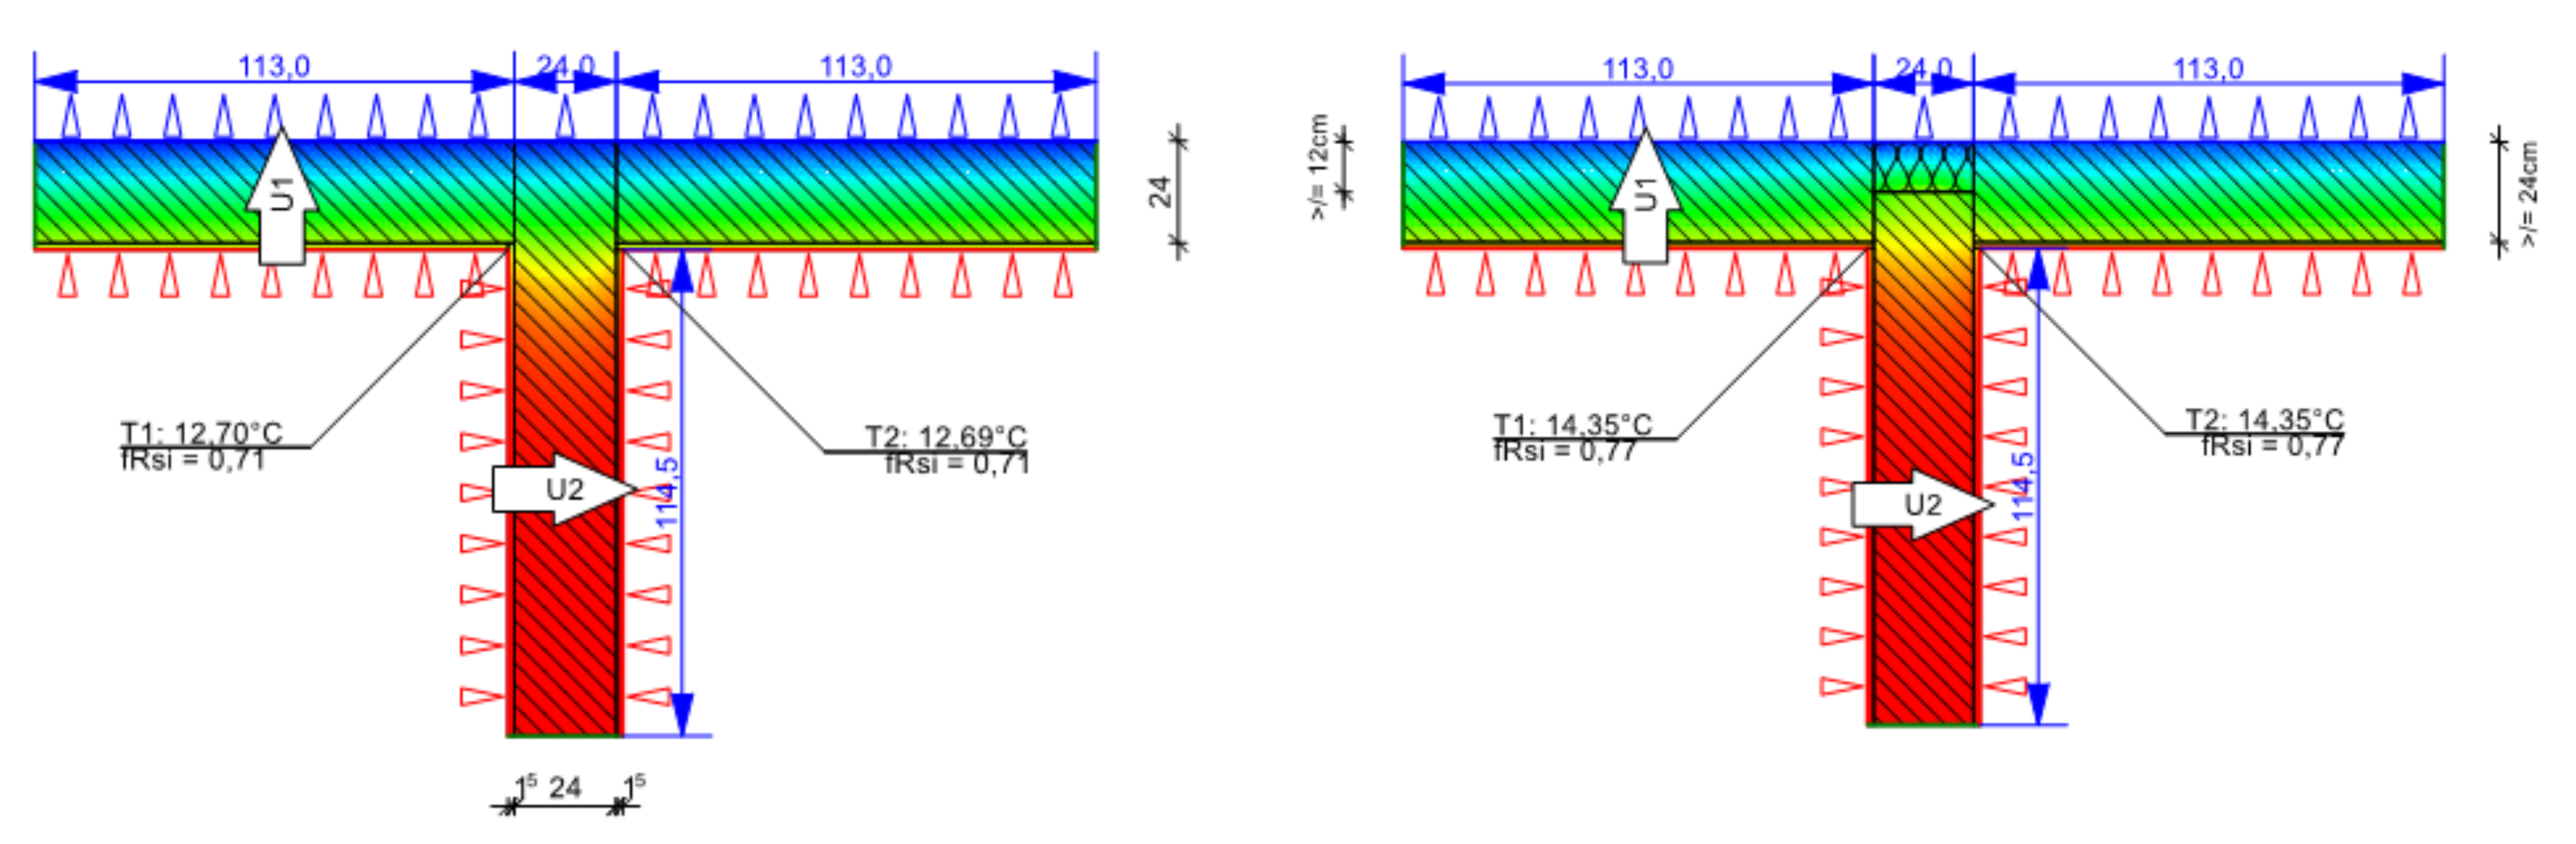
Figure A5. For the retrofit of this thermal bridge type, it is necessary to break off part of the support or the inner wall and to build a recess into which thermal insulation material can be filled. For a professional retrofit, a sufficient embedment depth of the thermal insulation of 12 cm must be ensured, which should be integrated over the entire width of the inner wall embedment of 24 cm. An illustration of this retrofit measure is shown in Figure A6, the costs for the retrofit of this thermal bridge type are listed in Table A8, and the change in the characteristic values of heat loss and mold formation of the building component before and after the retrofit is shown in Table A9.
Figure A5. Example: thermal bridge of an inside wall/column.
Energies 14 07360 g0a5
Figure A6. Before and after the thermal bridge retrofit of an inside wall (created with ThermCad thermal bridge simulation calculator).
Energies 14 07360 g0a6
Table A8. Retrofit components and costs of the thermal bridge retrofit of an inside wall [38,39].
Pos. No.Retrofit Measure *
Installation Height: 24 cm
Retrofit Costs per Linear Meter
LB 323-2Removing old plaster from the partial area6.24 EUR/m
LB 323-6Removing old plaster base from the wall3.36 EUR/m
LB 312-5Demolishing old outer masonry14.57 EUR/m
LB 323-68Preparing base for the thermal insulation system0.72 EUR/m
LB 323-87Thermal insulation system up to 20 m, PS 50, Bondig technique19.92 EUR/m
LB 323-30Reinforcement fabrics (glass fiber)2.64 EUR/m
LB 323-67Plaster (undercoat and finishing plaster)9.84 EUR/m
Gross total57.29 EUR/m
* In retrofit practice costs for scaffold are also relevant.
Table A9. Quantifiable results of the thermal bridge retrofit of an inside wall (ThermCad thermal bridge simulation calculation).
Original State before RetrofitState after RetrofitImprovement
fR,si,0Ψ0q0fR,si,1Ψ1q1ΔΨΔq
(-)(W/mK)(W/m)(-)(W/mK)(W/m)(W/mK)(W/m)
0.710.0586.450.77−0.2381.920.284.52
Connection wall and rooftop
The connection between the outer wall and the rooftop is difficult for the insulation work due to different geometric conditions and changing angles. If the insulation is missing or incorrectly attached, this connection is a thermally weak point of the façade. A thermal bridge can occur due to the structural design of the external wall in the area of the connection to the roof. Due to static requirements, a reinforced concrete ring anchor in the area of the thermal bridge is needed but has a different material compared to the rest of the standard cross-section of the outer wall. There is a significant loss of heat in the area of the ring anchor. This effect is reinforced by the different thermal conductivities of the various materials that are installed in the connection area (usually masonry and reinforced concrete) [51].
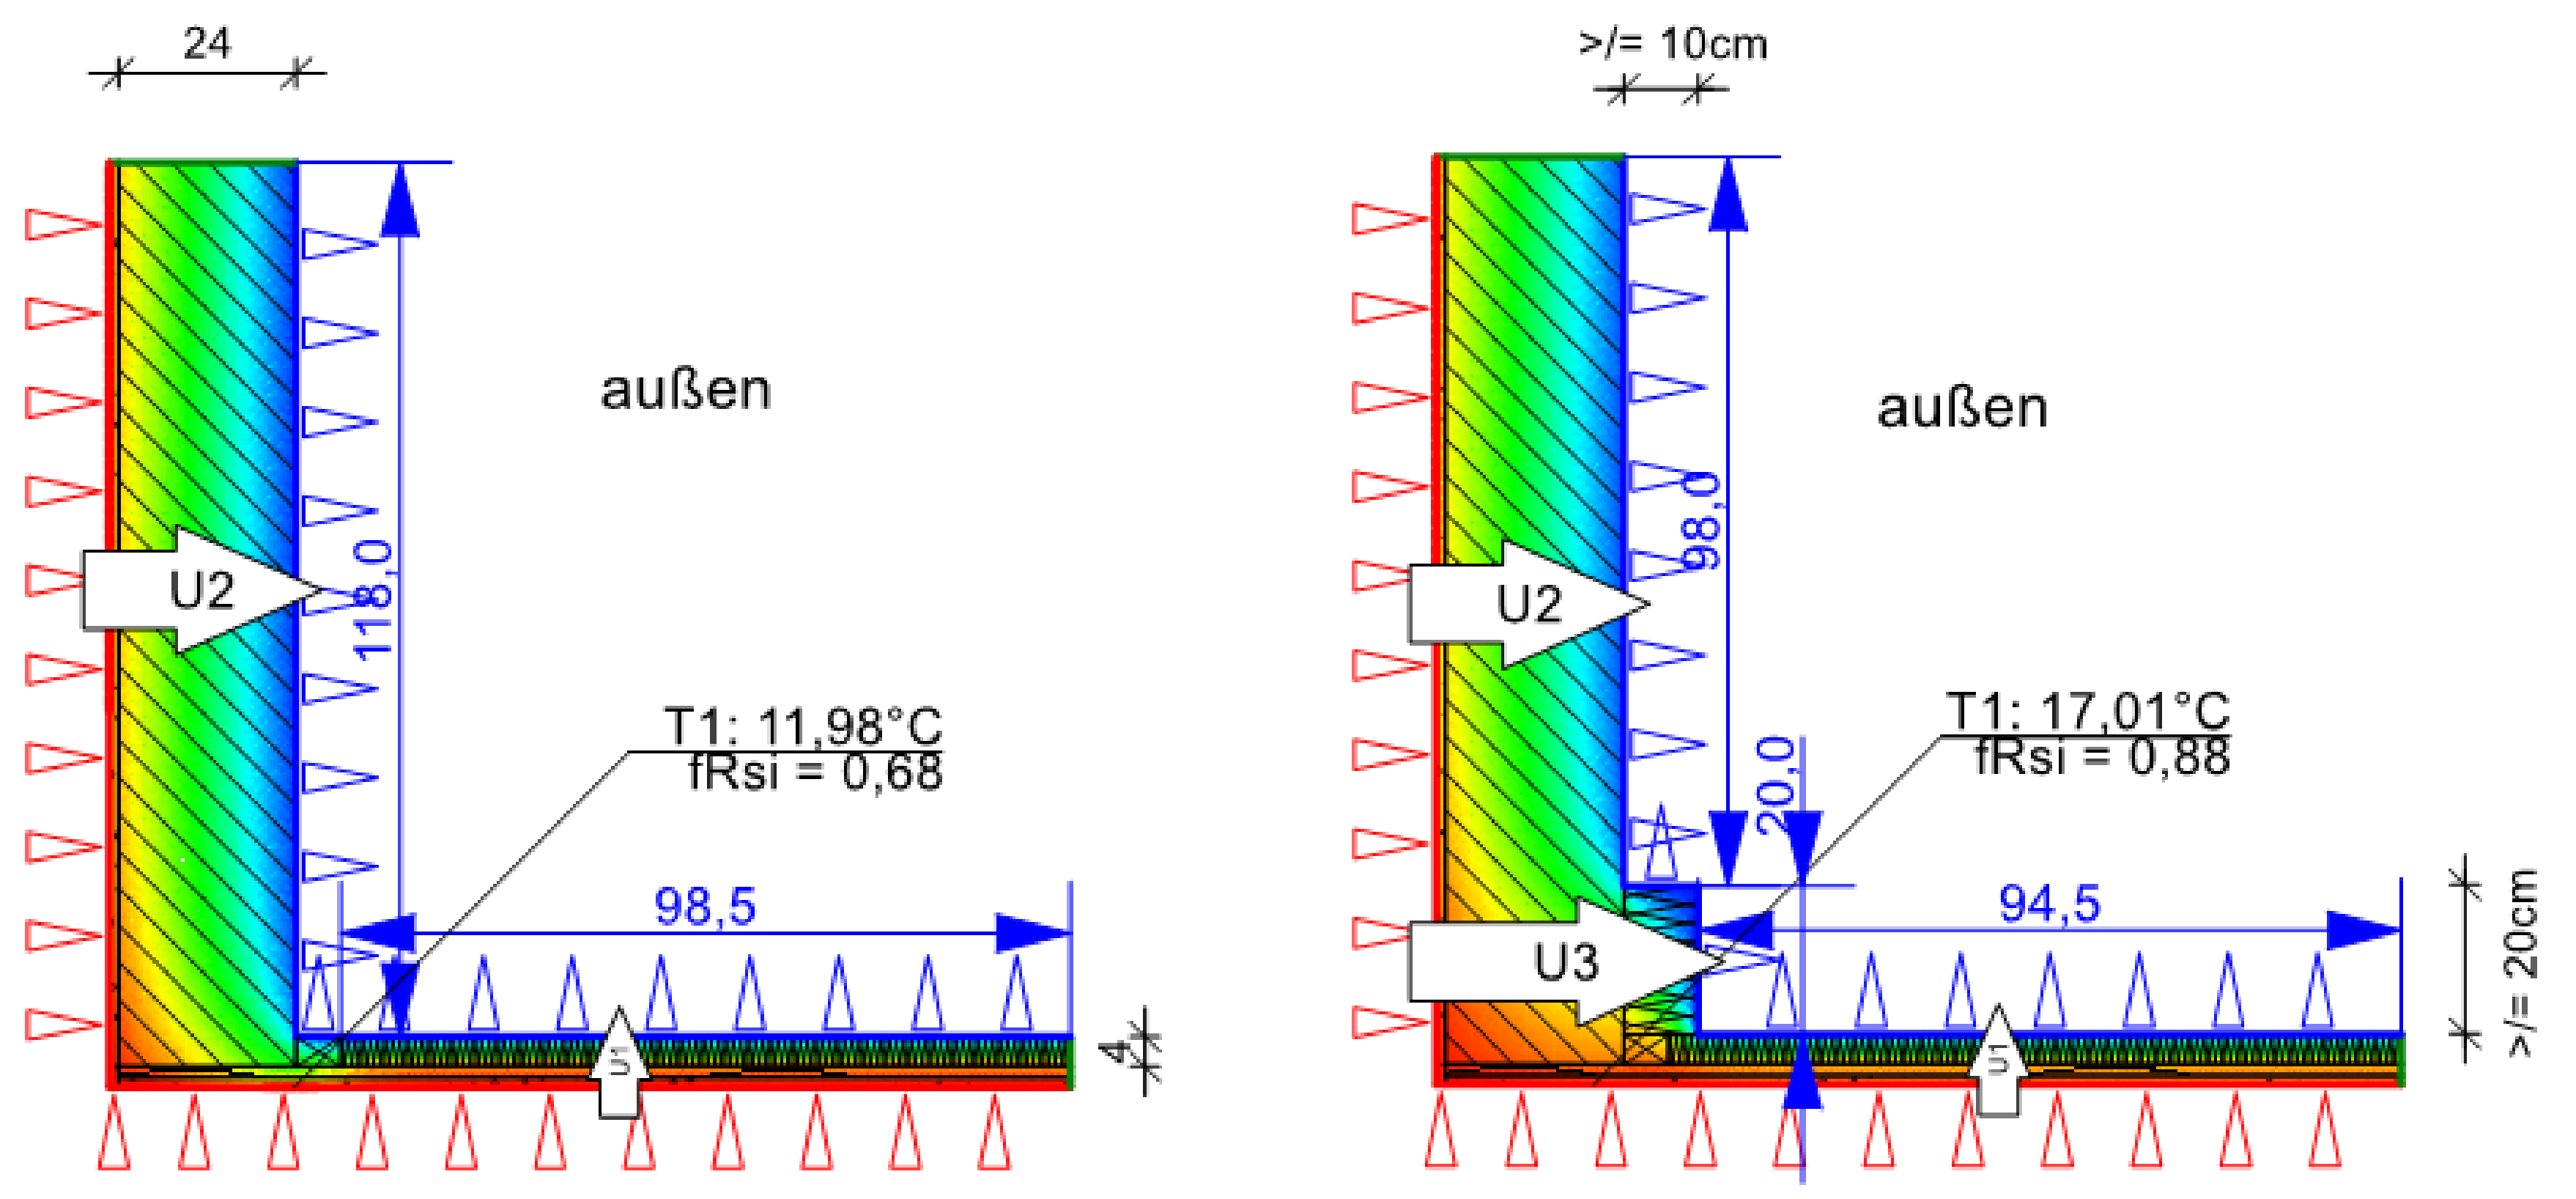
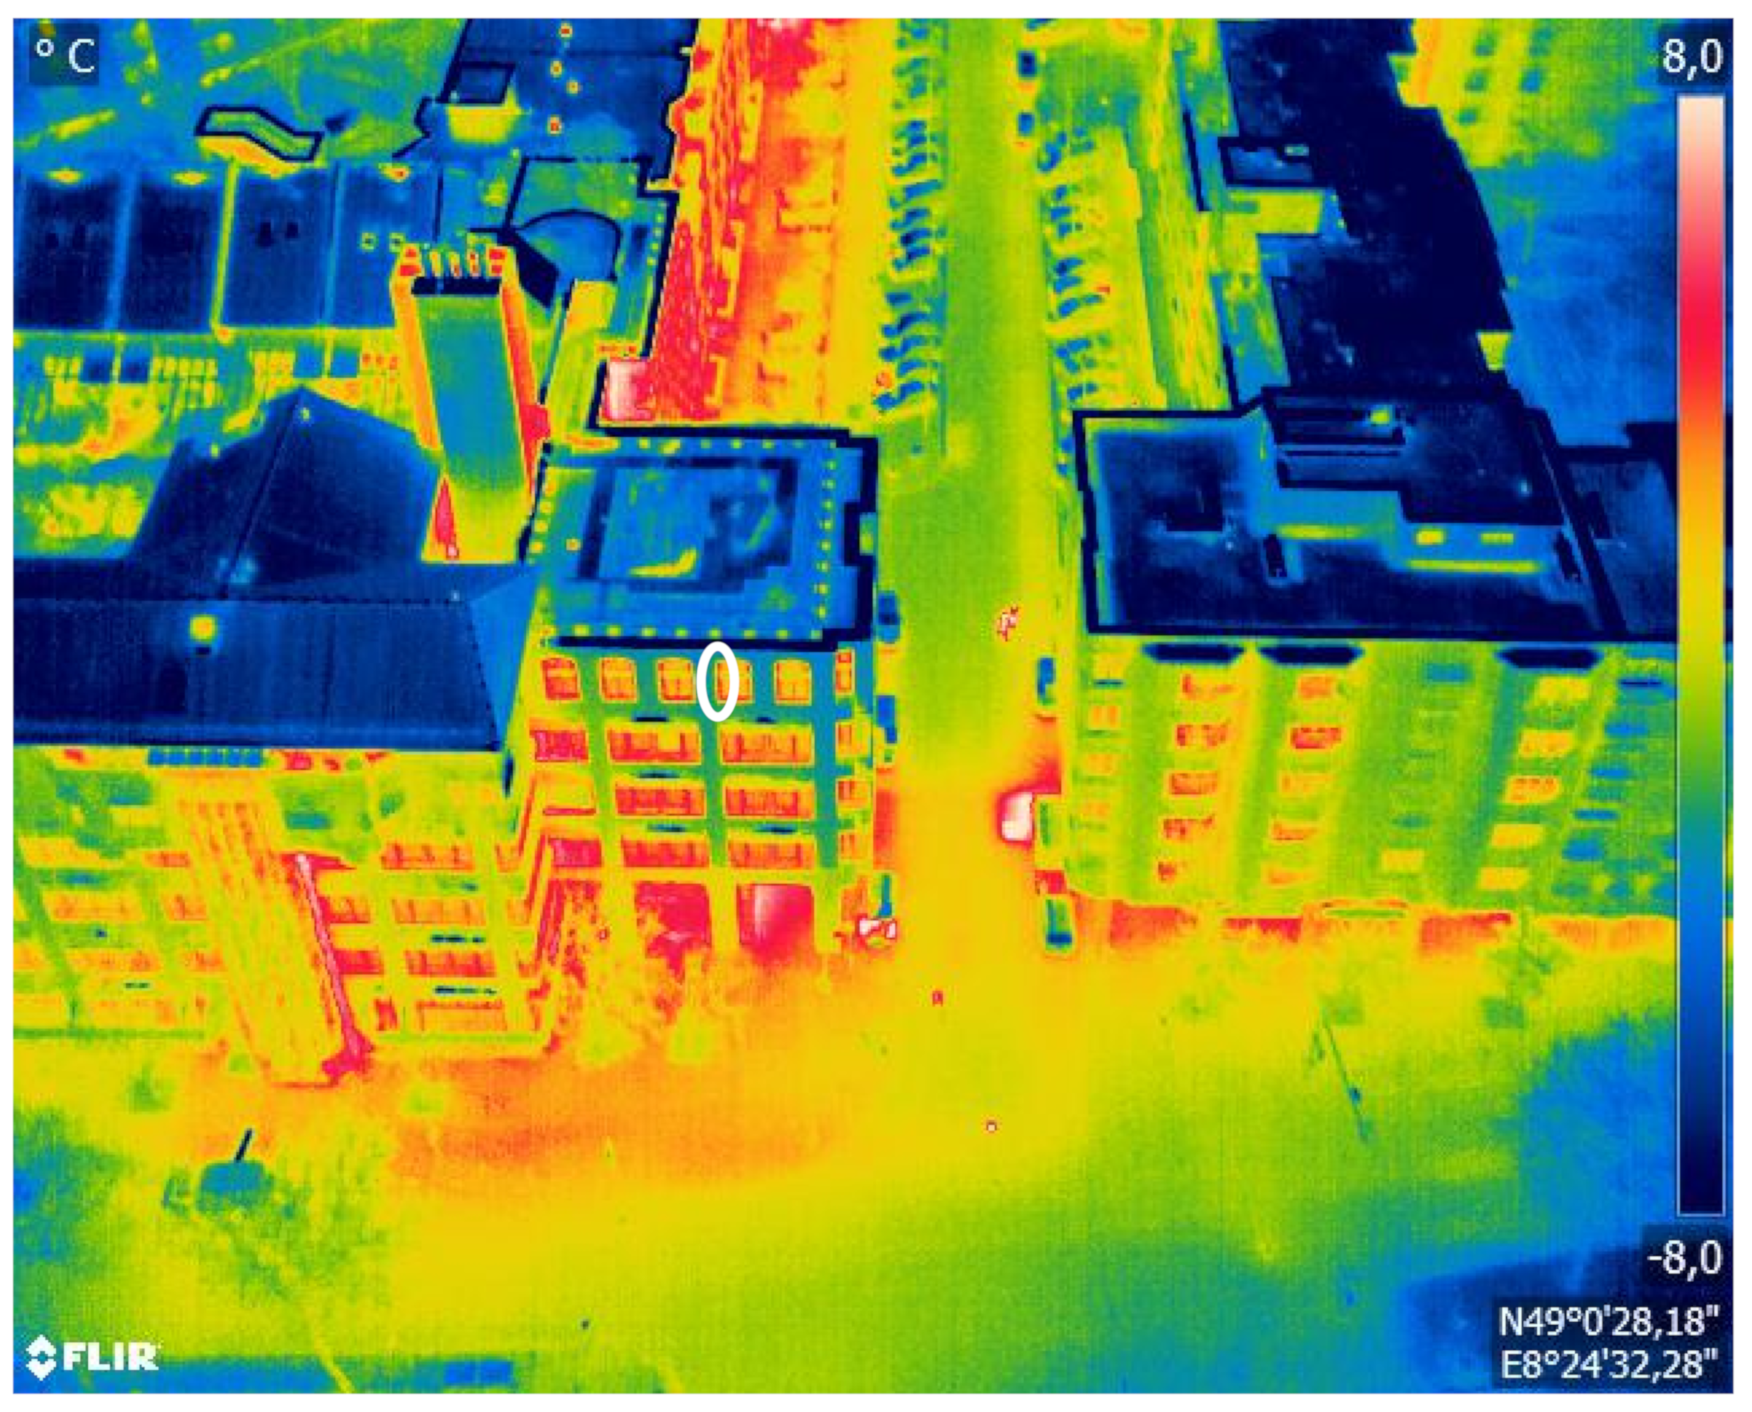
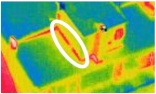
An example for a thermal bridge of a connection between a wall and a rooftop is presented in Figure A7. For the retrofit of this thermal bridge type, it is necessary to apply thermal insulation material in the connection area along the ring anchor. The necessary insulation should be a total of 20 cm high and installed in the direct connection area to the roof. An illustration of this retrofit measure is shown in Figure A8, the costs for the retrofit of this thermal bridge type are listed in Table A10 and the change in the characteristic values heat loss and criterion for mold formation of the building component before and after the retrofit is shown in Table A11.
Figure A7. Example: thermal bridge of a connection between a wall and a rooftop.
Energies 14 07360 g0a7
Figure A8. Before and after scheme of the thermal bridge retrofit of a connection between a wall and a rooftop (created with ThermCad thermal bridge simulation calculator).
Energies 14 07360 g0a8
Table A10. Retrofit components and costs of the thermal bridge retrofit of a connection between a wall and a rooftop [38,39].
Pos. No.Retrofit Measure *
Installation Height: 20 cm
Retrofit Costs per Linear Meter
LB 323-2Removing old plaster from the partial area5.20 EUR/m
LB 323-6Removing old plaster base from the wall2.80 EUR/m
LB 323-68Preparing base for the thermal insulation system0.60 EUR/m
LB 323-86Thermal insulation system up to 20 m, PS 50, bonding technique15.60 EUR/m
LB 323-30Reinforcement fabrics (glass fiber)2.20 EUR/m
LB 323-67Plaster (undercoat and finishing plaster)8.20 EUR/m
Gross total34.60 EUR/m
* In retrofit practice, costs for the scaffold are also relevant.
Table A11. Quantifiable results of the thermal bridge retrofit of a connection between wall and rooftop (ThermCad thermal bridge simulation calculation).
Original State before RetrofitState after RetrofitImprovement
fR,si,0Ψ0q0fR,si,1Ψ1q1ΔΨΔq
(-)(W/mK)(W/m)(-)(W/mK)(W/m)(W/mK)(W/m)
0.680.3266.820.880.1957.750.139.06

Appendix B.2. Thermal Bridge Types of Balconies

Balcony slab
Balconies are outdoor elements and permanently exposed to changing weather conditions. A thermal bridge can occur especially in cantilevered balcony slabs of old reinforced concrete buildings, which are designed as an extension of the story ceiling without thermal decoupling. The cause of the thermal bridge is the structural design of the connection details of the balcony slab and the associated heating of the external components [8].
An example of a thermal bridge of a balcony slab is presented in Figure A9. This type of thermal bridge can only be retrofitted if the existing balcony slab is completely demolished. The thermal bridge can then be removed by inserting an insulating element between the floor slab and the new balcony slab. An illustration of this retrofit measure is shown in Figure A10, the costs of the retrofit of this thermal bridge type are listed in Table A12, and the change in the characteristic values of heat loss and mold formation of the building component before and after the retrofit is shown in Table A13.
Figure A9. Example: thermal bridge of a balcony slab.
Energies 14 07360 g0a9
Figure A10. Before and after the thermal bridge retrofit of a balcony slab (created with ThermCad thermal bridge simulation calculator).
Energies 14 07360 g0a10
Table A12. Retrofit components and costs of the thermal bridge retrofit of a balcony slab [38,39].
Pos. No.Retrofit Measure *
Installation Height: 20 cm
Retrofit Costs per Linear Meter
LB 313-7Demolishing old balcony slab22.00 EUR/m
LB 313-89Cleaning concrete surfaces0.24 EUR/m
LB 013-128Thermal insulation element for the balcony connection4.20 EUR/m
LB 013-84Reinforced concrete prefabricated component, balcony slab45.20 EUR/m
LB 013-65Side rails for the balcony slab4.40 EUR/m
LB 013-61Slab, in-situ concrete, SB2, C25/307.60 EUR/m
Gross total83.64 EUR/m
* In retrofit practice, costs for the scaffold are also relevant.
Table A13. Quantifiable results of the thermal bridge retrofit of a balcony slab (ThermCad thermal bridge simulation calculation).
Original State before RetrofitState after RetrofitImprovement
fR,si,0Ψ0q0fR,si,1Ψ1q1ΔΨΔq
(-)(W/mK)(W/m)(-)(W/mK)(W/m)(W/mK)(W/m)
0.580.44102.960.74−0.0590.870.4812.09

Appendix B.3. Thermal Bridge Types of Windows

Window sill
A window sill is the part of a wall below a window. Thermal bridges in these areas are caused by radiator construction designs. In old buildings, the positioning of radiators directly below a window is usual. This is due to the poor quality of old windows and supposed to prevent drafts caused by convection of cold air. In addition, the heat emissions by the radiator can circulate better on the window than on a wall due to a temperature difference. In order to save space and enable easier installation of the windows, the wall thickness in the area of windows in old buildings is often reduced, which is called “radiator niche” [9].
An example of a thermal bridge of a window sill is presented in Figure A11. For the retrofit of this thermal bridge type, it is necessary to insulate the entire area below a window. For this purpose, thermal insulation material should be installed for compensating for the effect of the different specific thermal conductivities. An illustration of this retrofit measure is shown in Figure A12, the costs of the retrofit of this thermal bridge type are listed in Table A14, and the change in the characteristic values of heat loss and mold formation of the building component before and after the retrofit is shown in Table A15.
Figure A11. Example: thermal bridge of a window sill.
Energies 14 07360 g0a11
Figure A12. Before and after the thermal bridge retrofit of a window sill (created with ThermCad thermal bridge simulation calculator).
Energies 14 07360 g0a12
Table A14. Retrofit components and costs of the thermal bridge retrofit of a window sill [38,39].
Pos. No.Retrofit Measure *
Installation Height: 100 cm
Retrofit Costs per Linear Meter
LB 323-2Removing old plaster from the partial area26.00 EUR/m
LB 323-6Removing old plaster base from the wall14.00 EUR/m
LB 323-68Preparing base for the thermal insulation system3.00 EUR/m
LB 323-86Thermal insulation system up to 20 m, PS 100, bonding technique78.00 EUR/m
LB 323-30Reinforcement fabrics (glass fiber)11.00 EUR/m
LB 323-67Plaster (undercoat and finishing plaster)41.00 EUR/m
Gross total173.00 EUR/m
* In retrofit practice, costs for the scaffold are also relevant.
Table A15. Quantifiable results of the thermal bridge retrofit of a window sill (ThermCad thermal bridge simulation calculation).
Original State before RetrofitState after RetrofitImprovement
fR,si,0Ψ0q0fR,si,1Ψ1q1ΔΨΔq
(-)(W/mK)(W/m)(-)(W/mK)(W/m)(W/mK)(W/m)
0.480.18147.660.920.0883.060.1064.60
Window reveal
Every window has at least one connection joint in the area where the window frame and the outer wall connect. The anchoring of the window frame in the lateral surface of the outer wall can be the cause of a thermal bridge. These so-called window reveals exist both on the inside and on the outside of windows. If the window is not installed within the insulation layer, the side connection joint of the window to the outer wall is exposed. It is important to note that there are two possible vertical thermal bridge areas per window [2].
An example of a thermal bridge of a window reveal is presented in Figure A13. For the retrofit of this thermal bridge type, it is necessary to apply additional thermal insulation material in the connection area of the window reveal. The main purpose of this is to compensate for the effect of the different specific thermal conductivities of masonry and wood/glass. The necessary insulation should be 40 cm long in total and installed in the direct connection area of the window reveal. It is important to ensure that the window frame is insulated by at least 3 cm so that the lateral connection joint between the window and the outside wall is not exposed. An illustration of this retrofit measure is shown in Figure A14, the costs of the retrofit of this thermal bridge type are listed in Table A16, and the change in the characteristic values of heat loss and mold formation of the building component before and after the retrofit is shown in Table A17.
Figure A13. Example: thermal bridge of a window reveal.
Energies 14 07360 g0a13
Figure A14. Before and after the thermal bridge retrofit of a window reveal (created with ThermCad the thermal bridge simulation calculator).
Energies 14 07360 g0a14
Table A16. Retrofit components and costs of the thermal bridge retrofit of a window reveal [38,39].
Pos. No.Retrofit Measure *
Installation Height: 40 cm
Retrofit Costs per Linear Meter
LB 323-2Removing old plaster from the partial area10.40 EUR/m
LB 323-6Removing old plaster base from the wall5.60 EUR/m
LB 323-68Preparing base for the thermal insulation system1.20 EUR/m
LB 323-86Thermal insulation system up to 20 m, PS 100, bonding technique31.20 EUR/m
LB 323-30Reinforcement fabrics (glass fiber)4.40 EUR/m
LB 323-67Plaster (undercoat and finishing plaster)16.40 EUR/m
Gross total69.20 EUR/m
* In retrofit practice, costs for the scaffold are also relevant.
Table A17. Quantifiable results of the thermal bridge retrofit of a window reveal (ThermCad thermal bridge simulation calculation).
Original State before RetrofitState after RetrofitImprovement
fR,si,0Ψ0q0fR,si,1Ψ1q1ΔΨΔq
(-)(W/mK)(W/m)(-)(W/mK)(W/m)(W/mK)(W/m)
0.570.10126.450.72−0.41118.550.517.89
Window lintel
Windows have a horizontal lintel above the corresponding wall opening, which diverts the incoming loads from above to the side of the window. In the area of lintels, different materials are located next to each other. Usually, masonry is used as the outer wall and reinforced concrete as the actual lintel of this construction element. Due to this construction, a thermal bridge can occur on the contact surface [51].
An example of a thermal bridge of a window lintel is presented in Figure A15. For the retrofit of this thermal bridge type, it is necessary to install thermal insulation material along the lintel. This should compensate for the effect of the different specific thermal conductivities of masonry and reinforced concrete. It is important to use thermal insulation with a height of at least 40 cm that should not only cover the lintel, but also the transition to the masonry. It is crucial that the window frame is insulated by at least 3 cm, in analogy to the retrofit of a window reveal. An illustration of this retrofit measure is shown in Figure A16, the costs of the retrofit of this thermal bridge type are listed in Table A18, and the change in the characteristic values of heat loss and mold formation of the building component before and after the retrofit is shown in Table A19.
Figure A15. Example: thermal bridge of a window lintel.
Energies 14 07360 g0a15
Figure A16. Before and after the thermal bridge retrofit of a window lintel (created with ThermCad thermal bridge simulation calculator).
Energies 14 07360 g0a16
Table A18. Retrofit components and costs of the thermal bridge retrofit of a window lintel [38,39].
Pos. No.Retrofit Measure *
Installation Height: 40 cm
Retrofit Costs per Linear Meter
LB 323-2Removing old plaster from the partial area10.40 EUR/m
LB 323-6Removing old plaster base from the wall5.60 EUR/m
LB 323-68Preparing base for the thermal insulation system1.20 EUR/m
LB 323-86Thermal insulation system up to 20 m, PS 100, bonding technique31.20 EUR/m
LB 323-30Reinforcement fabrics (glass fiber)4.40 EUR/m
LB 323-67Plaster (undercoat and finishing plaster)16.40 EUR/m
Gross total69.20 EUR/m
* In retrofit practice, also costs for the scaffold are relevant.
Table A19. Quantifiable results of the thermal bridge retrofit of a window lintel (ThermCad thermal bridge simulation calculation).
Original State before RetrofitState after RetrofitImprovement
fR,si,0Ψ0q0fR,si,1Ψ1q1ΔΨΔq
(-)(W/mK)(W/m)(-)(W/mK)(W/m)(W/mK)(W/m)
0.420.77142.300.74−0.34117.601.1124.70
Roller shutter casing
In most existing buildings, the roller shutter casing is integrated into the outer wall. In this area of the façade, the outer wall has a significantly smaller cross section than the remaining almost homogeneous outer wall. In addition, the insulating effect of the façade is reduced by the roller shutter casing. Due to different materials, this thermal bridge is reinforced by different specific thermal conductivities. The thermal bridge effect is most intense when the roller shutters are down, as then there is an air-filled space within the façade [51].
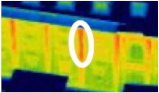
An example of a thermal bridge of a roller shutter casing is presented in Figure A17. For the retrofit of this thermal bridge type, it is necessary to add additional thermal insulation material to the roller shutter casing. The insulation is used to compensate for the effect of the different specific thermal conductivities of the roller shutter box and the outer wall and to reduce heat loss. This measure can be carried out very quickly and easily without removing the roller shutter. The insulation material can be pushed into the roller shutter box from the inside, with a length of about 80 cm being required. It is important to choose the insulation thickness such that the roller shutter can still be moved after the retrofit. An illustration of this retrofit measure is shown in Figure A18, the costs of the retrofit of this thermal bridge type are listed in Table A20, and the change in the characteristic values of heat loss and mold formation of the building component before and after the retrofit is shown in Table A21.
Figure A17. Example: thermal bridge of a roller shutter casing.
Energies 14 07360 g0a17
Figure A18. Before and after the thermal bridge retrofit of a roller shutter casing (created with ThermCad thermal bridge simulation calculator).
Energies 14 07360 g0a18
Table A20. Retrofit components and costs of the thermal bridge retrofit of a roller shutter casing [38,39].
Pos. No.Retrofit Measure *
Installation Height: 80 cm
Retrofit Costs per Linear Meter
LB 330-7Insulating roller shutter casing60.00 EUR/m
Gross total60.00 EUR/m
* In retrofit practice, a check for possible moisture problems and the need of a base seal is also relevant.
Table A21. Quantifiable results of the thermal bridge retrofit of a roller shutter casing (ThermCad thermal bridge simulation calculation).
Original State before RetrofitState after RetrofitImprovement
fR,si,0Ψ0q0fR,si,1Ψ1q1ΔΨΔq
(-)(W/mK)(W/m)(-)(W/mK)(W/m)(W/mK)(W/m)
0.700.11121.940.85−0.24113.140.358.80

Appendix B.4. Thermal Bridge Types of Rooftops

Flat roof: Attic
An attic is an extension of the actual flat roof. The connection between a flat roof and an attic leads to geometric changes and can cause a thermal bridge. The connection area warms disproportionately more compared to the standard cross section, so that a significant heat loss occurs. This thermal bridge effect is reinforced by different materials used for the attic and roof surfaces [51].
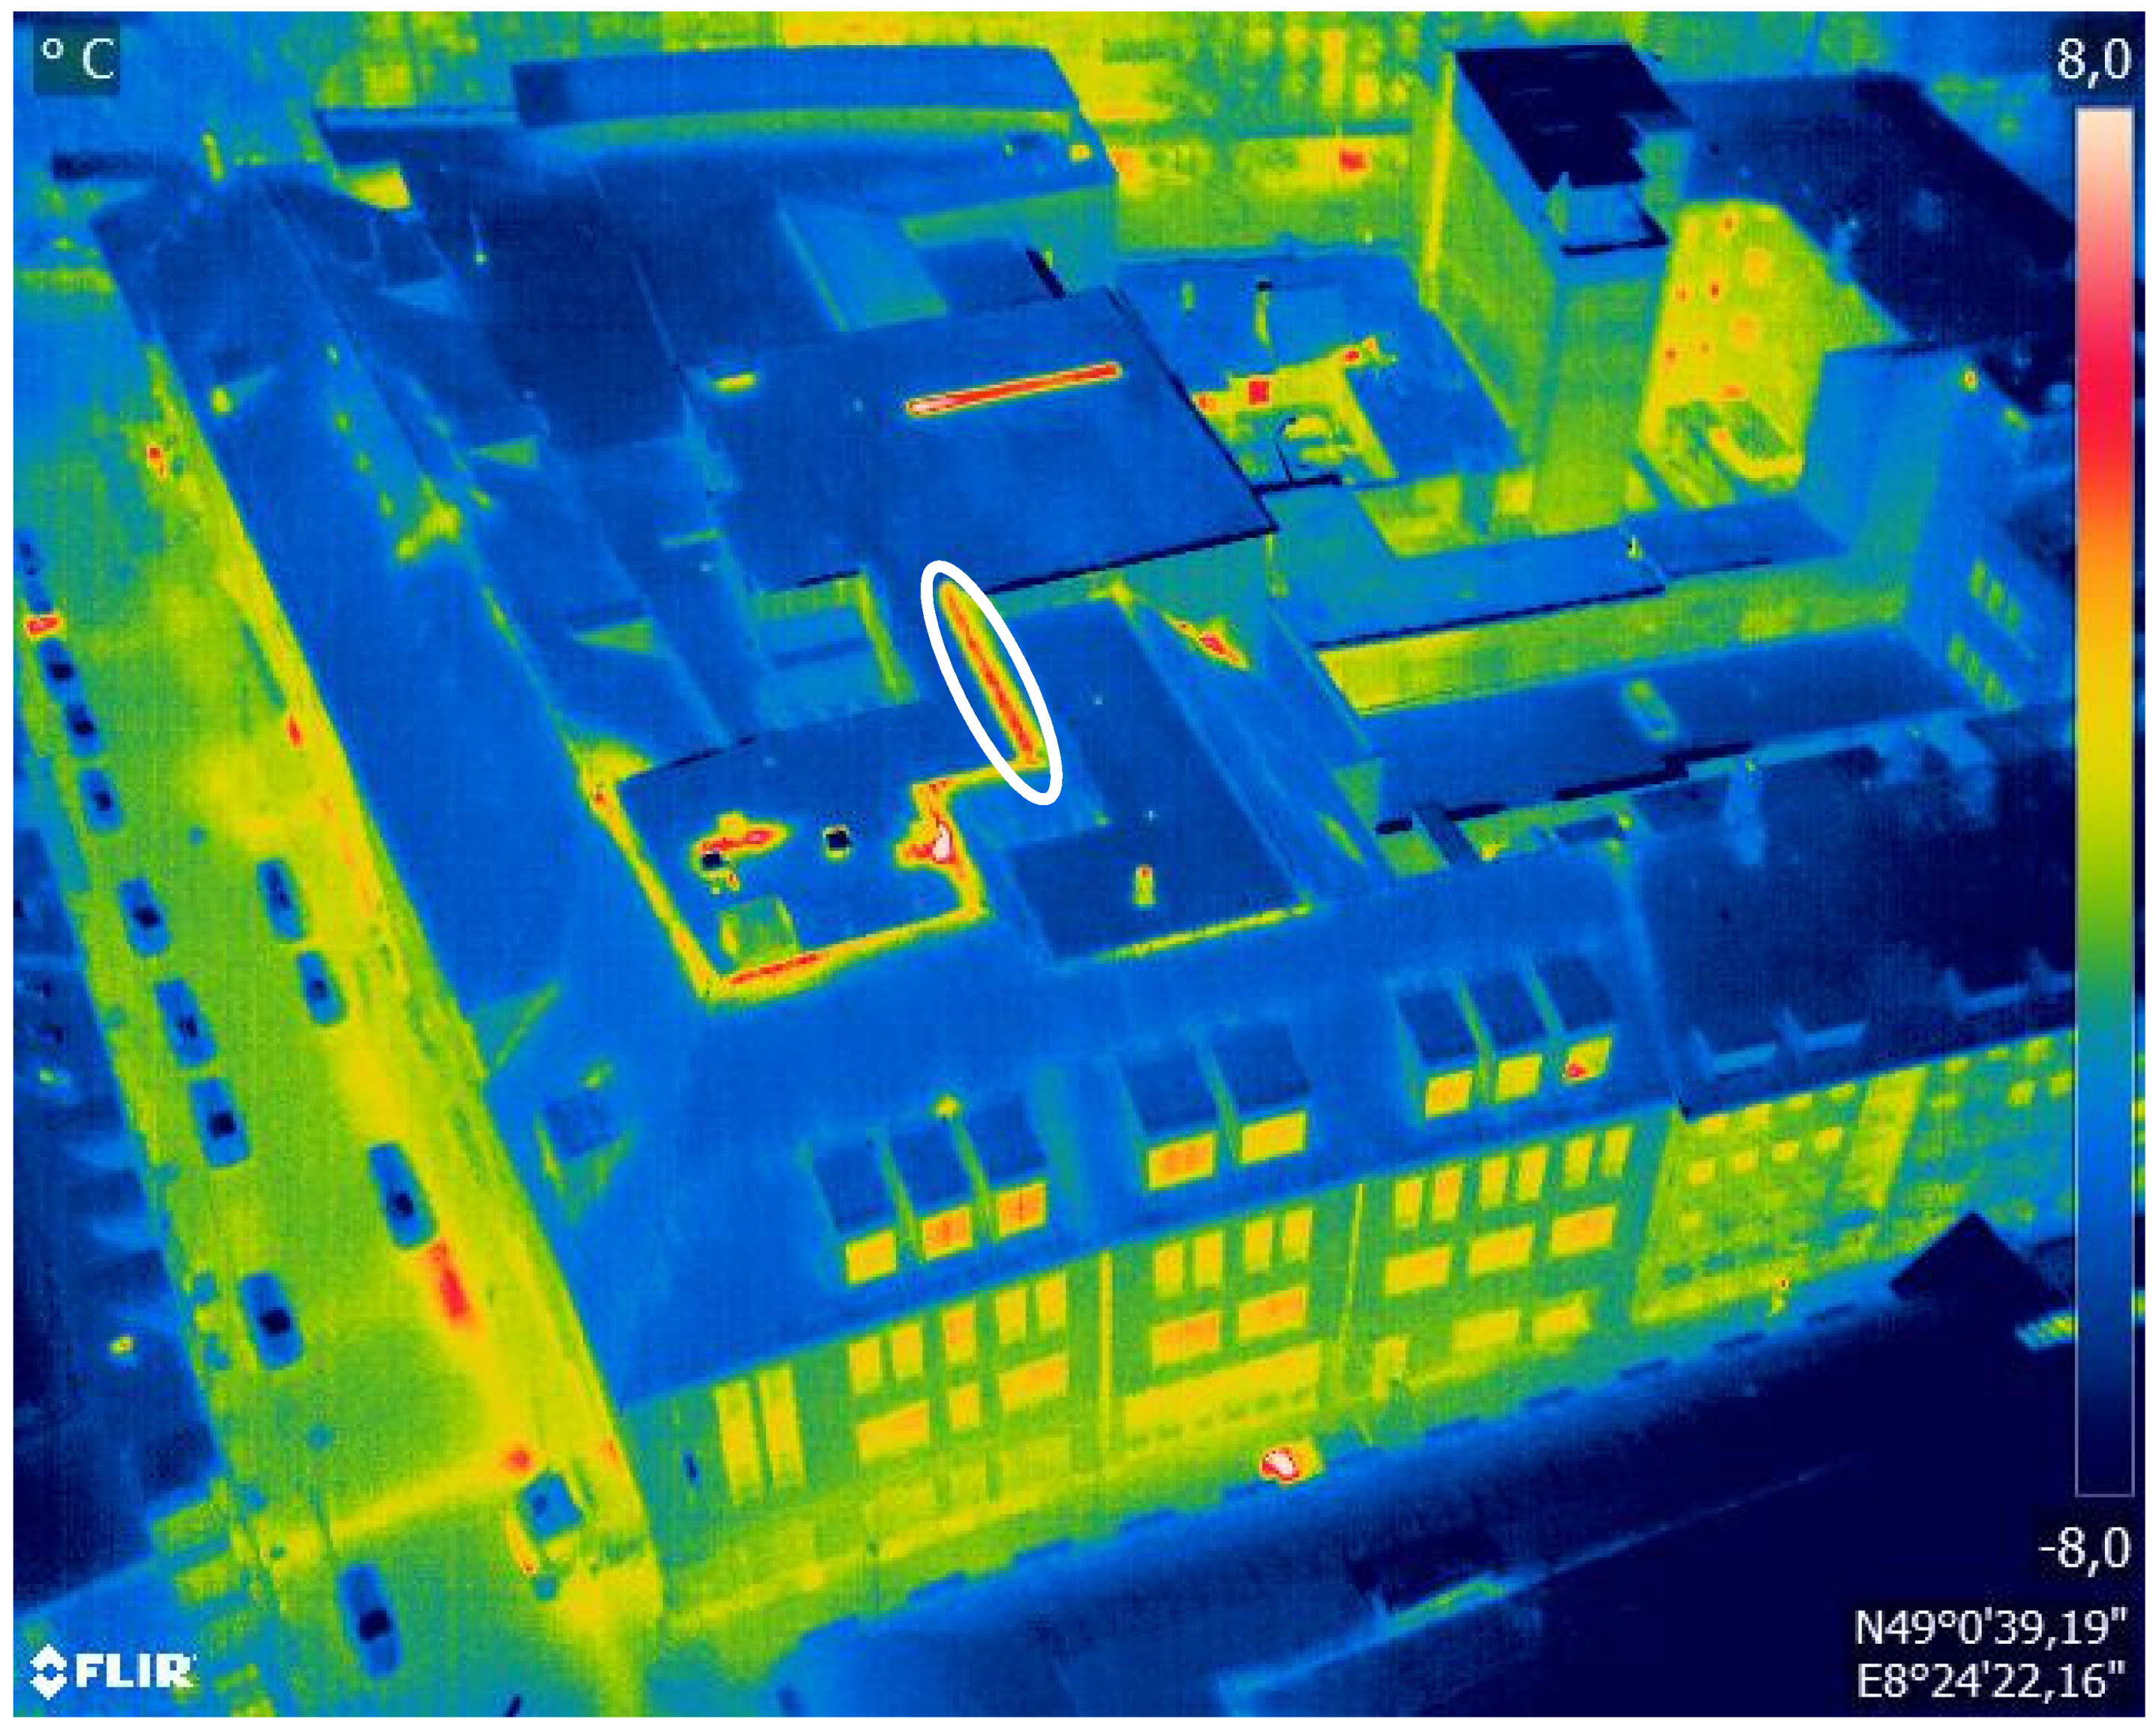
An example of a thermal bridge of an attic is presented in Figure A19. For the retrofit of this thermal bridge type, it is necessary to completely cover the attic with thermal insulation material. This compensates for the effect of the different specific thermal conductivities and minimizes the heat loss and other negative effects of the thermal bridge. For a retrofit, the thermal insulation material must be introduced directly above the roof insulation and run around the entire attic. It is important that the insulation on the façade side is attached up to at least 50 cm below the upper edge of the reinforced concrete ceiling. An illustration of this retrofit measure is shown in Figure A20, the costs of the retrofit of this thermal bridge type are listed in Table A22, and the change in the characteristic values of heat loss and mold formation of the building component before and after the retrofit is shown in Table A23.
Figure A19. Example: thermal bridge of an attic.
Energies 14 07360 g0a19
Figure A20. Before and after the thermal bridge retrofit of an attic (created with ThermCad thermal bridge simulation calculator).
Energies 14 07360 g0a20
Table A22. Retrofit components and costs of the thermal bridge retrofit of an attic [38,39].
Pos. No.Retrofit Measure *
Installation Height: 162 cm
Retrofit Costs per Linear Meter
LB 323-2Removing old plaster from the partial area42.12 EUR/m
LB 323-6Removing old plaster base from the wall22.68 EUR/m
LB 323-68Preparing base for the thermal insulation system4.86 EUR/m
LB 323-86Thermal insulation system up to 20 m, PS 100, bonding technique126.36 EUR/m
LB 323-30Reinforcement fabrics (glass fiber)17.82 EUR/m
LB 323-67Plaster (undercoat and finishing plaster)66.42 EUR/m
Gross total280.26 EUR/m
* In retrofit practice, the bitumen waterproofing is replaced, if necessary, to prevent moisture problems.
Table A23. Quantifiable results of the thermal bridge retrofit of an attic (ThermCad thermal bridge simulation calculation).
Original State before RetrofitState after RetrofitImprovement
fR,si,0Ψ0q0fR,si,1Ψ1q1ΔΨΔq
(-)(W/mK)(W/m)(-)(W/mK)(W/m)(W/mK)(W/m)
0.480.25106.930.73−0.7382.040.9924.89
Flat roof: Staggered story
A staggered story is an additional top story set back from the outer walls of the building. A thermal bridge can occur at the connection between a flat roof and a staggered story, if the insulation in this area is missing or incorrectly applied. The thermal bridge effect can be reinforced by the different materials used for the staggered story and the roof surface [51].
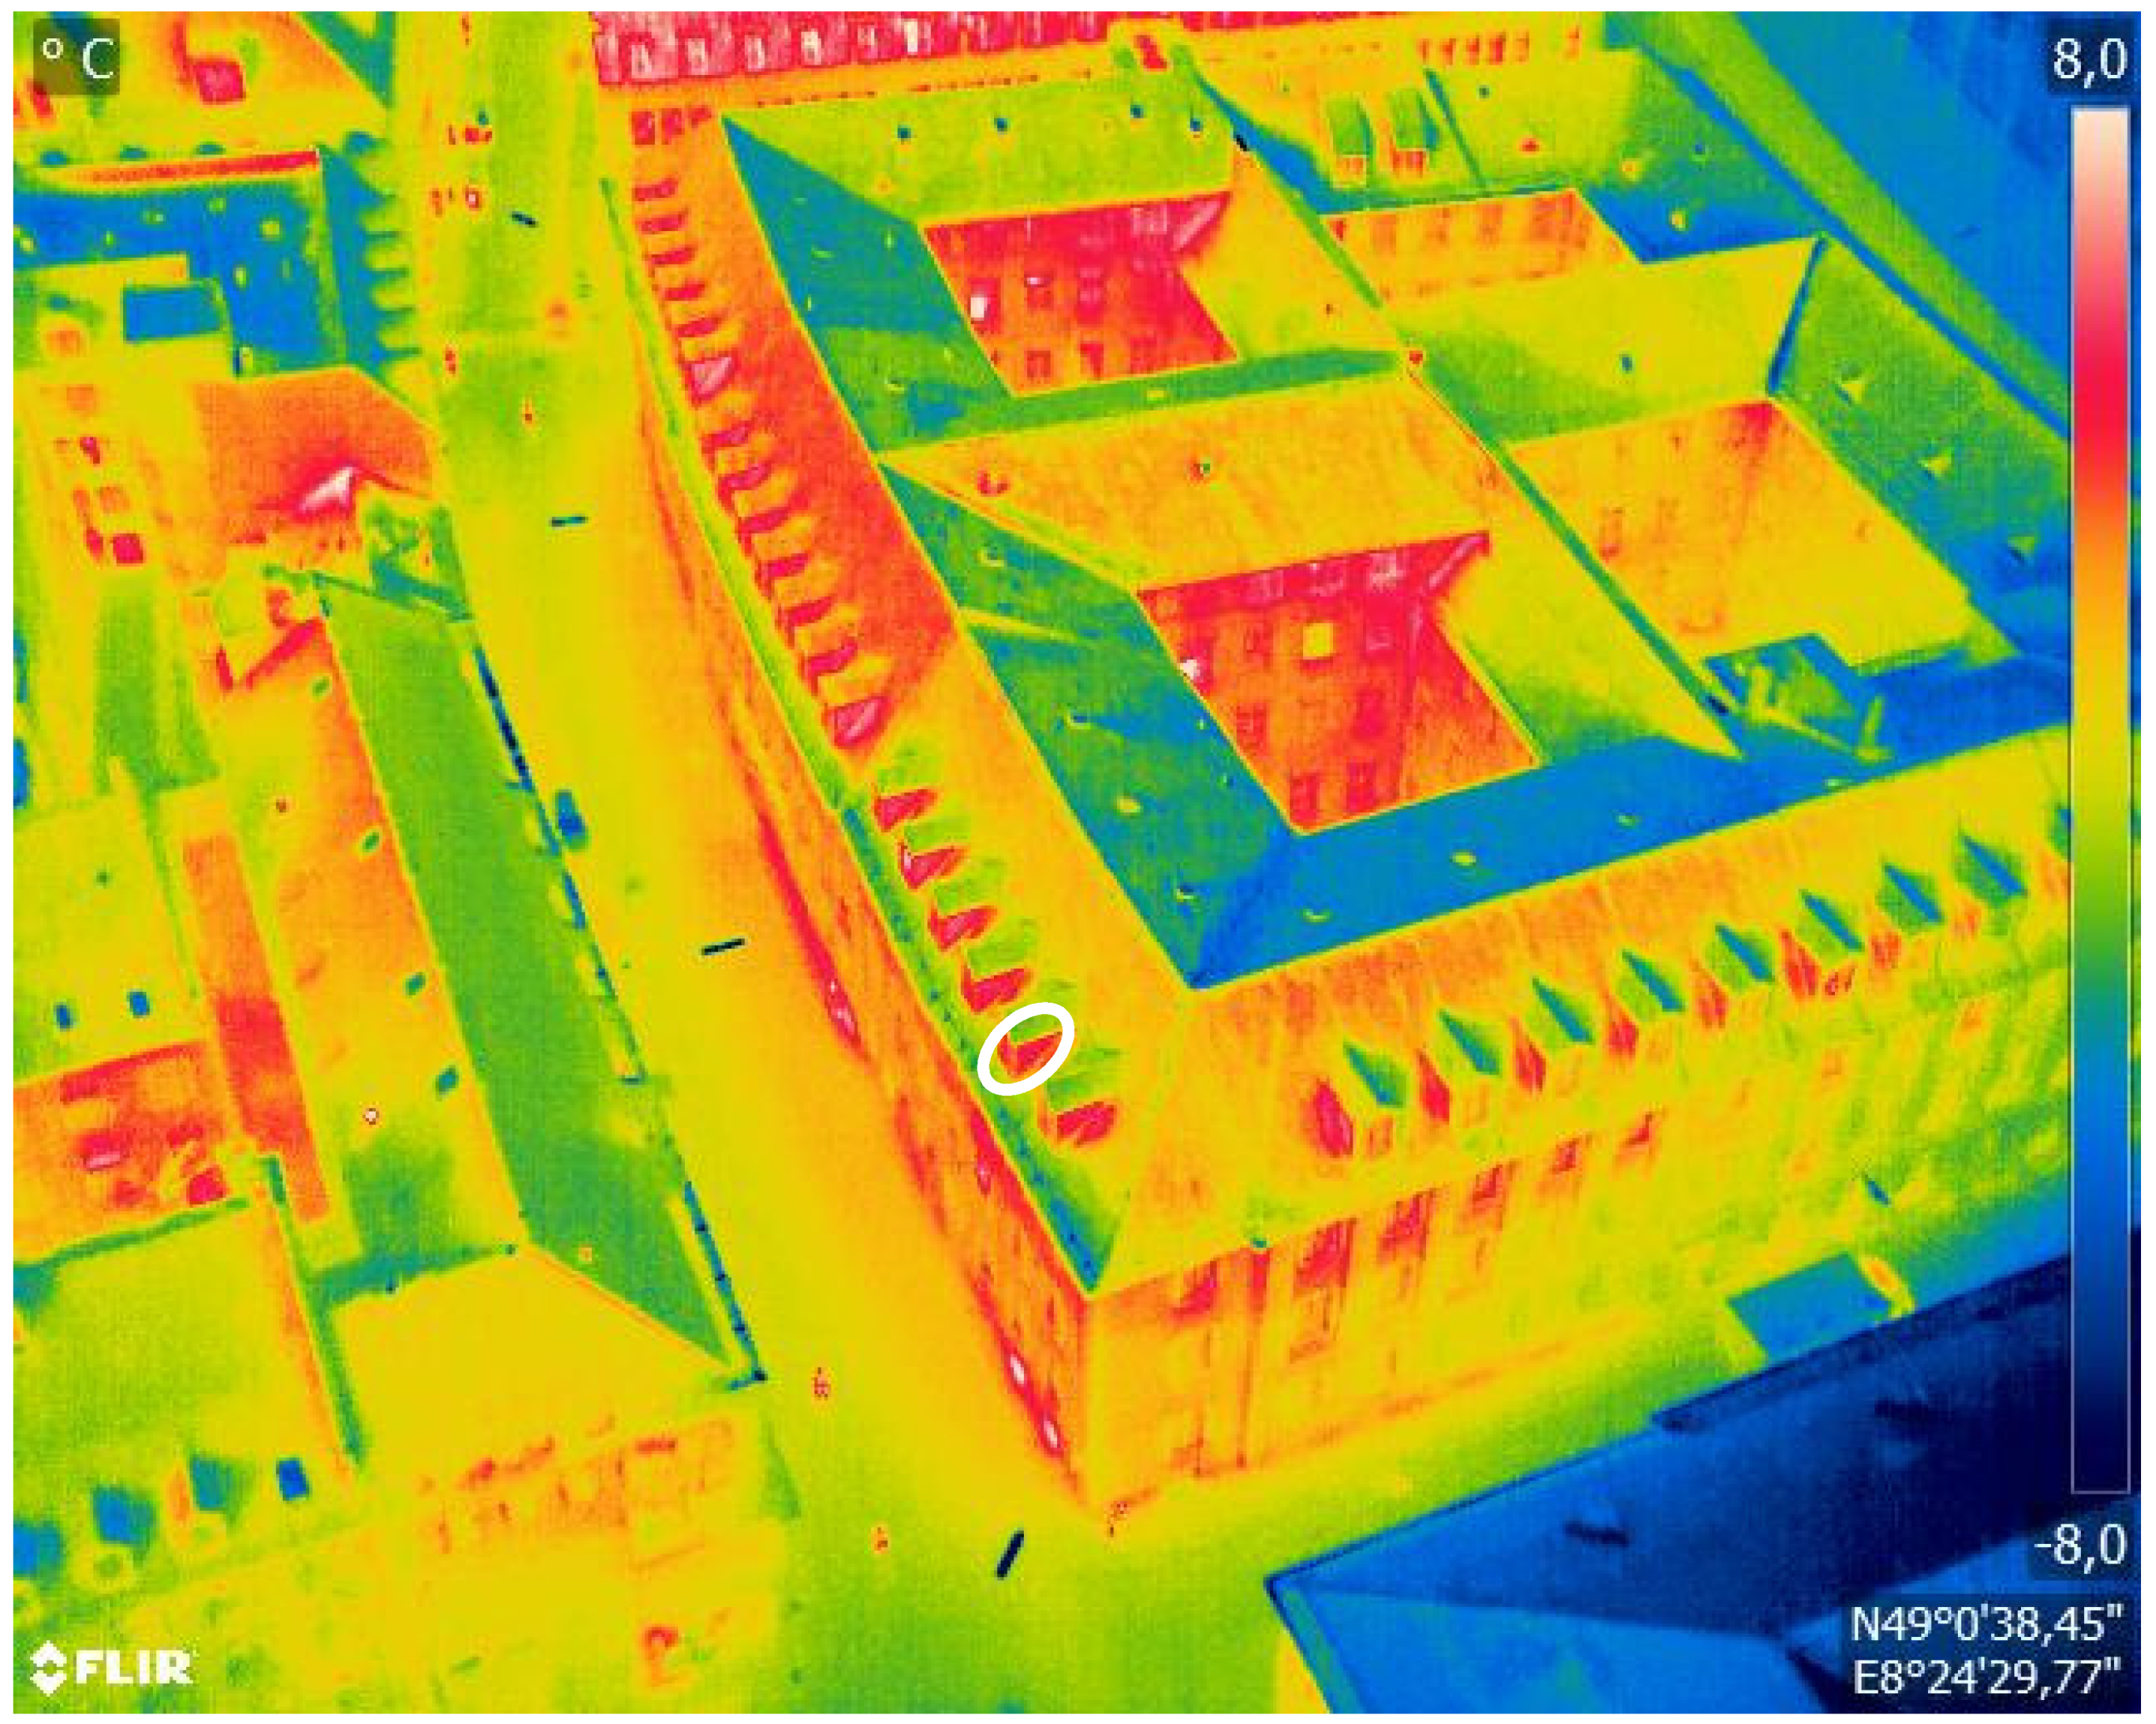
An example of a thermal bridge of a staggered story is presented in Figure A21. For the retrofit of this thermal bridge type, it is necessary to demolish a part of the roof structure and install new thermal insulation material in the connection area. The thermal insulation reduces the negative effects of the thermal bridge in the edge area. Due to the necessary partial removal of the existing roof covering, this retrofit is time-consuming and there is a risk of moisture problems. The insulation should be 20 cm long in total and installed in the direct connection area to the rising components of the staggered story. An illustration of this retrofit measure is shown in Figure A22, the costs of the retrofit of this thermal bridge type are listed in Table A24, and the change in the characteristic values of heat loss and mold formation of the building component before and after the retrofit is shown in Table A25.
Figure A21. Example: thermal bridge of a staggered story.
Energies 14 07360 g0a21
Figure A22. Before and after the thermal bridge retrofit of a staggered story (created with ThermCad thermal bridge simulation calculator).
Energies 14 07360 g0a22
Table A24. Retrofit components and costs of the thermal bridge retrofit of a staggered story [38,39].
Pos. No.Retrofit Measure *
Installation Height: 100 cm
Retrofit Costs per Linear Meter
LB 321-5Removing and reattaching roof paving11.80 EUR/m
LB 321-4Removing and reattaching gravel filling10.20 EUR/m
LB 321-10Demolishing old trickle protection mat2.00 EUR/m
LB 321-9Removing old filter layer0.80 EUR/m
LB 321-27Thermal insulation, DAA, CG, up to 140 mm16.40 EUR/m
LB 321-35Roof waterproofing PYE PV250 S5, upper layer3.40 EUR/m
LB 310-15Percolating layer, fleece-laminated3.40 EUR/m
LB 321-40New trickle protection mat1.00 EUR/m
Gross total49.00 EUR/m
* In retrofit practice, the bitumen waterproofing is replaced, if necessary, to prevent moisture problems.
Table A25. Quantifiable results of the thermal bridge retrofit of a staggered story (ThermCad thermal bridge simulation calculation).
Original State before RetrofitState after RetrofitImprovement
fR,si,0Ψ0q0fR,si,1Ψ1q1ΔΨΔq
(-)(W/mK)(W/m)(-)(W/mK)(W/m)(W/mK)(W/m)
0.780.2867.170.820.2359.830.067.34
Steep roof: Roof ridge
A gable roof has a ridge where the two sloping roof surfaces connect. The ridge has high demands on the quality of the roof insulation work due to the different geometric conditions. If the insulation is missing or incorrectly installed, this area can become a significant thermal bridge within the roof structure. In addition, the air leakage potential increases considerably due to changes in the angle [2].
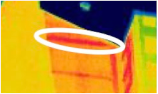
An example of a thermal bridge of a roof ridge is presented in Figure A23. For the retrofit of this thermal bridge type, it is necessary to install thermal insulation material as under-rafter insulation below the ridge. This reduces the effect of the geometric discontinuity and the heat loss through the thermal bridge area. For a professional retrofit, a sufficient width of the thermal insulation of 30 cm must be ensured, which should be attached directly to the ridge. It is important that the thermal insulation is applied on both sides of the ridge. An illustration of this retrofit measure is shown in Figure A24, the costs of the retrofit of this thermal bridge type are listed in Table A26, and the change in the characteristic values of heat loss and mold formation of the building component before and after the retrofit is shown in Table A27.
Figure A23. Example: thermal bridge of a roof ridge.
Energies 14 07360 g0a23
Figure A24. Before and after the thermal bridge retrofit of a roof ridge (created with ThermCad thermal bridge simulation calculator).
Energies 14 07360 g0a24
Table A26. Retrofit components and costs of the thermal bridge retrofit of a roof ridge [38,39].
Pos. No.Retrofit Measure *
Installation Height: 60 cm
Retrofit Costs per Linear Meter
LB 320-11Demolishing old roof boarding10.80 EUR/m
LB 320-8Removing old roof lathing2.40 EUR/m
LB 320-37Bottom rafter insulation, MW 035, 100 mm29.40 EUR/m
LB 320-64Vapor barrier, variable humidity4.80 EUR/m
LB 320-72Cross-laths, dry, 30 × 50 mm, roof3.00 EUR/m
LB 320-82Boarding OSB/3 humidity range, 25 mm18.60 EUR/m
Gross total69.00 EUR/m
* In retrofit practice, costs for the scaffold are also relevant.
Table A27. Quantifiable results of the thermal bridge retrofit of a roof ridge (ThermCad thermal bridge simulation calculation).
Original State before RetrofitState after RetrofitImprovement
fR,si,0Ψ0q0fR,si,1Ψ1q1ΔΨΔq
(-)(W/mK)(W/m)(-)(W/mK)(W/m)(W/mK)(W/m)
0.710.0636.800.82−0.2830.040.346.76
Steep roof: Dormer
The connection between the rooftop and a dormer has high demands on the quality of insulation work due to the geometrical conditions. If the insulation is missing or incorrectly applied, this connection leads to a thermal bridge within the roof cladding. Due to different angles, the thermal bridge potential also increases considerably. The thermal bridge effect is reinforced by the different specific thermal conductivities of wood and masonry [2].
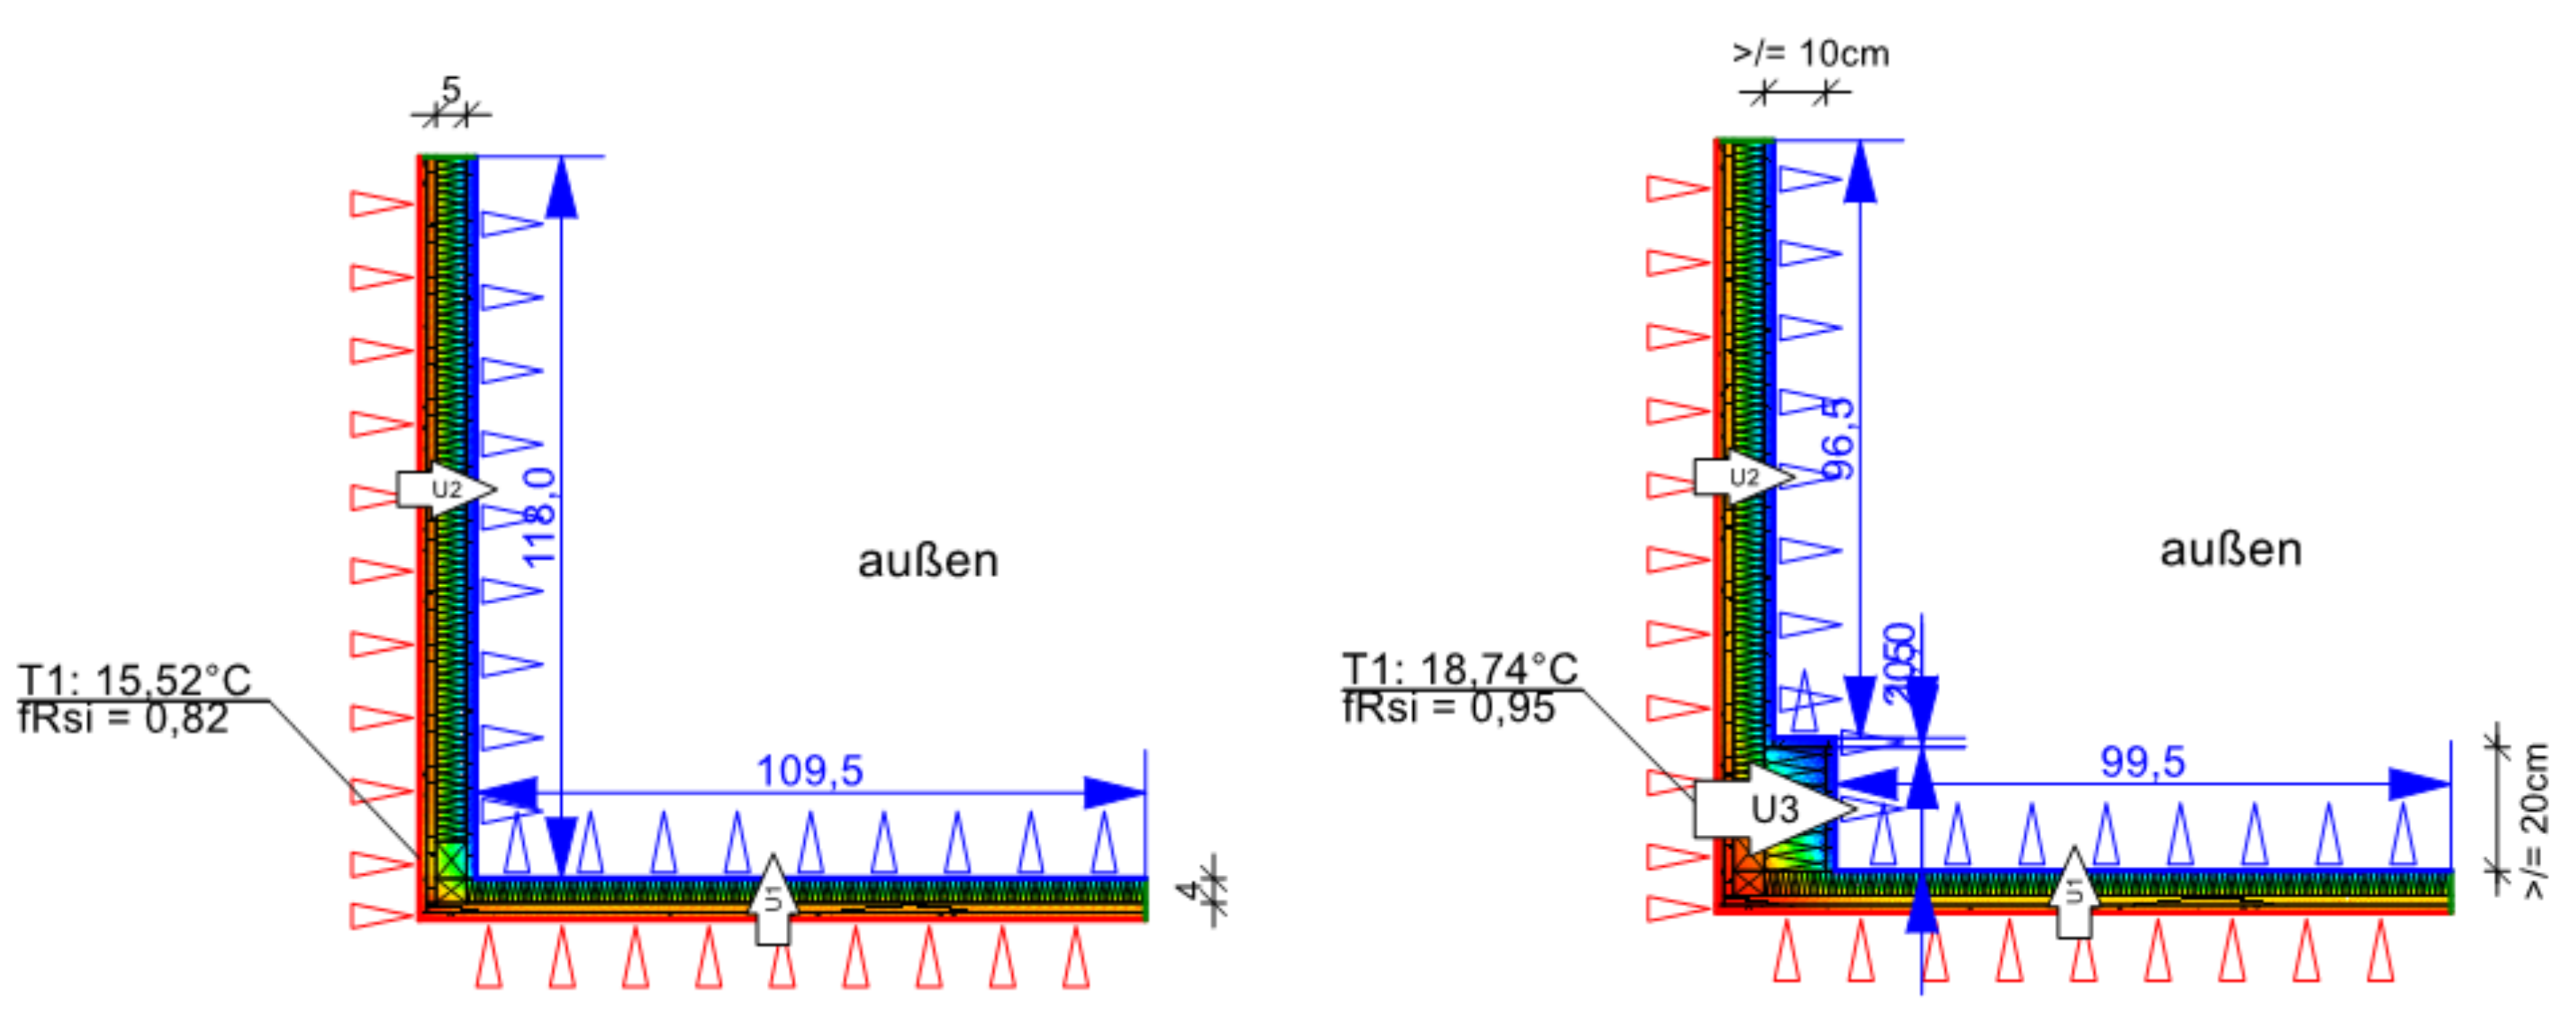
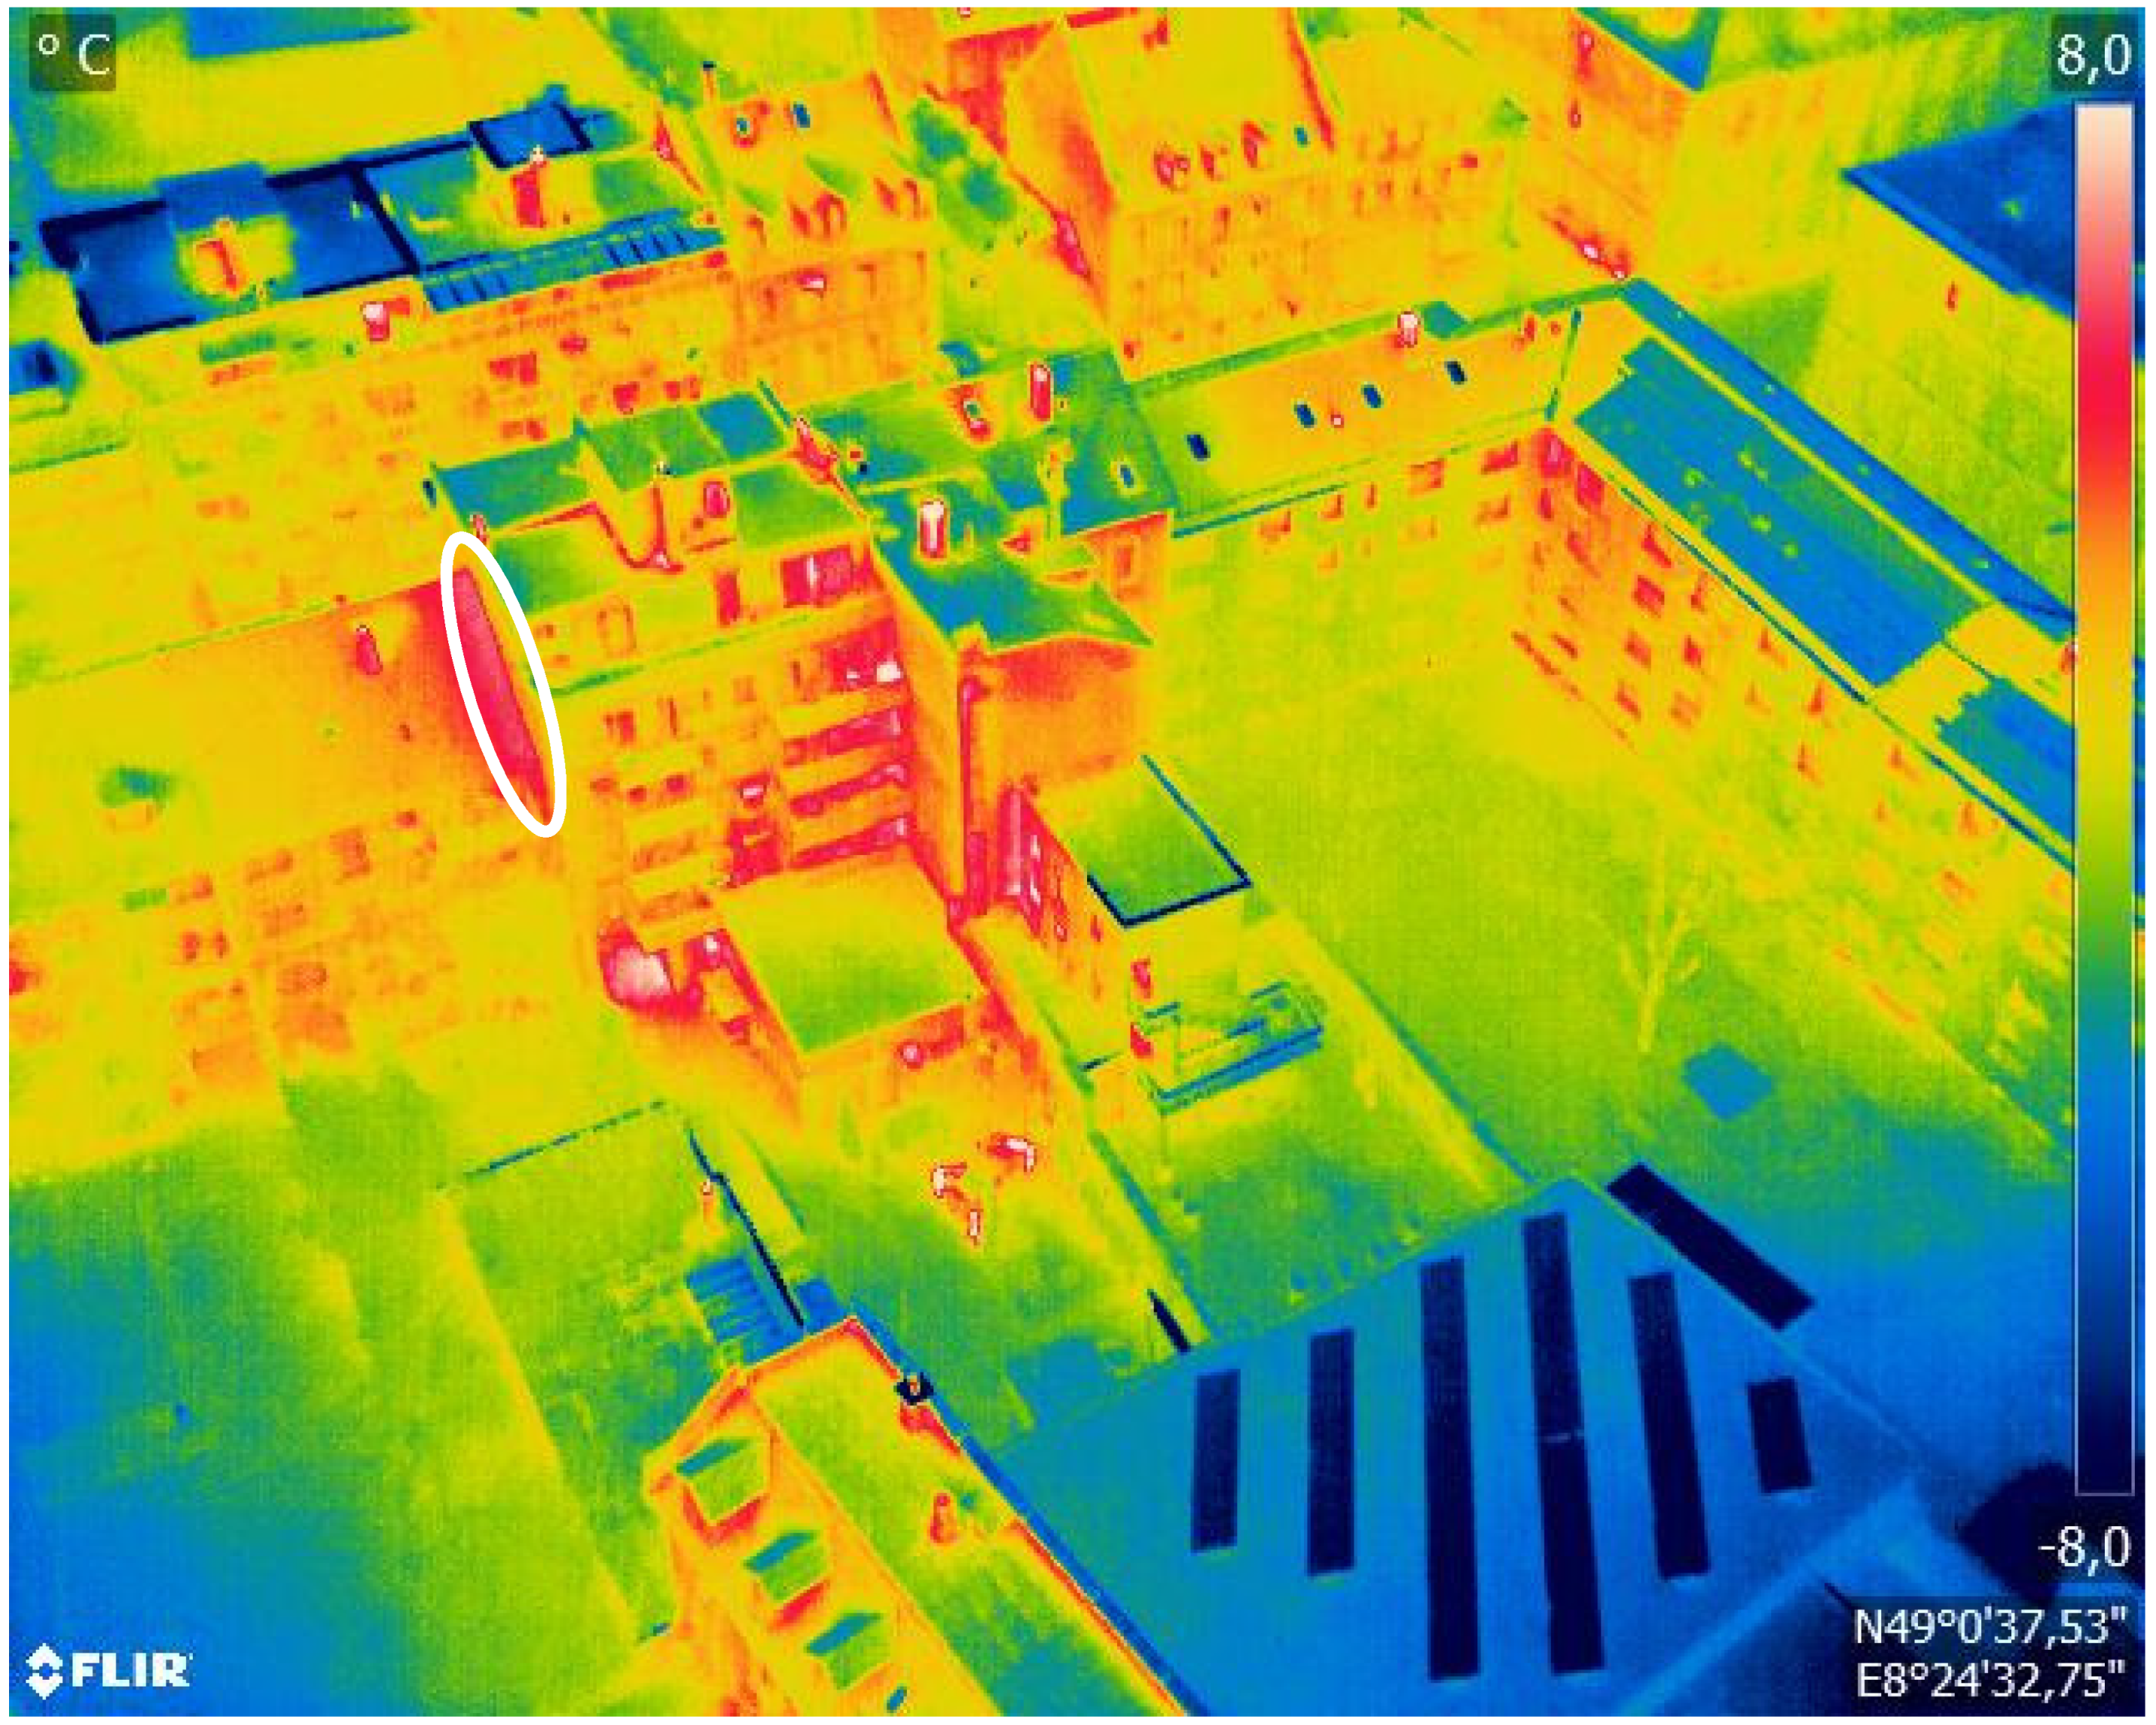
An example of a thermal bridge of a dormer is presented in Figure A25. For the retrofit of this thermal bridge type, it is necessary to install additional thermal insulation material along the connection area from the dormer to the rooftop. This serves to balance the effect of the different specific thermal conductivities of masonry and wood and to reduce heat loss. The necessary insulation should be 20 cm high and installed in the direct connection area to the roof. An illustration of this retrofit measure is shown in Figure A26, the costs of the retrofit of this thermal bridge type are listed in Table A28, and the change in the characteristic values of heat loss and mold formation of the building component before and after the retrofit is shown in Table A29.
Figure A25. Example: thermal bridge of a dormer.
Energies 14 07360 g0a25
Figure A26. Before and after the thermal bridge retrofit of a dormer (created with ThermCad thermal bridge simulation calculator).
Energies 14 07360 g0a26
Table A28. Retrofit components and costs of the thermal bridge retrofit of a dormer [38,39].
Pos. No.Retrofit Measure *
Installation Height: 20 cm
Retrofit Costs per Linear Meter
LB 323-2Removing old plaster from the partial area5.20 EUR/m
LB 323-6Removing old plaster base from the wall2.80 EUR/m
LB 323-68Preparing base for the thermal insulation system0.60 EUR/m
LB 323-86Thermal insulation system up to 20 m, PS 100, bonding technique15.60 EUR/m
LB 323-30Reinforcement fabrics (glass fiber)2.20 EUR/m
LB 323-67Plaster (undercoat and finishing plaster)8.20 EUR/m
Gross total34.60 EUR/m
* In retrofit practice, costs for the scaffold are also relevant.
Table A29. Quantifiable results of the thermal bridge retrofit of a connection of a rooftop on a wall (ThermCad thermal bridge simulation calculation).
Original State before RetrofitState after RetrofitImprovement
fR,si,0Ψ0q0fR,si,1Ψ1q1ΔΨΔq
(-)(W/mK)(W/m)(-)(W/mK)(W/m)(W/mK)(W/m)
0.820.0936.340.950.0532.010.044.33
Steep roof: Connection between a rooftop and a wall
Due to the different geometric conditions, the connection between a rooftop and an outer wall is associated with high demands on the quality of the insulation work. If the roof insulation is missing or incorrectly installed, this connection causes a thermal bridge. In addition, the thermal bridge potential increases considerably due to the angle of the roof and different materials of the two components [51].
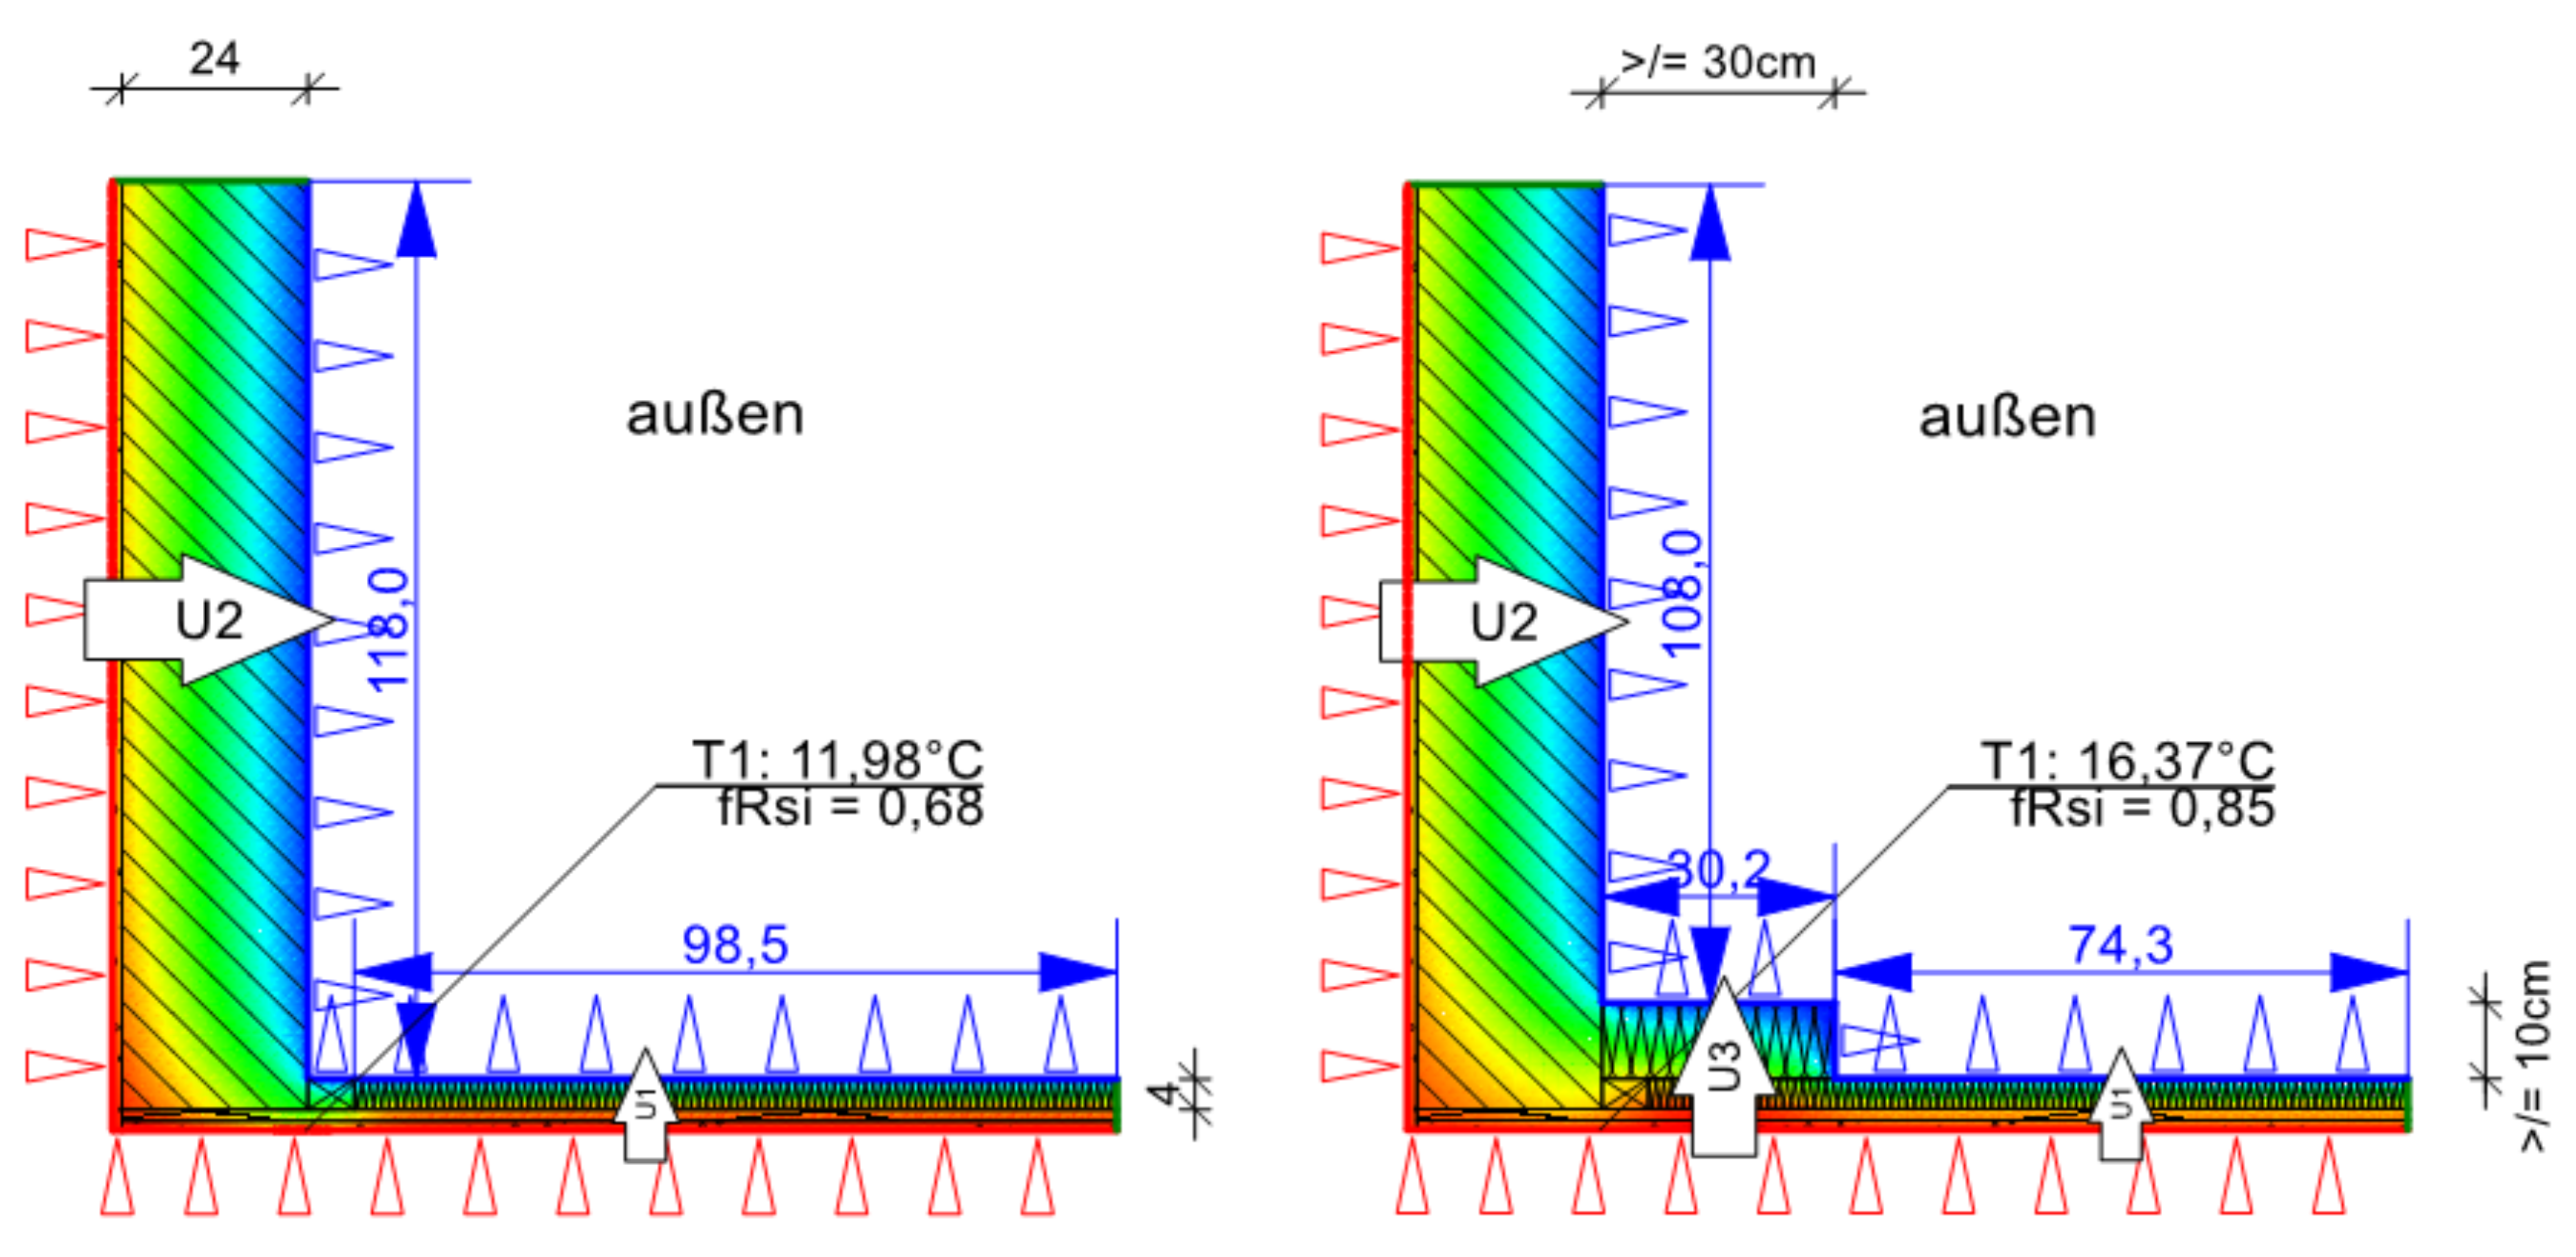
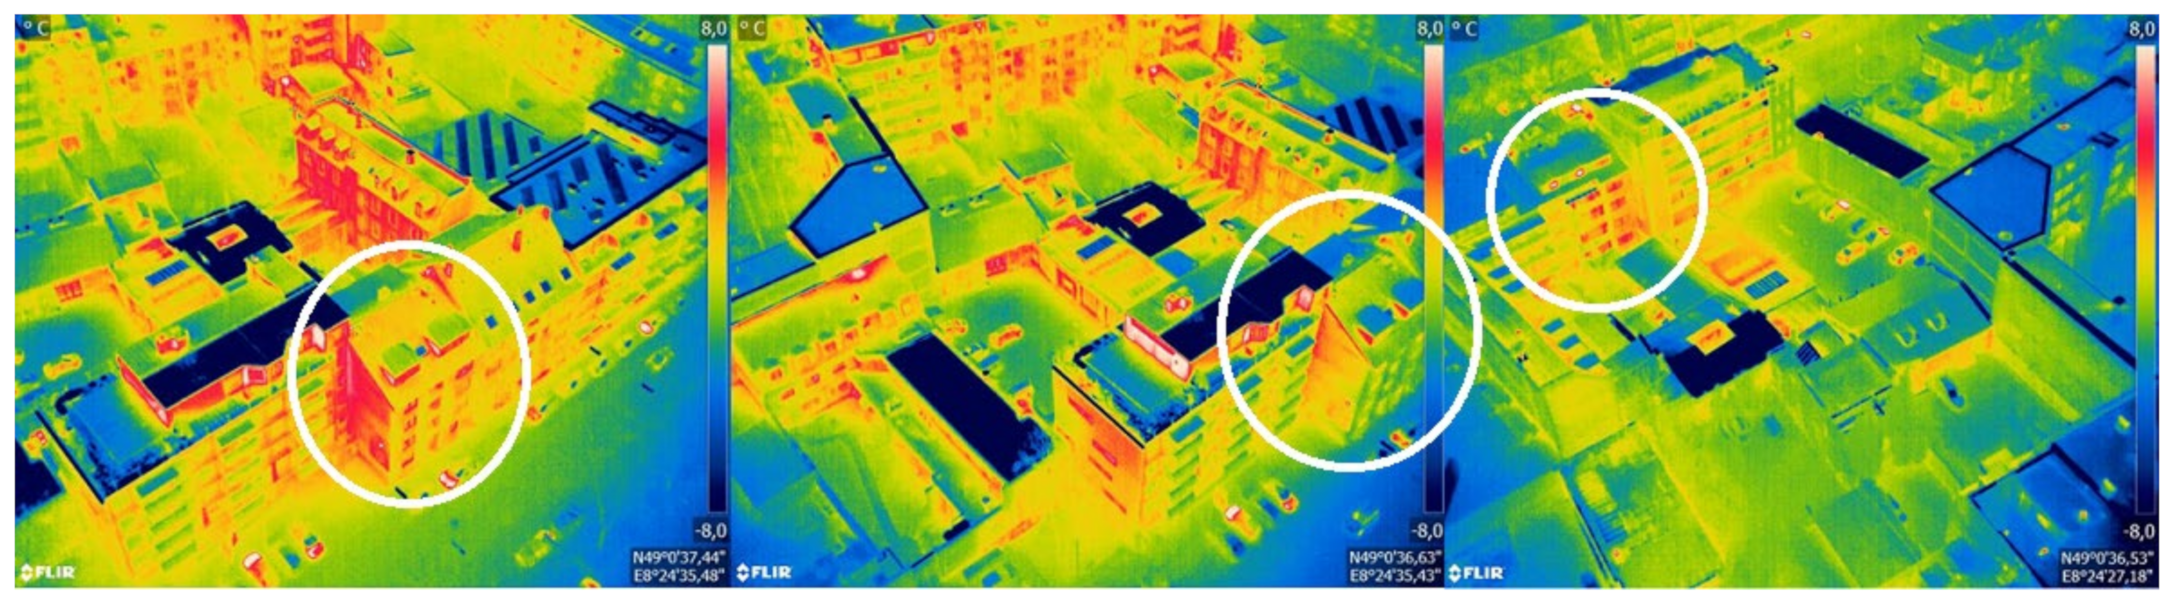
An example of a thermal bridge of a connection between a rooftop and a wall is presented in Figure A27. For the retrofit of this thermal bridge type, it is necessary to demolish part of the roof structure and install additional thermal insulation material in the connection area to reduce the negative effects of the thermal bridge in the edge area. The partial removal of the existing roof structure makes the retrofit very complex and is associated with the risk of moisture problems if the vapor barrier is damaged. For the retrofit, it is important to use a sufficiently long thermal insulation layer of 30 cm, which is installed in the direct connection area to the outer wall. An illustration of this retrofit measure is shown in Figure A28, the costs of the retrofit of this thermal bridge type are listed in Table A30, and the change in the characteristic values of heat loss and mold formation of the building component before and after the retrofit is shown in Table A31.
Figure A27. Example: thermal bridge of a connection between a rooftop and a wall.
Energies 14 07360 g0a27
Figure A28. Before and after the thermal bridge retrofit of a connection between a rooftop and a wall (created with ThermCad thermal bridge simulation calculator).
Energies 14 07360 g0a28
Table A30. Retrofit components and costs of the thermal bridge retrofit of a connection between a rooftop and a wall [38,39].
Pos. No.Retrofit Measure *
Installation Height: 30 cm
Retrofit Costs per Linear Meter
LB 320-2Removing and reattaching roof covering6.00 EUR/m
LB 320-8Removing old roof lathing1.20 EUR/m
LB 320-20Demolishing old underlay sill1.80 EUR/m
LB 320-11Demolishing old roof boarding5.40 EUR/m
LB 320-37Bottom rafter insulation, MW 035, 100 mm15.00 EUR/m
LB 320-79Roof boarding, coniferous wood, 24 mm peg8.10 EUR/m
LB 320-68Underlay sill, ventilated roof2.70 EUR/m
LB 320-74Roof lathing, dry2.40 EUR/m
Gross total42.60 EUR/m
* In retrofit practice, costs for the scaffold are also relevant.
Table A31. Quantifiable results of the thermal bridge retrofit of a connection between a rooftop and a wall (ThermCad thermal bridge simulation calculation).
Original State before RetrofitState after RetrofitImprovement
fR,si,0Ψ0q0fR,si,1Ψ1q1ΔΨΔq
(-)(W/mK)(W/m)(-)(W/mK)(W/m)(W/mK)(W/m)
0.680.3266.820.850.2157.960.118.86

Appendix C

Thermal anomalies on aerial thermographic images that can be misinterpreted as thermal bridges:
  • Ventilation tiles on gable roofs: Ventilation tiles help ventilating the roofing in order to prevent the formation of mold and moisture problems. These additional but small heat losses cannot be avoided or retrofitted and can be neglected in accordance with the supplementary sheet 2 of DIN 4108 [35]. In thermograms, they appear as small hot dots on rooftops.
  • Water pipe aerators: Pipe aerators for wastewater downpipes must also be routed over the roof. They prevent overpressure or underpressure in the sewage system in order to protect the residents from harmful sewer gases. Because of the sewage’s own temperature, there is little heat loss, which is released into the environment via the pipe aerator and can also be neglected according to the supplementary sheet 2 of DIN 4108 [35]. In thermograms, these also appear as small hot dots on rooftops.
  • Solar systems: Photovoltaic systems on roofs can radiate a lot of heat for a long time after sunset. The roof can then be falsely rated as having a very low energy quality. At night, this phenomenon is reversed in PV systems. Then, they appear comparatively cold due to the very high reflection. If there is a photovoltaic system, no conclusions can be drawn with respect to the thermal quality of the roof below.
  • Lamps: Lamps and neon signs that are attached to the building and operated with old, conventional light sources appear as small flat areas that have a higher temperature than the remainder of the exterior façades.
  • Constructions with heat build-ups: Constructions such as small inner courtyards or arcade constructions lead to heat build-ups. Due to their protected construction, heat is retained here particularly well and warm air cannot flow easily. These constructions are often visible in thermograms as areas with increased temperature, but they are not thermal bridges and do not need to be retrofitted.
  • Open windows: Through open windows, high amounts of thermal energy can be transported. On thermograms, open windows can be misinterpreted as thermal weak points of the façade.

Appendix D

Case study: Exemplary thermal bridge assessment of a German building constructed in the 1950s/1960s using thermographic aerial images:
Figure A29. Reference building for an exemplary thermal bridge assessment (north orientation).
Energies 14 07360 g0a29
Figure A30. Thermographic aerial images of the reference building (north, east, and west orientation).
Energies 14 07360 g0a30
Table A32. Building size characteristics of the reference building [47].
Building Size CharacteristicsSizeUnit
Width11.40M
Length15.40M
Floor area175.56M
Width of jutting edge6.45M
Height to roof edge11.00M
Building height14.00M
Number of stories4 full stories + 1 additional roof story-
Number of windows20Pieces
Window sizes1.76 × 1.38 (length × height)M
Number of French windows13pieces
French window sizes1.76 × 2.31 (length × height)m
Number of dormers3pieces
Size dormer (south)10.4 × 1.5 × 3 (length × height × width)m
Size dormer (north 1)4.5 × 1.5 × 3 (length × height × width)m
Size dormer (north 2)4.2 × 1.5 × 3 (length × height × width)m
Table A33. Area sizes, U-values, temperature adjustment factors, and transmission heat losses of components of the reference building [37,47,49].
Building ComponentArea
(m2)
U-Value
(W/m2K)
Temperature Adjustment Factor Fix
(-)
Transmission Heat Loss HT (W/K)
Outside wall north104.851.41.0146.79
Outside wall east80.631.41.0112.88
Outside wall south84.521.41.0118.33
Outside wall west0.001.41.00.00
Basement wall above ground north5.701.41.07.98
Basement wall above ground east3.231.41.04.52
Basement wall above ground south5.701.41.07.98
Basement wall above ground west0.001.41.00.00
Basement wall underneath ground north22.801.40.619.15
Basement wall underneath ground east12.901.40.610.84
Basement wall underneath ground south22.801.40.619.15
Basement wall underneath ground west0.001.40.60.00
Ground floor slab176.701.20.484.82
Windows north40.552.91.0117.60
Windows east0.002.91.00.00
Windows south60.882.91.0176.55
Windows west0.002.91.00.00
Rooftop136.800.71.095.76
Dormer north22.050.51.011.03
Dormer east0.000.51.00.00
Dormer south20.100.51.010.05
Dormer west0.000.51.00.00
To calculate the thermal bridge surcharge, we use the high precision method (German “genaues Verfahren”) [37]:
H T = i H T , i + H T B = i F x , i * U i * A i + j Ψ j * l j
  • H T : Transmission heat loss (W/K)
  • H T , i : Transmission heat loss of building component I (W/K)
  • H T B : Additional transmission heat loss caused by thermal bridges (W/K)
  • F x , i : Temperature correction factor of building component i (-)
  • U i : Heat transmission coefficient of building component i (W/(m²K))
  • A i : Area size of building component i (m²)
  • Ψ j : The thermal bridge loss coefficient of thermal bridge j (W/(mK))
  • l j : Length of thermal bridge j (m)
Table A34. Transmission heat losses caused by thermal bridges and total transmission heat losses of the reference building before and after a retrofit [37,47,49].
liΨ0Ψ1HTB,0,i = Ψ0,i * liHTB,1,i = Ψ1,i * li
Thermal bridges(m)(W/mK)(W/mK)(W/K)(W/K)
Window reveal115.260.10−0.4111.53−47.26
Dormer37.100.090.053.341.86
Floor slab96.300.700.0967.418.67
Connection wall/roof6.000.320.191.921.14
Balcony slab32.700.44−0.0514.39−1.64
HTB = ∑ HTB 98.58−37.23
HT = Fxi * Ui* Ai 943.40943.40
HT = HT,i + HTB 1041.99906.17

References

  1. Global Alliance for Buildings and Construction (GlobalABC). Global Status Report towards a Zero-Emission, Efficient and Resilient Buildings and Construction Sector; GlobalABC: Paris, France, 2018; ISBN 978-92-807-3729-5. [Google Scholar]
  2. Haefele, G.; Oed, W.; Sabel, L. Hauserneuerung: Instandsetzen Modernisieren Energiesparen Umbauen, 17th ed.; (May Be Translated As: Building Retrofits: Repairing, Modernizing, Saving Energy, Reconstructing); Ökobuch: Staufen bei Freiburg, Germany, 2019; ISBN 978-3-936896-49-7. [Google Scholar]
  3. Theodoridou, I.; Papadopoulos, A.; Hegger, M. A typological classification of the Greek residential building stock. Energy Build. 2011, 43, 2779–2787. [Google Scholar] [CrossRef]
  4. Ballarini, I.; Corgnati, S.P.; Corrado, V. Use of reference buildings to assess the energy saving potentials of the residential building stock: The experience of TABULA project. Energy Policy 2014, 68, 273–284. [Google Scholar] [CrossRef]
  5. Diefenbach, N. Basisdaten für Hochrechnungen mit der Deutschen Gebäudetypologie des IWU: Neufassung Oktober 2013. IWU, Darmstadt. (May be Translated as: Basic Data for Projections with the German Building Typology of the IWU: New version October 2013.). Available online: https://www.iwu.de/fileadmin/publikationen/energie/klima_altbau/2013_IWU_Diefenbach_Basisdaten-f%C3%BCr-Hochrechnungen-mit-der-Deutschen-Geb%C3%A4udetypologie-des-IWU-2013.pdf (accessed on 15 June 2021).
  6. Kreditanstalt für Wiederaufbau (KfW). Einflussfaktoren auf die Sanierung im deutschen Wohngebäudebestand. IWU, Darmstadt. (May Be Translated as: Factors Influencing the Renovation of the German Residential Building Stock). 2016. Available online: https://www.kfw.de/PDF/Download-Center/Konzernthemen/Research/PDF-Dokumente-alle-Evaluationen/Einflussfaktoren-auf-die-Sanierung-im-deutschen-Wohngeb%C3%A4udebestand_2016.pdf (accessed on 25 April 2021).
  7. Cischinski, H.; Diefenbach, N. Datenerhebung Wohngebäudebestand 2016. IWU, Darmstadt. (May Be Translated as: Data Collection of Residential Buildings in 2016). 2018. Available online: https://www.iwu.de/fileadmin/user_upload/dateien/gebaeudebestand/prj/Endbericht_Datenerhebung_Wohngeb%C3%A4udebestand_2016.pdf (accessed on 15 June 2021).
  8. Schild, K. Wärmebrücken: Berechnung und Mindestwärmeschutz, 1st ed.; (May Be Translated as: Thermal bridges: Calculation and Minimum Requirements for Thermal Insulation); Springer Fachmedien Wiesbaden GmbH: Wiesbaden, Germany, 2018. [Google Scholar] [CrossRef]
  9. Schmidt, P.; Windhausen, S. Bauphysik-Lehrbuch: Wärmeschutz—Energieeinsparung—Feuchte- und Tauwasserschutz—Schallschutz —Raumakustik, 1st ed.; (May be translated as: Building physics textbook: Thermal insulation—energy saving—moisture and condensation protection—sound insulation—room acoustics.); Bundesanzeiger: Köln, Germany, 2018; ISBN 978-3-8462-0407-8. [Google Scholar]
  10. Fouad, N.; Richter, T. Leitfaden Thermographie im Bauwesen: Theorie, Anwendungsgebiete, Praktische Umsetzung, 4th ed.; (May be Translated as: Thermography Guideline for Construction: Theory and Practice); Fraunhofer IRB: Stuttgart, Germany, 2012; ISBN 3816784569. [Google Scholar]
  11. Kirimtat, A.; Krejcar, O. A review of infrared thermography for the investigation of building envelopes: Advances and prospects. Energy Build. 2018, 176, 390–406. [Google Scholar] [CrossRef]
  12. Lucchi, E. Applications of the infrared thermography in the energy audit of buildings: A review. Renew. Sustain. Energy Rev. 2018, 82, 3077–3090. [Google Scholar] [CrossRef]
  13. Kylili, A.; Fokaides, P.; Christou, P.; Kalogirou, S. Infrared thermography (IRT) applications for building diagnostics: A review. Appl. Energy 2014, 134, 531–549. [Google Scholar] [CrossRef]
  14. Umweltbundesamt (UBA): Kohlendioxid-Emissionen im Bedarfsfeld „Wohnen. (May Be Translated as: Carbon Dioxide Emissions in the Housing Sector). 2021. Available online: https://www.umweltbundesamt.de/daten/private-haushalte-konsum/wohnen/kohlendioxid-emissionen-im-bedarfsfeld-wohnen (accessed on 25 May 2021).
  15. US Department of Energy (DOE). Guide to Community Energy Strategic Planning. 2013. Available online: https://www.energy.gov/sites/prod/files/2014/05/f15/cesp_guide.pdf (accessed on 30 August 2021).
  16. Littlejohn, D.; Laszlo, R. National Report on Community Energy Plan Implementation. Quality Urban Energy Systems of Tomorrow (QUEST). 2015. Available online: https://questcanada.org/wp-content/uploads/2018/08/National-Report-on-Community-Energy-Plan-Implementation_Full_Report_2015.pdf (accessed on 12 September 2021).
  17. Urban Europe (UE). White Paper on PED Reference Framework for Positive Energy Districts and Neighbourhoods. 2020. Available online: https://jpi-urbaneurope.eu/ped/ (accessed on 30 August 2021).
  18. Kreditanstalt für Wiederaufbau (KfW). Merkblatt Energetische Stadtsanierung—Zuschuss. 432 Zuschüsse für Quartierskonzepte und Sanierungsmanager. (May Be Translated As: Leaflet on Urban Energy Improvement—Grant. 432 Grants for District Plans and Redevelopment Managers) Frankfurt. 2015. Available online: https://www.kfw.de/PDF/Download-Center/F%C3%B6rderprogramme-(Inlandsf%C3%B6rderung)/PDF-Dokumente/6000002110_M_432_Energetische_Stadtsanierung_Zuschuss.pdf (accessed on 12 January 2021).
  19. DIN EN 13187:1999-05. Wärmetechnisches Verhalten von Gebäuden—Nachweis von Wärmebrücken in Gebäudehüllen—Infrarot-Verfahren (ISO 6781:1983, Modifiziert); Deutsche Fassung EN 13187:1998; (May Be Translated as: Thermal Perfor-Mance of Buildings—Qualitative Detection of Thermal Irregularities in Building Envelopes—Infrared Method (ISO 6781:1983, Modified); German Version EN 13187:1998; DIN: Berlin, Germany, 1999. [Google Scholar] [CrossRef]
  20. Fouad, N.; Richter, T. Bauphysik-Kalender 2012: Schwerpunkt: Gebäudediagnostik; (May Be Translated as: Building Physics Calendar 2012: Focus: Building Diagnostics); Verlag für Architektur und technische Wissenschaften GmbH & Co. KG: Berlin, Germany, 2012. [Google Scholar]
  21. Miller, J.; Singh, N. Kinetic Super-Resolution Long-Wave Infrared (KSR LWIR) Thermography Diagnostic for Building Envelopes: Scott AFB, IL. Engineer Research and Development Center Champaign Il Construction Engineering Research Lab. 2021. Available online: https://erdc-library.erdc.dren.mil/jspui/bitstream/11681/19958/1/ERDC-CERL-TR-15–18.pdf (accessed on 18 June 2021).
  22. Garrido, I.; Lagüela, S.; Arias, P.; Balado, J. Thermal-based analysis for the automatic detection and characterization of thermal bridges in buildings. Energy Build. 2018, 158, 1358–1367. [Google Scholar] [CrossRef]
  23. Macher, H.; Landes, T.; Grussenmeyer, P. Automation of Thermal Point Clouds Analysis for the Extraction Of Windows and Thermal Bridges of Building Facades. ISPRS—Int. Arch. Photogramm. Remote Sens. Spat. Inf. Sci. 2020, XLIII-B2-2, 287–292. [Google Scholar] [CrossRef]
  24. Miño, J.A.P.Y.; Duport, N.; Beckers, B. Pixel-by-pixel rectification of urban perspective thermography. Remote Sens. Environ. 2021, 266, 112689. [Google Scholar] [CrossRef]
  25. Aguerre, J.P.; Nahon, R.; Garcia-Nevado, E.; La Borderie, C.; Fernández, E.; Beckers, B. A street in perspective: Thermography simulated by the finite element method. Build. Environ. 2018, 148, 225–239. [Google Scholar] [CrossRef]
  26. Entrop, A.G.; Vasenev, A. Infrared drones in the construction industry: Designing a protocol for building thermography procedures. Energy Procedia 2017, 132, 63–68. [Google Scholar] [CrossRef]
  27. Vorajee, N.; Mishra, A.K. Analyzing capacity of a consumer-grade infrared camera in South Africa for cost-effective aerial inspection of building envelopes. Front. Arch. Res. 2020, 9, 697–710. [Google Scholar] [CrossRef]
  28. Mavromatidis, L.; Dauvergne, J.-L.; Saleri, R.; Batsale, J.-C. First Experiments for the Diagnosis and Thermophysical Sampling Using Pulsed IR Thermography from Unmanned Aerial Vehicle (UAV); Taylor & Francis: Bordeaux, France, 2014. [Google Scholar] [CrossRef]
  29. Benz, A.; Taraben, J.; Debus, P.; Habte, B.; Oppermann, L.; Hallermann, N.; Voelker, C.; Rodehorst, V.; Morgenthal, G. Framework for a UAS-based assessment of energy performance of buildings. Energy Build. 2021, 250, 111266. [Google Scholar] [CrossRef]
  30. Hou, Y.; Volk, R.; Chen, M.; Soibelman, L. Fusing tie points’ RGB and thermal information for mapping large areas based on aerial images: A study of fusion performance under different flight configurations and experimental conditions. Autom. Constr. 2021, 124, 103554. [Google Scholar] [CrossRef]
  31. FLIR Systems Inc. FLIR Tools. 2021. Available online: https://www.flir.de/products/flir-tools/ (accessed on 10 July 2021).
  32. Fouad, U.-P.D.-I.N.A.; Richter, I.T. Infrarot-Thermografie in der Praxis; John Wiley & Sons: Hoboken, NJ, USA, 2012. [Google Scholar] [CrossRef]
  33. Fouad, N. Bauphysik-Kalender 2017: Schwerpunkt: Gebäudehülle und Fassaden; (May be Translated as: Building Physics Calendar 2012: Focus: Building Envelope and Façades.); Wilhelm Ernst & Sohn: Hoboken, NJ, USA, 2017. [Google Scholar] [CrossRef]
  34. Stadt Essen (City of Essen). Gebäudetypologie für die Stadt Essen. (May be Translated as: Building Typology for the City of Essen). 2015. Available online: https://www.alt-bau-neu.de/_database/_data/datainfopool/Gebaeudetypologie_Essen.pdf (accessed on 17 April 2021).
  35. DIN 4108 Beiblatt 2. Wärmeschutz und Energieeinsparung in Gebäuden—Beiblatt 2: Wärmebrücken—Planungs- und Ausführungsbeispiele; (May be Translated as: Thermal Insulation a0nd Energy Economy in Buildings; Supplement 2: Thermal Bridges—Examples for Planning and Performance); DIN: Berlin, Germany, 2004. [Google Scholar]
  36. ROWA Soft GmbH. ThermCAD Wärmebrückensimulationsberechnung; (May be Translated as: Thermal Bridge Calculation Tool); ROWA Soft GmbH: Altenburg, Germany, 2021; Available online: http://www.rowasoftgmbh.de/de/produkte/produktdetails/thermcad (accessed on 10 May 2021).
  37. DIN V 4108-6:2003-06: Wärmeschutz und Energie-Einsparung in Gebäuden—Teil 6: Berechnung des Jahresheizwärme- und des Jahresheizenergiebedarfs; (May be Translated as: Thermal Protection and Energy Economy in Buildings—Part 6: Calculation of Annual Heat and Energyconsumption); DIN: Berlin, Germany, 2003.
  38. BKI Baukosteninformationszentrum. BKI Baukosten 2020 Altbau: Statistische Kostenkennwerte für Positionen; (May be Translated as: BKI Construction Prices 2020 Old Buildings: Statistical Price Parameters); BKI: Stuttgart, Germany, 2020; ISBN 978-3-945649-95-4. [Google Scholar]
  39. BKI Baukosteninformationszentrum. BKI Baukosten 2020 Neubau: Statistische Kostenkennwerte für Positionen; (May be Translated as: BKI Construction Prices 2020 New Buildings: Statistical Price Parameters); BKI: Stuttgart, Germany, 2020; ISBN 978-3-945649-89-3. [Google Scholar]
  40. DIN 276. Kosten im Bauwesen; (May be translated as: Building Costs); DIN: Berlin, Germany, 2018. [Google Scholar]
  41. SZ DJI Technoloy Co. Ltd. Matrice 600 Pro: User Manual; Version 1.0; DJI: Shenzen, China, 2018; Available online: https://www.dji.com/de/matrice600-pro (accessed on 25 October 2021).
  42. FLIR Systems, Inc. Duo Pro R: User Guide Version 1, August 2017. 2017. Available online: https://www.flir.com/products/duo-pro-r/ (accessed on 25 October 2021).
  43. SZ DJI Technology Co. Ltd. Zenmuse XT 2: User Manual; Version 1.0; DJI: Shenzen, China, 2018; Available online: https://www.dji.com/zenmuse-xt2 (accessed on 25 October 2021).
  44. Mapsz Editor (n.d.). Karlsruhe, Germany. Available online: https://mapz.com/map (accessed on 25 October 2021).
  45. Deutsche Energie-Agentur (dena). Wärmebrücken in der Bestandssanierung: Leitfaden für Fachplaner und Architekten; (May be Translated as: Thermal Bridges and the Retrofit of Existing Buildings: Guidelines for Specialist Planners and Architects); Dena: Berlin, Germany, 2015; Available online: https://www.dena.de/fileadmin/dena/Publikationen/PDFs/2019/8179_Leitfaden_Waermebuecken_Bestandssanierung.pdf (accessed on 27 July 2021).
  46. DIN EN ISO 10211:2008-04. Wärmebrücken im Hochbau—Wärmeströme und Oberflächentemperaturen—Detaillierte Berechnungen; (May be Translated as: Thermal Bridges in Building Construction—Heat Flows and Surface Temperatures—Detailed Calculations (ISO 10211:2007); German Version EN ISO 10211:2007DIN; DIN: Berlin, Germany, 2008. [Google Scholar]
  47. Google Maps. 2021. Available online: https://www.google.de/maps (accessed on 27 July 2021).
  48. Mayer, Z.; Kahn, J.; Hou, Y.; Volk, R. AI-based thermal bridge detection of building rooftops on district scale using aerial images. In Proceedings of the EG-ICE 2021 Workshop on Intelligent Computing in Engineering proceedings, Berlin, Germany, 30 June–2 July 2021; p. 1427. [Google Scholar] [CrossRef]
  49. Bundesministerium für Wirtschaft und Energie (BMWi); Bundesministerium für Umwelt, Natur, Bau und Reaktorsicherheit (BMU). Bekanntmachung der Regeln zur Datenaufnahme und Datenverwendung im Wohngebäudebestand; (May be Translated as: Announcement of the Rules for Fata Acquisition and Data Use in the Residential Building Stock); BMWi: Munich Germany, 2015; Available online: https://www.bbsr-energieeinsparung.de/EnEVPortal/DE/EnEV/Bekanntmachungen/Download/WGDatenaufnahme2013.pdf;jsessionid=5176E5F904AEFBDEA192EC019F60DC57.live21322?__blob=publicationFile&v=5 (accessed on 18 March 2021).
  50. Forum. EnEV 2014 im Gebäudebestand. (May Be Translated as: Energy Saving Ordinance 2014 for the Building Stock). 2021. Available online: https://www.forum-verlag.com/media/pdf/lp_1391_Gebaude-aus-den-Baujahren-1960–1969.pdf (accessed on 10 May 2021).
  51. Gabriel, I.; Ladener, H. Vom Altbau zum Effizienzhaus: Modernisieren und Energetisch Sanieren, 13th ed.; Staufen bei Freiburg May be Translated as: From the Old to the Efficient Building: Modernizing and Energetic Retrofitting; Ökobuch: Freiburg im Breisgau, Germany, 2018; ISBN 978-3-936896-75-6. [Google Scholar]
Figure 1. Research approach of this study presented in a flow diagram. The focus of this paper is on buildings constructed in Germany in the time between 1950 and 1969.
Energies 14 07360 g001
Figure 2. Area where thermal drone images were collected. Map of the city of Karlsruhe, district Innenstadt-Ost [44].
Energies 14 07360 g002
Figure 3. Thermographic aerial panorama image (left) with the corresponding RGB aerial panorama image (right) of inner-city buildings in Karlsruhe.
Energies 14 07360 g003
Figure 4. Criterion of mold formation of 14 thermal bridges in German buildings constructed between 1950 and 1969 prior to a retrofit (based on simulations with ThermCad). The red line marks the mold formation criterion of 0.7. Thermal bridge types with a red bar are clearly lower, with a yellow bar close to, and with a green bar clearly higher than 0.7.
Energies 14 07360 g004
Figure 5. Costs and heat flow differences of the retrofit of 14 thermal bridge types of German buildings constructed between 1950 and 1969.
Energies 14 07360 g005
Figure 6. Benefit–cost ratios for energy savings of the retrofits of 14 thermal bridge types of German buildings constructed between 1950 and 1969.
Energies 14 07360 g006
Table 1. Types of thermal bridges sorted by the building parts in which they occur.
Building PartType of Thermal Bridge
Thermal bridges of outer wallsConnection of the basement ceiling slab with the outer wall
Connection of the wall and the rooftop
Connection of an inside wall with the outer wall
Connection of a floor slab with the outer wall
Thermal bridge types of balconiesBalcony slab
Thermal bridge types of windowsRoller shutter casing
Window lintel
Window reveal
Window sill
Thermal bridge types of rooftopsConnection between the rooftop and an outer wall (steep roof)
Connection of the rooftop and a dormer (steep roof)
Roof ridge (steep roof)
Connection of a staggered story with the rooftop (flat roof)
Connection of an attic with the rooftop (flat roof)
Table 2. Overview of 14 thermal bridge types of German buildings constructed in the time between 1950 and 1969 with thermographic image excerpts.
Type of Thermal BridgeExample ImageType of Thermal BridgeExample Image
Window sill Energies 14 07360 i001Balcony slab Energies 14 07360 i002
Window lintel Energies 14 07360 i003Dormer Energies 14 07360 i004
Floor slab Energies 14 07360 i005Window reveal Energies 14 07360 i006
Connection wall and rooftop Energies 14 07360 i007Roof ridge Energies 14 07360 i008
Connection rooftop on wall Energies 14 07360 i009Attic Energies 14 07360 i010
Staggered story Energies 14 07360 i011Inside wall Energies 14 07360 i012
Roller shutter casing Energies 14 07360 i013Basement ceiling slab Energies 14 07360 i014
Table 3. Characteristic values, estimated costs, and benefit–cost ratios of the retrofits of 14 thermal bridge types in German buildings constructed between 1950 and 1969, prior to and after a retrofit (characteristic values are based on simulations with ThermCad, costs are based on BKI prices as of 2020 [38,39]), sorted according to benefit–cost ratio. The temperature factor is either below (red), near (yellow), or above (green) the mold formation threshold f R , s i of 0.7.
Original State before RetrofitState after RetrofitImprovementEstimated Retrofit CostsBenefit–Cost Ratio
Type of Thermal BridgefR,si,0Ψ0q0fR,si,1Ψ1q1ΔΨΔq--
(-)(W/mK)(W/m)(-)(W/mK)(W/m)(W/mK)(W/m)(EUR/m)(W/EUR)
Window sill0.480.18147.660.920.0883.060.1064.60173.000.37
Window lintel0.420.77142.300.74−0.34117.601.1124.7069.200.36
Floor slab0.550.70105.160.720.0989.900.6115.2649.600.31
Wall/rooftop0.680.3266.820.880.1957.750.139.0634.600.26
Rooftop/wall0.680.3266.820.850.2157.960.118.8642.600.21
Staggered story0.780.2867.170.820.2359.830.067.3449.000.15
Roller shutter casing0.700.11121.940.85−0.24113.140.358.8060.000.15
Balcony slab0.580.44102.960.74−0.0590.870.4812.0983.640.14
Dormer0.820.0936.340.950.0532.010.044.3334.600.13
Window reveal0.570.10126.450.72−0.41118.550.517.8969.200.11
Roof ridge0.710.0636.800.82−0.2830.040.346.7669.000.10
Attic0.480.25106.930.73−0.7382.040.9924.89280.260.09
Inside wall0.710.0586.450.77−0.2381.920.284.5257.290.08
Basement ceiling slab0.570.0452.970.75−0.4646.890.506.08106.400.06
Publisher’s Note: MDPI stays neutral with regard to jurisdictional claims in published maps and institutional affiliations.

