Article

Effects of Positioning of Multi-Sensor Devices on Occupancy and Indoor Environmental Monitoring in Single-Occupant Offices

Department of Applied Physics and Electronics, Umeå University, 901 87 Umeå, Sweden
*
Author to whom correspondence should be addressed.
Energies 2021, 14(19), 6296; https://doi.org/10.3390/en14196296
Submission received: 19 August 2021 / Revised: 25 September 2021 / Accepted: 27 September 2021 / Published: 2 October 2021
(This article belongs to the Special Issue Energy Efficiency Improvements in Buildings to Achieve Climate Goals)

Abstract

:
The advancements in sensor and communication technologies drive the rapid developments in the applications of occupancy and indoor environmental monitoring in buildings. Currently, the installation standards for sensors are scarce and the recommendations for sensor positionings are very general. However, inadequate sensor positioning might diminish the reliability of sensor data, which could have serious impacts on the intended applications such as the performance of demand-controlled HVAC systems and their energy use. Thus, there is a need to understand how sensor positioning may affect the sensor data, specifically when using multi-sensor devices in which several sensors are being bundled together. This study is based on the data collected from 18 multi-sensor devices installed in three single-occupant offices (six sensors in each office). Each multi-sensor device included sensors to measure passive infrared (PIR) radiation, temperature, CO2, humidity, and illuminance. The results show that the positions of PIR and CO2 sensors significantly affect the reliability of occupancy detection. The typical approach of positioning the sensors on the ceiling, in the middle of offices, may lead to relatively unreliable data. In this case, the PIR sensor in that position has only 60% accuracy of presence detection. Installing the sensors under office desks could increase the accuracy of presence detection to 84%. These two sensor positions are highlighted in sensor fusion analysis as they could reach the highest accuracy compared to other pairs of PIR sensors. Moreover, sensor positioning can affect various indoor environmental parameters, especially temperature and illuminance measurements.

1. Introduction

Development and improvement of sensor technologies and their wireless networking have been the top priority of Internet of Things (IoT) for smart city infrastructure [1]. The advancements in the sensor and wireless communication technologies have elevated the opportunities to benefit from occupancy and indoor environmental monitoring in buildings [2]. Building performance monitoring allows optimizing the operation of existing facilities and improving the future designs, in terms of energy efficiency and occupants’ comfort and well-being [3,4]. As the sensing technologies become more cost-effective and adaptable, new applications in buildings continuously emerge. For example, occupancy sensors may be used for space use management by providing information about space use which allows to improve the efficiency of using energy and resources [5]. Occupancy and indoor environmental sensors can be used together to enable solutions such as demand-controlled energy systems [6], demand response [7], and behavior change campaigns [8]. Multiple applications using similar sensing and data infrastructure increase their chance of being economical and facilitate the widespread adoption of sensors in buildings [6].
Legislative documents by European Union promote smart devices and encourage the adoption of intelligent metering and active control systems in buildings to achieve energy saving [9]. As the importance of occupancy and indoor environmental monitoring being recognized, building codes would likely consider occupant-related aspects enhancing the adoption of sensing devices [10]. The trends suggest more stringent requirements in the future towards mandatory adoption of sensing devices [11]. The technological advancements and various economic, social, and sustainability motives are likely to increase the deployment of sensors in buildings on a broader scale [2].
There are various types of sensors for occupancy monitoring such as passive infrared (PIR) sensor, infrared array, and ultrasonic sensor [6,12]. Similarly, indoor environmental parameters such as temperature, humidity, light, and CO2 concentration can be measured by different sensor technologies. The positioning of sensors on where they are installed is often flexible and can be adapted to standards such as ASHRAE standard 55 [13]. Sensor developers provide some guidelines for sensor installation, which are mostly qualitative. For example, PIR sensors, which are commonly used for occupancy monitoring, should be installed on vibration-free surfaces so that they face the main areas of activity, or temperature sensors should be installed distant from heat sources [14,15]. The sensor developers might also provide quantitative recommendations by providing a number for coverage area or distance from air vents. However, they rarely provide information about the basis for those recommendations [15,16]. To compare such recommendations with building codes, it is found that some recommendations in building codes and standards are likely to be based on anecdotal evidence and experiences as they are often difficult to be traced back to scientific reasoning [10]. This might also apply to the installation guides from the sensor developers, indicating a knowledge gap on the factors influencing sensor performance related to their installation and positioning.
Some occupancy sensors are integrated as built-in parts of other devices such as thermostats and switches. The positioning of sensors in such cases may be restricted to the designated position of the main device. For example, switches are typically installed on 1 m height, even when they have built-in PIR sensors without an adequate field of view (FOV) in that position [17]. A similar problem exists for environmental sensors. For example, even with built-in temperature sensors, the thermostats’ typical location is at the height of 1.5 m of the walls, which might contradict the recommendations for placement of temperature sensors in specific spaces [13,18]. Numerous studies in the literature propose various applications in buildings for using multiple sensors such as PIR, temperature, CO2, light level, humidity, and acoustics [19,20,21]. Indoor environmental sensors might be used to monitor their specific aspect of indoor environmental quality (IEQ) to improve building services, or they can be fused for improved occupancy detection [20,21]. In the latter case, multiple sensors can compensate for each other’s shortcomings and limitations to improve the reliability of occupancy information without investing in complicated and costly sensors [6]. Incorporating multiple sensors together within one device can significantly reduce the sensor price, installation cost, size, and power use [22,23]. The trend of integrating multiple sensors in a single device can be observed in the emerging applications of IoT in various areas other than building monitoring, such as weather stations, parking monitoring, and military applications [23]. As the applications for occupancy and indoor environmental monitoring develop, it is becoming more common to use multi-sensor devices in recent studies related to buildings [24,25].
Due to benefits such as reduced deployment cost, sensors are becoming battery operated and wireless connected, leading to more flexibility on where and how they can be positioned [11,26]. However, the optimum performance of many types of sensors requires specific considerations on their positionings. Choosing an appropriate positioning for light sensors is crucial as their measurements may lead to different implications for controlling lighting systems if they are located too close or too far from sources of natural or artificial light [27]. Positioning CO2 sensors away from the office door can significantly improve their applicability for occupancy detection due to high air exchange when the door is open [17]. Investigations on the performance of PIR sensors in laboratory settings to detect human motion show that factors such as distance to detection target can influence their accuracy [28,29]. However, studies on the factors related to the positioning of occupancy and environmental sensors in specific built environments are limited. The scarcity of explicit information on the effect of installation practices on sensor performance contrasts with fairly extensive research on sensor technologies and their various applications in buildings. This gap is likely to cause numerous under-optimized and inadequate installation of sensors that may exacerbate the reliability of monitored data and diminishes the effectiveness of their applications to improve building performance. The research gap in sensor positioning is described by a review study on occupancy detection systems as “an urgent and challenging task requiring further research” [30].
In any sensor deployment, there would be tradeoffs between measurement accuracy and other factors such as coverage, ease of deployment, potential risk of the sensor being tempered, aesthetics, etc. Deployment of multi-sensor devices requires extra considerations, as suitable positioning might be conflicting between different sensors. In other words, optimal positioning for one sensor may be compromised to avoid unacceptable inaccuracy for other sensors. The data from faulty, misplaced sensors might be improved by data cleaning in a preprocessing stage. However, data reliability from sensors with sub-optimal positioning would be generally diminished [29,30]. This implies the need for more systematic exploratory studies of potential influencing factors on the performance of sensing devices in different spaces in built environments.
The influence of occupants on energy use in office spaces is relatively strong, thus, there is a high potential to avail from occupancy and environmental monitoring [31]. PIR sensors are among the most common sensor types used for occupancy detection in buildings [32,33]. The objective of this study is to examine how sensor positioning affects the performance of PIR sensors for occupancy detection in single-occupant offices. Further, the effects of positioning of indoor environmental sensors on their measurements are also investigated. The specific aims of this study are:
  • Investigating the effects of positioning of PIR sensors on the accuracy of occupancy detection by evaluating the factors such as distance from seated area and exposure to windows.
  • Investigating the effects of sensor positioning on the accuracy of occupancy detection when fusing (combining) PIR sensor data.
  • Investigating the effects of sensor positioning on the measurements of indoor environmental parameters, including temperature, relative humidity (RH), CO2 concentration, and illuminance.
This paper’s structure is as follows: Section 2 presents the literature review on occupancy sensing technologies and the conceptual grounding to evaluate occupancy detection and provides information on indoor environmental sensors and the applications of indoor environmental monitoring. Section 3 presents the methods and approaches used for data collection and data analysis. Section 4 presents and discusses the results of the analysis. Section 5 provides conclusions, limitations of the study, and directions for future research.

2. Sensing Technologies for Occupancy and Environmental Monitoring

2.1. Occupancy Monitoring

The importance of occupant behavior for assessing IEQ and energy use has been given increasing attention in recent years [3,34]. The increasing sensitivity of buildings’ energy performance to occupants’ behavior is probably due to more efficient building materials and HVAC systems [10,35,36]. Occupants’ behavior, including their presence and interactions with buildings’ energy systems, can significantly affect the energy performance of buildings with similar features for energy conservation (building envelope and mechanical systems) [31]. Occupant factor has become known as an important reason causing the discrepancy between the predicted and real energy and comfort performance of buildings [37,38].
The research publications on various occupancy monitoring technologies such as visual cameras, ultrasound sensors, and PIR sensors have continuously increased in recent years [2,33]. Besides the technologies primarily designed for occupancy detection, it is possible to use indoor environmental sensors such as CO2, temperature, and humidity to detect occupants [39,40]. Every occupancy sensing technology has its advantages, disadvantages, and limitations in different conditions [33].
PIR sensors have been preferred for occupancy detection in various applications due to low cost, low power consumption, simplicity, and no need for maintenance [28,33]. These sensors are stated to provide better information about occupancy than several other common sensors, including ultrasound and CO2 sensors [17]. The infrared radiation emitted from the human body enables these sensors to detect occupants [41]. These radiations are emitted from every object with a temperature above absolute zero, and the wavelength of this radiation is proportional to the temperature of objects [42]. The pyroelectric materials in PIR sensors react by being polarized when there is a spontaneous change in the receiving radiation [29]. The temperature of a typical human body is about 37 °C, and the radiated heat from a human body is within a specific range of wavelength, which can be set for PIR sensors for occupancy detection [28]. PIR sensors sense the change in emitted heat (infrared radiation) caused by occupants’ motion. Sudden temperature changes in the environment caused by sun radiation, switching airflow from HVAC vents, etc., are likely to cause false triggers. The performance of PIR sensors can be improved by using Fresnel lens made from semi-opaque plastic that focuses the light beams to the sensing element [28]. The Fresnel lens can adjust the FOV by making it longer and narrower, or shorter and wider based on the requirement of the applications.
The functionality of PIR sensors depends on their direct line-of-sight, so it is important to avoid placing them behind obstacles, in spaces that are cluttered with furniture, or placing them facing irrelevant potential motions such as occupants passing a walkway outside the area of interest. The coverage area of PIR sensors differs depending on the design of a sensor and the Fresnel lens. Most sensor developers recommend a specific range of coverage for their sensors, such as [15] with 5 m coverage. However, the decrease in the accuracy of occupancy detection with higher distance is gradual as it depends on the strength of radiation beams, which also decrease gradually with higher distance. The position of PIR sensors changes their FOV and exposes them to a different range of motions of occupants. PIR sensors can be designed to be ceiling- or wall-mounted or integrated as part of other components such as wall switches [14]. Switch-integrated PIR sensors might be more susceptible to vandalism and unintentional damage and might require more durable material [14]. Moreover, occupants are likely to unintentionally obscure such sensors with objects such as shelves or plants [43].
PIR sensors are used for a multitude of applications such as adjusting room temperature setpoint [44], lighting control with occupancy [45], building utilization monitoring [43,46], and security systems that detect intruders [47]. The majority of research on applications of PIR sensors take the occupancy detection in offices for granted without investigating the uncertainties in sensor data, while the effectiveness of those solutions is dependent on the reliability of occupancy detection [17]. According to a review study, the energy efficiency potential of demand-controlled energy systems is estimated between 15–50% [6]. However, without reliable occupancy sensing, not only would these savings not be reached, but also the comfort of occupants would be impaired. The performance of PIR sensors might be adversely affected when the occupants are overly static or due to reasons such as distance, background temperature, and low sensitivity to fine motions [33]. For example, a high distance of these sensors from the detection target can lead to false absence detection [11]. The positioning of PIR sensors plays a significant role in the reliability of their data [17].

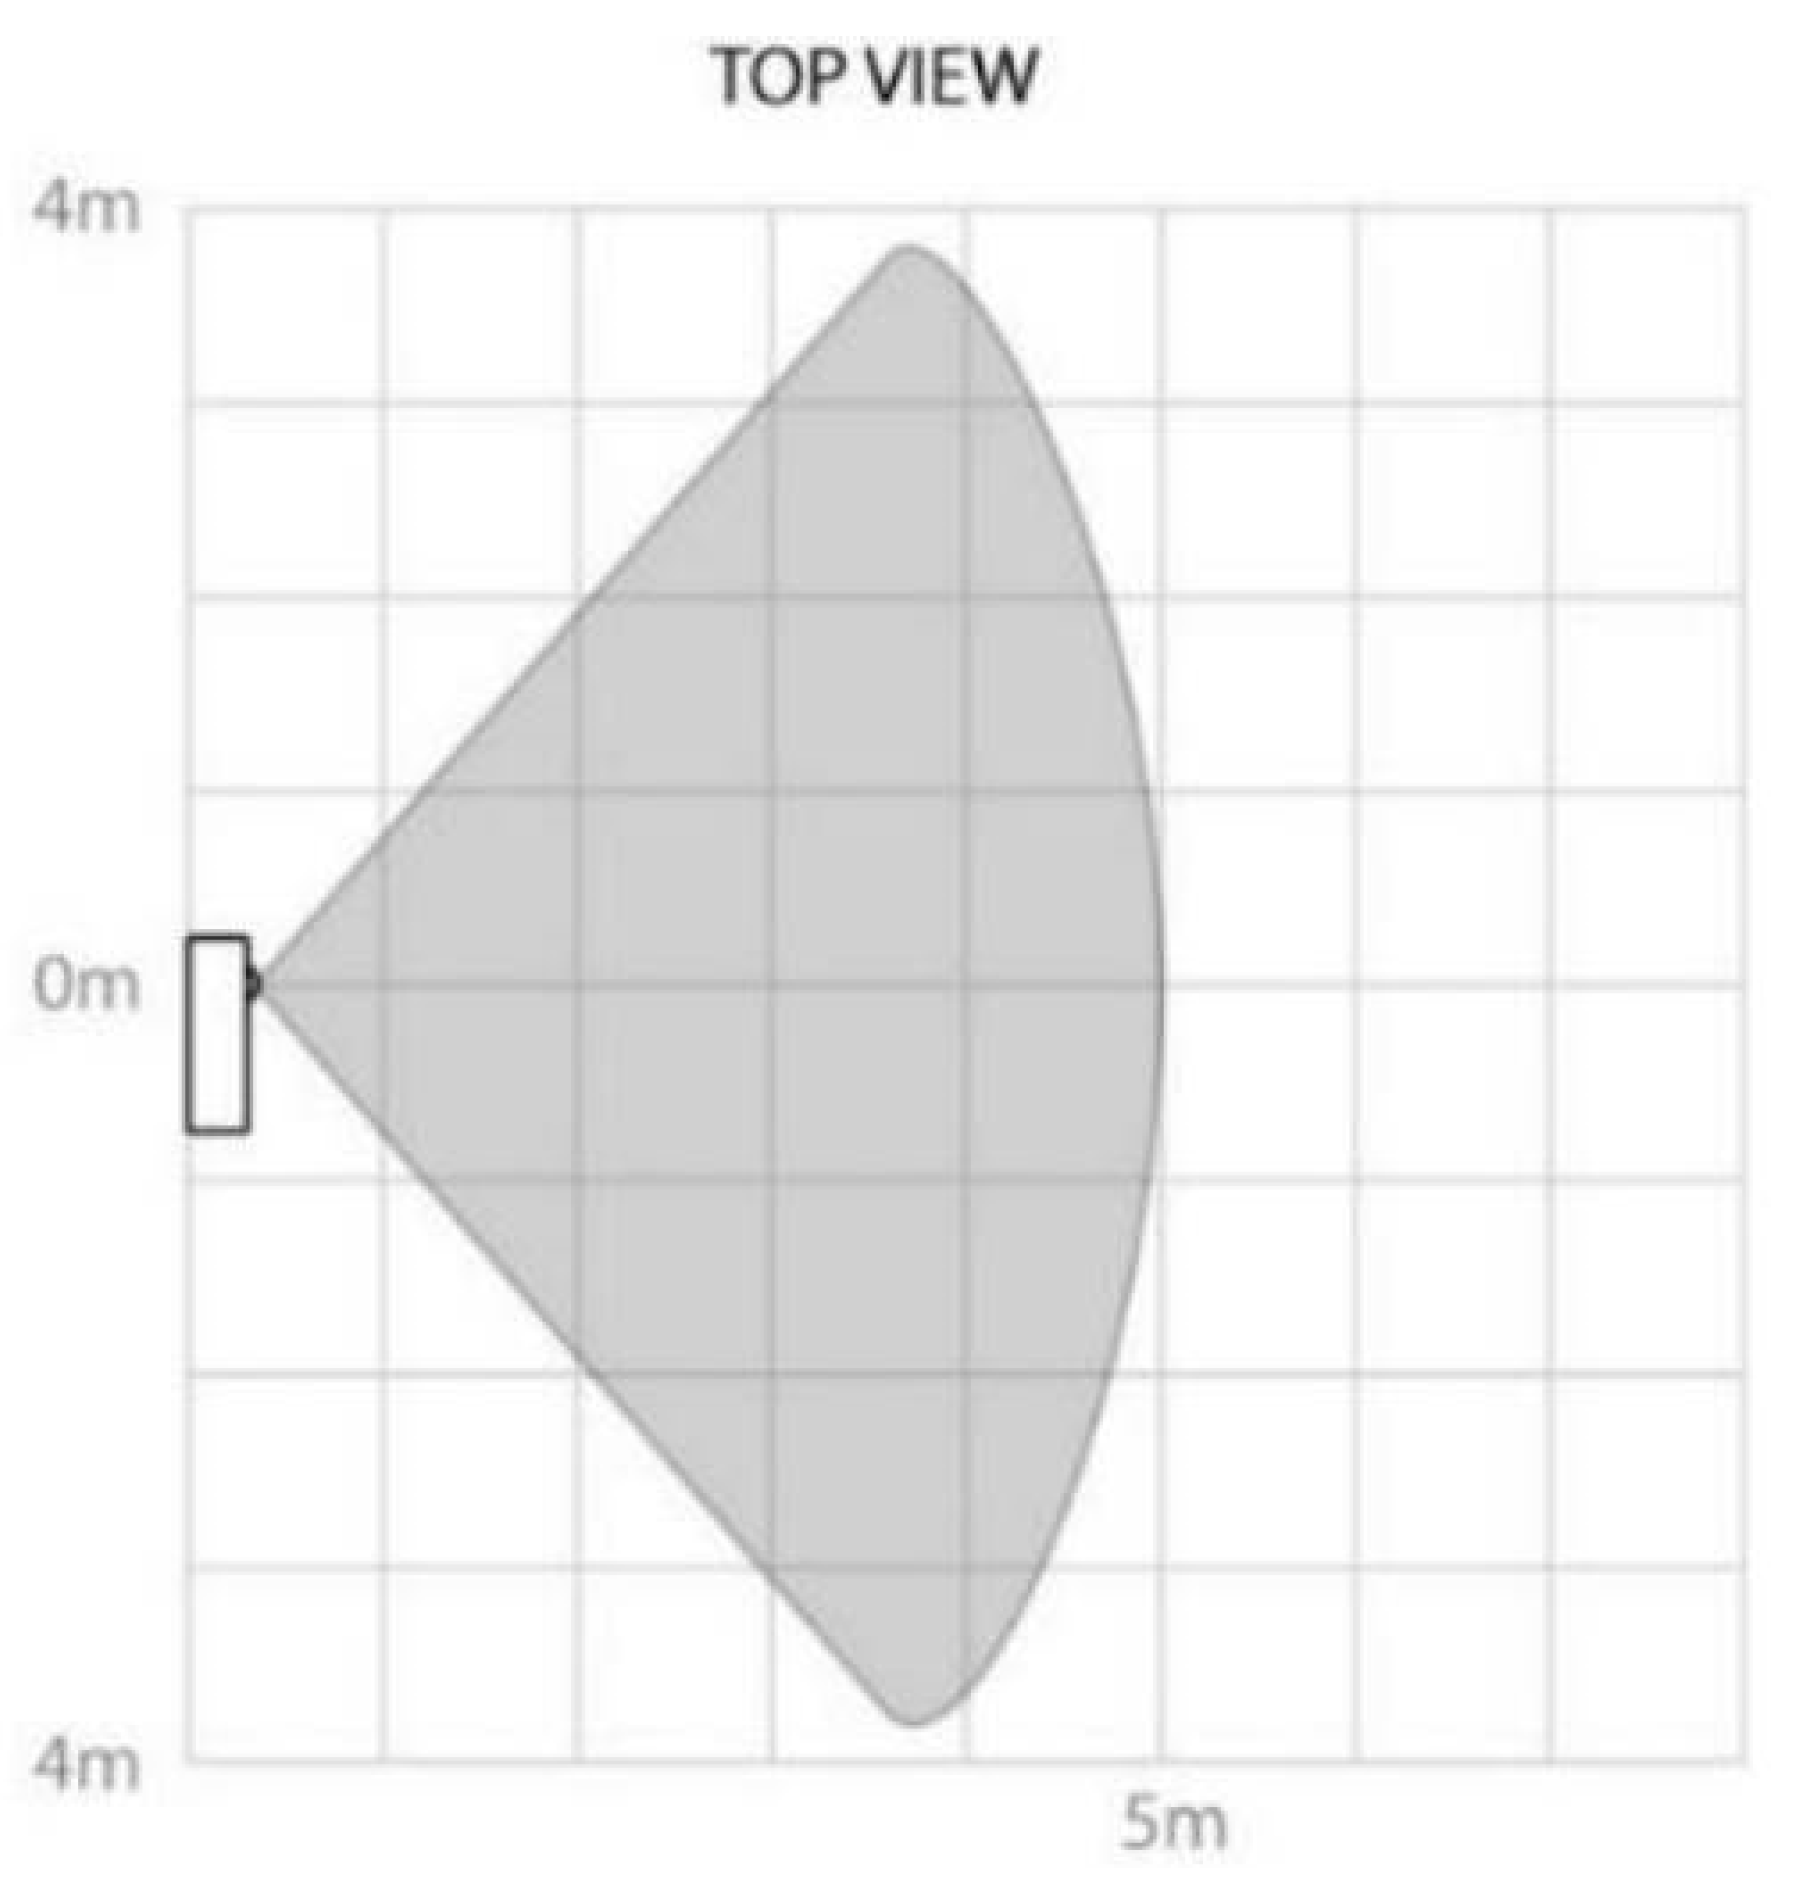
Quality of Occupancy Detection by PIR Sensors

A framework presented by [41] evaluates various aspects of occupancy sensing systems, including the aspects related to the outcome information: information type, spatial granularity, and temporal granularity. These three aspects presented in another study as three dimensions of resolution of occupancy detection, namely occupancy, spatial, and temporal dimensions of resolution [48]. As the resolution of occupancy detection increases, the occupants are more clearly defined, space is monitored in more detail, and the information is available quicker. These three resolution dimensions, along with the accuracy of occupancy detection, are the primary measures of quality for evaluating occupancy information [6].
PIR sensors are adequate for applications that require low spatial resolution. These sensors are specifically common in small spaces such as single-occupant offices due to their short coverage distance [33]. Normally, the occupant resolution of information provided by these sensors consists of only a Boolean function of presence or absence. Temporal resolution for PIR sensors is the time interval set between two data sampling. The other terminologies used for this concept include temporal granularity, timeout period, sampling interval, measurement frequency, and time-delay. If a PIR sensor detects motion within a time-delay, it interprets that the occupants are present in the space in that period. Otherwise, if no motion is detected in that period, space is inferred to be unoccupied.
Accuracy of occupancy detection is the primary criterion for the evaluation of occupancy detection systems [41]. Accuracy can be calculated separately for presence and absence periods [49]. The accuracy of presence detection is the ratio of correct presence detections to all the presence detections, and the accuracy of absence detection is the ratio of correct absence detections to the entire detections of absence. In this study, the average accuracy of both presence and absence detections is referred to as overall accuracy. When energy systems are controlled based on occupancy, incorrect presence detection or false positive error increases energy use, as energy services are provided when they are not required [17]. On the other hand, incorrect absence detection or false negative error undermines occupants’ comfort when, e.g., lighting or ventilation are controlled based on occupancy. The latter case may also eventually lead to a waste of energy when the dissatisfied occupants sabotage the system. An example is observed in a case in which an opaque material was placed on occupancy sensors to impede and overrun the automatic lighting [18].
Accuracy of detection is often calculated by comparing the monitored data against ground truth data, which is the data achieved by a more reliable method, in other words, the data that is believed to be reliable. The concept of ground truth data is widely used in other fields such as computer vision and biometrics [34]. Visual cameras often obtain ground truth data for occupancy. One study tested different sensors for occupancy detection, including CO2 and PIR, while using a video camera to achieve ground truth validation [50]. However, the privacy issues with using video surveillance limit the use of this method to obtain ground truth data [33]. Manual survey data is another common method for ground truth validation [34].
A review study reported that the typical range of accuracy of occupancy detection by various sensing systems is between 75% and 98% [41]. A study on PIR sensors mentioned an accuracy of 90% when the sensors detect human motion in less than 2 m distance [33]. Another study of PIR sensors installed on a PC monitor to detect the users during a few hours mentioned an overall accuracy of 91% [49]. The majority of studies that report accuracy or precision for PIR sensors’ performance are based on short trials without specifications of sensor positions or activity type. Such accuracy results are case-dependent, as they are specific to each sensor setup and cannot be generalized. A study on PIR sensors’ performance in laboratory settings shows that factors such as distance to detection target, size of the body, and features of motion (velocity) can influence the accuracy of occupancy detection by PIR sensors [29]. Generally, the variables that affect PIR sensor’s accuracy are sensor characteristics, space characteristics, sensor positioning, time-delay, occupants’ features, and typical activities in a space [17,28,29].
To exemplify the variability of accuracy of PIR sensors in different cases, the effect of changing time-delay (temporal resolution) on the accuracy of presence and absence detection is shown in Figure 1 from a case study [17]. As the time-delay increases, the accuracy of presence detections increases. In contrast, with an increasing time-delay, the accuracy of absence detection decreases. The rates of change are different between the accuracy of presence and absence detection. The curves for accuracy of presence and absence detection are specific to each case depending on factors such as the characteristics of PIR sensors and sensor positionings. Because of the varying relation between time-delay and presence and absence accuracy (e.g., in Figure 1), there could be an optimum time-delay for the highest overall (average) accuracy for every case. Accuracy and resolution can be quantitatively presented, and an adequate comparison of different sensing systems should consider both these quality aspects together. The focus of the analysis here is on the positioning of sensors, and the relation of accuracy with resolution (e.g., time-delay) is not within this study’s scope. However, the explanations in this section facilitate and delimit the interpretation of the results by providing a general understanding of the aspects of quality of occupancy detection.
Various applications may have different requirements on the resolution and accuracy of occupancy information [51]. For example, one study suggests that 30 min of temporal resolution is enough for space use monitoring of meeting rooms despite the data being available every 5 min [24]. High resolution of occupancy detection may cause unnecessary complexities for data communication and data storage or may entail unjustified investments [11].

2.2. Indoor Environmental Monitoring

Buildings are primarily meant to protect humans from outdoor conditions and provide a suitable environment for their activities [52]. Thermal comfort and indoor air quality are important aspects of IEQ in modern buildings, partly quantified by sensors measuring air temperature, relative humidity (RH), and CO2 concentration [53]. Research shows that homeowners’ adoption of energy efficiency measures is more likely to be motivated by improvement of IEQ rather than saving energy [54]. A recent project by International Energy Agency underlines the importance of recognizing the value of a healthy and comfortable indoor environment and the new opportunities by the advancements in sensing and communication technologies to improve IEQ [55].
CO2 sensors measure the concentration of CO2 gas in air as parts per million (ppm). The CO2 concentration of outdoor air is generally in the range of 375–450 ppm [56]. The normally accepted comfort range for indoor CO2 concentration is below 1000 ppm, while exposure to high concentration levels might cause problems such as fatigue, dizziness, and low work productivity [57]. A CO2 sensor installed indoors provides the dynamics between CO2 generated in the space and the amount of fresh air (with a lower CO2 concentration) provided by ventilation from the outdoor air. Occupants are the sole source of CO2 generation in most indoor spaces. This feature can be leveraged to estimate the number of occupants [58]. These sensors are sometimes placed in return ventilation ducts despite the fact that the air is usually the average of all spaces being ventilated and cannot be representative of a specific space [56]. Thus, these sensors are preferred to be installed in each zone where occupancy is expected to vary [56]. Similar to temperature sensors, CO2 sensors should be placed away from doors, open windows, air intakes, and air exhausts. Moreover, these sensors should not be installed where occupants directly breathe on them to prevent overly high measurements [59]. CO2 sensor might be susceptible to error when used for occupancy detection due to slow response time, fluctuations in ambient CO2 levels, ventilation rate, and door status (open or closed) [60]. These sensors are sometimes used to complement motion sensors to enhance occupancy detection [2,61].
Thermal comfort is a subjective matter which varies between individuals based on their gender, age, body mass index (BMI), etc. [62]. Models such as predicted mean vote (PMV) are developed to evaluate thermal comfort [63]. However, it is common to assess thermal comfort by assuming an acceptable range for indoor air temperature [2]. Accordingly, heating and cooling systems are often controlled using an accepted temperature setpoint [2]. Inadequate indoor air temperature can cause problems such as discomfort and health issues besides reducing the occupants’ productivity in work environments [52]. Various sensor technologies are used to measure temperature, such as thermocouples and resistive temperature detectors [63]. It is generally recommended that temperature sensors are not installed near doors and open windows on the exterior walls, near heating and cooling systems [43,59]. RH is another parameter affecting the human perception of environmental comfort, which is also included in the PMV model [63]. Humidity sensors are often designed to operate based on the changes in the resistance of their build material when being exposed to different RH levels [63]. For optimum positioning, these sensors should be placed away from humidity sources such as a humidifier or kettle [43].
A light sensor (illuminance sensor) measures the flux of visible light energy to a surface area in lux unit. The recommended minimum work plane illuminance for visual comfort in offices is 500 lux, while natural light compared to artificial light can improve occupants’ productivity [27]. The control and adjustment of an appropriate level of lighting require an accurate measurement of the light level. The positioning of the illuminance sensor influences the measurement accuracy [27]. Ceiling-mounted indoor illuminance sensors are commonly used to measure visual comfort to control lighting [2].

3. Method

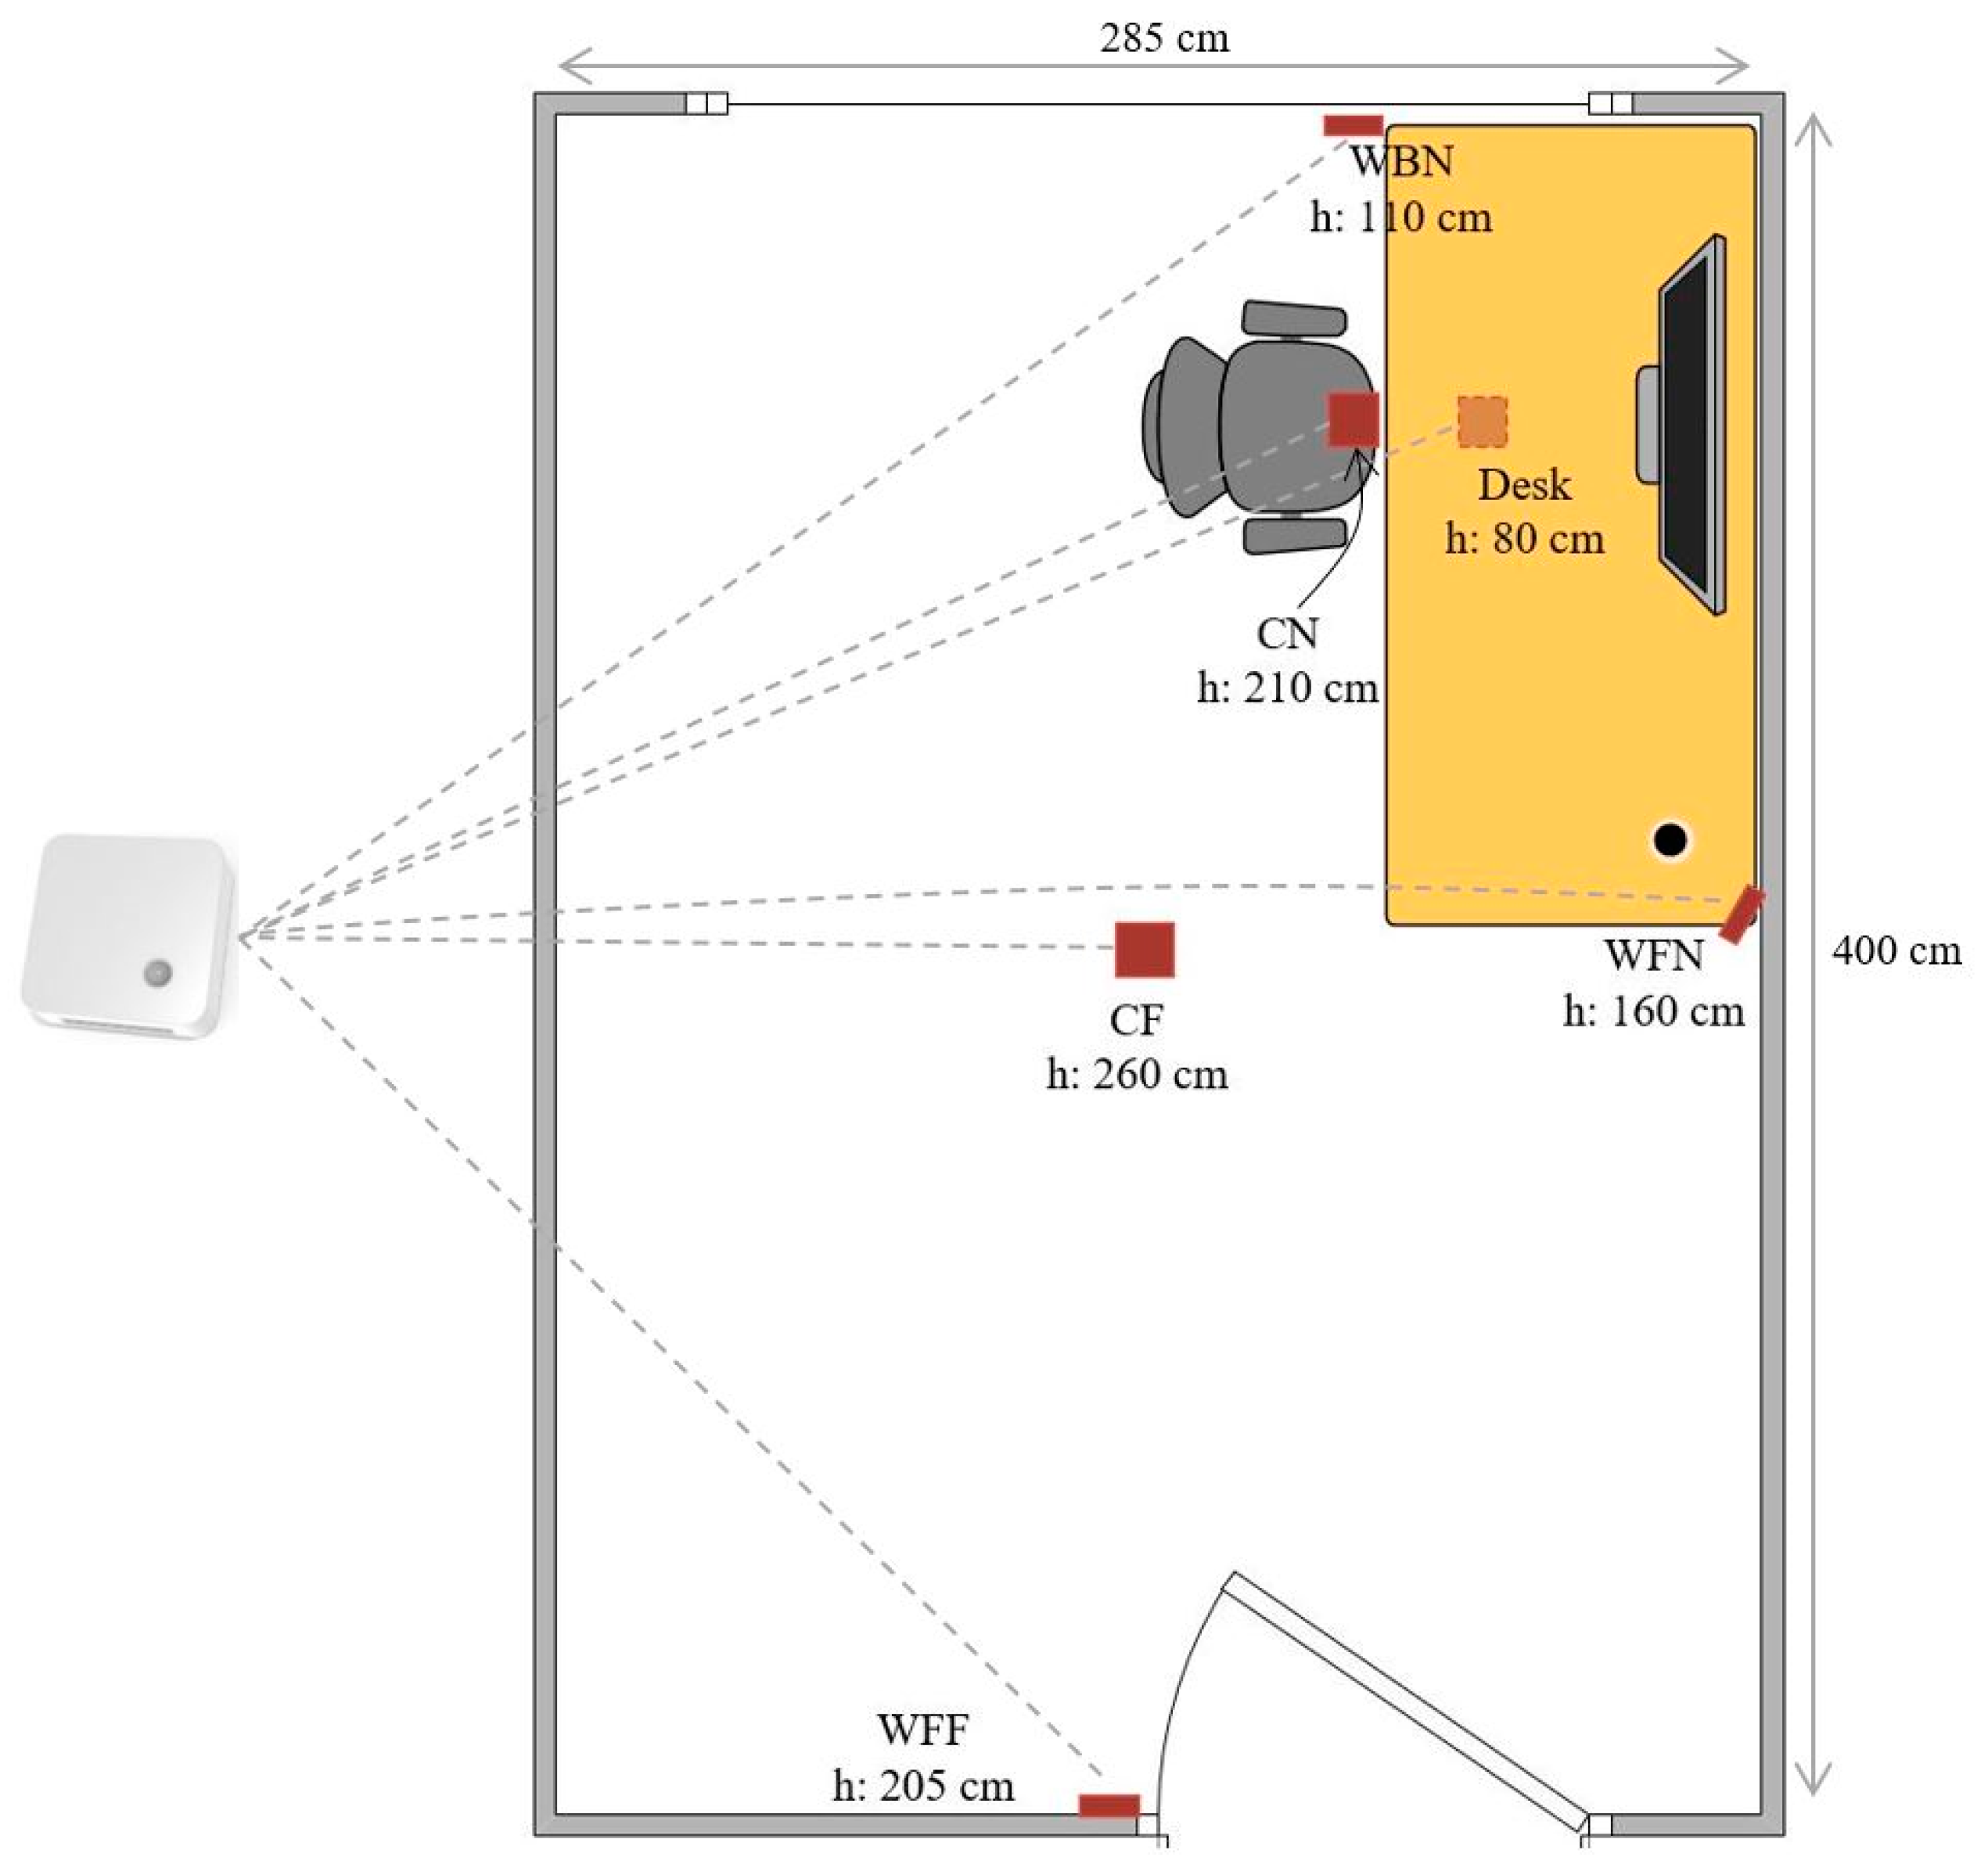
3.1. Data Collection

The data collection in three fairly similar single-occupant offices at Umeå University was carried out using six multi-sensors devices deployed in different positions in each office (Figure 2). The offices were used by researchers who were usually in the office during working hours. Offices were located on the first floor; however, their windows were approximately 3 m above the pedestrian passage outside the building. Each office was equipped with a desk and a chair, determining the primary area of activity. A ventilation inlet was located on the ceiling in the middle of each office, diffusing fresh air in all directions. The ventilation outlet in each office was located above the office door. The occupancy and environmental data were collected from the three offices during two weeks in September–October 2019.
These multi-sensor devices may be referred to as “sensor” to simplify the terminology, henceforth. The sensors shown in Figure 2 are named based on their positioning features in the offices as: Desk sensor, Window-Backward-Near (WBN) sensor, Window-Faced-Near (WFN) sensor, Window-Faced-Far (WFF) sensor, Ceiling Near (CN) sensor, and Ceiling Far (CF) sensor. Overall, in the real-life (practical) cases of sensor deployment, the positioning of sensors is partly determined by the architectural design and spatial positioning of furniture and lighting fixtures. In this study, the positionings of the sensors were chosen to cover various possibilities and include various distances to the seated area and levels of exposure to windows. The positionings ensured that the FOV of PIR sensors allowed capturing of the motions in the seated area of the offices where the occupants spent most of their time in the office. The relative differences between the sensors on their distance to the seated area and their direction of sight regarding the window and the occupant can be used to identify the factors influencing the measured data. The sensors shown in Figure 2 by square shapes were installed vertically (with vertical view) on the ceiling (CF), light fixture (CN), and under the desk (Desk). The sensors shown with narrow rectangular shapes (WBN, WFN, and WFF) were positioned horizontally (with horizontal view).
All multi-sensor devices, except Desk sensor, were identical and had PIR, temperature, RH, CO2, and light sensors. The specifications of these sensors are presented in Appendix A (Appendix A.1, Appendix A.2, Appendix A.3, Appendix A.4 and Appendix A.5). Desk sensor had all the mentioned sensors except the CO2 sensor. This multi-sensor device incorporated an additional IR camera, although its data are not used in this analysis. As the sensors were battery operated and used wireless data transmission, their installation was facilitated without wiring by simply using double-sided adhesive tapes. The sensors used LoRa (Long Range) wireless network, which is categorized as low-power wide-area network and has been widely utilized in devices for IoT applications [64]. Reducing the frequency of data logging and transmission increases the sensors’ battery life. The multi-sensor devices were set to transmit data in 10-min intervals, which is common for building monitoring systems in various studies in the literature [44,45,65]. The data are thus in the form of regular time series instead of being event-based (such as data transmitted when a motion detected by PIR sensor), which allows the measured data by different sensors to be time-aligned and comparable. The data were collected in a middleware database platform, which allowed easy access to all sensors via the internet.
The in-situ data collection approach used in this study is relatively cost-effective for long-term data collection compared to laboratory studies since there is no need to recruit participants. The research subjects continued their daily routines during the data collection period, and the offices were performing similarly to living laboratories that are monitored to understand how the occupants use them. The occupants were explained that the collected data could not reveal any information about their activities other than their presence and absence. This privacy assurance aimed to improve data collection reliability by preventing the Hawthorne effect (where observation causes changes in occupants’ behavior) [34]. Further, the participants were assured that the data would be anonymized for the analysis and reporting of the results.
The occupants of the 3 offices were asked to manually annotate the time they enter and leave the offices on tabulated paper sheets provided to them. This information was then entered in timetables to be used as ground truth data to evaluate the reliability of occupancy information obtained from the sensors. However, after the data collection, a few occupants reported that they might have forgotten to input their occupancy information a few times during the trial period. This is a common problem in long-term or large-scale experiments as relying on the concentration of the person providing the occupancy information is susceptible to faults [66]. Thereby, the ground truth information was improved using the sensor data, which is further explained in the following section.

3.2. Data Pre-Processing

The data used for the analysis were collected from several sensors every 10 min for two weeks. The data from different sensor devices with different configurations, offsets, and sometimes different sampling frequencies were required to be aligned and merged within a consistent format. Moreover, the missing data due to interruptions in wireless communication were needed to be identified for each sensor. Thus, the initial data cleansing was a necessary preprocessing stage for the data analysis to correct the errors in the gathered data.
It was initially intended to use cameras to record the occupants during the data collection period to have robust ground truth data. However, this plan was rejected due to privacy concerns. The ground truth data reported by occupants is the main reference to analyze the performance of different sensors. However, as the occupants sometimes forgot to record their presence, the PIR dataset collected by all deployed sensors were used to improve the ground truth data. A few occasions of the missing records of presence in the ground truth data were recovered by using the following criteria:
  • if at least half of the PIR sensors (i.e., three out of six sensors) have detected occupant’s presence, and
  • if one of these sensors is either the Desk or CF sensor.
The second criterion is based on the assumption that the occupant is either sitting in front of the desk (which can be detected by Desk sensor) or moving around the office wherein they could be detected by the CF sensor due to its wide FOV and coverage area. This strict criterion improves the reliability of ground truth correction by decreasing the probability of false negative errors despite the fact that its eventual effect on correcting ground truth is found to be negligible. Without considering the second criterion, 10.8% of the reported ground truth information is corrected compared to 10.1% when both criteria are applied.

3.3. Data Analysis

The effects of positioning on the occupancy and environmental monitoring by multi-sensor devices are analyzed. A large part of the analysis is related to evaluating occupancy information by examining the accuracy of data from different sensor positionings. Presence, absence, and overall accuracies are calculated by contrasting the sensor detections with ground truth data. Detection accuracies of PIR sensors in different positions are compared while the influence of factors such as the distance of sensors to occupants, exposure to window, and other general installation considerations are investigated. PIR sensors are normally not affected by light (radiation in the visible spectrum) from windows. However, solar radiation comprises radiation in different spectrums, including infrared that might affect the performance of PIR sensors. Infrared radiation can also be emitted from objects inside the offices heated by sunlight transmitted through the windows.
Moreover, the potential accuracy improvement by sensor fusion is investigated. Two common hard-decision data fusion rules based on logical operators of OR and AND are tested for the analysis [67,68]. In a hard-decision fusion, the measured data is being processed by each sensor locally to make an initial binary decision about the monitored target (either being present or absent) individually. The local decisions are then reported to a fusion center (FC) to be fused by hard decision fusion rules such as OR, AND, or Majority, which are all special cases of the k-out-of-N rule. On the other hand, in a soft decision fusion scheme, the FC receives more information instead of binary decisions. Although a soft decision fusion scheme may provide more information with higher reliability to the FC results, the hard-decision data fusion approach uses simpler algorithms. Accordingly, it avoids communication overheads to the system, which are unnecessary in many applications. In this analysis, OR and AND decision rules are applied to 30 pairs of datasets comprising six sensors (positions) based on presence detection. Data fusion with OR infers presence if at least one sensor detects presence, whereas the analysis with AND infers presence when both sensors detect presence. This analysis is conducted only for pairwise fusion (two sensors together), although theoretically even more sensors can be used together to improve occupancy detection further. However, using more than two PIR sensors may not be viable for single-occupant offices due to the high cost and complexity for, presumably, a small improvement in occupancy detection.
The effect of sensor positioning on indoor environmental measurements, including temperature, RH, and CO2 concentration are also investigated. Unlike the occupancy information, it is not viable to calculate the accuracy for environmental parameters as there is no ground truth information for them. Hence, in this analysis, the indoor environmental parameters measured by six multi-sensor devices (except CO2 by Desk sensor) are compared by depicting their average hourly time series. Among the indoor environmental parameters, CO2 sensors have a higher potential to be used for occupancy detection, as the change in CO2 concentration is primarily related to the occupant’s presence and activities [30]. Accordingly, the correlations between occupancy and CO2 concentration measurements are analyzed to determine the suitable sensor positions if the CO2 sensor is used for occupancy detection.

4. Results and Discussion

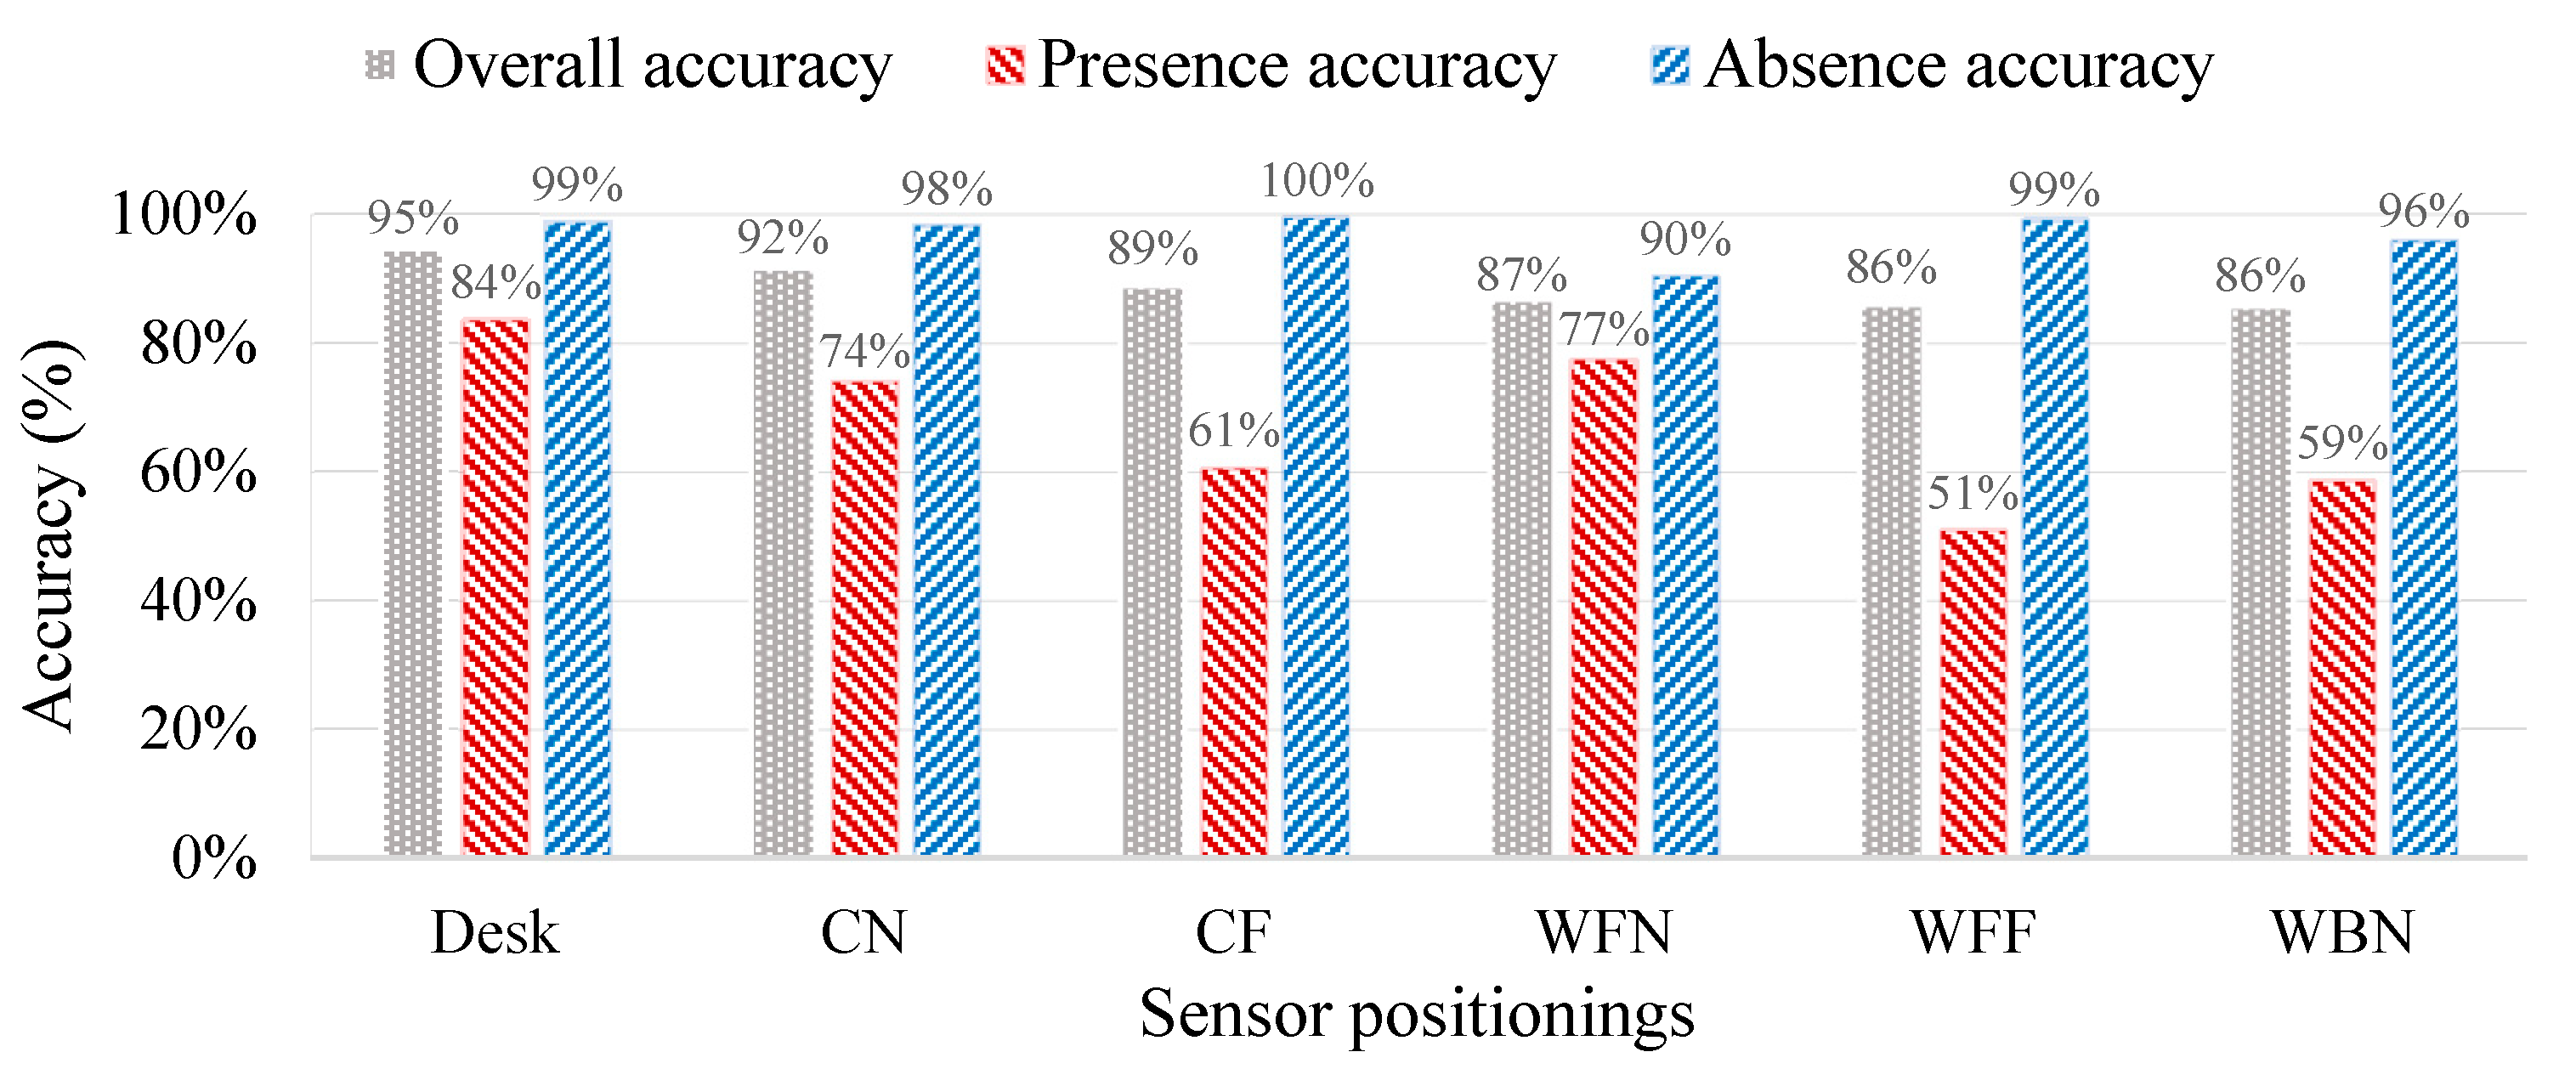
4.1. Effect of Positioning on the Accuracy of PIR Sensors

Figure 3 shows the average accuracy of PIR sensors in different positions. The data related to sensors in six positions were collected from the sensors installed in three studied offices. The calculation for overall accuracy includes the data related to both occupied and unoccupied periods. The overall accuracy of sensors ranges from 87% to 95%, with WFN and Desk sensors comprising the lowest and the highest accuracy. Detailed investigations of occupied and unoccupied periods separately can be more informative on the performance of sensors. Absence detection is significantly more accurate than presence detection for all the sensors, with an average of 97% accuracy compared to 68% accuracy for average presence detection. The WFF sensor with 51% has the lowest presence detection accuracy. The Desk sensor provides the most accurate presence detection with 84% accuracy. The sensors provide relatively similar accuracy for absence detection. Apart from the WFN sensor, which has 90% accuracy of absence detection, the accuracy of the rest of the sensors are fairly close to each other in a range between 96% and 99%. The relatively lower absence detection accuracy by the WFN sensor could be due to two reasons. The proximity of this sensor to the window and its orientation towards the window causes it to be more exposed to solar radiation and solar-heated surfaces.
The results show that accurate presence detection is more challenging for PIR sensors as compared to absence detection. The sensor performance on detecting presence is dependent on the detection of occupants’ motions. Motion detection can be affected by various factors related to positioning, including distance (to detection target) and ambient infrared radiation from windows.
Table 1 shows the distance of different sensors to the only chair in the office. Henceforth, the distance of sensors from the chair is briefly referred to as “distance of sensor”. The occupants are researchers at university, and their main activities include working with their computers while sitting on a chair. The results show the significant effect of the sensor’s distance to the seated area on the accuracy of presence detection, indicating that the occupants mostly spend their time sitting on the chair. Comparing sensors’ accuracy in different distances is more reasonable when the sensors face the occupants from a similar direction to ensure they capture similar motions. Two pairs of sensors with fairly similar directions to the occupants are CN-CF and WFN-WFF. Comparing their accuracy of presence detection in relation to their distance to the seated area shows the accuracy drops by 13% for every 1 m of more distance, although the sensor developer recommends 5 m range of detection. It is worth noting that CF and CN sensors have different angles of view towards the seated area, which may affect their sensitivity on motion detection in that area. However, based on the sensors’ specifications (Appendix A) and the installation settings (sensor height and office dimensions), it is ensured that the detection sensitivity is not significantly different between those two angles of views in the case study offices.
The only outlier result is related to WBN, which has an accuracy of only 59%, although, considering the distance from the seated area, it was expected to have an accuracy close to WFN, which has a higher accuracy of 77%. One reason for the difference can be the effect of sunlight (which includes radiation in the infrared spectrum) and absorbed heat (thereby emitting infrared radiation) by the surfaces in its FOV, causing difficulty in distinguishing the occupant’s motion. This may increase the possibility of false negative error in WBN. Another reason can be the orientation of this sensor towards the occupants’ shoulder side, limiting its view to some parts of his/her body. This problem may be exacerbated by the proximity of the sensor to the occupants. WBN is positioned very close to the occupant, where it may not have an appropriate view of the parts of the occupant’s body such as the head and legs of the occupants, which have a high potential of motions.
In addition to distance and exposure to windows, the orientation of a PIR sensor with respect to the occupant affects the possibility of detecting different occupants’ motions. This geometrical complexity is mainly related to the angle of view to the occupant, which can improve the sensor exposure to specific motions. For example, a PIR sensor positioned on the ceiling has the view of occupants from a completely different angle compared to a wall-mounted sensor. The FOV of the Desk sensor allows only the detecting of the motions from the lower parts of the occupants’ body, which are mostly concealed by the desk for all of the other sensors. Another example of the orientation effect is when a sensor is positioned on the backside of an occupant while the seatback might obscure most of the motions of a seated occupant.

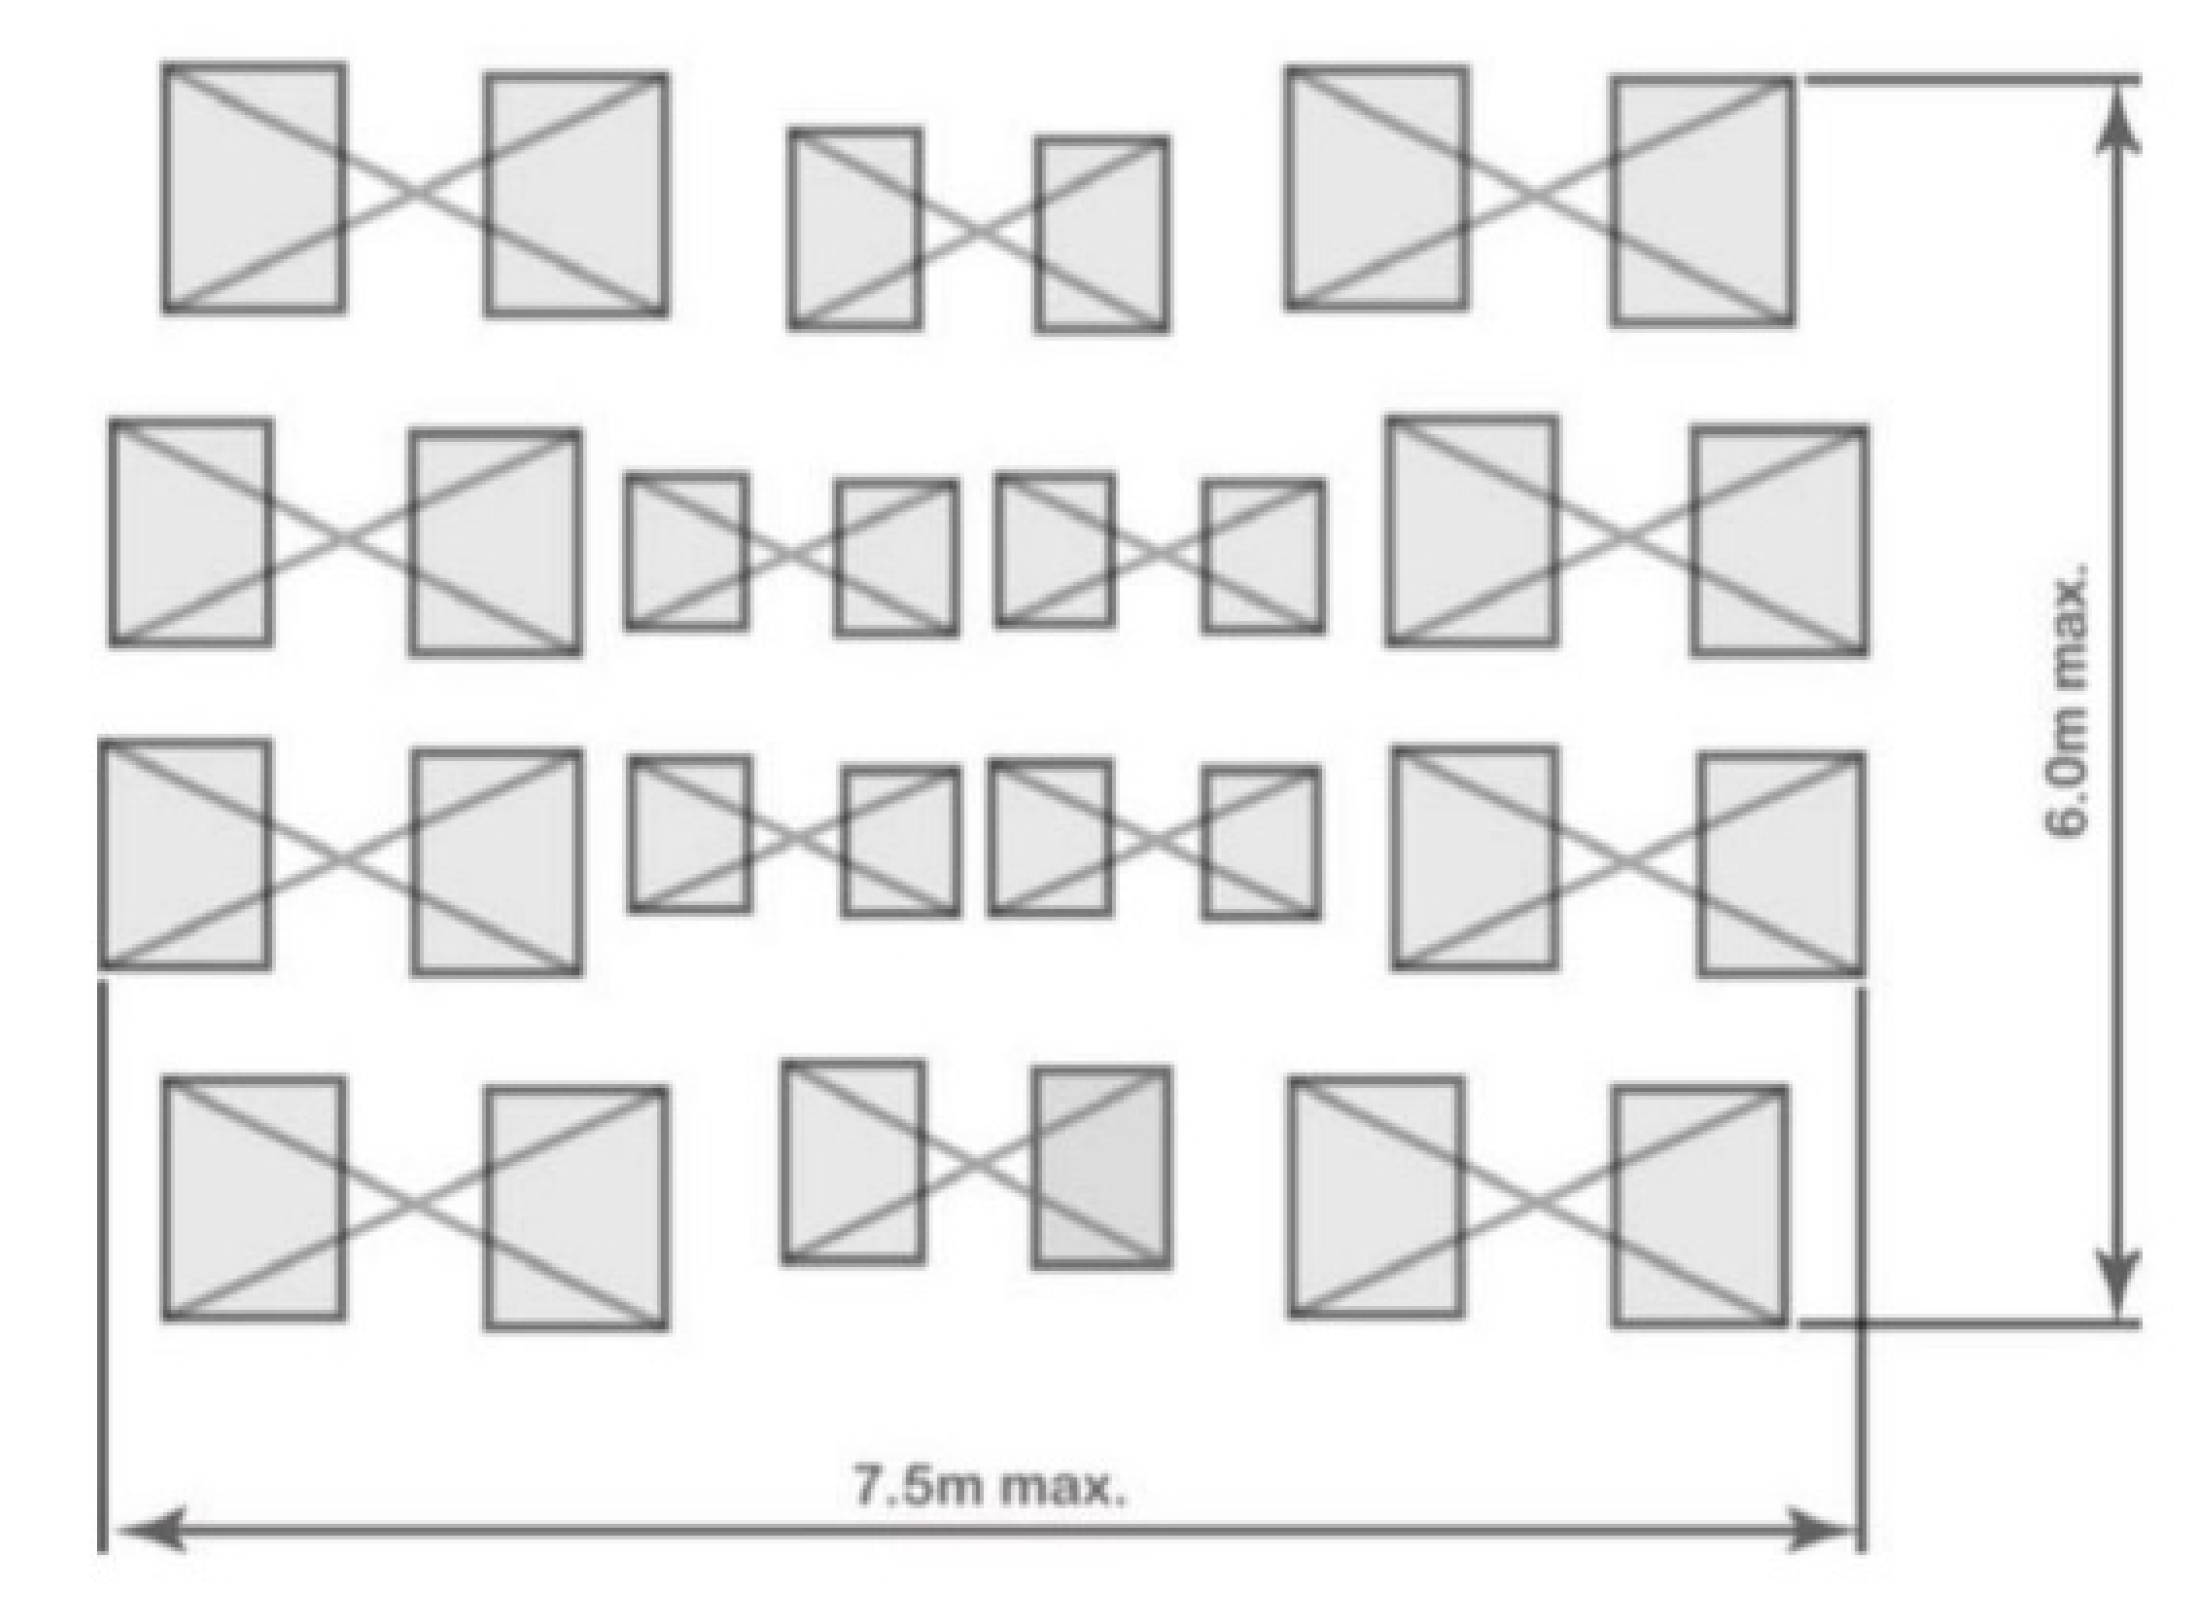
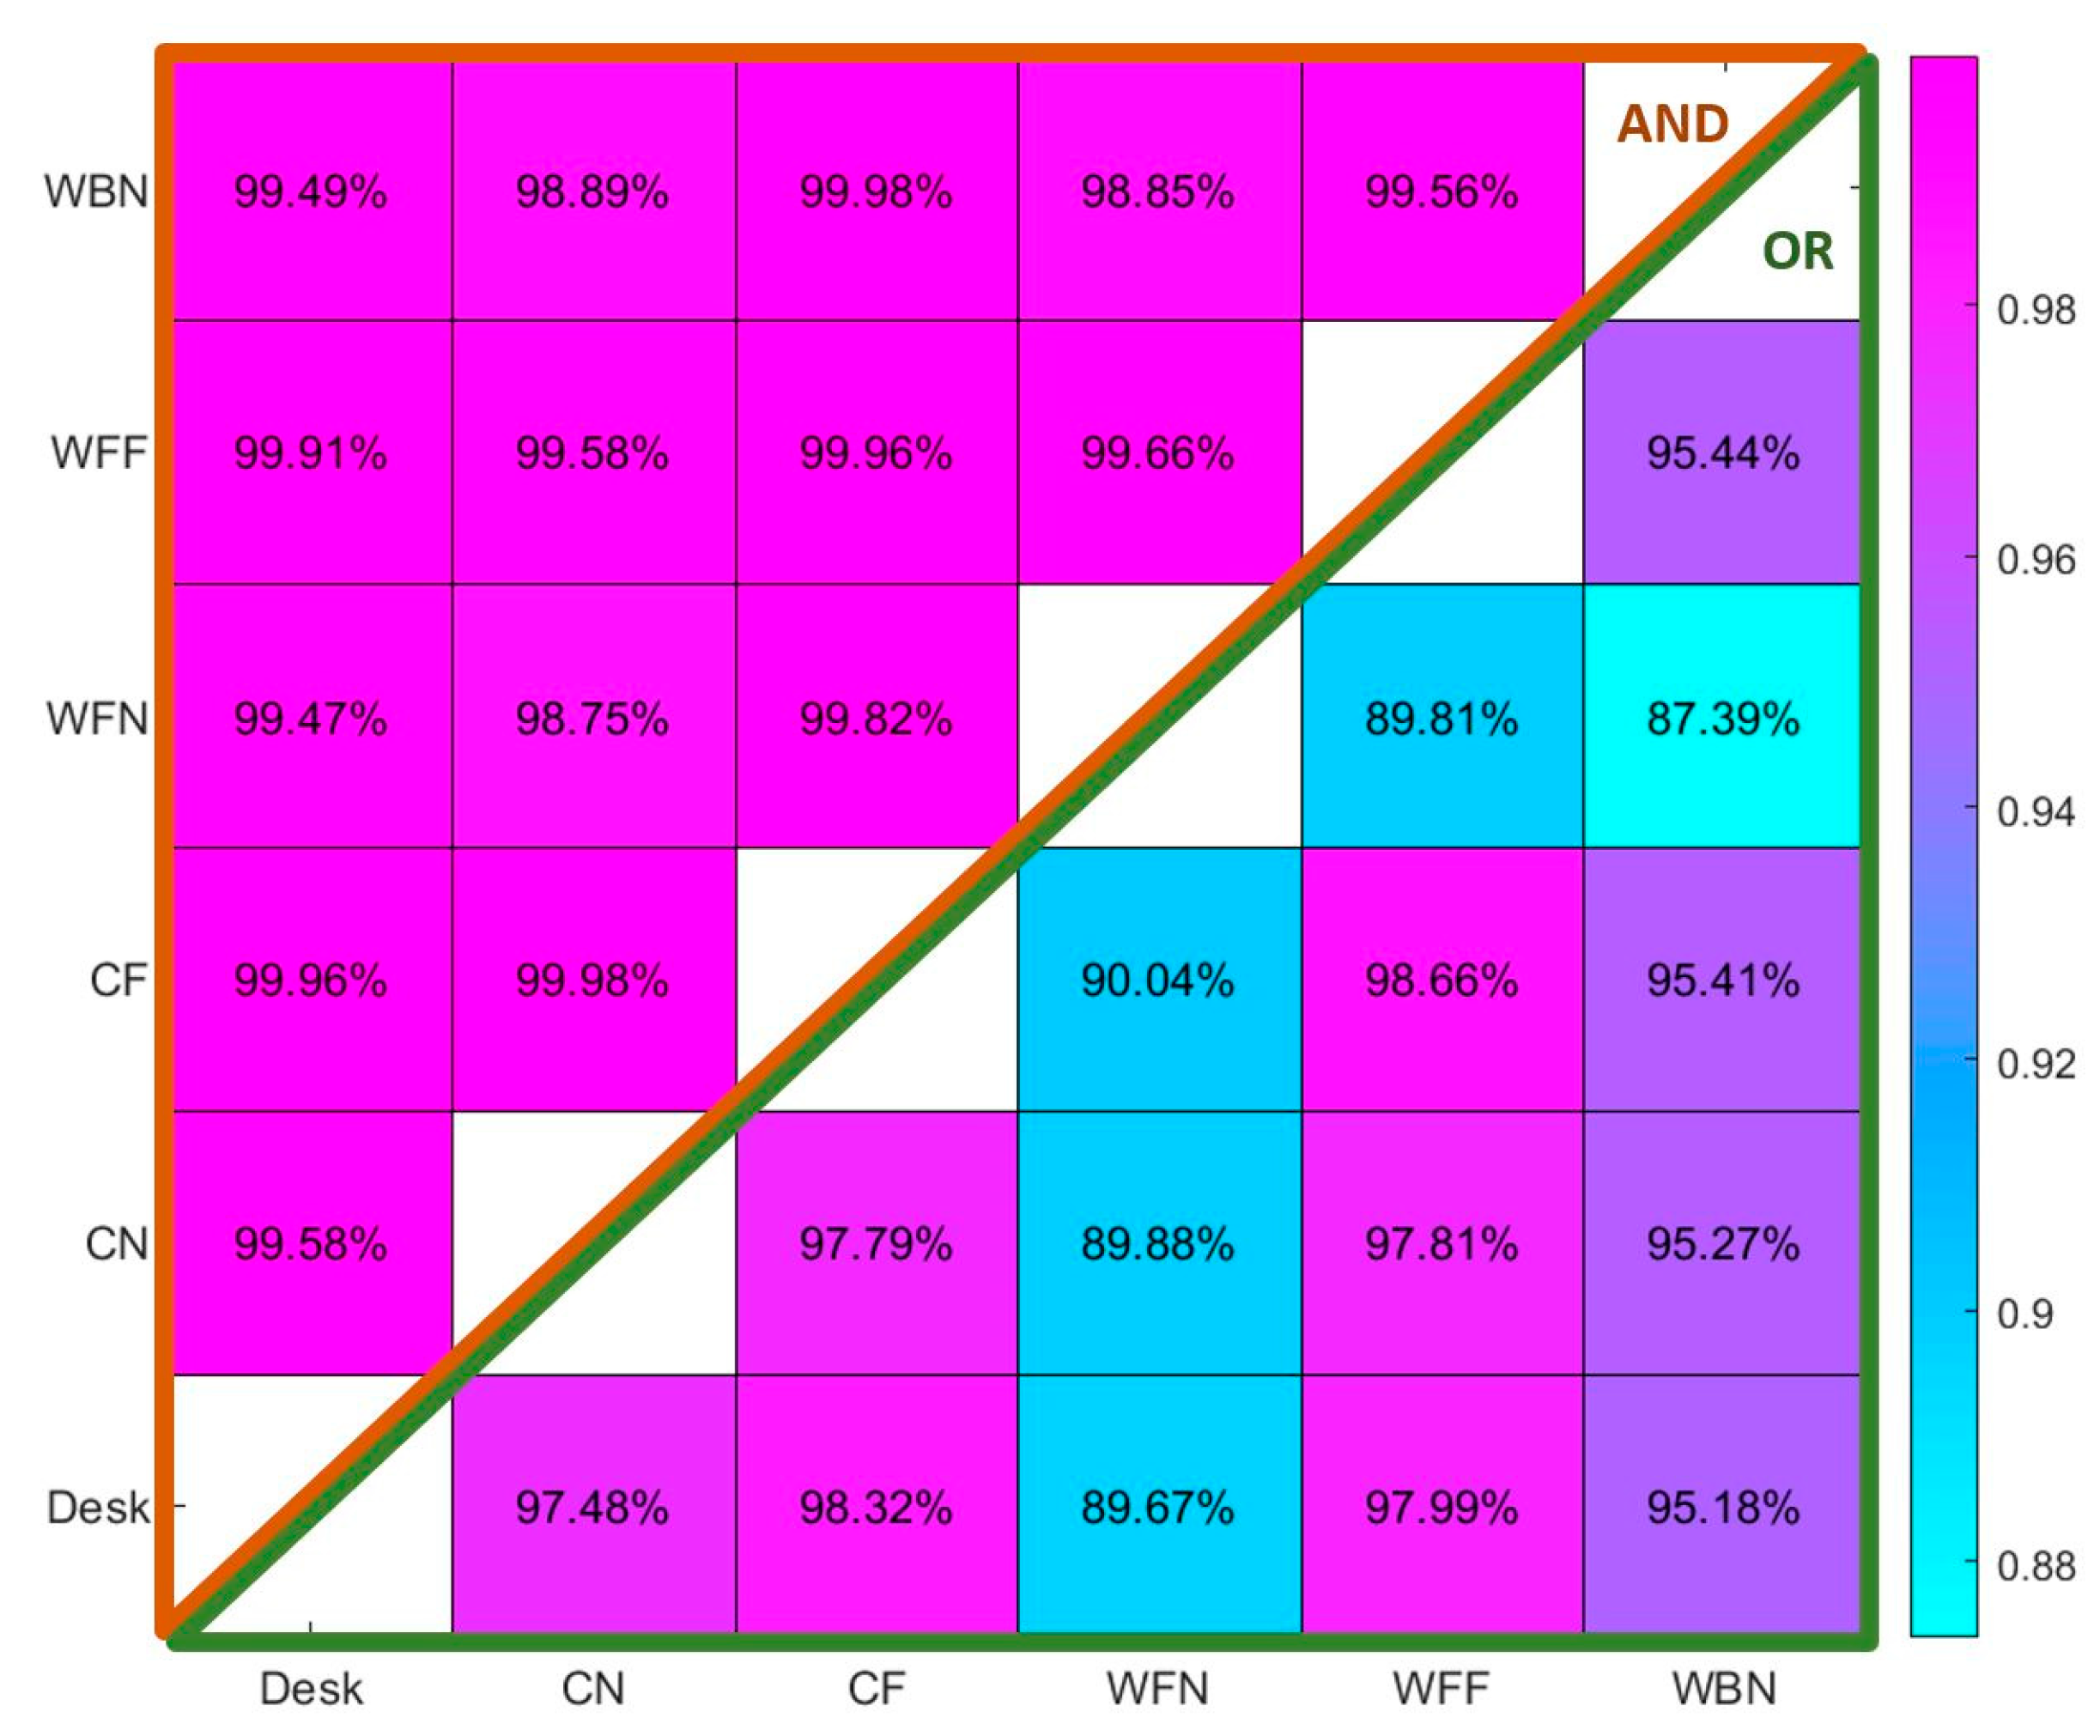
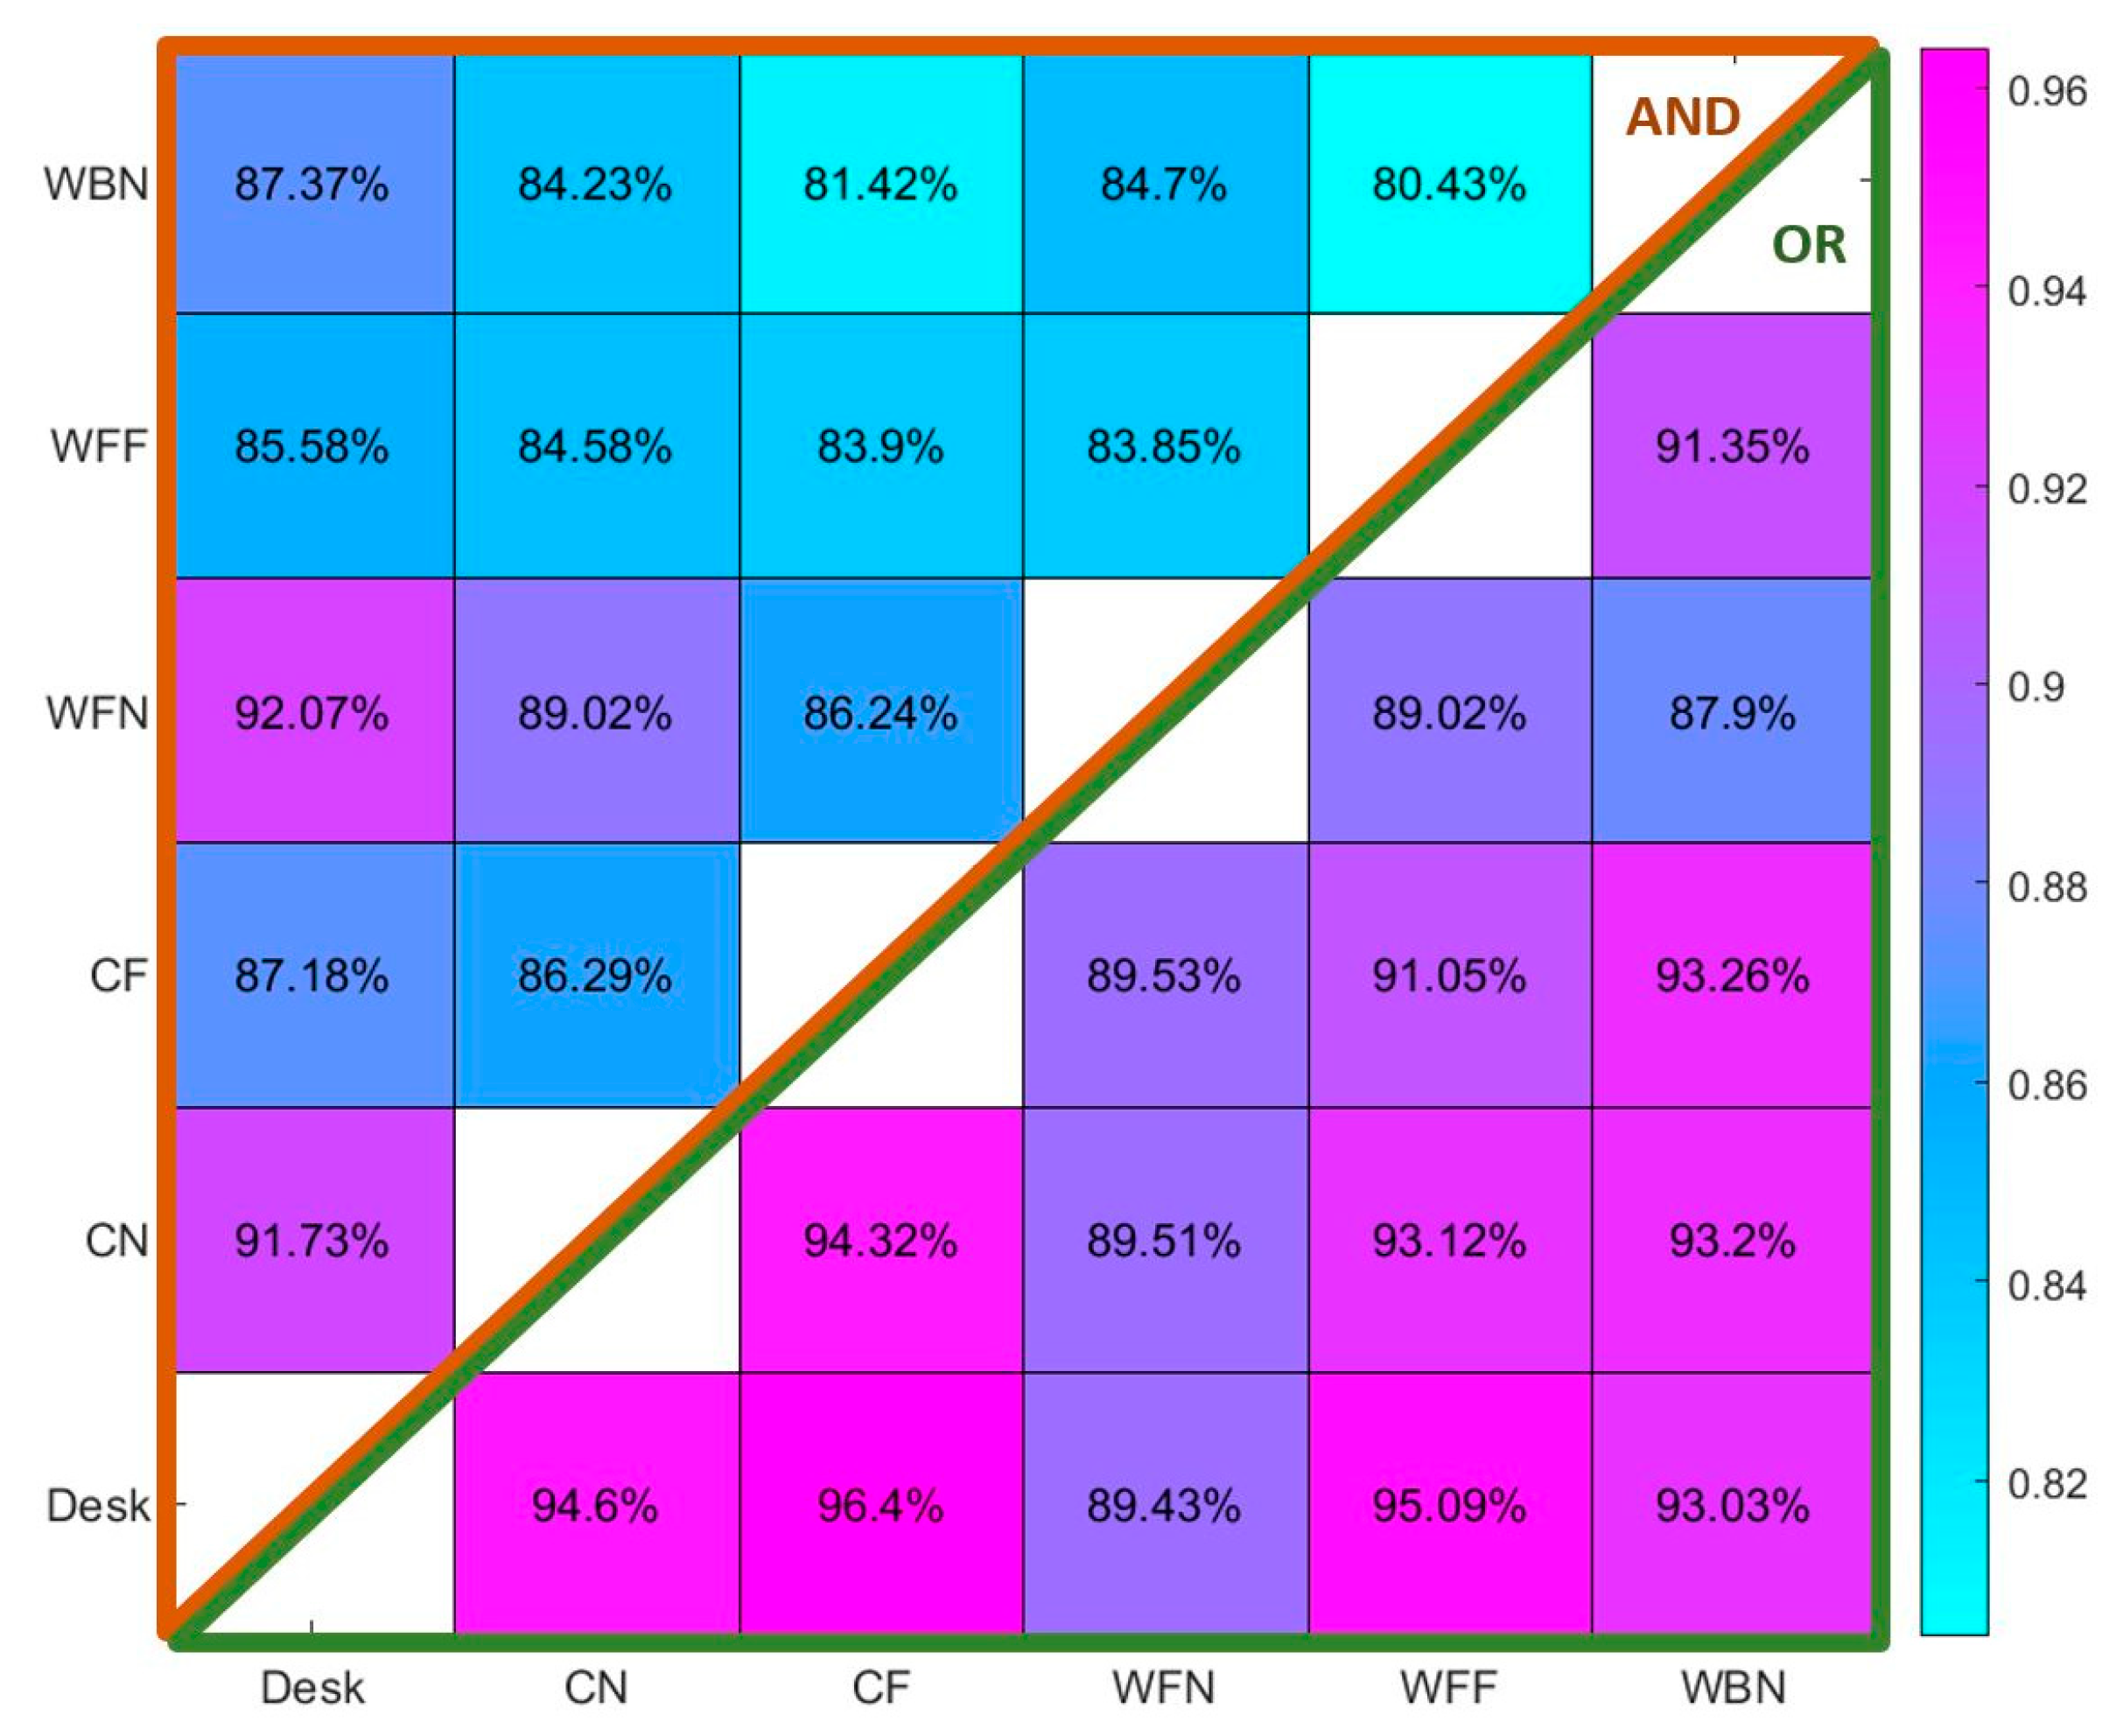
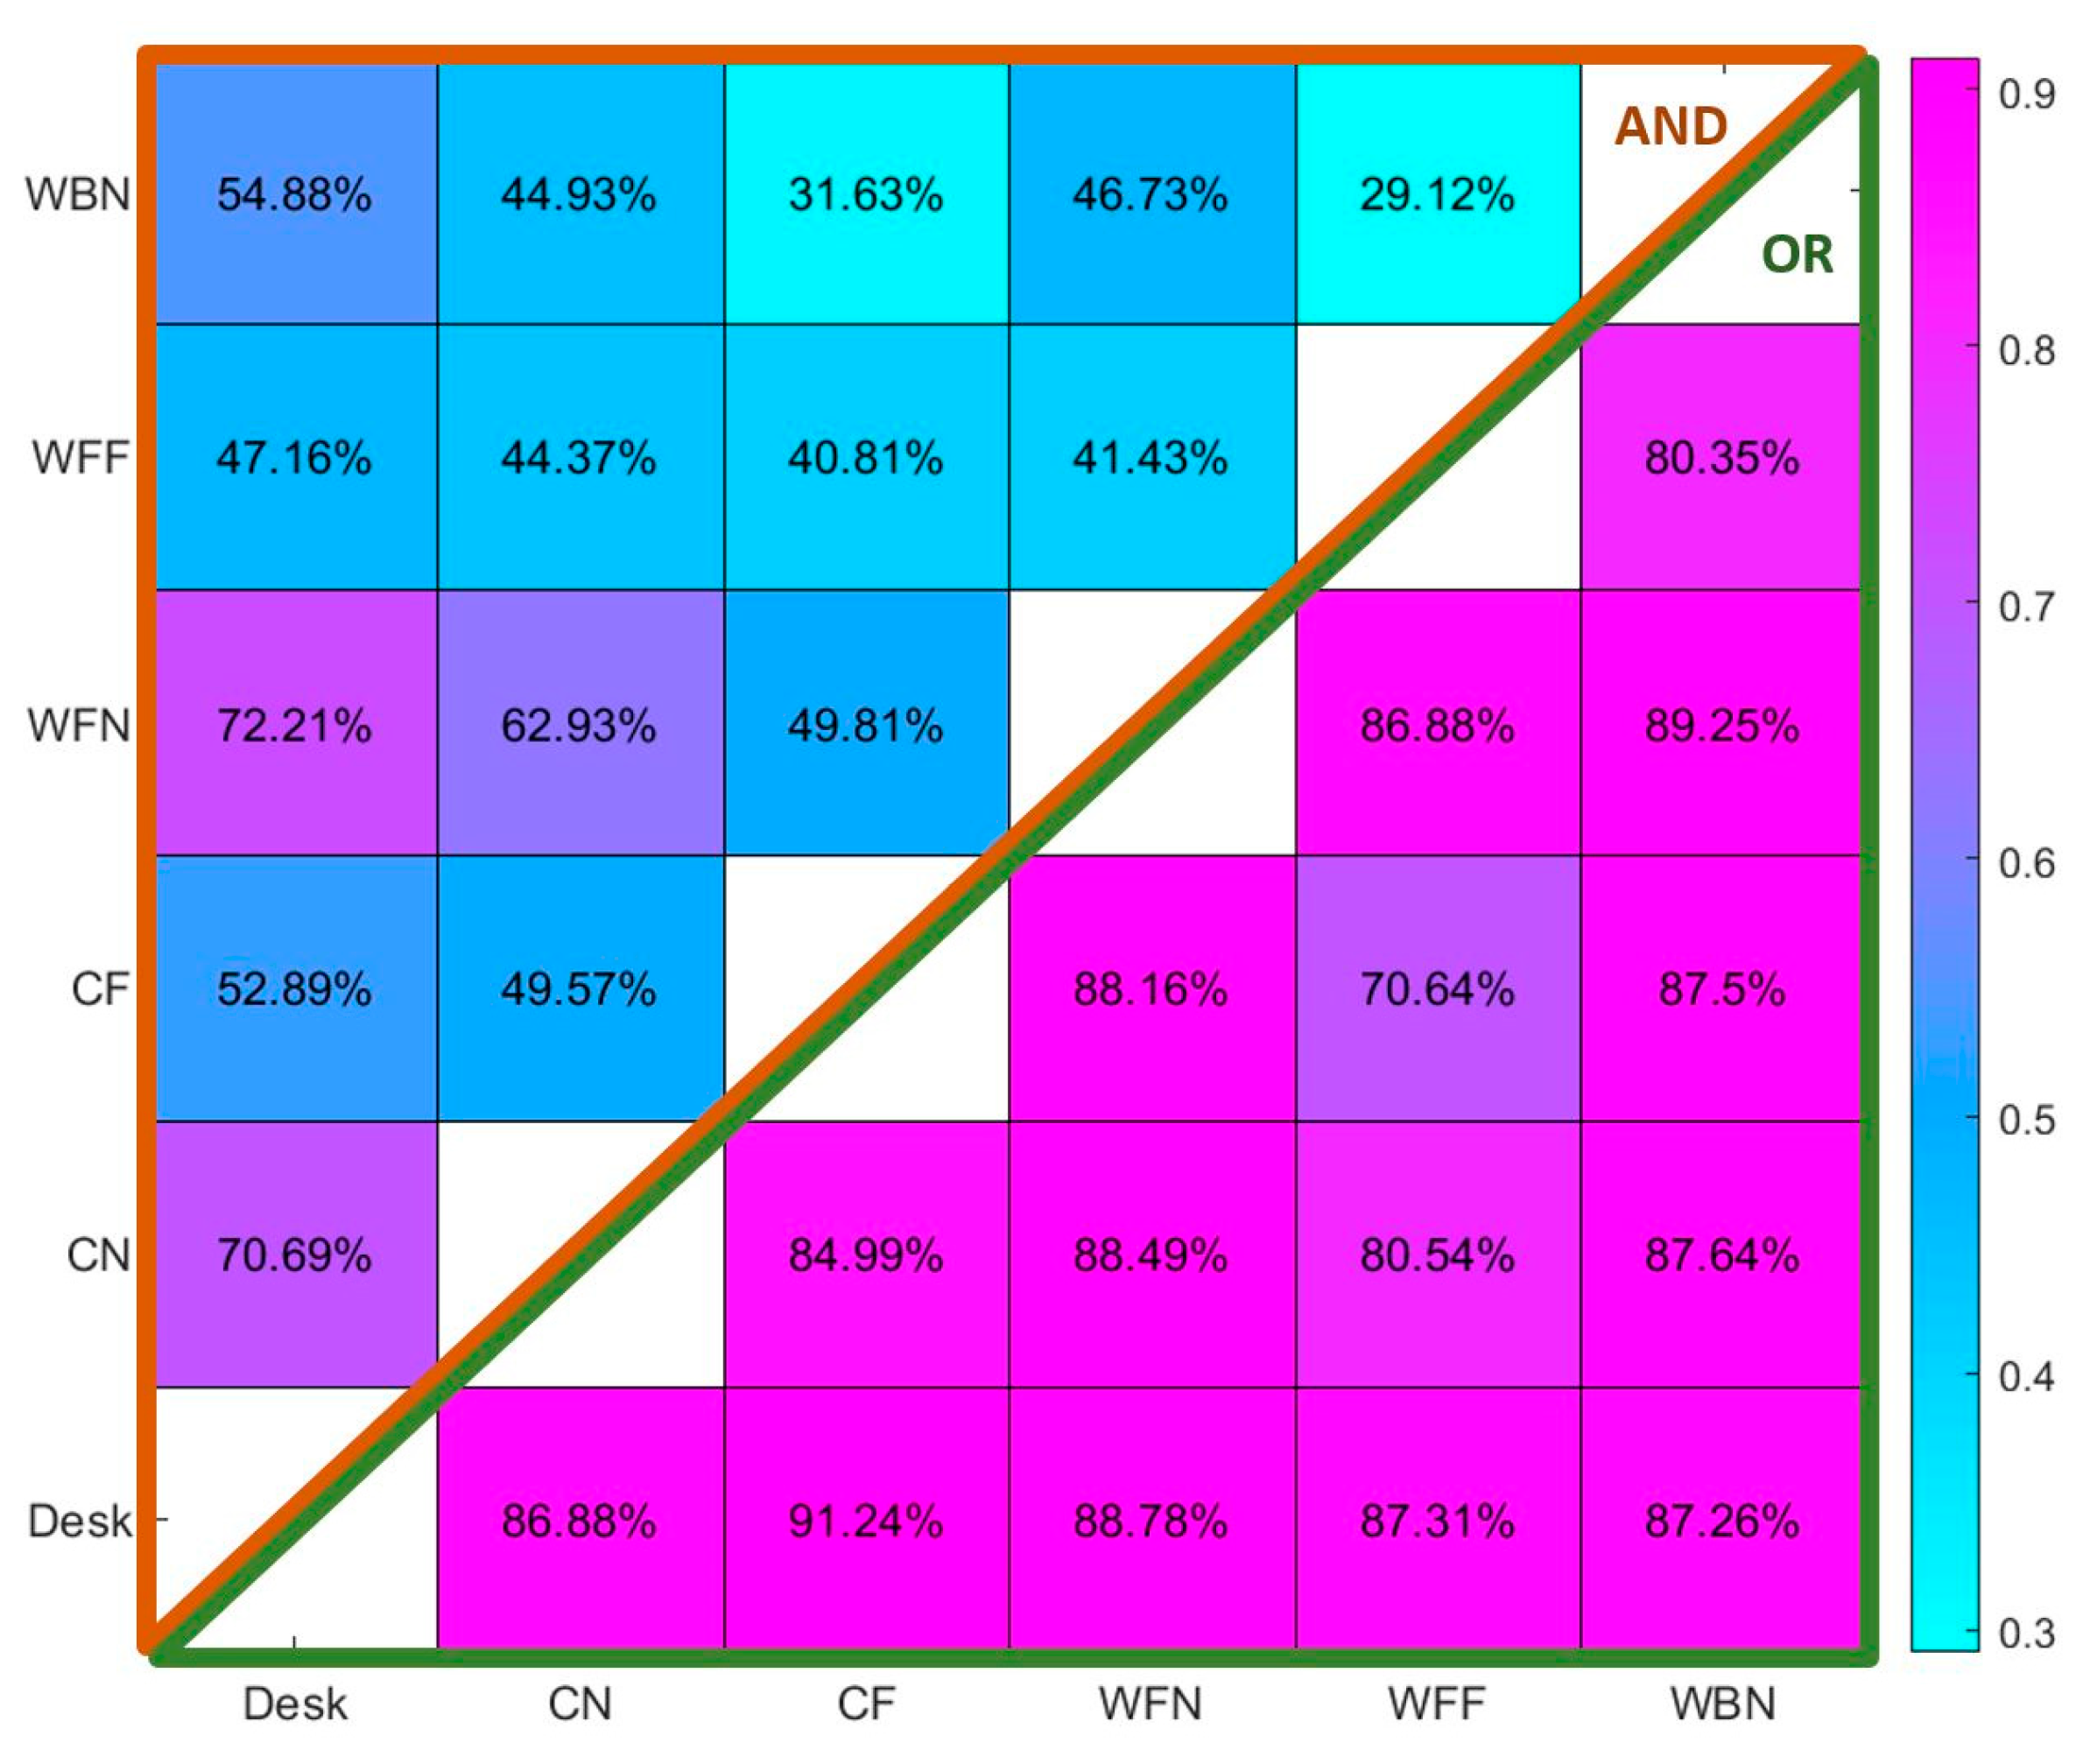
4.2. Fusion of PIR Sensors in Various Positions

As discussed in the previous section, the Desk sensor offers the most accurate occupancy detection. However, this result may vary in offices with additional furniture or when the occupants do not spend their time in the office seated in front of their desk. Accordingly, the Desk sensor may be sensitive to the alternative work styles and seating positions. Based on our observations, the following limitations may hinder the application of the Desk sensor for occupancy detection in offices:
  • The FOV is limited to the area in front of the desk.
  • The FOV can be easily blocked with the chair when the occupants are not seated.
  • It is positioned under the desk, which makes it susceptible to displacement by unintentional physical contact.
Nevertheless, avoiding the Desk position due to the above limitations may be an oversight as the analysis shows the sensor in this position has a relatively high detection accuracy when the occupants work in front of their desk. Moreover, other sensor positions also have limitations that can negatively affect detection accuracy in specific contexts. One way to take advantage of the relatively accurate sensors despite their occasional inaccuracy is to fuse (combine) the data from different sensors to enhance occupancy detection. In this approach, multiple PIR sensors are used simultaneously to compensate for the limitations of an individual sensor. Sensor fusion is investigated by analyzing the datasets of various pairs of PIR sensors to find out the potential improvements in detection accuracy.
Figure 4, Figure 5 and Figure 6 present the calculated overall accuracy of occupancy detection, presence detection, and absence detection, respectively, by various pairs of sensors. The choice between OR and AND fusion rules depends on improving overall accuracy and whether absence or presence detection is more important for the intended application. Figure 4 shows that the overall accuracy for all possible pairs of sensors that are fused with the logical operator OR have higher accuracy than when fused with AND. Similarly, comparing the results of sensor-fused presence detection between the two fusion rules in Figure 5 shows OR rule leads to a significantly higher presence detection accuracy compared to AND. For example, the fusion of Desk and CF sensors with AND rule results in 53% accuracy, while with OR rule, they can detect occupants with 91% accuracy. On the other hand, absence detection with AND rule provides higher accuracy as compared to OR when fusing the sensor pairs (Figure 6). For example, using AND rule to fuse Desk and CF sensors leads to 99.96% accuracy, while OR rule slightly decreases the accuracy to 98.32%.
It is important to consider the tradeoffs between presence and absence detection by any detection system in different applications. For example, in demand-controlled HVAC systems, the AND rule may result in higher energy saving while OR rule provides better occupant comfort. However, the results show the differences in the resulted accuracies between the two fusion approaches are significantly lower for absence detection than for presence detection. However, the accuracy of absence detection is already in a relatively high range even by a single PIR (i.e., higher than 90%). The fusion of PIR sensor data for occupancy detection seems to be more appropriate when using OR instead of AND rule because of its positive effect on presence detection. Hence, the results and the following discussions on sensor fusion are focused on those related to OR rule. The strategy of using OR instead of AND imposes the priority to improve presence detection instead of absence detection. The slight decrease in accuracy of absence detection compared to the significant increase in accuracy of presence detection eventually results in an increase in overall accuracy.
The most accurate occupancy detection is performed by the fusion of Desk and CF sensors with an overall accuracy of 96.4% (Figure 4). The detection accuracy by their fusion is higher than both Desk and CF sensors, which have overall accuracy of 94.6% and 88.9%, respectively (Figure 3). The improvements are more significant for presence detection compared to absence detection. Presence detection by fusion of Desk and CF sensors is 91.2% accurate (Figure 5), which is significantly higher than the accuracy of individual Desk and CF sensors with 83% and 60%, respectively (Figure 3). The same combination of sensors results in the most accurate absence detection with 98.3% accuracy (Figure 6), which is slightly lower than the accuracy of single Desk and CF sensors with 98.7% and 99.5%, respectively (Figure 3). These two sensors can complement each other by compensating for their limitations on detecting some of the motions. The Desk sensor is better to detect the motions of a seated occupant’s lower body, while the CF sensor has a wider FOV to detect when the occupant is not seated or even the motions of a seated occupants’ upper body.
The lowest overall accuracy is achieved by the fusion of WFN and WBN with 87.9 % (Figure 4). Such a result was expected as both of these sensors were positioned close to the window, which makes the sensors susceptible to false positive errors lowering the accuracy of absence detection to 87.4% (Figure 6) as compared to 90.3% and 95.8% for individual WFN and WBN sensors, respectively (Figure 3). Generally, the improvement in presence detection by sensor fusion is more significant compared to absence detection. WFF and CF sensors with individual presence detection accuracies of 51% and 61% (Figure 3) have the lowest sensor-fused presence detection accuracies compared to other pairs with only 70.6% accuracy (Figure 5). One reason could be that these two sensors are positioned farthest from the seated area and probably have similar limitations on detecting some of the occupants’ motions. This indicates the importance of positioning sensors at different distances from the detection targets when fusing data from multiple PIR sensors.

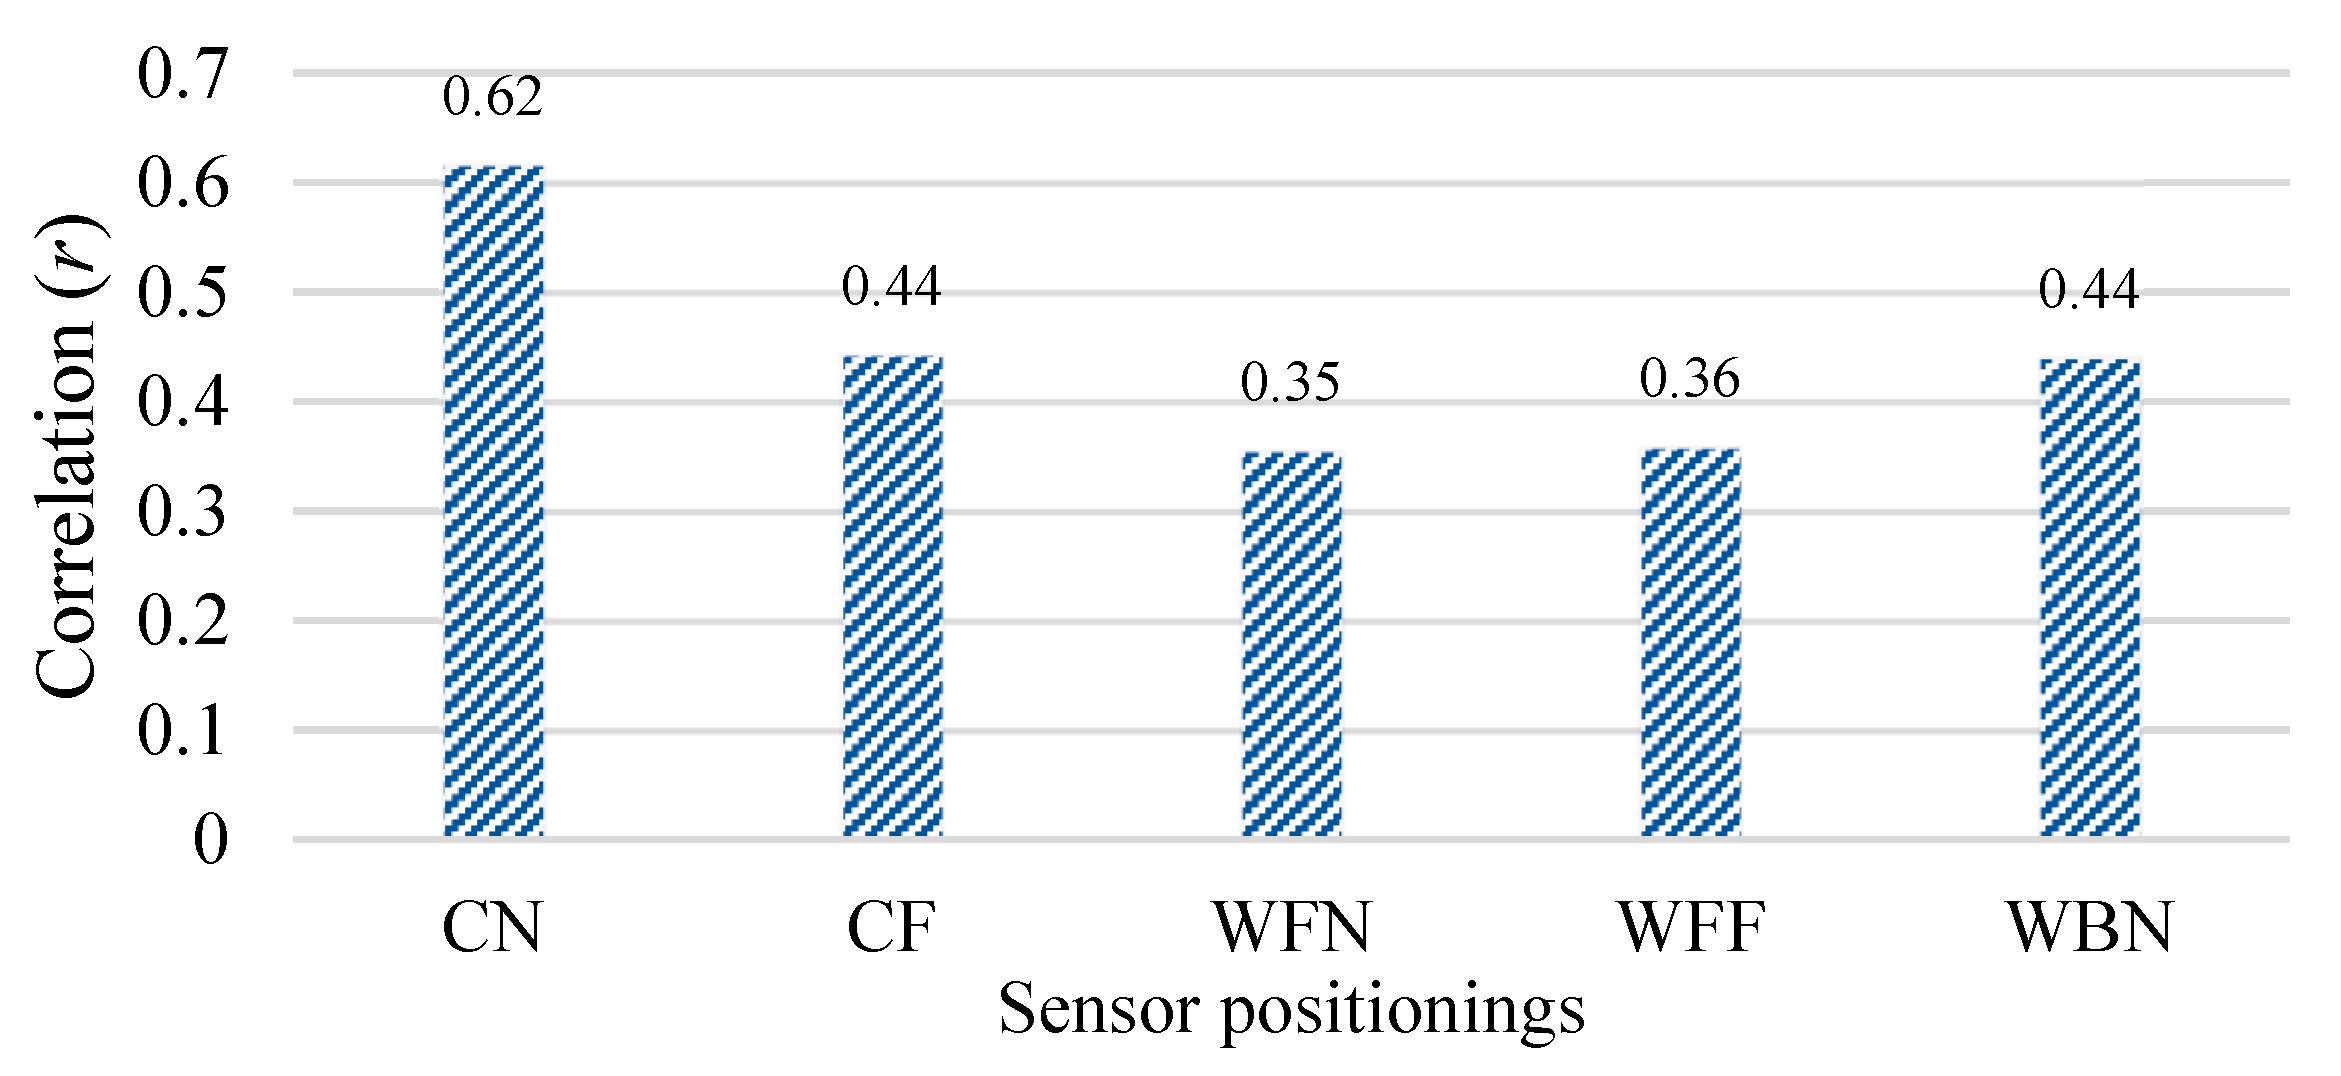
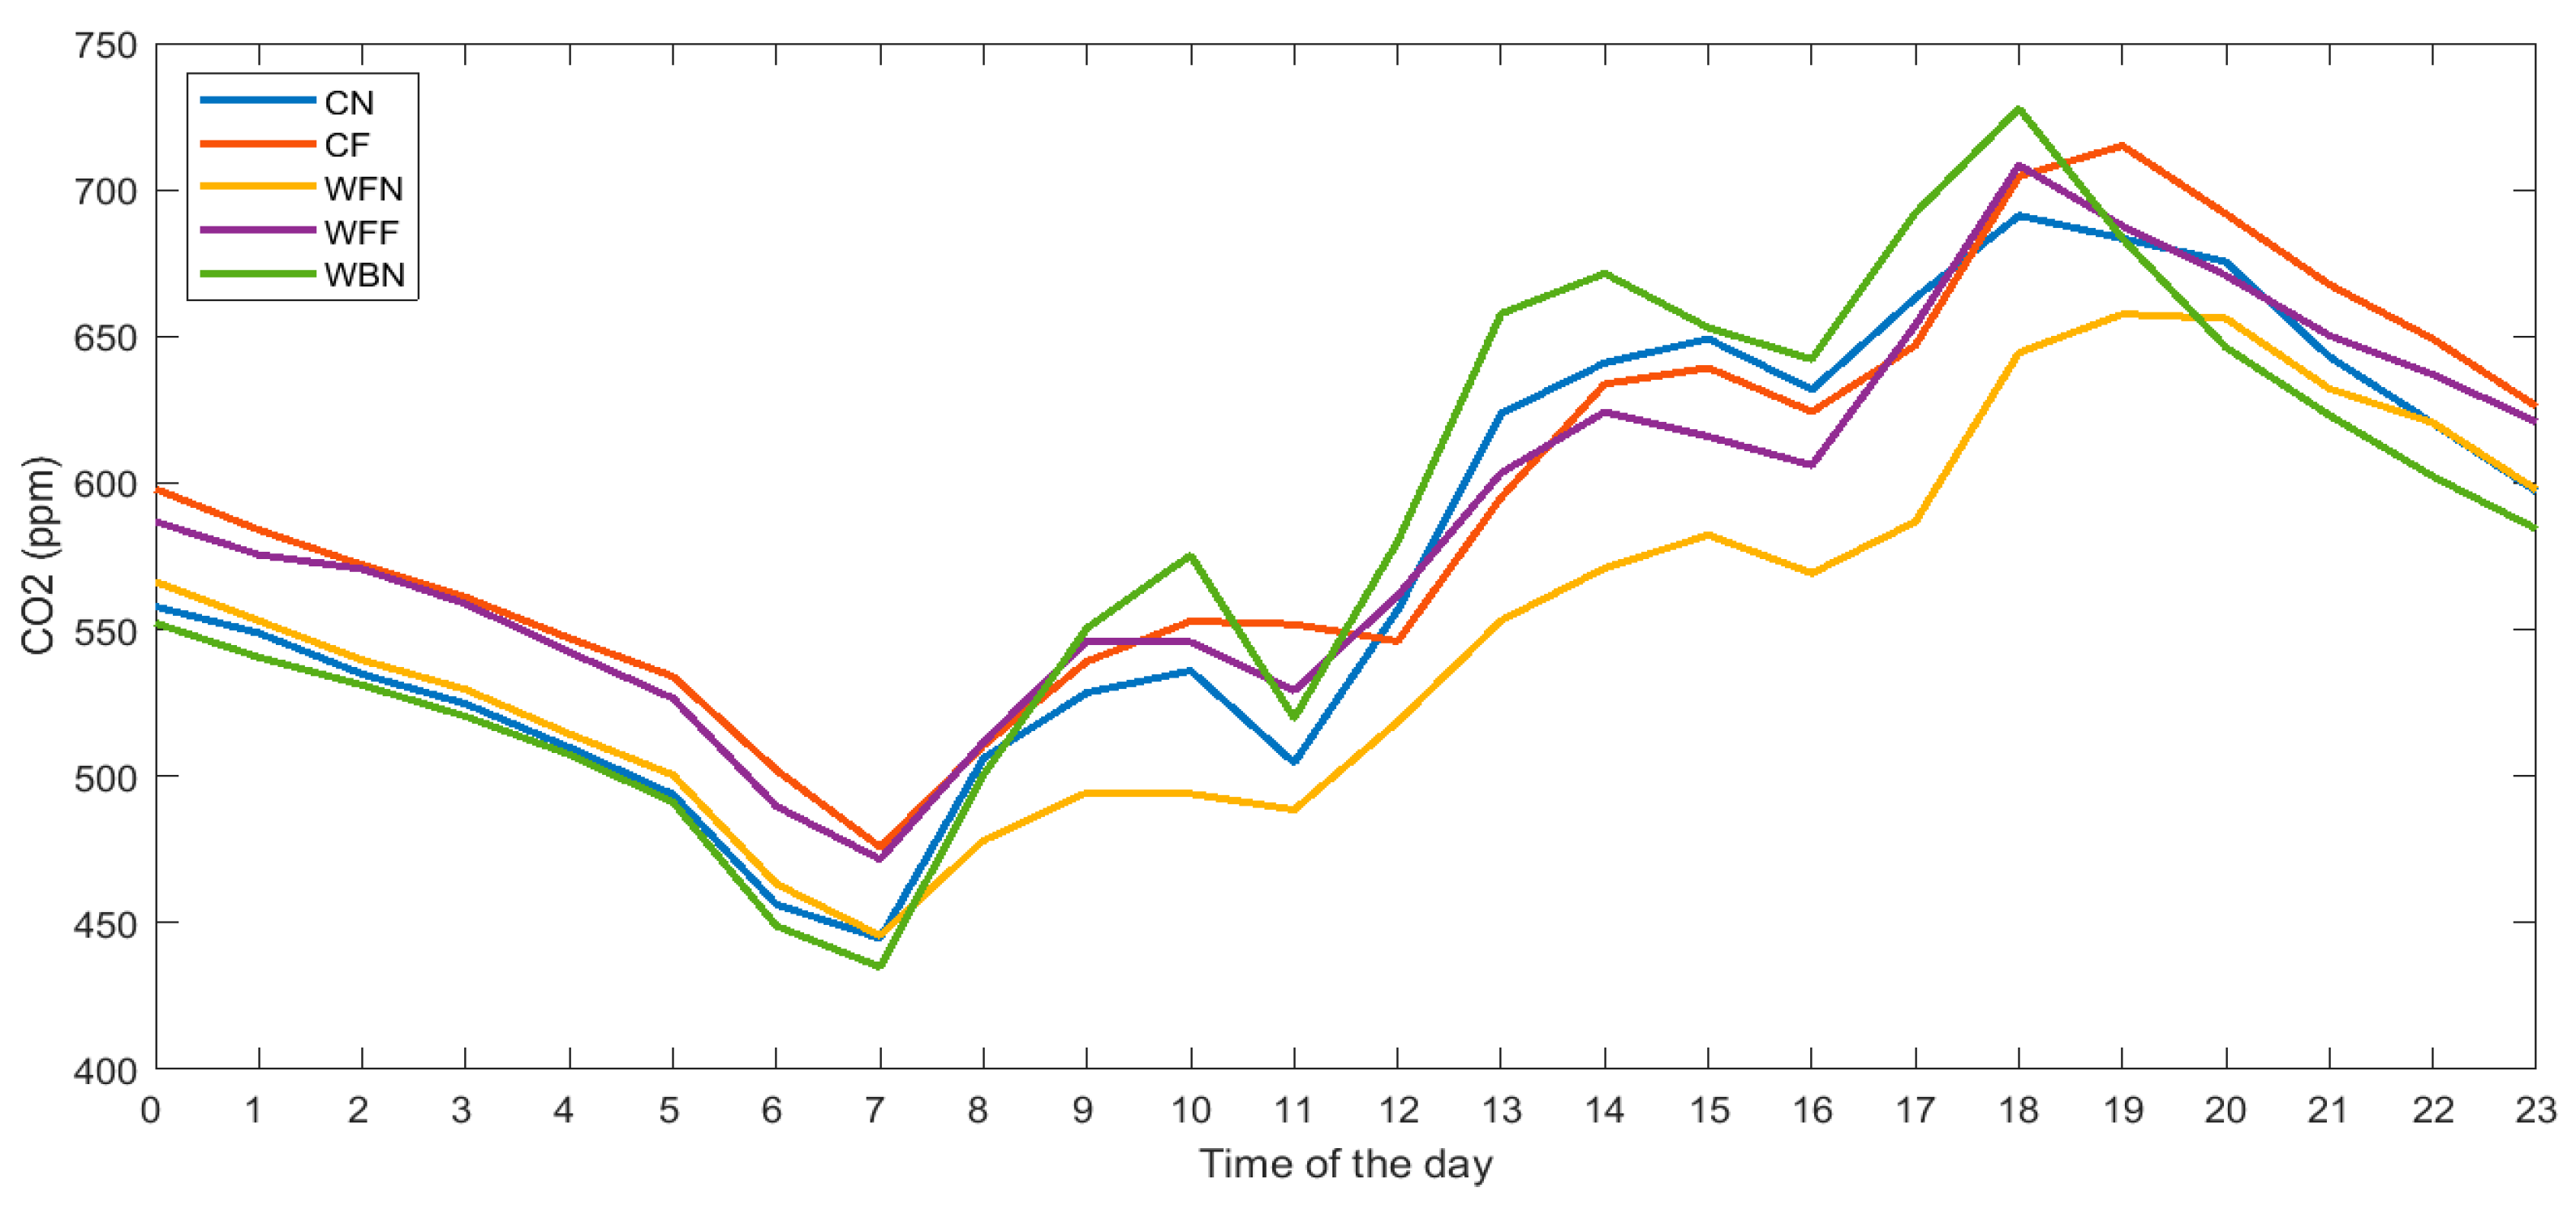
4.3. Occupancy Detection by CO2 Sensors in Various Positions

The analysis presented in this section compares the correlations between occupancy and CO2 concentration measurements in different sensor positionings. The results cannot be directly used to infer occupancy but indicate which sensor positionings are more appropriate to be used for occupancy detection. As displayed in Figure 7, CO2 measurements by CN sensor have the highest correlation with occupancy since the changes in the measured values have higher correspondence with occupancy changes. This sensor provides the best representation of the occupants’ presence considering its high correlation with occupancy (r = 0.61) compared to other sensor positions. This sensor is located just above the seated area, and thus is more influenced by CO2 emitted from the occupants.
The proximity of the location of CN sensor to the seated occupant is probably an important factor for the high correlation with occupancy. However, WBN and WFN sensors have a significantly lower correlation with occupancy despite their close distance to the seated occupant. The reason could be that these two sensors are positioned at a lower height compared to the CN sensor, which might decrease their exposure to the CO2 emitted by the occupant. On the other hand, the CF sensor has a lower correlation than CN sensor despite being located at a higher height, which is probably due to its higher distance to the seated occupant. The results show the two factors of distance and height from the occupant can affect the correlation of CO2 concentration measurements with occupancy. However, due to the potential delays in sensor reaction to the changes of the CO2 level [30], a control system of HVAC system solely based on this sensor may have negative impacts on energy and comfort performance. Accordingly, CO2 sensors, even when being positioned in the CN position, might be a better fit for fusion with a PIR sensor than being individually used for occupancy detection.

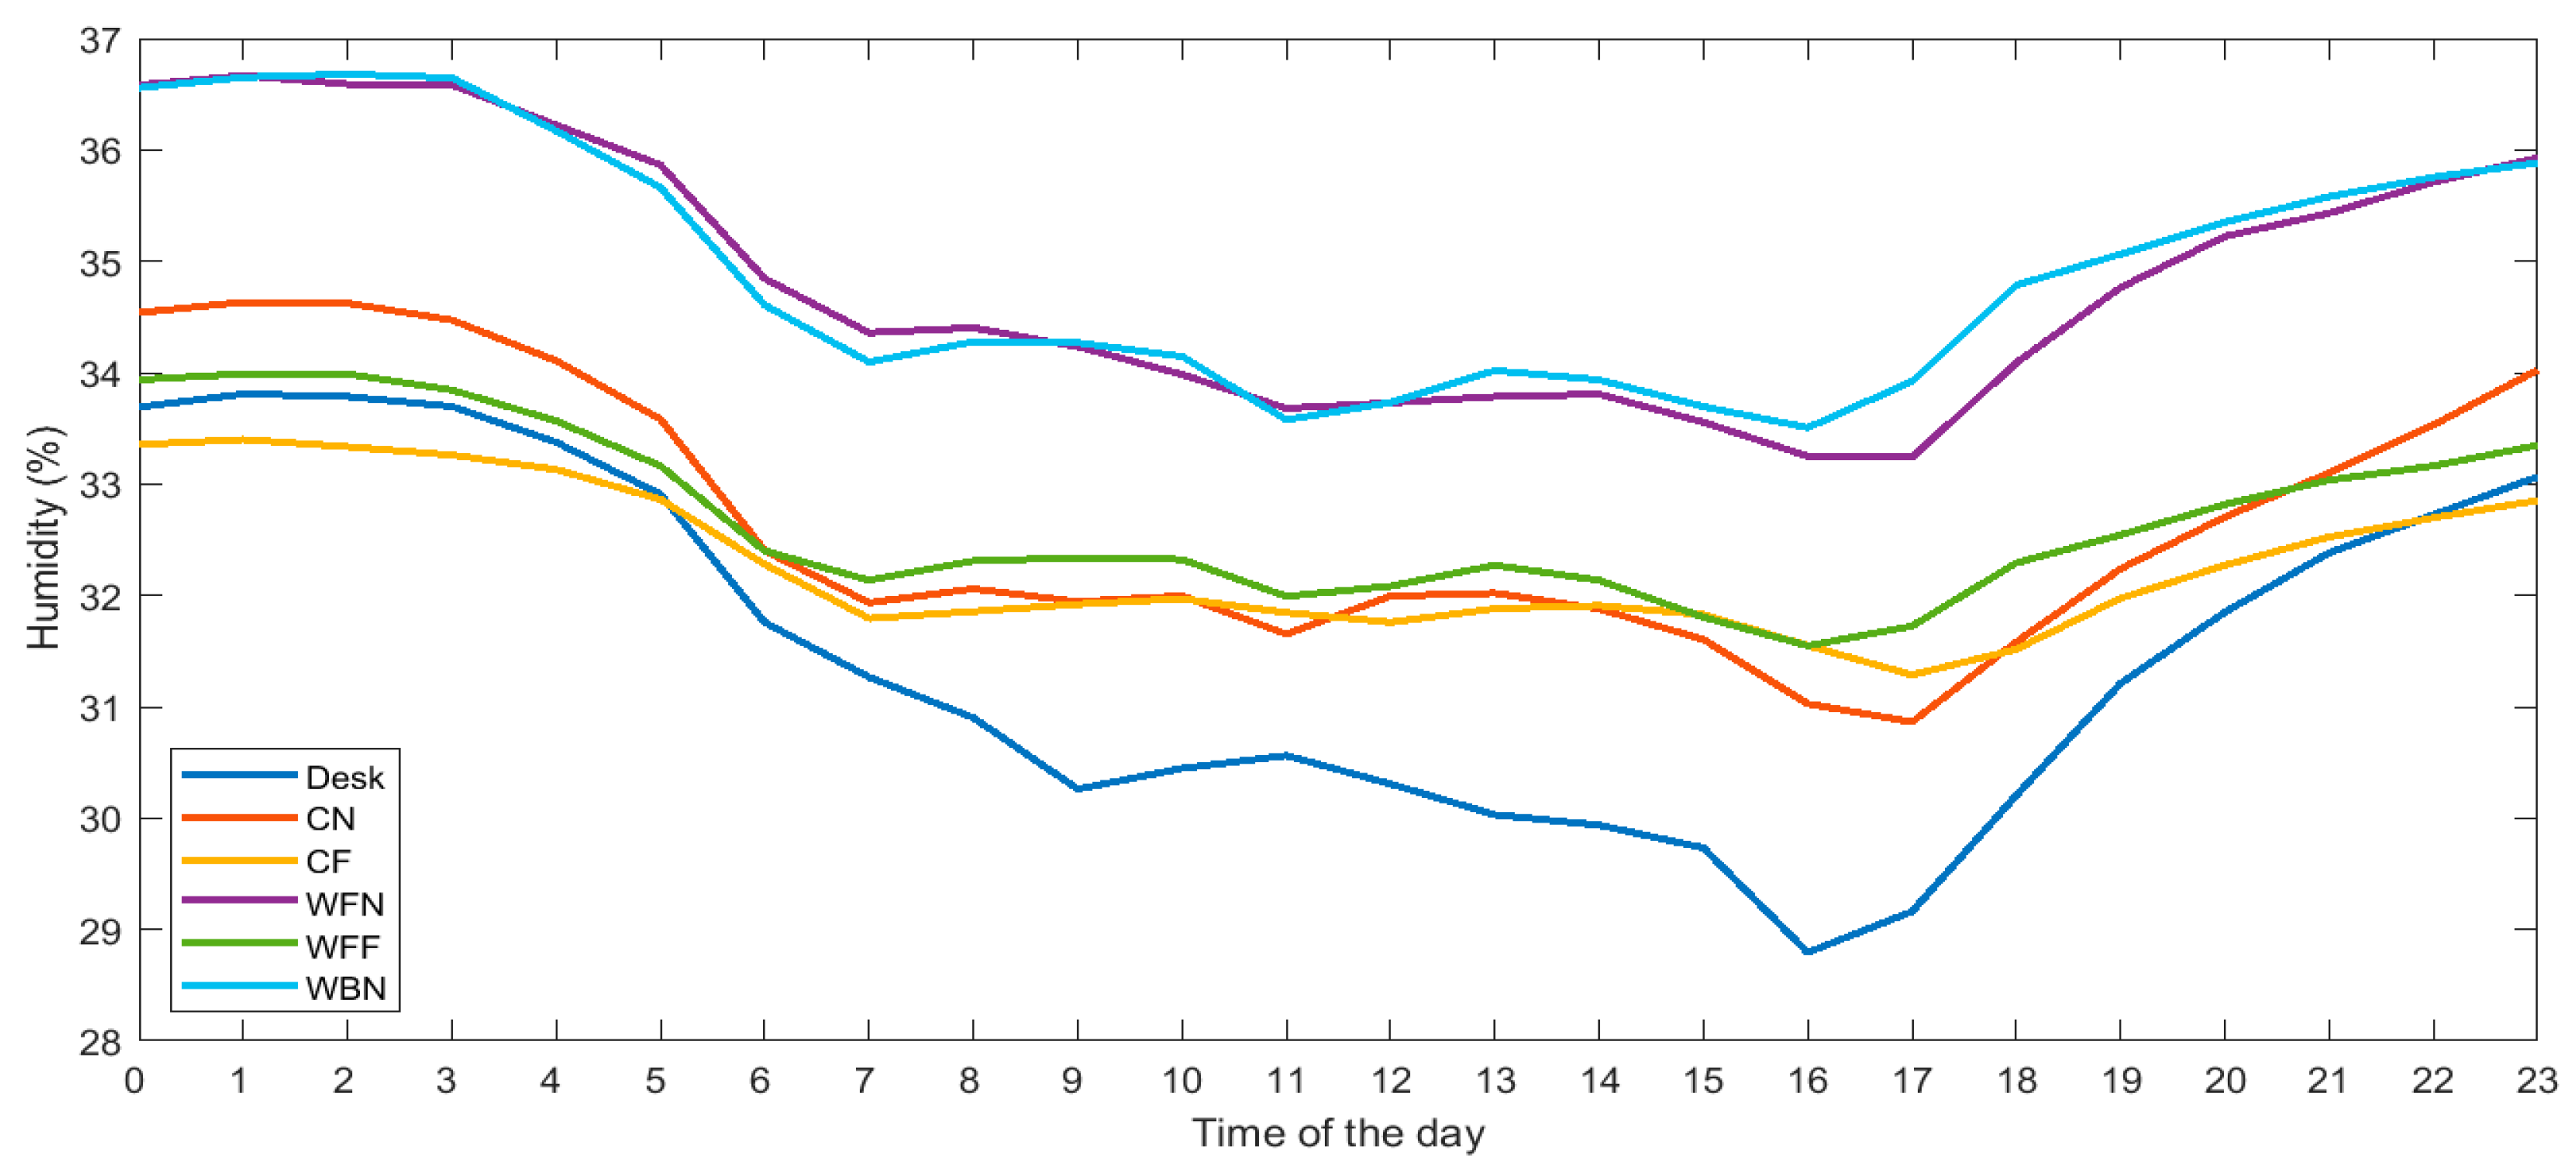
4.4. Effect of Sensor Positioning on Indoor Environmental Monitoring
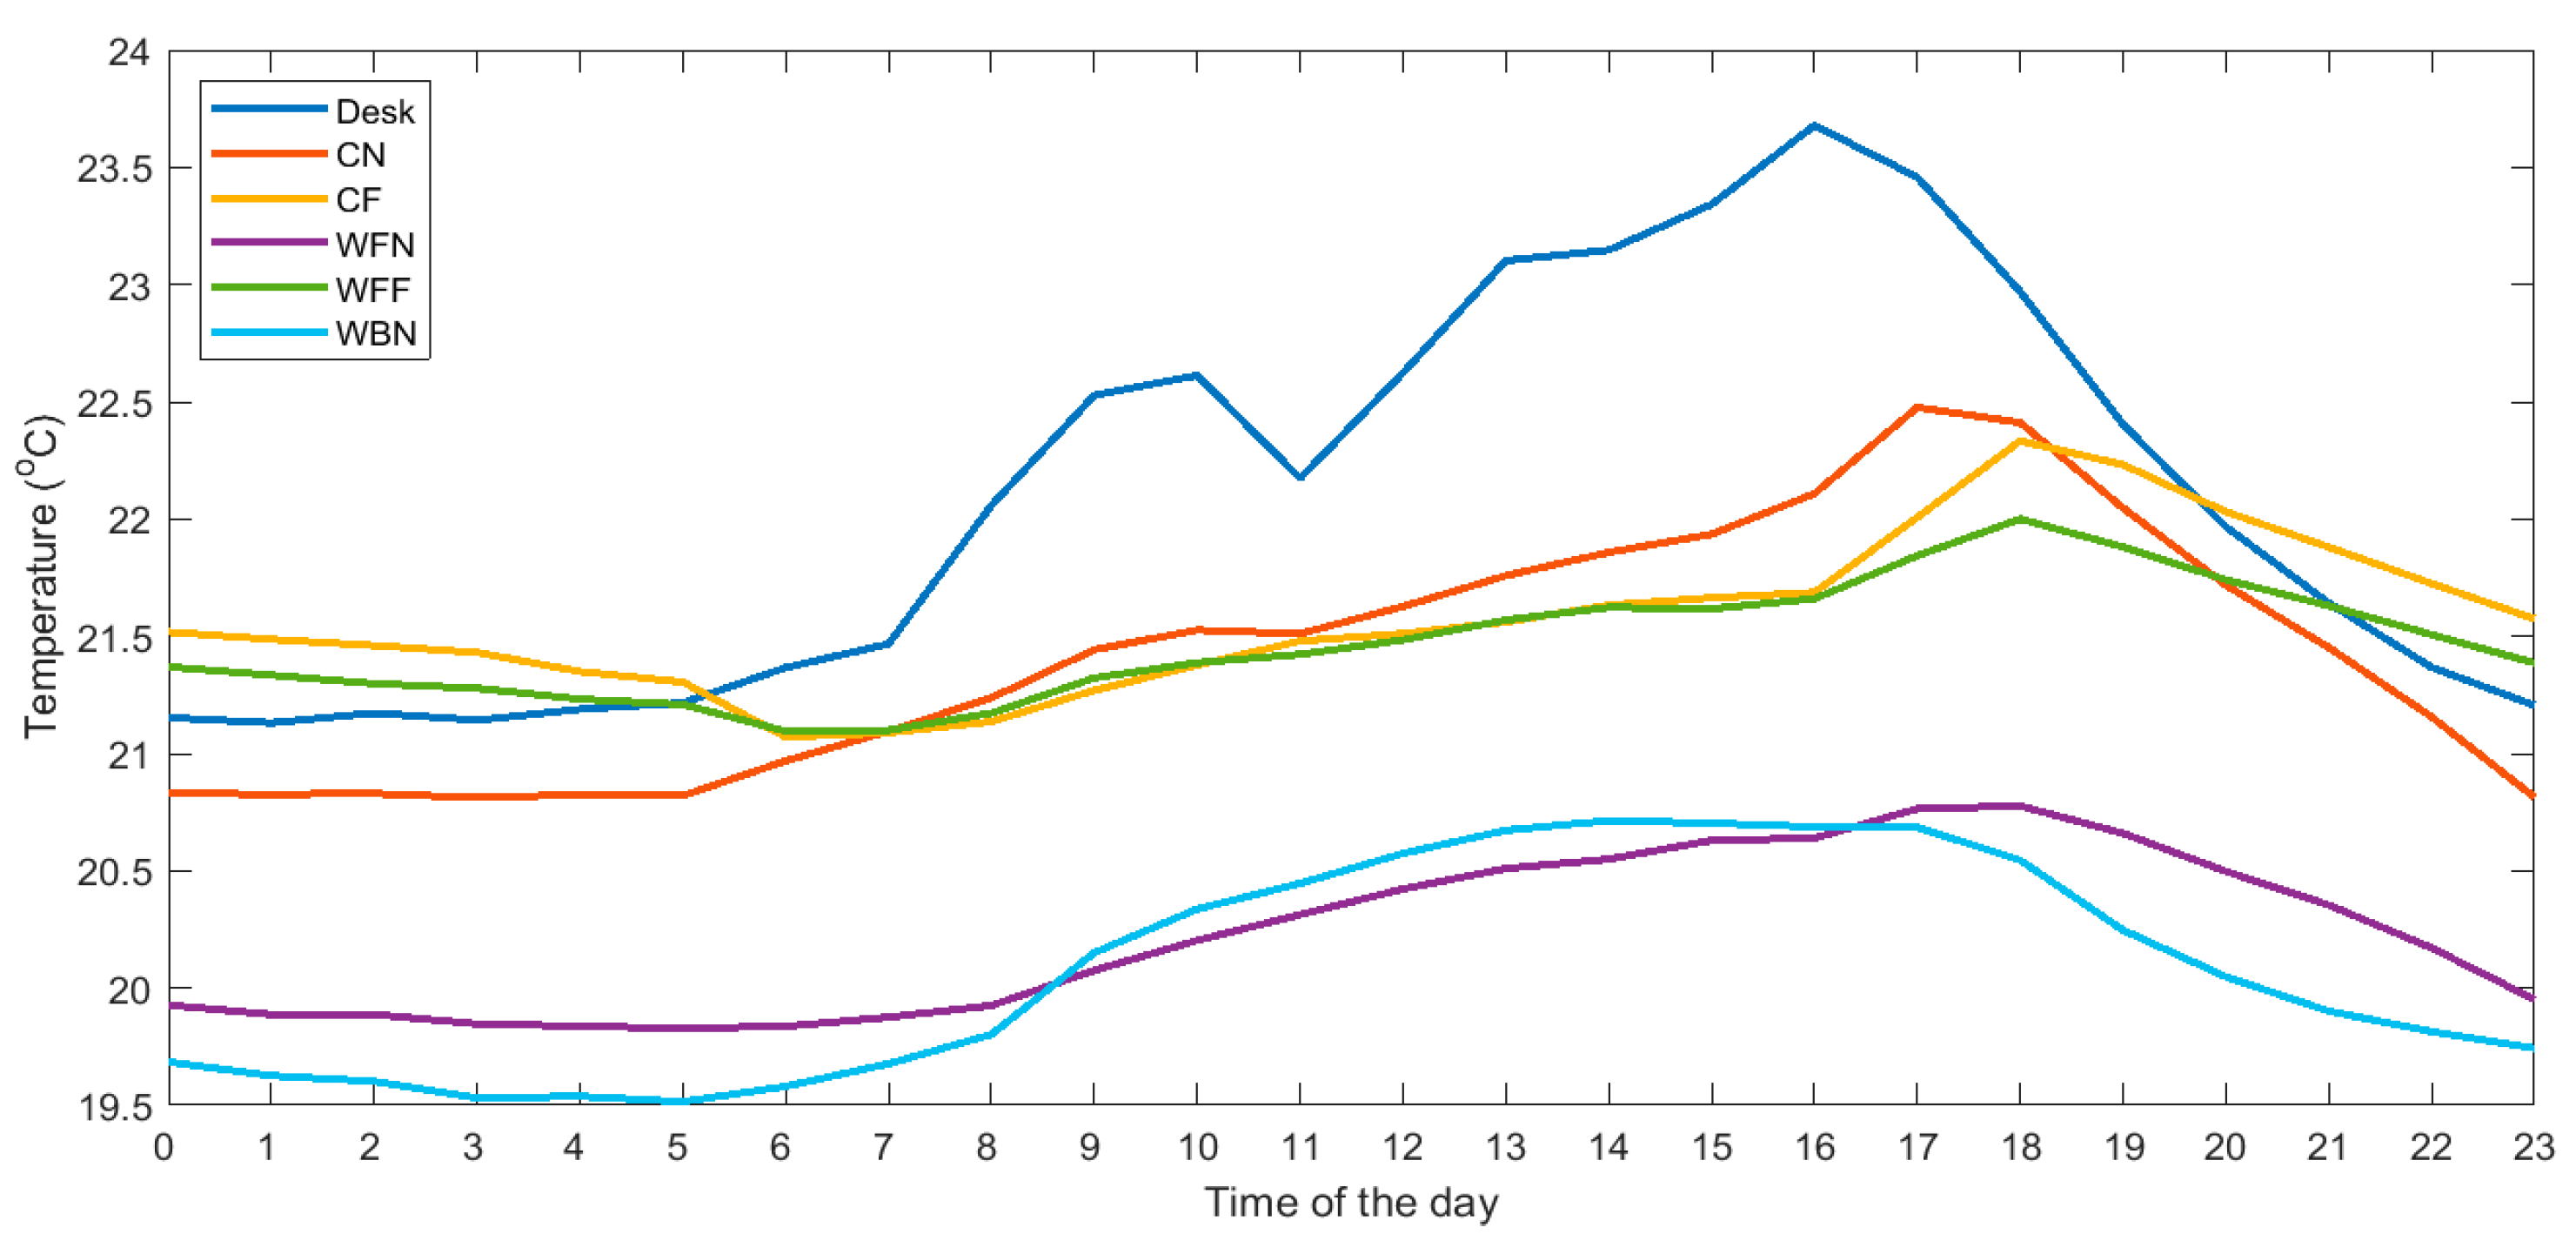
Multi-sensor devices used in buildings often measure the parameters related to the indoor environment besides providing information about occupancy. This section presents the average hourly time series of environmental parameters measured in different positions and provides an overview of the effect of sensors’ positions on measuring various indoor environmental parameters. The analysis can provide recommendations on the choice of the positioning of these sensors by highlighting the tradeoffs between the reliability of various measurements when installing a multi-sensor device. On the other hand, the difference in the environmental measurements between some sensor positions may be insignificant, showing the flexibility of sensor positioning. Unlike the analysis of PIR data, which uses ground truth as a reference, the data related to indoor environmental measurements in this study do not have any ground truth data to compare the positioning of various sensors. Thus, the analyses corresponding to indoor environmental measurements are presented by average hourly time series.

4.4.1. Temperature

The temperature distribution in the indoor spaces may be uneven due to a variety of heat sources and heat sinks. Thus, the position of the sensor can affect temperature measurements with implications for the temperature setpoint to maintain the occupants’ thermal comfort. Figure 8 presents the average hourly temperature measured by six sensors installed in the various positions in the three offices. For example, the average of temperature measurements between 23:00 and 24:00 during the two weeks of measurement is about 20 °C (the last point of the purple time series in Figure 8). WBN is the sensor positioned nearest to the window, and thus is exposed to lower temperatures in heating seasons due to higher heat transfer through the window. The average temperature can drop as low as 19.5 °C. CN and WFN sensors were also positioned near the window; however, they are installed at different heights, which might be the reason for recording different temperatures. Temperature distribution inside the room is affected by the buoyancy effect, and thus the sensors installed in lower heights are likely to measure lower temperatures. However, there could be an aberration in this when the temperature sensors are affected by the heat sources and heat sinks such as a radiator and window. This effect can be observed for the Desk sensor, of which, despite being installed at a relatively lower height, its exposure to the nearby radiator increases the measured temperature. As the heating system was active during the measurement period, the temperature increase is specifically significant during working hours such that the radiator has a higher heat supply to adjust to temperature setpoint.
The ventilation in offices is supplied by the demand-controlled units based on the sensors (different from sensors in our study) installed on the ceiling in the middle of the office, where the CF sensor is positioned. This choice of position allows the sensors to be a built-in part of the ventilation duct and reduce costs. However, WFN and WBN sensors positioned relatively near the seated area are more likely to represent the occupants’ thermal comfort experience. There is a considerable difference in the temperature measured by these two sensors and that of the CF sensor. As shown in Figure 8, the temperature measured by the CF sensor is higher than that measured by the other two sensors. The difference in the average temperatures between CF and the other two sensors can reach 2 °C and between 1 °C and 1.6 °C during non-working and working hours, respectively. WBN might be affected by the outside cold temperature since it is quite close to the window. The result suggests that a sensor installed at the CF position cannot measure a temperature that adequately reflects the occupant’s experience, while WFN may be a better choice due to its proximity to the seated area, lower height, and higher distance from the radiator and window.

4.4.2. Relative Humidity (RH)
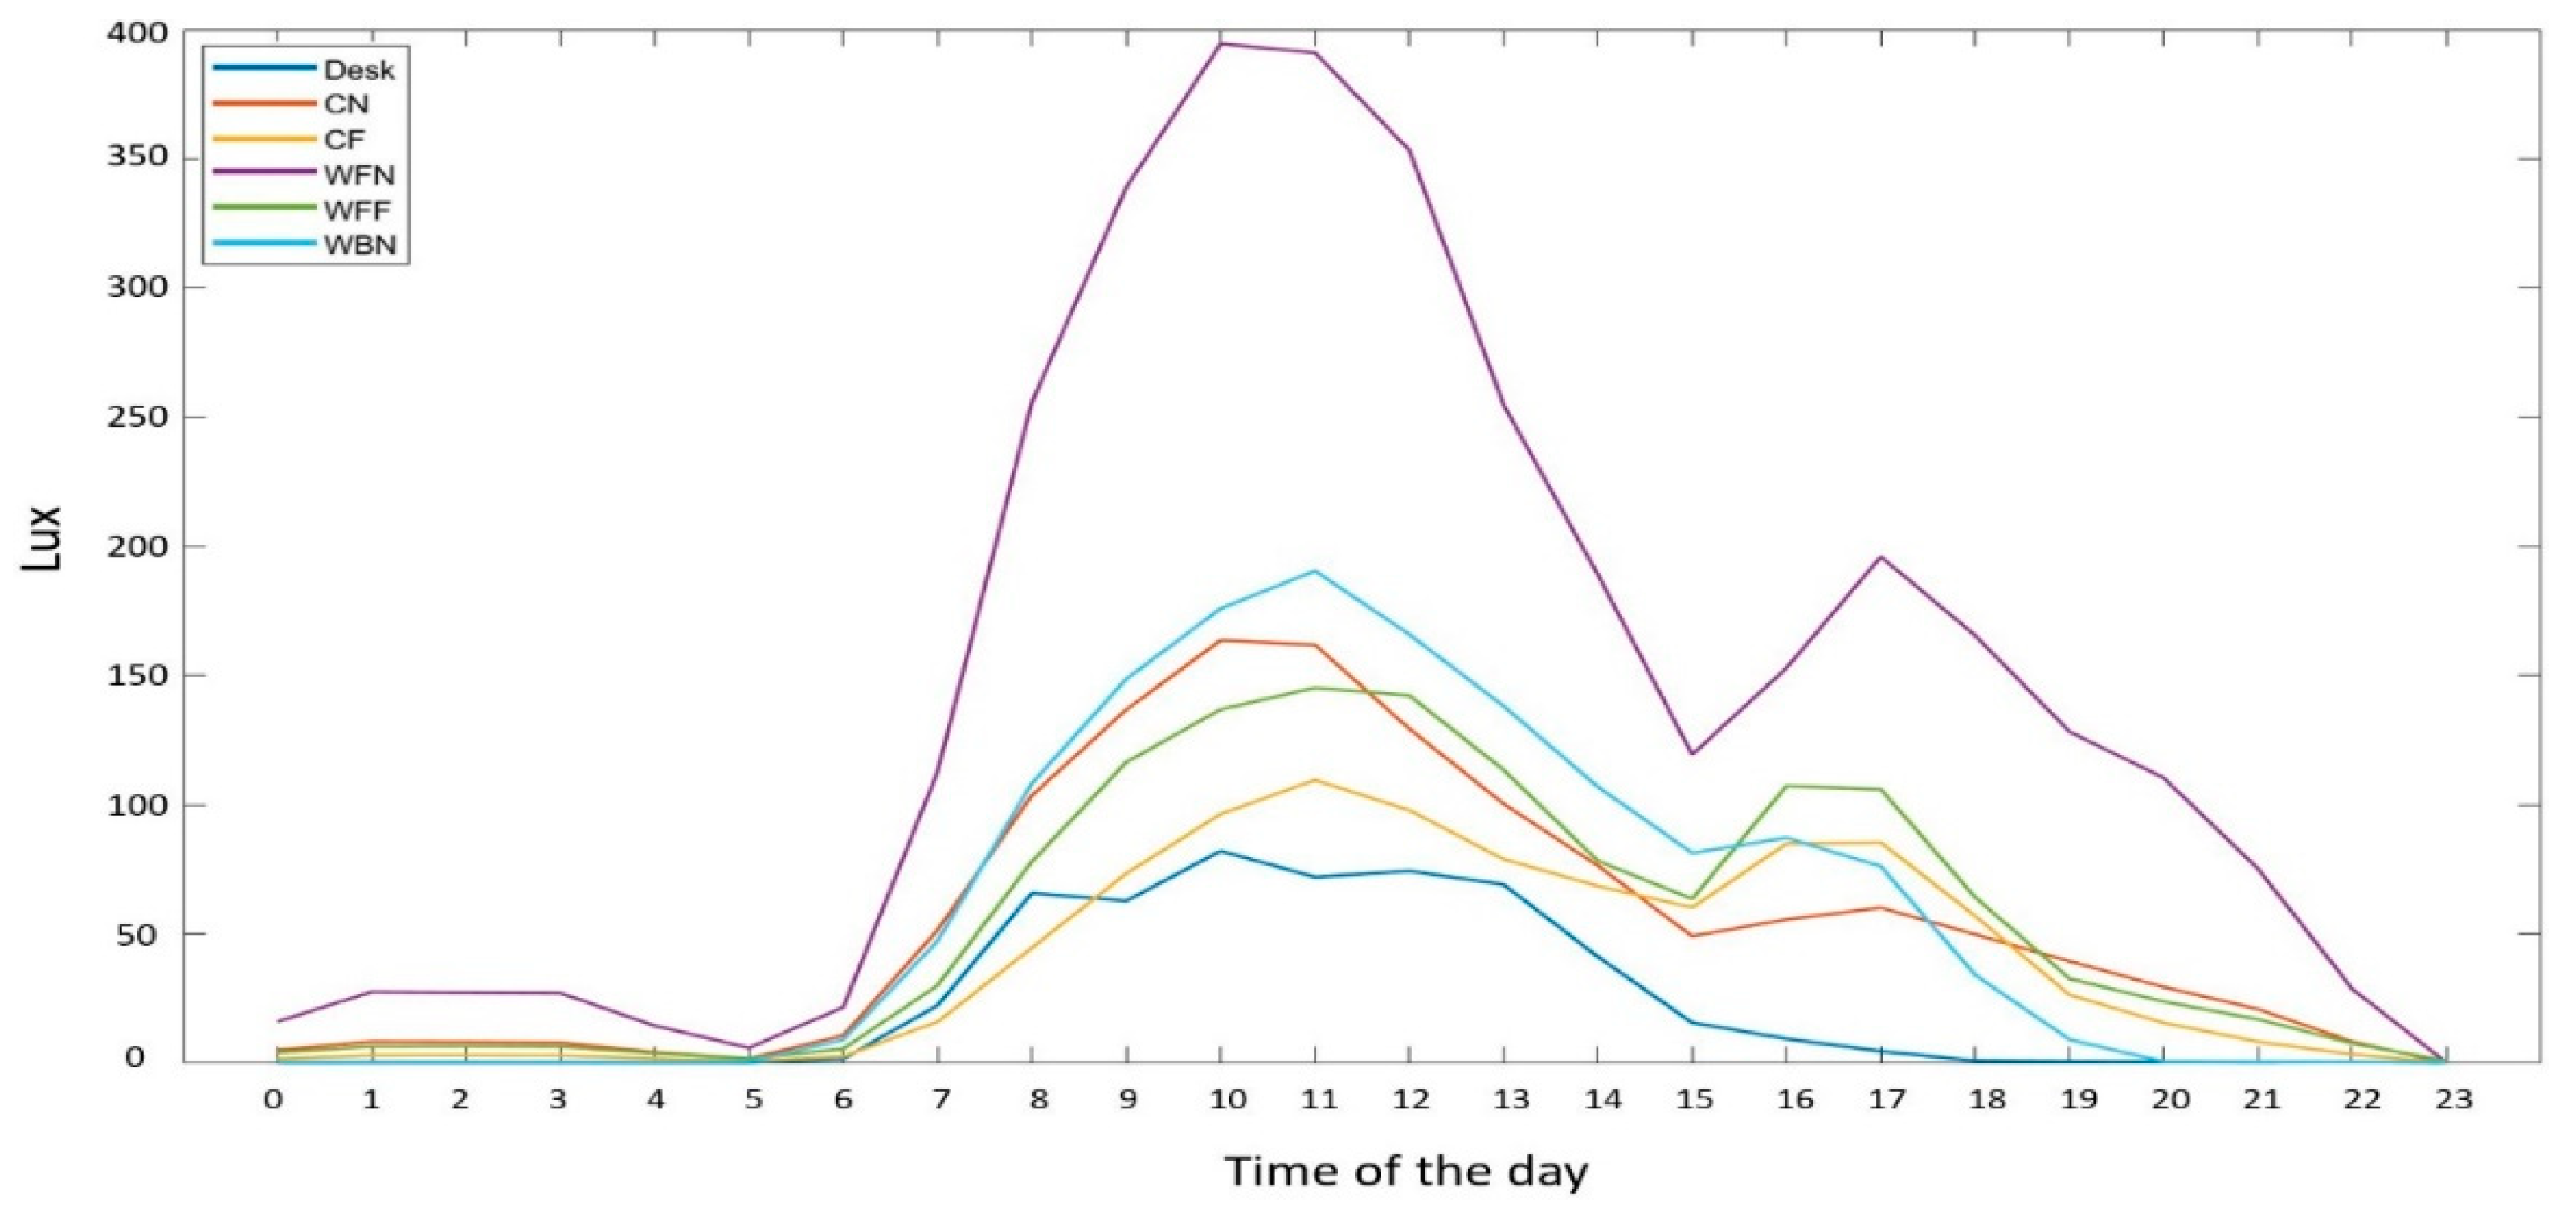
The average hourly RH measured by sensors positioned in different locations in the offices are presented in Figure 9. The highest difference in the values reaches 4.5% between WBN and Desk at 16:00. However, comparing Figure 8 and Figure 9 reveals the differences in RH measured by sensors in different positions originate from an uneven temperature distribution in the offices. RH is partly related to temperature as higher temperature reduces RH despite absolute humidity being constant. In other words, the absolute humidity is rather homogenously distributed while RH varies due to temperature variations in different locations of the offices. This effect explains the differences in RH measurements by different sensors along with the variations of RH measured by each sensor. As thermal comfort is not as sensitive to small variations in RH, the slight differences between the sensors’ measurements are unlikely to have implications for thermal comfort in the offices. Thus, the position of the humidity sensor might be relatively unimportant in an office unless it is near a humidity source such as a humidifier. For example, the changes in RH measurements by the CN sensor placed near the occupant are similar to the other sensors, which have a higher distance to the occupant. Thus, the occupants probably have a negligible effect on changing RH.

4.4.3. Illuminance

The average hourly illuminance (light level) measured by sensors in different positions in the offices are presented in Figure 10. In this case study, the sensors face different directions and none of them are positioned to present the work plane illuminance. Thus, it is not possible to evaluate the visual comfort in the offices. The aim of the analysis is to realize how significant is the data variation measured by illuminance sensors to suggest the adequate position of a multi-sensor device. The intensity of illuminance depends on the location of an observer (or sensor) into space and the relative position with respect to both natural (e.g., windows) and artificial (luminaires) light sources [3]. The light sensors cannot distinguish between different light sources.
As shown in Figure 10, the average illuminance measured by WFN sensor, which faces a window from a close distance, is significantly higher than the other sensors. It may be due to the direct sunlight during days and street light during nights. On the other hand, the Desk sensor that faces downwards under the desk is exposed to lower levels of light compared to the rest of sensors. Moreover, the illuminance measured by this sensor is highly affected by the occupants’ presence due the occupants’ shadow. Even without considering these two outlier sensors, the results show significant differences between the data measured by various sensors. For example, the average illuminance between 11:00 and 12:00 is 115 lux for the CF sensor while the measurements are 65% higher for the WBN sensor with 190 lux. Accordingly, measuring illuminance is very sensitive to sensor positioning, and small changes may cause significant variations in the measured data. This suggests that the light sensor may not be a good match to be integrated in a multi-sensor device if the purpose is to evaluate the visual comfort of the occupants.

4.4.4. CO2 Concentration

This analysis investigates the implication of sensor positioning on the measurement of CO2 concentration in a single-occupant office. Figure 11 depicts the average hourly CO2 concentration measured by various multi-sensor devices except for the Desk position since it did not have a CO2 sensor. All the sensors show similar variations for CO2 concentration in the offices. CO2 concentration starts to rise around 07:30 when the occupants arrive at the offices and gradually decreases after 18:00 when they leave their offices. The WBN sensor shows slightly higher variations during working hours as the sensor is positioned near the occupant. On the other hand, the WFN sensor shows relatively smaller changes in working hours, despite being near the occupant, indicating its location might receive a higher ventilation rate or air infiltration from the window that compensates the occupant’s respiration. The CN sensor is positioned right above the occupants and can be potentially affected by the occupants’ respiration. However, unlike the initial expectation, this sensor shows an almost similar measurement pattern to other sensors. Overall, the differences among measurements of CO2 concentration in different positions seem to be negligible; thus, positioning does not have a significant implication for monitoring the indoor air quality unless being directly exposed to the airflow of the ventilation system (e.g., WFN position).

5. Conclusions

This study provides qualitative and quantitative descriptions of the effect of sensor positioning on occupancy and environmental monitoring by multi-sensor devices. The results enable practitioners to evaluate the possible positionings of multi-sensor devices and allow researchers to overview the performance of such devices when being used in various building applications. Further, this study provides a method to obtain information on the accuracy and reliability of sensing systems, which enables conducting sensitivity analysis of the results of the studies investigating the applications of sensor data. The study design allows understanding of the tradeoffs between various positions of multi-sensor devices used for occupancy and environmental monitoring. Many studies have previously investigated the suitability of different sensor technologies for occupancy detection and indoor environmental monitoring in buildings. This study presents a new outlook for studies on sensors by demonstrating that, apart from sensor technologies, the way the sensors are used, such as their positioning, can significantly affect their applicability and effectivity.
The results show the significant effect of the position of PIR and CO2 sensors on their occupancy detection performance. Sensor positioning can also affect indoor environmental monitoring, especially when measuring temperature and illuminance. The results suggest describing the performance of PIR sensors by only a number as coverage distance is deficient. Sensor developers should test their sensors under standardized conditions to provide comparable information on their sensors’ accuracy in different distances. It is more challenging for PIR sensors to detect presence as compared to absence. Absence detection can be mainly impaired by sunlight when the sensor faces the windows from a short distance. The distance of PIR sensors to occupants affects presence detection besides PIR sensor’s sensitivity to other factors such as exposure to windows. In our case study, the accuracy of presence detection dropped by 13% for every 1 m of further distance. The fusion of multiple PIR sensors is shown to improve the accuracy of occupancy detection. However, achieving a significant improvement by sensor fusion requires careful sensor positioning by considering the positions with diverse distances and orientations to the detection target.
The choice of the positioning of PIR sensors should be made to expose them to the highest levels of occupants’ motions by considering the potential occupants’ activities. For example, as in a typical office, the occupants are likely to perform their tasks seated. Positioning PIR sensors under the desk results in the most accurate occupancy information. The fusion of a PIR sensor positioned under the desk with another sensor that has a wide FOV on the entire space can lead to a significantly enhanced occupancy detection. However, that position may not be appropriate for other environmental sensors in a multi-sensor device such as temperature. In this case, using multi-sensor devices may prevent the optimum choice of positioning. However, by knowing the potential adversity of measurements for some sensors, it is still acceptable to position multi-sensor devices availing from the positions best suited for measuring the main intended parameter.
The study design allows the relative comparison of sensor positionings; however, the results of the individual sensors have limited generalizability. For example, the values of accuracy of PIR sensors in our case study cannot be generalized to other PIR sensors even with similar positionings. Besides sensor positioning, accuracy of occupancy detection depends on sensor’s build quality and setups, and occupant’s activity in different spaces. Thus, PIR sensors’ low accuracy in some positionings in our study does not undermine the results of other studies that used occupancy information from PIR sensors. The results related to the positioning of indoor environmental sensors should be used cautiously regarding the office equipment and amenities especially when measuring temperature due to its high sensitivity.
Future studies should provide multi-dimensional optimization models taking various factors associated with the geospatial positioning of sensors into account. The results of indoor environmental measurements are related to the average data collected during a two-week-period, which may not be representative of the monitoring downfalls in specific conditions. Further investigations may consider the effect of certain events on sensor measurements, such as when there are visitors in the offices. The investigations could be further expanded by considering other types of spaces such as open-plan offices or classrooms where occupants might conduct different types of activities. Moreover, the sensors for occupancy and indoor environmental monitoring are not limited to those investigated in this study and various sensor technologies need to be assessed with regard to their positionings.

Author Contributions

Conceptualization, S.A., R.R., G.N., T.O.; methodology, S.A. and R.R.; software, R.R. and S.A.; validation, S.A. and R.R.; formal analysis, R.R.; investigation, S.A. and R.R.; resources, S.A., G.N.; data curation, R.R. and S.A.; writing—original draft preparation, S.A. and R.R.; writing—review and editing, S.A., R.R., G.N., and T.O.; visualization, R.R.; supervision, G.N., and T.O.; project administration, S.A., G.N., and T.O.; funding acquisition, T.O. All authors have read and agreed to the published version of the manuscript.

Funding

The authors gratefully acknowledge RUGGEDISED project, which has received funding from the European Union’s Horizon 2020 research and innovation program under grant agreement No 731198 and project “Energy efficiency improvements in HVAC of university buildings by studying the occupancy pattern” funded by Swedish Energy Agency within E2B2 program No 47878–1.

Institutional Review Board Statement

Not applicable.

Informed Consent Statement

Informed consent was obtained from the office occupants involved in the study.

Data Availability Statement

The data are available upon request via an email to the correspondence author.

Acknowledgments

The authors acknowledge Lisa Redin from Umeå University for her support to arrange the trials and office occupants from Department of Computing Science at Umeå University, who provided the ground truth data.

Conflicts of Interest

The authors declare no conflict of interest.

Appendix A. Sensors Specifications

Sensors’ specifications are provided individually, as follow [69]:

Appendix A.1. PIR Sensor

Range: 5 m.
Figure A1. Sensitivity in different parts of the FOV [69].
Energies 14 06296 g0a1
Figure A2. Range and angle of view [69].
Energies 14 06296 g0a2

Appendix A.2. CO2 Sensor

CO2 range 0–2000 ppm (Extended: 0–10,000 ppm).
CO2 noise 14 ppm at 400 ppm 25 ppm at 1000 ppm CO2.
Accuracy ±50 ppm/±3% of reading.
Accuracy extended: ±10% of reading.

Appendix A.3. Temperature Sensor

Temperature range 0–40 °C.
Temperature resolution 0.1 °C.
Temperature accuracy ±0.2 °C.

Appendix A.4. Humidity Sensor

Humidity range 0–100%.
Humidity resolution 0.1% RH.
Humidity accuracy ±2% RH.

Appendix A.5. Light Sensor

Light range 4–2000 Lux.
Light resolution 1 Lux.
Light accuracy ±10 Lux.

References

  1. Park, E.; Del Pobil, A.P.; Kwon, S.J. The role of internet of things (IoT) in smart cities: Technology roadmap-oriented approaches. Sustainability 2018, 10, 1388. [Google Scholar] [CrossRef] [Green Version]
  2. Park, J.Y.; Ouf, M.M.; Gunay, B.; Peng, Y.; O’Brien, W.; Kjærgaard, M.B.; Nagy, Z. A critical review of field implementations of occupant-centric building controls. Build. Environ. 2019, 165, 106351. [Google Scholar] [CrossRef]
  3. Azar, E.; O’Brien, W.; Carlucci, S.; Hong, T.; Sonta, A.; Kim, J.; Andargie, M.; Abuimara, T.; El Asmar, M.; Jain, R.K.; et al. Simulation-aided occupant-centric building design: A critical review of tools, methods, and applications. Energy Build. 2020, 224, 110292. [Google Scholar] [CrossRef]
  4. Mahdavi, A.; Taheri, M. An ontology for building monitoring. J. Build. Perform. Simul. 2017, 10, 499–508. [Google Scholar] [CrossRef]
  5. Azizi, S.; Nair, G.; Rabiee, R.; Olofsson, T. Application of internet of things in academic buildings for space use efficiency using occupancy and booking data. Build. Environ. 2020, 186, 107355. [Google Scholar] [CrossRef] [PubMed]
  6. Azizi, S.; Nair, G.; Olofsson, T. Demand-controlled energy systems in commercial and institutional buildings: A review of methods and potentials. In Proceedings of the Eceee 2019 Summer Study, Belambra Presqu’île de Giens, France, 3–8 June 2019; pp. 1443–1450. [Google Scholar]
  7. Chaney, J.; Owens, E.H.; Peacock, A.D. An evidence based approach to determining residential occupancy and its role in demand response management. Energy Build. 2016, 125, 254–266. [Google Scholar] [CrossRef] [Green Version]
  8. Timm, S.; Deal, B.M. Effective or ephemeral? The role of energy information dashboards in changing occupant energy behaviors. Energy Res. Soc. Sci. 2016, 19, 11–20. [Google Scholar] [CrossRef]
  9. EU EPBD. Directive (EU) 2018/844 of the European Parliament and of the council of 30 May 2018. Off. J. Eur. Union 2018, L156/75. [Google Scholar]
  10. O’Brien, W.; Tahmasebi, F.; Andersen, R.K.; Azar, E.; Barthelmes, V.; Belafi, Z.D.; Berger, C.; Chen, D.; De Simone, M.; D’Oca, S.; et al. An international review of occupant-related aspects of building energy codes and standards. Build. Environ. 2020, 179, 106906. [Google Scholar] [CrossRef]
  11. Ahmad, M.W.; Mourshed, M.; Mundow, D.; Sisinni, M.; Rezgui, Y. Building energy metering and environmental monitoring—A state-of-the-art review and directions for future research. Energy Build. 2016, 120, 85–102. [Google Scholar] [CrossRef] [Green Version]
  12. Rabiee, R.; Karlsson, J. Multi-bernoulli tracking approach for occupancy monitoring of smart buildings using low-resolution infrared sensor array. Remote. Sens. 2021, 13, 3127. [Google Scholar] [CrossRef]
  13. ASHRAE. Standard 55: Thermal Environmental Conditions for Human Occupancy; ASHRAE: Washington, DC, USA, 2020. [Google Scholar]
  14. Legrand Putting a Stop to Energy Waste—Motion and Lighting Management Sensors; Design and Application Guide. Available online: http://www.legrand.com.mm/fileadmin/user_upload/PDF/Building_Systems/LMS/Catalogue_Motion_and_Lighting_Management_Sensors.pdf (accessed on 23 July 2020).
  15. Elsys, A. Best Practise Guide Executive Summary. Available online: https://www.elsys.se/en/ers/ (accessed on 15 January 2021).
  16. Lurton Occupancy/Vacancy Sensor Design and Application Guide. Available online: https://www.lutron.com/TechnicalDocumentLibrary/3683197.pdf (accessed on 23 July 2020).
  17. Gunay, H.B.; Fuller, A.F.; O’Brien, W.; Beausoleil-Morrison, I. Detecting occupants’ presence in office spaces: A case study. eSim 2016. [Google Scholar] [CrossRef]
  18. Shen, W.; Newsham, G.; Gunay, B. Leveraging existing occupancy-related data for optimal control of commercial office buildings: A review. Adv. Eng. Inform. 2017, 33, 230–242. [Google Scholar] [CrossRef] [Green Version]
  19. Ioannidis, D.; Zikos, S.; Krinidis, S.; Tryferidis, A.; Tzovaras, D.; Likothanassis, S. Occupancy-driven facility management and building performance analysis. Int. J. Sustain. Dev. Plan. 2017, 12, 1155–1167. [Google Scholar] [CrossRef]
  20. Ekwevugbe, T.; Brown, N.; Pakka, V.; Fan, D.; Pakka, V. Improved occupancy monitoring in non-domestic buildings. Sustain. Cities Soc. 2017, 30, 97–107. [Google Scholar] [CrossRef]
  21. Valks, B.; Arkesteijn, M.H.; Koutamanis, A.; Heijer, A.D. Towards a smart campus: Supporting campus decisions with internet of things applications. Build. Res. Inf. 2021, 49, 1–20. [Google Scholar] [CrossRef]
  22. Weyers, R.; Jang-Jaccard, J.; Moses, A.; Wang, Y.; Boulic, M.; Chitty, C.; Phipps, R.; Cunningham, C. Low-cost indoor air quality (IAQ) platform for healthier classrooms in New Zealand: Engineering issues. In Proceedings of the 4th Asia-Pacific World Congress on Computer Science and Engineering (APWC on CSE), Mana Island, Fiji, 10–12 December 2017; pp. 208–215. [Google Scholar] [CrossRef]
  23. Roozeboom, C.L.; Hill, B.E.; Hong, V.A.; Ahn, C.H.; Ng, E.J.; Yang, Y.; Kenny, T.W.; Hopcroft, M.A.; Pruitt, B.L. Multifunctional integrated sensors for multiparameter monitoring applications. J. Microelectromech. Syst. 2014, 24, 810–821. [Google Scholar] [CrossRef]
  24. Saralegui, U.; Antón, M.Á.; Arbelaitz, O.; Muguerza, J. Smart meeting room usage information and prediction by modelling occupancy profiles. Sensors 2019, 19, 353. [Google Scholar] [CrossRef] [Green Version]
  25. Pipattanasomporn, M.; Chitalia, G.; Songsiri, J.; Aswakul, C.; Pora, W.; Suwankawin, S.; Audomvongseree, K.; Hoonchareon, N. CU-BEMS, smart building electricity consumption and indoor environmental sensor datasets. Sci. Data 2020, 7, 241. [Google Scholar] [CrossRef]
  26. Kintner-Meyer, M. Opportunities of wireless sensors and controls for building operation. Energy Eng. 2005, 102, 27–48. [Google Scholar] [CrossRef]
  27. Gentile, N.; Laike, T.; Dubois, M.-C. Lighting control systems in individual offices rooms at high latitude: Measurements of electricity savings and occupants’ satisfaction. Sol. Energy 2016, 127, 113–123. [Google Scholar] [CrossRef]
  28. Fang, J.-S.; Hao, Q.; Brady, D.J.; Shankar, M.; Guenther, B.D.; Pitsianis, N.P.; Hsu, K.Y. Path-dependent human identification using a pyroelectric infrared sensor and fresnel lens arrays. Opt. Express 2006, 14, 609–624. [Google Scholar] [CrossRef] [PubMed]
  29. Yan, J.; Lou, P.; Li, R.; Hu, J.; Xiong, J. Research on the multiple factors influencing human identification based on pyroelectric infrared sensors. Sensors 2018, 18, 604. [Google Scholar] [CrossRef] [PubMed] [Green Version]
  30. Chen, Z.; Jiang, C.; Xie, L. Building occupancy estimation and detection: A review. Energy Build. 2018, 169, 260–270. [Google Scholar] [CrossRef]
  31. Lin, H.-W.; Hong, T. On variations of space-heating energy use in office buildings. Appl. Energy 2013, 111, 515–528. [Google Scholar] [CrossRef] [Green Version]
  32. Salimi, S.; Hammad, A. Critical review and research roadmap of office building energy management based on occupancy monitoring. Energy Build. 2019, 182, 214–241. [Google Scholar] [CrossRef]
  33. Ngamakeur, K.; Yongchareon, S.; Yu, J.; Rehman, S.U. A survey on device-free indoor localization and tracking in the multi-resident environment. ACM Comput. Surv. 2020, 53, 1–29. [Google Scholar] [CrossRef]
  34. Yan, D.; Hong, T.; Dong, B.; Mahdavi, A.; D’Oca, S.; Gaetani, I.; Feng, X. IEA EBC Annex 66: Definition and simulation of occupant behavior in buildings. Energy Build. 2017, 156, 258–270. [Google Scholar] [CrossRef] [Green Version]
  35. Hoes, P.-J.; Hensen, J.; Loomans, M.; de Vries, B.; Bourgeois, D. User behavior in whole building simulation. Energy Build. 2009, 41, 295–302. [Google Scholar] [CrossRef] [Green Version]
  36. Hafer, M. Quantity and electricity consumption of plug load equipment on a university campus. Energy Effic. 2017, 10, 1013–1039. [Google Scholar] [CrossRef] [Green Version]
  37. Menezes, A.C.; Cripps, A.; Bouchlaghem, D.; Buswell, R. Predicted vs. actual energy performance of non-domestic buildings: Using post-occupancy evaluation data to reduce the performance gap. Appl. Energy 2012, 97, 355–364. [Google Scholar] [CrossRef] [Green Version]
  38. De Wilde, P. The gap between predicted and measured energy performance of buildings: A framework for investigation. Autom. Constr. 2014, 41, 40–49. [Google Scholar] [CrossRef]
  39. Szczurek, A.; Maciejewska, M.; Pietrucha, T. Occupancy determination based on time series of CO2 concentration, temperature and relative humidity. Energy Build. 2017, 147, 142–154. [Google Scholar] [CrossRef]
  40. Yang, J.; Santamouris, M.; Lee, S.E. Review of occupancy sensing systems and occupancy modeling methodologies for the application in institutional buildings. Energy Build. 2016, 121, 344–349. [Google Scholar] [CrossRef]
  41. Kjærgaard, M.B.; Sangogboye, F. Categorization framework and survey of occupancy sensing systems. Pervasive Mob. Comput. 2017, 38, 1–13. [Google Scholar] [CrossRef] [Green Version]
  42. Rodiet, C.; Remy, B.; Degiovanni, A. Optimal wavelengths obtained from laws analogous to the Wien’s law for monospectral and bispectral methods, and general methodology for multispectral temperature measurements taking into account global transfer function including non-uniform emissivity of surfaces. Infrared Phys. Technol. 2016, 76, 444–454. [Google Scholar] [CrossRef]
  43. Gilani, S.; O’Brien, W. Review of current methods, opportunities, and challenges for in-situ monitoring to support occupant modelling in office spaces. J. Build. Perform. Simul. 2016, 10, 444–470. [Google Scholar] [CrossRef]
  44. Peng, Y.; Nagy, Z.; Schlüter, A. Temperature-preference learning with neural networks for occupant-centric building indoor climate controls. Build. Environ. 2019, 154, 296–308. [Google Scholar] [CrossRef]
  45. Nagy, Z.; Yong, F.Y.; Frei, M.; Schlueter, A. Occupant centered lighting control for comfort and energy efficient building operation. Energy Build. 2015, 94, 100–108. [Google Scholar] [CrossRef]
  46. Azizi, S.; Rabiee, R.; Nair, G.; Olofsson, T. Application of occupancy and booking information to optimize space and energy use in higher education institutions. E3S Web Conf. 2020, 172, 25010. [Google Scholar] [CrossRef]
  47. Surantha, N.; Wicaksono, W.R. Design of smart home security system using object recognition and PIR sensor. Procedia Comput. Sci. 2018, 135, 465–472. [Google Scholar] [CrossRef]
  48. Melfi, R.; Rosenblum, B.; Nordman, B.; Christensen, K. Measuring building occupancy using existing network infrastructure. In Proceedings of the 2011 International Green Computing Conference and Workshops, Orlando, FL, USA, 25–28 July 2011; pp. 1–8. [Google Scholar]
  49. Christensen, K.; Melfi, R.; Nordman, B.; Rosenblum, B.; Viera, R. Using existing network infrastructure to estimate building occupancy and control plugged-in devices in user workspaces. Int. J. Commun. Netw. Distrib. Syst. 2014, 12, 4–29. [Google Scholar] [CrossRef] [Green Version]
  50. Dong, B.; Andrews, B.; Lam, K.P.; Höynck, M.; Zhang, R.; Chiou, Y.-S.; Benitez, D. An information technology enabled sustainability test-bed (ITEST) for occupancy detection through an environmental sensing network. Energy Build. 2010, 42, 1038–1046. [Google Scholar] [CrossRef]
  51. Han, J.; Lee, E.; Cho, H.; Yoon, Y.; Lee, H.; Rhee, W. Improving the energy saving process with high-resolution data: A case study in a university building. Sensors 2018, 18, 1606. [Google Scholar] [CrossRef] [Green Version]
  52. Wyon, D.P. The effects of indoor air quality on performance and productivity. Indoor Air 2004, 14, 92–101. [Google Scholar] [CrossRef] [PubMed]
  53. Kim, J.; de Dear, R. Nonlinear relationships between individual IEQ factors and overall workspace satisfaction. Build. Environ. 2012, 49, 33–40. [Google Scholar] [CrossRef] [Green Version]
  54. Azizi, S.; Nair, G.; Olofsson, T. Analysing the house-owners’ perceptions on benefits and barriers of energy renovation in Swedish single-family houses. Energy Build. 2019, 198, 187–196. [Google Scholar] [CrossRef]
  55. O’Brien, W.; Wagner, A.; Schweiker, M.; Mahdavi, A.; Day, J.; Kjærgaard, M.B.; Carlucci, S.; Dong, B.; Tahmasebi, F.; Yan, D.; et al. Introducing IEA EBC annex 79: Key challenges and opportunities in the field of occupant-centric building design and operation. Build. Environ. 2020, 178, 106738. [Google Scholar] [CrossRef]
  56. Schell, M.; Int-Hout, D. Demand control ventilation using CO2. ASHRAE J. 2001, 43, 18–29. [Google Scholar]
  57. Park, J.; Loftness, V.; Aziz, A.; Wang, T.-H. Critical factors and thresholds for user satisfaction on air quality in office environments. Build. Environ. 2019, 164, 106310. [Google Scholar] [CrossRef]
  58. O’Neill, Z.D.; Li, Y.; Cheng, H.C.; Zhou, X.; Taylor, S.T. Energy savings and ventilation performance from CO2-based demand controlled ventilation: Simulation results from ASHRAE RP-1747 (ASHRAE RP-1747). Sci. Technol. Built Environ. 2019, 26, 257–281. [Google Scholar] [CrossRef] [Green Version]
  59. Lee, S. CO2-based demand-controlled ventilation and its implications for interior design. J. Inter. Des. 2012, 37, 19–36. [Google Scholar] [CrossRef]
  60. Meyn, S.; Surana, A.; Lin, Y.; Oggianu, S.M.; Narayanan, S.; Frewen, T.A. A sensor-utility-network method for estimation of occupancy in buildings. In Proceedings of the 48h IEEE Conference on Decision and Control (CDC) held jointly with 2009 28th Chinese Control Conference, Shanghai, China, 15–18 December 2009; pp. 1494–1500. [Google Scholar]
  61. Hobson, B.; Lowcay, D.; Gunay, H.B.; Ashouri, A.; Newsham, G.R. Opportunistic occupancy-count estimation using sensor fusion: A case study. Build. Environ. 2019, 159, 106154. [Google Scholar] [CrossRef]
  62. Dong, B.; Prakash, V.; Feng, F.; O’Neill, Z. A review of smart building sensing system for better indoor environment control. Energy Build. 2019, 199, 29–46. [Google Scholar] [CrossRef]
  63. Cheng, C.-C.; Lee, D. Enabling smart air conditioning by sensor development: A review. Sensors 2016, 16, 2028. [Google Scholar] [CrossRef] [Green Version]
  64. Georgiou, O.; Raza, U. Low power wide area network analysis: Can LoRa scale? IEEE Wirel. Commun. Lett. 2017, 6, 162–165. [Google Scholar] [CrossRef] [Green Version]
  65. Gunay, H.; O’Brien, W.; Beausoleil-Morrison, I.; Bisaillon, P.; Shi, Z. Development and implementation of control-oriented models for terminal heating and cooling units. Energy Build. 2016, 121, 78–91. [Google Scholar] [CrossRef]
  66. Petersen, S.; Pedersen, T.H.; Nielsen, K.U.; Knudsen, M.D. Establishing an image-based ground truth for validation of sensor data-based room occupancy detection. Energy Build. 2016, 130, 787–793. [Google Scholar] [CrossRef]
  67. Rabiee, R. Signal Processing for Cooperative Cognitive Radio Networks; Nanyang Technological University: Singapore, 2020. [Google Scholar]
  68. Luo, J.; He, X. A soft-hard combination decision fusion scheme for a clustered distributed detection system with multiple sensors. Sensors 2018, 18, 4370. [Google Scholar] [CrossRef] [PubMed] [Green Version]
  69. ELSYS Sensor Datasheet. 2019. Available online: https://elsys.se/public/datasheets/ (accessed on 26 September 2021).
Figure 1. The influence of time-delay on accuracy of presence and absence detection from a case study—adapted from [17].
Energies 14 06296 g001
Figure 2. Schematic layout of one of the offices and sensor positionings (“h” stands for the height that the sensor installed).
Energies 14 06296 g002
Figure 3. Accuracy of occupancy detection by different PIR sensors in different positions.
Energies 14 06296 g003
Figure 4. Overall accuracy of occupancy detection by pairwise fusion of PIR sensors.
Energies 14 06296 g004
Figure 5. Accuracy of presence detection by pairwise fusion of PIR sensors.
Energies 14 06296 g005
Figure 6. Accuracy of absence detection by pairwise fusion of PIR sensors.
Energies 14 06296 g006
Figure 7. Correlation of CO2 concentration with occupancy.
Energies 14 06296 g007
Figure 8. Time series of temperature sensors with various positionings.
Energies 14 06296 g008
Figure 9. Time series of humidity sensors with various positionings.
Energies 14 06296 g009
Figure 10. Time series of light sensors in various positionings.
Energies 14 06296 g010
Figure 11. Time series of CO2 sensors in various positionings.
Energies 14 06296 g011
Table 1. Distance of sensors to the seated area and their presence detection accuracy.
Sensor PositionDeskCNCFWFNWFFWBN
Distance (cm)508017011030090
Accuracy of Presence Detection84%74%61%77%51%59%
Publisher’s Note: MDPI stays neutral with regard to jurisdictional claims in published maps and institutional affiliations.

