1. Introduction
Energy consumption has grown exponentially across the world over the past years, along with society’s dependency on fossil fuels. According to the US Energy Information Administration (EIA), energy use worldwide will continue to grow for at least another three decades due to economic growth [
1]. The EIA estimates that total energy consumption will increase 15% for OECD countries and nearly 70% for non-OECD countries between 2018 and 2050.
Due to the rapid increase in demand for energy, governments, industries and experts are trying to find a way to ensure supply while at the same time continuing to reduce greenhouse gas (GHG) emissions. Efforts between countries have been made, and settlements such as the Paris Agreement are also in place to achieve a long-term goal, to limit global warming below 2 degrees Celsius [
2]. One way to accomplish this objective is to identify technologies that provide reliable, affordable and clean energy. However, developing these technologies is a challenging task. To shift oil-based fuel predictions and increase the energy produced from renewables is an aim most countries are focused on. Currently, liquid fuels, especially petroleum-based, are the largest energy source around the world [
3]. They present several advantages over any other energy system such as low cost, high reliability and efficiency; characteristics that are required in any fuel. Nevertheless, the path for renewable energies is becoming clearer and growing [
4]. Solar, wind, hydro and marine energy, among other green technologies, will become cheaper and more efficient in the next decades, leading to a new era in energy generation [
5].
This energy transition will only be possible through technological innovation, particularly by finding zero-carbon alternatives and new ways to store excess energy from renewables. This is not an easy task; finding a zero-carbon fuel that also remains economically beneficial and reliable is currently a challenge. When referring to storage methods, there are many possible options available in the market, but the most popular and technologically matured option is batteries. However, these devices currently represent low efficiency and high costs for long-term storage [
6]. Currently, only a few zero-carbon fuels exist (i.e., hydrazine, hydrogen sulphide, ammonium nitrate, ammonia, etc.) that can be used for energy storage. Research indicates that amongst these, hydrogen and ammonia are the most promising [
7].
Ammonia (
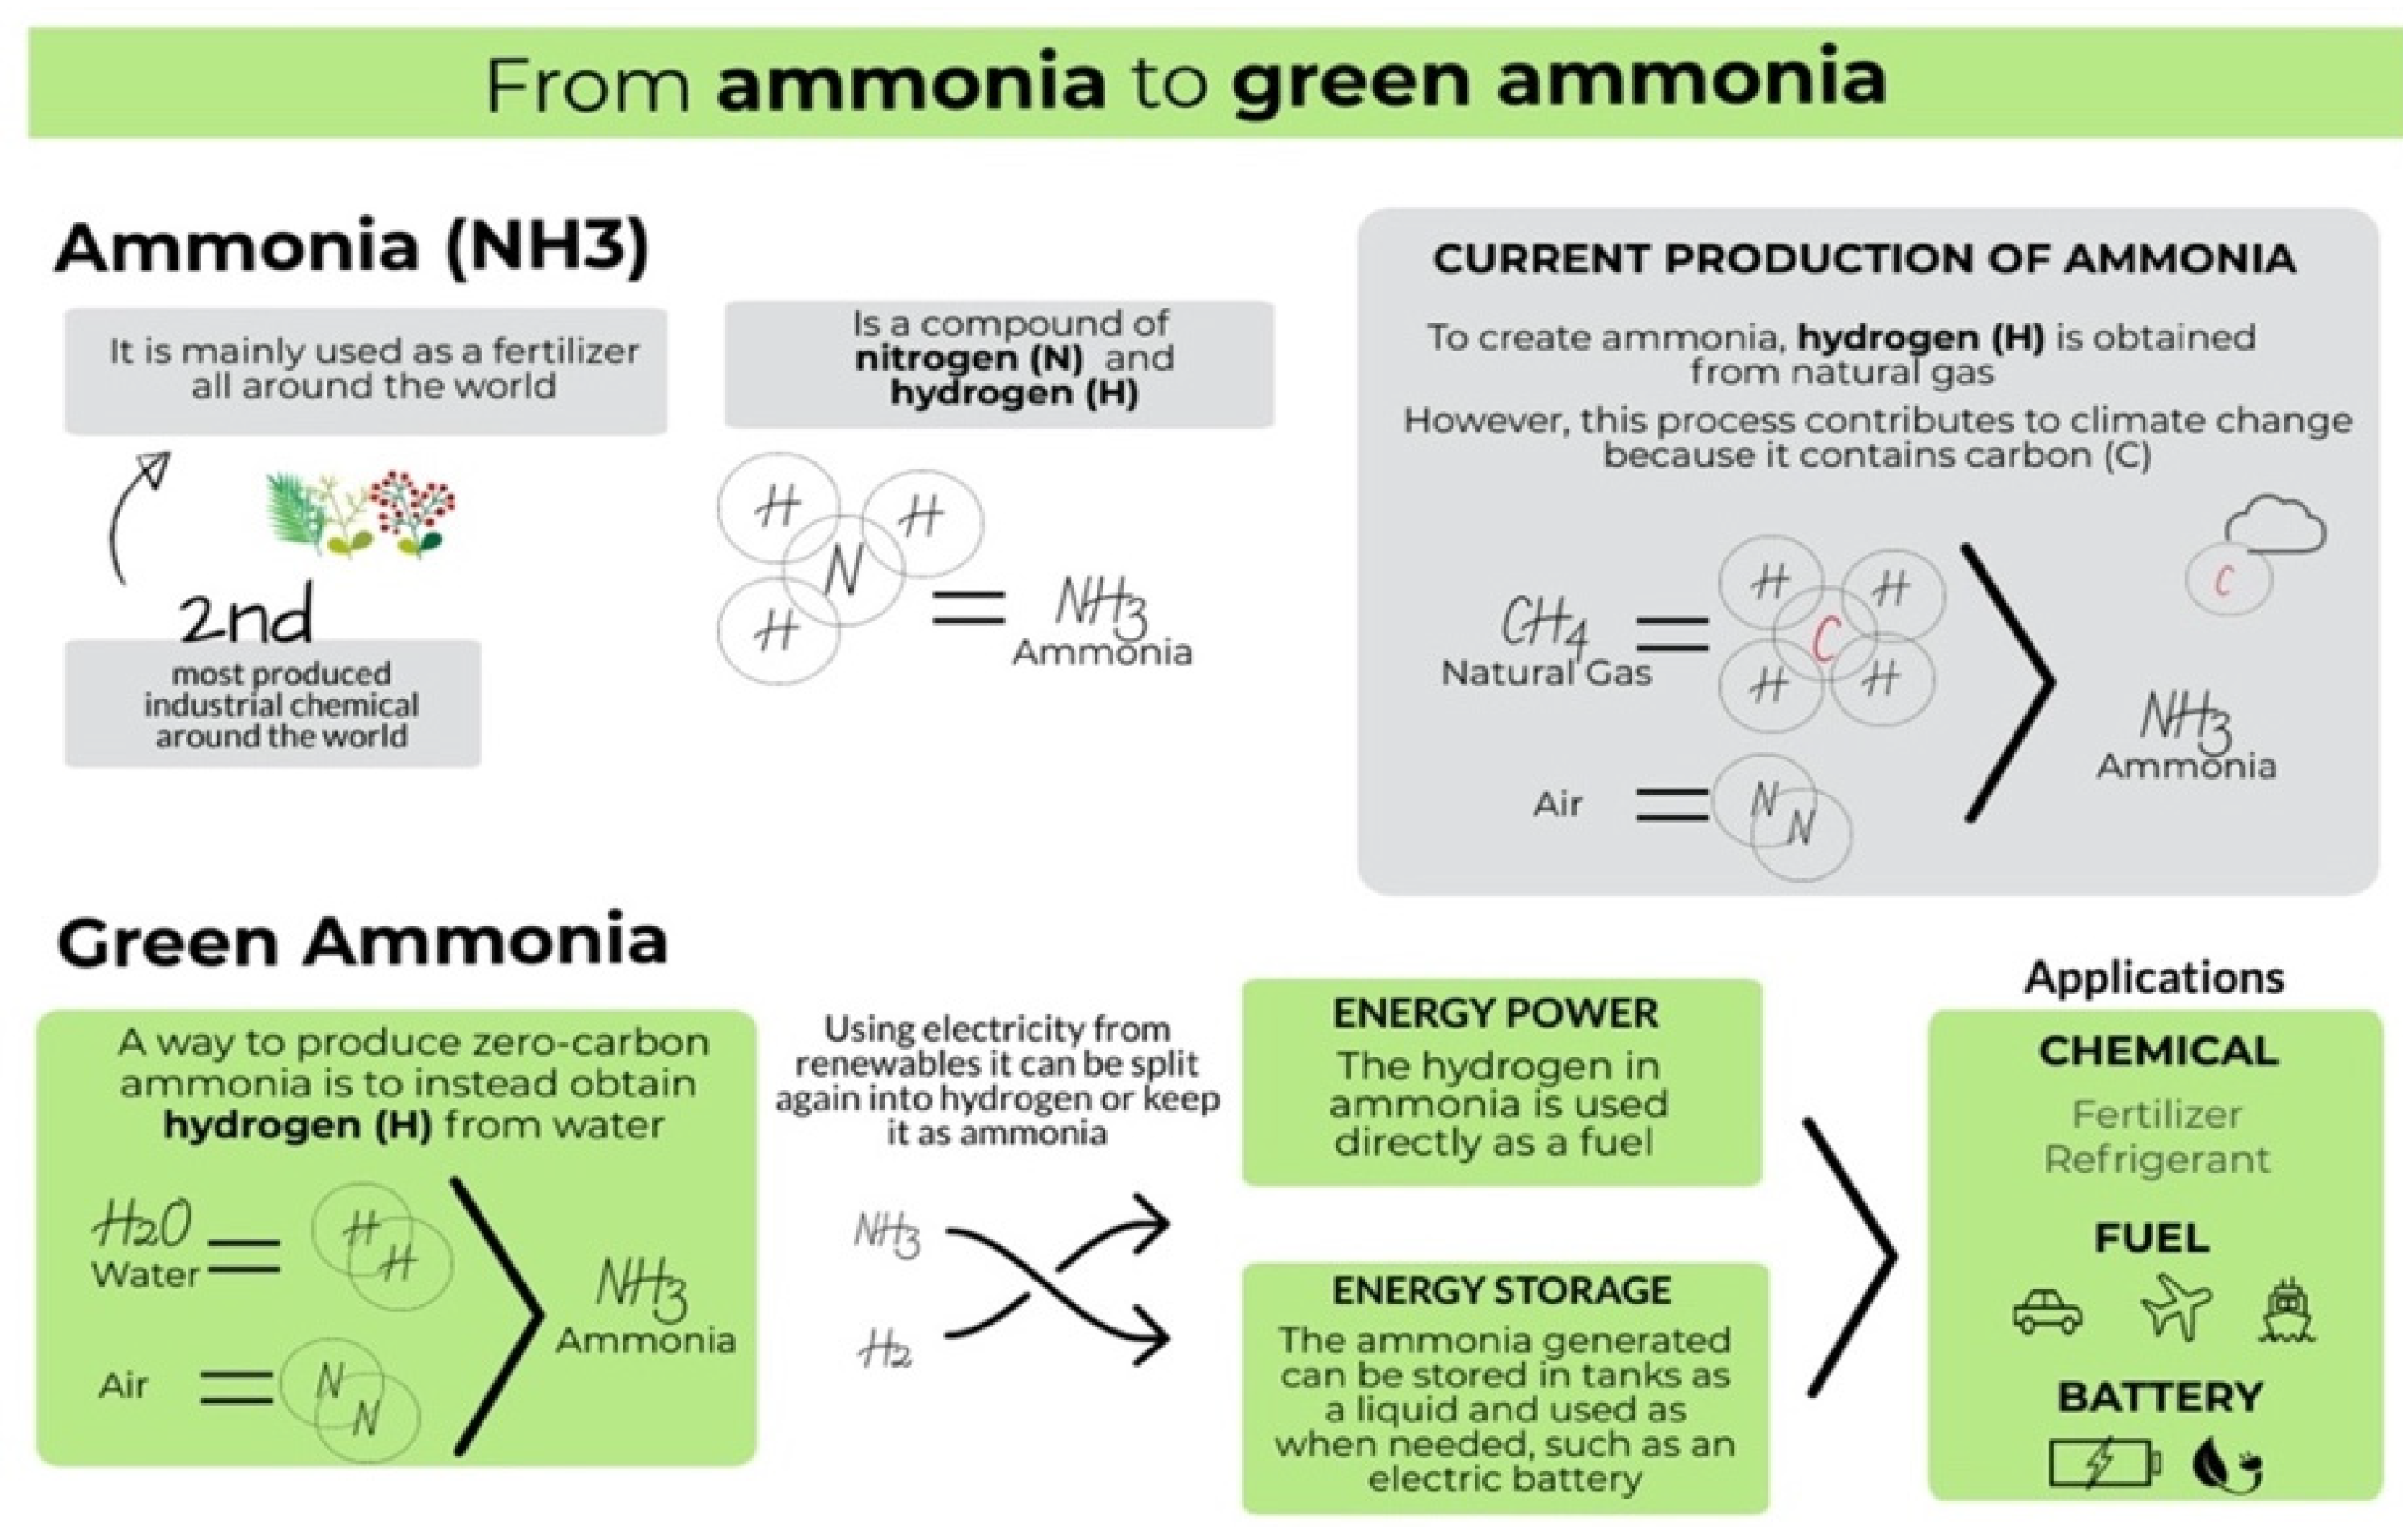
) is a well-known chemical that is mainly used as a fertiliser. Currently is the second most-produced chemical worldwide, just after sulphuric acid [
8]. As a fuel and storage method, it relies on its high-hydrogen content and is considered the main candidate for a transition to a decarbonised society [
9]. As an energy vector, it can be used in Internal Combustion Engines (ICE), Combine Cycle Gas Turbines (CCGT) or as a chemical for Carbon Capture and Storage (CCS). As a storage method, it can be used as a chemical battery to store energy for longer periods [
10]. In this process, ammonia simulates a battery. The excess energy from renewables is used to split the water and obtain hydrogen; consequently, this hydrogen is stored in tanks and used when and where it is needed.
With its current applications as a fertiliser and chemical compound, the knowledge and infrastructure already established, along with the attractive characteristics as a zero-carbon fuel, industries are increasingly investing in
as an energy vector and storage method [
11,
12,
13]. However, little is known about public attitudes and concerns around this technology, one of the factors that will support its successful implementation and facilitate energy policy targets.
Public acceptance of energy technology is complex and therefore difficult to study. A new energy technology often brings several benefits for the public, especially when referring to zero-carbon technologies. Yet, as with any technology, it is always a challenge to understand people’s responses to them. Numerous factors are known to play a role, such as emotions, cultural backgrounds, associations, place attachment, to mention a few [
14]. This topic has become more popular among companies, authorities and private local investors who are starting to involve the public at earlier stages of the development of new systems. Research about the participation of the general public in the development of emerging energy systems is becoming more popular and considered essential in the development of upstream technologies [
15,
16]. As new technologies keep expanding, more questions and, therefore, more answers will be required to implement new energy alternatives.
In the case of hydrogen energy systems, the interest from different sectors is growing, and there are several studies trying to understand people’s attitudes towards this fuel [
17], recognising the significance of involving social contexts and processes in the deployment of a hydrogen economy [
18].
However, this is not the case with ammonia-based technologies. Currently, there are no formal studies that have examined public perception of ammonia as a potential energy vector or storage medium. Therefore, this research aims to provide the first empirical study examining public perceptions of green ammonia in two different countries. Developing studies such as the one presented below will allow us to establish the foundations for the recognition of public perceptions around this subject; enabling future stakeholders to consider the findings during the development of new technologies fuelled by .
2. Materials and Methods
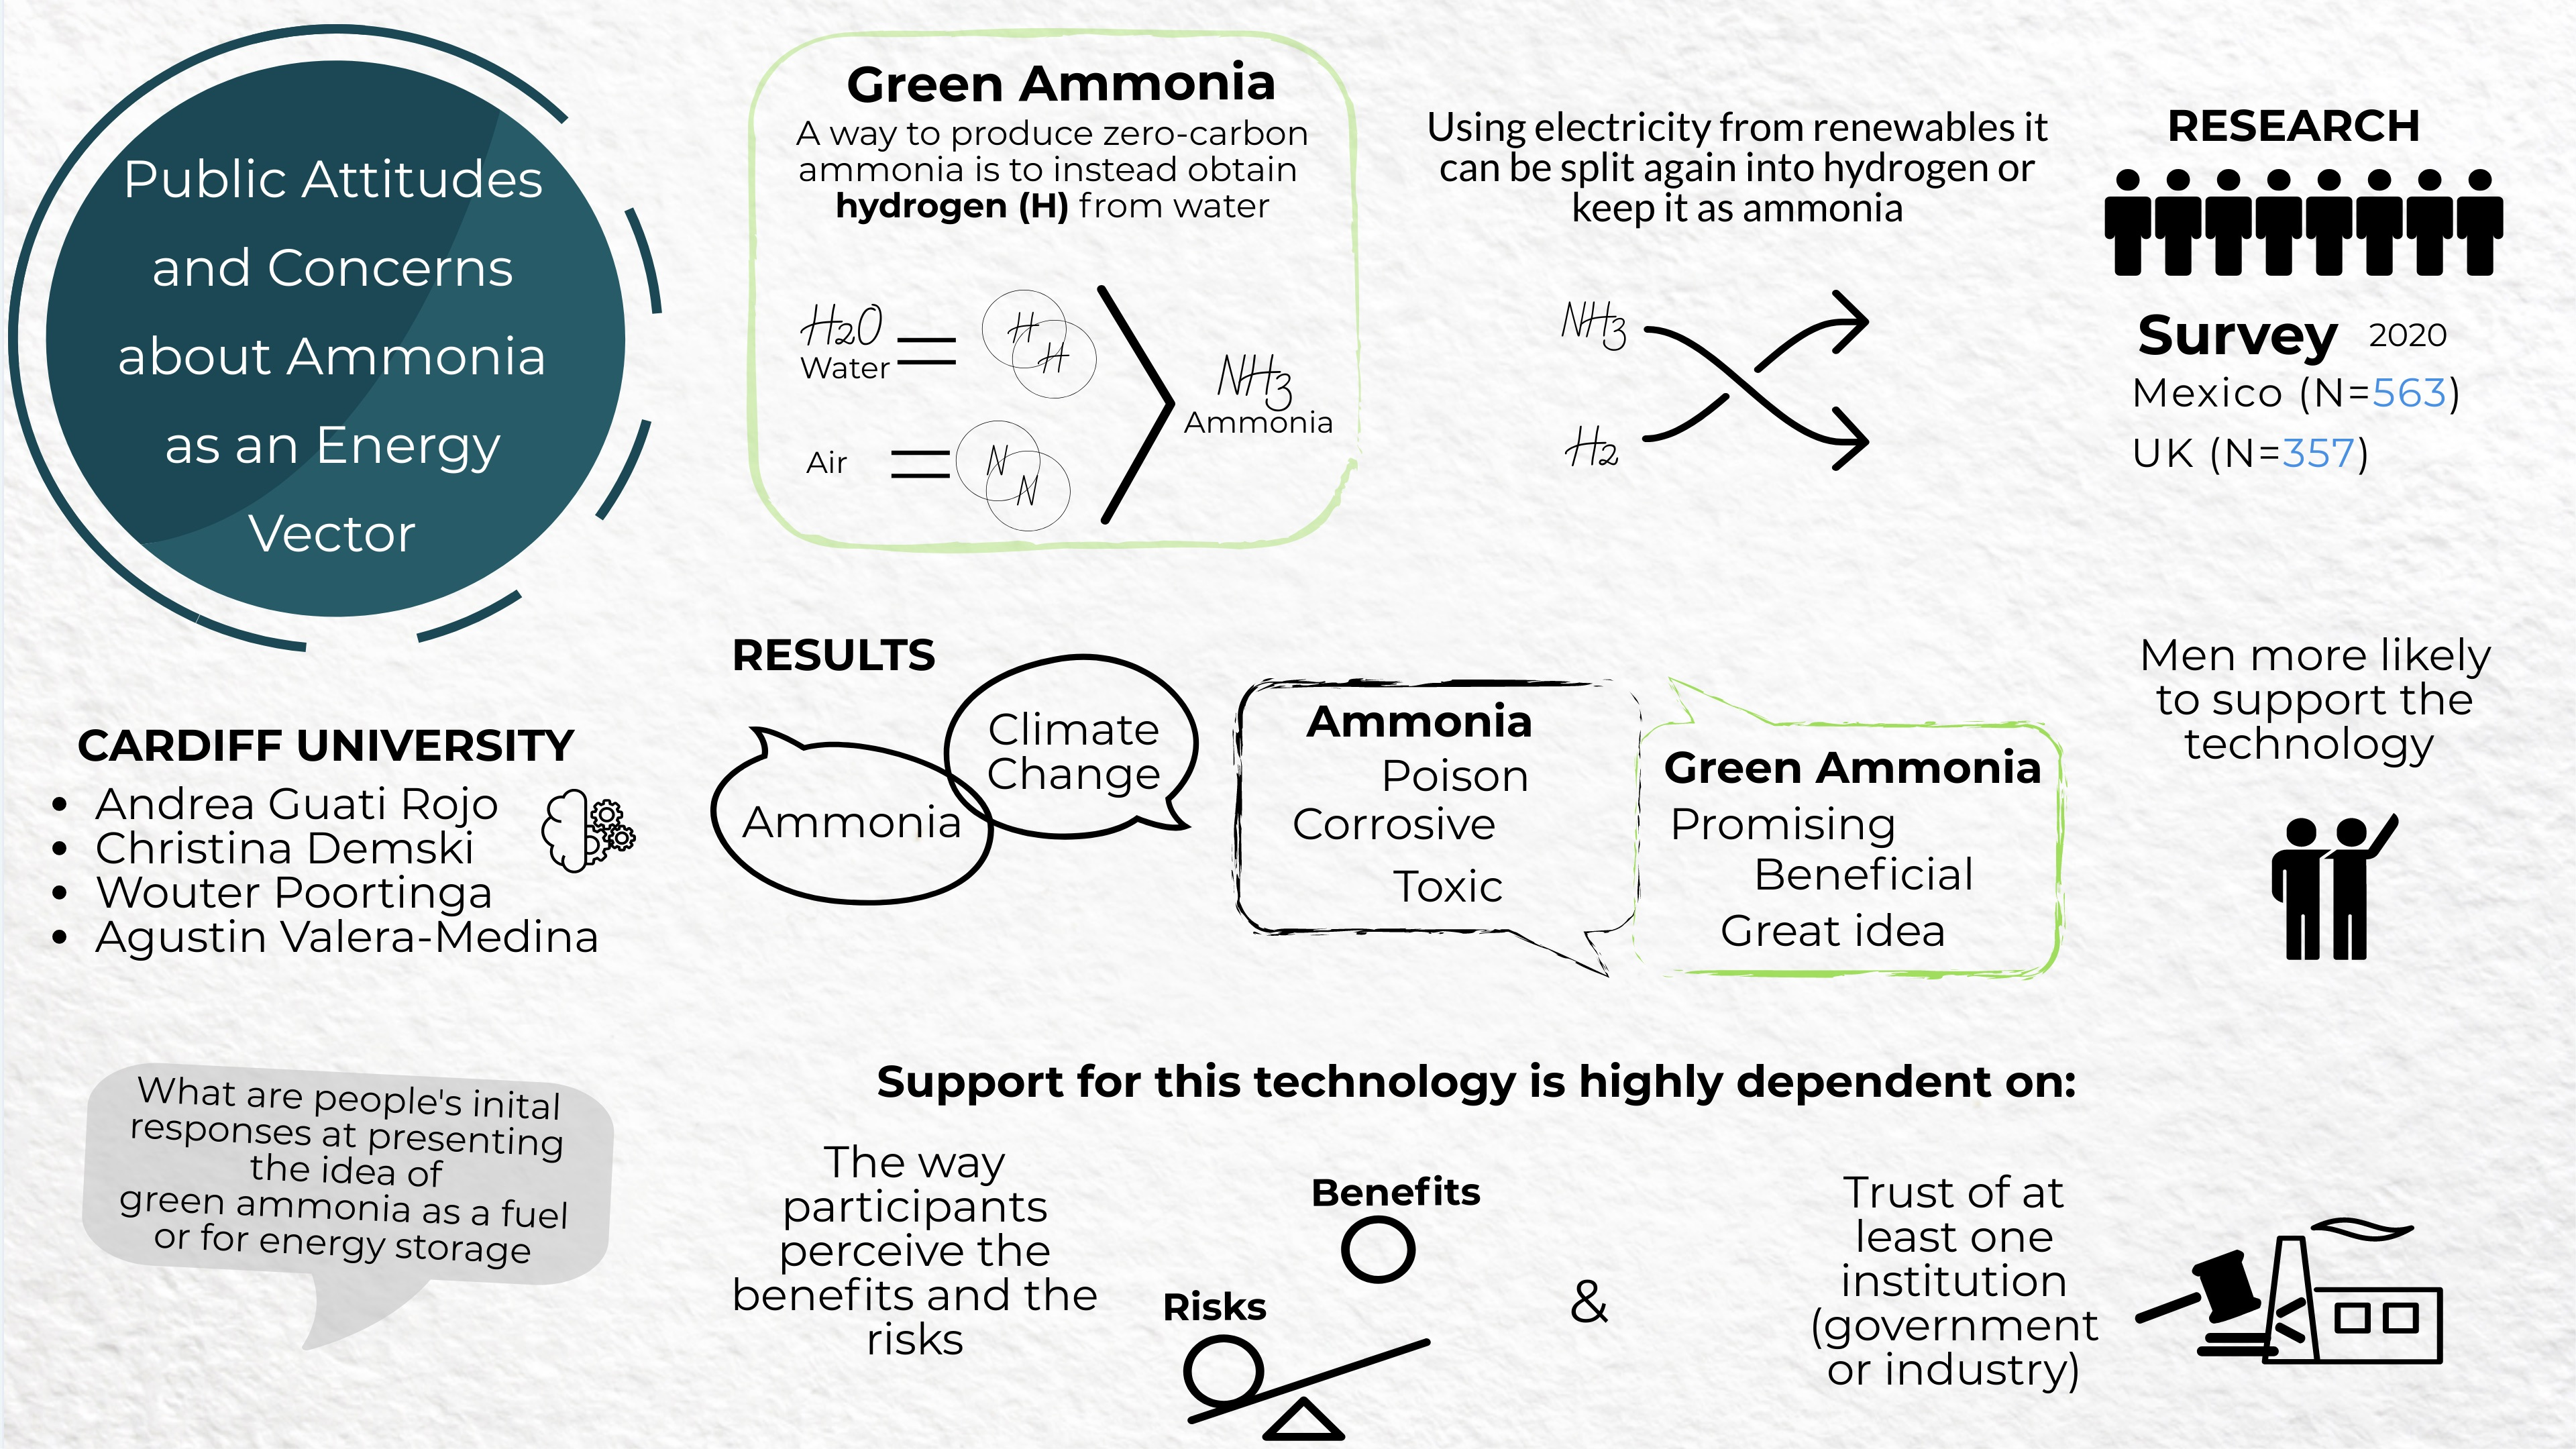
This study focused on two specific countries, Mexico and the UK. Mexico currently has high revenues in agriculture and depends on ammonia as a fertiliser. It therefore has an existing infrastructure for the transportation and storage of ammonia gas, as well as local knowledge in the farming industry, which may translate into positive acceptance by local Mexican communities. In the UK, ammonia presents an opportunity to store excess energy produced by renewable energy technologies, with increasing interest and investment in ammonia projects around Europe but mainly in the UK.
Analysing two different countries provides an opportunity to examine the potential deployment of ammonia projects in two different contexts. This research aimed to (1) gain a better understanding of what people’s initial responses are when presented with the idea of ammonia as an energy vector and energy storage; (2) understand how people’s socio-cultural context shape their opinion about a specific element: their different point of views towards different scenarios; and (3) investigate topics related to the perception of climate change and energy sources.
The results presented in this paper are part of a larger project examining public perceptions of green ammonia technologies, involving additional interviews with stakeholders and focus groups with the general public (see
Supplementary S1 for a detailed description of the general project).
2.1. Participants: Recruitment Measures
Data for this study were collected between May and June 2020. A carefully designed questionnaire was distributed online using the Qualtrics survey platform in Mexico and the UK (Supplemetary). This method is considered a suitable option for public perception studies as it produces valid and reliable results that can be generalised [
19]. Additionally, surveys allowed us to reach a wider range of the population in both nations, which is the best option for countries such as Mexico, which holds one of the largest populations in the world. Participants were recruited through snowball sampling; this consists of distributing the questionnaire amongst members of the populations who are available to the researcher [
20]. For this study, the survey was distributed first to colleagues and friends close to the researchers, who passed it on to other people until subsequently a larger number of participants is reached. This type of sampling is applied when samples with the target characteristics are not easily accessible. The data collection process had a total duration of four weeks. In the end, a total number of 357 participants in the UK and 563 in Mexico was achieved.
2.2. Questionnaire and Structure
The questionnaire was divided into seven sections covering the topics of (1) demographic profile, (2) perception of climate change, (3) pro-environmental behaviour (PEB), (4) climate change and overpopulation, (5) climate change knowledge, (6) perceptions of green ammonia technologies, and (7) views on the deployment of green ammonia in their country (see
Supplementary S2 for complete questionnaire). Our main objective was to understand the participants’ previous knowledge and concerns about climate change, to later introduce the concept of green ammonia and analyse their attitudes about this new alternative energy system.
The results for each of the seven topics are described in this paper in the same order as they are listed.
Most of the questions in the survey were close-ended questions, consisting predominantly of Likert-scale answering scales. The response scales were designed to range from negative to positive (e.g., strongly disagree to strongly agree), with a neutral option in between (neither agree nor disagree). Questions were designed to be five- or seven-point scale. The questions were coded so that higher scores indicate higher agreement, concern, support, favourability, etc., where necessary items were re-coded to reflect this.
Data gathered from the survey were analysed using a different range of statistical methods. This study applied mainly basic statistical approaches such as frequency distributions, descriptive statistics, t-tests and z-tests.
An independent
t-test was used to compare the means of the sample across the two countries. Post-hoc comparisons were used with Bonferroni corrections to adjust for multiple testing [
21]. Further statistical methods, such as linear and multiple regressions, were used to understand what factors are associated with the support of green ammonia technologies. For open-ended questions, the most common answers were identified and divided into categories. Consequently, each category was then split by topics providing a code for each of these. For example, for the question about a location, both countries were divided into different areas according to the political division in each country (the UK in 12 and Mexico in 5). Each of these areas was assigned a value that allowed us to quantify the data and obtain a precise number of participants living in a certain location. For questions about green ammonia, the process started with all the responses being scanned to obtain a general idea of the most common answers. Next, different categories were created to summarise these responses. Once we established values for each category/coding, then each of the responses from participants was given a value depending on the answer (new values were created if needed). This allowed us to quantify the answers and measure the most common responses in terms of percentages.
3. Results
3.1. Demographic Profile
The Mexican sample was slightly more balanced in terms of gender than the UK sample, with just a slightly higher female participation compared to men (F = 56.8%, M = 42.8%). Most of the participants were between 25 and 34 years old, held a university degree (53.6%) and worked full time (63.2%). When asking about political orientation they placed themselves on the right side of the spectrum (M = 5.69, SD = 2.26) (The question required participants to rate their political orientation from 0 to 10 (0 = left 10 = right)).
The UK sample had a high number of female participants (67.2%), with an average age of 35–44 years old. The educational level amongst participants was higher than in Mexico, with a majority holding a postgraduate degree (49.9%) and working full time (55.2%). The UK sample has a higher percentage of retired participants (8.7%) than the Mexico sample (4.8%). The participants in the UK also indicated a more left-wing political ideology (M = 3.77, SD = 2.19). The two country samples (see
Table 1) cannot be considered representative of their national population.
3.2. Climate Change Perceptions
Results from the survey indicate similar perceptions of climate change in the two countries. Most of the participants from Mexico and the UK think the world’s climate is definitely changing (UK 88.7%, Mexico 95.7%), report to feel extremely or very concerned about climate change (UK 60.9%, Mexico 68.2%) and believe that climate change is caused entirely or mainly by human activity (UK 84.1%, Mexico 81.4%).
Nevertheless, when asked about the seriousness of climate change (how serious of a threat, if at all, is climate change to each of the following: you and your family, UK/Mexico as a whole, people in developing countries, people in developed countries; the responses were measured on a 5-point scale from not at all serious to extremely serious), results show that the UK think climate change is less of a threat for themselves and their country than the Mexican sample; however, both countries perceive climate change as a very or extremely serious threat for developing countries (UK 61.4%, Mexico 70.1%). Additionally, participants from both countries agree that it is the national government that is mainly responsible for acting on the issue (UK 75.4%, Mexico 83.7%), followed by the industry (UK 61.1%, Mexico 80.8%).
3.3. Pro-Environmental Behaviour (PEB)
This section consisted of a series of PEB activities where participants needed to rate each action on a 5-point scale (1-Never–5-Always) on how often they plan to execute them (see
Table 2 below).
Participants from both countries plan to engage in the activities presented equally often, with a high number of participants indicating that in the next month, they plan to carry out most of these actions about half the time or most of the time. Generally, we can observe that the actions that participants from both countries intend to perform more often in the next month are turning off lights when not using them, turning off the tap when brushing their teeth and driving economically. However, it also becomes evident throughout this section that the activities participants plan to carry out less frequently (avoid eating meat, buy food that is organic and cut down the amount they fly) are the ones with the highest impact on the environment [
22].
3.4. Climate Change and Overpopulation
Overpopulation is a topic often associated with climate change, and which some would describe as the “root of the problem” [
23]. Nevertheless, we need to take into consideration that the impact on climate change from developed nations is significantly larger than developing countries [
24]. According to a report conducted by the Stockholm Environment Institute (SEI) and Oxfam, the richest 10% of the population was responsible for 49% of carbon emissions in 2015, whereas the poorest 50% were responsible for only 7% [
25]. This shows how higher economic growth is generally associated with higher emissions [
26]. This “inequality in emissions” requires to be acknowledged when referring to overpopulation as one of the main causes of climate change.
Several articles affirm that the single most effective measure an individual in the developed world could take to cut their carbon emissions over the long term could be having smaller families or “one fewer child per family” [
27]. This statement was presented to participants to understand their perception of the impact of overpopulation in climate change and to compare their points of view between countries. Participants were asked to rate their agreement with the statement on a 5-point scale (1—strongly disagree, 5—strongly agree).
Results from the surveys suggest that there is a significant difference between countries, t(917) = 6.839, p < 0.001. Whereas a majority of Mexican participants agree with limiting the number of children per family as a measure to tackle climate change (62.8%), only 46% of the UK participants do so. About one in four (23.5%) of UK respondents and about one in five (19.6%) of Mexico respondents neither agree nor disagree with the statement.
3.5. Climate Change Knowledge
In general, we can state that participants in both countries have a good baseline knowledge of climate change. This section was measured through four questions about climate change and energy sources, where participants were asked to rate if certain fuels contribute to climate change or if a statement was correct or incorrect. However, there is still high uncertainty about the causes of climate change, especially amongst Mexican participants, where numerous “don’t know” answers were obtained in the sections on fuels and climate change knowledge.
Participants in both countries were aware that burning oil produces , which shows that most participants understand the role of fossil fuels in climate change. However, there was still a relatively large percentage of participants answering “don’t know” (UK 6.4%, Mexico 11.7%).
Most of the participants are not aware that nuclear energy plants do not produce during their operation. Answers were divided, but a high number of participants answered that they do so (UK 29.7%, Mexico 38%). Again, uncertainty was high, with 32.8% in the UK and 33.6% in Mexico answering, “don’t know”.
3.6. Perceptions of Green Ammonia Technologies
3.6.1. First Associations
The first question about this topic was displayed at the beginning of the survey, straight after the demographics section, and asked participants to list the first thoughts or images that come to mind when hearing the term “ammonia”. No previous information about the chemical was given to participants. When examining both samples together, most of the participants (18.4%) answered with a single broad concept such as “chemical” or “chemical compound/substance” that does not have specific negative or positive connotations. However, 17.4% of the whole sample mentioned words that reflect a more negative opinion about ammonia, referring to it as “poison”, “toxic”, “corrosive” or “acid”. A further 8.6% used the words “dangerous”, “not safe” or “bad for humans” to describe their associations with ammonia. An interesting observation was that the association with “killing”, “bomb” and “death” also came up, although in a low number of participants (1.4%).
If we look at the data from each country separately, several differences between them were found. The results show that for the UK sample, the most popular answer was associated with smell (23.2%). This was followed by mentions of urine/manure (15.1%) and cleaning products (13.7%). The odour was only mentioned by 7.1% of participants from Mexico. In Mexico, the most mentioned associations were “poison”, “toxic” or “acid” (25.2%), followed by “chemical” (22.6%) and “cleaning products” (16.5%).
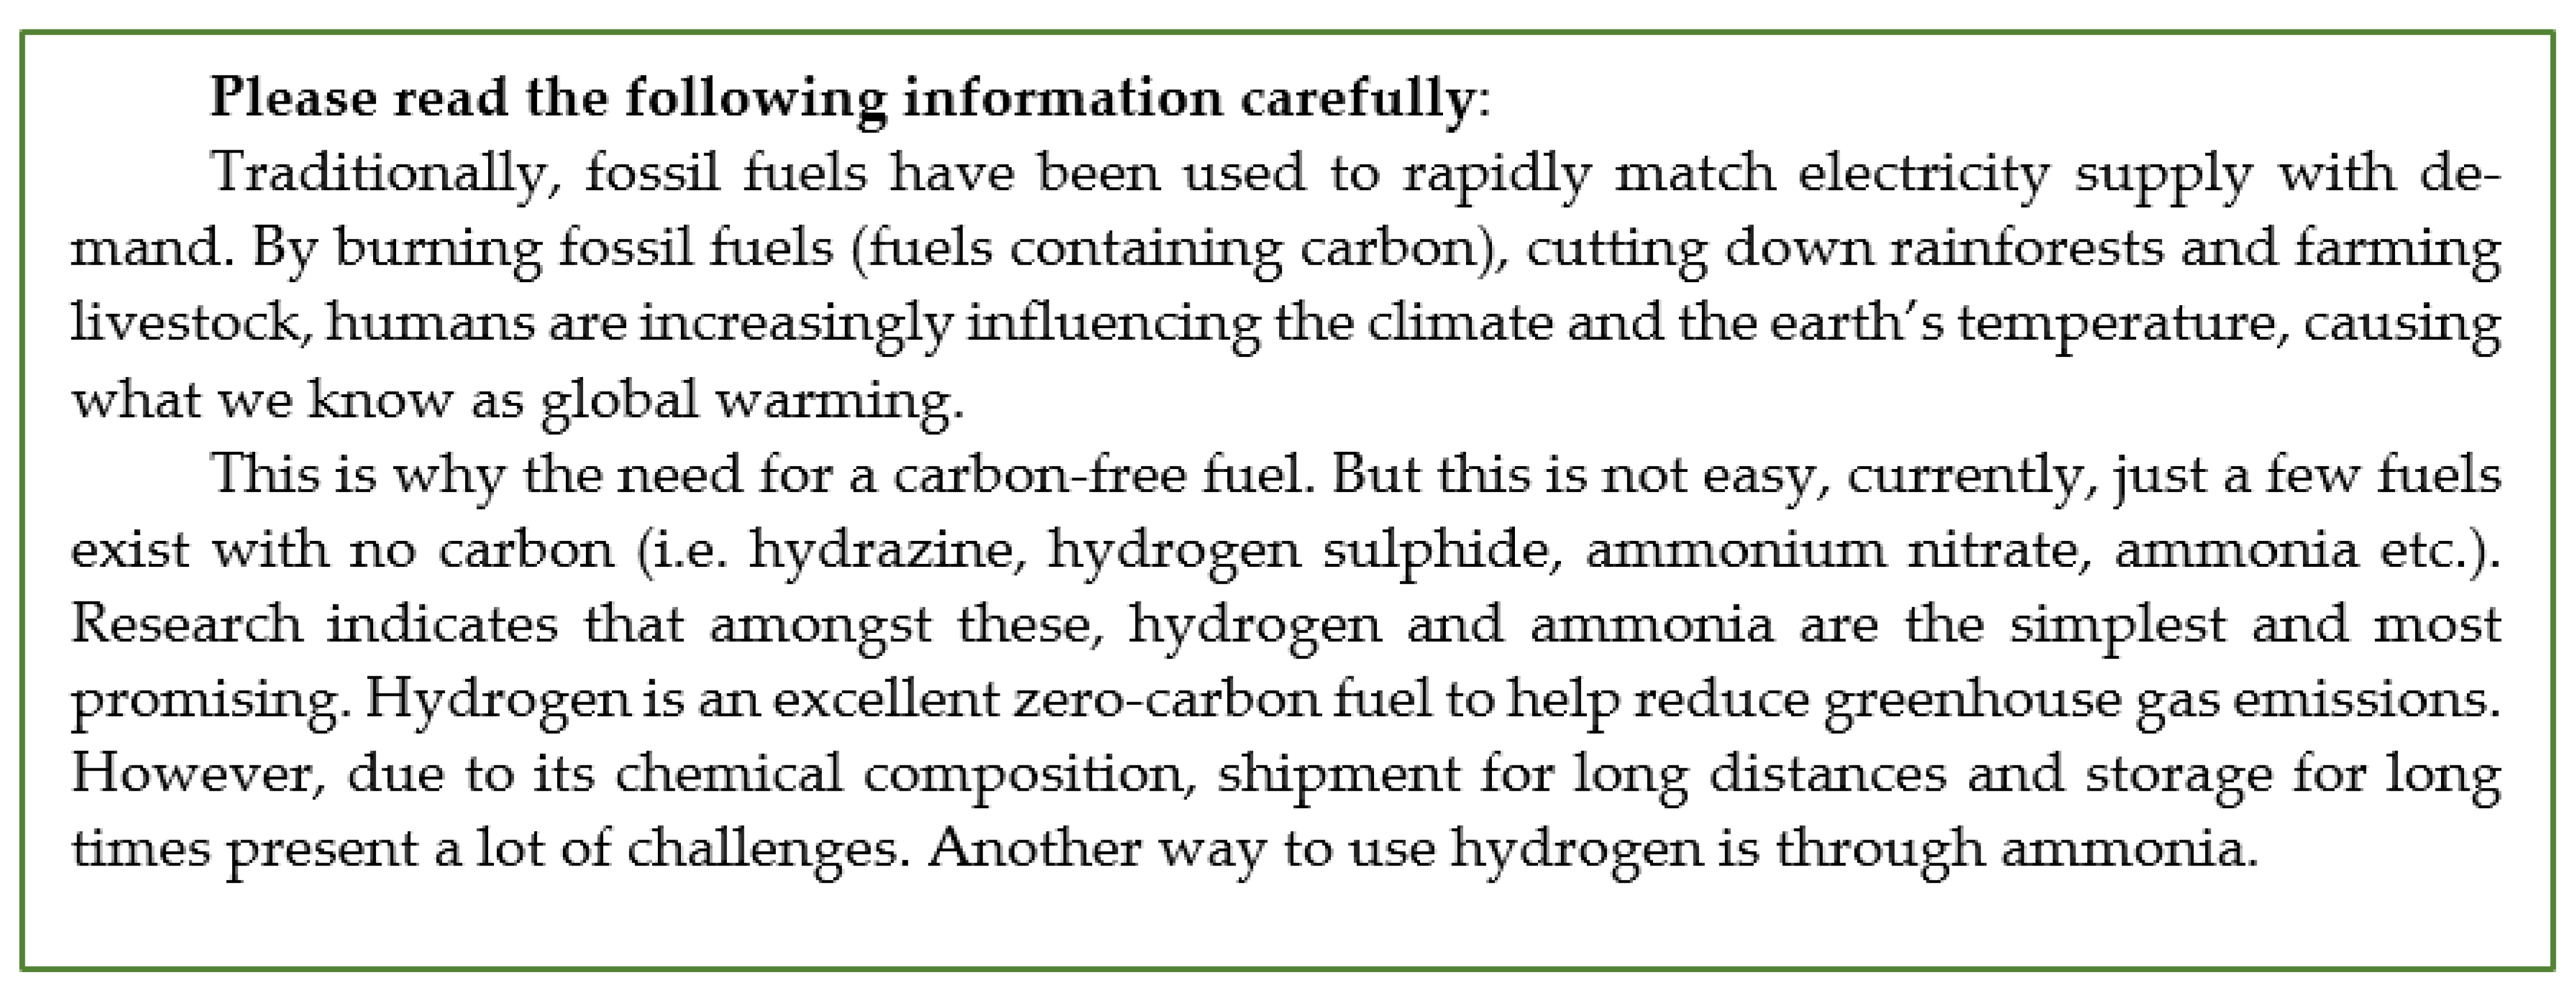
At a later stage in the survey, participants were given an infographic and a text explaining what ammonia is, how it is currently being produced and then the concept of green ammonia was introduced in simple terms (see
Figure 1 and
Figure 2).
By following this explanation, a second open-ended question was asked: “Please tell us what thoughts or images came to mind when reading this information about green ammonia?”. The results from this question show a change in perception about ammonia. The majority of respondents in both countries (Mexico 30.2%, UK 39.5%) answered with positive comments about this technology using words such as “promising”, “beneficial”, “amazing”, “great idea” and “excellent option”. Following these answers, the most common response for Mexico and the UK was related to a novel concept (Mexico 18.7%, UK 8.4%).
After presenting the infographic, participants were asked to rate on a 7-point scale (from 1—extremely negative to 7—extremely positive) how they feel about green ammonia in general. Responses from both countries were similar with no significant difference, t(912) = 1.891, p = 0.059, with a majority of the answers being positive, (UK M = 5.63 SD = 1.08; Mexico M = 5.77 SD = 1.10). However, participants from Mexico felt slightly more positive about the technology (87.7%) than participants from the UK (82.9%)
3.6.2. Risks and Benefits
Once the information about green ammonia was given to participants and their first perception of the technology was recorded, a list of possible benefits and risks was presented in order for them to rate how positive or worried they felt about these, respectively.
First, four benefits (see
Table 3) were presented where participants were asked to rate them on a 5-point scale from 1—not at all positive to 5—extremely positive. The results confirm a similar pattern in the two countries. The benefit participants feel most positive about is the zero-carbon property of this fuel (UK M = 4.25, SD = 0.82, Mexico 4.35 SD = 0.79), followed by using animal waste to produce energy (UK: M = 4.12 SD = 0.82, Mexico M = 4.30 SD = 0.76) and the established infrastructure (UK: M = 4.05 SD = 0.92, Mexico M = 4.13 SD = 0.84). For both countries, the least favourite benefit was the penetrating smell to detect a gas leak (UK: M = 3.67 SD = 0.84, Mexico M = 3.98 SD = 0.85), with UK participants being less positive than Mexican participants.
Second, five risks (see
Table 4) were presented where participants were asked to indicate on a 5-point scale how worried they were about these risks (scale ranged from 1— not at all worried to 5—extremely worried). The perceptions of risk associated with green ammonia were different in the two countries. For UK participants, the main worry was about possible NOx emissions if ammonia is not burned properly (M = 3.55, SD = 0.79), whereas, in Mexico, their main concern was about the intensive water use of the technology (M = 3.86, SD = 0.93). The second highest worry in the UK was the toxicity of the gas when inhaled (M = 3.32, SD = 0.89), while Mexican participants opted for NOx emissions (M = 3.82, SD = 0.81). These were followed by water intensity (M = 3.04, SD = 0.99) for the UK and toxicity of the gas for Mexico (M = 3.64, SD = 0.88). Interestingly, the possible increase in electricity prices seems not to be a main worry for neither of the countries (UK M = 2.98, SD = 0.89) (Mexico M = 3.63, SD = 0.85). Even though smell came at the bottom of the benefits as the least positive characteristics of the technology, for concerns, the unpleasant smell came as the least of the worries for both Mexico (M = 3.14 SD = 1.10) and the UK (M = 2.79, SD = 1.03).
Following the list of risks, participants were asked to rate on a 5-point scale how acceptable or unacceptable in general the risks of green ammonia are (1—very unacceptable to 5—very acceptable). The results were similar to previous findings with a significant difference between countries, t(904) = −3.662, p < 0.001, showing that Mexican participants consider the risks to be less acceptable than UK participants (UK: M = 3.59, SD = 0.73, Mexico: M = 3.40 SD = 0.74). Both participants from Mexico and the UK agreed that the benefits outweigh the risks (UK 45.3%, Mexico 47.8%); nevertheless, there is still a considerable percentage in both countries that believe the contrary (UK 15.8%, Mexico 17.4%).
3.7. Ammonia in Their Country
This final section of the survey focused on how acceptable participants thought it would be to implement green ammonia technologies in their country and who they would trust to regulate it. The first question in this section was: “Would you support or oppose the use and development of green ammonia technologies in your country as a way to reduce carbon emissions?” The results indicate similar answers between countries without a significant difference, t(913) = −0.725, p = 0.468. The majority of participants in the UK and Mexico strongly support (UK 28%, Mexico 26.2%) or somewhat support (UK 44.9%, Mexico 49.6%) the development of this technology in their country (UK M = 3.97 SD = 0.81) (Mexico M = 3.93 SD = 0.89). Results were coded as follows: 1—Strongly oppose, 2—Somewhat oppose 3—Neither support nor oppose, 4—Somewhat support, 5—Strongly support. The negative results indicating a strong or somewhat opposition were very low, only representing 3.1% for the UK and 7.4% for Mexico.
Next, participants were asked: “How feasible do you think the development of this kind of projects (e.g., ammonia technologies) might be in your country?” Most of the participants in the UK perceive this technology to be definitely or probably feasible (64.1%), followed by 30.8% who are not sure and 5.1% considering it is probably or definitely not feasible. Views in Mexico appear to be divided. While 36.9% consider the technology definitely or probably feasible, almost the same percentage (33.5%) consider it probably or definitely not feasible. A high number of participants from Mexico are “not sure” about the feasibility of the technology (29.6%).
A different perspective about the technology is also observed in the question: “If we use this technology in the UK/Mexico, who would you trust to regulate it?” The participants were asked to choose between four options: government, industry, both or none. For participants from the UK, the most trustworthy institution to regulate this technology is a combination between government and industry (43.8%); whereas, for participants from Mexico, the industry was their first option with 44.6%.
By considering the results obtained previously, further analysis was performed to understand the relationship between trust and support from green ammonia technologies. A regression established a significant relationship between these two variables, indicating that trust in government predicts support for green ammonia technologies in both countries: Mexico, F (3557) = 15.265, p < 0.001; UK, F (3350) = 5.509, p < 0.001. For the UK, trust in at least one of the institutions (government or industry) also predicts support for green ammonia technologies.
3.8. The Role of Demographics and Climate Change Risk Perception in Support for Green Ammonia Technologies
Further analysis was performed to determine the factors in public support for green ammonia energy technologies. The results from a series of linear regressions indicate that climate change worry, climate change threat and perception of risks and benefits each separately and significantly predict support for green ammonia technologies in most cases (see
Supplementary S3).
Subsequently, a multiple regression analysis was run, including climate worry, climate change threat, and perceived risks and benefits. The multiple regression model significantly predicted support for green ammonia technologies in both countries, Mexico, F (3552) = 68.46, p = < 0.001 and UK, F (3342) = 31.11, p = < 0.001, and could explain 27.1% and 21.4% of the variance, respectively.
Interestingly, when including the three climate change related variables, results indicate that the perception of risks and benefits mediate the association between climate change worry/threat and support. This indicates that support for this type of technology highly depends on the way participants perceive the benefits and the risks of implementing green ammonia as a fuel or for storage in their countries.
To conclude, a final multiple regression was performed, including all sociodemographic and climate change related variables. The multiple regression model significantly predicted support for green ammonia technologies for both countries, Mexico, F (8467) = 23.568,
p = < 0.001, UK, F (8270) = 9.804,
p = < 0.001. All variables accounted for 27.5% (Mexico) and 20.3% (UK) of the variation in support, which is only marginally more than the variance explained by climate worry, the climate change threat and perceived risks and benefits.
Table 5 also shows that controlling for socio-demographics only slightly alters the associations of the psychological factors in the acceptability of green ammonia technologies. When considering all variables, only gender, political orientation (only for Mexico), the climate change threat (only for UK) and perception of risk and benefits suggested a significant relationship with support for green ammonia technologies, as displayed in
Table 5.
4. Discussion
This study explored perceptions of several topics related to climate change and green ammonia in both Mexico and the UK. The results obtained for the first block of questions are in line with our initial hypotheses about the existing concern around climate change in the two countries. The respondents from both Mexico and the UK believe the climate to be changing, feeling deep concern about this topic and stating that climate change is caused entirely or mainly by human activity. When analysing the impact of climate change, the results indicate that the UK sample has a lower risk perception for themselves and their country than the Mexican sample. However, both countries perceive climate change as a very or extremely serious threat to developing countries. Additionally, both countries agreed that it is the national government the main responsible for acting on this issue, followed by the industry.
With regards to climate change understanding, we can conclude that, in general, there is a good baseline knowledge around this topic. However, there is still high uncertainty around which fuels contribute to climate change. Interestingly the data suggest that for both samples, the fuel that people have more doubts about is hydrogen, which is extremely important for this research as ammonia fuel is based mainly on hydrogen. Thus, this implies that if the technology is presented to laypeople, a majority might not consider hydrogen as carbon-free.
The main objective of this research was to understand and first analyse associations with green ammonia to produce and store energy. Participants’ perception of the technology was surprisingly positive, describing it as “promising”, “beneficial” and a “great idea”. This was also evident when most of them affirmed feeling extremely, moderately or slightly positive about the technology. In general, we noticed that the Mexican sample seems to have a more positive perspective on the technology and seems more confident about the benefits; nevertheless, this country is also more worried about the risks than the UK, indicating more extreme perceptions for both—risks and benefits.
Trust was one of the results with higher contrast between countries: whereas the Mexican sample trusts the industry to develop this technology, the UK sample would rely on both government and industry. Research shows that government and parliament are some of the institutions least trusted in the UK [
28]. Additionally, Edelman Trust Barometer Report (2020) indicates that with regards to technology, the UK tends to perceive the industry as “essentially self-serving and just acting in their best interests” [
29]. This might explain the results obtained from the sample in the UK. On the other hand, in Mexico, the government in power has on various occasions pronounced itself against renewable energy. Before the survey was distributed, Andres Manuel Lopez Obrador (Mexican President) announced his support for fossil fuel-derived power generation and a reduction in the budget for all green energy technologies [
30]. This context in the country may explain the low trust from participants in the Mexican government to develop green ammonia energy technologies.
When exploring further the association between the climate change related variables and green ammonia support, we observed that support for this technology highly depends on the way participants perceive the benefits and the risks of implementing green ammonia as a fuel or for storage in their countries.
When examining trust linked to support for green ammonia, we found that when participants do not trust any institution (government or industry), the support for this technology is considerably low.
In terms of demographics, men are more likely to support the technology in both countries. These results go in line with different studies from previous years in the UK. According to Devine-Wright (2007), women are more likely to support new renewable energy development in general terms [
31]. However, when it comes to specific renewable technologies, women are less likely to support them (e.g., wind farms, nuclear energy, carbon capture and storage) [
32].
Additionally, results suggest an association between political orientation and support for green ammonia technologies amongst Mexican participants; respondents leaning more to right-wing parties are more likely to support this type of technology. This result reinforces the previous statement about the current situation of the Mexican government (left-wing), where the energy strategy is focused on boosting hydrocarbon fuels in order to support the national oil production.
5. Conclusions
It is a reality that green ammonia interest and investment are increasing worldwide; countries are adopting this technology as a measure to tackle GHG emissions. As renewable energy technologies keep growing, the need to store and transport excess energy follows the same path, transforming green ammonia into the essential means to store and carry energy. Even though several barriers have to be overcome in the next coming years from a technical perspective, acceptance from the public will be a key aspect for full implementation. This study represents the first step into a comprehensive vision for the deployment of green ammonia as a fuel.
As we can observe from the results, perceptions of green ammonia are positive overall, perceiving the technology as “promising” and “beneficial”. However, it is extremely important to continue with this type of study considering the general public at all stages of technology development. Research reveals that perspectives from members of the general public uncover problems, issues and solutions that sometimes are missed by experts. Additionally, effective public participation leads to better results, for instance, reducing the probability of error [
33].
Even though this research indicates positive outcomes, we need to remember that it is also highly dependent on the perception of risks and benefits, as well as on the trust of at least one institution (government or industry). Lack of trust in stakeholders may increase the public’s perception of risks and, therefore, decrease the recognition of the benefits, even to a point where the purpose of technology is no longer acknowledged [
34].
Therefore, technological responsibility requires a new public standard of accountability, “to establish the needs of the future within the present”—Groves, 2016 [
35]. The next step of innovation is not only to consider technical aspects but to recognise the importance of a joint effort between key players and formulate an ethics of care for the future, where a comprehensive vision is in line with moral reasoning, taking into account both public and stakeholders.
6. Limitations
There are some limitations to this study that need to be addressed in future research. First, the survey was distributed online (mainly on social media), which means that the sample was self-selected. This was reinforced by participants being recruited by snowball sampling, which possibly caused people to share the survey with most people their own age. Additionally, the recruitment process started with the researcher distributing the survey to colleges and then passing it on to friends and then other people, which might explain a large number of participants in both countries between ages 25–34 years (age of the researcher).
Regarding the survey, both samples were not representative of their country, so it is important to consider that the results may not be representative of the whole population. Therefore, additional research with a larger sample should be carried out to obtain more representative data. Moreover, we were able to compare the UK data to other previous surveys and thus explore to what extent the current sample is similar or not to findings in more national surveys (on key perceptions such as climate change); however, this was not possible for the Mexican sample because there is a lack of national surveys on these topics.
Furthermore, perceptions of green ammonia must be interpreted cautiously because of the novelty of the technology and a lack of theoretical research. Public perceptions are highly dependent on how much and what type of information is provided to participants.
Finally, the national and international context must also be carefully considered when analysing the data. When the survey was distributed, there was a lockdown in place due to COVID-19 in both countries, which might have influenced the answer for some of the questions, especially for PEB. This situation might have mainly impacted people’s concern about climate change and even the severity of the topic.
Moreover, a couple of months after the survey was released, an explosion of ammonium nitrate in Lebanon took place with extensive international coverage in the media. Although the technology presented in this survey is different from the chemical that caused the explosion in Beirut, the public perception could have been impacted, and the support for green ammonia could have changed. Therefore, additional research should be carried out to determine the positive opinion of green ammonia obtained in the research.
Author Contributions
Conceptualization, A.G.-R., C.D. and A.V.-M.; methodology A.G.-R., C.D. and A.V.-M.; software, A.G.-R., C.D. and W.P.; formal analysis, A.G.-R., C.D. and W.P.; investigation, A.G.-R. and C.D. writing—original draft preparation, A.G.-R., C.D., W.P. and A.V.-M., writing—review and editing, A.G.-R., C.D., W.P. and A.V.-M.; visualization, A.G.-R.; supervision, C.D., W.P. and A.V.-M. All authors have read and agreed to the published version of the manuscript.
Funding
This research was funded by the Consejo Nacional de Ciencia y Tecnología (National Council of Science and Technology), abbreviated CONACYT. Mexico City, Mexico.
Institutional Review Board Statement
The study was conducted according to the BPS Guidelines for ethical practices in psychological research. Approved by Cardiff University, School of Psychology, Ethics Committee Approval number: EC.20.04.14.6008R.
Informed Consent Statement
Informed consent was obtained from all subjects involved in the study.
Data Availability Statement
Acknowledgments
Guati-Rojo, A gratefully acknowledges the support provided by CONACYT, whose scholarship program has allowed her to pursue the Ph.D. degree from which this work was possible.
Conflicts of Interest
The authors declare no conflict of interest.
References
- US EIA. EIA: International Energy Outlook 2019 Presentation; 2019. Available online: https://www.eia.gov/outlooks/ieo/pdf/ieo2019.pdf (accessed on 30 September 2021).
- United Nations Climate Change. The Paris Agreement | UNFCCC. United Nations Framework Convention on Climate Change. 2018. Available online: https://unfccc.int/process-and-meetings/the-paris-agreement/the-paris-agreement (accessed on 22 June 2021).
- Yildiz, L. Fossil Fuels. In Comprehensive Energy Systems; Elsevier Inc.: Amsterdam, The Netherlands, 2018; Volume 1–5, pp. 521–567. [Google Scholar]
- IRENA. Global Energy Transformation: A Roadmap to 2050; IRENA: Abu Dhabi, United Arab Emirates, 2018. [Google Scholar]
- British Petroleum. Energy Outlook 2020 Edition. 2020. Available online: https://www.irena.org/publications/2019/Apr/Global-energy-transformation-A-roadmap-to-2050-2019Edition (accessed on 25 September 2021).
- Spector, J. The 5 Most Promising Long-Duration Storage Technologies Left Standing. 2020, pp. 4–9. Available online: https://www.greentechmedia.com/articles/read/most-promising-long-duration-storage-technologies-left-standing (accessed on 20 September 2021).
- IRENA. Hydrogen: A Renewable Energy Perspective. 2019. Available online: https://www.irena.org/publications/2019/Sep/Hydrogen-A-renewable-energy-perspective (accessed on 20 September 2021).
- Ghavam, S.; Vahdati, M.; Wilson, I.A.G.; Styring, P. Sustainable Ammonia Production Processes. Front. Energy Res. 2021, 9, 34. [Google Scholar]
- Service, R. Ammonia—A renewable fuel made from sun, air, and water—Could power the globe without carbon. Science 2018. Available online: https://www.science.org/content/article/ammonia-renewable-fuel-made-sun-air-and-water-could-power-globe-without-carbon (accessed on 30 September 2021). [CrossRef]
- Valera-Medina, A.; Banares-Alcantara, R. Techno-Economic Challenges of Green Ammonia as an Energy Vector; Elsevier: Amsterdam, The Netherlands, 2021. [Google Scholar]
- Yara. Yara and JERA Plan to Collaborate on clean Ammonia to Decarbonize Power Production in Japan. 2021. Available online: https://www.yara.com/corporate-releases/yara-and-jera-plan-to-collaborate-on-clean-ammonia-to-decarbonize-power-production-in-japan/ (accessed on 25 September 2021).
- Paul, S. Australia chases green ammonia for power in near-term hydrogen push. Reuters 2021. Available online: https://economictimes.indiatimes.com/industry/renewables/australia-chases-green-ammonia-for-power-in-near-term-hydrogen-push/articleshow/82598152.cms (accessed on 23 September 2021).
- Safetyforsea. Five Major Companies to Develop Ammonia-Fueled Vessels. May 2020. Available online: https://safety4sea.com/five-major-companies-to-develop-ammonia-fueled-vessels/?__cf_chl_jschl_tk__=3fe764c9d93baee408b2a6f19d3ccb7000d5df8c-1625685665-0-AQ5G9t--V5_Al-OQbt-aiVWi1lFr4RfQ4FwXz74rqhHjbvOuIEt_1B1-4FGHVwDJAohqivzw8I_DUTj3add2rXbxUiJi1ldYnt0ENz (accessed on 7 July 2021).
- Breakwell, D.G.M. The Psychology of Risk; Cambridge University Press: New York, NY, USA, 2014. [Google Scholar]
- Kim, J.; Jeong, D.; Choi, D.; Park, E. Exploring public perceptions of renewable energy: Evidence from a word network model in social network services. Energy Strategy Rev. 2020, 32, 100552. [Google Scholar] [CrossRef]
- Pidgeon, N.; Harthorn, B.; Satterfield, T. Nanotechnology risk perceptions and communication: Emerging technologies, emerging challenges. Risk Anal. 2011, 31, 1694–1700. [Google Scholar] [CrossRef] [PubMed]
- Ricci, M.; Bellaby, P.; Flynn, R. What do we know about public perceptions and acceptance of hydrogen? A critical review and new case study evidence. Int. J. Hydrogen Energy 2008, 33, 5868–5880. [Google Scholar] [CrossRef]
- Maack, M.H.; Skulason, J.B. Implementing the hydrogen economy. J. Clean. Prod. 2006, 14, 52–64. [Google Scholar] [CrossRef]
- Dowler, E.; Green, J.M.; Bauer, M.W.; Gasperoni, G. Assessing public perception: Issues and methods. In Health Hazard and Public Debate: Lessons for Risk Communication from BSE/CJD Saga; World Health Organization: Geneva, Switzerland, 2006; pp. 40–60. [Google Scholar]
- Naderifar, M.; Goli, H.; Ghaljaie, F. Snowball Sampling: A Purposeful Method of Sampling in Qualitative Research. Strides Dev. Med. Educ. 2017, 14, e67670. [Google Scholar] [CrossRef] [Green Version]
- Evans, M. IBM SPSS: Intermediate. Comparing Groups. 2020. Available online: https://www.ibm.com/products/spss-statistics (accessed on 15 September 2021).
- Centre for Climate Change and Social Transformations (CAST). Transport and Mobility. 2014. Available online: https://cast.ac.uk/transport-and-mobility/ (accessed on 5 November 2020).
- Marx, A. Overpopulation’s Effects on Climate Change and Global Warming—MagellanTV. 2020. Available online: https://www.magellantv.com/articles/overpopulation-in-the-era-of-climate-change (accessed on 9 September 2020).
- Alberro, H. Why we should be wary of blaming ‘overpopulation’ for the climate crisis. Conversation 2020. Available online: https://theconversation.com/why-we-should-be-wary-of-blaming-overpopulation-for-the-climate-crisis-130709 (accessed on 4 September 2021).
- Kartha, S.; Kemp-Benedict, E.; Ghosh, E.; Nazareth, A.; Gore, T. The Carbon Inequality Era. An Assessment of the Global Distribution of Consumption Emissions among Individuals from 1990 to 2015 and Beyond. 2020. Available online: https://policy-practice.oxfam.org/resources/the-carbon-inequality-era-an-assessment-of-the-global-distribution-of-consumpti-621049/ (accessed on 1 September 2020).
- Ravallion, M.; Heil, M.; Jalan, J. Carbon emissions and income inequality. Oxf. Econ. Pap. 2000, 52, 651–669. [Google Scholar] [CrossRef]
- Carrington, D. Want to fight climate change? Have fewer children | Environment | The Guardian. The Guardian. 2017. Available online: https://www.theguardian.com/environment/2017/jul/12/want-to-fight-climate-change-have-fewer-children (accessed on 1 September 2020).
- OECD. Trustlab-OECD. Statistics and Data Directorate. 2017. Available online: https://www.oecd.org/sdd/trustlab.htm (accessed on 6 November 2020).
- Wisniewski, G. Losing Faith: The UK’s Faltering Trust in Tech | Edelman. Edelman. 2020. Available online: https://www.edelman.co.uk/research/losing-faith-uks-faltering-trust-tech (accessed on 30 October 2020).
- Fernandez, R. Mexican president orders fraud complaints against green power firms. UK Reuters. Available online: https://mobile.reuters.com/article/amp/ca/idUSKBN2413BV (accessed on 30 June 2020).
- Wall, R.; Devine-Wright, P.; Mill, G.A. Comparing and Combining Theories to Explain Proenvironmental Intentions the Case of Commuting-Mode Choice. Environ. Behav. 2007, 39, 731–753. [Google Scholar] [CrossRef]
- BEIS. BEIS Public Attitudes Tracker (March 2020, Wave 33, UK); 2020. Available online: https://www.gov.uk/government/statistics/beis-public-attitudes-tracker-wave-33 (accessed on 20 August 2021).
- Fiorino, D.J. Citizen Participation and Environmental Risk: A Survey of Institutional Mechanisms. Sci. Technol. Hum. Values 1990, 15, 226–243. [Google Scholar] [CrossRef]
- Bronfman, N.C.; Jiménez, R.B.; Arévalo, P.C.; Cifuentes, L.A. Understanding social acceptance of electricity generation sources. Energy Policy 2012, 46, 246–252. [Google Scholar] [CrossRef]
- Groves, C. Technological Futures and Non-Reciprocal Responsibility. Int. J. Humanit. Annu. Rev. 2006, 4, 57–62. [Google Scholar] [CrossRef]
| Publisher’s Note: MDPI stays neutral with regard to jurisdictional claims in published maps and institutional affiliations. |
© 2021 by the authors. Licensee MDPI, Basel, Switzerland. This article is an open access article distributed under the terms and conditions of the Creative Commons Attribution (CC BY) license (https://creativecommons.org/licenses/by/4.0/).


