Abstract
The operating costs of breaking coal particles into fine powder, to achieve optimum combustion for the boilers in a power plant, are made up of power input to carry on an energy intensive comminution mechanism and to overcome friction losses within pulverising machines. The operating costs also include the cost of the replacement of the processing system’s components due to wear. This study presents the development and application of an attrition test machine that enables an investigation of the factors that influence pulverizing efficiency. The attrition tester simulates grinding conditions in real vertical spindle mills. In this kind of mill, as with the tester, the size reduction process results from a shearing action during the redistribution of the coal particles. The redistribution and attrition within the coal bed are forced by movement of the rollers (or by a disc rotation, in the case of the tester). The testing method was oriented toward mechanical properties, i.e., internal friction shear strength, abrasiveness and grindability. This method enables facilitated testing procedures and a more exact simulation of grinding in vertical spindle coal mills. Ball-race mills and Loesche roller mills were used.
1. Introduction
The crushing and grinding of materials is an important component of many technological processes in the mining, energy and pharmaceutical industries, hence the development of new and more efficient and accurate methods of testing these processes is still required. Today’s technologies used in coal grinding are changing dynamically, devices built in accordance with the idea of the industrial internet of things (IoT) are increasingly used for control, which increases the reliability, efficiency, and effectiveness of this process [1]. The study presented in this paper is limited to the specificity of coal grinding for the needs of its industrial combustion. The total cost of crushing raw coal to the size of dust required by state-of-the-art coal-fired boilers consists of the cost of energy required for the crushing process in dust mills [2,3], the cost of energy required to overcome internal resistance in grinding plants, and the cost of replacing plant components used as a result of the high abrasive aggressiveness of certain types of coal [4,5]. The amount of energy required to crush the coal depends on the grain size of the raw material and the required degree of grain grinding. The use of fine coal grains obtained for this purpose, for example from mine waste landfills or settling tanks, will reduce the costs of the grinding process. In this case, the ecological aspect is also important, resulting from the elimination of the negative effects of waste storage and limiting the negative impact on human health and the environment [6,7,8,9]. An extremely important element in terms of costs also seems to be the appropriate selection of a shredding machine—adapted to the physical properties of the material to be shredded, which can significantly reduce the investment costs, especially the operating costs (electricity costs) of the system [10,11]. Thus, the properties of coal that determine the first and the last of these cost components of the grinding process are important to designers of these machines. A perfect understanding of powder behaviour is very important for optimization processes. Due different mechanical and physical properties of a wide scale of particulate materials it is very hard to design appropriate technologies for both carbon and other materials [10,12,13,14,15,16]. The currently used methods for testing coal allow only for a separate determination of each coal property. There is no method that would integrate the crushing process with the abrasive wear process of the crushing elements for strictly determined conditions of the process, determined by the unit pressure, the relative speed and average temperature of the coal layer. Therefore, an attempt was made in this paper to create a static crushing process on a laboratory scale, including a total abrasive interaction between the coal layer and the crushing elements, as well as mutual attrition of coal particles leading to its crushing [17,18,19]. Despite the high technological importance of the crushing process, there is no satisfactory mathematical relationship describing the main values of the process, i.e., input energy versus the effect of the crushing process. There are descriptions of mechanical crushing hypotheses formulated by Rittinger, Kick and Bond [2]. However, it is difficult to create a mathematical relationship for the specific conditions of the crushing process and for a specific mineral, and in particular for coal. Coal is not consistent, but rather a mixture of combustible material. It contains products of different physical and chemical composition. Coal is an easily broken material (as fine coal particles may flow instead of shattering) for a random distribution of internal defects. The internal surface area of microcracks is several times greater than the external surface of crushed coal of the same mass [20]. During the grinding process, the existing pores create a new surface. Fractures propagate along the pores and cracks that appear between the phases.
It is difficult to verify the reduction of energy due to complex energy balance in the grinding process. Due to a conversion of energy, coal is broken as primary energy is absorbed for a generation of new surfaces, plastic and elastic deformation, vibration and noise [21,22]. Secondary energy dissipation processes cause plastic deformations. Heat is generated as the result of external friction.
Therefore, it should be taken into account that industrial grinding processes can require a cooling jet to control the temperature of the machinery [23,24]. Although this paper has slot impingement techniques as its focus on the slot impingement techniques, this is interesting because they analyze different turbulence models and thermal radiation models showing the strengths and the weakness for each of them. Moreover, it presents some physical methods to control temperature of the machinery.
Another difficulty in establishing energy-size reduction relationships arises in any attempt to define the new surface created in the pulverisation process. Testing of the grindability of coal was obstructed by the fact that the surface can only be practically determined by the use of screens. For coal of pulverized-fuel size, most of the grain size is smaller than the bottom limit of screening. Screen analyses give an estimation of the required grain numbers.
The relationship between laboratory tests and operation of real pulverisers is difficult. Apart from the coal grindability, the capacity of a pulveriser depends on the size of coal in the feed, by its water content, by the degree of the grinding component’s wear, by the fineness of grinding, etc. The coal crushing ability (the ease with which it may be ground to a size enough for use as pulverized fuel) is a physical property affected by parameters of the crushing system. The content and size of hard particles in coal has an impact on the size reduction and wear processes [4], as with quartz and pyrites, for example, which make it difficult to obtain the required size of pulverized coal. It should be kept in mind that environmental parameters (moisture and active gases) also have an impact on the breaking process [21]. The following functions represent the coal grindability and abrasiveness:
where G is the coal grindability within the specified system, M means the mechanical properties of the coal, is the coal porosity, q determines the hard particles mechanical and geometrical characteristics, ω is the moisture, T is the temperature, is the overall efficiency of the grinding system, A is the coal abrasiveness, B is the tribological properties of the system.
Grindability and abrasiveness of coal are not inherent but also depend on the grinding system. That is why numerical evaluations of these properties based on the laboratory test results may be burdened by error when applied to the real conditions [25].
2. Review of Test Methods for Grindability and Abrasion Determination in Comminution Processes
2.1. Mechanism of Grindability and Abrasion in Comminution Processes
Tensile or shear action is almost always effective in breaking. The compressive and shear forces acting on grains within the majority of mills dominate. Inefficiency of grinding processes is caused by an action of compressive force [19].
The crushing mills can be classified according to different criteria, but the classification according to purpose, and principal breaking action, is the most common [2]. The most important criterion to compare comminution processes includes interactions among mineral particles and grinding components, so the classification given bellow should be taken into account (Figure 1):
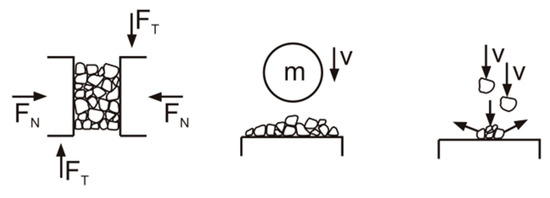
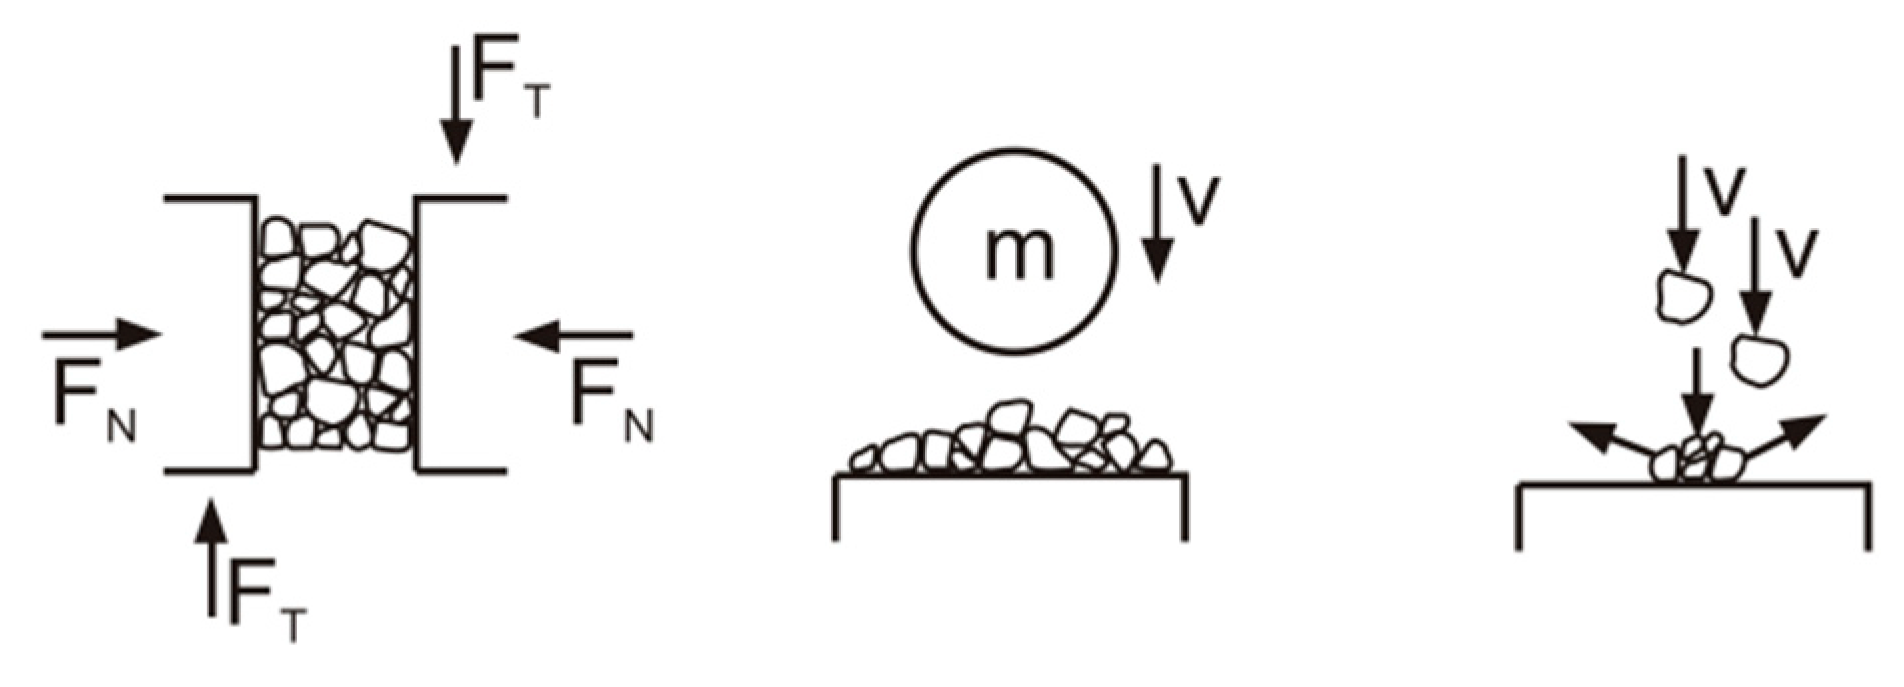
Figure 1.
Three types of interactions between mineral particles and grinding components, Fn—normal force, Ft—tangential force, m—mass, v—speed.
- (1)
- Static three-body interaction in static stressing-nipping machines, e.g., ball-race mills, Loesche roller mills [26].
- (2)
- Low speed three-body interaction by inertial forces in the presence of grinding media, produced by gravity-tumbling machines, e.g., ball and rod mills.
- (3)
- High speed direct impact interaction by inertial forces produced by mechanical impacting machines, e.g., hammer and beater mills [2].
In all three classes of equipment of different mechanics, the tribological conditions are represented by the pressure distribution, peak pressure, gradient of sliding speed, impact speed, temperature inside the grinding zone, and many other factors.
For modelling the reliability of a coal grinding system, it is required to keep the abrasion and grinding parameters similar in both the laboratory and the industrial conditions.
2.2. Test Methods for Grindability and Abrasion Testing
A review of test methods [27,28,29] shows (Figure 2) that there are several different ones which measure wear rate during the grinding process. These methods include the jaw crusher gouging wear tester, the British Coal Utilisation Research Association -roll (BCURA-roll) mill—high stress wear tester, the dry-sand rubber wheel low stress scratching abrasion tester, the Yancey, Geer and Price (YGP) abrasion tester, the hammer impact mill, and the Bond mill. There are methods (Figure 2), based only on the size reduction process, including the drop-weight test machine, the roller test machine, and the Hardgrove mill. Using the attrition test machine, presented in Figure 2, is the only integrated testing method that allows for simulation of coal behaviour during grinding and abrasion interaction inside the nipping mills, e.g., ball-race mills or vertical spindle mills.
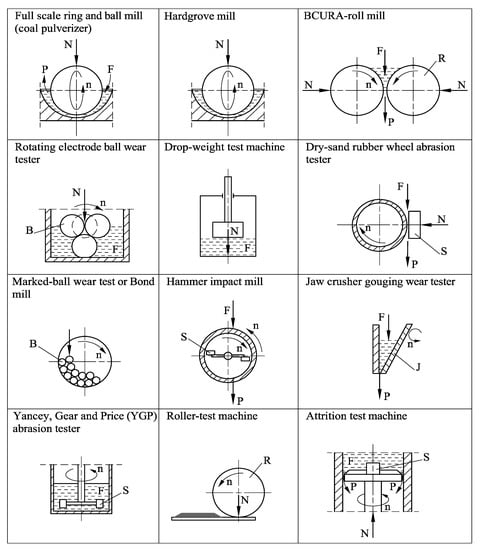
Figure 2.
Test methods for grindability and abrasion testing: Full scale ring and ball mill, Hardgrove mill [30,31], BCURA-roll mill, Rotating electrode ball wear tester [32], Drop-weight test machine [28], Dry-sand rubber wheel abrasion tester [33], Marked-ball wear test or Bond mill [34], Hammer impact mill [35], Jaw crusher gouging wear tester [36], Yancey, Gear and Price (YGP) abrasion tester [37], Roller-test machine [29], Attrition test machine [21,35,38], where: N—normal load, F—feed, P—product, n—number of revolution per minute, R—roller, B—steel ball, S—specimen, J—rotating jaw.
3. Basic Mechanical Properties of Fine Coals
3.1. Shear Strength of Fine Coals
When the resistance to the shear strength of fine coals is exceeded, continuous shear displacement takes place between two parts of the fine materials. This strength is related to three factors:
- Sliding friction between adjacent grains;
- Rolling friction, as some of the grains will change position by rolling;
- The resistance to moving individual grains generally called the effect of interlocking action.
The internal resistance causes changes in the shear strength. Particle shape and grain size distribution have an impact of this resistance. Examples of shear test results in the case of fine coal are shown in Figure 3.
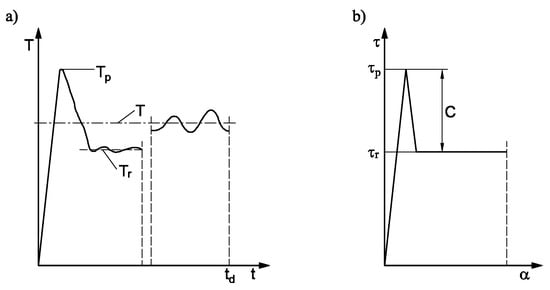
Figure 3.
Torque diagram (a) and fine cohesive material behaviour in a shear test (b). For non-cohesive materials component C→0 and τp = τr.
The shear stress diagram consists of peak (τp) and residual values (τr). After the peak torque (Tp) is reached at a small angular displacement, the shear strength decreases and the torque necessary to continue the shear displacement is reduced to the final residual torque (Tr). Shear displacement takes place across a shear zone. Stress σ acting at any point within the plane of shear action can be resolved into two components: σn and τ, as shown in Figure 4.
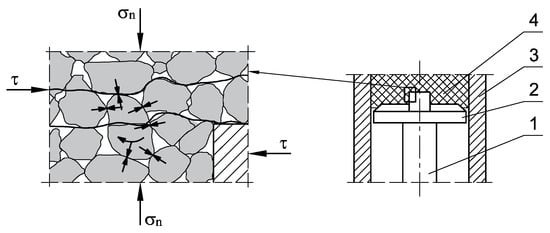
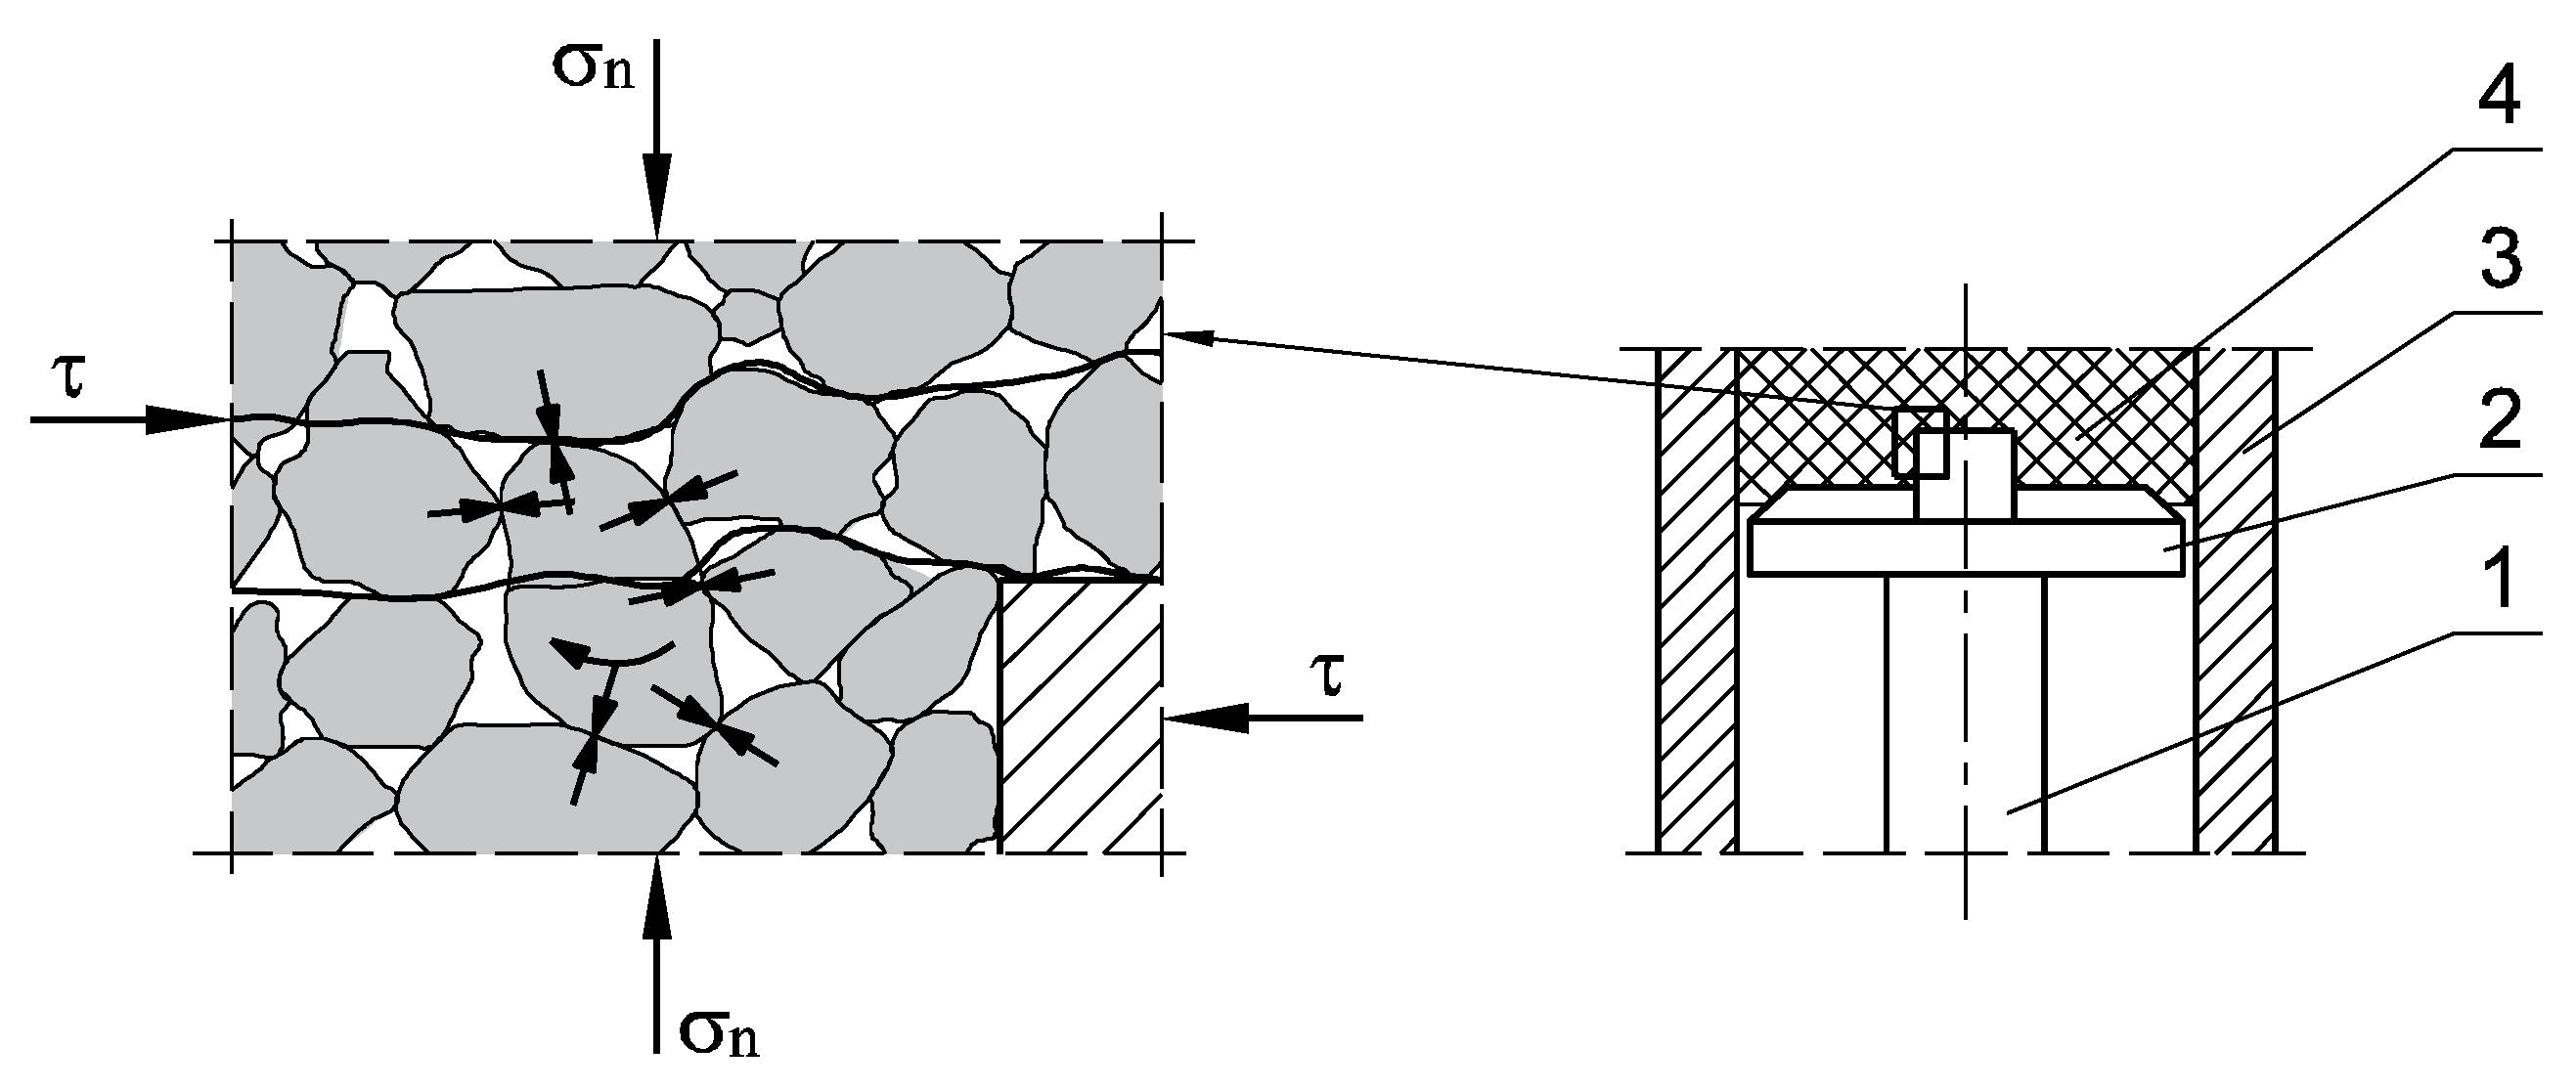
Figure 4.
Schematic diagram of coal grain arrangement inside the testing device (fine coal versus disc-bar assembly) and interpretation of interaction between the particulate coal and the bar within shear zone, where: 1—driving shaft, 2—disc-bar assembly, 3—cylindrical container, 4—particulate coal-abradant (feed).
Test results in the suggested device (Figure 5 and Figure 6, and Table 1) are given in Figure 7. The resistance can be calculated from the following Coulomb’s Equation:
and
where τp is a peak of shear strength (MPa), τr is the residual shear strength (MPa), Tp is the torque peak (Nm), C is the apparent cohesion (MPa), Tr is the residual torque (Nm), R is the radius of cylinder (m), Fn is the normal force (N), σn = Fn (πR2)−1 is the normal stress (MPa).
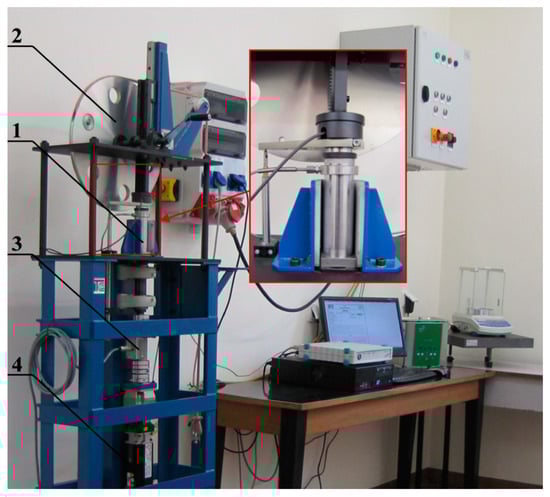
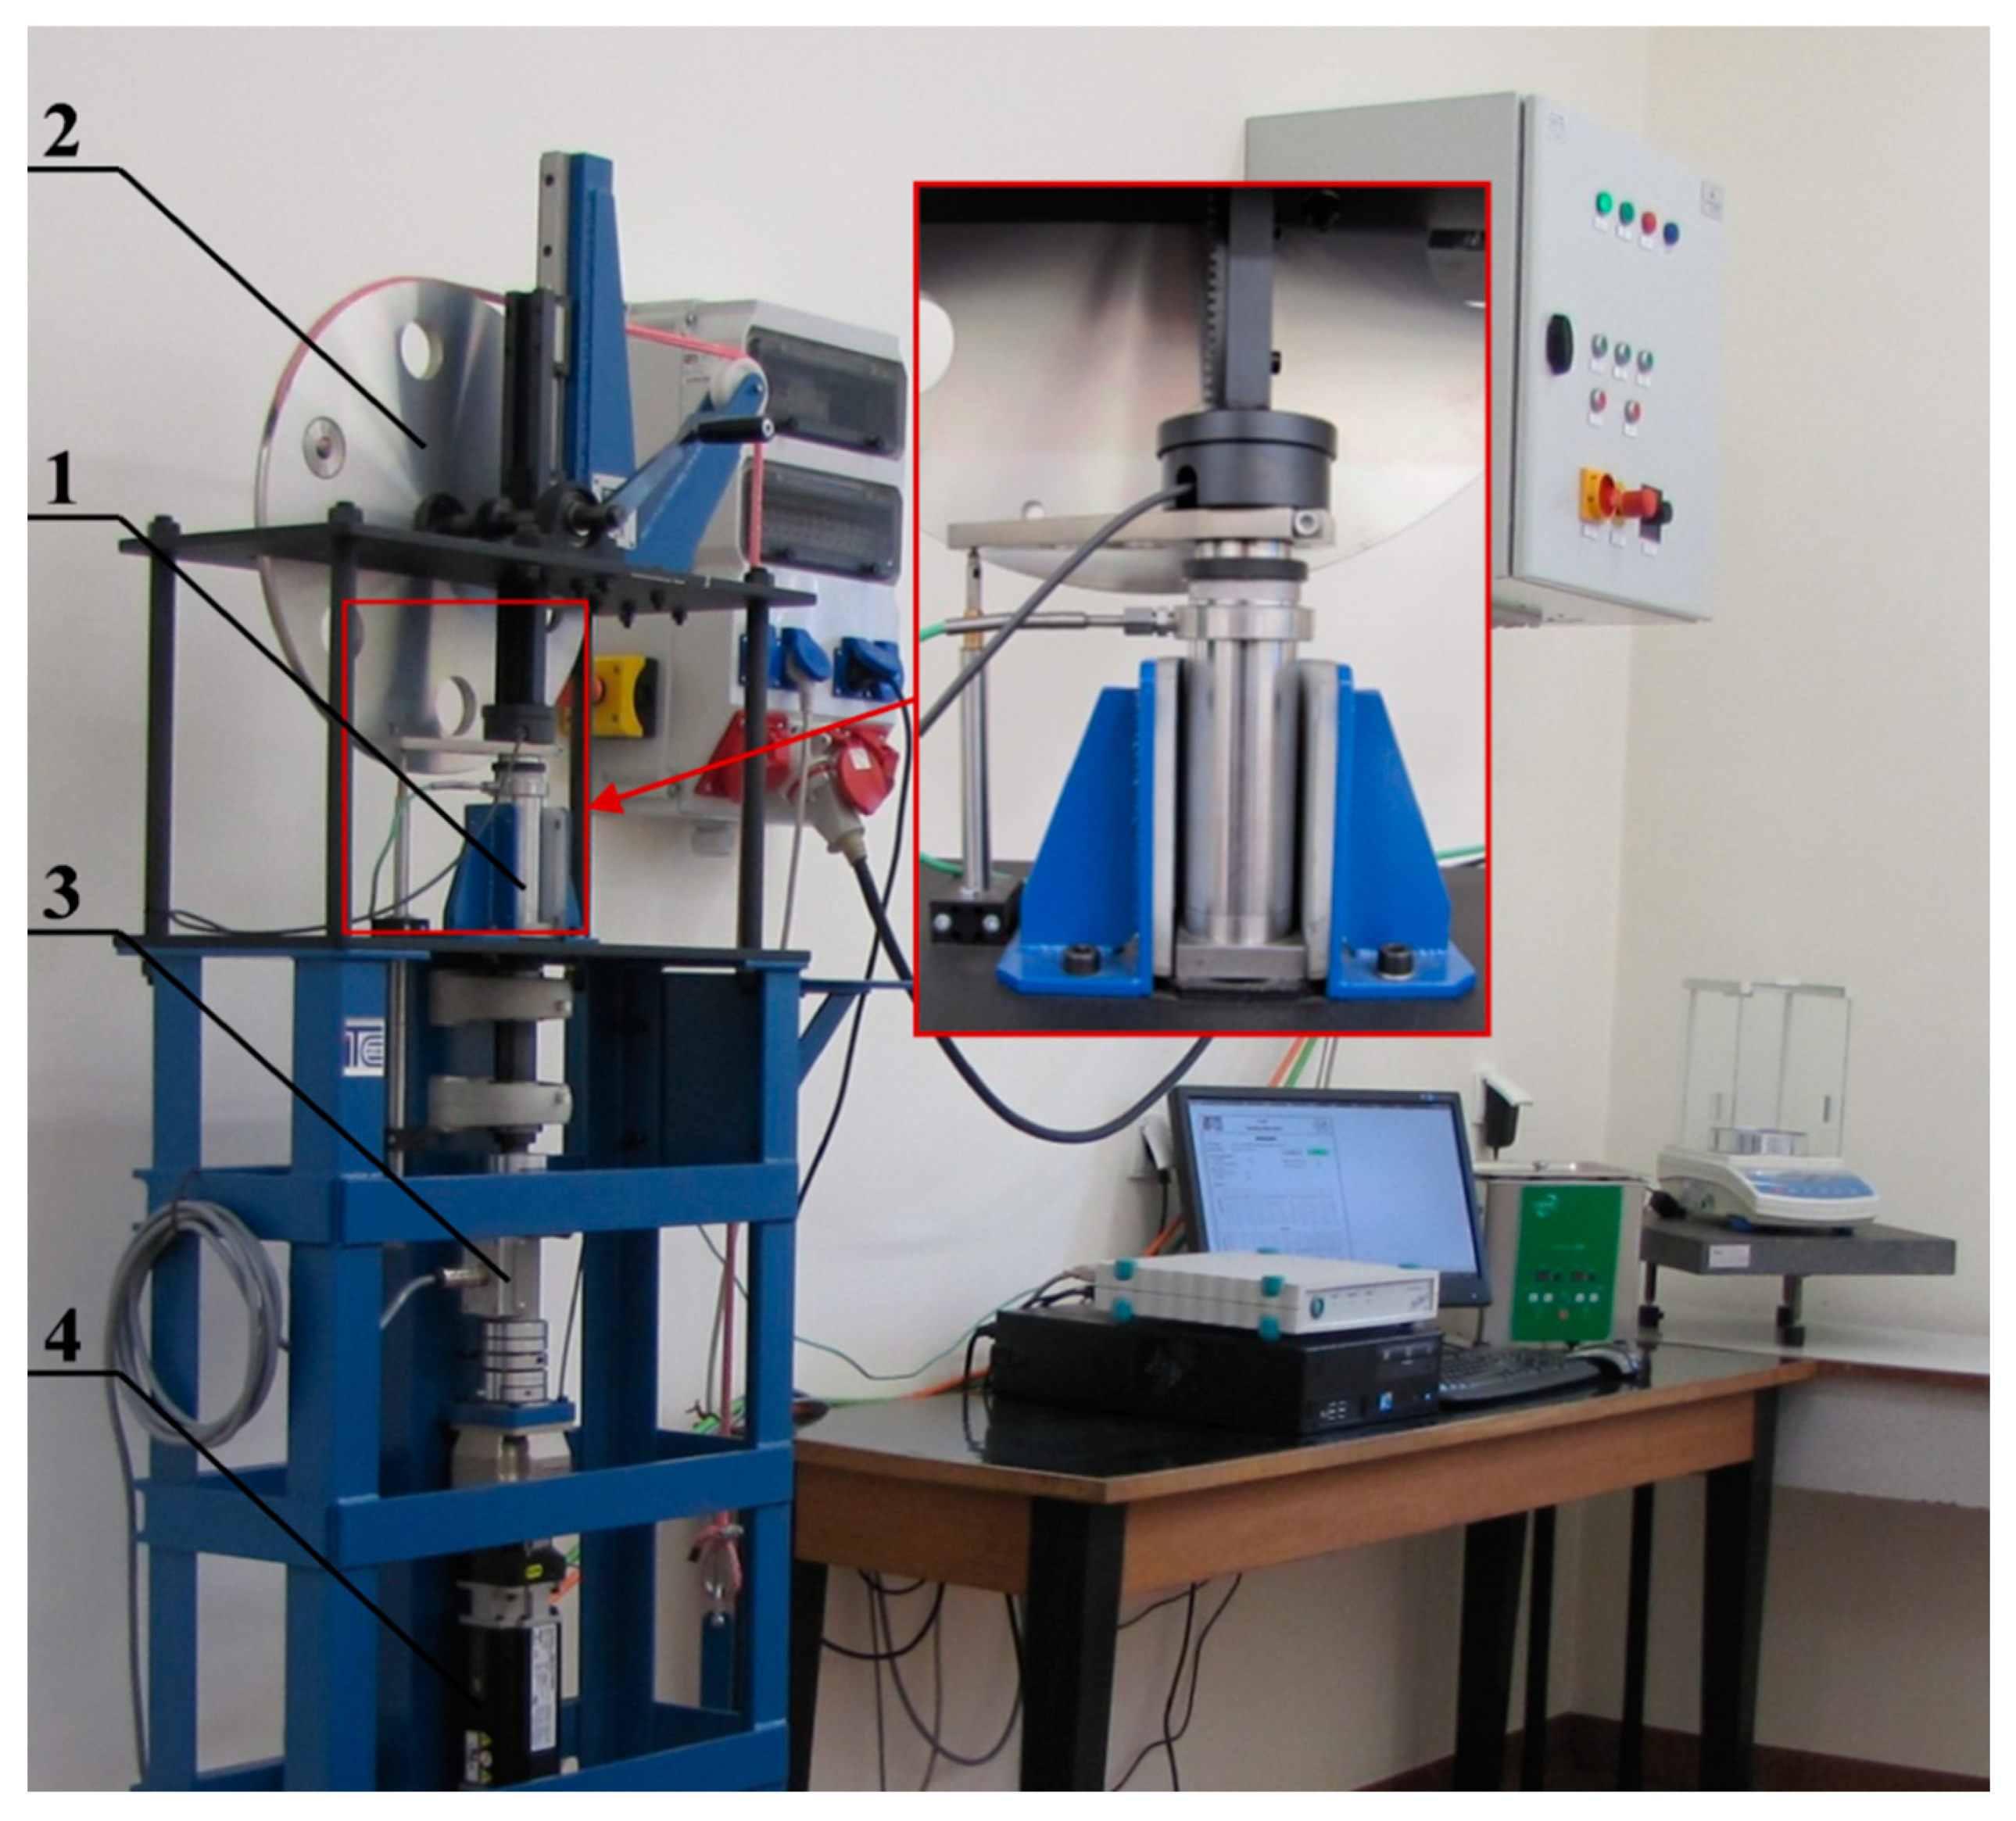
Figure 5.
The testing device designed and constructed by the Institute for Sustainable Technology in Radom with cylindrical attrition tribotester (1), loading pulley (2), load and torque indicators (3) and drive (4).
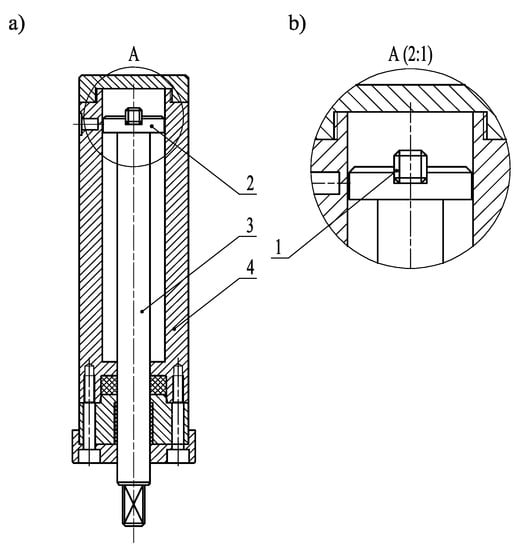
Figure 6.
Cylindrical attrition tribotester (a), and bar-specimen (b) with square cross-section, where: 1—specimen, 2—disc-specimen holder, 3—driving shaft, 4—cylindrical container.

Table 1.
Specification of the apparatus and experimental details.
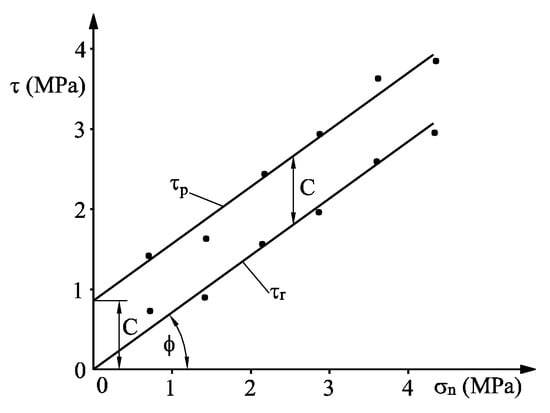
Figure 7.
Shear strength of fine coal in a function of normal stress, and Coulomb’s parameters ϕ and C (Equation (3)).
The shearing stress necessary for displacement is approximately reduced by apparent cohesion (Figure 3 and Equation (3)). The decrease in the degree of interlocking is the result of particles crushing and breaking as well as by particle redistribution. The internal resistance in shearing, i.e., the internal angle of friction depends on the grain hardness and environmental parameters, e.g., humidity
3.2. Grinding and Abrasion of Fine Coal
Grindability and abrasiveness of coal not only depends on its properties but also on the crushing system parameters. Thus, using the results of numerical evaluation of the size reduction process based on coal properties obtained in the laboratory may result in errors when applied to real industrial conditions.
To overcome these difficulties in the development of a mathematical model of the size reduction process, a practical engineering application maybe used to develop a simple form of the relationship. This is based on Rittinger’s hypothesis and can be stated as follows:
Work input = K (new specific surface)1−c,
Or
where W = EI·m−1 is the input of unit work per mass of coal reduced from its feed size to a the size in the final product, K is the constant, depending mainly on the parameters and efficiency of the coal crushing process, c is the constant, which depends on the discrepancies between the theoretical Rittinger model of breaking and size reduction of a real coal sample with weaknesses in internal structure. It is related to the probability that new surface originates from pre-existing pores, c varies depending on coal type and method of grinding, F is the feed size modulus—width of the square opening that will pass 80% of the feed, P is the product size modulus—width of the square opening that will pass 80% of the product.
Tests of the selected coals proved that an average regression coefficient 1−c is 0.5. To determine the relative reduction in coal resistance in the tested size range as well as the relative efficiencies of different machines and different processes, the work index, Wi, after Bond (Berkowitz 1979) was introduced. Wi is the calculated work input in J·g−1 applied in reducing the coal particles to the final size of 80% passing 75 μm. For any values of F and P, work input W is proportional to (1/P–1/F)0.5:
Hence:
When the work index, Wi, is known, the work input required to break coal particles from any feed size F to any product size P with the same efficiency may be calculated.
The shear process is accompanied by wear of the bar-specimen (Figure 4 and Figure 6). The grains of coal become ground to a greater or lesser degree than what is specified by the index of comminution (IC), which characterises the coal’s ability to be crushed. IC is expressed in mg of pulverized coal (fraction <75 μm particle size) per joule of energy input.
Relative displacement between the fine coal particles and the steel bar surface (Figure 4) causes a significant abrasion wear of the bar surface as the coal particles slide on the surface. They may also move against each other and may rotate while sliding on the surface. In industrial conditions, as well as in a laboratory testing device, high abrasion stress is observed. Under the high abrasion stress, coal particles or abradant particles are intensively crushed, increasing the abrasion process. Correlation between comminution and abrasion wear was given by Scieszka and Jadi [25].
The abrasion property of solids is characterized by the abrasion factor (AF) and the intensity of abrasion (IA). The intensity of abrasion is expressed in mg of metal lost within 1 s from m2 of the metal bar surface exposed to abrasion wear. Relative wear resistance (ε) is the ratio between the wear resistance of the tested material and the wear resistance of the reference material.
The above properties can be expressed as:
- IC = PC/EI—index of comminution (mg·J−1),
- AF = Δ W/PC—abrasion factor (mg· kg−1),
- IA = Δ W/S td—intensity of abrasion (mg·m−2·s−1),
- WR = (EI/Δ W)·10−6—wear resistance of bar material (MJ·g−1),
- ε = WR (specimen tested)/WR (reference material)—relative wear resistance,
where PC is the weight of coal pulverized fraction <75 μm (g), EI is the energy input (J), ΔW is the wear of metal bar (g), S is the surface area exposed to abrasion (m2), td is the duration of test (s).
The standard methods of testing the comminution and abrasive properties of coal were compared with the new method. The method given by Yancey, Geer and Price (Figure 2) and described more precisely in British Standard Method [37] was used for determination of the Abrasion Index (AI) of coal.
The standard Hardgrove machine method [30] was used for the determination of the Hardgrove Grindability Index (HGI). The testing procedure including the preparation of test sample was followed according to the Standard Test Method Specification.
For determination of the Abrasion Potential (AP), the Hardgrove machine modified by the ESCOM Research and Development Department was applied. Eight radioactive balls were used and the radioactivity of worn particles after each test was counted. The procedure for AP determination is described in the literature [21,36].
4. Comparative Analysis of the Test Results of Ten Types of Coal
The comparison of different current methods and the suggested method for testing the coal grindability and abrasiveness was the objective of the testing. Ten types of coal, representing a wide range of Polish and South African coals, were tested to determine changes in the parameters of coal grinding. The test results are given in Table 2.
Table 2.
Basic mechanical properties of ten bituminous coals, where bar No. 1 is made of carbon steel (0.08% C—standard steel) and bar No. 2 is made of cast iron (2.7% C, 22% Cr and 2% Mo).
Table 2 presents the weight percentage of quartz and pyrite, the Hardgrove Grindability Index (HGI), the Abrasion Index (AI), the Abrasion Potential (AP), and all the results from the suggested new testing method.
The results from this method are given for two different materials of the bar. The standard material according to BS 1016: Part 19: 1980 [37] and the material which is currently used for rings in ball-and-race pulverisers (Cast iron 2.7% C, 22.0% Cr, 2.0% Mo) were used for the bars manufacture. The standard errors in the determination of the index of comminution (IC), the work index (Wi), and the abrasion factor (AF) were below 5% for the most coal samples. The results of the shear strength, apparent cohesion and final frictional angle measurements indicated considerable differences among the coal tested. It is expected that this difference will result in different torque requirements in the pulveriser. This is because of the clear relationship between the shear strength of coal, the rolling resistance of balls on the coal layer, and the torque requirement.
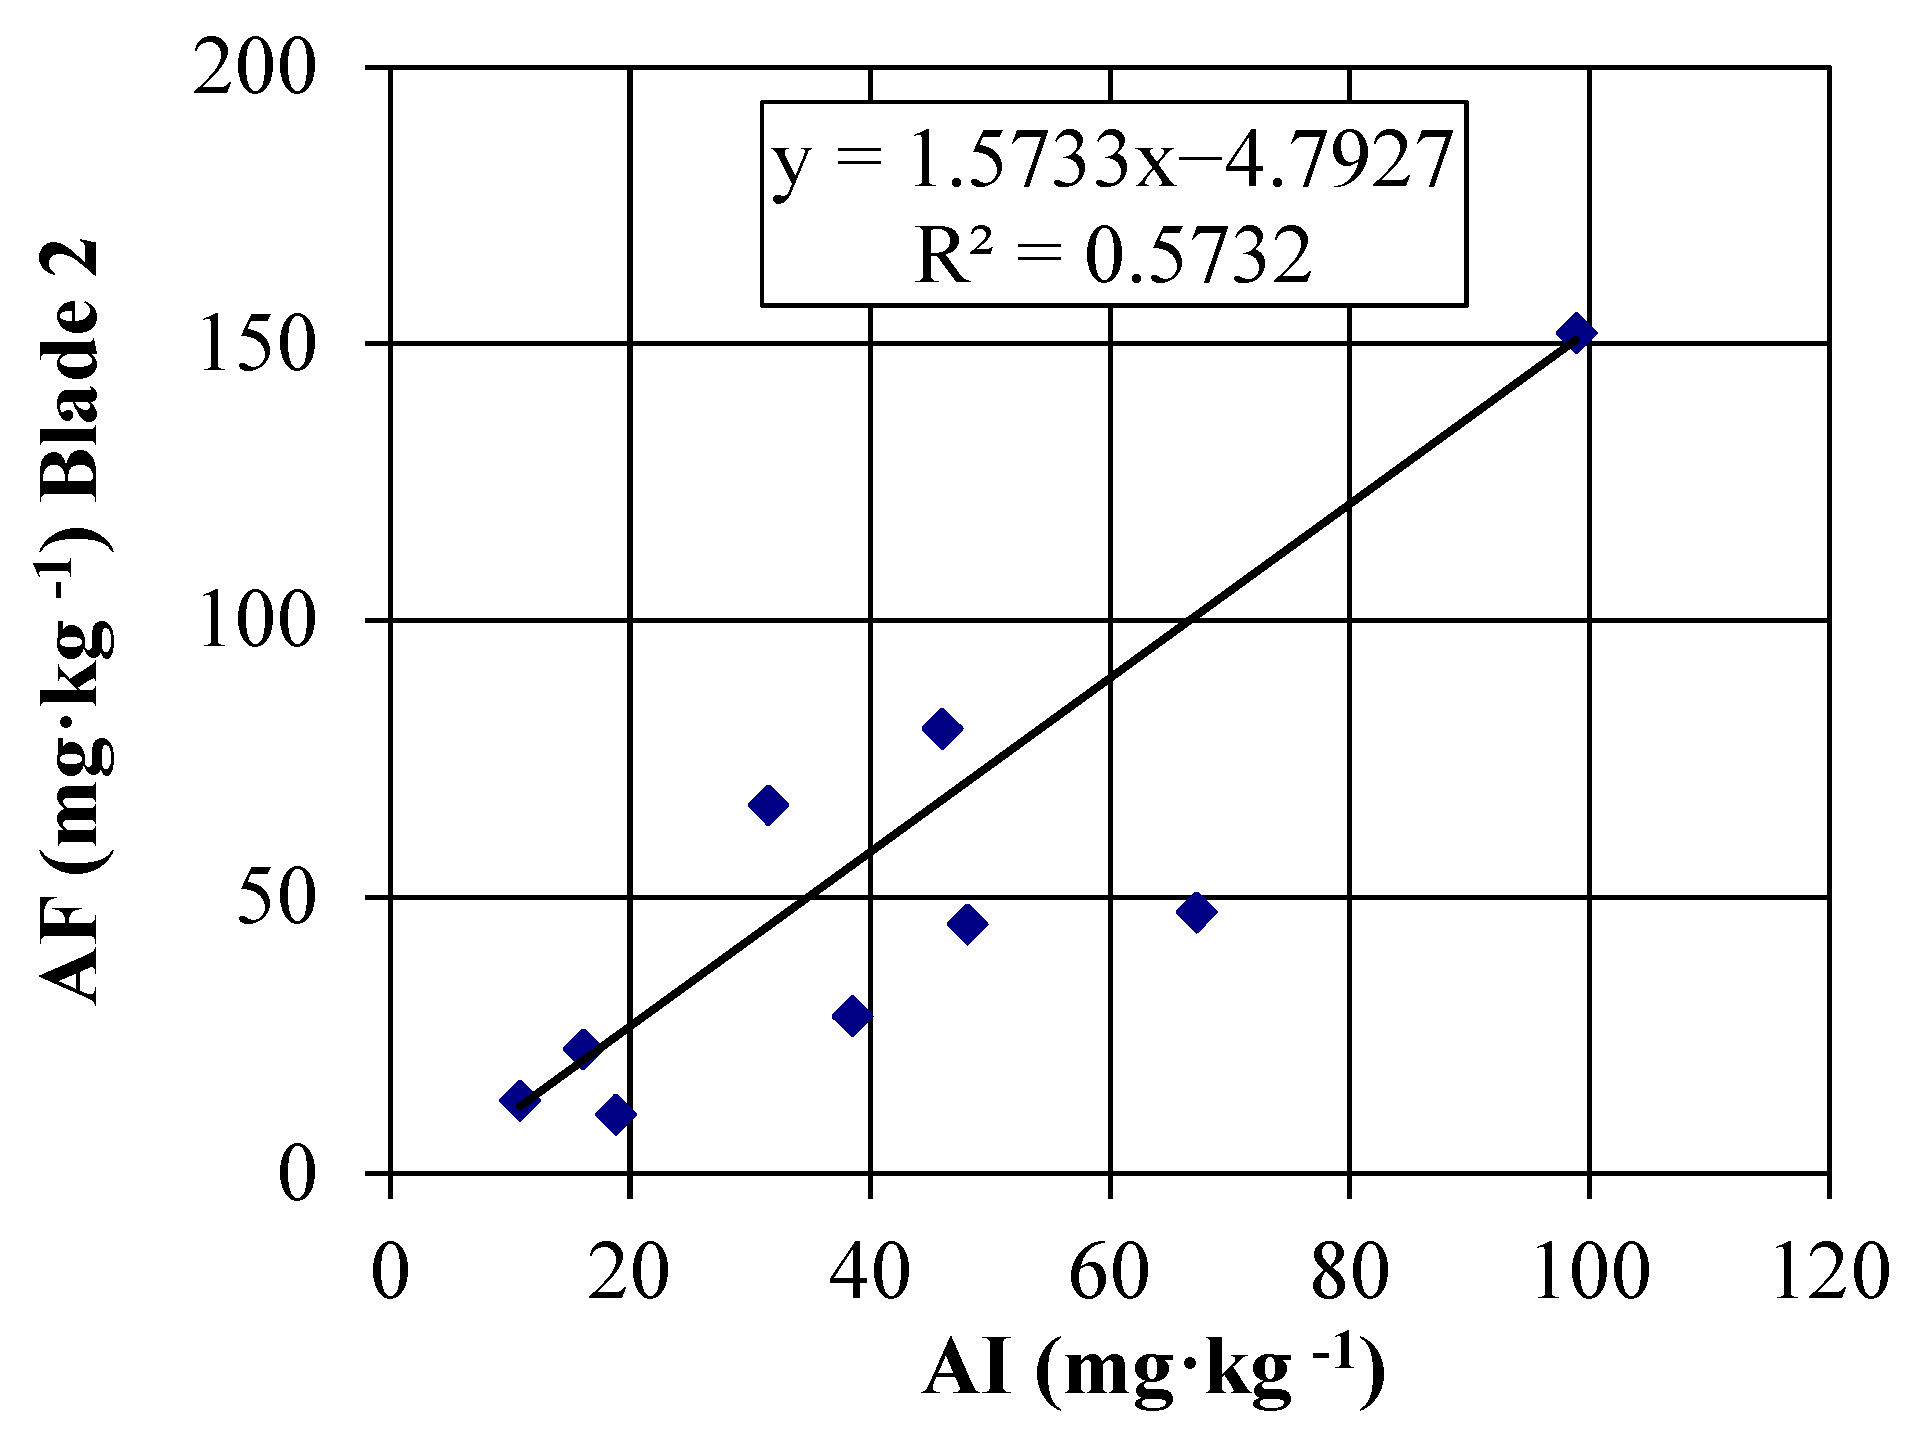
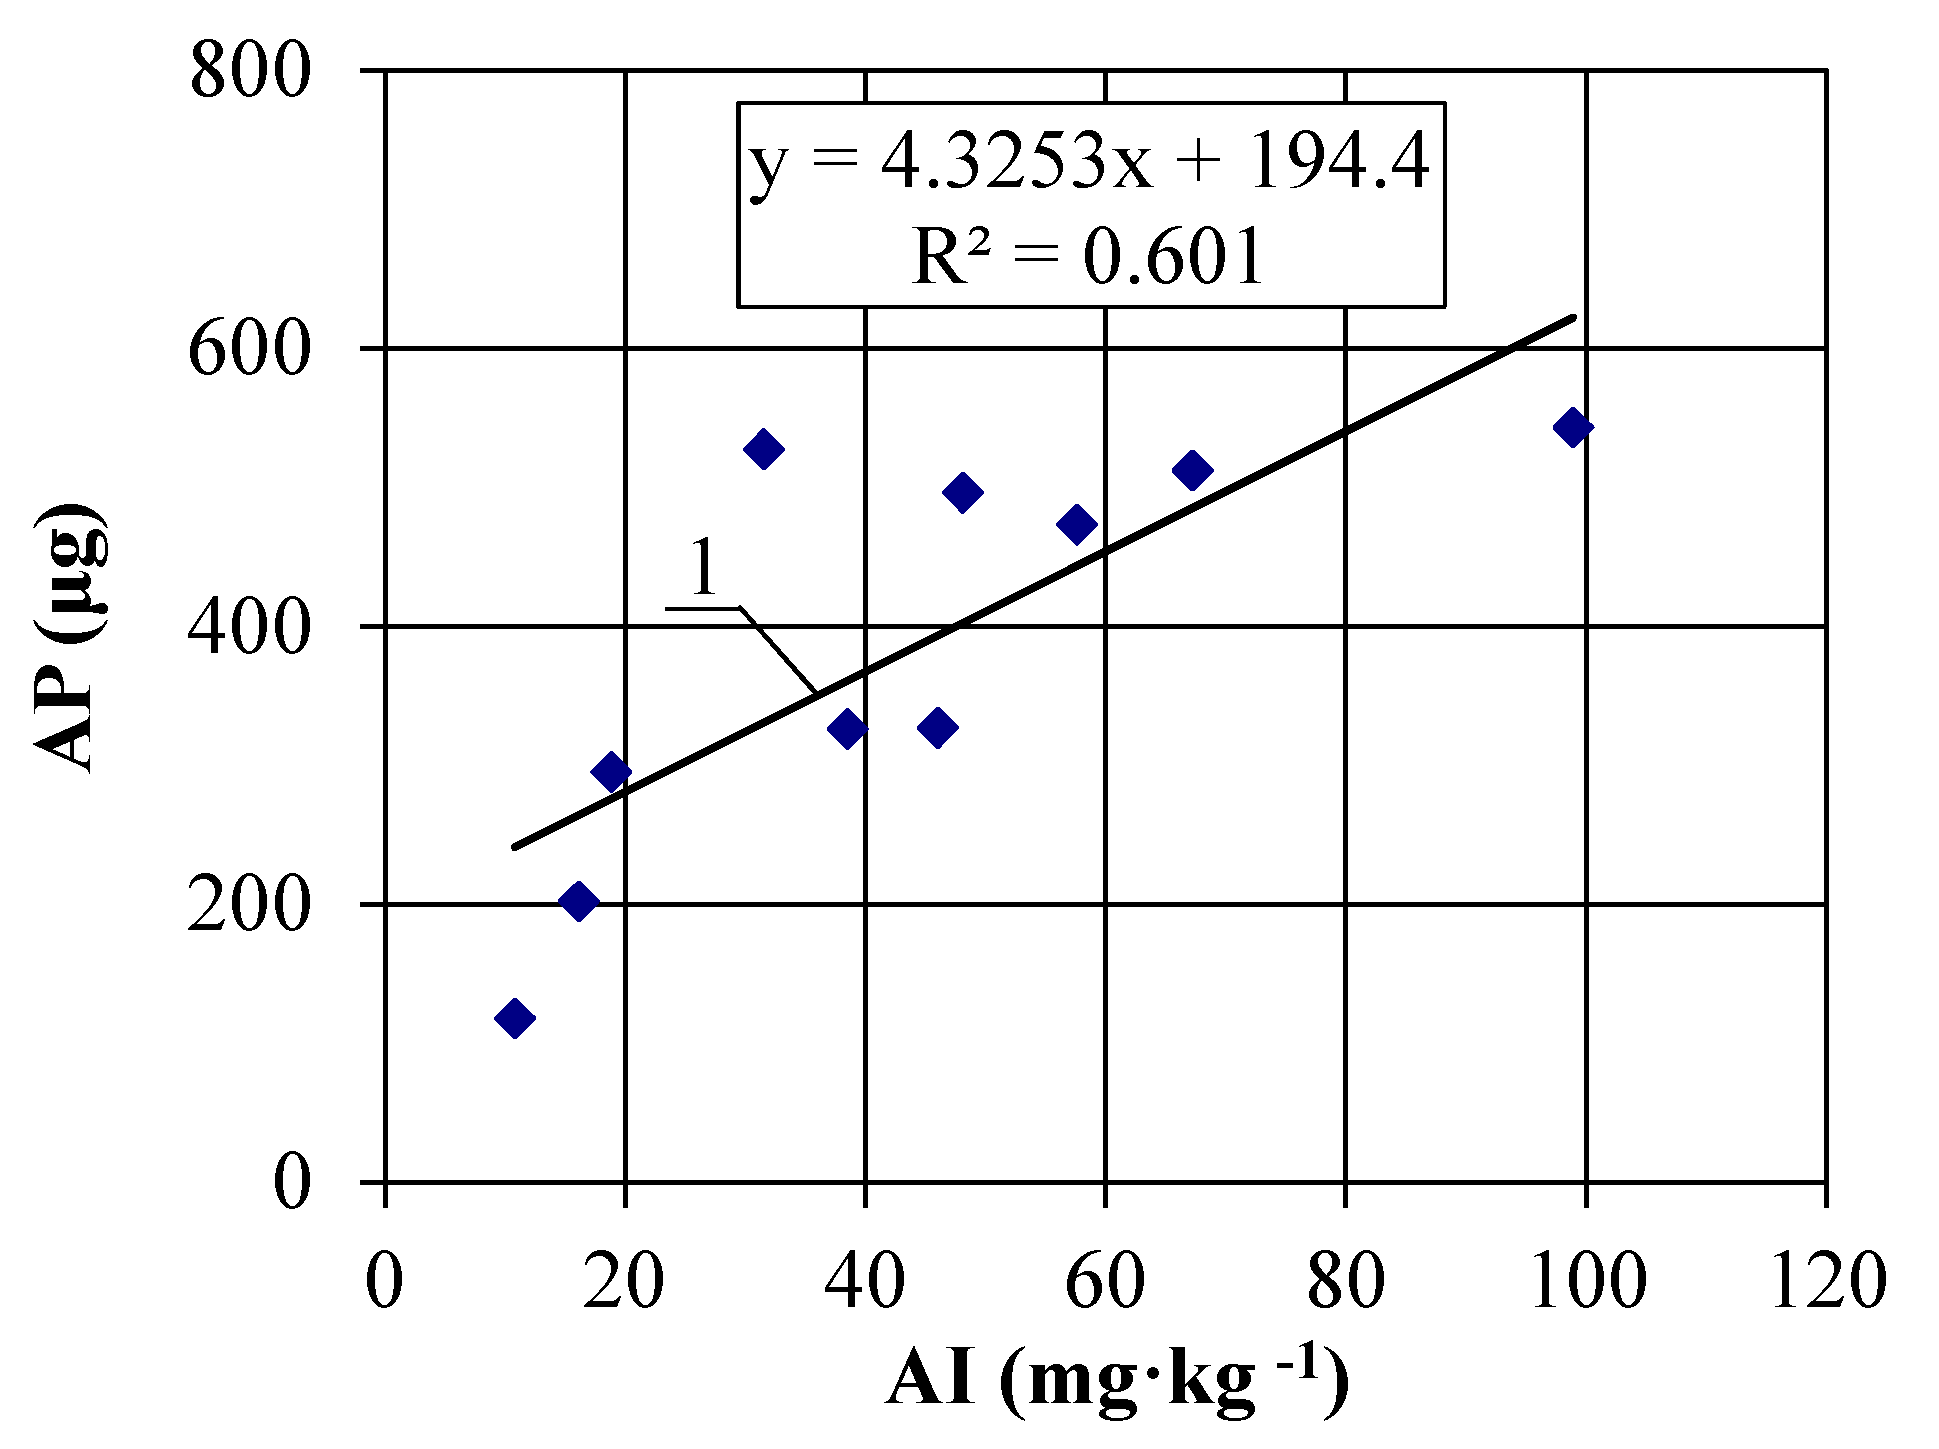
Correlations between the work index (Wi) and the Hardgrove grindability index (HGI) for the ten tested coals (Figure 8), and between the abrasion factor (AF) and abrasion index (AI) (Figure 9) were found. Figure 10, Figure 11 and Figure 12 present the correlations between various methods for testing the abrasiveness of the coal.
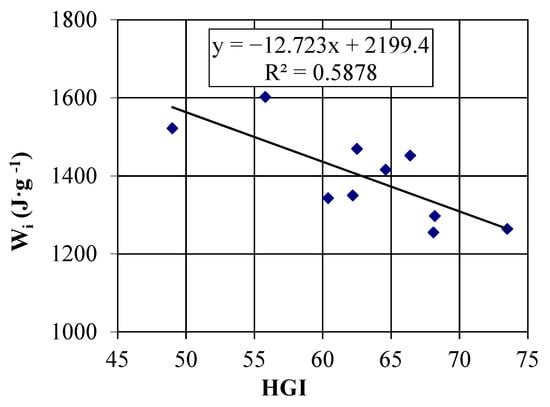
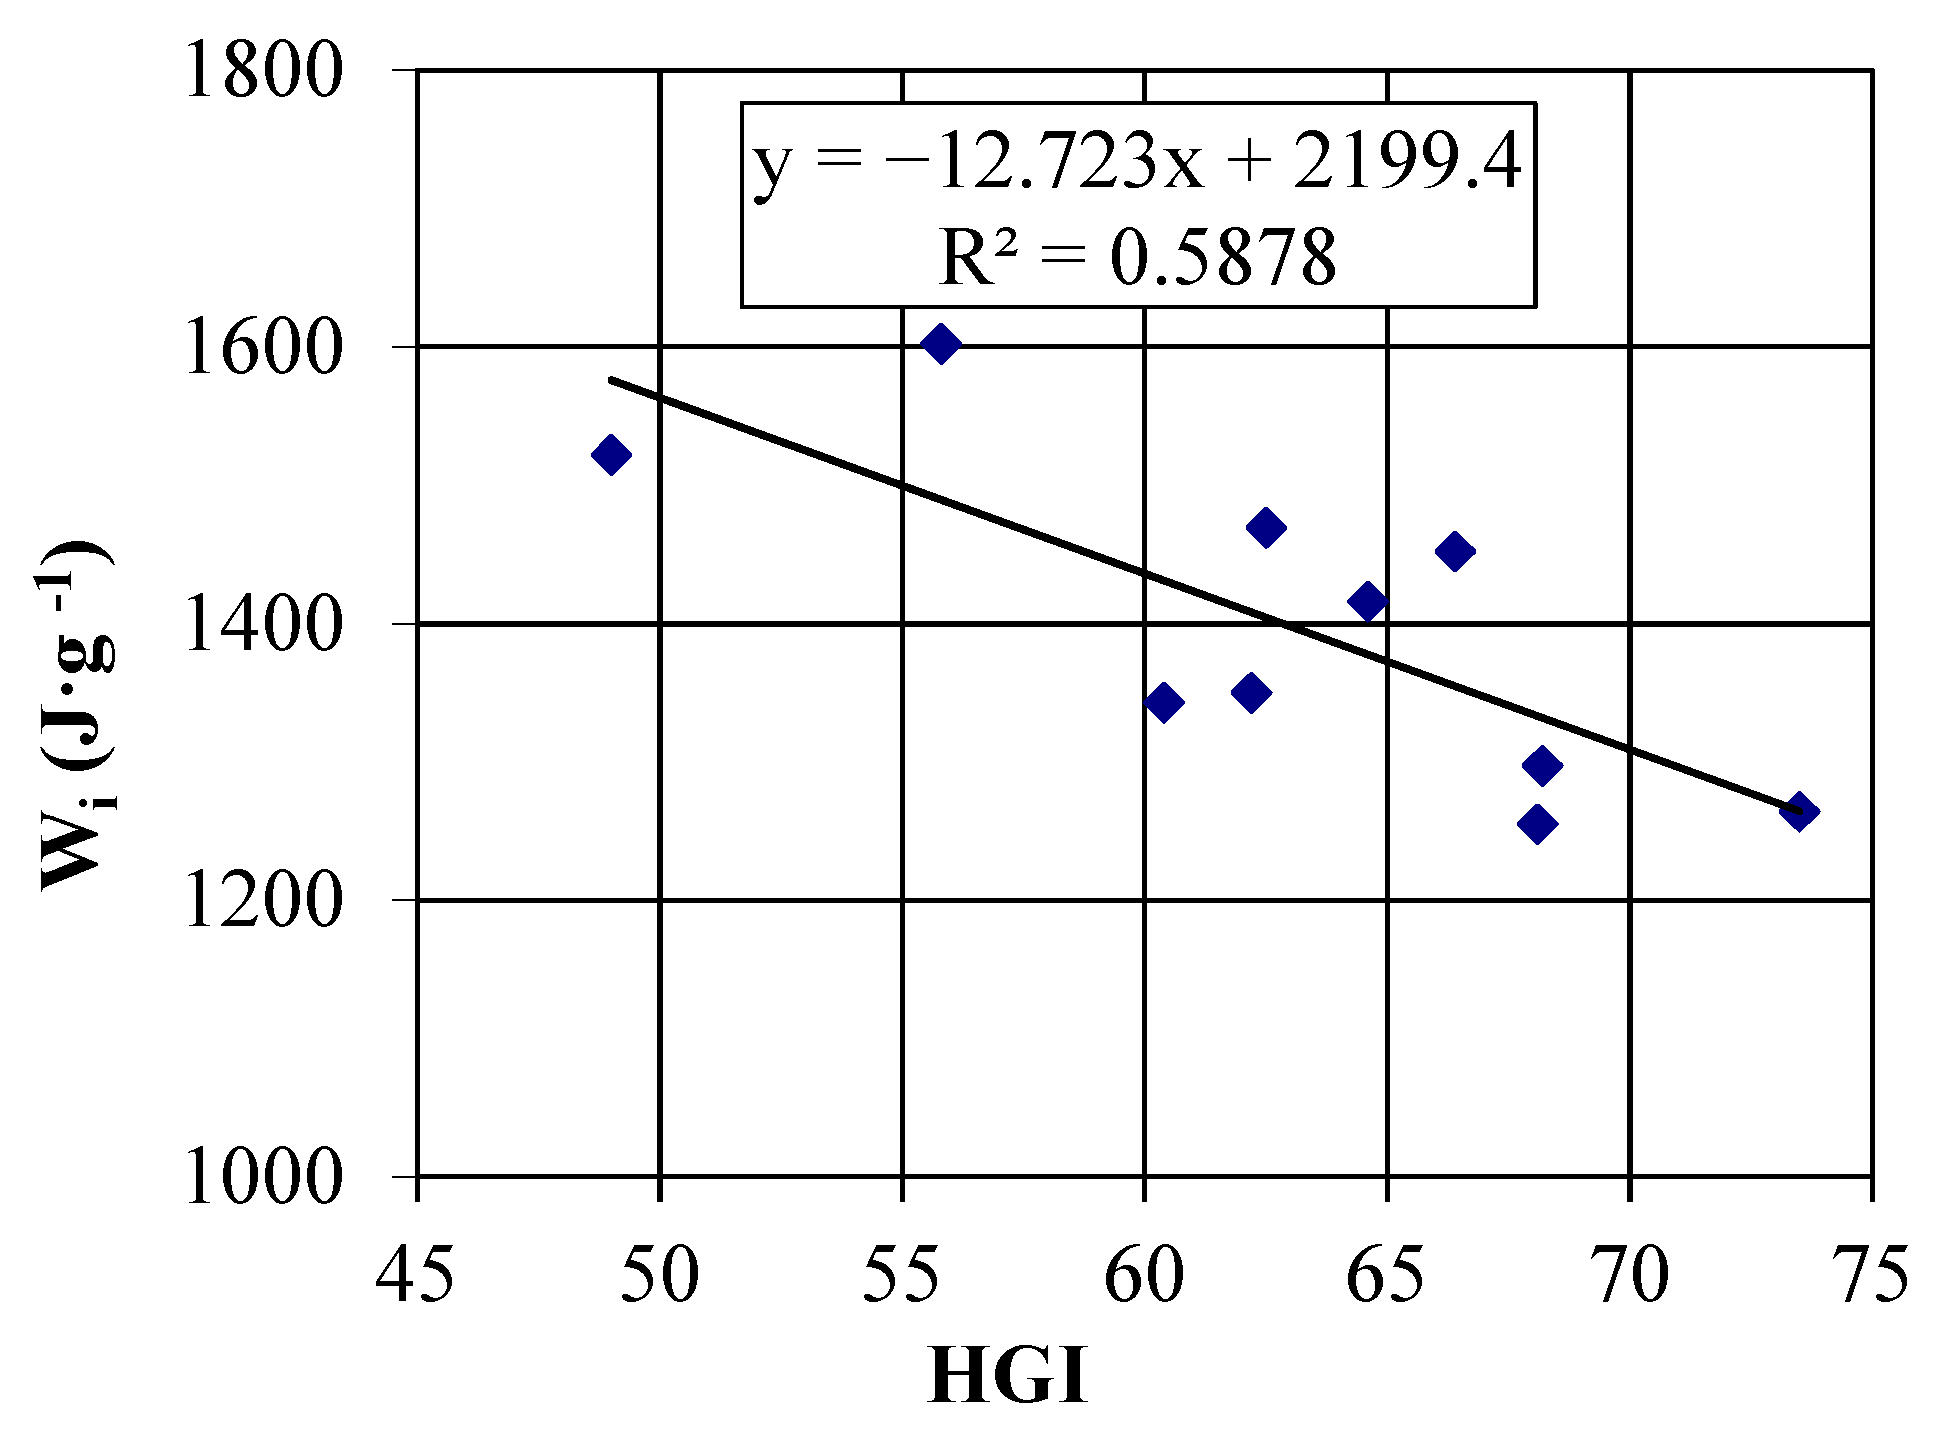
Figure 8.
Scatter diagram of the results showing the relationship between Work Index (Wi) and Hardgrove Grindability Index (HGI), where 1 is the regression line Wi upon HGI (R2 = 0.5878).
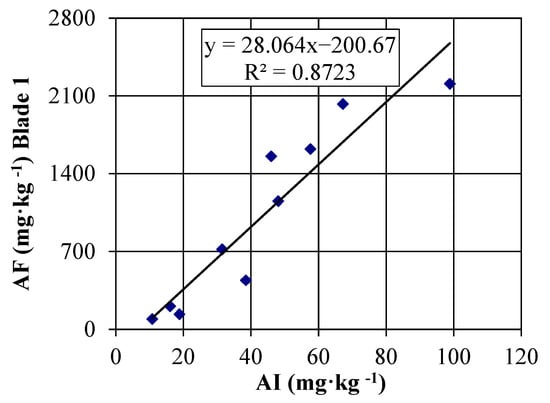
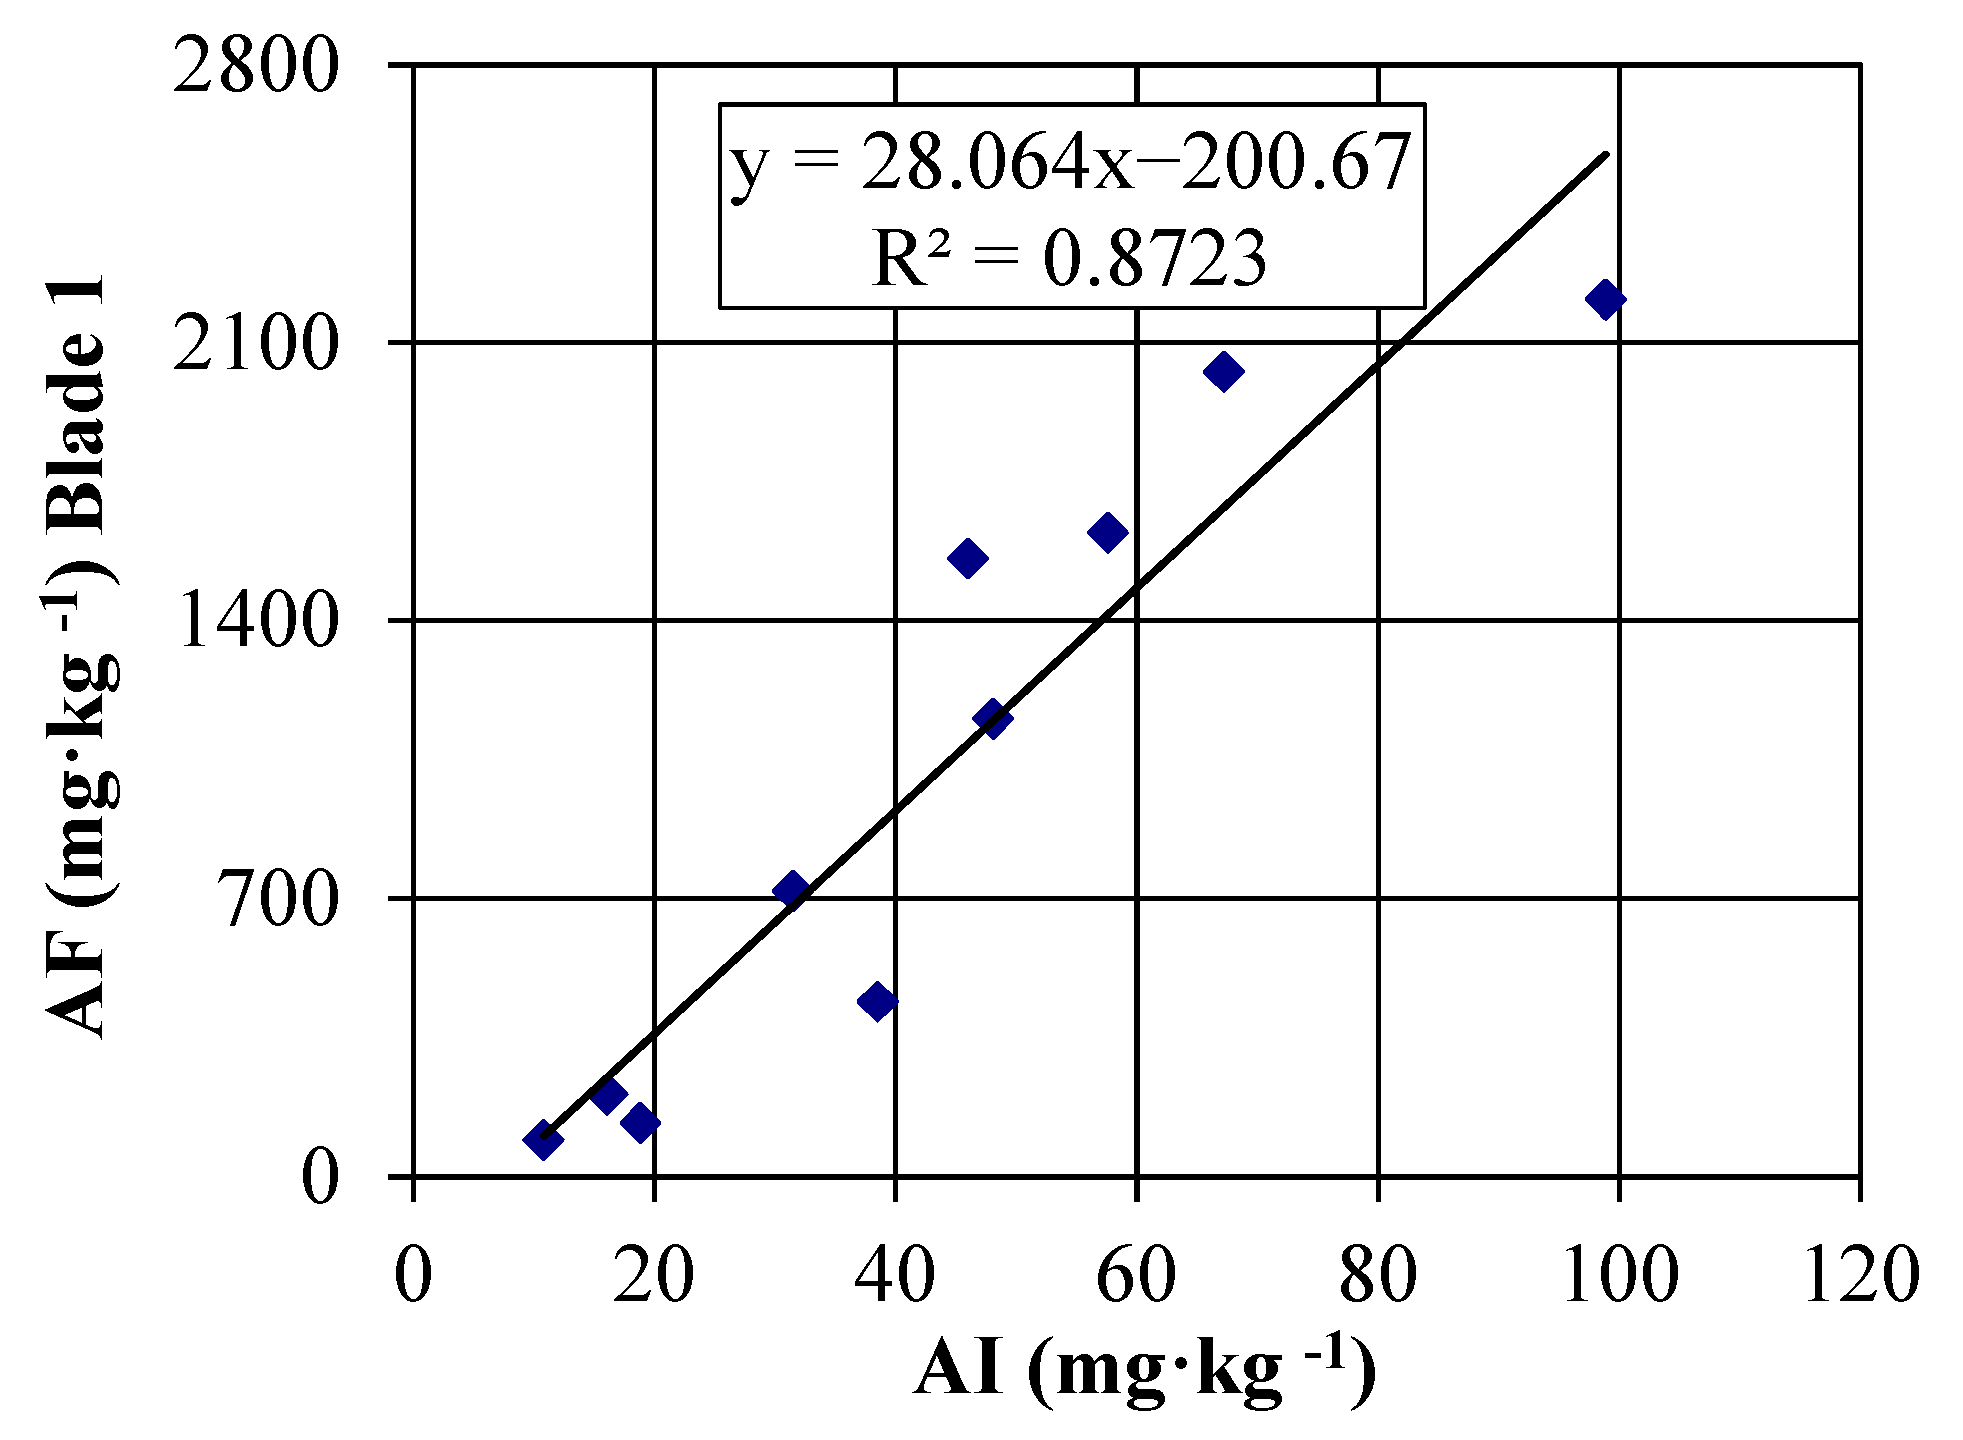
Figure 9.
Scatter diagram of results showing the relationship between Abrasion Factor (AF) and Abrasion Index (AI), where 1 is regression line AF upon AI (R2 = 0.8723).

Figure 10.
Scatter diagram of results showing the relationship between Abrasion Factor (AF) and Abrasion Index (AI), where 1 is regression line AF upon AI (R2 = 0.5732).
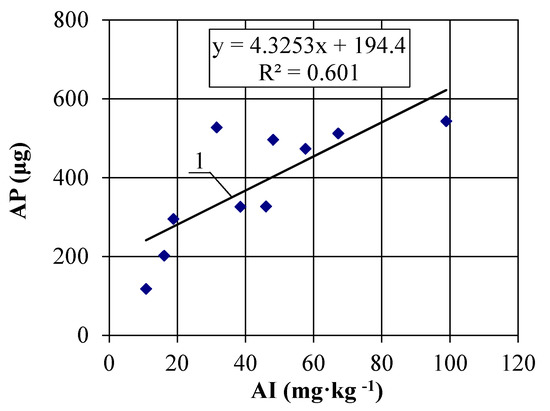
Figure 11.
Scatter diagram of results showing the relationship between Abrasion Potential (AP) and Abrasion Index (AI), where 1 is regression line AP upon AI (R2 = 0.601).
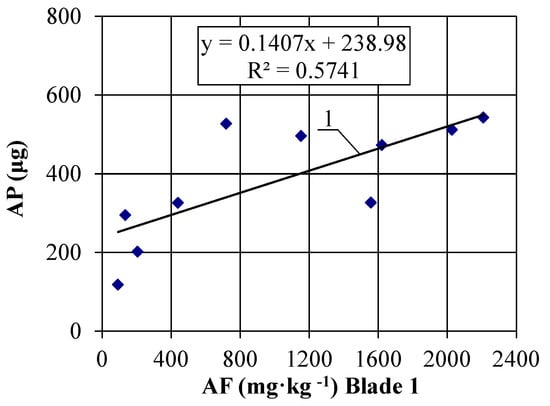
Figure 12.
Scatter diagram of the results showing the relationship between Abrasion Potential (AP) and Abrasion Factor (AF), where 1 is regression line AP upon AF (R2 = 0.5741).
The results indicate that the standard method can be replaced by the new one suggested by the authors. The suggested new method has several advantages compared to the standard method, such as easiness of testing, higher accuracy and better defined abrasion conditions. The standard abrasion test method does not recreate the conditions of the wear process in a ball-on-race type of coal mill. The relative sliding speed between the coal particles and the bar, as well as the stress conditions in the coal-bar contact layer, differ significantly from those found in industrial pulverisers. The wear conditions in the standard method [37] are erosive, not abrasive; loose coal particles act on the bar’s surface with a speed of about 15.4 m·s−1.
The new suggested method allows for much better recreation of wear conditions in a real mill. The method also allows for a fast and cheap determination of coal abrasiveness at any condition (viz pressure, sliding speed and temperature) and with different co-operating materials (viz material of metal bar and type of coal sample). The standard method requires a bigger coal sample i.e., 2000 g than the suggested method, where only about 20 g of coal sample is enough. The metal bar sample (Figure 4 and Figure 6) is smaller and easier to machine than four standard blades. This advantage of the new method is especially important when used to determine the wear resistance of various materials. The new method requires about three minutes for one test, which is less than it takes with the standard method.
The coal abrasiveness (AF—Abrasion Factor and IA—Intensity of Abrasion) tested in various material configurations (blade No. 1 and blade No. 2) showed relatively different results. The abrasive property of coal should be tested with blades made of the materials currently used for the mill balls and the races. Only the results of tests conducted in the precisely recreated operational and material conditions found in the industrial pulverisers can be directly used in calculations.
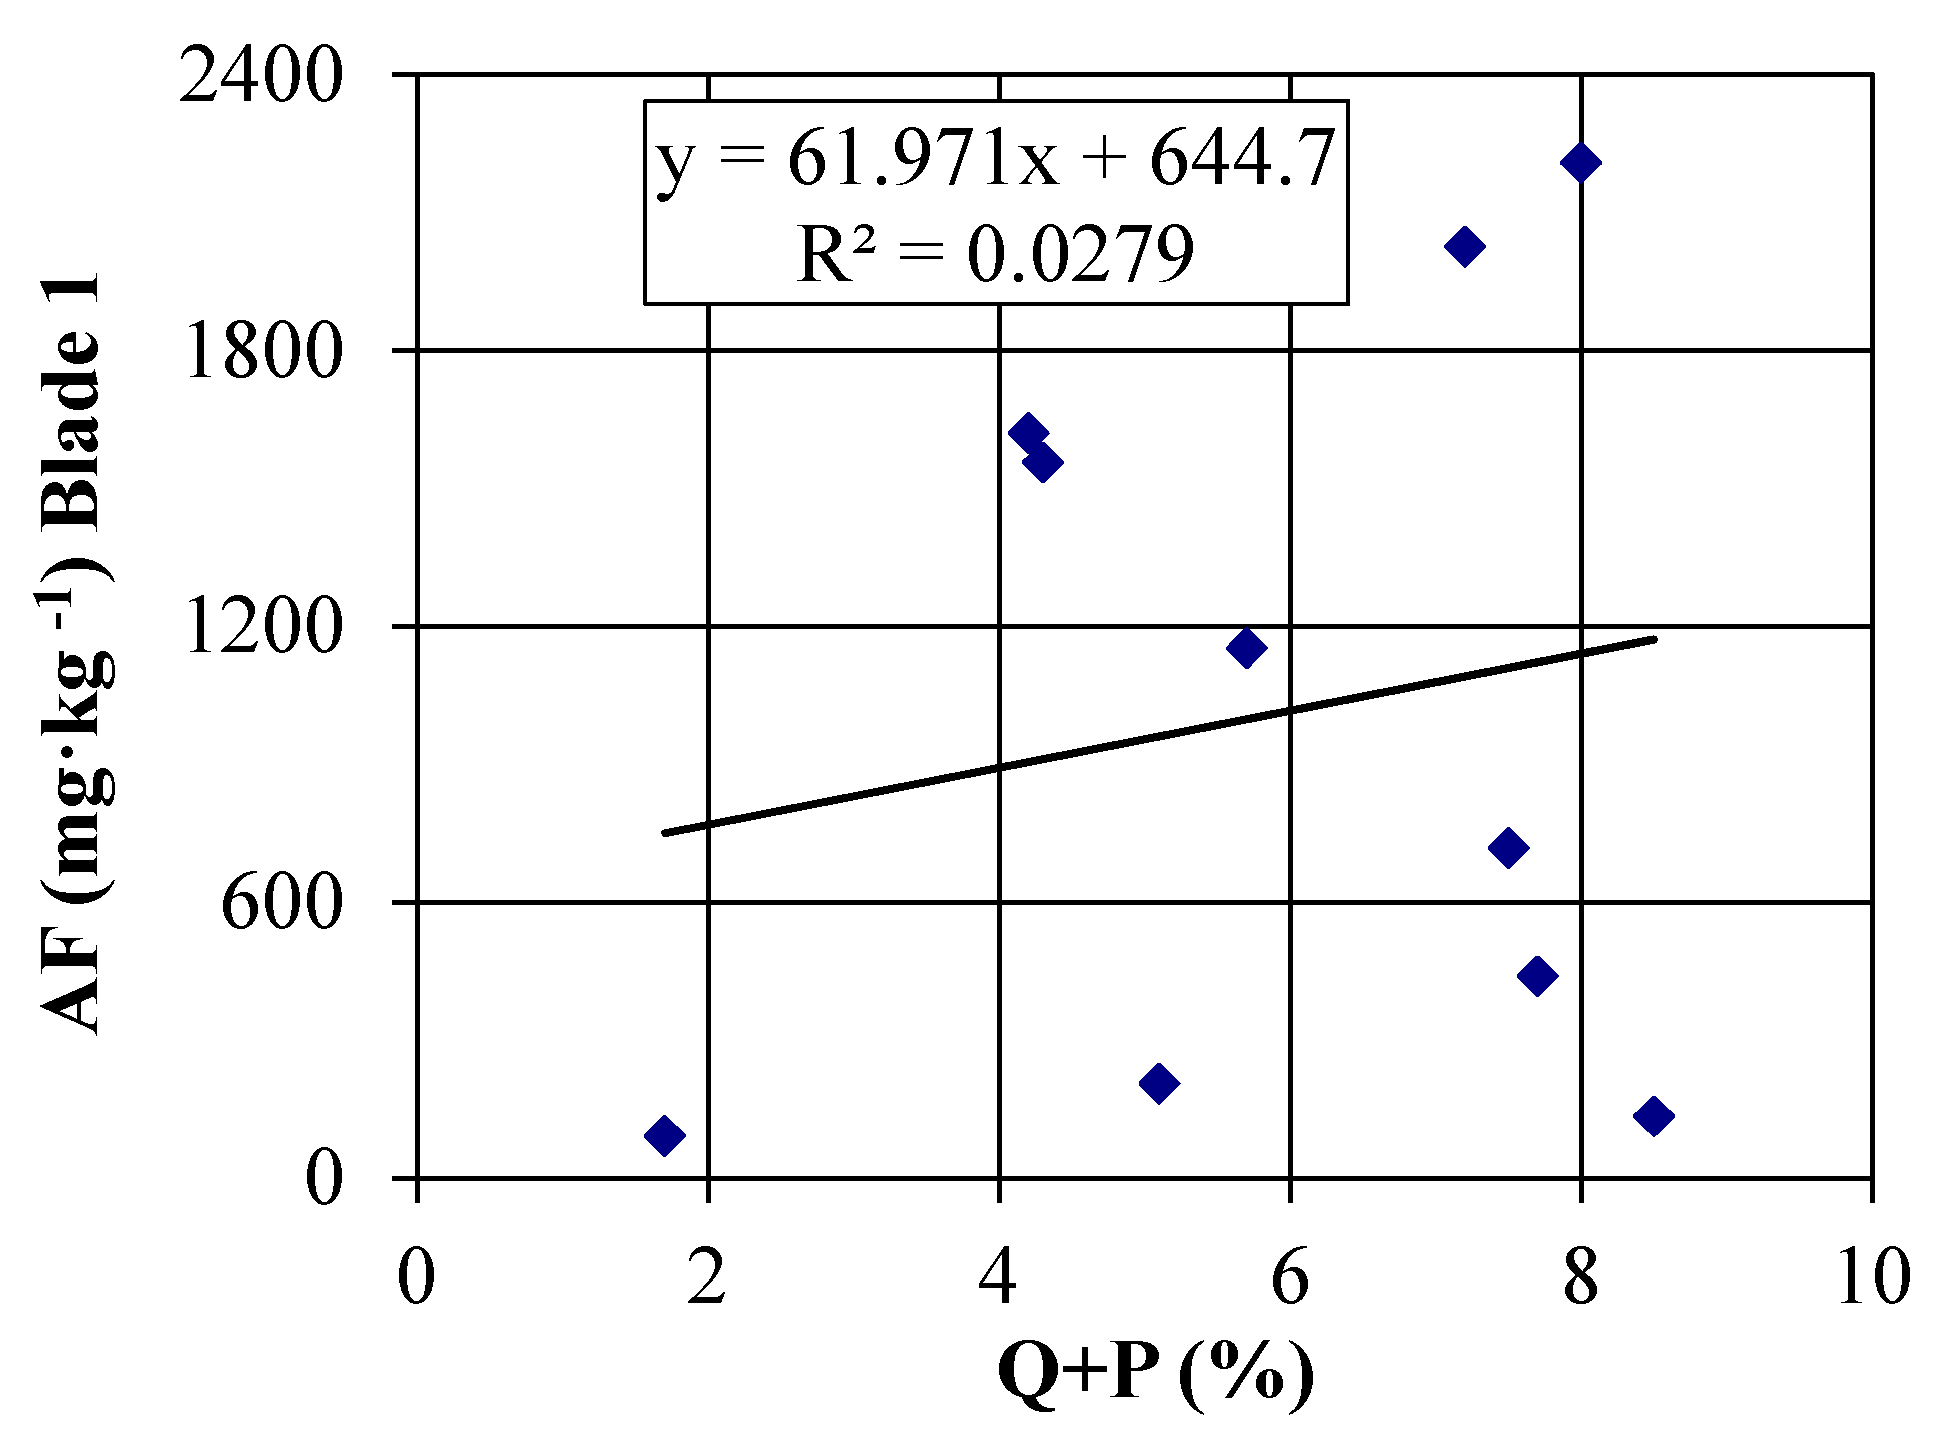
Figure 13 shows that there is no correlation (coefficient of correlation R2 = 0.0279) between the quartz and pyrite content and the abrasiveness of coals described by the abrasion factor. The same lack of correlation is between percentage of quartz and pyrite and other factors describing the coal abrasiveness, such as the Abrasion Potential and the Abrasion Index. This can be explained by the fact that the content of hard particles in coal does not determine coal abrasiveness but rather their size distribution. Quartz and pyrite particle size distribution was not tested.
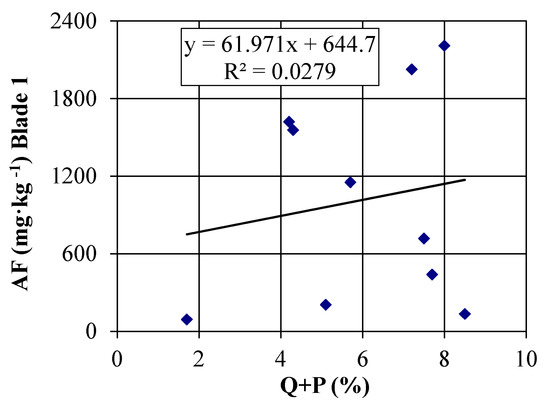
Figure 13.
Scatter diagram of the results showing the relationship between Abrasion Factor (AF), tested with blade No. 1, and combined weight percentage of quartz and pyrite (R2 = 0.0279).
Comparative measurements were taken on the selected coal, the coal water slurry, and three abrasives frequently used in different tribotests. The results are given in Table 3. The results show that water decreases the abrasiveness and grindability of coal, which might be partly related to the lower internal friction for water slurry. All three abrasives have much higher abrasiveness than the selected coal.
Table 3.
Basic mechanical properties of selected coal, coal water slurry and abradants.
5. Conclusions
- The suggested method is less stringent than the methods used so far; it recreates wear conditions that occur in coal processing systems (Appendix A).
- This method enables a quick and inexpensive determination of the abrasiveness and grindability of coal.
- Coal abrasiveness should be tested with bars made of the currently used materials.
- Comparison between the industrial and the laboratory results shows a good correlation between coal abrasiveness obtained by the new suggested method and the maximum and average life of the bottom ring in Babcock vertical mills.
- The intensity of coal abrasion enables the calculation of the maximum and average life of rings (Appendix B).
- An important advantage of the presented attrition test machine (Figure 5 and Figure 6) is its ability to determine not only the pulverizing and abrasive properties of various different minerals, but the abrasion resistance and the fracture toughness of the materials as well (e.g., mining tools). All the tests were performed on the same test machine, but with the inverted test procedure as presented by [39].
Author Contributions
Conceptualization, W.G.; methodology, W.G. and D.A.; software, G.G.; validation, D.K.; formal analysis, A.L.; investigation, W.G. and D.A.; resources, D.K.; data curation, G.G.; writing—original draft preparation, W.G.; writing—review and editing, D.K.; visualization, W.G.; supervision, W.G. and A.L.; project administration, W.G. All authors have read and agreed to the published version of the manuscript.
Funding
This research project received no external funding.
Acknowledgments
The authors would like to express their gratitude to the Institute for Sustainable Technology, Radom, Poland for building the tribotester as part of the Innovative Economy Operational Programme.
Conflicts of Interest
The authors declare no conflict of interest.
Appendix A
Identification of tribological conditions in ball-race coal pulverisers.
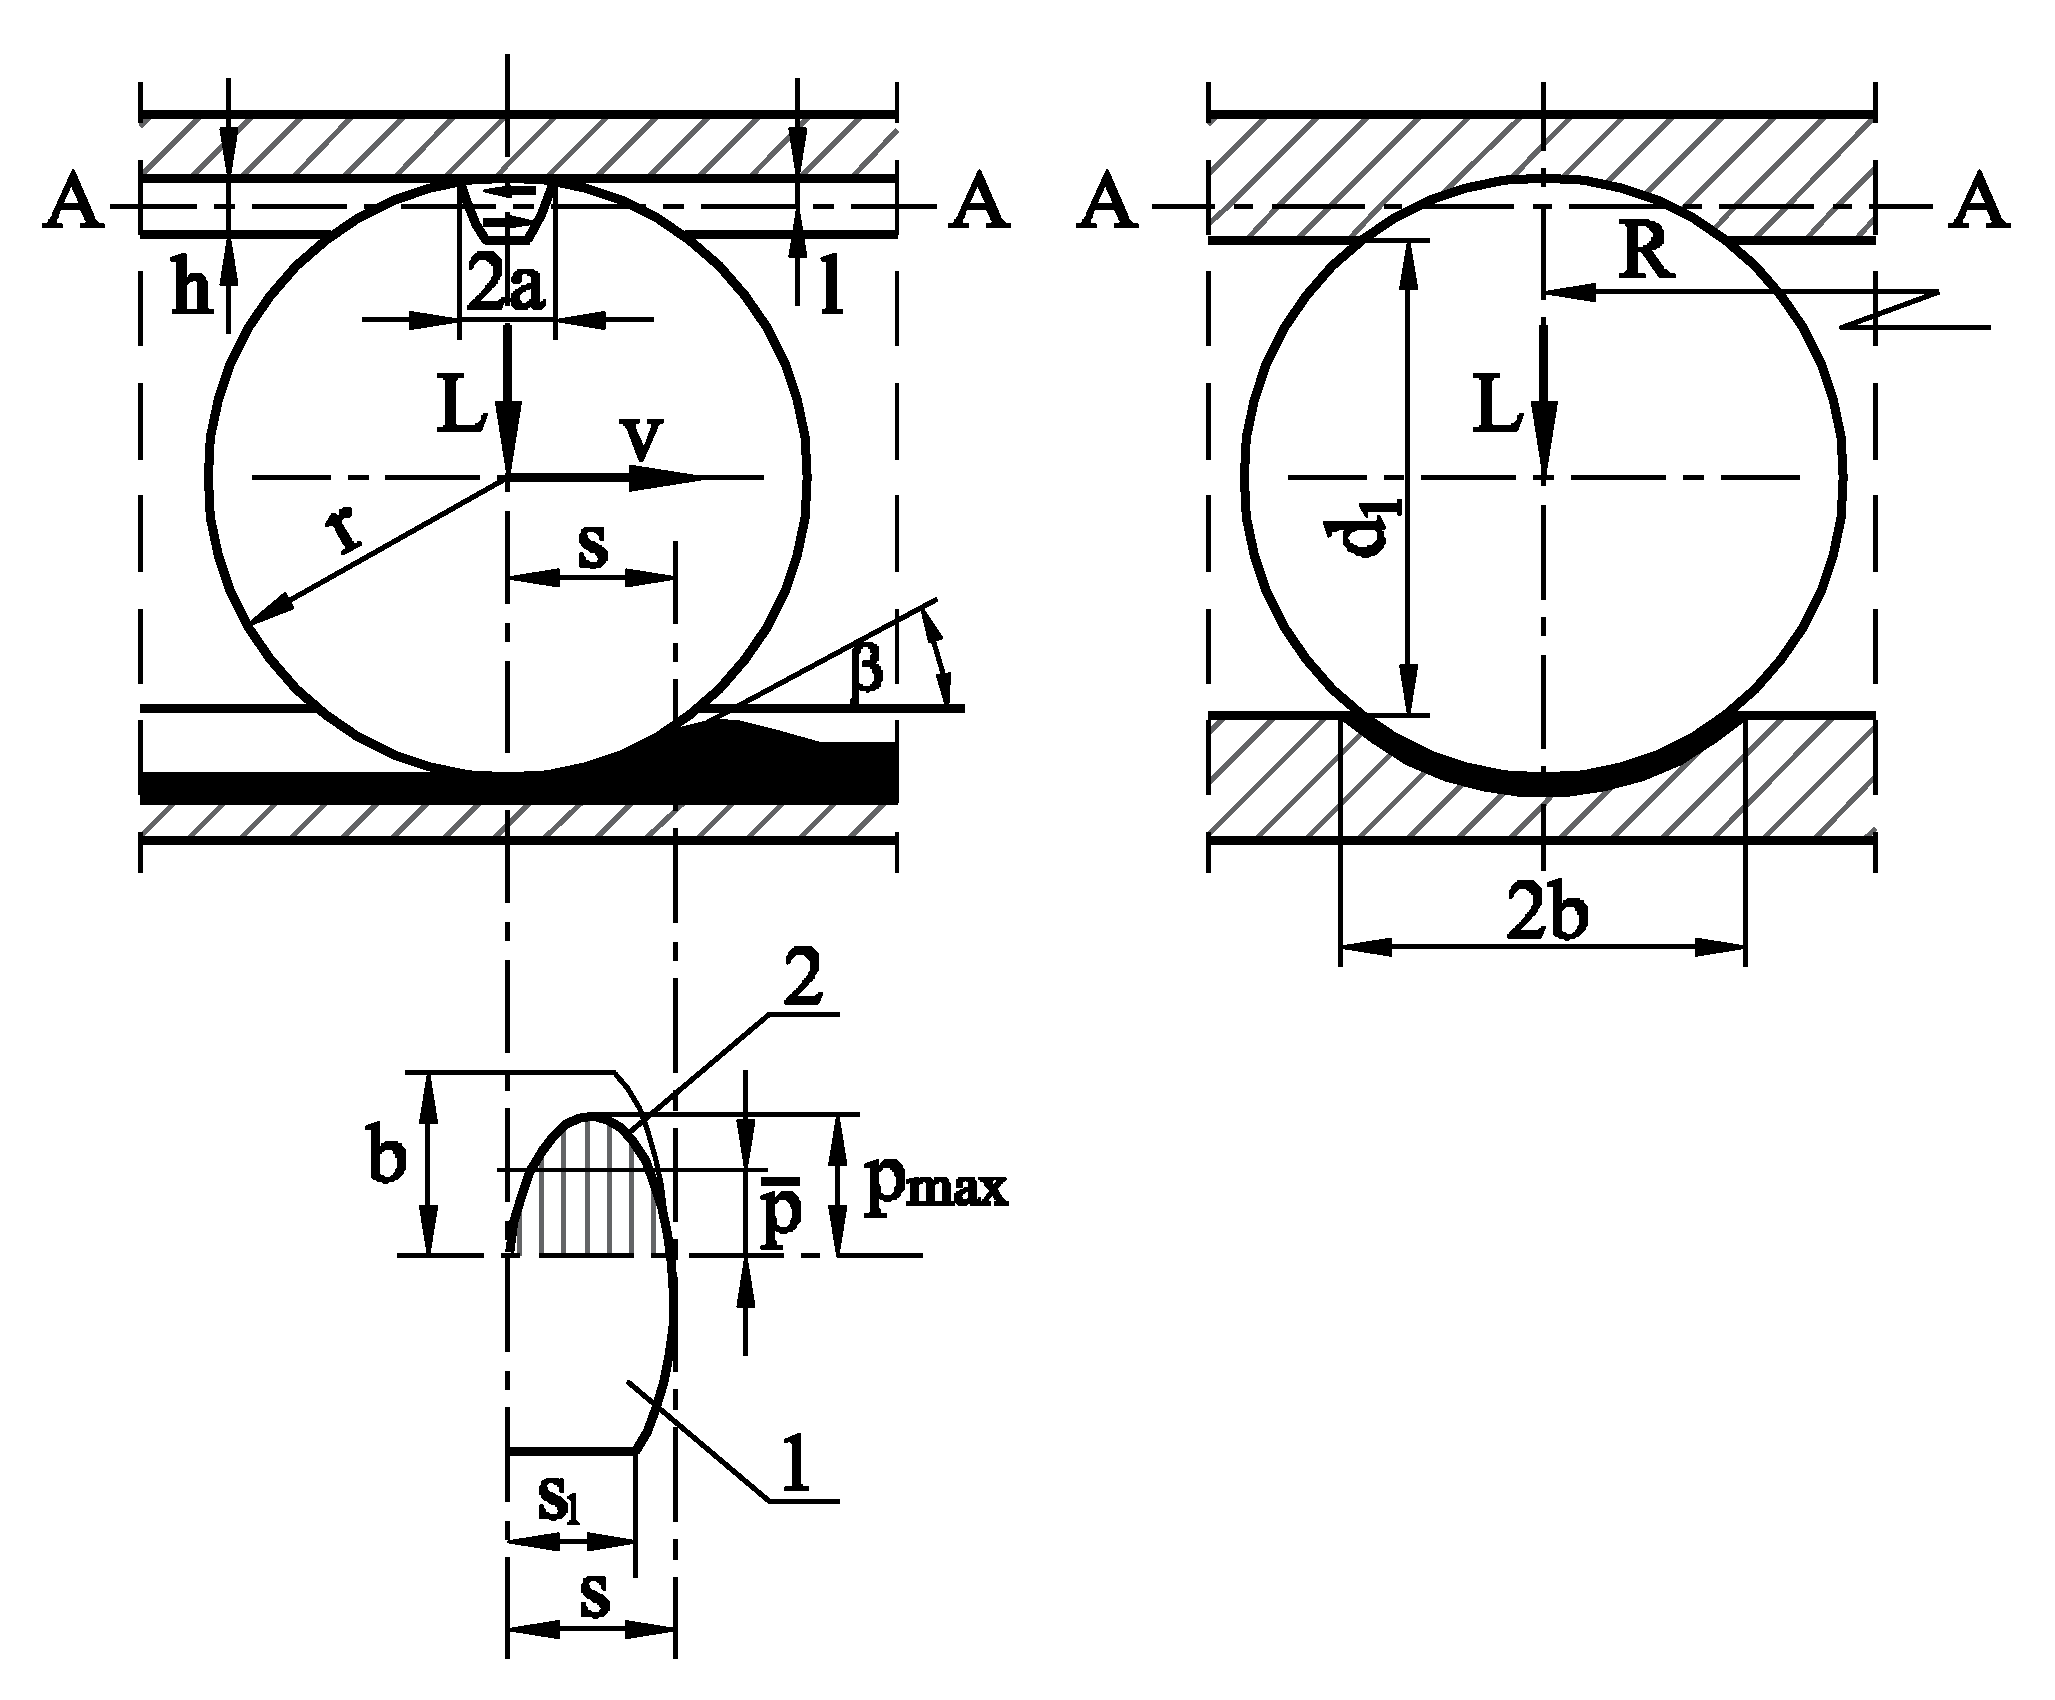
In ball-race mills, which now have a significant number of pulverisers for coal grinding, the shearing and attrition mechanisms dominate. In Figure A1, the tribological conditions of the system are described by the pressure distribution, the gradient of sliding speed and the temperature inside the coal grinding zone and in the contact surface between the coal and the grinding components. The ball-race system geometry changes as the wear process progresses. To identify the pressure condition at the interface between the ball and the bed of fine coal, the model shown in Figure A1 was applied. Loading and geometrical data were taken from the Babcock 12.9 E-type mill as follows: load per ball L = 120 kN; 2r = d = 0.98 m; b = 0.32 m; β = 16°, d1 = 0.742 m. Since s = r sin β and s1 = r1 sin β then s = 0.135 m and s1 = 0.102 m (Figure A1).
The area of contact A was calculated using Equation (A1):
Then the average pressure on the interface between the ball and the coal layer
was obtain. Similar pressure conditions were created in the laboratory test rig by a normal force F = 1000 N which results in
= 2.4 MPa.
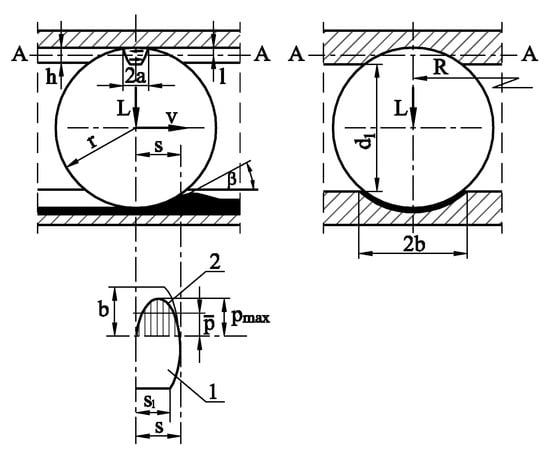
Figure A1.
Simplified diagram of the contact area between the ball, the upper race and the coal layer, where 1 is the area of contact and 2 is the pressure distribution at the interface between the ball and the coal layer.
Figure A1.
Simplified diagram of the contact area between the ball, the upper race and the coal layer, where 1 is the area of contact and 2 is the pressure distribution at the interface between the ball and the coal layer.
The average pressure on the interface between the grinding component and the coal bed ( = 1.5 MPa) was found to be 20 to 30 times lower than the compressive strength of the coal being pulverized [38]. This confirms that crashing and fracturing of each particle takes place on the real contact areas (Figure 4) between coal particles which are forced to move one against another by the rolling components (the balls or the rollers).
Appendix B
Correlation between the mill grinding component life and the coals abrasiveness determined in the laboratory.
Industrial data from the power station performance monitoring services and the laboratory results for the five coals (Table A1) were compared. Good correlation was found between tribotest results from simulations and the results from industrial mill operation (Figure A2). The correlations can be presented in the form of the following regression equations:
- MSL = 27,064−137 IA, r = −0.923
- ASL = 19,976−140 IA, r = −0.988
Table A1.
Comparison between mill grinding component life and abrasiveness of selected coals.
Table A1.
Comparison between mill grinding component life and abrasiveness of selected coals.
| Coal Number | MSL (h) | ASL (h) | IA (mg·m−2·s−1) |
|---|---|---|---|
| A | 13,260 | 5700 | 99.0 |
| B | 20,000 | 15,300 | 32.3 |
| C | 25,435 | 16,009 | 22.6 |
| D | 22,000 | 14,000 | 49.1 |
| E | 22,000 | 15,500 | 34.4 |
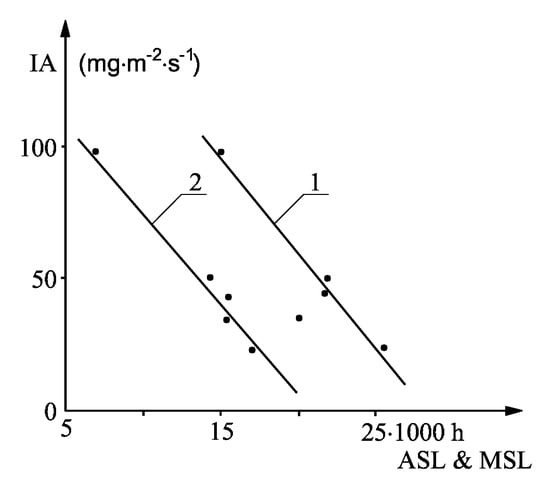
Figure A2.
Correlation between IA and MSL and ASL, where 1 and 2 are the regression lines of the Equations MSL = 27,064−137 IA, and ASL = 19,976−140 IA, MSL is a maximum life of the bottom rings (h), ASL is an average life of the bottom rings (h), IA is intensity of abrasion (mg·m−2·s−1).
Figure A2.
Correlation between IA and MSL and ASL, where 1 and 2 are the regression lines of the Equations MSL = 27,064−137 IA, and ASL = 19,976−140 IA, MSL is a maximum life of the bottom rings (h), ASL is an average life of the bottom rings (h), IA is intensity of abrasion (mg·m−2·s−1).

References
- Mazurek, K.; Szyguła, M.; Perutka, K.; Turczyński, K.; Stankiewicz, K. Acquiring electric energy from the transport conveyor roller movement for distributed sensors network. J. Electr. Eng. 2020, 71, 87–95. [Google Scholar] [CrossRef]
- Lowrison, G.C. Crushing and Grinding: The Size Reduction of Solid Material; Butterworths: London, UK, 1974. [Google Scholar]
- Berkowitz, N. An Introduction to Coal Technology, 2nd ed.; Academic Press: London, UK, 1994. [Google Scholar]
- Raask, E. Erosion Wear in Coal Utilization; Hemisphere Publishing Corporation: Washington, DC, USA, 1988. [Google Scholar]
- Scieszka, S. Modelling durability of coal grinding systems. Wear 1987, 114, 29–39. [Google Scholar] [CrossRef]
- Lutyński, M.; Lutyński, A. Energy Potential of Coal Slurries Deposited in Environment. In Proceedings of the XXIV International Conference, Ecological Truth, Eco_ist ’16, Vrnjacka Banja, Serbia, 12–15 June 2016; pp. 477–481. [Google Scholar]
- Lutyński, M.; Lutyński, A. Coal waste slurries as the fuel for IGCC plants. E3S Web Conf. 2016, 8, 01056. [Google Scholar] [CrossRef] [Green Version]
- Różański, Z.; Suponik, T.; Matusiak, P.; Kowol, D.; Szpyrka, J.; Mazurek, M.; Wrona, P. Coal recovery from a coal waste dump. In Proceedings of the MEC 2016, Mineral Engineering Conference, Swieradow-Zdroj, Poland, 25–28 September 2016; pp. 1–9. [Google Scholar]
- Kowol, D.; Matusiak, P. Technology of fine coal grains recovery from the mining waste deposits. IOP Conf. Ser. Mater. Sci. Eng. 2018, 427, 012025. [Google Scholar] [CrossRef]
- Sidor, J.; Klich, A. Współczesne Maszyny do Rozdrabniania—kruszarki i Młyny; Instytut Techniki Górniczej KOMAG: Gliwice, Poland, 2018; pp. 1–393. [Google Scholar]
- Foszcz, D.; Krawczykowski, D.; Gawenda, T.; Kasińska-Pilut, E.; Pawlos, W. Analysis of process of grinding efficiency in ball and rod mills with various parameters. In Proceedings of the MEC 2018, Mineral Engineering Conference, Zawiercie, Poland, 26–29 September 2018; pp. 1–11. [Google Scholar]
- Hlosta, J.; Zurovec, D.; Zidek, M.; Zegzulka, J. Mechanical properties of powdered coal and their influence to technological processes. J. Pol. Miner. Eng. Soc. 2014, 15, 107–112. [Google Scholar]
- Saramak, D.; Gawenda, T.; Saramak, A.; Foszcz, D.; Naziemiec, Z. Effectiveness of copper minerals liberation from the gangue through application of HRC press in copper ore processing circuits. Arch. Min. Sci. 2018, 63, 465–476. [Google Scholar]
- Nad, A.; Saramak, D. Comparative Analysis of the Strength Distribution for Irregular Particles of Carbonates, Shale, and Sandstone Ore. Minerals 2018, 8, 37. [Google Scholar] [CrossRef] [Green Version]
- Saramak, A. Comparative Analysis of Selected Types of Crushing Forces in Terms of Dust Emission. J. Pol. Miner. Eng. Soc. 2019, 21, 151–154. [Google Scholar]
- Nad, A.; Brozek, M. Analysis of the Particle Size Distribution of Products Crushing Shale and Dolomite Crushing by Compression of Single Irregular Particles. J. Pol. Miner. Eng. Soc. 2018, 20, 241–245. [Google Scholar]
- Liu, J.; Schöner, K. Modelling of interparticle breakage. Int. J. Miner. Process. 1996, 44, 101–115. [Google Scholar] [CrossRef]
- Bemrose, C.; Bridgwater, J. A review of attrition and attrition test methods. Powder Technol. 1987, 49, 97–126. [Google Scholar] [CrossRef]
- Scieszka, S.F. Laboratory Method for Combined Testing of Abrasiveness, Grindability and Wear in Mineral. Processing Systems; University of Cape Town: Cape Town, South Africa, 1991; STLE 91-AM-5F-1: 1–10. [Google Scholar]
- Van Krevelen, D.W. Coal—Typology, Chemistry, Physics, Construction; Elsevier: Amsterdam, The Netherlands, 1993. [Google Scholar]
- Scieszka, S.F. A technique to investigate pulverizing properties of coal. Powder Technol. 1985, 43, 89–102. [Google Scholar] [CrossRef]
- Tavares, L. Energy absorbed in breakage of single particles in drop weight testing. Miner. Eng. 1999, 12, 43–50. [Google Scholar] [CrossRef]
- Cademartori, S.; Cravero, C.; Marini, M.; Marsano, D. CFD Simulation of the Slot Jet Impingement Heat Transfer Process and Application to a Temperature Control System for Galvanizing Line of Metal Band. Appl. Sci. 2021, 11, 1149. [Google Scholar] [CrossRef]
- Huang, H.; Sun, T.; Zhang, G.; Li, D.; Wei, H. Evaluation of a developed SST k-ω turbulence model for the prediction of turbulent slot jet impingement heat transfer. Int. J. Heat Mass Transf. 2019, 139, 700–712. [Google Scholar] [CrossRef]
- Scieszka, S.F.; Jadi, A.S.M. The effect of abradant particle comminution on the intensity of three-body abrasion. Tribotest 1998, 5, 145–155. [Google Scholar] [CrossRef]
- Schaefer, H. Loesche vertical roller mills for the comminution of ores and minerals. Miner. Eng. 2001, 14, 1155–1160. [Google Scholar] [CrossRef]
- Spero, C.; Hargreaves, D.; Kirkcaldie, R.; Flitt, H. Review of test methods for abrasive wear in ore grinding. Wear 1991, 146, 389–408. [Google Scholar] [CrossRef]
- Eksi, D.; Benzer, A.H.; Sargin, A.; Genc, O. A new method for determination of fine particle breakage. Miner. Eng. 2011, 24, 216–220. [Google Scholar] [CrossRef]
- Chi, C.; Zhou, Y.; Cao, S.; Arima, K.; Chuman, Y.; Okafuji, T. Development of a pilot roller test machine for investigating the pulverizing performance of particle beds. Miner. Eng. 2015, 72, 65–72. [Google Scholar] [CrossRef]
- ASTM D409-71. Standard Test Method for Grindability of Coal by the Hardgrove Machine Method; ASTM International: West Conshohocken, PA, USA, 1971. [Google Scholar]
- ISO 5074:1994. Hard Coal—Determination of Hardgrove Grindability Index; Swedish Standards Institution: Stockholm, Sweden, 1994. [Google Scholar]
- Jang, J.W.; Iwasaki, I.; Moore, J.J. The Effect of Galvanic Interaction between Martensite and Ferrite in Grinding Media Wear. Corrosion 1989, 45, 402–407. [Google Scholar] [CrossRef]
- ASTM G65-80. Standard Practice for Conducting Dry Sand/Rubber Wheel Abrasion Test; ASTM International: West Conshohocken, PA, USA, 1980. [Google Scholar]
- Perez, R.; Moore, J.J. The influence of grinding ball composition and wet grinding conditions on metal wear. Wear Mater. ASME 1983, 1983, 67–78. [Google Scholar]
- Scieszka, S.F. Tribological problems of mineral comminution. Tribotest 1996, 2, 235–255. [Google Scholar] [CrossRef]
- Bayer, R.G. Selection and use of wear tests for metals. ASTM Spec. Tech. Publ. 1976, 615, 30–44. [Google Scholar]
- British Standards Institution. Determination of the Index of Abrasion of Coal BS 1016: Part. 19; British Standards Institution: London, UK, 1980. [Google Scholar]
- Scieszka, S.F.; Dutkiewicz, R.K. Testing abrasive wear in mineral comminution. Int. J. Miner. Process. 1991, 32, 81–109. [Google Scholar] [CrossRef]
- Scieszka, S.F.; Grzegorzek, W.; Zołnierz, M. Tribotesting system for hardmetals mechanical characterization. Int. J. Refract. Met. Hard Mater. 2013, 41, 470–482. [Google Scholar] [CrossRef]


Publisher’s Note: MDPI stays neutral with regard to jurisdictional claims in published maps and institutional affiliations. |
© 2021 by the authors. Licensee MDPI, Basel, Switzerland. This article is an open access article distributed under the terms and conditions of the Creative Commons Attribution (CC BY) license (https://creativecommons.org/licenses/by/4.0/).