Article

Environmental Life Cycle Assessment of Ammonia-Based Electricity

1
Facultad de Ingeniería en Mecánica y Ciencias de la Producción, Escuela Superior Politecnica del Litoral, ESPOL, Campus Gustavo Galindo, Km 30.5 Vía Perimetral, P.O. Box 13 09-01-5863, Guayaquil 090902, Ecuador
2
Proton Ventures, Karel Doormanweg 5, 3115 JD Schiedam, The Netherlands
3
College of Physical Sciences and Engineering, Cardiff University, Cardiff CF24 3AA, UK
4
Ammonia Energy Association, 77 Sands Street, 6th Floor, Brooklyn, NY 11201, USA
5
Catalytic Processes & Materials, MESA+ Institute for Nanotechnology, University of Twente, P.O. Box 217, 7500 AE Enschede, The Netherlands
*
Author to whom correspondence should be addressed.
Energies 2021, 14(20), 6721; https://doi.org/10.3390/en14206721
Submission received: 26 September 2021 / Revised: 9 October 2021 / Accepted: 12 October 2021 / Published: 15 October 2021
(This article belongs to the Special Issue Ammonia as an Energy Carrier)

Abstract

:
In recent years, several researchers have studied the potential use of ammonia (NH3) as an energy vector, focused on the techno-economic advantages and challenges for full global deployment. The use of ammonia as fuel is seen as a strategy to support decarbonization; however, to confirm the sustainability of the shift to ammonia as fuel in thermal engines, a study of the environmental profile is needed. This paper aims to assess the environmental life cycle impacts of ammonia-based electricity generated in a combined heat and power cycle for different ammonia production pathways. A cradle-to-gate assessment was developed for both ammonia production and ammonia-based electricity generation. The results show that electrolysis-based ammonia from renewable and nuclear energy have a better profile in terms of global warming potential (0.09–0.70 t CO2-eq/t NH3), fossil depletion potential (3.62–213.56 kg oil-eq/t NH3), and ozone depletion potential (0.001–0.082 g CFC-11-eq/t NH3). In addition, surplus heat for district or industrial applications offsets some of the environmental burden, such as a more than 29% reduction in carbon footprint. In general, ammonia-based combined heat and power production presents a favorable environmental profile, for example, the carbon footprint ranges from −0.480 to 0.003 kg CO2-eq/kWh.

1. Introduction

Ammonia (NH3) is currently gaining considerable interest as a zero-carbon energy vector from academic institutions, governmental bodies, and industrial companies. The potential use of ammonia in power generation systems such as fuel cells, internal combustion engines, furnaces, and gas turbines is under scrutiny at different power scales [1], with considerable efforts to tackle emissions and enable reliable, stable processes [2]. Progress on the subject has led to international programs that aim to develop innovative technologies to demonstrate ammonia’s use to store renewable energy from wind, solar, and even marine resources [3]. However, ammonia as fuel still requires further research, especially when demonstrating an integrated approach that considers all the impacts in the production and utilization chain of ammonia produced with different methods and in various regions. Therefore, this work attempts to bring all these points under a life cycle assessment umbrella to demonstrate the potential impact of integrated ammonia-based units fueled from ammonia produced in different parts of the world.
The challenge of considering ammonia as an energy carrier does not only lie in the technical complexities of using a slow-reacting molecule with the potential of NOX formation [4] but also in the economic and logistical aspects of the concept behind generating green ammonia via renewable sources. The challenges of implementing large-scale green ammonia production and its novel uses must be identified and overcome if its development and deployment are to be accelerated and fully capitalized on [5]. Overall, some of these challenges include upfront investment costs (i.e., EUR 300–350 tNH3 compared to EUR 440–630 tNH3 via green ammonia [6]), existing capacity, market uncertainty (i.e., use of ammonia for marine applications may vary from 25% to 99% by 2050 [7,8]), erosion of revenues due to other vectors, government support, and last but not least, environmental impacts of the “hydrogen through ammonia” economy concept. Hence, current efforts focus on developing studies and demonstration systems capable of meeting these challenges. As for environmental impacts, the use of novel tools has improved insight into the effects of various ammonia-based systems, primarily via life cycle assessments.
A life cycle assessment (LCA) is defined as the systematic analysis of the potential environmental impacts of products or services during their entire life cycle. Ammonia has been under the scope of LCA analysts for several years. Wei and En-ke [9] performed an analysis of the use of coal-based ammonia for vehicular applications, finding the concept feasible. Similarly, Bicer et al. have approached the subject by evaluating different ammonia production methods [10], aerospace, marine, and vehicle applications [11,12,13], and integration of concepts [14]. Their results denote the impacts on eutrophication, abiotic depletion, global warming potential, and human health. Although the results are mixed and some options are better than others, it is evident from all their work that ammonia can be obtained with low environmental impacts, while the use of current technologies can enable similar or lesser effects on health and the environment if ammonia replaces fossil-based fuels. Cox and Treyer [15] also conducted assessments for the use of fuel cells that could replace standard power systems. Their study focused on alkaline units, denoting that there is still work to do to improve cell lifetime, power densities, and fuel consumption for less impactful devices. Further work was presented by Razon and Valera-Medina [16], who studied ammonia in gas turbines. Blends of ammonia–methane were evaluated, with results showing that ammonia produced from nuclear or wind energy could potentially support global decarbonisation with a −27% to −32% reduction in global warming potential. Table 1 summarizes these studies that analyze the environmental profile of ammonia-based electricity.
Most studies conclude that current technologies used to produce green ammonia need to be improved. Pfromm [18] concludes in his assessment that using the available industrial-scale technology, the energy demand for a process based on electrical energy to provide hydrogen and nitrogen is about 14% higher than that of the conventional natural gas-based process. On the other hand, according to Smith [19], electrochemical-based ammonia could achieve reductions in energy consumption and CO2 emissions by 50% and 78%, respectively, in comparison with methane-based ammonia. Hence, technological developments are needed in conjunction with better cycles that can increase the overall efficiency of ammonia power systems.
On that line of research, ammonia cycles have also experienced an increase in analysis. Relevant work presented by Keller et al. [20] denotes how the use of ammonia could potentially be employed with efficient profiles, while by-products of the process (mainly water, nitrogen, and traces of hydrogen that are burned in a heat recovery steam generator) can boost the final thermal efficiency, keeping NOX emissions low. Further work performed by Mashruk et al. [21] approached the use of ammonia via hydrogen and humidified blends. The results show that using ammonia with hydrogen/steam blends potentially can reduce NOX in an order of magnitude, while combustion efficiencies remain high with the implementation of two-stage combustion systems. The works were expanded by Gutesa-Bozo et al. [22], who presented an innovative cycle that uses ammonia for power generation and cooling and heating purposes. The results show that efficiencies of up to 60% can be achieved using ammonia blends. The results are in accord with those found by other studies [23]. Hence, that study was used as a background in this paper, combining an efficient cooling/heating/power cycle with state-of-the-art ammonia production methods in a detailed LCA that is critically needed to progress to a physical demonstration. The work is expanded to different regions, showing how ammonia production can have different impacts via other methods and resources.
Ammonia production is usually centralized, but distributed production is required when coping with the geographic isolation and intermittency of renewable energy [19]. Several researchers have addressed the environmental impact of ammonia production considering different scales, feedstocks, and pathways; however, few of them include a description of ammonia life cycle inventories at different production scales. Moreover, an environmental evaluation of a co-generation heat and power (CHP) system based on ammonia has not been analyzed from a life cycle perspective in the literature.
Ammonia presents several barriers before it can be fully deployed as an energy carrier at a global scale [5]. First, ammonia needs to be produced in a simple, cheap manner. Current methods still rely on the production of hydrogen via steam-methane reforming, hence heavily contributing to climate change. Unfortunately, the use of electrolyzers (as in this work) still poses a heavy economic burden for green ammonia, a subject that is under scrutiny worldwide. Second, utility-scale power generation needs to be addressed with efficient systems that mitigate the production of unwanted emissions such as nitrogen oxides. Nitrous oxide (N2O) is a strong greenhouse gas that can be produced from ammonia combustion systems, thus reducing the eco-friendly nature of using ammonia as a carbon-fuel replacement if these systems are not properly designed, which is another state-of-the-art subject under continuous research. Third, public perception needs to be fully acknowledged. Understanding how communities and individual users can use ammonia as a carbon-free fuel is still poorly understood. Bad perceptions of the chemical can stop stakeholders’ interest, funding, and progress on the topic. Finally, all the developments need to be profitable with healthy economic profiles, otherwise companies of all sizes will not invest in ammonia technologies. Therefore, this work approaches the latter two barriers with a study that supports a better understanding of the impacts of using ammonia as an energy vector for a better acknowledgement of its potential application in different locations, while the results also serve as the basis for future economic analyses.
The objectives of this study are: (i) to present a life cycle inventory of ammonia production in small (20,000 t/year) and medium (100,000 t/year) scale plants; (ii) to compare the environmental performance of ammonia production using different energy resources and different technology scales; and (iii) to compare the environmental performance of ammonia-based electricity generated in the studied CHP system using the different ammonia production pathways. This research will serve as a basis to understand and discuss the role of ammonia through different commercially available routes to generate electricity as support for decarbonization.

2. Materials and Methods

This work aims to evaluate the environmental profile of ammonia as an energy carrier, following the methodological framework provided in the ISO Standards 14040:2006 and 14044:2006 [24,25]. LCA has been used successfully to evaluate the environmental sustainability of electricity generation systems [26,27,28].
A cradle-to-gate assessment was developed for both studied systems. Figure 1 presents the streamlined ammonia systems for natural gas steam reforming (a) and water electrolysis (b). Figure 2 illustrates the whole system, including extracting raw materials and energy resources, processing, manufacturing, and distributing ammonia, CHP plant operation, plant construction, and displaced heat from natural gas.
The functional unit, FU, is the quantity in which all the inputs and outputs are calculated; as well, it serves as a basis to estimate the environmental impacts and compare with other systems with the same function. Therefore, two FU are considered in this work: “1 ton of ammonia (NH3) at the gate of the production facility” and “1 kWh of electricity at the CHP plant”.
The life cycle inventory (LCI) stage is the systematization of the input and output flows for the product system. The LCI of the ammonia production system was developed based on primary data from Proton Ventures BV [29] and supplemented with secondary data from the literature [30,31]. The estimation of fugitive emissions during the storage and transport stage was based on the work of Al-Breiki and Bicer [32,33]. The power plant model was based on the operation cycle proposed by Guteša Božo et al. [22] that uses a mix of humidified ammonia/hydrogen as fuel (NH3 is partially cracked to produce a 30/70 H2/NH3 blend). Figure 3 shows a representation of the power cycle. The LCI in all the system stages was completed with background data obtained from the Ecoinvent database 3.7.1 [34]. Background data include material and energy flows needed to extract, process, manufacture, and distribute fuels, electricity, products, and capital goods.
Various scenarios were studied to analyze the environmental feasibility of synthesized ammonia as a carrier in the global energy market. Ammonia can be produced from nitrogen (N2) and hydrogen (H2) through the Haber–Bosch process. Purified nitrogen is obtained from the atmospheric air via an air separation unit (ASU), which requires a certain amount of energy. Depending on the location and production scale, hydrogen gas can be obtained from different feedstocks (methane, water, biomass) and various energy sources (fossil resources, electricity from renewables, or nuclear). Steam methane reforming (SMR) is the most used technology to produce hydrogen (around 80% of the global production of ammonia [35]).
In contrast, using an electrolyzer with water as feedstock and electricity as an energy source is gaining more relevance nowadays [3,5]. Hydrogen production represents most of the energy requirement, typically more than 90% of the total energy requirement [36]. Both hydrogen production technologies were included in this study, i.e., steam methane reforming and electrolysis.
Regarding locations, the UK is the baseline scenario where the co-generation power plant is situated. Considering the future role that ammonia could have as a storage carrier in a decarbonized global energy market [10], other locations outside the UK were considered to produce green ammonia, potentially for import of green ammonia to the UK. A variety of research shows promising technical and economic feasibility of producing hydrogen/ammonia from renewable sources and exporting to other locations in Europe or Asia [37,38,39]. In this regard, Australia [40,41], Morocco [42,43], and Chile [44,45] are in the lead with the development of green ammonia production facilities. Brazil, one of the major consumers of fertilizers that also has a significant renewable energy capacity, and Iceland, were also considered for this study. The United Arab Emirates are expanding their energy portfolio, with nuclear [46] and ammonia [47,48]; therefore, a scenario considering ammonia production based on nuclear energy from UAE was included.
Ammonia production is mainly centralized, but distributed production may be required in isolated areas. Distributed ammonia production opens up transformative opportunities for applications besides fertilizers. For this, the Haber–Bosch process should be adapted to the geographic isolation and intermittency of renewable energy sources, decarbonized, be made more energy efficient, and deployed in low capital projects [19]. Indeed, the production scale is an issue as well: when scaling down, heat losses and energy consumption increase [36]. For both gray (SMR) and green (from renewable energy) ammonia, a small-scale scenario of ammonia production (with a yield of 20,000 t per annum) was modeled for the UK. Medium-scale production (100,000 t per annum) scenarios for production of gray, green, and blue ammonia (SMR with carbon capture and storage—CCS) are modeled for the UK and the other locations to later import to the UK. Table 2 includes a description of the scenarios under study.
Ammonia synthesis is a highly energy-intensive process; therefore, the energy efficiency of its production is an essential factor to consider when evaluating the sustainability of large-scale production. This study addresses this issue by comparing the future environmental profile of green ammonia, considering future trends in electrolyzer technology [19]. Scenarios using the country electricity generation mix and a conventional natural gas power plant to assess the environmental cost of producing ammonia with non-renewable sources were included. Natural gas is used as this is likely the marginal energy technology used in the countries where ammonia is produced. The marginal energy technology represents a case where the generation technology must cover a new demand on the margin of that energy market.
The life cycle impact assessment (LCIA) was performed using the characterization factors comprised in the ReCiPe2016 Midpoint(H) v1.13 methodology [49] and was modeled using the OpenLCA software [50]. Impact categories included in the analysis are listed in Table 3.
In addition, the ReCiPe2016 Midpoint(I) methodology [49] was used to assess the potential reduction in GHG emissions between gray (methane-based) and blue (methane-based with CCS) ammonia.

3. Results and Discussion

Supplementary Material shows the life cycle inventory of the ammonia production system (Table S1), the storage and transport of ammonia (Table S2), and the electricity generation production system (Table S3).

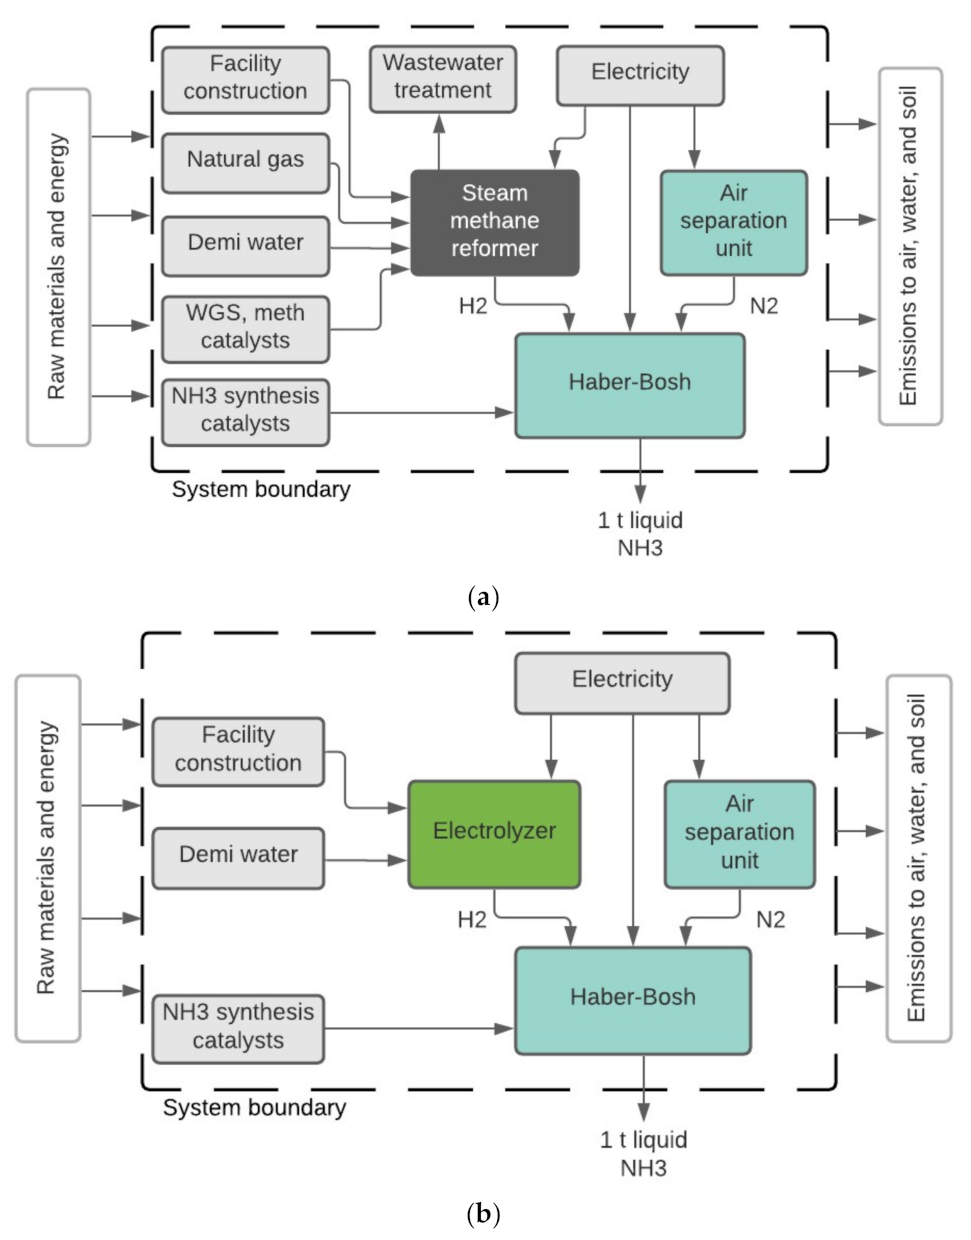
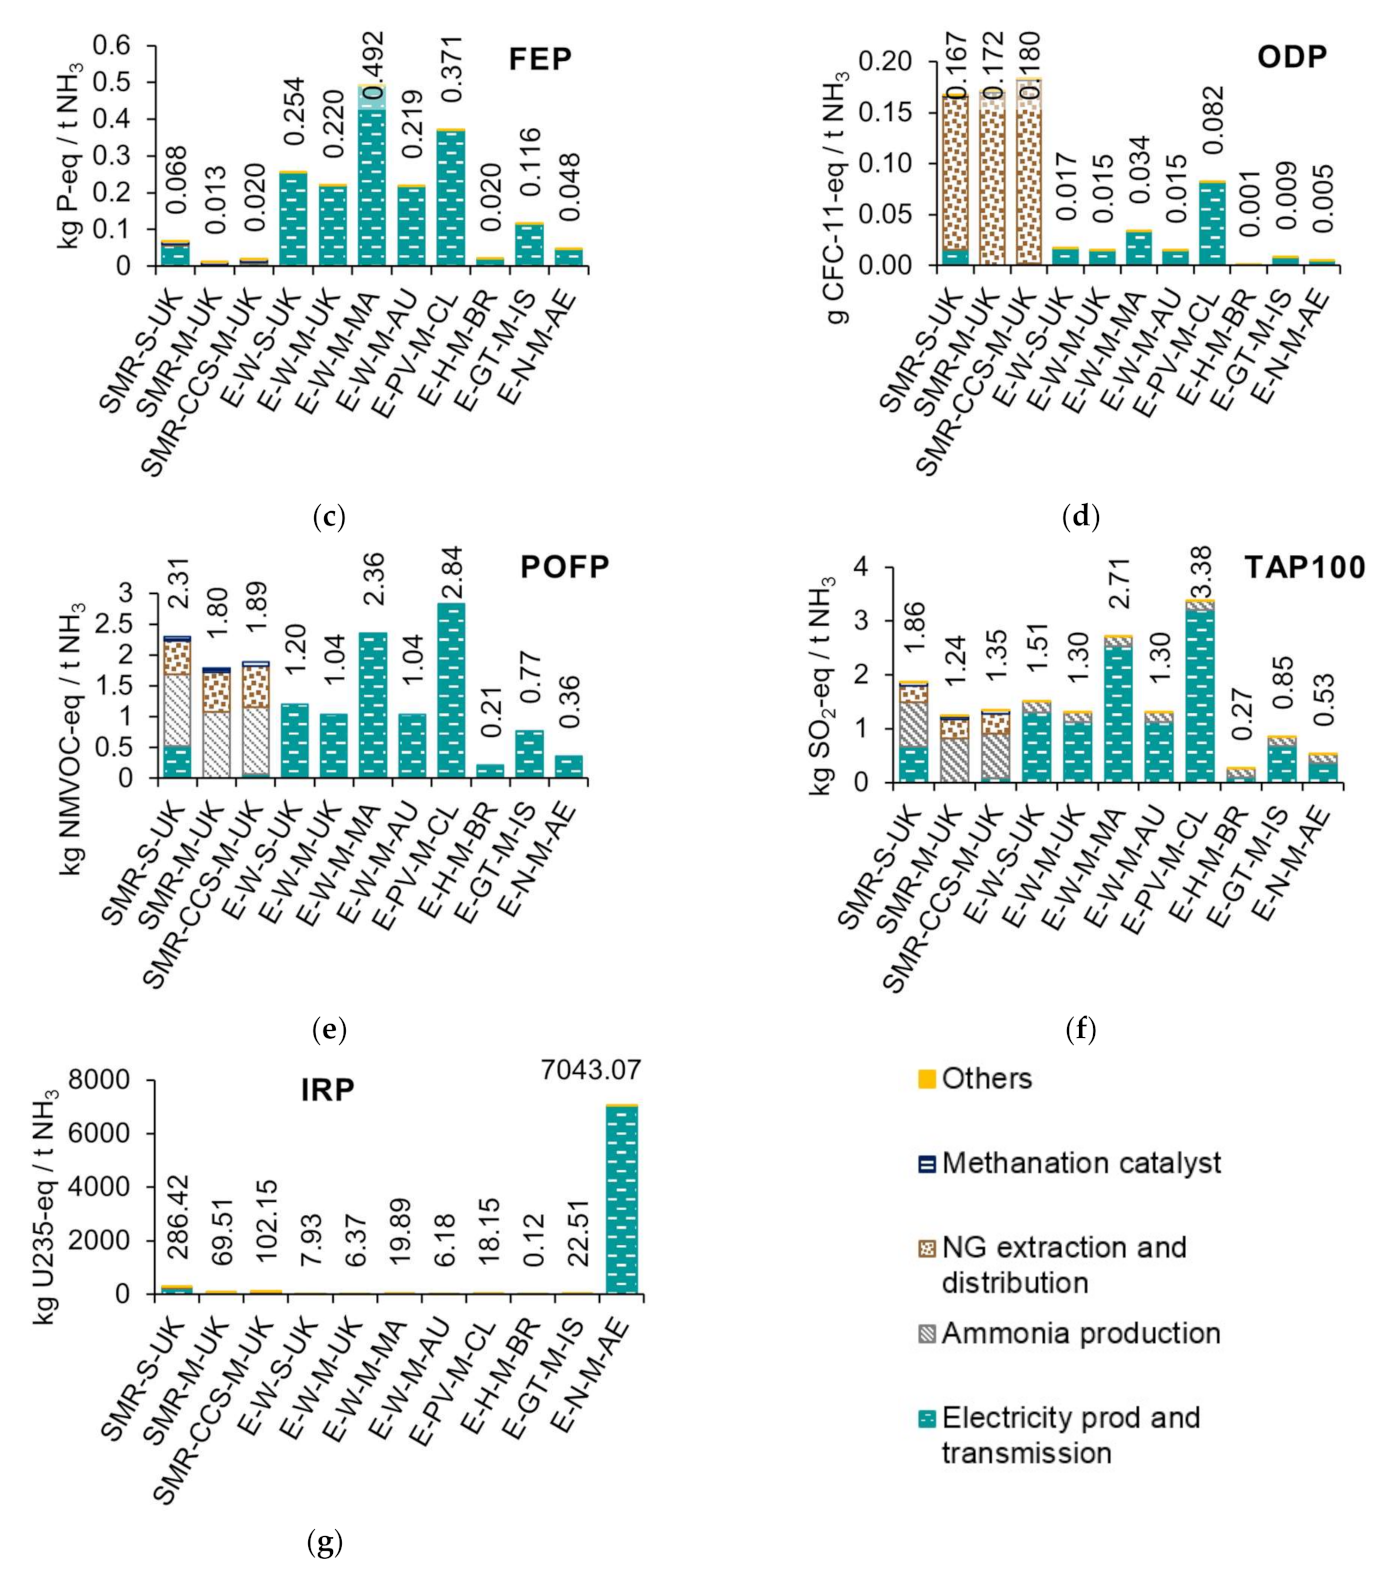
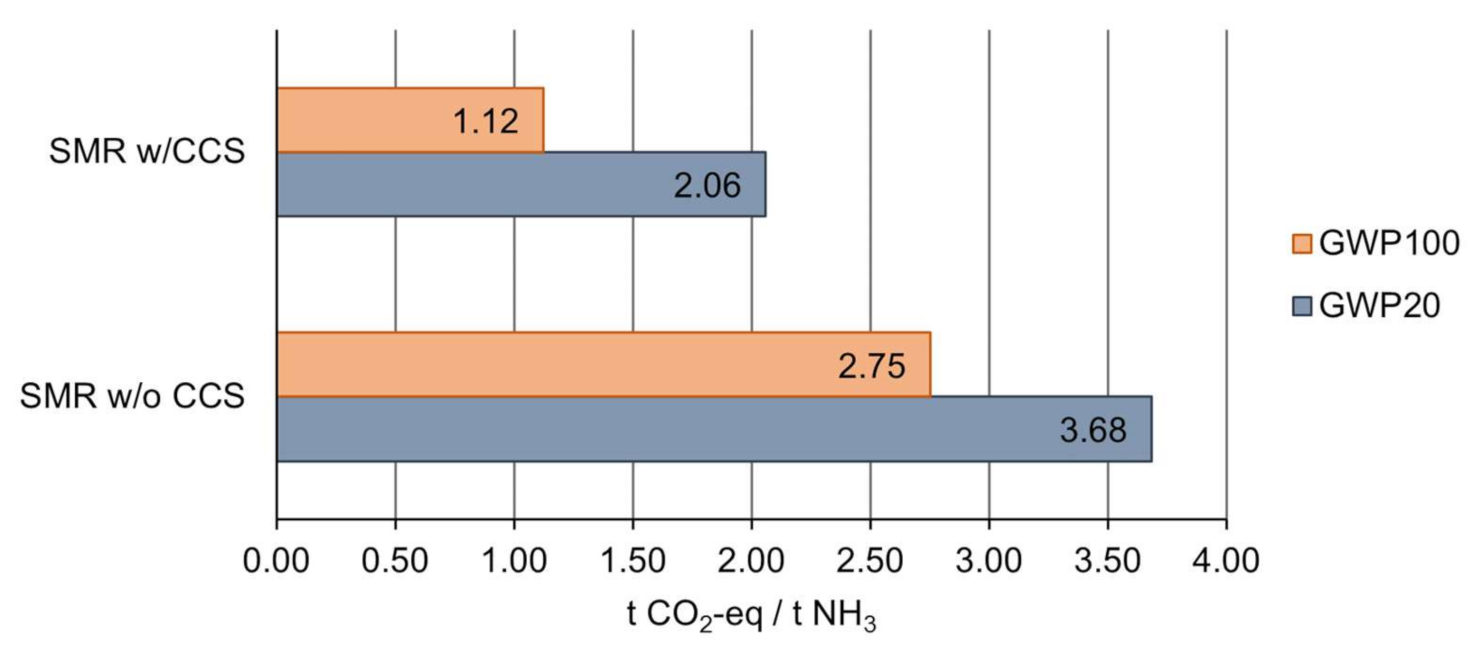
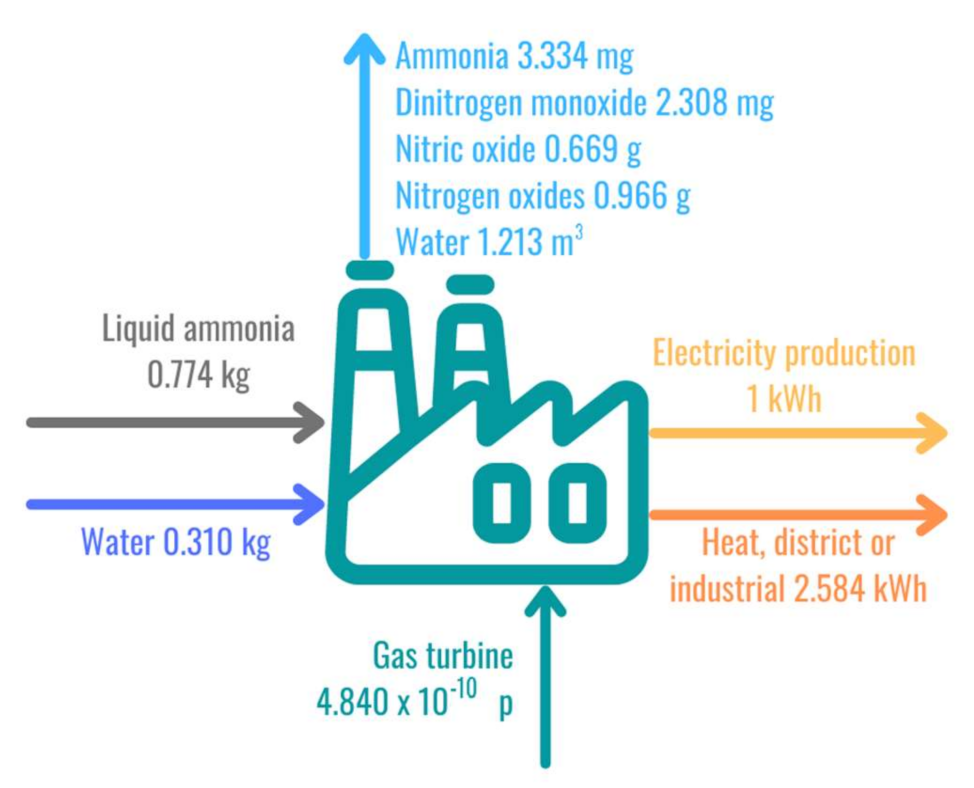
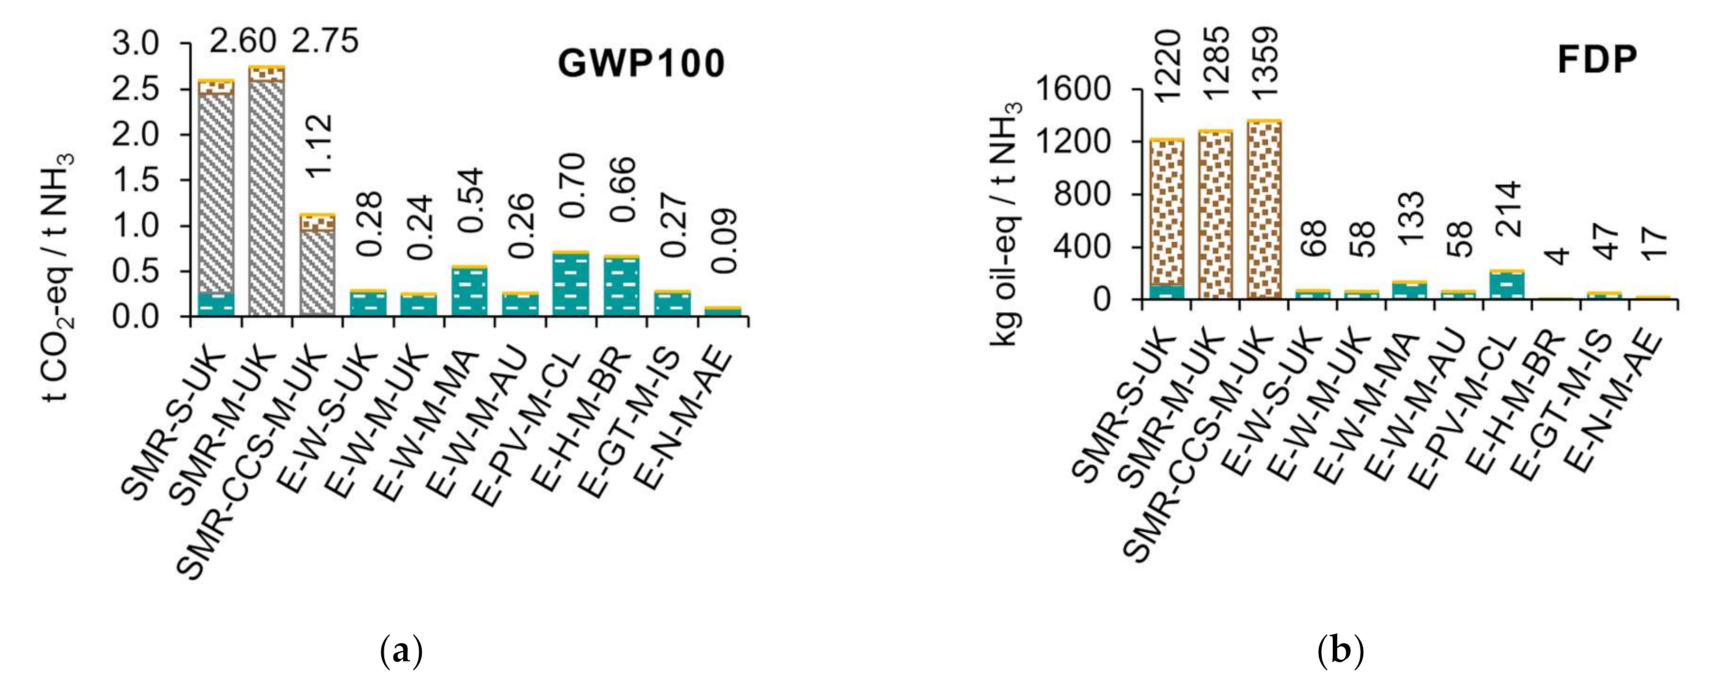
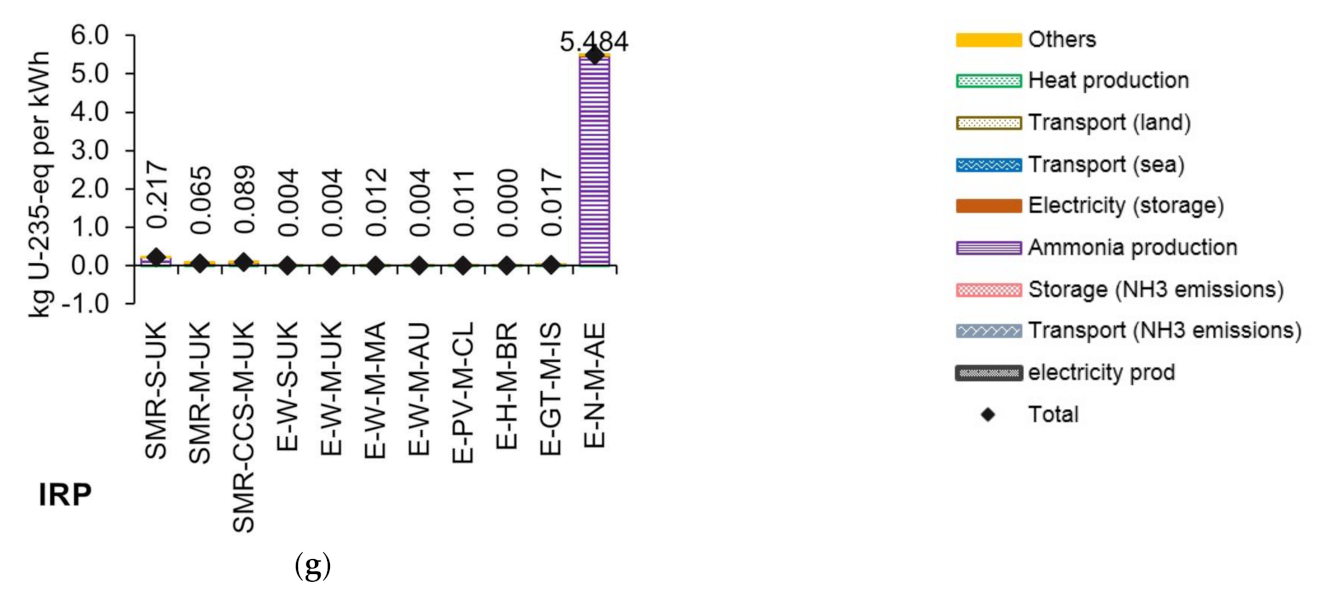
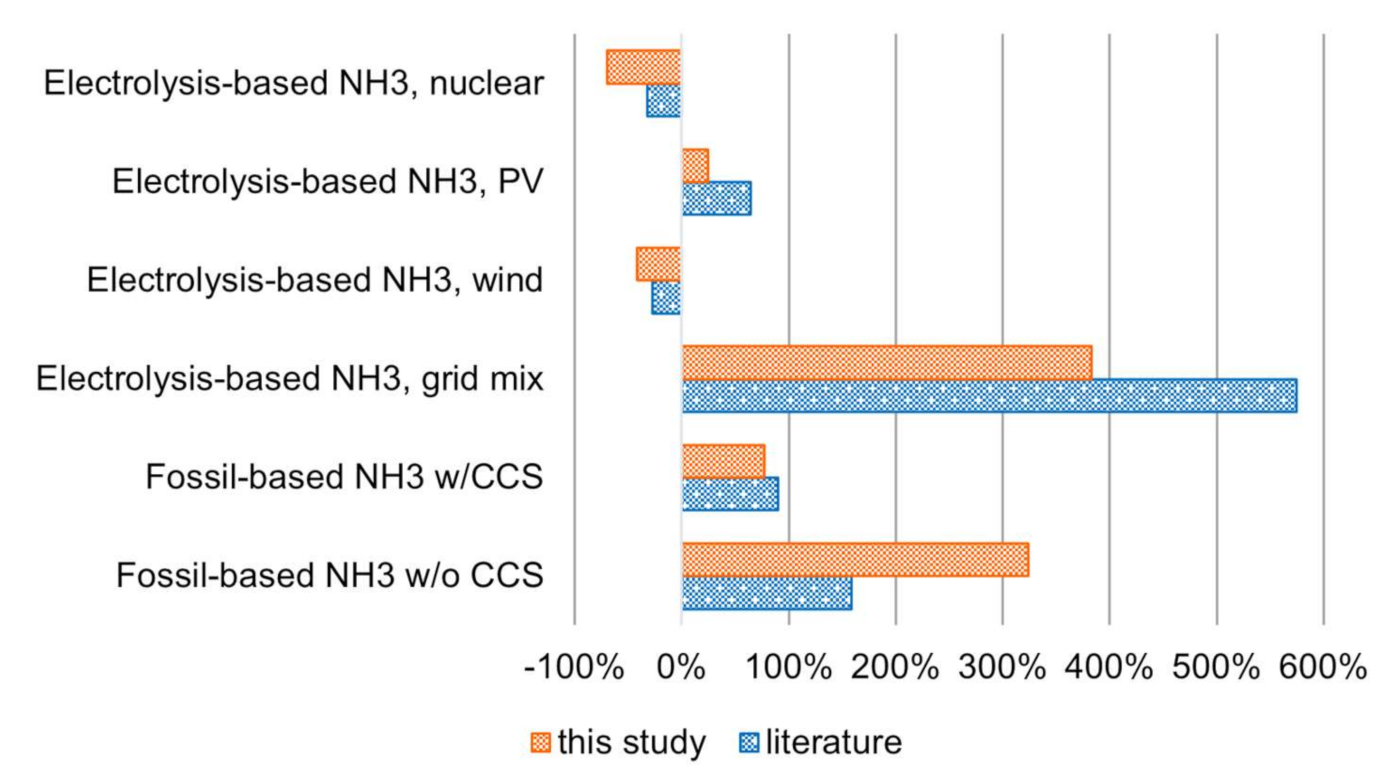
3.1. Life Cycle Impact Assessment of Ammonia Production

Figure 4 shows the impact characterization of the ammonia production system and the contribution of the main processes relative to each impact category. In the present study, most impacts of the electrolysis based-ammonia scenarios are related to the electrolysis process. This agrees with the literature, as the effect of ammonia production depends mainly on the methods used to produce hydrogen [51]; indeed, hydrogen synthesis accounts for around 90% of the carbon emissions for ammonia synthesis [35].
All the LCA studies include mainly GHG emissions metrics (i.e., global warming potential, carbon footprint, climate change). However, few include additional impact categories under different methods, such as CML 2001 [10], Eco-Indicator 99, or ReCiPe [52].
The results show that SMR production pathways have the highest GWP values in general: 2.75 t CO2-eq/t NH3 for mid-scale production, 2.6 t CO2-eq/t NH3 for small-scale. This is due to the use of fossil resource (natural gas) as feedstock and fuel, and thus it is also related to the higher fossil depletion potential (FDP) related to SMR processes. The results for the other scenarios (i.e., all electrolysis based on renewable energy scenarios and CCS scenario) are below 0.7 t CO2-eq/t NH3. For the SMR scenarios, the natural gas extraction and transport is the most relevant process for the FDP: it is related to 94% of FDP in mid-scale production and 84% in small scale. These results are in line with reviewed studies. Ghavam et al. [53] obtained 2.16 t CO2-eq/t NH3. At the same time, Al-Breiki and Bicer [32] found that ammonia production via steam methane reforming with and without carbon capture and storage (CCS) emits 1.68 and 2.24 t CO2-eq/t NH3, respectively.
Adding carbon capture processes to steam reforming improves the performance in terms of carbon emissions. In the present study, when adding CCS, GHG emissions decreased by almost 60%. At the same time, other impact categories were raised (FEP increased by 56%, IRP increased by 47%, others increased less than 8%; this is related to the extra energy needed to run the CCS system). According to Tock [54], there is a small increment in energy consumption due to CCS compressing the carbon dioxide since the CO2 is already separated to purify the H2 in the SMR. However, Dufour et al. [55] found that CCS worsens other environmental impact categories (single score Eco-indicator 95 mPt: GHGs decreased by two-thirds, acidification increased by around half, heavy metals increased by around one-third, winter smog increased by half). Nevertheless, this depends on the energy mix or electricity source.
Hydrogen production is predominant in the environmental profile of ammonia production, especially for the impacts of climate change, fossil depletion, and ozone layer depletion. There are mixed results for blue hydrogen (fossil-based hydrogen with CCS) regarding global warming potential in the literature. Atilhan et al. [56] reported a range from 40 to 90 g CO2-eq per MJ of L-H2. In contrast, Howarth and Jacobson [57] estimated 135 or 139 g CO2-eq per MJ with and without flue-gas capture, respectively, considering a time horizon of 20 years for this indicator. A sensitivity analysis for a 20-year time frame was performed. The results show (Figure 5) that the implementation of CCS entails a reduction of 44% of the carbon footprint of 1 t ammonia via SMR, which is less than previously estimated for GWP100.
This study shows that renewable energy electrolysis-based ammonia has a favorable environmental performance in terms of climate change. Wind-based electrolysis results are between 0.24 and 0.54 t CO2-eq/t NH3. Singh et al. [51] found that ammonia from wind emits 0.496 t CO2-eq/t NH3. In this study, 1 t of hydropower electrolysis-based ammonia emits 0.66 t CO2-eq, solar PV electrolysis-based ammonia resulted in 0.7 t CO2-eq, and geothermal electrolysis-based ammonia resulted in 0.27 t CO2-eq. In previous studies, it was estimated to be 0.38 t CO2-eq per t of hydropower-based ammonia [10] and 1.28 t CO2-eq per t of solar PV ammonia [51]. The GHG emissions are mostly related to the materials and energy needed to build and install the power plant facilities.
Nuclear-based ammonia (pink ammonia) production has the lowest GWP (0.09 t CO2-eq/t NH3). However, the ionizing radiation potential indicator performs very unfavorably (around 7000 kg U235-eq/t NH3 against less than 300 in the other scenarios). Likewise, Bicer and Dincer [58] found that nuclear electrolysis-based ammonia has lower CO2 equivalent emissions than SMR, generating between 0.45 and 0.6 t CO2-eq/t NH3. Still, it worsens the environmental performance in terms of human toxicity. Bicer et al. [10] reported 0.84 t CO2-eq/t NH3, and Karaca et al. [59] reported GWP for different nuclear electrolysis-based ammonia production ranging from 0.18 to 0.337 t CO2-eq/t NH3.

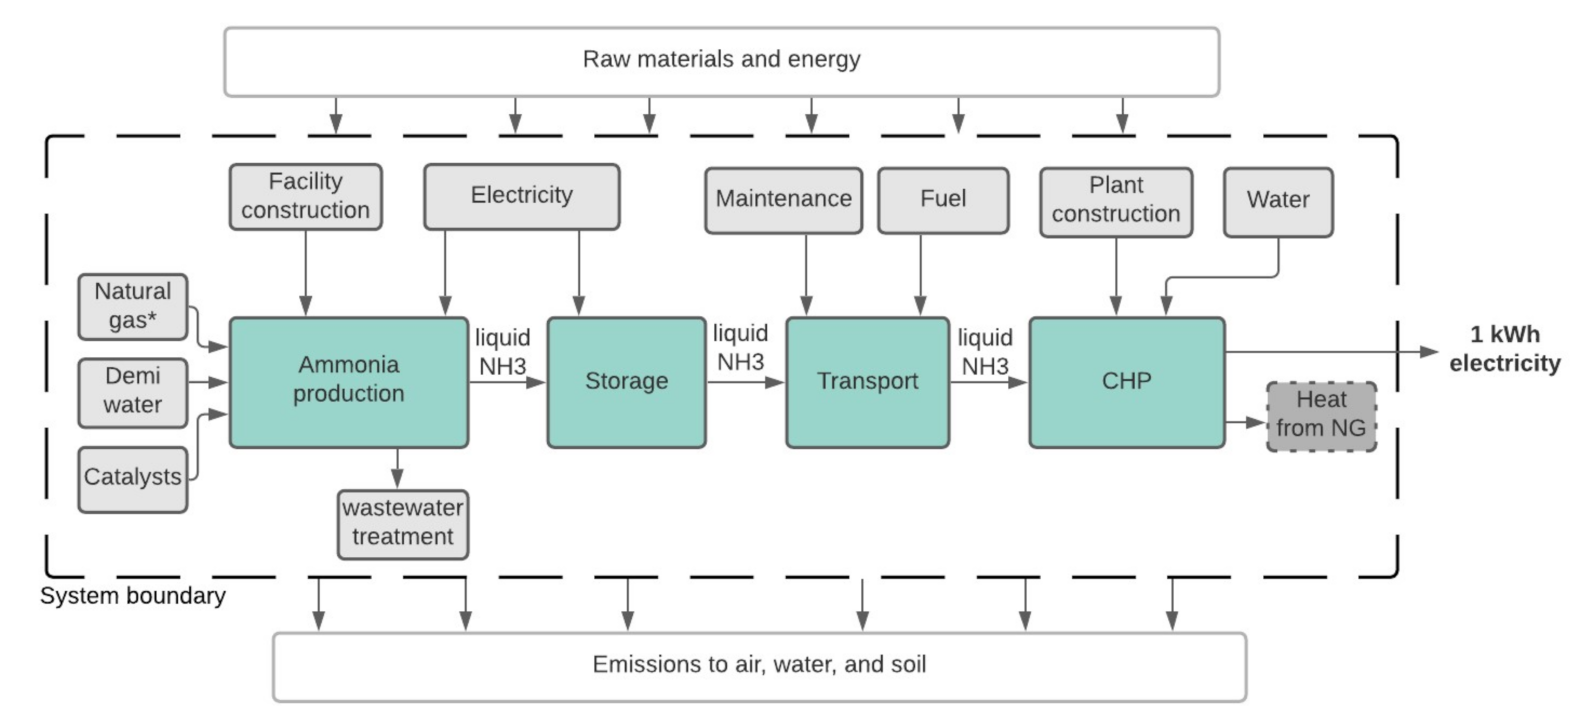
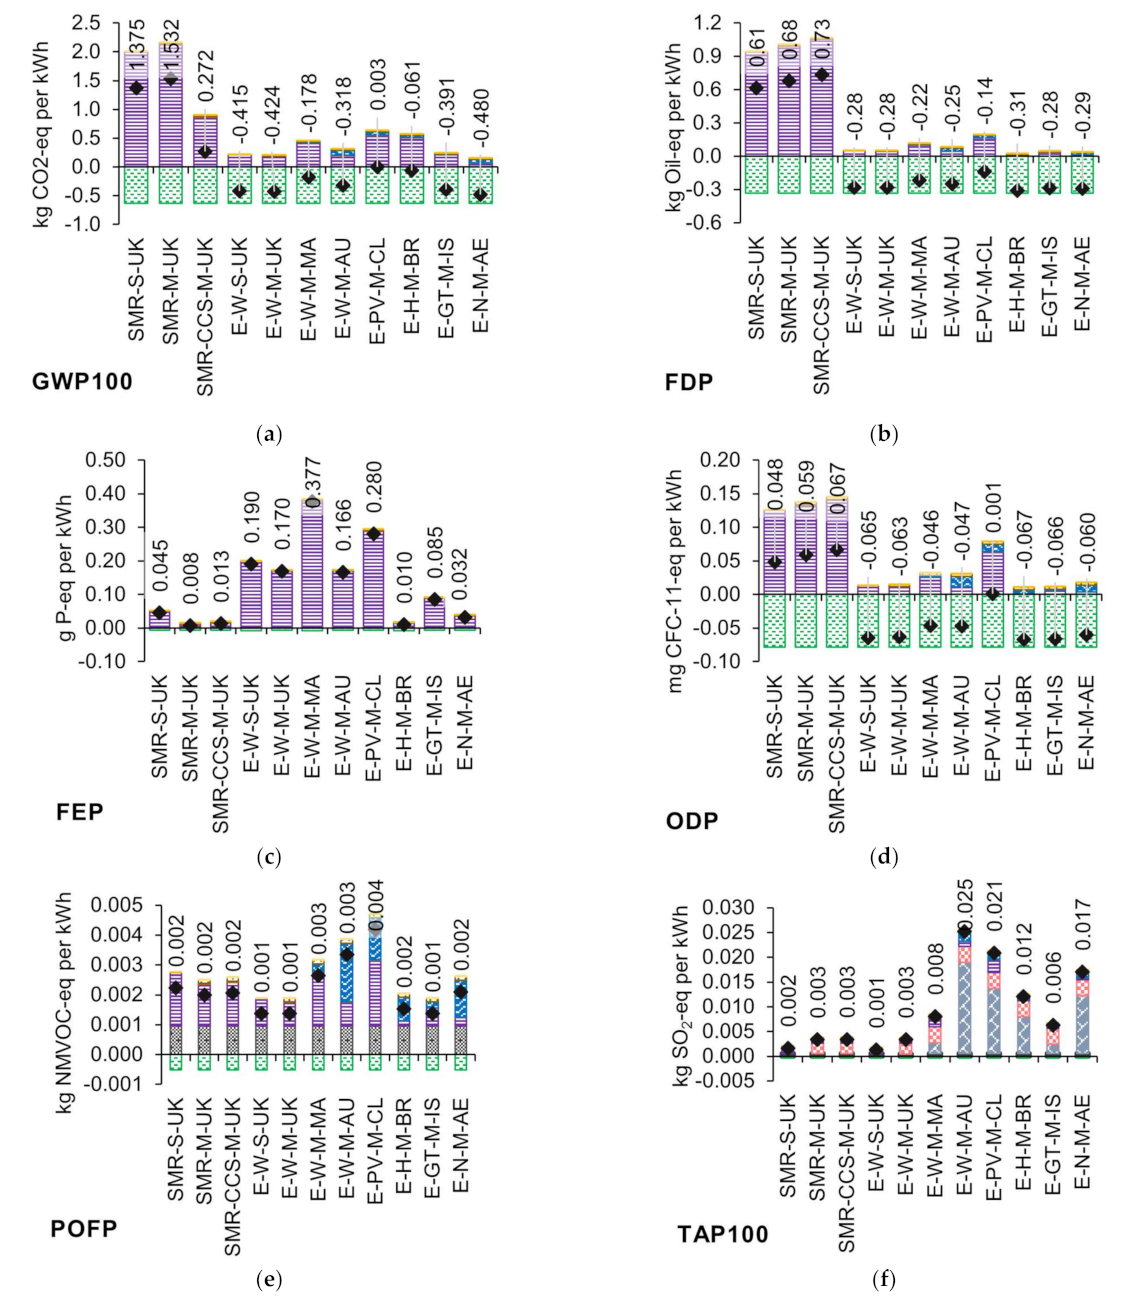
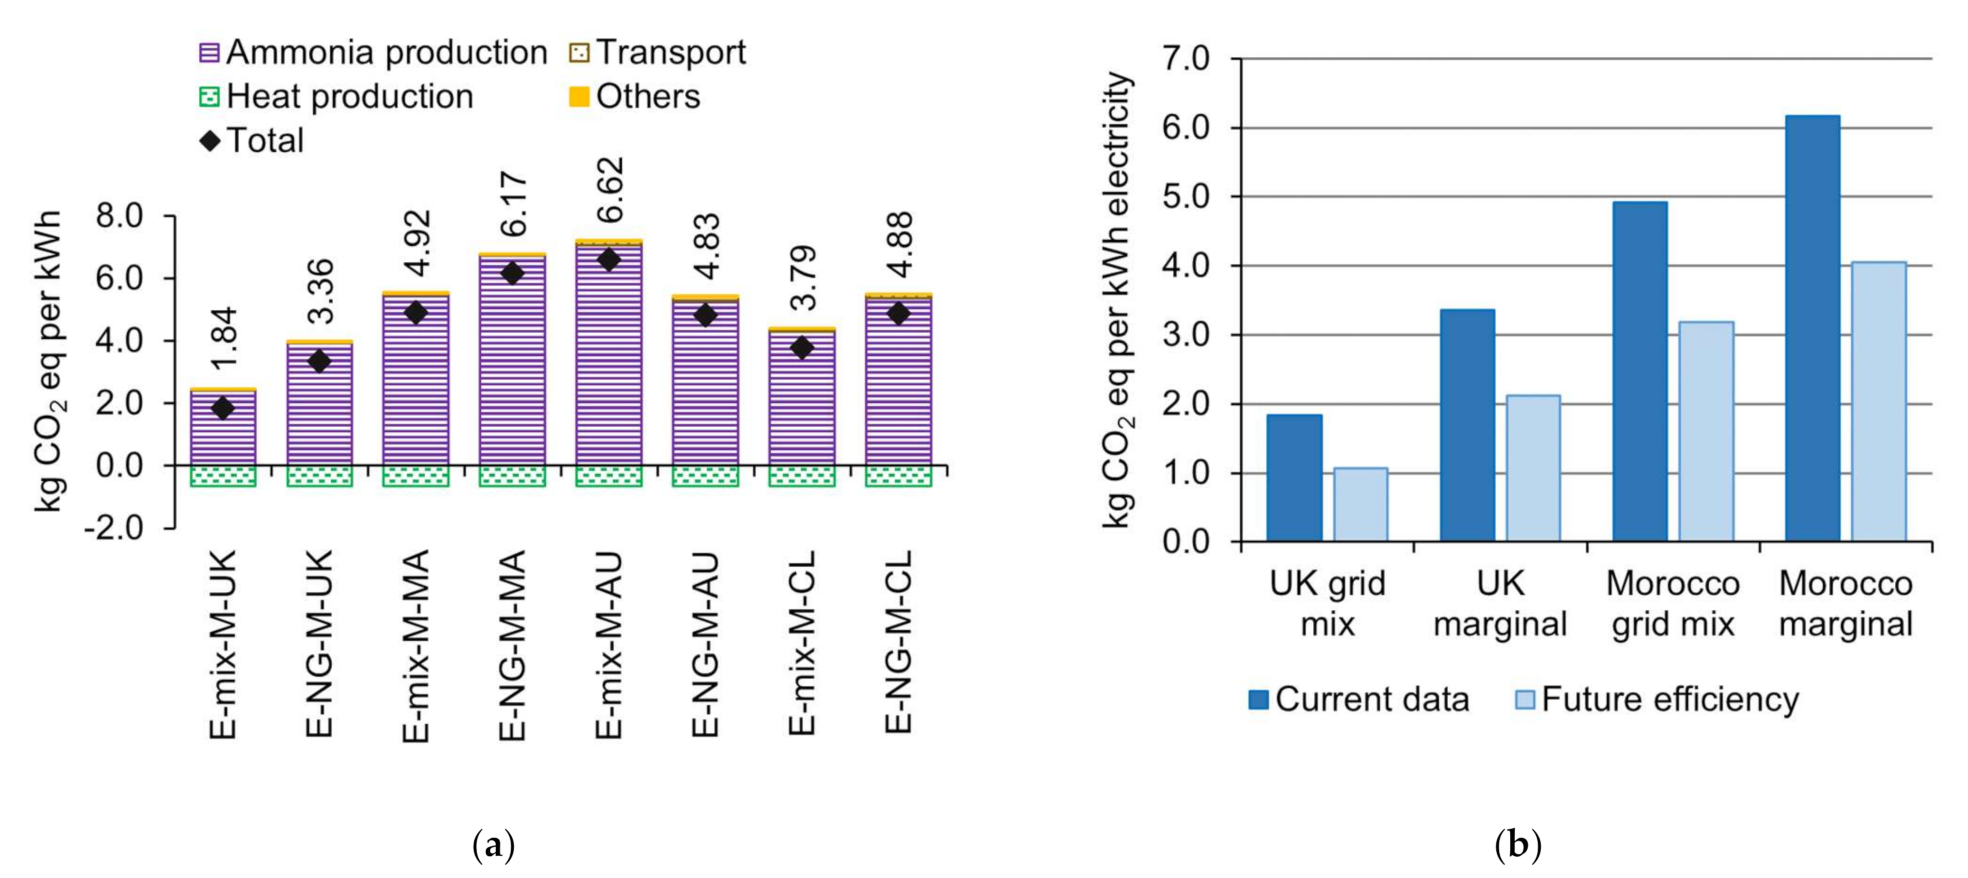
3.2. Life Cycle Impact Assessment of Ammonia-Based Electricity

Figure 6 shows the impact characterization of 1 kWh of electricity based on ammonia. Results show that ammonia production is the main contributor to the environmental impacts of ammonia-based electricity and that the use of surplus heat for district or industrial applications offsets some of the environmental burdens in all impact categories.
Displacement of heat from natural gas for utilization in industrial or domestic applications reduces the carbon footprint of each kWh of electricity-based ammonia in the range of 30% to 400%; therefore, the negative values obtained imply an overall positive impact on the environment. Without considering co-generation, the eight electrolysis-based ammonia scenarios show an advantage over methane-based ammonia, even being below the UK’s grid mix (0.325 kg CO2-eq/kWh) or a conventional gas turbine power plant in the UK (0.511 kg CO2-eq/kWh); values taken from Ecoinvent [34]. Regarding the emissions during transport, the results show that for locations such as Brazil, Chile, UAE, and Australia (distances greater than 3000 nautical miles), the contribution of the emissions during transport is significant (between 7% for hydro from Brazil to 39% for nuclear from UAE). The share contribution of transport depends on the distance and the overall GHG; hence, medium and long distances, combined with the lowest global GHG emissions, resulted in a high percentage contribution from transport emissions. Likewise, the results of Al-Breiki and Bicer [32] show that for 10,000 nmi, the share of carbon emissions during transport is 3% for NH3 from natural gas without CCS and 15% for NH3 from wind electrolysis, while for 20000 nmi, the share increases to 7% and 28%, respectively.
With CCS technology incorporated, the reduction in life cycle carbon emissions of one kWh of electricity reaches 82%, considering a 100-year time horizon. As previously done for ammonia production, the carbon footprint of 1 kWh electricity-based ammonia via SMR was evaluated considering a 20-year time frame. The results indicate a GHG emission reduction of 57%, from 2.2 kg CO2-eq/kWh without CCS to 0.94 kg CO2-eq/kWh with CCS. As denoted by Howarth and Jacobson [57], in terms of carbon footprint, the benefit of CCS is counterbalanced by methane emissions (direct and upstream) and their higher warming potential in the atmosphere over an integrated 20-year period.
For the impact category fossil depletion, a similar trend is observed, except for the scenario with CCS, where there is a slight increase. The extra energy needed to compress and inject the CO2 was modeled from the UK’s grid mix, which has more than 22% renewables and 23% nuclear [34]. Taking the UK country mix as a benchmark (0.145 kg oil-eq/kWh), using methane-based ammonia entails a rise of 6.5 to 7.4 times for this impact (without considering co-generation); in the other scenarios, the comparison ranges from 0.4 to 1.3.
Freshwater eutrophication potential is associated with the emissions of nitrogen (N), phosphorus (P), and other nutrient-rich substances that result in over-fertilization of freshwater bodies, such as lakes, streams, rivers, and reservoirs, among others. In the case of scenarios where renewable energy (wind, PV, and geothermal) is used to produced ammonia, the FEP is 3 to 6.6 times higher than the UK’s grid mix (0.058 g P-eq/kWh [34]). Emissions of phosphates during waste treatment processes of copper, hard coal, and lignite mining are the most significant contributors. Considering the same benchmark, hydro-based ammonia, nuclear-based ammonia, and methane-based ammonia show better results (between 0.3 and 0.9 of the UK’s grid mix results). The use of surplus heat for district/industrial heating denotes marginal benefit.
Regarding the impact category ozone depletion potential, a similar tendency as for climate change and fossil depletion is observed, where methane-based ammonia entails a higher impact than electrolysis-based ammonia. The ODP is linked with stratospheric ozone destruction substances emissions, such as chlorodifluoromethane (HCFC-22) and bromochlorodifluoromethane (Halon 1211), present in the natural gas extraction and transport processes. For this reason, the positive effect of co-generation is more significant (i.e., with co-generation, there is a reduction in the ODP from 56% to 700%). Without the co-generation credits and considering the electricity production from a conventional natural gas power plant in the UK as the reference point (0.036 mg CFC-eq/kWh), the scenarios SMR-CCS-M-UK, SMR-M-UK, SMR-S-UK, and E-PV-M-CL have a higher impact, of 4.1, 3.8, 3.5, and 2.2 times, respectively. In the case of PV-based ammonia, the emissions of CFCs and HCFCs during the manufacturing of the PV cell components contribute to this impact.
Photochemical oxidant formation potential is related to the emission of nitrogen oxides and reactive hydrocarbons that form tropospheric ozone in the presence of sunlight, known as ‘smog.’ Nitrogen compound emissions (NOX, NO) are inherent in ammonia-based electricity production; in this study, the direct emissions during CHP plant operation contribute 9.6 × 10⁻⁴ kg NMVOC-eq per kWh, which represents between 20% and 40% of the total impact for the studied scenarios. It is worth noting that the CHP cycle on which the model was based does not have NOX control equipment; therefore, a reduction of this impact would be expected for commercial operation. Emissions of internal combustion engines for land and sea transport also contribute to this impact, ranging from 4% to 48% of the total.
Terrestrial acidification is the change of soil chemical properties due to the accumulation of acidifying forms of nitrogen and sulfur; the air pollutants NOX, NH3, and SO2 are the main precursors. Small-scale production is favored since there are no fugitive emissions of ammonia related to storage and transport. Ammonia emissions during transport represent 27% of the total impact for the closest location to the UK, Morocco, and up to 73% for Australia.
The excess energy emitted during the spontaneous disintegration of atoms (radioactivity) is known as ionizing radiation. Ionizing radiation exposure could come from natural and human-made sources, and the effect on human health (tissue or organ damage) depends on the type, and dose of radiation received [60]. Nuclear-based ammonia entails the higher impact for this category, 19.8 times the UK’s grid mix (0.278 kg U235-eq/kWh electricity [34]), followed by methane-based ammonia at small-scale production, due to the inflow of electricity from the UK country mix (23% of nuclear [34]).
LCA studies on ammonia as a fuel for transport [11,61,62,63] and power generation [12,15,16,64] are less numerous than studies on ammonia production solely. Even though a straightforward comparison cannot be made due to differences in functional units, impact assessment methods, and in some cases, blends with other fuels, our results show a good agreement with those found in the literature. Bicer and Dincer [12] evaluated the environmental impact of ammonia from wind electrolysis for power generation. They found a reduction in GWP and ODP of 36% and 54%, respectively, while TAP increased 3969% relative to 1 kWh of electricity from a conventional natural gas power plant. In this study, without co-generation, the average impact of 1 kWh of ammonia-based on wind electrolysis is −41%, −36%, and 2629% relative to a natural gas conventional power plant, for GWP, ODP, and TAP, respectively. Razon and Valera-Medina [16] used pure methane as the benchmark for their LCA results of ammonia/methane blends in a gas turbine. A summary of the average percentage difference relative to benchmark they reported for GWP and those found in this study (without co-generation) are shown in Figure 7. The variability between the results of this study and those found in the literature [12,16] corresponds to the uncertainty and variability inherent in all stages of LCA studies regarding system boundaries, assumptions, data sources, and impact assessment methods. However, an agreement is observed in the comparison with the literature, in sign and order of magnitude.
The efficiency of electrolysis-based ammonia is expected to increase in the medium-term future; that should come from the electrolysis step for hydrogen production [19]. More efficient scenarios were modeled for the UK and Morocco (Figure 8). These scenarios show a reduction (8–44%) in all impact categories for 1 kWh of ammonia-based electricity for the UK and Morocco. Current data show an average of 9.5 MWh is used to produce 1 t of liquid ammonia, whereas in the more efficient scenario, an energy input of 6.5 MWh per t of liquid NH3 was included [19].
To contribute to the decarbonization of power and transport sectors, it is evident that ammonia via electrolysis is more favorable than ammonia via SMR and even with CCS. Considering the future demand for ammonia will likely be significantly higher by 2050, much more than the present supply capacity [39], a secondary analysis of the GWP of electrolysis-based ammonia using the grid mix and marginal electricity was developed. As seen in Figure 9, electricity production from electrolysis-based ammonia from non-renewable sources entails a higher carbon footprint for all the studied scenarios. With a lower carbon grid mix, such as the UK’s, the GWP is lower, 1.835 kg CO2-eq per kWh, but still much higher than that of the UK’s grid mix or a conventional natural gas power plant, 0.325 and 0.511 kg CO2-eq per kWh, respectively. Considering a future more efficient electrolysis- and Haber–Bosch-based process, an average reduction of the GWP is projected (37%). However, the carbon footprint in the base case scenario is twice the conventional natural gas plant reference point. In comparison, with electricity from renewable and nuclear-based ammonia, the GWP is much lower.

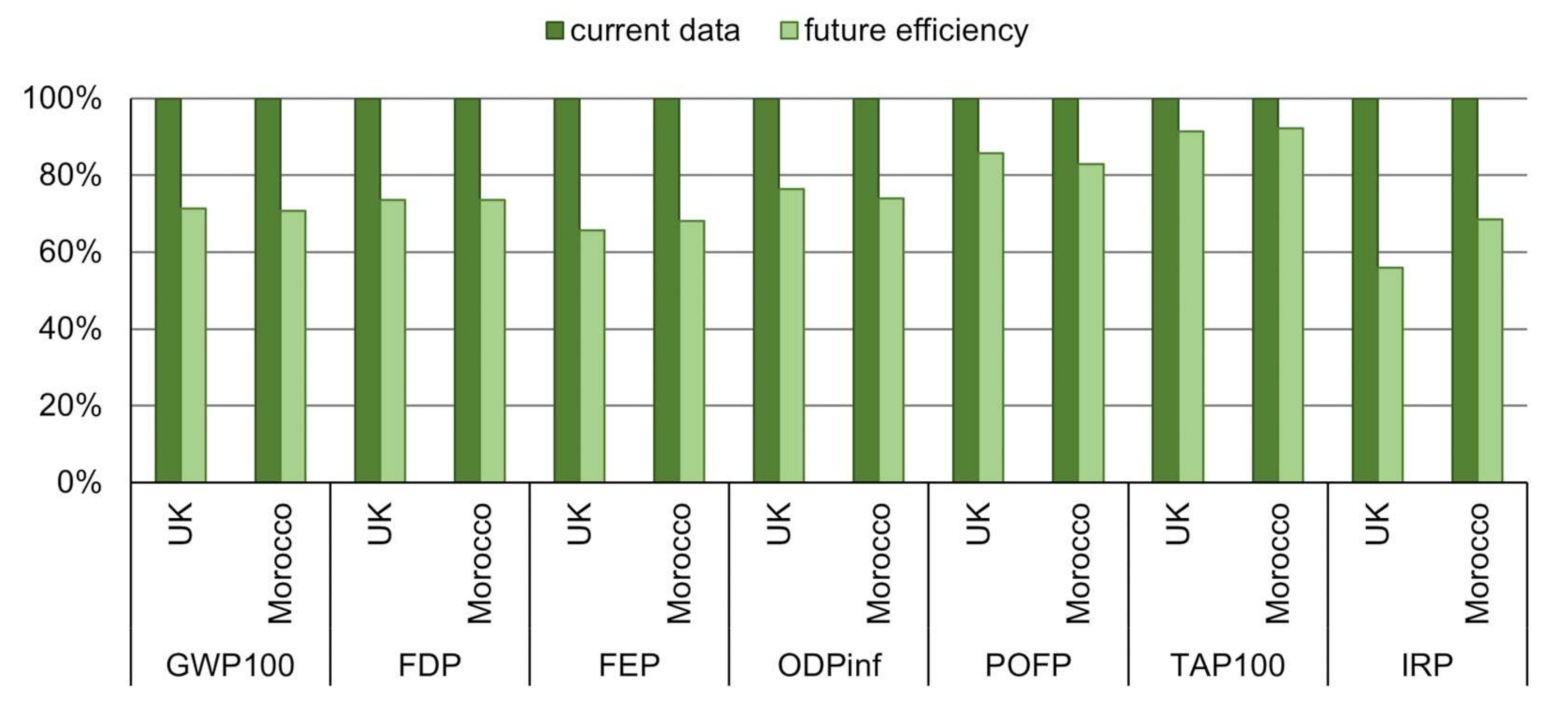
3.3. Limitations and Recommendations for Further Research

As seen from the sensitivity analysis of GWP20, upstream processes and their associated emissions, such as the fugitive emissions of the extraction and distribution of natural gas, have an important contribution to the environmental profile of energy systems. Therefore, using secondary information for these processes could imply a limitation of this study regarding the ammonia systems based on natural gas. In the literature, various researchers [65,66] observed a high variability (several orders of magnitude) of fugitive methane emissions and their impact on climate change associated with the upstream processes of the natural gas supply chain. The results of the natural gas-based ammonia and natural gas ammonia-based electricity could be higher if the fugitive emissions are significantly higher.
Even though the use of heat output for industrial or domestic applications enhances the studied cycle’s environmental profile, particularly for GWP, FDP, and ODP, further research is needed for systems that only produce electricity. This would deepen the understanding of the ecological implications of the use of ammonia for large power generation.
The characterization of the life cycle impacts of the power cycle was based on simulated results; therefore, as experimental or small-scale ammonia to power systems go into operation, real emissions and performance data should be used to update the present findings.
One of the by-products that could be obtained is water with high nitrogen levels, which could be used as fertilizer, and the potential benefit should be studied in more detail.
In the present study, transport and distribution were included using a LCI database with conventional technologies (fossil-based); however, transport’s contribution could be significant for specific impact categories (GWP, FDP, ODP, POFP), especially for renewable or nuclear-based ammonia, because of their low environmental impact. Further research is needed to integrate ammonia-based sea transport in the assessment. Indeed, as ammonia could become an essential factor in the energy mix, and electricity is a fundamental input in the life cycle of most of products, its impact should be reassessed, especially for very low-emission ammonia systems such as renewable or nuclear-based.

4. Conclusions

The environmental performance of a novel application of ammonia (NH3) as an energy carrier was evaluated using a life cycle approach, comparing methane-based and water-based ammonia through various scenarios (combining different technologies, locations, and resources). This study shows that the ammonia production process is critical to any system that uses it. Two levels of analysis are presented: ammonia production and ammonia-based electricity production.
The results show that contributing significantly to the power sector’s decarbonization is only possible with electrolysis-based ammonia from renewable or nuclear sources. However, climate change is not the only thing that affects the environment, and if other environmental impacts are considered, there is a negative impact due to the use of ammonia from renewable or nuclear sources. This is due, in part, to the inherent emissions of nitrogen substances and the amount of energy needed for ammonia production. There could be a significant potential reduction of this negative impact with an increase in the efficiency of the electrolysis—Haber–Bosch technology. Nuclear-based ammonia performs very unfavorably regarding ionizing radiation potential.
CCS technology is seen as a viable option during the transition to a low-carbon energy market; however, the potential benefit could be less than previously estimated if a shorter time frame for GWP is used. This is especially significant in methane-based systems, such as in the production of blue ammonia and its applications, due to the higher contribution to global warming of methane emissions. Moreover, due to the extra energy needed for the process, blue ammonia’s environmental profile worsens compared with gray ammonia’s.
Although the results of this study are consistent with the rest of the literature, there may be some variability, due to the use of secondary information for upstream processes and simulated data for the power cycle, which may affect the impact indicators. Thus, further research is required on those critical aspects in order to fully grasp the benefits and drawbacks of ammonia as energy carrier.
In general, ammonia-based electricity production presents a favorable environmental profile, specifically with technologies such as hydropower and geothermal. However, this benefit could be improved by mitigating the emissions associated with the transport of ammonia. Consequently, the development of an ammonia production facility relatively close to the final users, a regional-level system, would enhance the positive effects of ammonia as an energy carrier. In addition, research and development is needed in order to analyze from a technical and environmental perspective the use of ammonia as a fuel for sea transportation, which would enhance the environmental performance of green ammonia.

Supplementary Materials

The following are available online at https://www.mdpi.com/article/10.3390/en14206721/s1, Table S1: Life cycle inventory (LCI) of ammonia production, FU 1 t of liquid NH3, Table S2: Life cycle inventory of ammonia storage and transport, FU 1 t of liquid NH3, and Table S3: Life cycle inventory of ammonia-based power generation, FU 1 kWh of electricity.

Author Contributions

Conceptualization, A.J.B., A.V.-M. and A.D.R.; investigation, A.J.B.; methodology, A.J.B. and A.D.R.; project administration, A.D.R.; resources, K.K., M.K., J.M., S.M., M.T. and K.R.; supervision, A.V.-M. and A.D.R.; visualization, A.J.B.; writing—original draft, A.J.B., D.A.S. and A.V.-M.; writing—review and editing, A.V.-M. and A.D.R. All authors have read and agreed to the published version of the manuscript.

Funding

The APC was funded by Escuela Superior Politecnica del Litoral, ESPOL.

Data Availability Statement

The data presented in this study are available in Supplementary Materials.

Conflicts of Interest

The authors declare no conflict of interest.

Abbreviations

ASUair separation unit
CCScarbon capture and storage
CFCchlorofluorocarbon
CHPcombined heat and power
CO2carbon dioxide
FDPfossil depletion potential
FEPfreshwater eutrophication potential
GHGgreenhouse gas
GWPglobal warming potential
H2hydrogen
IRPionizing radiation potential
ISOInternational Organization for Standardization
LCAlife cycle assessment
LCIlife cycle inventory
LCIAlife cycle impact assessment
Nnitrogen
NH3ammonia
NMVOCnon-methane volatile organic compounds
NOnitrogen monoxide
NOXnitrogen oxides
N2Onitrous oxide
ODPozone depletion potential
Pphosphorous
POFPphotochemical oxidant formation potential
PVphotovoltaic
SMRsteam methane reforming
SO2sulphur dioxide
TAPterrestrial acidification potential
UKUnited Kingdom
U235uranium-235

References

  1. Valera-Medina, A.; Xiao, H.; Owen-Jones, M.; David, W.I.F.; Bowen, P.J. Ammonia for power. Prog. Energy Combust. Sci. 2018, 69, 63–102. [Google Scholar] [CrossRef]
  2. Elishav, O.; Lis, B.M.; Miller, E.M.; Arent, D.J.; Valera-Medina, A.; Dana, A.G.; Shter, G.E.; Grader, G.S. Progress and Prospective of Nitrogen-Based Alternative Fuels. Chem. Rev. 2020, 120, 5352–5436. [Google Scholar] [CrossRef] [PubMed]
  3. Valera-Medina, A.; Amer-Hatem, F.; Azad, A.K.; Dedoussi, I.C.; De Joannon, M.; Fernandes, R.X.; Glarborg, P.; Hashemi, H.; He, X.; Mashruk, S.; et al. Review on ammonia as a potential fuel: From synthesis to economics. Energy Fuels 2021, 35, 6964–7029. [Google Scholar] [CrossRef]
  4. Lhuillier, C.; Brequigny, P.; Lamoureux, N.; Contino, F.; Mounaïm-Rousselle, C. Experimental investigation on laminar burning velocities of ammonia/hydrogen/air mixtures at elevated temperatures. Fuel 2020, 263, 116653. [Google Scholar] [CrossRef] [Green Version]
  5. Valera-Medina, A.; Banares-Alcantara, R. Techno-Economic Challenges of Green Ammonia as an Energy Vector; Valera-Medina, A., Banares-Alcantara, R., Eds.; Elsevier Inc.: London, UK, 2021; ISBN 978-0-12-820560-0. [Google Scholar]
  6. Fasihi, M.; Weiss, R.; Savolainen, J.; Breyer, C. Global potential of green ammonia based on hybrid PV-wind power plants. Appl. Energy 2021, 294, 116170. [Google Scholar] [CrossRef]
  7. Det Norske Veritas (DNV). Maritime Forecast to 2050. Energy Transition Outlook 2019; Det Norske Veritas (DNV): Bærum, Norway, 2018; p. 118. [Google Scholar]
  8. Raucci, C.; Bonello, J.-M.; Suarez De La Fuente, S.; Smith, T.; Sogaard, K. Aggregate Investment for the Decarbonisation of the Shipping Industry; UMAS: London, UK, 2020. [Google Scholar]
  9. Wei, Z.; En-ke, A. Life cycle analysis of coal-based ammonia fuel for vehicular application. J. China Coal Soc. 2010, 1, 46. [Google Scholar]
  10. Bicer, Y.; Dincer, I.; Zamfirescu, C.; Vezina, G.; Raso, F. Comparative life cycle assessment of various ammonia production methods. J. Clean. Prod. 2016, 135, 1379–1395. [Google Scholar] [CrossRef]
  11. Bicer, Y.; Dincer, I. Life cycle evaluation of hydrogen and other potential fuels for aircrafts. Int. J. Hydrogen Energy 2017, 42, 10722–10738. [Google Scholar] [CrossRef]
  12. Bicer, Y.; Dincer, I. Life cycle assessment of ammonia utilization in city transportation and power generation. J. Clean. Prod. 2018, 170, 1594–1601. [Google Scholar] [CrossRef]
  13. Bicer, Y.; Dincer, I. Clean fuel options with hydrogen for sea transportation: A life cycle approach. Int. J. Hydrogen Energy 2018, 43, 1179–1193. [Google Scholar] [CrossRef]
  14. Bicer, Y.; Dincer, I.; Vezina, G. Comprehensive Evaluation of NH3 Production and Utilization Options for Clean Energy Applications. In Proceedings of the AIChe Annual Meeting, Topical Conference: NH3 Energy, Minneapolis, MN, USA, 1 November 2017. [Google Scholar]
  15. Cox, B.; Treyer, K. Environmental and economic assessment of a cracked ammonia fuelled alkaline fuel cell for off-grid power applications. J. Power Sources 2015, 275, 322–335. [Google Scholar] [CrossRef]
  16. Razon, L.F.; Valera-Medina, A. A Comparative Environmental Life Cycle Assessment of the Combustion of Ammonia/Methane Fuels in a Tangential Swirl Burner. Front. Chem. Eng. 2021, 3, 1–13. [Google Scholar] [CrossRef]
  17. Xue, M.; Wang, Q.; Lin, B.-L.; Tsunemi, K. Assessment of Ammonia as an Energy Carrier from the Perspective of Carbon and Nitrogen Footprints. ACS Sustain. Chem. Eng. 2019, 7, 12494–12500. [Google Scholar] [CrossRef]
  18. Pfromm, P.H. Towards sustainable agriculture: Fossil-free ammonia. J. Renew. Sustain. Energy 2017, 9, 034702. [Google Scholar] [CrossRef] [Green Version]
  19. Smith, C.; Hill, A.K.; Torrente-Murciano, L. Current and future role of Haber-Bosch ammonia in a carbon-free energy landscape. Energy Environ. Sci. 2020, 13, 331–344. [Google Scholar] [CrossRef]
  20. Keller, M.; Koshi, M.; Otomo, J.; Iwasaki, H.; Mitsumori, T.; Yamada, K. Thermodynamic evaluation of an ammonia-fueled combined-cycle gas turbine process operated under fuel-rich conditions. Energy 2020, 194, 116894. [Google Scholar] [CrossRef]
  21. Mashruk, S.; Xiao, H.; Valera-Medina, A. Rich-Quench-Lean model comparison for the clean use of humidified ammonia/hydrogen combustion systems. Int. J. Hydrogen Energy 2021, 46, 4472–4484. [Google Scholar] [CrossRef]
  22. Guteša Božo, M.; Mashruk, S.; Zitouni, S.; Valera-Medina, A. Humidified ammonia/hydrogen RQL combustion in a trigeneration gas turbine cycle. Energy Convers. Manag. 2021, 227, 113625. [Google Scholar] [CrossRef]
  23. Cesaro, Z.; Ives, M.; Nayak-Luke, R.; Mason, M.; Bañares-Alcántara, R. Ammonia to power: Forecasting the levelized cost of electricity from green ammonia in large-scale power plants. Appl. Energy 2021, 282, 116009. [Google Scholar] [CrossRef]
  24. ISO. ISO 14040:2006. Environmental Management—Life Cycle Assessment—Principles and Framework; ISO: Geneva, Switzerland, 2006. [Google Scholar]
  25. ISO. ISO 14044:2006. Environmental Management—Life Cycle Assessment—Requirements and Guidelines; ISO: Geneva, Switzerland, 2006. [Google Scholar]
  26. Varun; Bhat, I.K.; Prakash, R. LCA of renewable energy for electricity generation systems—A review. Renew. Sustain. Energy Rev. 2009, 13, 1067–1073. [Google Scholar] [CrossRef]
  27. Barros, M.V.; Salvador, R.; Piekarski, C.M.; de Francisco, A.C.; Freire, F.M.C.S. Life cycle assessment of electricity generation: A review of the characteristics of existing literature. Int. J. Life Cycle Assess. 2020, 25, 36–54. [Google Scholar] [CrossRef]
  28. Ramirez, A.D.; Boero, A.; Rivela, B.; Melendres, A.M.; Espinoza, S.; Salas, D.A. Life cycle methods to analyze the environmental sustainability of electricity generation in Ecuador: Is decarbonization the right path? Renew. Sustain. Energy Rev. 2020, 134, 11. [Google Scholar] [CrossRef]
  29. Proton Ventures B.V. Small Scale Ammonia Plant Design and Applications; Hands, R., Connock, L., Eds.; Nitrogen+Syngas: London, UK, 2018; pp. 1–10. [Google Scholar]
  30. European Commission. Reference Document on Best Available Techniques for the Manufacture of Large Volume Inorganic Chemicals -Ammonia, Acids and Fertilisers. The Best Available Tech. Ref. Doc. 2007, I, 513–527. [Google Scholar]
  31. Chisalita, D.; Petrescu, L.; Cormos, C. Environmental evaluation of european ammonia production considering various hydrogen supply chains. Renew. Sustain. Energy Rev. 2020, 130, 109964. [Google Scholar] [CrossRef]
  32. Al-Breiki, M.; Bicer, Y. Comparative life cycle assessment of sustainable energy carriers including production, storage, overseas transport and utilization. J. Clean. Prod. 2021, 279, 123481. [Google Scholar] [CrossRef]
  33. Al-Breiki, M.; Bicer, Y. Investigating the technical feasibility of various energy carriers for alternative and sustainable overseas energy transport scenarios. Energy Convers. Manag. 2020, 209, 112652. [Google Scholar] [CrossRef]
  34. Ecoinvent Ecoinvent 3.7.1 Database 2020. Available online: https://ecoinvent.org/the-ecoinvent-database/data-releases/ecoinvent-3-7-1/ (accessed on 30 January 2021).
  35. Bird, F.; Clarke, A.; Davies, P.; Surkovic, E. Ammonia: Zero-Carbon Fertiliser, Fuel and Energy Store. Policy Briefing; The Royal Society: London, UK, 2020; ISBN 9781782524489. [Google Scholar]
  36. Rouwenhorst, K.H.R.; Krzywda, P.M.; Benes, N.E.; Mul, G.; Lefferts, L. Ammonia Production Technologies. In Techno-Economic Challenges of Green Ammonia as an Energy Vector; Valera-Medina, A., Bañares-Alcántara, R., Eds.; Academic Press: Cambridge, MA, USA, 2021; pp. 41–83. [Google Scholar] [CrossRef]
  37. Fúnez Guerra, C.; Reyes-Bozo, L.; Vyhmeister, E.; Jaén Caparrós, M.; Salazar, J.L.; Clemente-Jul, C. Technical-economic analysis for a green ammonia production plant in Chile and its subsequent transport to Japan. Renew. Energy 2020, 157, 404–414. [Google Scholar] [CrossRef]
  38. Salmon, N.; Bañares-Alcántara, R.; Nayak-Luke, R. Optimization of green ammonia distribution systems for intercontinental energy transport. iScience 2021, 24, 102903. [Google Scholar] [CrossRef]
  39. Salmon, N.; Bañares-Alcántara, R. Green ammonia as a spatial energy vector: A review. Sustain. Energy Fuels 2021, 5, 2814–2839. [Google Scholar] [CrossRef]
  40. Reuters Australia Chases Green Ammonia for Power in Near-Term Hydrogen Push 2021. Available online: https://www.reuters.com/business/energy/australia-chases-green-ammonia-power-near-term-hydrogen-push-2021-05-13/ (accessed on 5 September 2021).
  41. Arora, P.; Hoadley, A.F.A.; Mahajani, S.M.; Ganesh, A. Multi-objective optimization of biomass based ammonia production-Potential and perspective in different countries. J. Clean. Prod. 2017, 148, 363–374. [Google Scholar] [CrossRef]
  42. Boulakhbar, M.; Lebrouhi, B.; Kousksou, T.; Smouh, S.; Jamil, A.; Maaroufi, M.; Zazi, M. Towards a large-scale integration of renewable energies in Morocco. J. Energy Storage 2020, 32, 101806. [Google Scholar] [CrossRef]
  43. Atchison, J. 183,000 Tonnes per Year Green Ammonia in Morocco. Available online: https://www.ammoniaenergy.org/articles/183000-tonnes-per-year-green-ammonia-in-morocco/ (accessed on 5 September 2021).
  44. Armijo, J.; Philibert, C. Flexible production of green hydrogen and ammonia from variable solar and wind energy: Case study of Chile and Argentina. Int. J. Hydrogen Energy 2020, 45, 1541–1558. [Google Scholar] [CrossRef]
  45. Heynes, G. Green Hydrogen and Ammonia Mega Project Welcomed by Chilean Ministry of Energy. Available online: https://www.h2-view.com/story/green-hydrogen-and-ammonia-mega-project-welcomed-by-chilean-ministry-of-energy/?origin=mobileSearch (accessed on 5 September 2021).
  46. Reuters UAE’s only Nuclear Power Plant Begins Operations at 2nd Unit 2021. Available online: https://www.reuters.com/world/middle-east/uaes-only-nuclear-power-plant-begins-operations-2nd-unit-2021-08-27/ (accessed on 5 September 2021).
  47. Atchison, J. The Ammonia Wrap: Two New Large-Scale Ammonia Projects in the UAE and More-Ammonia Energy Association. Available online: https://www.ammoniaenergy.org/articles/the-ammonia-wrap-two-new-large-scale-ammonia-projects-in-the-uae-and-more/ (accessed on 5 September 2021).
  48. Osman, O.; Sgouridis, S. Optimizing the production of ammonia as an energy carrier in the UAE. In Proceedings of the 2018 5th International Conference on Renewable Energy: Generation and Applications (ICREGA), Al Ain, United Arab Emirates, 25–28 February 2018; pp. 277–280. [Google Scholar] [CrossRef]
  49. National Institute for Public Health and the Environment. ReCiPe 2016 v1.1; RIVM Report 2016-0104; National Institute for Public Health and the Environment: Bilthoven, The Netherlands, 2017; pp. 1–201.
  50. GreenDelta OpenLCA v1.10.3 2019. Available online: https://www.openlca.org/openlca/ (accessed on 30 January 2021).
  51. Singh, V.; Dincer, I.; Rosen, M.A. Life Cycle Assessment of Ammonia Production Methods. In Exergetic, Energetic and Environmental Dimensions; Elsevier: Amsterdam, The Netherlands, 2018; pp. 935–959. ISBN 9780128137352. [Google Scholar]
  52. Arora, P.; Sharma, I.; Hoadley, A.; Mahajani, S.; Ganesh, A. Remote, small-scale, ‘greener’ routes of ammonia production. J. Clean. Prod. 2018, 199, 177–192. [Google Scholar] [CrossRef]
  53. Ghavam, S.; Vahdati, M.; Wilson, I.A.G.; Styring, P. Sustainable Ammonia Production Processes. Front. Energy Res. 2021, 9, 1–19. [Google Scholar] [CrossRef]
  54. Tock, L.; Maréchal, F.; Perrenoud, M. Thermo-environomic evaluation of the ammonia production. Can. J. Chem. Eng. 2015, 93, 356–362. [Google Scholar] [CrossRef]
  55. Dufour, J.; Serrano, D.P.; Gálvez, J.L.; Moreno, J.; García, C. Life cycle assessment of processes for hydrogen production. Environmental feasibility and reduction of greenhouse gases emissions. Int. J. Hydrogen Energy 2009, 34, 1370–1376. [Google Scholar] [CrossRef]
  56. Atilhan, S.; Park, S.; El-Halwagi, M.M.; Atilhan, M.; Moore, M.; Nielsen, R.B. Green hydrogen as an alternative fuel for the shipping industry. Curr. Opin. Chem. Eng. 2021, 31, 100668. [Google Scholar] [CrossRef]
  57. Howarth, R.W.; Jacobson, M.Z. How green is blue hydrogen? Energy Sci. Eng. 2021, 9, 1676–1687. [Google Scholar] [CrossRef]
  58. Bicer, Y.; Dincer, I. Life cycle assessment of nuclear-based hydrogen and ammonia production options: A comparative evaluation. Int. J. Hydrogen Energy 2017, 42, 21559–21570. [Google Scholar] [CrossRef]
  59. Karaca, A.E.; Dincer, I.; Gu, J. A Comparative Life Cycle Assessment on Nuclear-Based Clean Ammonia Synthesis Methods. J. Energy Resour. Technol. 2020, 142, 102106. [Google Scholar] [CrossRef]
  60. WHO-World Health Organization Ionizing Radiation, Health Effects and Protective Measures. Available online: https://www.who.int/news-room/fact-sheets/detail/ionizing-radiation-health-effects-and-protective-measures (accessed on 12 September 2021).
  61. Bilgili, L. Comparative assessment of alternative marine fuels in life cycle perspective. Renew. Sustain. Energy Rev. 2021, 144, 110985. [Google Scholar] [CrossRef]
  62. Siddiqui, O.; Dincer, I. A comparative life cycle assessment of clean aviation fuels. Energy 2021, 234, 121126. [Google Scholar] [CrossRef]
  63. Al-Aboosi, F.Y.; El-Halwagi, M.M.; Moore, M.; Nielsen, R.B. Renewable ammonia as an alternative fuel for the shipping industry. Curr. Opin. Chem. Eng. 2021, 31, 100670. [Google Scholar] [CrossRef]
  64. Ayaz, S.K.; Altuntas, O.; Caliskan, H. Thermoecologic Assessment and Life Cycle–Based Environmental Pollution Cost Analysis of Microgas Turbine. J. Environ. Eng. 2020, 146, 04019096. [Google Scholar] [CrossRef]
  65. Hammond, G.P.; O’Grady, Á. The life cycle greenhouse gas implications of a UK gas supply transformation on a future low carbon electricity sector. Energy 2017, 118, 937–949. [Google Scholar] [CrossRef] [Green Version]
  66. Bouman, E.A.; Ramirez, A.; Hertwich, E.G. Multiregional environmental comparison of fossil fuel power generation—Assessment of the contribution of fugitive emissions from conventional and unconventional fossil resources. Int. J. Greenh. Gas. Control 2015, 33, 1–9. [Google Scholar] [CrossRef]
Figure 1. System boundaries of the ammonia production system: (a) based on natural gas via steam methane reforming to obtain hydrogen; (b) based on water via electrolysis to obtain hydrogen.
Energies 14 06721 g001
Figure 2. The system boundary of the ammonia-based electricity generation system. The CHP has a thermal output of 2.58 kWh per 1 kWh of electricity generated, which can be used as industrial or district heating. This heat was integrated into the model as a displacement of heat from natural gas. * Natural gas is the only input in the production of ammonia via SMR. The quantitative values of materials and energy flows are described in detail in Tables S1 to S3 of the Supplementary Materials.
Energies 14 06721 g002
Figure 3. Materials and energy flows of the power cycle based on [22].
Energies 14 06721 g003
Figure 4. Contribution analysis for the impact category indicator results of 1 kg ammonia at the production plant gate for (a) global warming potential (GWP100), (b) fossil depletion potential (FDP), (c) freshwater eutrophication potential (FEP), (d) ozone depletion potential (ODP), (e) photochemical oxidation formation potential (POFP), (f) terrestrial acidification potential TAP100, (g) ionizing radiation potential (IRP). SMR: steam methane reforming, E: electrolysis, CCS: carbon capture and storage, S: small-scale 20,000 ton per annum ammonia plant, M: mid-scale 100,000 ton per annum ammonia plant, PV: photovoltaic, W: wind, H: hydro, GT: geothermal, N: nuclear, UK: United Kingdom, MA: Morocco, AU: Australia, CL: Chile, BR: Brazil, IS: Iceland, AE: United Arab Emirates.
Energies 14 06721 g004aEnergies 14 06721 g004b
Figure 5. Global warming potential (GWP) considering 20- and 100-year time horizons for 1 t of NH3 via steam methane reforming (SMR) with and without carbon capture and storage (CCS).
Energies 14 06721 g005
Figure 6. Impact category indicator results with contribution analysis of ammonia-based electricity in co-generation cycle, FU: 1 kWh of electricity at the plant. (a) global warming potential (GWP100), (b) fossil depletion potential (FDP), (c) freshwater eutrophication potential (FEP), (d) ozone depletion potential (ODP), (e) photochemical oxidation formation potential (POFP), (f) terrestrial acidification potential TAP100, (g) ionizing radiation potential (IRP). SMR: steam methane reforming, E: electrolysis, CCS: carbon capture and storage, S: small-scale 20,000 ton per annum ammonia plant, M: mid-scale 100,000 ton per annum ammonia plant, PV: photovoltaic, W: wind, H: hydro, GT: geothermal, N: nuclear, UK: United Kingdom, MA: Morocco, AU: Australia, CL: Chile, BR: Brazil, IS: Iceland, AE: United Arab Emirates.
Energies 14 06721 g006aEnergies 14 06721 g006b
Figure 7. Global warming potential relative to benchmark: natural gas combustion in a gas turbine for [16], and electricity production from a conventional natural gas plant for this study.
Energies 14 06721 g007
Figure 8. Environmental profile of electricity production based on green ammonia. For the production of green ammonia, current data consider an energy input of 9.5 MWh per t NH3; for the future 6.5 MWh per t NH3 is considered.
Energies 14 06721 g008
Figure 9. Global warming potential results of co-generation cycle based on ammonia, FU: 1 kWh of electricity. (a) comparison of different locations’ grid mixes and marginal electricity (natural gas in gas turbine power plant); (b) comparison of current and future efficiency of the electrolyzer and Haber–Bosch processes. E: electrolysis; mix: grid mix, NG: marginal electricity—natural gas in a gas turbine, M: mid-scale 100,000 ton per annum ammonia plant, UK: United Kingdom, MA: Morocco, AU: Australia, CL: Chile.
Energies 14 06721 g009
Table 1. Life cycle assessment studies of ammonia-based electricity.
ReferenceSystemObjective/GoalSystem BoundariesFunctional UnitImpact Categories
Bicer and Dincer [12]Ammonia utilization in transportation and power generation.To study the environmental impact of ammonia as fuel in passenger cars in cities and generation in a gas turbine power plant.Manufacturing, operation, maintenance, and disposal of the vehicle.
Construction of power plant, ammonia production (wind-based), transportation of ammonia, and power plant operation.
1 traveled km and 1 MJ energy generated.Abiotic depletion potential, acidification potential, global warming potential, ozone layer depletion potential.
Cox and Treyer [15]A cracked ammonia fueled alkaline fuel cell.To analyze the environmental and human health impacts of power production, for use at off-grid BTS, with a cracked ammonia-fueled AFC system and to compare with diesel generators.Raw materials, fabrication, transport, use phase, fuel production, refurbishment, recycling, and final disposal.1 kWh of net electricityClimate change, terrestrial acidification, human toxicity, particulate matter formation, metal depletion, non-renewable primary energy demand.
Razon and Valera-Medina [16]Ammonia blends with methane for heat generation.To compare the environmental impact of 14 scenarios for producing and combusting methane and ammonia to produce heat.Ammonia production (7 different sources) and methane production (2 different sources), heat production.
Transport was not included.
1 MJ of heat.Global warming potential, aquatic ecotoxicity, aquatic eutrophication, human toxicity, ionizing radiation, land occupation, mineral extraction, non-renewable energy, respiratory organics, ozone layer depletion, terrestrial acidification, terrestrial ecotoxicity, aquatic acidification.
Xue et al. [17]Ammonia for power generation in fuel cells.To determine the carbon footprint and nitrogen footprint when ammonia is used as an energy carrier.Resources extraction, ammonia production, ammonia transport, fuel cell operation. Carbon footprint (climate change) and nitrogen footprint.
Table 2. Description of scenarios.
Scenario CodeDescription
SMR-S-UKMethane to ammonia via steam methane reforming process, small capacity (20,000 t of NH3 per annum) in the UK.
SMR-M-UKMethane to ammonia via steam methane reforming process, mid-capacity (100,000 t of NH3 per annum) in the UK.
SMR-CCS-M-UKMethane to ammonia via steam methane reforming process, with carbon capture and storage, mid-capacity (100,000 t of NH3 per annum) in the UK.
E-W-S-UKPower to ammonia via electrolysis process, electricity from wind, small capacity (20,000 t of NH3 per annum) in the UK.
E-W-M-UKPower to ammonia via electrolysis process, electricity from wind, mid-capacity (100,000 t of NH3 per annum) in the UK.
E-W-M-MAPower to ammonia via electrolysis process, electricity from wind, mid-capacity (100,000 t of NH3 per annum) in Morocco.
E-W-M-AUPower to ammonia via electrolysis process, electricity from wind, mid-capacity (100,000 t of NH3 per annum) in Australia.
E-PV-M-CLPower to ammonia via electrolysis process, electricity from photovoltaics, mid-capacity (100,000 t of NH3 per annum) in Chile.
E-H-M-BRPower to ammonia via electrolysis process, electricity from hydropower, mid-capacity (100,000 t of NH3 per annum) in Brazil.
E-GT-M-ISPower to ammonia via electrolysis process, electricity from geothermal, mid-capacity (100,000 t of NH3 per annum) in Iceland.
E-N-M-AEPower to ammonia via electrolysis process, electricity from nuclear, mid-capacity (100,000 t of NH3 per annum) in the United Arab Emirates.
SMR: steam methane reforming, E: electrolysis, CCS: carbon capture and storage, S: small-scale 20,000 ton per annum ammonia plant, M: mid-scale 100,000 ton per annum ammonia plant, PV: photovoltaic, W: wind, H: hydro, GT: geothermal, N: nuclear, UK: United Kingdom, MA: Morocco, AU: Australia, CL: Chile, BR: Brazil, IS: Iceland, AE: United Arab Emirates.
Table 3. Impact categories included in the LCA (ReCiPe2016 Midpoint(H) [49]).
Impact CategoryIndicatorCharacterisation FactorUnit
Climate changeInfra-red radiative forcing increaseGlobal warming potential—GWP100kg CO2-eq
Fossil resource scarcityUpper heating valueFossil depletion potential—FDPkg oil-eq
Freshwater eutrophicationPhosphorus increase in freshwaterFreshwater eutrophication potential—FEPkg P-eq
Ozone depletionStratospheric ozone decreaseOzone depletion potential—ODPinfkg CFC-11-eq
Photochemical oxidant formationTropospheric ozone increasePhotochemical oxidant formation potential—POFPkg NMVOC-eq
Terrestrial acidificationProton increase in natural soilsTerrestrial acidification potential—TAP100kg SO2-eq
Ionising radiationAbsorbed dose increaseIonizing radiation potential—IRPkg U235-eq
Publisher’s Note: MDPI stays neutral with regard to jurisdictional claims in published maps and institutional affiliations.

