Article

What Are the Policy Impacts on Renewable Jet Fuel in Sweden?

1
Department of Energy Technology, KTH Royal Institute of Technology, SE-114 28 Stockholm, Sweden
2
Department of Industrial Economics & Management, KTH Royal Institute of Technology, SE-114 28 Stockholm, Sweden
3
Sustainable Society, Energy, IVL Swedish Environmental Research Institute, Box 530 21, SE-400 14 Gothenburg, Sweden
*
Author to whom correspondence should be addressed.
Energies 2021, 14(21), 7194; https://doi.org/10.3390/en14217194
Submission received: 29 September 2021 / Revised: 18 October 2021 / Accepted: 21 October 2021 / Published: 2 November 2021
(This article belongs to the Special Issue Low Carbon Energy Transitions: Today and in the Future)

Abstract

:
The aviation industry contributes to more than 2% of global human-induced CO2-emissions, and it is expected to increase to 3% by 2050 as demand for aviation grows. As the industry is still dependent on conventional jet fuel, an essential component for a carbon-neutral growth is low-carbon, sustainable aviation fuels, for example alternative drop-in fuels with biobased components. An optimization model was developed for the case of Sweden to examine the impacts of carbon price, blending mandates and penalty fee (for not reaching the blending mandate) on the production of renewable jet fuel (RJF). The model included biomass gasification-based Fischer–Tropsch (FT) jet fuel, Power-to-Liquid (PTL) jet fuel through the FT route and Hydrothermal liquefaction (HTL)-based jet fuel. Thus, this study aims at answering how combining different policies for the aviation sector can support the production of RJF in Sweden while reducing greenhouse gas (GHG) emissions. The results demonstrate the importance of implementing policy instruments to promote the production of RJF in Sweden. The blending mandate is an effective policy to both promote RJF production while reducing emissions. The current level of the penalty fee is not sufficient to support the fuel switch to RJF. A higher blending mandate and carbon price will accelerate the transition towards renewable and sustainable fuels for the aviation industry.

1. Introduction

1.1. Background

The transport sector is the second largest contributor to global CO2 emissions after the electricity and heat industry, releasing a total of 8260 million tons (Mton) of CO2 in 2018 [1]. Fossil fuels represent the dominating energy source in the transport sector, accounting for approximately a quarter of global energy consumption. Measures such as energy efficiency, deployment of renewable fuels, and modal shifts to low-carbon alternatives have been put in place to decarbonize the transport sector [2,3]. However, challenges still remain in fully transitioning into sustainable pathways as the transportation demand increases, and the sector is still highly reliant on fossil fuels, which is particularly true for the aviation industry [4]. The aviation industry currently contributes to more than 2% of global human-induced CO2 emissions, which is expected to increase to 3% by 2050 as demand for aviation grows [4,5]. The expected increase does not consider the effects of the COVID-19 pandemic. Accelerating the transition to renewable jet fuel becomes crucial for the industry to contribute to climate goals aiming to reduce greenhouse gas (GHG) emissions. Within the European Union (EU), Sweden has relatively ambitious climate goals and aims to reach net-zero GHG emissions by 2045 [6]. The Swedish climate policy framework also sets the targets of reducing GHG-emissions by 63% by 2030 and 75% by 2040, compared to 1990 [6,7].
The aviation industry addresses the call to reduce its environmental impacts through investments in more fuel-efficient technologies and environmentally friendly operating practices [8] as well as in alternative fuel sources [9]. According to the Air Transport Action Group [10], an essential component of the overall strategy for carbon-neutral growth in the aviation sector is low-carbon, sustainable aviation fuels, namely alternative drop-in fuels with biobased components. Other potential solutions for a carbon-neutral growth are alternative aviation propulsion technologies, which include hydrogen, hybrid or electric powered aircrafts, as described in Dahal et al. [11]. Renewable aviation fuels are not expected to be competitive with fossil jet prices at least in the short term [12]. This indicates that policy support is important to accelerate the deployment of renewable and sustainable aviation fuels.
The impacts of policies on the aviation sector’s economic and environmental performance are explored in the recent literature. The most studied policy instruments include the EU Emissions Trading System (EU ETS) [13,14,15,16,17], aviation tax [18,19], carbon price [20], and the multiplier mechanism applied on energy content of biofuel to stimulate biofuel uptake [19]. These studies have demonstrated different degrees of policy effectiveness on reducing GHG emissions from the aviation industry. The inclusion of aviation tax may or may not be significant in reducing emissions depending on the carbon price [13,17], but may incentivize airports to maximize their revenue [14]. A study at the global level concluded that policy mixing including enhanced technology efficiency, carbon price, use of alternative fuels and demand shift are required for sustainable air transport [20]. Similar policies introduced in different countries may have different degrees of effectiveness depending on national circumstances, e.g., resource availability, technology availability, interaction with other policies, institutional aspects, etc. Hence, national, regional and local assessments of policy impacts are needed.
There are various quantitative and qualitative analyses used to evaluate policy impacts. Energy system modeling has been widely applied in scientific studies to address policy questions, e.g., evaluate the policy impacts within the aviation industry [20,21]. In general, energy system modeling can be categorized into top-down and bottom-up approaches. While top-down tools usually have a macroeconomic perspective, bottom-up tools have a technological perspective and is called technology-rich models. The bottom-up tools look at the deployment and use of different technologies and represent in detail their characteristics. Both modeling approaches have been applied in literature addressing policy questions within the aviation sector. In Sgouridis et al. [20], a system dynamic model (top-down tool), i.e., Global Aviation Industry Dynamics (GAID), was used to evaluate the impacts of five policies. The policies were technological efficiency improvement, operational efficiency improvement, use of alternative fuels, demand shift and carbon price, on total emissions, air transport mobility, airfares and airline profitability. The open-source global aviation systems model AIM (bottom-up tool) was utilized in Dray et al. [21] to model carbon leakages for aviation emissions policy in a single country. Economic instruments such as a feed-in tariff and capital investment subsidy to promote bio-jet fuel production were studied in Moncada et al. [22] using a spatially explicit agent-based model (bottom-up).
Optimization models, another type of bottom-up tool, are often deployed to optimize energy investment decisions endogenously, meeting a specific target under certain constraints [23]. Optimization tools can help to identify cost-effective and sustainable fuel production pathways [24]. Optimization models have also shown to be valuable as decision-making tools for planning and designing supply chains for RJF fuel provision [25]. A geographically explicit cost optimization model was used in de Jong et al. [26] to explore cost reduction strategies and required policy support for the production of bio-jet fuel in Sweden. In the study, de Jong et al. [26] examined distributed or centralized production and the opportunities to co-locate bio-jet-fuel production with existing industries in Sweden (e.g., oil refinery, pulp and paper mill, sawmill). The study analyzed only one technological conversion pathway, i.e., hydrothermal liquefaction (HTL), to produce bio-jet fuel. In Leong et al. [27] an optimization framework was applied for a bioenergy supply chain while considering a CO2 reduction target. In the study, a two-step optimization was performed on cost and emissions by combining carbon emission pinch analysis (CEPA) implemented through the automated targeting model (ATM), with superstructural optimization [27].
To the best of our knowledge, no study examines the impact of multiple policy instruments on the production of renewable jet fuel (RJF) while exploring multiple production pathways. This study sheds lights on the impacts of carbon price, blending mandates and penalty fee for not reaching the blending mandate, on the production of RJF through the following production pathways (i) biomass gasification-based Fischer–Tropsch (FT) (ii) Power-to-Liquid (PTL) through the FT route and (iii) the HTL route. In this study, alternative propulsion technologies such as hydrogen and hybrid or electric engines are not included. More specifically, this study aims to answer how combining different policies in the aviation sector can support the production of RJF to meet the emission reduction targets in Sweden by using an optimization model incorporating spatial and temporal aspects, specifically developed for this purpose. Evidence-based policies are essential for the successful and sustainable implementation of the RJF fuel supply chains. The case of Sweden is explored due to the relatively large domestic resource availability of, i.e., forestry residues [28,29], biogenic CO2 and renewable energy [30], and the ambitious national climate target of net zero GHG emissions by 2045.
Following the introduction, the climate and energy policies of Sweden, that are of relevance to the aviation industry are summarized in Section 1.2. In Section 2, the methodology is presented, including an overview of the chosen conversion pathways, the technoeconomic parameters, the objective of the optimization model and a description of the scenarios to be explored. In Section 3, the results of the optimization model and scenario development are presented and discussed. Section 4 summarizes and concludes the key insights from the research findings.

1.2. Climate and Energy Policies for the Aviation Industry in Sweden

In Sweden, climate and energy policies have been introduced in the transport sector, and for specific transport modes, with the aim to reduce the impact on climate change. The policy support is expected to contribute to meeting fossil-free domestic aviation by 2030 and for all flights departing from Swedish airports to be fossil-free by 2045 [31].
The Swedish climate and energy targets adopted under the Energy Agreement (2016) and the Climate Policy Framework (2017) [6] include:
  • By 2045, Sweden is to achieve no net GHG-emissions into the atmosphere.
  • By 2040, 100% of the electricity generation should be from renewable sources.
  • By 2030, the emissions from domestic transport should be reduced by 70% compared with 2010 (excluding domestic aviation since it is included in EU ETS) [6].
To mitigate the climate impact from the aviation sector, the Swedish government introduced policy instruments, such as an aviation tax and a blending mandate. The aviation tax was launched in 2018 primarily to reduce demand for air travels [7,32,33,34]. The tax is included in the price of the passenger flight ticket. Different taxes are applied depending on travel destination. An assessment of the aviation tax was conducted by the Swedish Transport Agency in 2018, estimating a reduction of a total of 350,000 passengers [32].
A blending mandate, which sets a mandatory requirement on jet fuel suppliers to blend bio-jet fuel into fossil jet fuel was introduced in Sweden on 1 July 2021. The blending ratio starts at 0.8% in 2021 and will gradually increase to 27% in 2030. A penalty fee of 6 SEK/kgCO2, eq is imposed to the supplier if they fail to fulfil the blending ratio requirement during a calendar year or fail to report how the requirements have been met in time [35].
In 1991, Sweden introduced a carbon tax on fossil fuels in proportion to their carbon content. The tax started at a value of 250 SEK/ton-CO2 emitted and has gradually increased to its current value of 1200 SEK/ton-CO2, in 2021 [36]. However, the carbon tax does not include aviation fuels used for commercial purposes and only covers fuels used in private flights in Sweden. The Chicago Convention (signed in 1944), together with a resolution adopted by International Civil Aviation Organization (ICAO) in 1993, makes the implementation of a carbon tax on international flights in practice impossible [32,37]. In this study, the carbon tax will be explored for both domestic and international flights to investigate its impact on the use of RJF.

2. Materials and Methods

2.1. Technological Conversion Pathways

Three conversion pathways of drop-in RJF are analyzed in detail in this study, namely: gasification-based Fischer–Tropsch (FT), hydrothermal liquefaction (HTL) and Power-to-Liquid (PTL) with the FT route. In addition to these pathways, Hydrotreated Esters and Fatty Acids (HEFA) and conventional jet fuel (CJF) are also considered in the optimization model, by including their current market prices and import. Thus, without considering the supply chain and technoeconomic performances of HEFA and CJF. A more detailed investigation on HEFA (which is produced from vegetable oils) is not included, since priority is placed on abundant, raw biomass materials in Sweden (mainly forestry residue).
The conversion pathways were selected considering three main reasons. First, the standard ASTM for drop-in fuel specification. An RJF certified under ASTM is suitable for blending with CJF. ASTM has approved a total of seven technology pathways to produce biomass-based RJF (Table 1). Additional technologies are currently under evaluation by ASTM and the latest approvals were made in 2020, however, the time frame of evaluation can vary between different pathways [32,38,39].
Secondly, the maturity level of a technology is based on the Technology Readiness Level (TRL). The TRL ranges from 1–9, in which TRL 1 is defined as the stage where basic principles have been observed and TRL 9 the stage where the technology has been proven in an operational environment [40,41]. An assessment of the TRL for HEFA, FT, Direct Sugars to Hydrocarbons (DSHC), Alcohol-to-Jet (ATJ), Pyrolysis, HTL was provided from [42] and for PTL from [43], which is depicted in Figure 1.
Thirdly, the selection of the conversion pathways considered the abundant and locally sourced feedstocks. In Sweden and the other Nordic countries, the interest of producing RJF have mainly been directed towards using forestry residue as feedstock [32]. The forestry industry is well-established in Sweden and utilizing the by-products for RJF production provides a great potential for conversion pathways such as FT and HTL. This makes it interesting to analyze the HTL pathway, although it has not been ASTM approved using forestry residues yet, the TRL level is promising with growing interest indicated by demonstration-scale activities [44]. Additionally, industries such as paper and pulp, chemical industries, etc., located in Sweden, have the potential to provide CO2 through carbon capturing, which could promote the production of PTL jet fuels by utilizing the CO2 released from industries. Since FT jet fuel has been approved by ASTM for a 50% blend, PTL jet fuel through the FT route is a conversion pathway with promising characteristics suitable as a drop-in jet fuel [45].
There are other potential alternative aviation fuels including hydrogen and hybrid or electric propulsion technologies. These have not been considered in this assessment. The prerequisites for hydrogen for aviation is discussed by for example Dahal et al. (2021) [11], Balli et al. (2018) [46] and Bicer & Dincer (2018) [47] and electric propulsion for example by Brelje and Martins (2019) [48].
This study evaluates the impact of policies including the carbon tax, which is internalized in the model; the blending mandate, which regulates the RJF demand in Sweden; and the penalty fee, which aims to promote the use of RJF by imposing the fee to the jet fuel suppliers that fail to fulfill the requirements of the blending mandate. In this study, the blending mandate is only considered for the RJF conversion pathways FT, HTL and PTL, to prioritize domestic production of RJF from abundant raw materials. Currently, there is no HEFA production in Sweden and the feedstocks used for HEFA are limited in supply, hence HEFA is not considered for the blending ratio in the analysis.

2.1.1. Hydroprocessed Esters and Fatty Acids

Hydroprocessed Esters and Fatty Acids (HEFA) is a biofuel produced from raw materials with the main component being triglycerides, which form the base material for any natural fats and oils. HEFA is also known as HVO (Hydrotreated Vegetable Oils) and HRJ (Hydroprocessed Renewable Jet). Feedstocks that could be used to produce HEFA includes any types of fats and oils. The market of RJF-production is currently dominated by the HEFA pathway, mainly using vegetable oils or waste oils and fats as feedstocks to convert into jet fuel. The process is widely commercialized and provides the lowest cost amongst the certified pathways. In short term, HEFA has the largest potential to grow its production capacity, according to World Economic Forum (WEF) [49]. However, feedstocks used in the HEFA pathway are either first generation biomass considered controversial to use for fuel production or waste oils that face a natural upper limit since there is a finite supply of waste oils and fats. In both cases, there are also competing industries with demand for these feedstocks [49].
The process of producing HEFA mainly involves the following steps: pretreatment, deoxygenation and hydrogenation, cracking and isomerization, and lastly distillation. In the first step, the feedstock is pretreated to remove impurities such as phosphorous compounds, trace metals and soaps, which could result in catalyst poisoning. Following this, deoxygenation and hydrogenation reactions occur in the presence of catalysts and the oil reacts with hydrogen. The reactions take place in a reactor with a temperature range from 250–450 °C and a hydrogen pressure from 10–300 bars. In the process, unsaturated carbon chains and oxygen are removed from the oil molecules, producing long-chain hydrocarbons together with other by-products such as water, propane, CO and CO2. In the following step, cracking and isomerization reactions occur to yield smaller and more branched hydrocarbon chains. In the final step, the product is separated in two steps; removal of water and gaseous components, and then distillation to yield the final products of kerosene, diesel, and naphtha in different proportions [50,51,52,53].

2.1.2. Fischer–Tropsch

Fischer–Tropsch (FT) is a conversion technology used to produce synthetic hydrocarbons (fuels) from any carbon-based material, such as coal, natural gas and biomass. For alternative aviation fuel purposes, feedstocks such as lignocellulosic materials and municipal waste are promising due to their low carbon footprint. The FT-process involves the following steps: feedstock preparation and pretreatment, syngas production, syngas refinement, FT-synthesis, isomerization and branching, and lastly distillation [53,54,55].
Firstly, the biomass undergoes a size reduction and drying process which is dependent on the type of gasifier used in the subsequent conversion steps. Secondly, the biomass is converted into synthesis gas (syngas) through gasification. The thermochemical process operates in a temperature range of 800–1800 °C with oxygen, steam or both used as gasification agents. Pure syngas is a mixture of CO and H2, the ratio of which depends on the raw material used. Following this, the syngas is cleaned from contaminants to avoid catalyst poisoning and is conditioned through the water-gas-shift reaction to optimize the ratio of CO and H2. The clean syngas then undergoes FT-synthesis and is converted into hydrocarbon liquids and waxy solids in the presence of a catalyst. The FT-synthesis is usually carried out in a low temperature range (200–240 °C) using iron or cobalt catalysts or a high temperature range (300–350°C) using iron catalysts. Once the syngas has been converted to hydrocarbons, the crude FT-fuel undergoes a purification and refining process to produce the aviation fuel [53,54,55,56,57].

2.1.3. Hydrothermal Liquefaction

Hydrothermal liquefaction (HTL) is a thermochemical process that can convert biomass with high water content into liquid fuel. In the process, a wide variety of biobased and waste feedstocks can be utilized, including woody biomass, wastes from the forestry industry, food wastes, industrial wastes, manure, algae, etc. [58,59]. The main steps involved in the HTL process include pretreatment, the HTL process, hydrotreating, hydrogen production and wastewater treatment [60].
Depending on the type of biomass used as feedstock, the pretreatment step varies. Since biomass slurries are used in the conversion process, it could be necessary to either add or remove water to the feedstock. Following is the HTL process which involves three main steps, in which hydrolysis, dehydration and decarboxylation and condensation, cyclization and polymerization are performed. In the process steps, macromolecules are made into smaller compounds, converted, and then rearranged to yield the desired product. During the process, water acts both as a solvent and reaction medium. A spontaneous phase separation occurs resulting in water remaining in an aqueous phase, a gaseous phase containing rich levels of CO2, a solid phase, and a bio-crude phase. The different phases from the HTL process are separated, and a hydrotreatment is required to upgrade the bio-crude phase to produce the final fuel product. The upgrading process is primarily performed to remove oxygen and produce a hydrocarbon fuel with characteristics suitable to be used as a drop-in fuel. The liquid water from the HTL-process can also be recycled, which is performed after being separated from the other phases. Before being returned to the environment or reused for the pretreatment step, the water undergoes a treatment since it contains water-soluble organics [59,60,61,62].

2.1.4. Power-to-Liquid with Fischer–Tropsch Route

Power-to-X (PTX), also called electrofuels, are carbon-based synthetic fuels which are produced through the PTX processes, which includes power-to-liquids (PTL) and power-to-gas (PTG). In the processes, the main constituents are electricity, water, and CO2. To achieve climate benefits, conditions such as using renewable energy sources and CO2 originated from the atmosphere or sustainable point sources, must be fulfilled. In general, the main process steps to produce electrofuels include the following: CO2 provision, H2 production, synthesis and fuel conditioning [59,63,64,65].
Concentrated CO2 can be provided from three major sources which are of fossil origin, i.e., from fossil industrial flue gases, mineral origin, i.e., from geothermal activities, or renewable origin, i.e., from biofuel production, biomass-based industrial flue gases and extraction from the atmosphere. However, utilizing fossil CO2 for the production of PTL jet fuel cannot be considered as carbon-free. Different technologies are available for capturing and extracting CO2 from industrial production processes which in general could be divided into three categories: precombustion, postcombustion or oxyfuel combustion carbon-capturing (CC) technologies. Following the capturing process, the separation of CO2 can be performed through absorption, adsorption, membranes, and cryogenics. In Direct Air Capture (DAC), CO2 is removed directly from the air, using absorption or adsorption processes. However, since the concentrations of CO2 are much lower in the atmosphere than in industrial flue gases, the energy demand and costs are higher for DAC [64,65,66,67,68].
Hydrogen can be produced through different processes utilizing fossil fuels, biomass, or water as a raw material. Approximately 95% of global hydrogen production is currently using natural gas and coal as primary resource [69]. The most common way to produce hydrogen without using fossil fuels is currently through water electrolysis. In the electrolysis process, an electrochemical cell is used with a direct current to split water into H2 and O2 gas. Different types of electrolyzers are available, operating in conditions using either liquid water in low-temperature or high-temperature steam [63,65,70].
Following the CO2 capturing and the H2 production is a synthesis that can be performed through biological, mechanical, chemical, and thermal processes. To produce jet fuel, processes such as the FT-synthesis and the production of methanol as an intermediate product could be utilized [59,65].

2.2. Supply Chain Model

In this study, a centralized supply chain model was considered for RJF production in Sweden. The supply chain encompasses the raw material production, conversion and upgrading of jet fuel and downstream transportation to the jet fuel demand sites. A co-location strategy was implemented considering the raw material production sites as potential locations for the jet fuel conversion and upgrading facilities to be built. These sites are represented by 121 sawmills [71] and 136 industrial facilities (pulp and paper, combined heat and power, chemical industries, waste treatment and incineration, biofuel and biogas upgrading facilities) [72,73]. From the production sites, the jet fuel will be transported directly to the demand sites, represented by 39 airports in Sweden [74,75]. In Figure 2, a visualization of the supply chain model considered is provided.

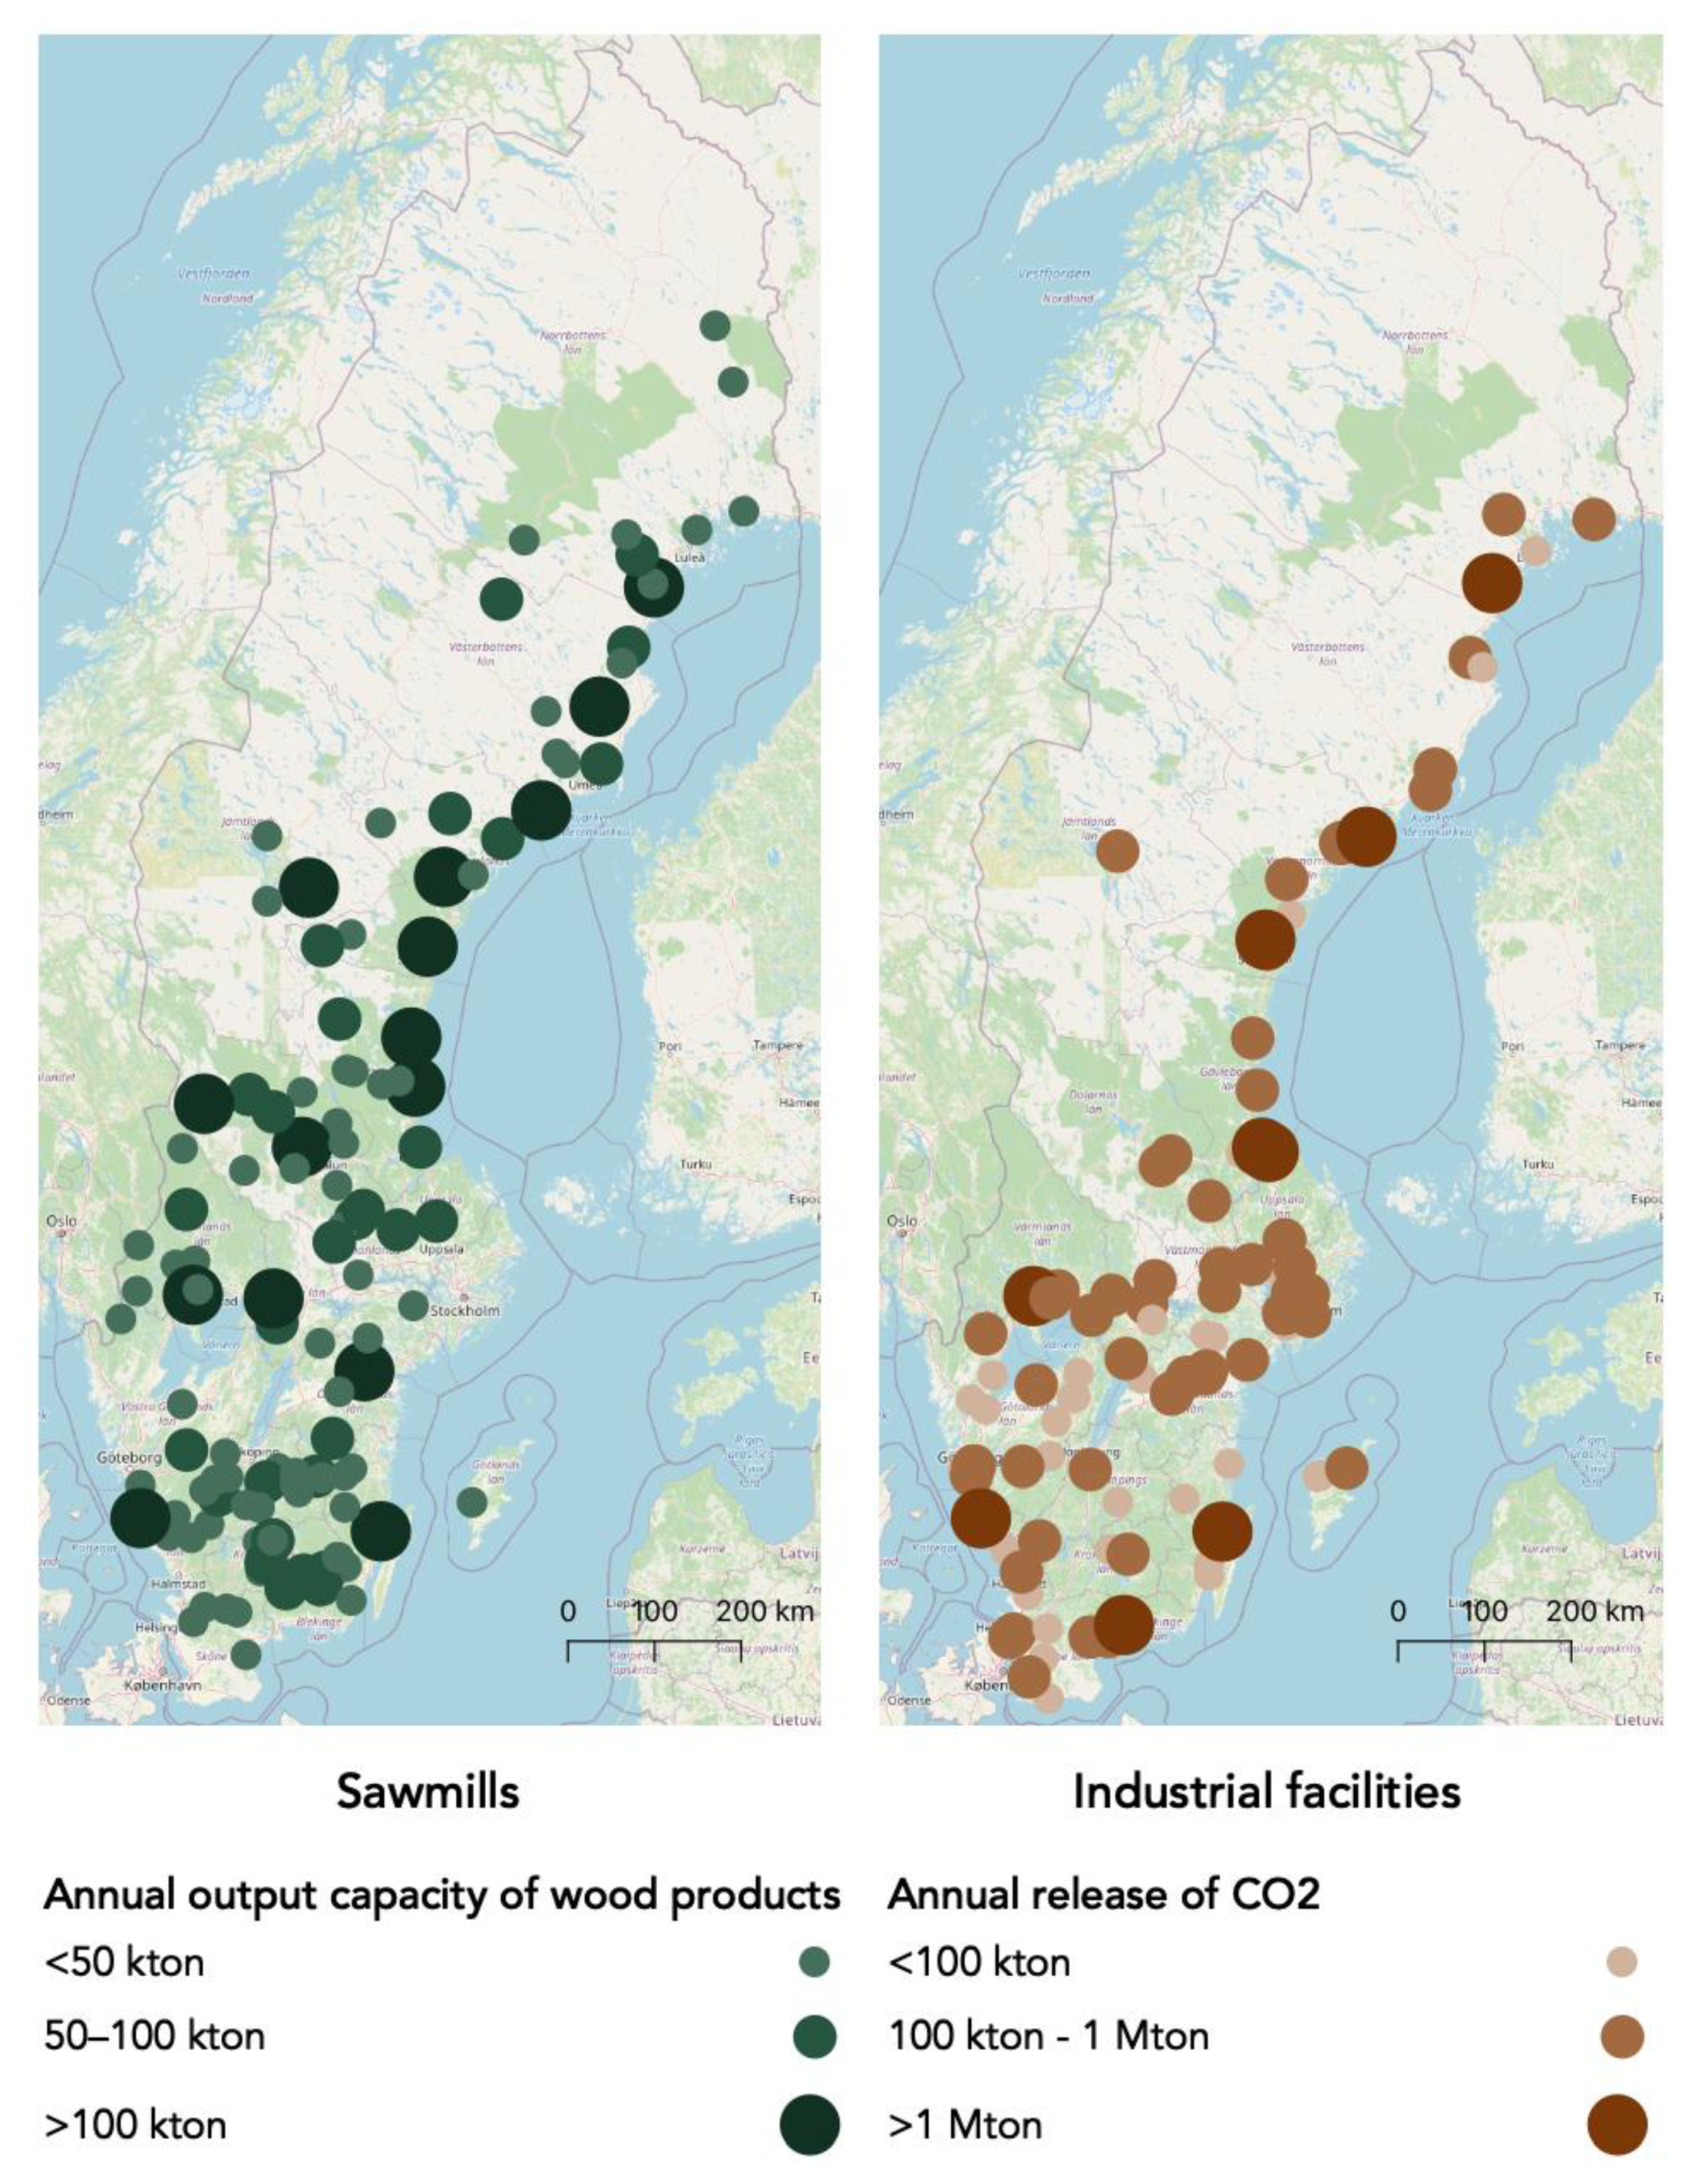
2.3. Feedstock Supply to Produce RJF

The sawmills were considered as potential locations to produce RJF through biomass gasification-based FT (which will be referred to as FT in text) and HTL due to the access to forestry residue as feedstock. Only sawmills with an output capacity of wood products equal to or greater than 30,000 m3/year were considered, to ensure that the availability of feedstock is high enough for the site to be considered feasible for RJF production. To account for biomass competition from other sectors, a starting value of 30% availability of forestry residue was set in the base case. The output capacity of wood products from the sawmills, thus the feedstock supply, was assumed to be constant throughout the modeling period.
To produce PTL jet fuel through the FT route (which will be referred to as PTL in text), 136 industrial facilities were considered as potential locations due to the availability of CO2 as feedstock for PTL. A list of 74 industrial facilities were extracted from the European Pollutant Release and Transfer Register (E-PRTR) [73] which includes industries such as paper and pulp (PP), combined heat and power (CHP), chemical industries (CI) and waste treatment and incineration plants (WT/WI). From these industrial facilities, only the biogenic fraction of their CO2 release was considered for the production of PTL, with a recoverable share assumed to be 70% [65]. Biogenic carbon emissions are released from biomass sources and are part of the natural carbon cycle [81]. The industrial facilities also include 62 biofuel (BF) and biogas (BG) upgrading plants, with a 100% recoverable share, as these plants can provide relatively pure streams of CO2 [30]. Data used to estimate the CO2 release from the biofuel and biogas upgrading are provided in the Supplementary Materials in Table S3 from [30,82,83,84]. In the model, the electricity generated [85,86,87,88,89,90,91,92,93,94,95,96,97,98,99,100,101,102] at the CHP plants will be utilized in the production of the PTL jet fuel. The additional electricity demand for PTL will be supplied from the grid. The annual CO2 release and electricity generation at the CHPs are assumed to be constant throughout the modeling period.
In Figure 3, maps of the sawmills and industrial facilities are presented. In the model, the four electricity pricing areas of Sweden (SE1, SE2, SE3 and SE4) were included to consider the differences in electricity pricing, which could help reflect limitations in transmission capacity between the areas [103]. In Figure 4, a map of the four pricing areas in Sweden is provided and the electricity prices can be found in the Supplementary Materials in Table S4 from [104,105].

2.4. Technoeconomic Parameters

In this study, the time frame was set from 2020–2050 with a five-year time step, to consider the long-term GHG emission targets of Sweden. The baseline year was 2020. The lifetime of the jet-fuel plants was therefore set to 30 years and the discount rate at 10% in accordance with [108,109], see Table 2. The technoeconomic data is based on scientific literatures that provide a detailed breakdown of the production processes. In Table 3, an overview of the capacities used, and total capital investment (TCI) is provided and in Table 4 the production yields of each conversion pathway are listed.
From the technoeconomic data presented in Table 3 and Table 4, the annual capital expenditure (CAPEX), fixed costs and variable costs were determined. The TCI cost was annualized with the capital recovery factor, as shown in Equations (1) and (2). The capacity of the jet-fuel plants is determined by the model. The annualized plant capital cost was divided by the total output capacity of the jet fuel to obtain the CAPEX per ton of jet-fuel output. The fixed costs were set as 4% of CAPEX [113]. The variable costs were determined based on the utilities required, considering the electricity, water, and hydrogen as well as catalysts and chemicals. In the model, economies of scale and labor costs were not taken into consideration. In Table 5, the CAPEX, fixed costs, and parameters required to determine the variable costs are listed. The CAPEX and fixed costs are constant throughout the assessment period (2020–2050), while the variable costs changes based on the values in Table 6.
Capital   recovery   factor   ( CRF ) = r · ( 1 + r ) N ( 1 + r ) N 1
Annualised   capital   cos t = CRF · TCI
  • r Discount rate
  • N Number or years
The production of RJF through PTL involves a syngas process, in which the input is CO2 captured from the industrial facilities and hydrogen produced onsite. In this study, only CO2 is considered as the main raw material input in the PTL process. Therefore, the cost of the onsite hydrogen production and the fixed costs of CO2 capturing has been internalized in the economic parameters of the PTL plant, while the variable costs (electricity and water demand) in the capturing process of CO2 represents the cost of raw material.
In Table 6, the utility prices used to determine the variable costs are listed (2020–2050) as well as the market prices of HEFA and CJF. The annual increase in the fossil products was based on the increase of price of fossil diesel as modelled by the Swedish Energy Agency [104]. The values for 2025, 2035, 2045 were interpolated based on the values in Table 6.

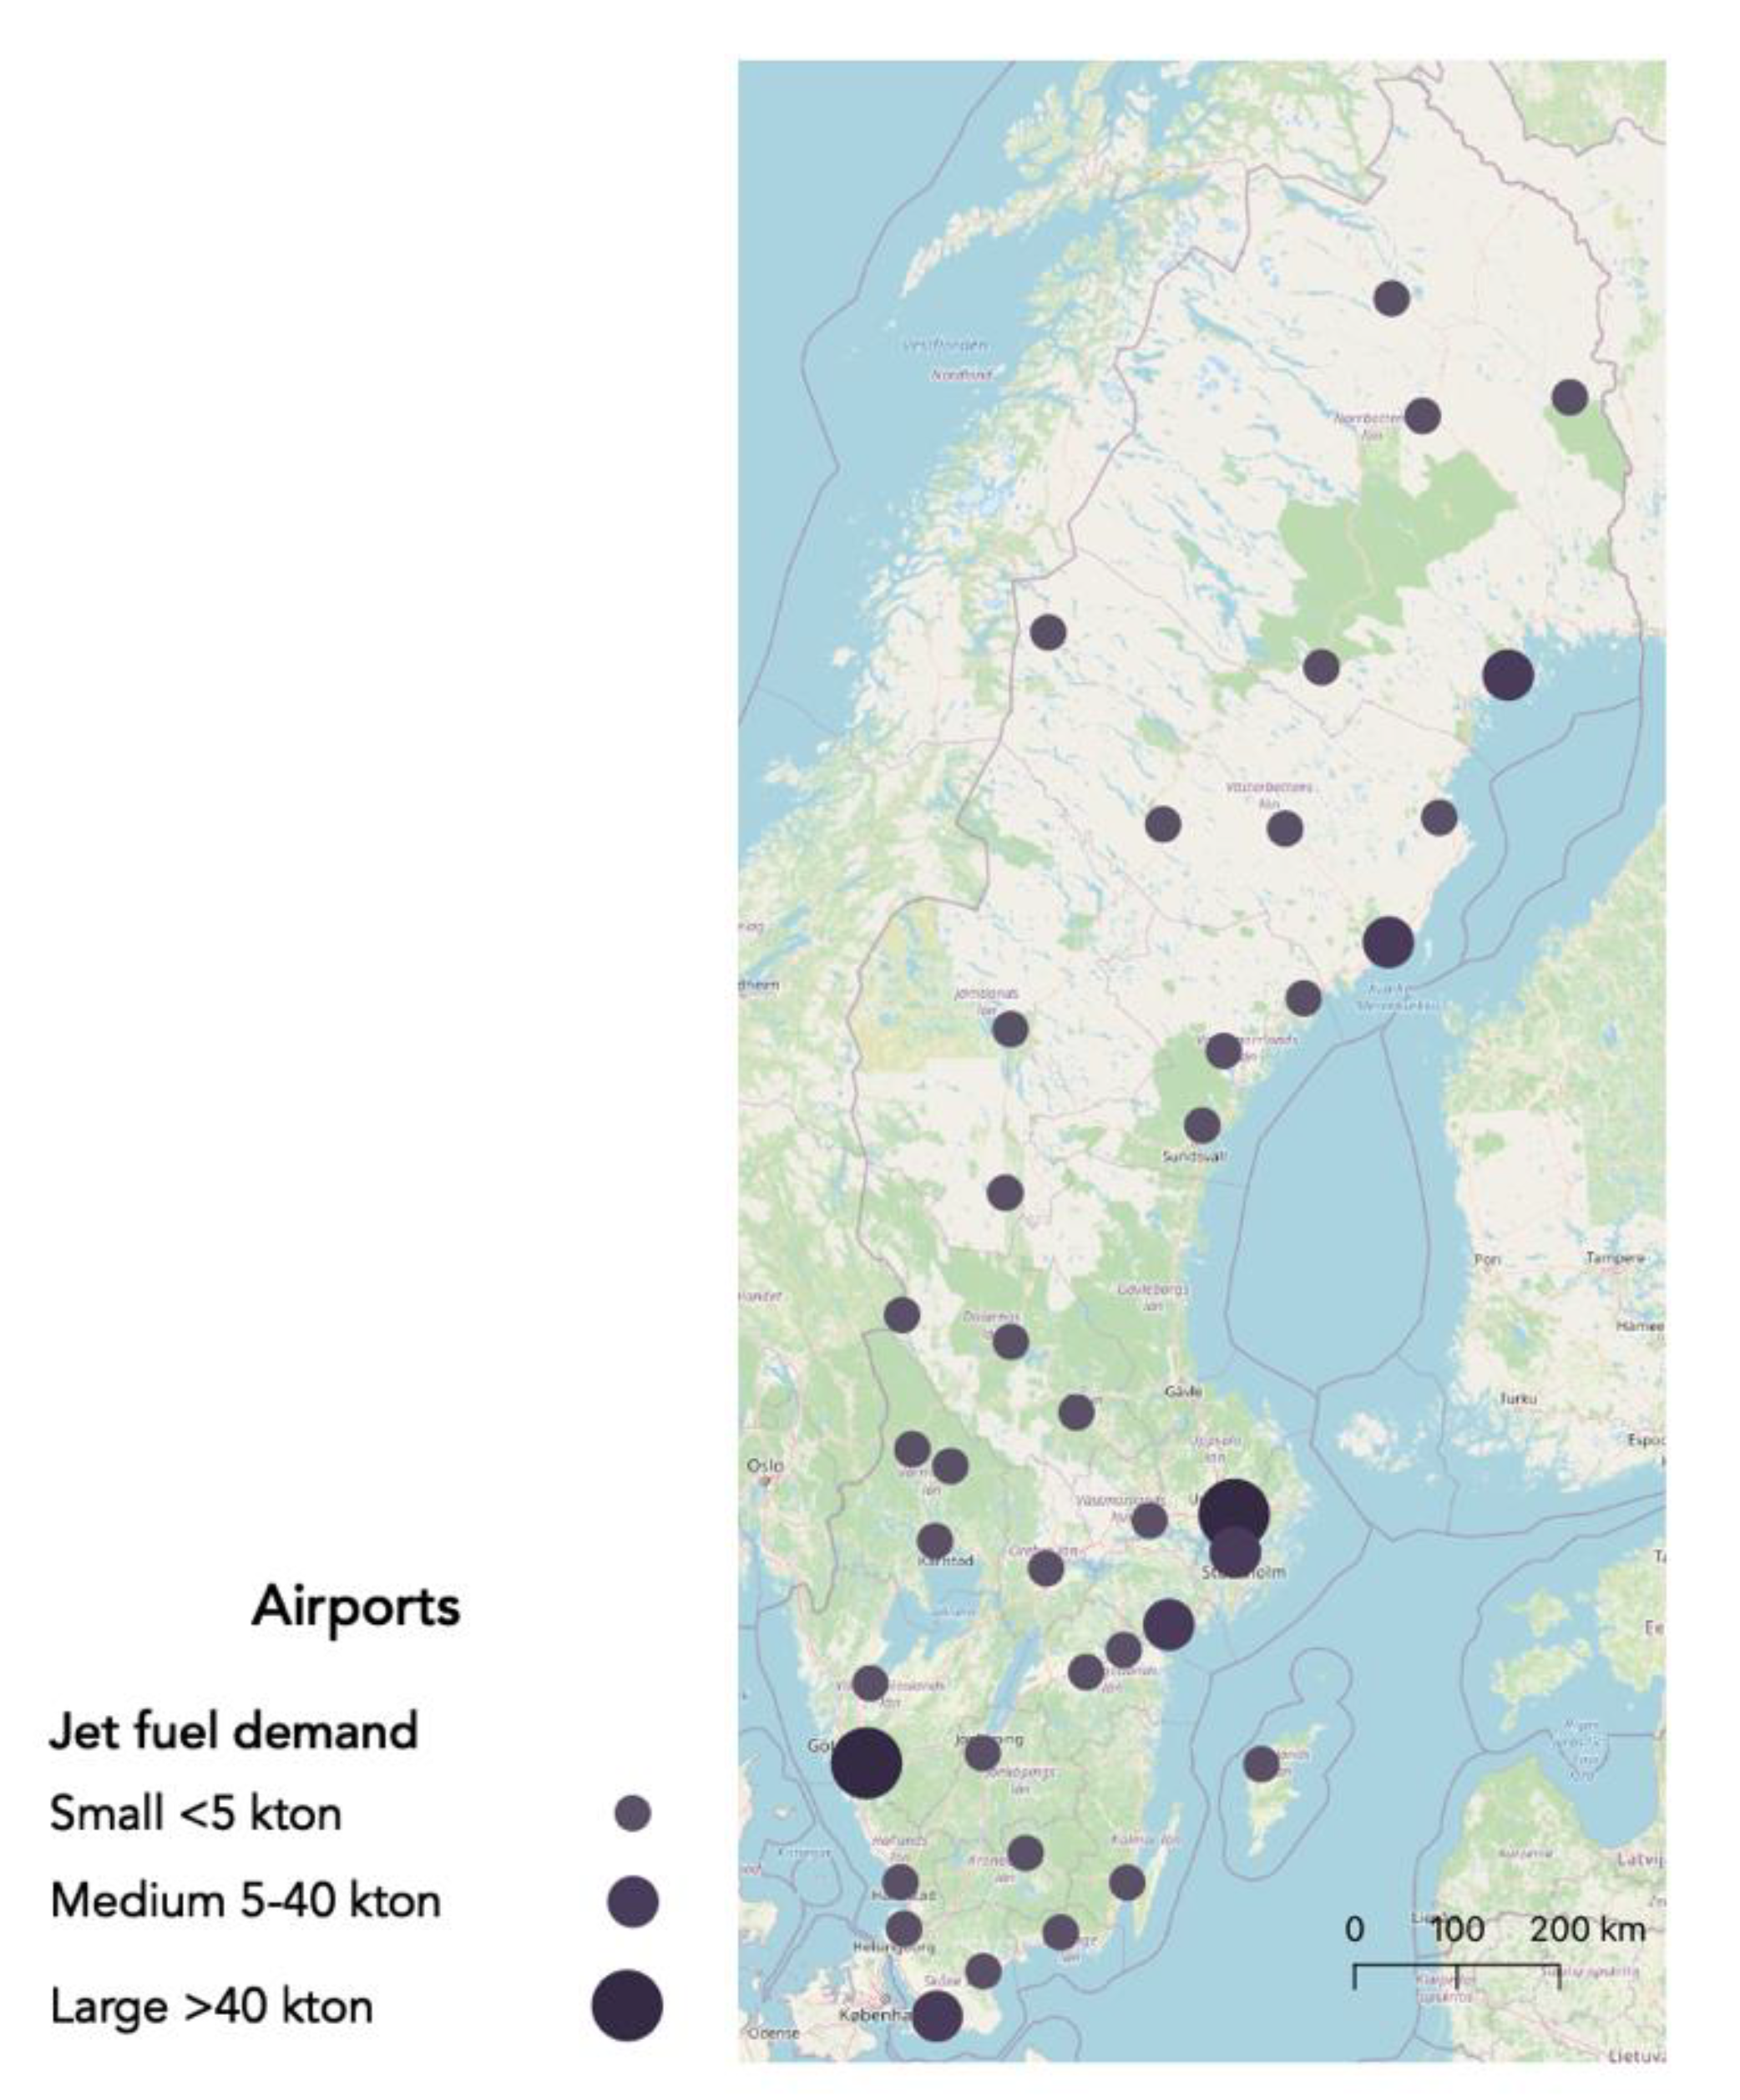
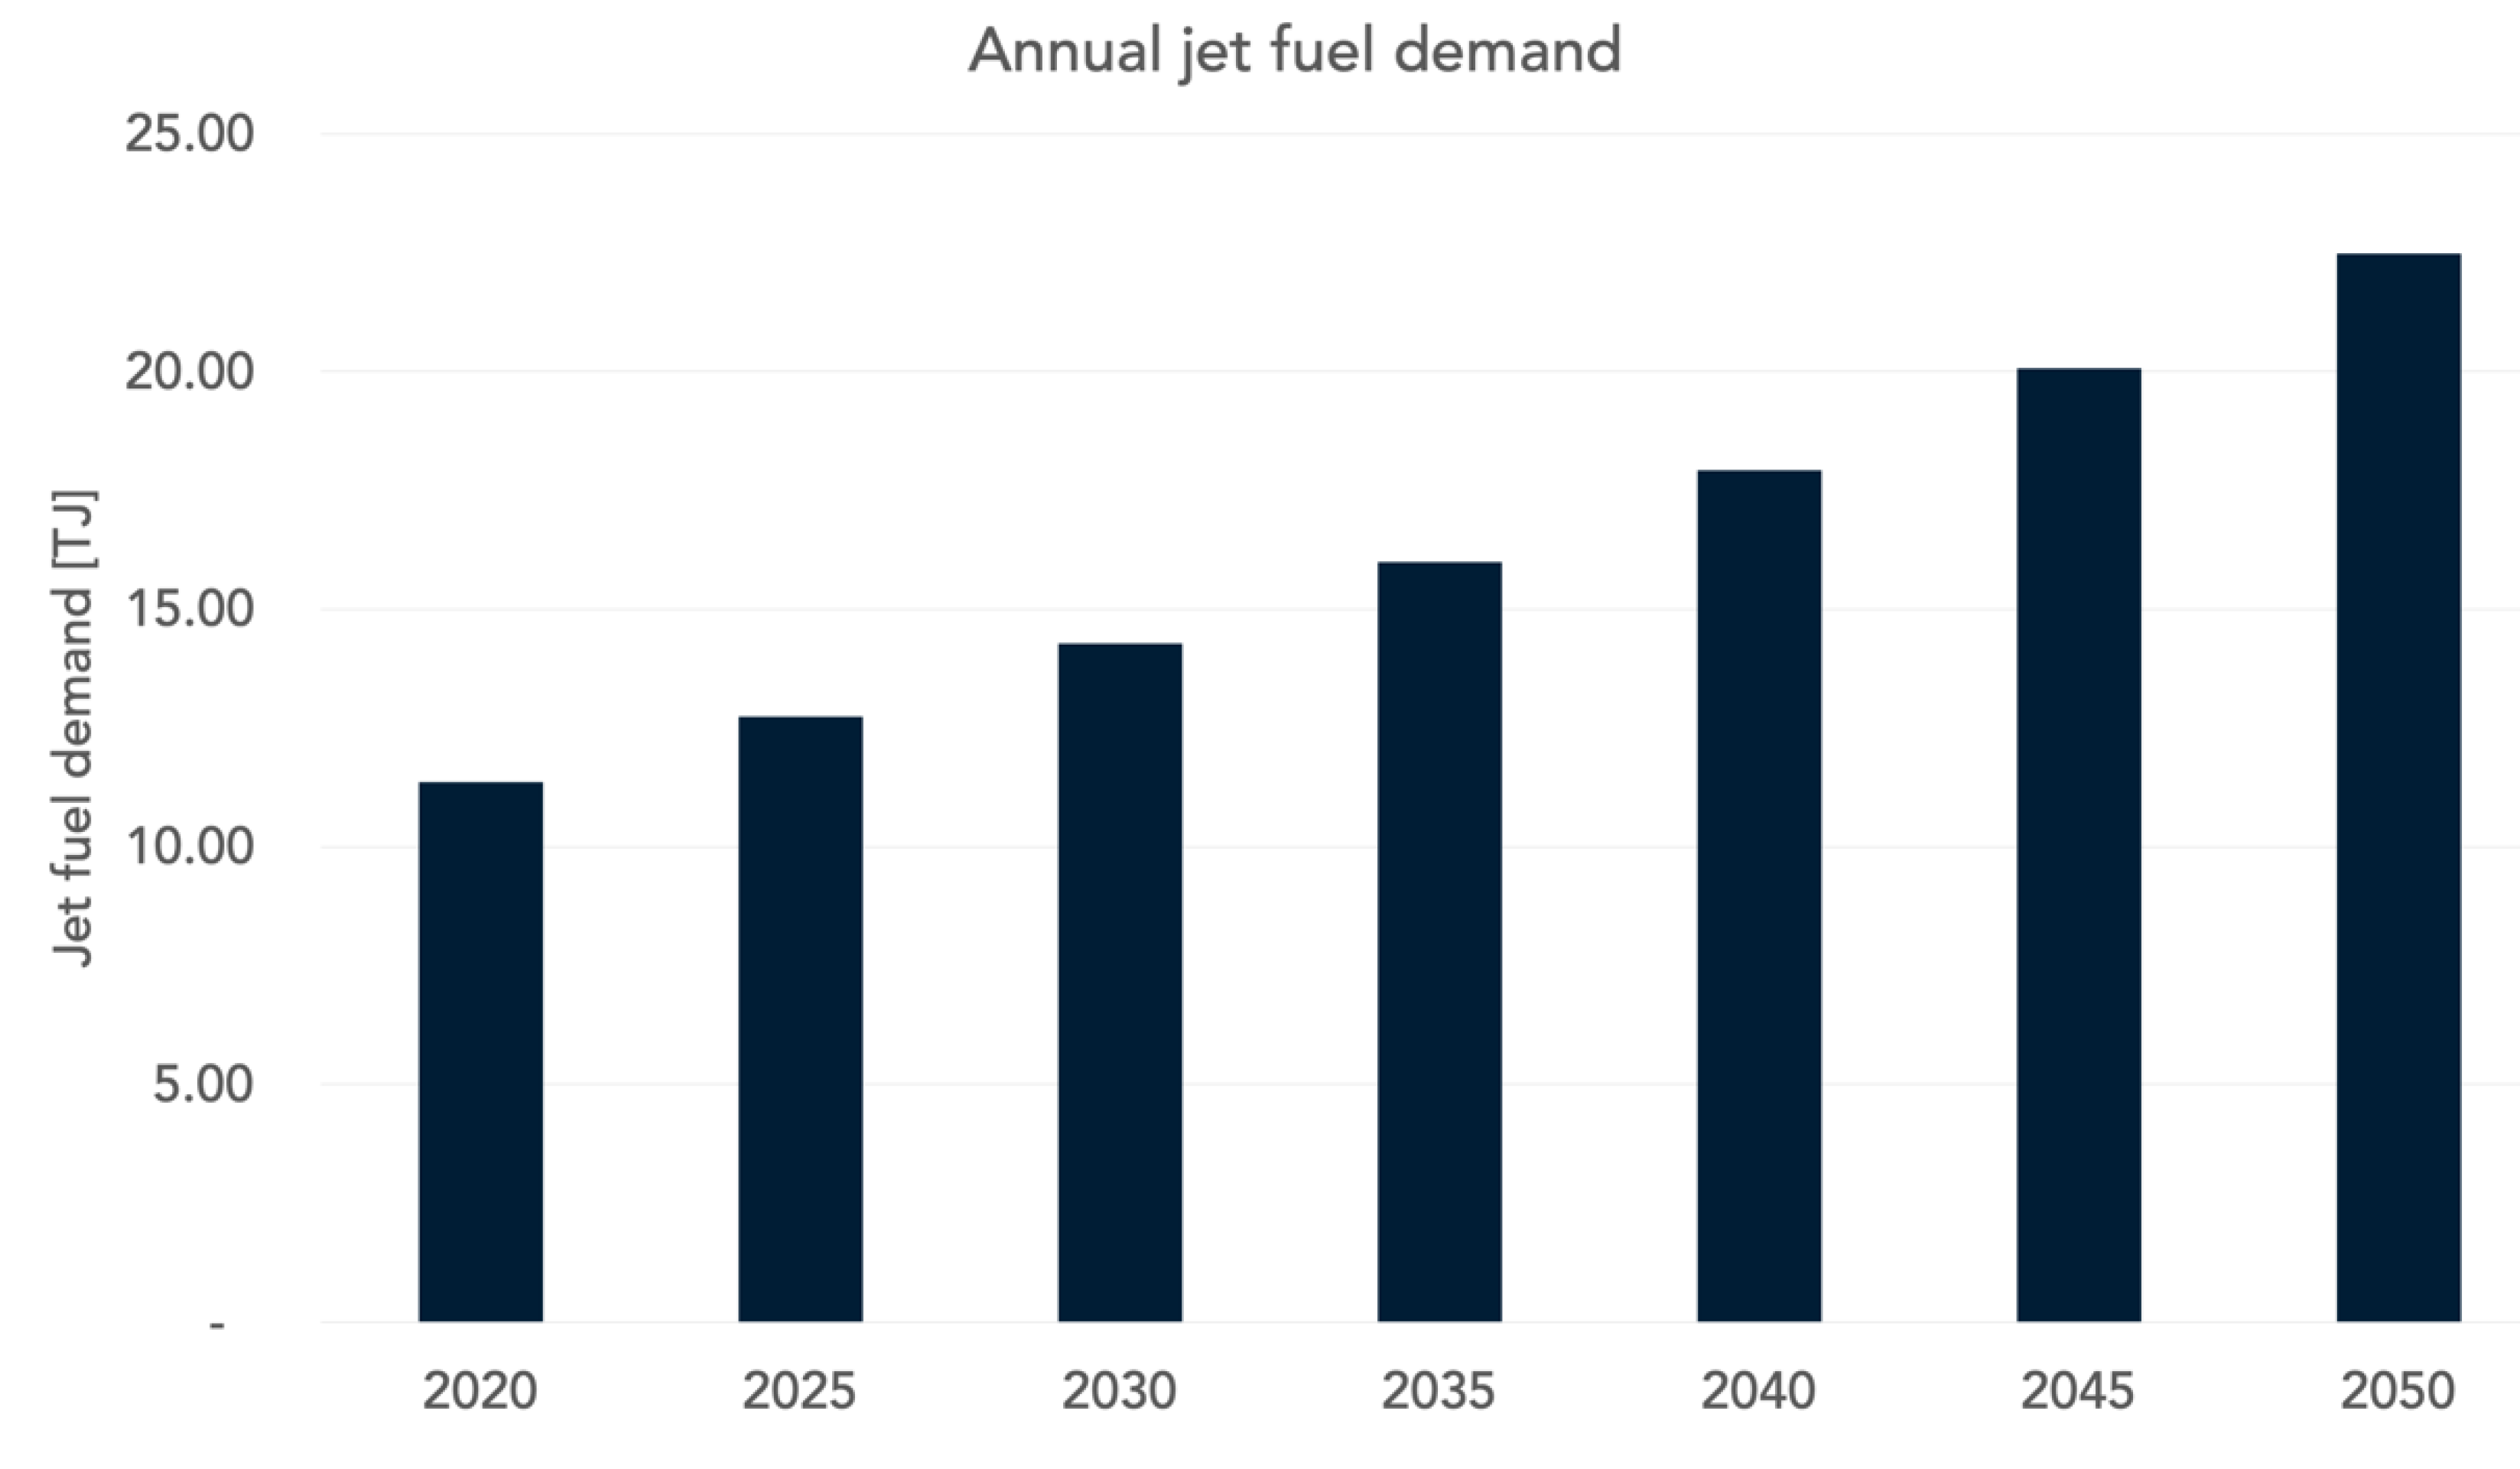
2.5. Jet Fuel Demand

The jet fuel demand for small airports was partly calculated by using the values (for average distance, fuel consumption per passenger and number of passengers travelling in 2019 [74,75]) presented in Table 7 and Equation (3) and partly by contacting the airports [125,126,127,128,129,130,131] to retrieve information on annual jet fuel demand. For medium–large scale airports, the fuel consumption was calculated by applying methodology from ICAO [132], considering domestic and international flights. The domestic and international flight frequencies were based on [133], using the annual average between 2015–2019. The airport fuel demand only considers flights departing from the Swedish airports.
Fuel   demand small   airport =   f ~ passenger · (   p ~ a , Europe · δ Europe +   p ~ a , domestic · δ domestic )
In Figure 5, a map of the location of the airports with their estimated annual jet fuel demand in 2020, is provided. In 2020, the Swedish Transport Administration investigated the future trends in commercial aviation in Sweden [134] and forecasted an average growth of 2.3% in passenger frequency for both domestic and international flights until 2040 [134], which was used in this study for the estimation of future jet fuel demand. In Figure 6, the projection of jet fuel demand per year is presented.
For the transportation of RJF, only transport by trucks from the production sites to the airport demand sites were considered. The distance from the sites were modeled in QGIS 3.16 [135] using a straight-line approximation. Further details on the truck transportation and the technoeconomic data used is provided in the Supplementary Materials in Table S5, based on data from [136,137,138].

2.6. Life Cycle Emissions

In this study, the life cycle GHG emissions during the production of jet fuel were considered for the feedstock cultivation and processing for FT and HTL, for the feedstock to fuel conversion for FT, and for the chemicals and catalysts used during the PTL production. For HTL, the GHG emissions during feedstock to fuel conversion is assumed to be zero [139]. The emissions from the electricity consumption during production and the transport from production to demand site were considered for all three pathways. For PTL, the biogenic CO2 captured was assumed to have zero emissions and therefore assumed to be accounted for by the industrial facilities instead, as applied by [140]. The grid emission factor is assumed to decrease as more renewable energy is introduced to the electricity grid system of Sweden. As mentioned in Section 2.3, the electricity generated from the CHP plants is utilized in the process for the PTL jet fuel production. The electricity from the CHP plants is assumed to have zero emissions and have the same electricity prices as presented in the Supplementary Materials in Table S4. However, if additional electricity from the grid is required during the production of PTL jet fuel at the CHP plants, the grid emission factor will be considered. The emission factors used in the modeling are presented in Table 8.

2.7. Optimization Model

A Mixed Integer Linear Programming (MILP) optimization model was developed using Python 3.9 and the PuLP 2.4 library to solve the Facility Location Problem [142,143,144]. The spatial (supply chain components as presented in Figure 2) and temporal (multi-years assessment from 2020 to 2050) aspects are incorporated in the model. The objective of the MILP optimization model was to minimize the system cost of the supply chain, while determining an optimal location and production capacity of the jet-fuel plants. The model only considers the aviation sector in Sweden, considering the production of RJF from FT, HTL and PTL conversion pathways at the sawmills and industrial facilities, and the demand of jet fuel from and transportation of RJF to airports.
In the model, the production of FT, HTL and PTL are required to meet the jet fuel demand set by the blending mandate, while HEFA has been excluded since the feedstocks used for HEFA are either 1st generation feedstocks or are limited in supply. However, in the model, HEFA and CJF can be used to meet the remaining jet fuel demand that is not covered by the blending ratio, in which the choice is optimized based on their market prices and the internalized cost of emissions. For the RJF production, the GHG emissions during production and transport is included, which are based on the emission factors in Table 8.
As Equation (4) shows, the objective function comprises the cost of production, transport, raw materials, emissions, revenues from by-products and the cost of purchasing HEFA and CJF. A detailed mathematical formulation is provided in the supplementary materials in Section S3.
Minimise   C S = C P C N + C T + C R + C E + C HEFA , CJF
  • CS Total system cost of supply chain
  • CP Total cost of production
  • CN Total revenues from by-products
  • CT Total cost of transport
  • CR Total cost of raw materials
  • CE  Total cost of emissions
  • CHEFA, CJF Total cost of HEFA and/or CJF

2.8. Scenario Description

To investigate the potential of producing RJF in Sweden, six scenarios were developed:
  • Reference scenario (REF)
  • Scenario 1–Higher carbon tax (SC1-HCT)
  • Scenario 2–Higher blending mandate (SC2-HBM)
  • Scenario 3–Higher carbon tax without blending mandate (SC3-HCT-B)
  • Scenario 4–Higher or lower raw material availability (SC4-RMA)
  • Scenario 5–Inclusion of penalty fee (SC5-PF)
The scenarios are presented in Table 9. As the scenario names indicate, the parameters considered for the scenarios were the carbon tax for emissions, the blending ratio of the blending mandate policy, the availability of raw materials used in the processes of the conversion pathways and the penalty fee from the blending mandate policy.
A base case was modeled in REF to be compared with the other scenarios. In REF the variables have been set partly based on information found in the literature review and partly from other references that reflect the current situation in Sweden. The carbon tax was set to a constant 1.2 SEK/kgCO2 [36] throughout the years. As mentioned in Section 1.2, a blending mandate for RJF in Sweden is effective from 2021, starting with a blending ratio of 0.8%, rising to 27% in 2030. In REF, the blending mandate was included without considering a penalty fee, starting with a blending ratio of 0% in 2020 and was gradually increased to 4.5%, 27%, 39%, 51%, 63% and 75% in 2025–2050, respectively. As mentioned in Section 2.1, in the modeling, HEFA was not included in the blending mandate since the feedstocks used for HEFA are either 1st generation feedstocks or are limited in supply. Therefore, priority was instead set on domestic production of RJF from forestry residues and captured biogenic CO2 for the blending mandate. As mentioned in Section 2.3, the availability of forestry residue was set at 30% of the output capacity from the sawmills and for the CO2 the recoverable share from the capturing process was set to 70% and 100% for the E-PRTR industries and biofuels and biogas plants, respectively.
In SC1-HCT, the carbon tax was increased to investigate how the life cycle emissions could affect the results of the optimization model. From the base value of 1.2 SEK/kgCO2 in 2020, the carbon tax was increased based on the annual percentage increase on the price of EU ETS emission allowances as modelled by [104] from 2018–2050. The carbon tax was set to 1.44, 2.54 and 4.4 SEK/kgCO2 in 2030, 2040 and 2050, respectively. For 2025, 2035 and 2045 the carbon tax was interpolated from the values of the year before and after.
In SC2-HBM, the impact of implementing a higher blend ratio for the blending mandate was investigated, aiming to reach 100% in 2050. The blending ratio for 2025–2050 was set to 6.7%, 40%, 55%, 70%, 85% and 100%, respectively.
In SC3-HCT-B, the blending mandate has been removed while the carbon tax is further increased and builds upon the SC1-HCT scenario. From the base value of 1.2 SEK/kgCO2 in 2020, the carbon tax was set to 2.4, 2.9, 4.0, 5.1, 6.9 and 8.7 SEK/kgCO2 in 2025–2050.
In SC4-RMA, the availability of forestry residue was gradually reduced from 30% in 2020 to 10% in 2050 as the demand from other sectors would increase. For the recoverable share of CO2 from the industries, the share was assumed to increase due to technological improvements. The starting value of the carbon capturing efficiency was set to 70% in 2020 [65], and gradually increased to 100% for the E-PRTR facilities. The sources of CO2 derived from the biogas and biofuel plants were set at a constant 100% throughout the time frame as they emit relatively pure streams of CO2.
In SC5-PF, the penalty fee of 6 SEK/kgCO2, eq from the blending mandate is implemented and imposed on jet fuel suppliers that fail to fulfill the requirements of the blending ratio. While HEFA is not included in the blending ratio, the penalty fee is only imposed on CJF when the blending mandate is not fulfilled. When the penalty fee was not taken into account (in REF, SC1-HCT, SC2-HBM, SC3-HCT-B, SC4-RMA), a constraint was set in the optimization model in which the blending mandate had to be met by an RJF production, setting the RJF production strictly equal to the blending ratio requirement. In SC5-PF, the constraint was changed to count for the penalty fee, in which the RJF production could be less than or equal to the blending ratio requirement. As for the entire jet fuel demand, any type of jet fuel (FT, HTL, PTL, HEFA or CJF) can be used. Further details of the modeling are described in the Supplementary Materials in Section S3, Equations (S23)–(S27).

3. Results and Discussion

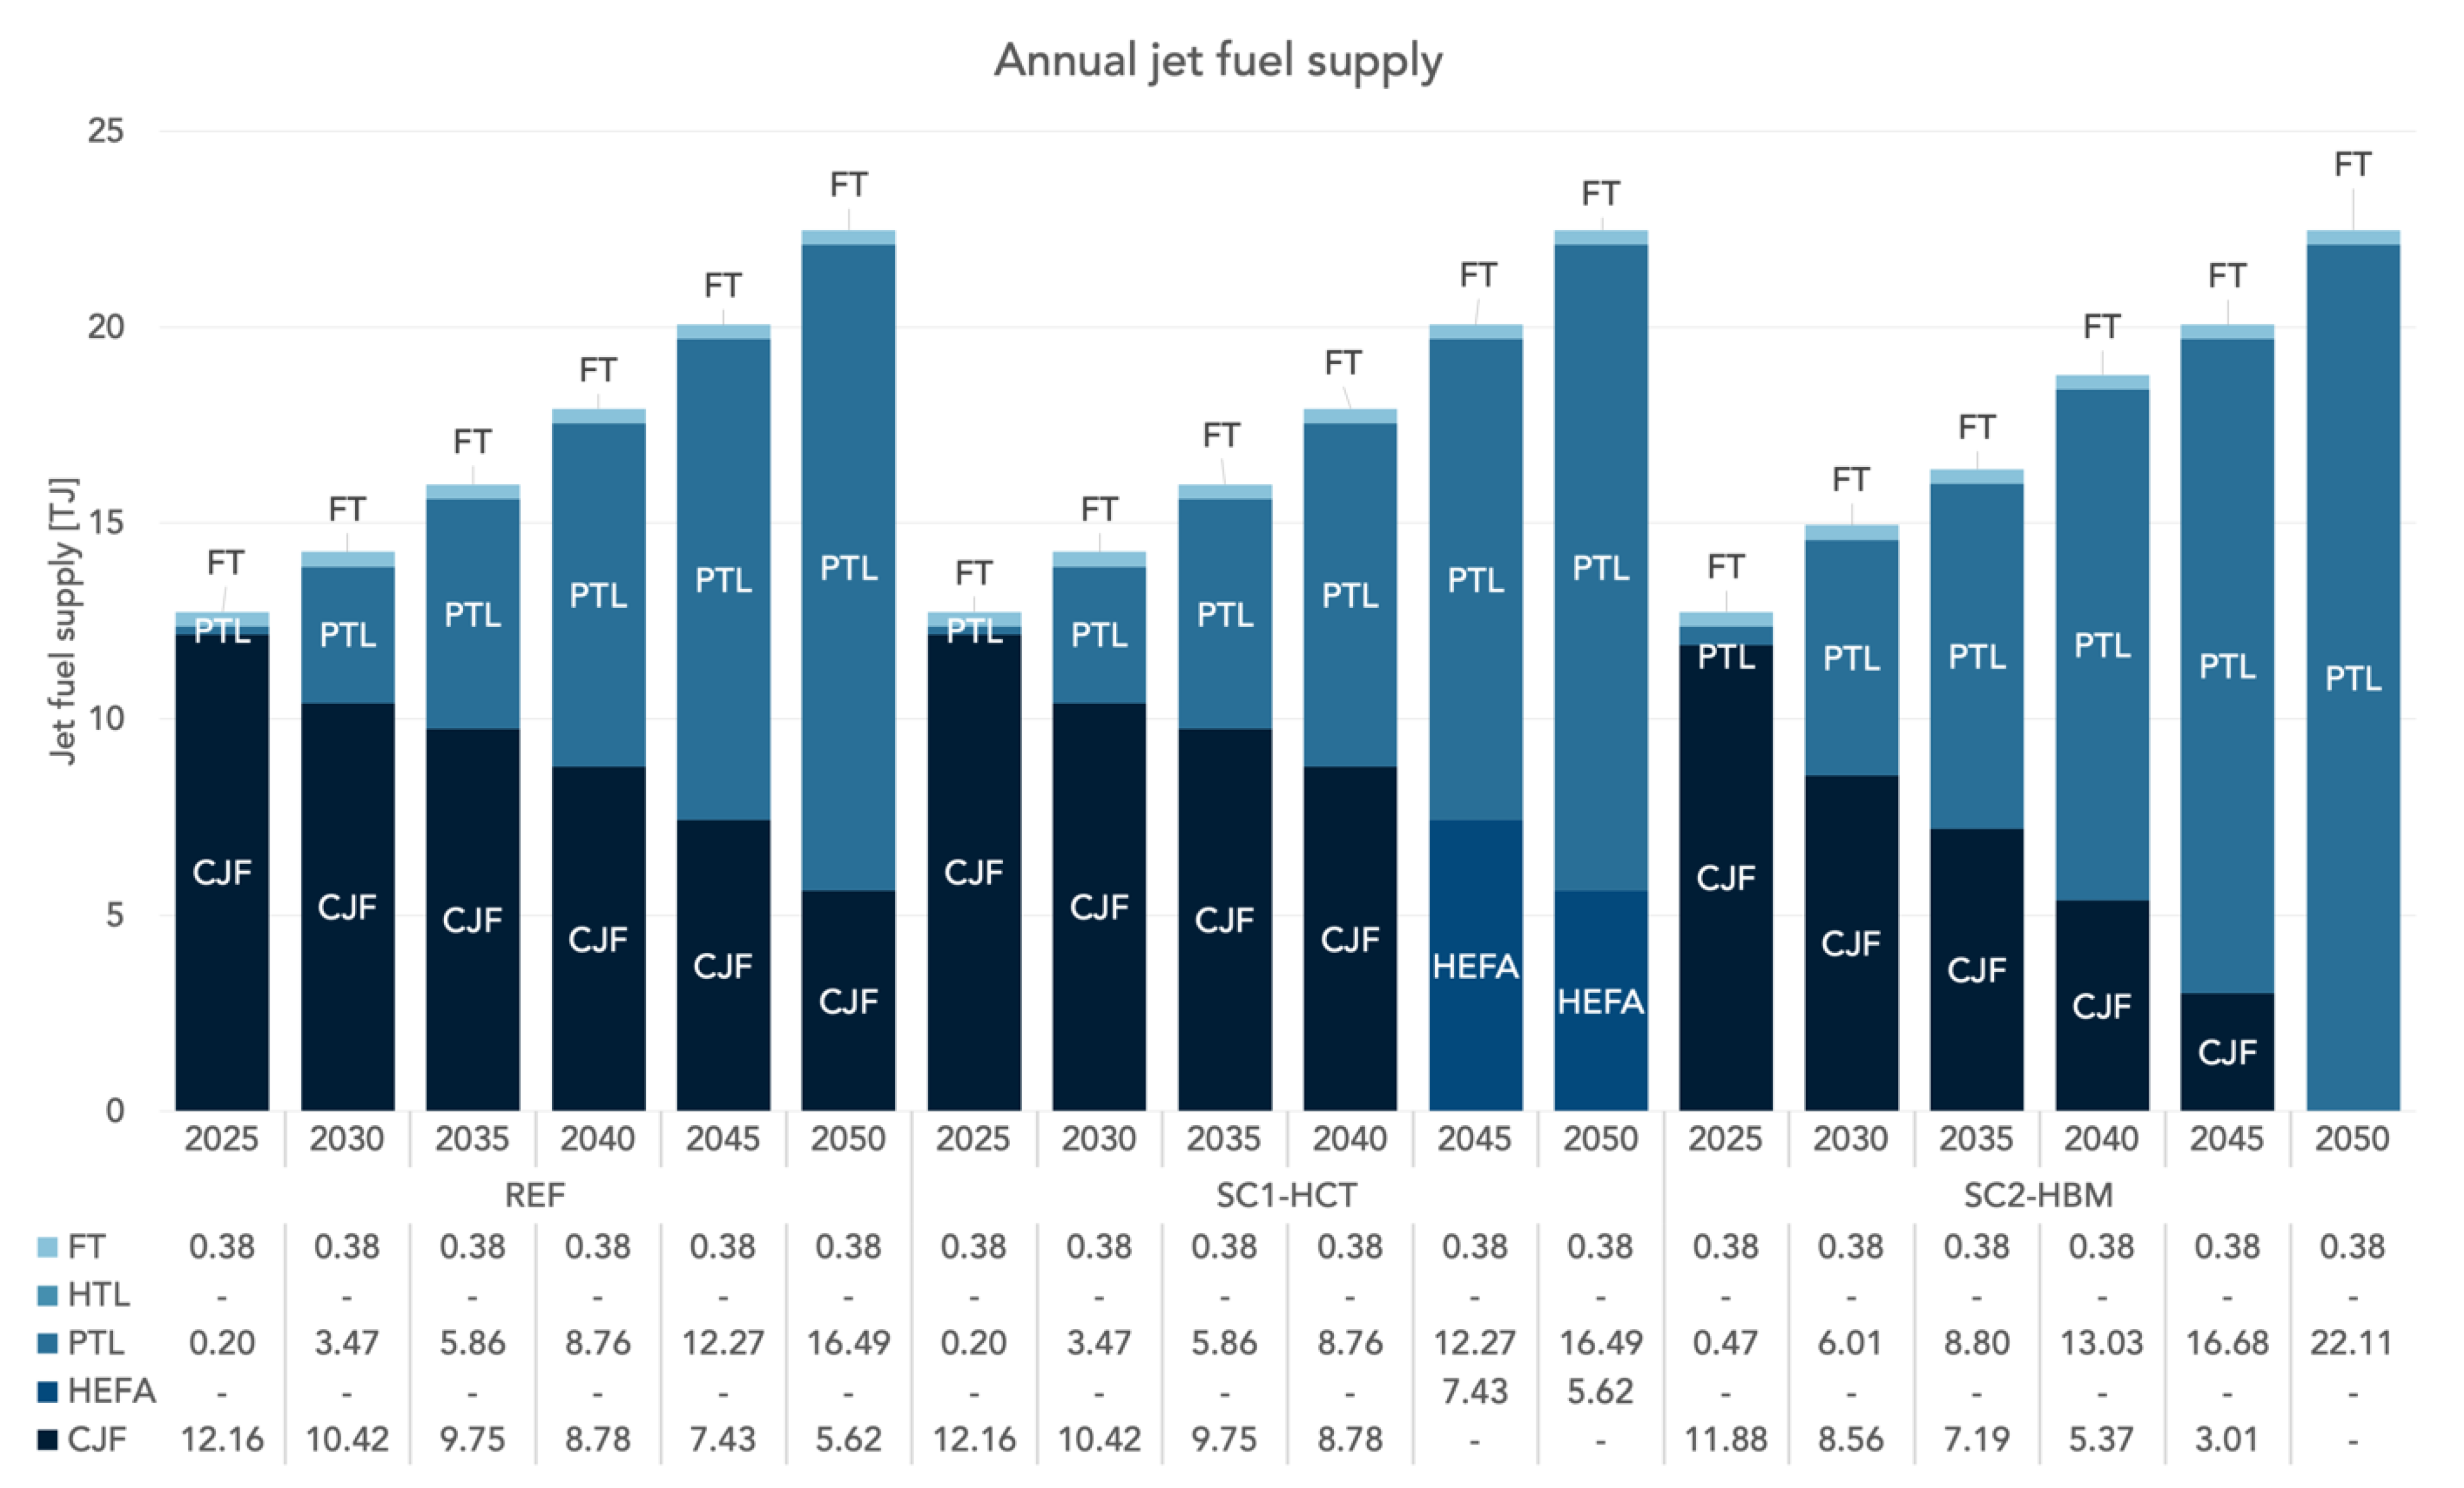
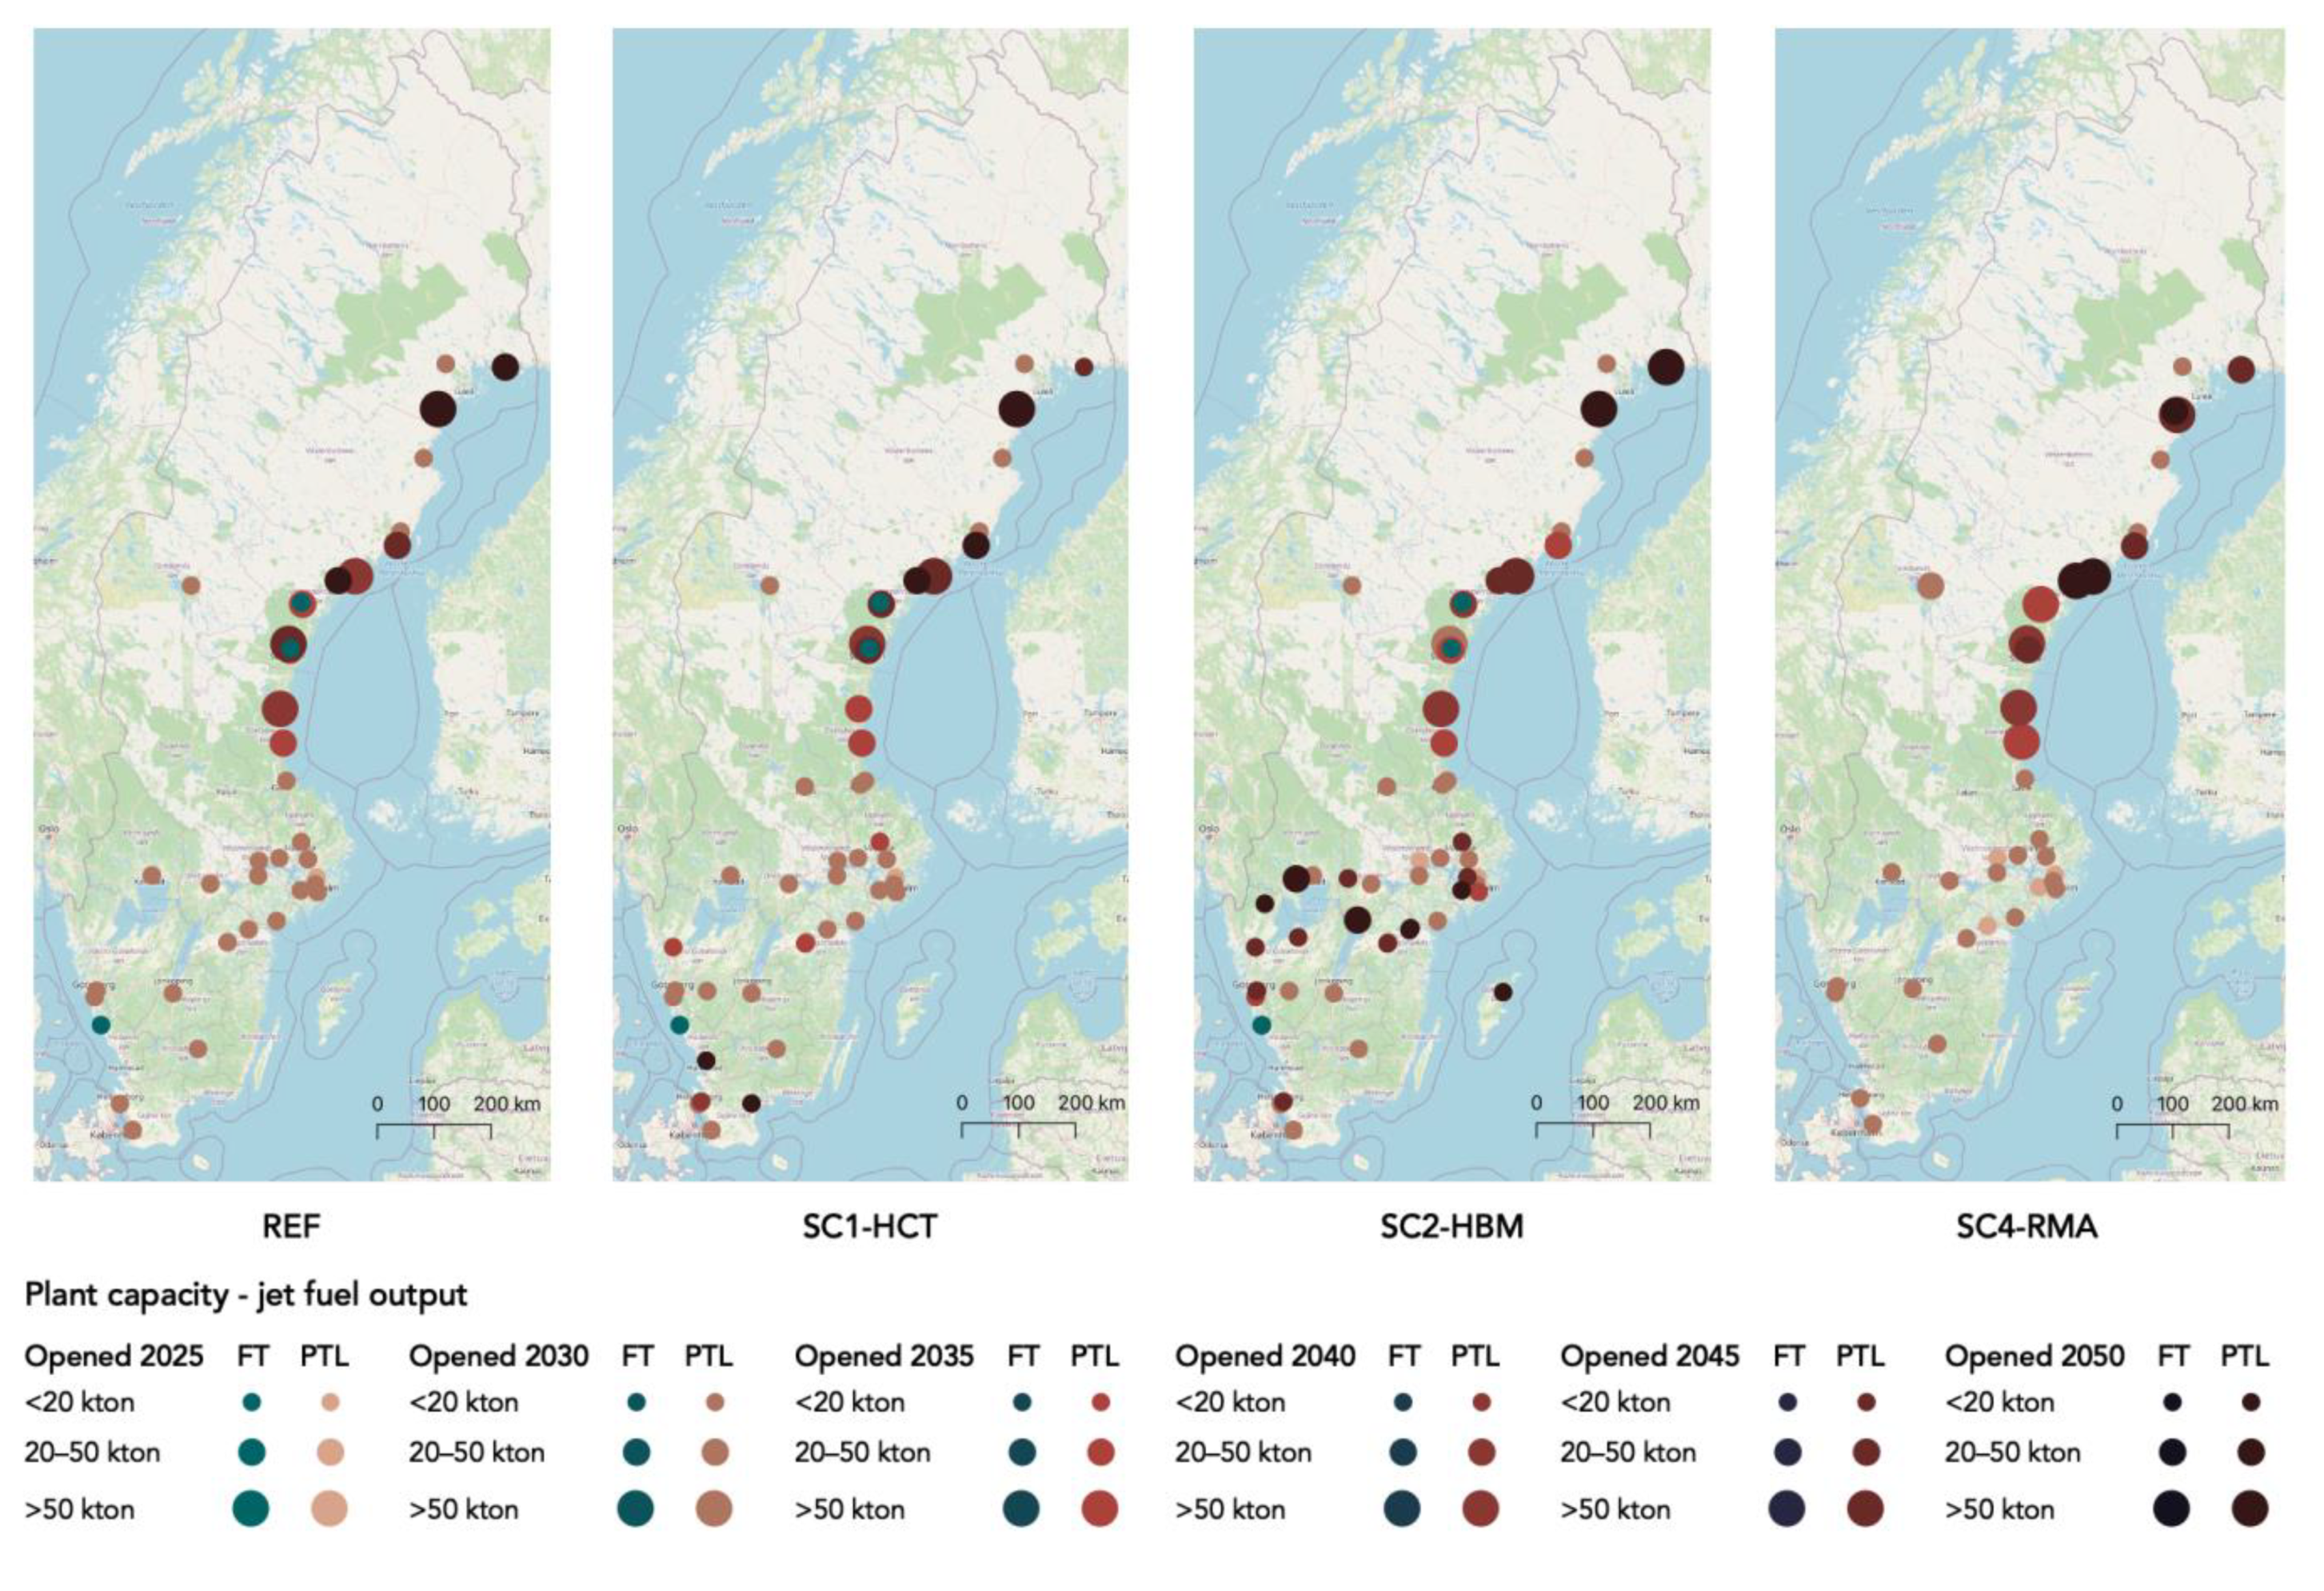
3.1. Optimal Conversion Pathway and Production Site

The objective of this study is to evaluate the impacts of aviation policies in Sweden on RJF production in 2020–2050. Several RJF technological conversion pathways were investigated to identify the optimal solutions for minimizing the total system cost considering feedstock supply and demand constraints. The results show different pathways chosen to supply the jet fuel demand during 2025–2050 in all six scenarios (Figure 7 and Figure 8). In the REF, the increased demand of aviation fuels is met by CJF and RJF (through the FT and PTL production pathways). At the beginning of the studied time period, CJF represents most of the supply but is gradually replaced by RJF mainly from the PTL pathway as the blending ratio increases throughout the years, but to a minor extent also from the FT pathway. The small amount of FT is likely due to the constraints set on forestry availability. As mentioned in Section 2.1, in this study, HEFA was not included in the blending mandate because the priority was given to domestic RJF production from forestry residues and biogenic CO2. This explains why HEFA is not selected to meet the blending mandate of the jet fuel demand in the REF. Furthermore, HEFA has a higher market price (10.81 SEK/liter) compared to CJF (2.31–4.18 SEK/liter) in 2020–2050 (Table 6).
In SC1-HCT, with an increased carbon tax (Figure 7), the results are similar to REF at the beginning of the studied time period. In SC1-HCT the jet fuel demand was met by CJF, PTL and FT pathways. However, from 2045, the demand previously met by CJF was entirely replaced by HEFA, indicating that the carbon tax at 3.5 SEK/kgCO2 is effective to substitute the entire supply of CJF. The amount of PTL and FT jet fuel produced is sufficient to meet the blending ratio demand, while the rest of the jet fuel demand is met by HEFA from year 2045. The reason for the latter is that since the market price of HEFA is lower than the production cost of PTL and FT jet fuel (as later presented in Section 3.2), HEFA will substitute the supply of CJF. In this study no upper constraint was set for the availability of HEFA, however, for HEFA to entirely replace CJF and meet a demand of 7.43 TJ in 2045 in Sweden, the current production of HEFA jet fuels would have to increase to also meet the jet fuel demand from markets outside of Sweden. In the EU28, HVO/HEFA had an estimated installed capacity 56.82 TJ in 2019, out of which 8.07 TJ were expected for aviation biofuels [145].
In SC2-HBM, with the increased blending mandate, the production of PTL increased while the amount of FT remains the same, compared to REF (Figure 7). The blending mandate demonstrates an effective policy to promote RJF production. An 85% blending mandate in 2045 allows a reduction of 75% of CJF supply compared to 2025. Increasing the blending ratio does not have an impact on the production of FT, likely due to the constraints set on the availability of forestry residue. This implies that, given the limited supply potential of forestry residue, locating PTL plants at the industrial sites is more feasible than locating FT or HTL plants at the sawmills since the supply of forestry residues would not be sufficient to produce RJF to meet the blending ratio demand throughout the years.
In SC3-HCT-B, the blending mandate was eliminated, and the carbon tax further increased compared to SC1-HCT. As a result, the entire jet fuel demand is met by CJF in 2020–2025 with a carbon tax of 1.2–2.4 SEK/kgCO2. From 2030, with a carbon tax of 2.9 SEK/kgCO2, the entire demand is met by HEFA when it becomes cost competitive compared to CJF (Figure 8). The results indicate that without the blending mandate, none of the RJF pathways are cost-effective in comparison to CJF or HEFA.
In SC4-RMA, where the lignocellulosic biomass availability is reduced and the CO2 availability increased, PTL is the only cost-effective alternative fuel option (Figure 8). This means that the demand previously met by the small share of FT has been entirely replaced by PTL, thus resulting in no FT-plants opening during the entire time frame. In SC4-RMA, PTL jet fuel meets the entire blending ratio demand while CJF meets the remaining jet fuel demand. Since the availability of forestry residues have been significantly decreased, producing jet fuel through the FT pathway is not considered economically feasible compared to producing jet fuel through the PTL pathway.
In SC5-PF, where a penalty fee is imposed when the blending mandate is not fulfilled, the jet fuel demand is mostly met by CJF coupled with an increasing amount of HEFA between 2025–2045 (Figure 8). The penalty fee was not included in the other five scenarios (i.e., REF, SC1-HCT, SC2-HBM, SC3-HCT-B, SC4-RMA). The results show that the additional cost imposed by the penalty fee is not set high enough to have an impact on the blending mandate, if it has to be met with forestry residue or CO2 and electricity-based jet fuels, since there is no production of PTL, FT or HTL jet fuel. In this case, HEFA becomes more cost competitive than CJF with the additional cost of 6 SEK/CO2, eq and as the price of CJF increases. Ultimately, the jet fuel volume to meet the blending mandate would be fulfilled by HEFA in 2030.
In all scenarios except scenarios SC3-HCT-B and SC5-PF, the amount of RJF corresponding to the blending mandate needs to be fulfilled (see Section 2.8). The type of fuel to meet the demand for jet fuel considers the economic parameters through comparison of RJF production cost (FT, HTL, PTL) or market prices (HEFA, CJF) as well as the internalized cost of emissions by the carbon tax. As a result of this modeling, the amount of RJF produced was sufficient to meet the demand of the blending mandate, while the rest of the jet fuel demand was met by CJF or HEFA. Since the objective of the optimization model was to minimize the total system cost, none of the RJF pathways were considered economically feasible compared to CJF without policies supporting its introduction.
The technology selections in all scenarios through the application of the optimization model are highly dependent on the technological efficiency (yield), availability of resources, the economic parameters, and the spatial location of the plants. Considering the economic parameters for RJF production, FT has the lowest CAPEX and fixed costs compared to HTL and PTL. However, since the availability of forestry residues is limited, the production of RJF from PTL is more favorable than FT and HTL. Additionally, HTL and FT are competing for the same raw material (forestry residues) from the sawmills, but the higher yield of FT makes it a more favorable technology than HTL.
In Figure 9, a map of the optimal production and demand sites in all scenarios, is provided. In REF, a total of 41 plants were optimal to supply RJF, consisting of 3 FT plants and 38 PTL plants in 2050, while no RJF plants appeared in SC3-HCT-B and SC5-PF. In REF, at the beginning of the modeling period, smaller plants were preferred mostly in the southern regions, and as the demand for RJF increases with the blending mandate, larger plants were preferred mostly along the coast in northeast Sweden. Most of the smaller PTL plants are located at CHP plants with proximity to most airports and which also provides electricity without a grid emission factor, while the larger plants are concentrated in areas with lower electricity prices (see Figure 4 for price areas). As presented in Table 5, the production of PTL jet fuel has an electricity demand of 10.84 MWh/tin, which includes the electricity demand for hydrogen production, CO2 capturing and production of jet fuel. In REF, the total electricity consumption for all PTL plants in 2025–2050 was 0.98, 17.19, 28.98, 43.34, 60.7 and 81.58 TWh, respectively. In 2020, the total electricity generation in Sweden amounted to a total of 158.8 TWh, out of which 62% came from hydropower and wind power, 30% from nuclear power and 8% from conventional thermal power [146]. The electricity consumption of the PTL plants corresponds to 0.6%, 10.8%, 18.3%, 27.3%, 38.2% and 51.4% of the total 158.8 TWh. Based on the high electricity consumption of the RJF production from PTL, the results indicate that the location of the plants are more dependent on the availability of resources along with the internalized cost of emission at the beginning of the modeling period, while towards the end, it is more dependent on the electricity pricing as the RJF output capacity increases.
Furthermore, the renewable electricity generation in Sweden would need to increase throughout the time frame to meet the demand for renewable electricity for the PTL pathway and from other sectors as well. Thus, the electricity supply has not been limited in the model.

3.2. Production Cost of Renewable Jet Fuel

In this study, the total system cost encompasses the RJF production cost, the price of CJF and HEFA, the external cost (cost of emissions) from transport, production of RJF, CJF and HEFA as well as the revenues from the by-products diesel, gasoline, and naphtha. The cost parameters included in the total production cost of the RJF pathways were the annualized capital costs (CAPEX), fixed costs, variable costs, raw material (forestry residue and CO2) costs and transport costs.
In Table 10, the production cost per unit of fuel produced for each conversion pathway is presented for 2025–2050. When excluding the revenues from by-products, PTL has the highest unit production cost. By including all cost components while also considering the revenues from by-products, FT provides the lowest production cost at 21.5–22.4 SEK/liter, followed by PTL at 22.9–29.2 SEK/liter. In the model, the price of utilities and by-products were gradually increased and thereby reached the highest cost level towards the end of the time frame. The FT and PTL pathways have quite similar unit production costs and including the revenues from the by-products is an important factor for reducing the production costs of PTL. The results also indicate that the amount of FT jet fuel produced is likely to have been limited by the availability of forestry residue in all scenarios.
The production cost, excluding transport cost, from this analysis is compared with other studies [26,65,108,147] which explore different RJF conversion technologies as a decarbonization pathway through technoeconomic analysis, and in some cases, through a spatial analysis as well. The RJF production cost through the PTL process [65,147] was between 16.8–21.1 SEK/liter and through the FT process [108] between 12.4–18.0 SEK/liter. Another study yielded production costs for PTL at 24.0–69.2 SEK/liter and for FT at 10.2–24.6 SEK/liter [11] (using an exchange rate for USD2021 provided from [111]). This indicates that the results for FT and PTL pathways in this study are within the range of other existing research. The RJF unit production cost is highly dependent on the assumptions made for the economic parameters and the boundaries that were set for the supply chain. In this study, the feedstock cost for FT was likely the major influencing cost component for the higher unit production cost compared to the existing literature. For PTL, the CAPEX and the electricity pricing were likely the main influencing parameters.
Based on the results of this study, the RJF production through FT and PTL pathways are not economically feasible in comparison to CJF or HEFA, which in this study have been modeled with the current market prices of 2.35 and 10.81 SEK/liter in 2020, respectively. Based on these market prices, the resulting unit production cost (without transport costs or revenues) of FT is 693% and 151% higher than the market price of CJF and HEFA, while for PTL it is 1195% and 203%. Since the blending mandate only incorporated FT, HTL and PTL, and the modeling required the blending mandate to be met in all scenarios except SC3-HCT-B and SC5-PF, HEFA was not chosen to meet the jet fuel demand in REF, SC2-HBM and SC4-RMA. However, restricting the HEFA supply could provide incentives for RJF production based on biomass residues and at the same time move towards a more sustainable production pathway as it would avoid potential feedstock competition with food.

3.3. Environmental Performance

The total annual CO2, eq emissions from the supply chain for all scenarios are presented in Figure 10. The figure shows that for REF and SC4-RMA, the emissions increase throughout the years and both scenarios provide a similar outcome for the emissions of CO2, eq. In the other scenarios the emissions decrease in various amounts. The main difference between REF and SC4-RMA is the replacement of RJF from FT with RJF from PTL, however since only a small amount of FT is produced in REF, there is only a small difference in emissions between the two scenarios. As shown in Figure 10, increasing the carbon tax in SC1-HCT does not affect the amount of emissions during 2025–2040, resulting in the same amount of emissions as REF. Not until 2045, when the carbon tax has been increased to 3.5 SEK/kg CO2, eq does the carbon tax take effect, resulting in the emissions plummeting as the CJF is entirely replaced by HEFA. However, as the blending mandate is increased in 2050, a higher PTL amount is introduced, resulting in higher emissions. The results indicate that PTL has a higher overall emission factor than HEFA, which is likely due to the choice of grid emission factor.
Implementing a higher blending mandate in SC2-HBM has also shown to be effective to reduce the emissions, as CJF is gradually replaced by RJF. In SC3-HCT-B, a significant reduction in emissions is achieved as the blending mandate is removed and the carbon tax set to a level in which CJF is completely replaced by HEFA to meet the jet fuel demand. In SC5-PF, the emissions are gradually decreased compared to REF and follows a similar trend as in SC2-HBM until HEFA is gradually increased from 2030.
In Table 11, the potential emissions reductions relative to REF and from continuing to only use CJF, is presented. SC3-HCT-B provides the highest reduction potential of the assessed scenarios.
The CO2 emissions per unit fuel produced were 2.68 gCO2, eq/MJ jet fuel for FT, and 46.11 gCO2, eq/MJ jet fuel for PTL. Including the transport emissions only yields an insignificant difference. As presented in Table 8, the emission factor of HEFA was set to 16 gCO2, eq/MJ, which confirms that the higher emissions in 2050 relative to 2045 for SC1-HCT is due to the higher emission factor of PTL. The emissions from the grid are also included in the emission factors of FT and PTL, based on the electricity consumption during production of these fuels. The grid emission factor considers an electricity mix including all electricity generation in Sweden. Therefore, the choice of grid emission factor has an important impact on the emissions related to the electricity consumption, especially during the PTL production process. By only considering renewable energy for the PTL production, the resulting emission factor would be significantly reduced.
Previous studies [65,139] have yielded an emission factor of 6 gCO2, eq/MJ jet fuel for FT from forestry residue and 19 gCO2, eq/MJ jet fuel for PTL. Based on this, the resulting emission factors from this study are rather different, with a significantly lower emission factor for FT and higher for PTL, which are most likely due to the low level of detail for the life-cycle emissions and somewhat different assumptions. Since a detailed life-cycle assessment was not within the scope of this paper, the emissions from the RJF production were considered by using emission factors for the forestry residue cultivation and collection, feedstock to fuel conversion for FT, chemicals and catalysts used during PTL jet fuel production, electricity consumption from the grid and the transport of jet fuel to airports. The choice of only including these emission factors was mainly due to limited data availability.

4. Conclusions and Policy Implications

This study sheds lights on the impact on aviation fuel production of aviation policies in Sweden, namely carbon price, blending mandates and penalty fee. An optimization model incorporating spatial, temporal, environmental and technoeconomic aspects was developed which is valuable as a decision-making tool for planning and designing supply chains for RJF fuel provision. The results demonstrate the importance of implementing policy instruments to promote the production of RJF in Sweden. Furthermore, the model and the results from the model can also be used to plan, design, and optimize the relative influence of different policy instruments.
Sweden has abundant domestic resources (forestry residues, biogenic CO2 and renewable energy) to produce sustainable RJF, provided the provision of effective policy supports are in place. The blending mandate is indicated to be an effective policy to both promote the RJF production while reducing emissions, given that possible associated penalty fees are high enough to stimulate the use of RJF. The inclusion of a penalty fee at the present level (6 SEK/kgCO2, eq), which is imposed to the supplier if they fail to meet the blending mandate, is not significant to justify the production of RJF from FT, HTL or PTL. It does however justify the utilization of HEFA with a market price of 10.81 SEK/liter. The PTL process can generate additional revenues from selling the by-products of diesel and gasoline, making it economically feasible to meet the jet fuel demand set by the blending mandate when a strict requirement is set without the penalty fee. In the PTL process, revenues could also be generated from additional by-products such as heat and oxygen, however this was not included in this study.
The optimal location of the RJF production plants for PTL were found to be at CHP plant sites with electricity generation and proximity to most airports or in the northern part of Sweden providing the lowest electricity prices (pricing areas SE1 and SE2). The RJF through PTL demands high electricity consumption. Areas with higher electricity prices indicates a limited capacity of the transmission grid, which could affect the production cost and output capacity of RJF from PTL. In terms of RJF from the FT process, the most cost-effective production facilities are found in the southern part of Sweden, indicating that this type of RJF production is not as dependent on electricity prices.
The analysis also reveals that increasing the carbon tax, without implementing a blending mandate, from today’s level of 1.2 SEK/kgCO2 to 2.9 SEK/kgCO2 could be effective in replacing CJF with an alternative fuel that has a lower emission factor, i.e., HEFA. However, implementing a higher blending mandate while the carbon tax remains at the current level, will only result in a gradual phasing out of CJF. A higher blending mandate and carbon price will accelerate the transition towards renewable and sustainable fuels for the aviation industry in Sweden.
For future research, the analysis performed within this study could be expanded by incorporating more details to the technoeconomic, environmental and spatial parameters. To further investigate the potential of producing RJF in Sweden, other conversion pathways (i.e., ATJ, pyrolysis, etc.) could also be included in the analysis. By including other or more pathways, other feedstocks could also be considered and allow for a broader spatial range for the production sites. Further investigation could also include assessing the potential effect on modal shift (i.e., shift from air transport to other transport modes) and other emissions as well as evaluating and monitoring potential social effects from different policy measures such as taxes and fees. In general, detailed impact assessments before implementation and control stations where the impacts of the implemented policies are assessed by the national authorities from a broader perspective, i.e., considering several environmental and social targets, represent one way of initiating this.

Supplementary Materials

The following are available online at https://www.mdpi.com/article/10.3390/en14217194/s1, Table S1: Properties of biomass and fuel products., Table S2: Currency data and index values., Table S3: Properties used to calculate CO2 release from biofuel and biogas upgrading plants., Table S4: Annual electricity prices per pricing area., Table S5: Transport parameters and costs., Table S6: Sets and decision variables used in the proposed optimization model.

Author Contributions

Conceptualization, J.T., F.H., A.F. and J.H.; Data curation, J.T. and F.H.; Formal analysis, J.T., F.H., A.F. and J.H.; Funding acquisition, F.H.; Investigation, J.T., F.H., A.F. and J.H.; Methodology, J.T. and F.H.; Project administration, J.T., F.H., A.F. and J.H.; Resources, J.T., F.H., A.F. and J.H.; Software, J.T.; Supervision, F.H., A.F. and J.H.; Validation, J.T.; Visualization, J.T.; Writing—original draft, J.T. and F.H.; Writing—review and editing, J.T., F.H., A.F. and J.H. All authors have read and agreed to the published version of the manuscript.

Funding

This research received no external funding.

Data Availability Statement

The study did not report any data.

Acknowledgments

This work benefited from the financial support provided by the Research Initiative on Sustainable Industry and Society (IRIS) (https://www.kth.se/en/itm/forskning/iris/om-iris (accessed on 22 October 2021)) at KTH Royal Institute of Technology, Sweden. We also gratefully acknowledge financial support from the Swedish Energy Agency and the Swedish Knowledge Centre for Renewable Transportation Fuels (f3) [project carried out within the collaborative research program Renewable transportation fuels and systems program (Samverkansprogrammet Förnybara drivmedel och system) “Project no. P48357-1”].

Conflicts of Interest

The authors declare no conflict of interest.

References

  1. International Energy Agency (IEA). Data and Statistics—CO2 Emissions by Sector, World 1990–2018. 2020. Available online: https://www.iea.org/data-and-statistics/data-browser/?country=WORLD&fuel=CO2%20emissions&indicator=CO2BySector (accessed on 10 September 2021).
  2. Zhang, R. The role of the transport sector in energy transition and climate change mitigation: Insights from an integrated assessment model. In Transport and Energy Research; Zhang, J., Ed.; Elsevier: Amsterdam, The Netherlands, 2020; pp. 15–30. [Google Scholar] [CrossRef]
  3. Hoen, A.; van Grinsven, A.; Kampman, B.; Faber, J.; van Essen, H.; Skinner, I. Research for TRAN Committee—Decarbonisation of EU Transport, European Parliament, Policy Department for Structural and Cohesion Policies. 2017. Available online: https://www.europarl.europa.eu/RegData/etudes/STUD/2017/601989/IPOL_STU(2017)601989_EN.pdf (accessed on 6 November 2020).
  4. Klkş, B.; Holistic, A. View of Sustainable Aviation. In Sustainable Aviation; Karakoc, T.H., Colpan, C.O., Altuntas, O., Sohret, Y., Eds.; Springer International Publishing: Cham, Switzerland, 2019; pp. 97–117. [Google Scholar] [CrossRef]
  5. International Energy Agency (IEA). World Energy Statistics. 2016. Available online: https://www.oecd-ilibrary.org/content/data/data-00510-en (accessed on 15 September 2020).
  6. Swedish Energy Agency. Energiläget 2020 [Energy in Sweden 2020]. 2020. Available online: https://energimyndigheten.a-w2m.se/Home.mvc?ResourceId=173928 (accessed on 15 September 2020).
  7. International Energy Agency (IEA). Energy Policies of IEA Countries: Sweden 2019. 2019. Available online: https://www.oecd-ilibrary.org/content/publication/d4ff3340-en (accessed on 30 September 2020).
  8. Gegg, P.; Budd, L.; Ison, S. The market development of aviation biofuel: Drivers and constraints. J. Air Transp. Manag. 2014, 39, 34–40. [Google Scholar] [CrossRef] [Green Version]
  9. Winchester, N.; McConnachie, D.; Wollersheim, C.; Waitz, I.A. Economic and emissions impacts of renewable fuel goals for aviation in the US. Transp. Res. Part A Policy Pr. 2013, 58, 116–128. [Google Scholar] [CrossRef] [Green Version]
  10. ATAG. Powering the Future of Flight: The Six Easy Steps to Growing a Viable Aviation Biofuels Industry. 2011. Available online: https://seors.unfccc.int/applications/seors/attachments/get_attachment?code=GRPR31ZA287D3KAP5XOXQO2WP1JE9SQQ (accessed on 27 August 2021).
  11. Dahal, K.; Brynolf, S.; Xisto, C.; Hansson, J.; Grahn, M.; Grönstedt, T.; Lehtveer, M. Techno-economic review of alternative fuels and propulsion systems for the aviation sector. Renew. Sustain. Energy Rev. 2021, 151, 111564. [Google Scholar] [CrossRef]
  12. Larkin, A.; Anderson, K. Carbon Budgets for Aviation or Gamble with Our Future? Transp. Sustain. 2013, 4, 65–84. [Google Scholar] [CrossRef]
  13. Anger, A. Including aviation in the European emissions trading scheme: Impacts on the industry, CO2 emissions and macroeconomic activity in the EU. J. Air Transp. Manag. 2010, 16, 100–105. [Google Scholar] [CrossRef]
  14. Scheelhaase, J.; Grimme, W.; Schaefer, M. The inclusion of aviation into the EU emission trading scheme—Impacts on competition between European and non-European network airlines. Transp. Res. Part D Transp. Environ. 2010, 15, 14–25. [Google Scholar] [CrossRef]
  15. Schaefer, M.; Scheelhaase, J.; Grimme, W.; Maertens, S. The economic impact of the upcoming EU emissions trading system on airlines and EU Member States—an empirical estimation. Eur. Transp. Res. Rev. 2010, 2, 189–200. [Google Scholar] [CrossRef] [Green Version]
  16. Morrell, P. An evaluation of possible EU air transport emissions trading scheme allocation methods. Energy Policy 2007, 35, 5562–5570. [Google Scholar] [CrossRef] [Green Version]
  17. Vespermann, J.; Wald, A. Intermodal integration in air transportation: Status quo, motives and future developments. J. Transp. Geogr. 2011, 19, 1187–1197. [Google Scholar] [CrossRef]
  18. Mayor, K.; Tol, R. The impact of the UK aviation tax on carbon dioxide emissions and visitor numbers. Transp. Policy 2007, 14, 507–513. [Google Scholar] [CrossRef] [Green Version]
  19. De Jong, S.; Van Stralen, J.; Londo, M.; Hoefnagels, R.; Faaij, A.; Junginger, M. Renewable jet fuel supply scenarios in the European Union in 2021-2030 in the context of proposed biofuel policy and competing biomass demand. GCB Bioenergy 2018, 10, 661–682. [Google Scholar] [CrossRef]
  20. Sgouridis, S.; Bonnefoy, P.A.; Hansman, R.J. Air transportation in a carbon constrained world: Long-term dynamics of policies and strategies for mitigating the carbon footprint of commercial aviation. Transp. Res. Part A Policy Pract. 2011, 45, 1077–1091. [Google Scholar] [CrossRef]
  21. Dray, L.; Doyme, K. Carbon leakage in aviation policy. Clim. Policy 2019, 19, 1284–1296. [Google Scholar] [CrossRef]
  22. Moncada, J.A.; Verstegen, J.A.; Posada, J.; Junginger, M.; Lukszo, Z.; Faaij, A.; Weijnen, M. Exploring the emergence of a biojet fuel supply chain in Brazil: An agent-based modeling approach. GCB Bioenergy 2018, 11, 773–790. [Google Scholar] [CrossRef] [Green Version]
  23. Nakata, T.; Silva, D.; Rodionov, M. Application of energy system models for designing a low-carbon society. Prog. Energy Combust. Sci. 2011, 37, 462–502. [Google Scholar] [CrossRef]
  24. Yue, D.; You, F.; Snyder, S.W. Biomass-to-bioenergy and biofuel supply chain optimization: Overview, key issues and challenges. Comput. Chem. Eng. 2014, 66, 36–56. [Google Scholar] [CrossRef]
  25. Doliente, S.; Narayan, A.; Tapia, J.F.D.; Samsatli, N.J.; Zhao, Y.; Samsatli, S. Bio-aviation Fuel: A Comprehensive Review and Analysis of the Supply Chain Components. Front. Energy Res. 2020, 8, 110. [Google Scholar] [CrossRef]
  26. De Jong, S.; Hoefnagels, R.; Wetterlund, E.; Pettersson, K.; Faaij, A.; Junginger, M. Cost optimization of biofuel production—The impact of scale, integration, transport and supply chain configurations. Appl. Energy 2017, 195, 1055–1070. [Google Scholar] [CrossRef] [Green Version]
  27. Leong, H.; Foo, D.C.; Ng, L.Y.; Andiappan, V. Hybrid approach for carbon-constrained planning of bioenergy supply chain network. Sustain. Prod. Consum. 2019, 18, 250–267. [Google Scholar] [CrossRef]
  28. Börjesson, P.; Hansson, J.; Berndes, G. Future demand for forest-based biomass for energy purposes in Sweden. For. Ecol. Manag. 2017, 383, 17–26. [Google Scholar] [CrossRef]
  29. de Jong, J.; Akselsson, C.; Egnell, G.; Löfgren, S.; Olsson, B.A. Realizing the energy potential of forest biomass in Sweden—How much is environmentally sustainable? For. Ecol. Manag. 2017, 383, 3–16. [Google Scholar] [CrossRef] [Green Version]
  30. Hansson, J.; Hackl, R.; Taljegard, M.; Brynolf, S.; Grahn, M. The Potential for Electrofuels Production in Sweden Utilizing Fossil and Biogenic CO2 Point Sources. Front. Energy Res. 2017, 5, 4. [Google Scholar] [CrossRef] [Green Version]
  31. Swedavia Airports. The Change is Already Underway. Available online: https://www.swedavia.com/the-change-is-already-underway/ (accessed on 6 September 2021).
  32. SOU 2019:11, Biojet för Flyget. Available online: https://www.regeringen.se/493238/contentassets/6d591e58fd9b4cad8171af2cd7e59f6f/biojet-for-flyget-sou-201911 (accessed on 30 September 2020).
  33. SFS 2017:1200, Lag om Skatt på Flygresort. Available online: https://www.riksdagen.se/sv/dokument-lagar/dokument/svensk-forfattningssamling/lag-20171200-om-skatt-pa-flygresor_sfs-2017-1200 (accessed on 1 October 2020).
  34. Swedish Energy Agency. Greenhouse Gas Reduction Mandate. 2020. Available online: http://www.energimyndigheten.se/en/sustainability/sustainable-fuels/greenhouse-gas-reduction-mandate/ (accessed on 4 October 2020).
  35. Proposition 2020/21:135, Reduktionsplikt för Flygfotogen. Available online: https://data.riksdagen.se/fil/5BBB452E-16A1-478B-8D66-D6B6CF103106 (accessed on 30 September 2020).
  36. Ministry of Finance, Sweden’s Carbon Tax. 2021. Available online: https://www.government.se/government-policy/taxes-and-tariffs/swedens-carbon-tax/ (accessed on 10 April 2021).
  37. ICAO. ICAO’S Policies on Taxation in the Field of International Air Transport. 1994. Available online: https://www.icao.int/publications/Documents/8632_2ed_en.pdf (accessed on 10 May 2021).
  38. International Air Transport Association (IATA). Fact Sheet 2—Sustainable Aviation Fuel: Technical Certification. Available online: https://www.iata.org/contentassets/d13875e9ed784f75bac90f000760e998/saf-technical-certifications.pdf (accessed on 29 October 2020).
  39. Swedish Energy Agency. Luftfartens Omställning Till Fossilfrihet [The Aviation Industry’s Transition towards Being Fossil Free]. 2017. Available online: https://energimyndigheten.a-w2m.se/FolderContents.mvc/Download?ResourceId=104637 (accessed on 29 October 2020).
  40. European Commission. Horizon 2020—Work Programme 2014–2015 general Annexes—G. Technology Readiness Levels (TRL). 2021. Available online: https://ec.europa.eu/research/participants/data/ref/h2020/wp/2014_2015/annexes/h2020-wp1415-annex-g-trl_en.pdf (accessed on 10 May 2021).
  41. NASA. Technology Readiness Level. 2021. Available online: https://www.nasa.gov/directorates/heo/scan/engineering/technology/technology_readiness_level (accessed on 10 May 2021).
  42. de Jong, S.A. Green Horizons: On the Production Costs, Climate Impact and Future Supply of Renewable Jet Fuels. Ph.D. Thesis, Utrecht University, Utrecht, The Netherlands, 2018. Available online: https://www.researchgate.net/publication/325719256_Green_Horizons_-_On_the_production_costs_climate_impact_and_future_supply_of_renewable_jet_fuels_PhD_thesis_Sierk_De_Jong_2018 (accessed on 10 May 2021).
  43. O’Connell, A.; Konti, A.; Padella, M.; Prussi, M.; Lonza, L. Advanced Alternative Fuels Technology Market Report 2018. 2019. EUR 29937 EN. European Commission. Luxembourg. Available online: https://publications.jrc.ec.europa.eu/repository/handle/JRC118306 (accessed on 10 May 2021).
  44. Wijeyekoon, S.; Torr, K.; Corkran, H.; Bennett, P. Commercial status of direct thermochemical liquefaction technologies. IEA Bioenergy Task 34. 2020. p. 2. Available online: https://www.ieabioenergy.com/wp-content/uploads/2020/09/Direct-Thermochemical-Liquefaction_Commercialization_Overview.pdf (accessed on 21 August 2021).
  45. International Civil Aviation Organization (ICAO). Assembly—40th Session: Agenda Item 16: Environmental Protection—International Aviation and Climate Change—Policy and Standardization: Power-to-Liquids (PTL): Sustainable Fuels for Aviation. 2019. Available online: https://www.icao.int/Meetings/a40/Documents/WP/wp_526_en.pdf (accessed on 28 September 2021).
  46. Balli, O.; Sohret, Y.; Karakoc, H.T. The effects of hydrogen fuel usage on the exergetic performance of a turbojet engine. Int. J. Hydrogen Energy 2018, 43, 10848–10858. [Google Scholar] [CrossRef]
  47. Bicer, Y.; Dincer, I. Life cycle evaluation of hydrogen and other potential fuels for aircrafts. Int. J. Hydrogen Energy 2017, 42, 10722–10738. [Google Scholar] [CrossRef]
  48. Brelje, B.J.; Martins, J.R. Electric, hybrid, and turboelectric fixed-wing aircraft: A review of concepts, models, and design approaches. Prog. Aerosp. Sci. 2019, 104, 1–19. [Google Scholar] [CrossRef]
  49. World Economic Forum (WEF). Joint Policy Proposal to Accelerate the Deployment of Sustainable Aviation Fuels in Europe—A Clean Skies for Tomorrow Publication. 2020. Available online: http://www3.weforum.org/docs/WEF_CST_Policy_European_Commission_SAF_2020.pdf (accessed on 4 November 2020).
  50. de Souza, L.M.; Mendes, P.A.; Aranda, D.A. Oleaginous feedstocks for hydro-processed esters and fatty acids (HEFA) biojet production in southeastern Brazil: A multi-criteria decision analysis. Renew. Energy 2020, 149, 1339–1351. [Google Scholar] [CrossRef]
  51. Lorenzi, G.; Mignini, L.; Venezia, B.; Silva, C.A.S.; Santarelli, M.; Migninic, L.; Veneziad, B. Integration of high-temperature electrolysis in an HVO production process using waste vegetable oil. Energy Procedia 2019, 158, 2005–2011. [Google Scholar] [CrossRef]
  52. Soam, S.; Hillman, K. Factors influencing the environmental sustainability and growth of hydrotreated vegetable oil (HVO) in Sweden. Bioresour. Technol. Rep. 2019, 7, 100244. [Google Scholar] [CrossRef]
  53. Richter, S.; Braun-Unkhoff, M.; Naumann, C.; Riedel, U. Paths to alternative fuels for aviation. CEAS Aeronaut. J. 2018, 9, 389–403. [Google Scholar] [CrossRef] [Green Version]
  54. Evans, G.; Smith, C. Biomass to Liquids Technology. In Comprehensive Renewable Energy; Sayigh, A., Ed.; Elsevier: Oxford, UK, 2012; pp. 155–204. [Google Scholar]
  55. de Klerk, A. Chapter 10—Aviation Turbine Fuels Through the Fischer–Tropsch Process. In Biofuels for Aviation; Elsevier Inc.: Edmonton, AB, Canada, 2016; pp. 241–259. [Google Scholar]
  56. Shahabuddin, M.; Alam, T.; Krishna, B.B.; Bhaskar, T.; Perkins, G. A review on the production of renewable aviation fuels from the gasification of biomass and residual wastes. Bioresour. Technol. 2020, 312, 123596. [Google Scholar] [CrossRef]
  57. F3 Centre. Bioflygbränsle, Biojet [Aviation biofuel, Biojet]. 2020. Available online: https://f3centre.se/en/fact-sheets/aviation-biofuel-biojet/ (accessed on 10 January 2021).
  58. Sahu, S.; Sahoo, N.; Naik, S.; Mahapatra, D. Advancements in Hydrothermal Liquefaction Reactors: Overview and Prospects; Elsevier: Amsterdam, The Netherlands, 2020; pp. 195–213. [Google Scholar]
  59. Baldino, C.; Berg, R.; Pavlenko, N.; Searle, S.; Advanced alternative fuel pathways: Technology overview and status. In The International Council on Clean Transportation; 2019. Available online: https://theicct.org/sites/default/files/publications/ICCT_advanced_alt_fuel_pathways_20190723.pdf (accessed on 2 March 2021).
  60. Tews, I.J.; Zhu, Y.; Drennan, C.; Elliott, D.C.; Snowden-Swan, L.J.; Onarheim, K.; Solantausta, Y.; Beckman, D. Biomass Direct Liquefaction Options. TechnoEconomic and Life Cycle Assessment. In Biomass Direct Liquefaction Options. TechnoEconomic and Life Cycle Assessment; Pacific Northwest National Lab (PNNL): Richland, WA, USA, 2014. [Google Scholar]
  61. Biller, P.; Roth, A. Hydrothermal Liquefaction: A Promising Pathway towards Renewable Jet Fuel. In Biokerosene: Status and Prospects; Springer: Berlin/Heidelberg, Germany, 2018; pp. 607–635. [Google Scholar]
  62. Elliott, D.; Biller, P.; Ross, A.B.; Schmidt, A.J.; Jones, S.B. Hydrothermal liquefaction of biomass: Developments from batch to continuous process. Bioresour. Technol. 2015, 178, 147–156. [Google Scholar] [CrossRef] [Green Version]
  63. Drünert, S.; Neuling, U.; Zitscher, T.; Kaltschmitt, M. Power-to-Liquid fuels for aviation—Processes, resources and supply potential under German conditions. Appl. Energy 2020, 277, 115578. [Google Scholar] [CrossRef]
  64. Schmidt, P.; Batteiger, V.; Roth, A.; Weindorf, W.; Raksha, T. Power-to-Liquids as Renewable Fuel Option for Aviation: A Review. Chem. Ing. Tech. 2018, 90, 127–140. [Google Scholar] [CrossRef]
  65. Fagerström, A.; Grahn, D.; Lundberg, S.; Sreetama Ghosh, D.C.; Olsson, L.; Abdelaziz, O.; Wallberg, O.; Hultberg, C.; Poulikidou, S.; Rydberg, T.; et al. Large Scale bio Electro jet Fuel Production Integration at CHP-Plant in Östersund, Sweden. 2021. Available online: https://www.ivl.se/download/18.2f05652c1775c6085c01a6/1612270805586/B2407.pdf (accessed on 2 March 2021).
  66. Keith, D.W.; Holmes, G.; Angelo, D.S.; Heidel, K. A Process for Capturing CO2 from the Atmosphere. Joule 2018, 2, 1573–1594. [Google Scholar] [CrossRef] [Green Version]
  67. Sreedhar, I.; Nahar, T.; Venugopal, A.; Srinivas, B. Carbon capture by absorption—Path covered and ahead. Renew. Sustain. Energy Rev. 2017, 76, 1080–1107. [Google Scholar] [CrossRef]
  68. Herzog, H.J. Carbon Capture; 2018; MIT Press essential knowledge series: Cambridge, MA, USA; ISBN 0-262-34886-1. Available online: https://mitpress.mit.edu/books/carbon-capture (accessed on 2 March 2021).
  69. Gielen, D.; Taibi, E.; Miranda, R. Hydrogen: A Renewable Energy Perspective. 2019. Available online: https://www.irena.org/-/media/Files/IRENA/Agency/Publication/2019/Sep/IRENA_Hydrogen_2019.pdf (accessed on 4 March 2021).
  70. Voitic, G.; Pichler, B.; Basile, A.; Iulianelli, A.; Malli, K.; Bock, S.; Hacker, V. Hydrogen Production. In Fuel Cells and Hydrogen; Elsevier: Amsterdam, The Netherlands, 2018; pp. 215–241. [Google Scholar]
  71. Sawmills Database, Sawmills. Available online: https://www.sawmilldatabase.com/sawmills.php?countryid=1&companyid=-1&productionfrom=30000&productionto= (accessed on 22 January 2021).
  72. Svebio, Biodrivmedel i Norden 2019 [Biofuels in the Nordic 2019]. 2019. Available online: https://www.mynewsdesk.com/se/svebio/documents/biodrivmedel-i-norden-2019-92374 (accessed on 27 January 2021).
  73. European Environment Agency. Industrial Reporting under the Industrial Emissions Directive 2010/75/EU and European Pollutant Release and Transfer Register Regulation (EC) No 166/2006. 2020. Available online: https://www.eea.europa.eu/data-and-maps/data/industrial-reporting-under-the-industrial-2 (accessed on 28 January 2021).
  74. Transport Analysis (TRAFA). Luftfart 2019—Tabell 1.2 Svenska Trafikflygplatser 2019-12-31 [Civil Aviation 2019—Airports with Scheduled and/or Non-Scheduled Traffic 31 December 2019]. 2019. Available online: https://www.trafa.se/luftfart/ (accessed on 10 November 2020).
  75. Swedish Transport Agency. Flygplatsstatistik [Airport Statistics]. 2020. Available online: https://www.transportstyrelsen.se/sv/luftfart/Statistik/Flygplatsstatistik-/ (accessed on 10 November 2020).
  76. Icons Made by Freepik from Flaticon, Truck. Available online: https://www.freepik.com(https://www.flaticon.com/premium-icon/oil-truck_4038674?term=oil%20truck&page=1&position=72&page=1&position=72&related_id=4038674&origin=search) (accessed on 6 September 2021).
  77. Icons Made by Smashicons from Flaticon, Refinery. Available online: https://www.flaticon.com/authors/smashicons(https://www.flaticon.com/free-icon/refinery_2296960?term=refinery&page=2&position=18&page=2&position=18&related_id=2296960&origin=search) (accessed on 6 September 2021).
  78. Icons Made by Freepik from Flaticon, Airport. Available online: https://www.freepik.com/(https://www.flaticon.com/premium-icon/airport_1830349?term=airport&page=1&position=2&page=1&position=2&related_id=1830349&origin=search) (accessed on 6 September 2021).
  79. Icons made by Freepik from Flaticon, Factory. Available online: https://www.flaticon.com/authors/freepik(https://www.flaticon.com/free-icon/factory_699505?term=industrial%20factory&page=1&position=31&page=1&position=31&related_id=699505&origin=search) (accessed on 6 September 2021).
  80. Icons Made by Ultimatearm from Flaticon. Biomass Factory. Available online: https://www.flaticon.com/authors/ultimatearm(https://www.flaticon.com/free-icon/biomass_2646951?related_id=2646951) (accessed on 6 September 2021).
  81. Harris, Z.M.; Milner, S.; Taylor, G. Taylor, Biogenic Carbon—Capture and Sequestration. In Greenhouse Gas Balances of Bioenergy Systems; Academic Press: Cambridge, MA, USA, 2018; pp. 55–76. [Google Scholar]
  82. SGC. Basic Data for Biogas. 2012. p. 7. Available online: http://www.sgc.se/ckfinder/userfiles/files/BasicDataonBiogas2012.pdf (accessed on 28 January 2021).
  83. F3 Centre. Metanol. 2017. Available online: https://f3centre.se/sv/faktablad/metanol/ (accessed on 1 February 2021).
  84. Swedish Energy Agency. Värmevärden Från Energimyndighetens Datalager (DW) [Thermal Values from the Swedish Energy Agency’s Database (DW)]. 2017. Available online: https://www.energimyndigheten.se/statistik/den-officiella-statistiken/statistikprodukter/varmevarden-och-densiteter/ (accessed on 1 February 2021).
  85. Energimyndigheten, Faktisk Elcertifikatberättigad Elproduktion 2017 2018 [Actual Electricity Production Eligible for Electricity Certificate 2017 2018]. Available online: https://www.energimyndigheten.se/fornybart/elcertifikatsystemet/marknadsstatistik/ (accessed on 17 September 2021).
  86. Bodens Energi, Elens Ursprung [The Origin of Electricity]. Available online: https://bodensenergi.se/elavtal/elens-ursprung/ (accessed on 17 September 2021).
  87. Anders Haaker, Vattenfall Planerar att Investera 3,5 Miljarder i Uppsala under sex år [Vattenfall Plans to Invest SEK 3.5 Billion in Uppsala over Six Years]. 2017. Available online: https://bioenergitidningen.se/biovarme/vattenfall-planerar-att-investera-35-miljarder-uppsala-sex-ar (accessed on 17 September 2021).
  88. Stockholm Exergi, Bristaverket—Stockholm Exergi, Miljörapport 2020 [Bristaverket—Stockholm Exergi, Environmental Report 2020]. 2021. Available online: https://www.stockholmexergi.se/content/uploads/2021/05/VARME-678587-v1-Bristaverket-MR-2020-v1.pdf (accessed on 17 September 2021).
  89. Öresundskraft, Filbornaverket. Available online: https://www.oresundskraft.se/om-oss/filbornaverket/ (accessed on 17 September 2021).
  90. Tekniska Verken, Gärstadverket—Tekniska Verken. Available online: https://www.tekniskaverken.se/om-oss/anlaggningar/kraftvarmeverk/garstadverket/ (accessed on 17 September 2021).
  91. Skellefteå Kraft, Fjärrvärme—Skellefteå Kraft. Available online: https://www.skekraft.se/om-oss/verksamhet/fjarrvarme/#box-no-4 (accessed on 17 September 2021).
  92. Tengbom, Hedenverket—Effektiv Miljösatsning I Karlstad. Available online: https://tengbom.se/projekt/hedenverket/ (accessed on 17 September 2021).
  93. ENA Energi AB, Våra anläggningar|ENA Energi AB. Available online: https://www.enae.se/fjarrvarme/produktion/vara-anlaggningar/ (accessed on 17 September 2021).
  94. E.ON Värme, Med Värme Från Händelö Kraftvärmeverk [with Heat from Händelö Heat and Power Plant]. Available online: http://mb.cision.com/Public/MigratedWpy/93678/9122214/ac456242581ba855.pdf (accessed on 17 September 2021).
  95. Stockholm Exergi, Hässelbyverket—Stockholm Exergi, Miljörapport 2020 [Hässelbyverket—Stockholm Exergi, Environmental Report 2020]. 2021. Available online: https://www.stockholmexergi.se/content/uploads/2021/05/VARME-679666-v1-Milj%C3%B6rapport-H%C3%A4sselbyverket-2020.pdf (accessed on 17 September 2021).
  96. Stockholm Exergi, Högdalenverket—Stockholm Exergi. Available online: https://www.stockholmexergi.se/om-stockholm-exergi/vara-anlaggningar/hogdalenverket/ (accessed on 17 September 2021).
  97. Svebio, Biokraft 2020. 2020. Available online: https://bioenergitidningen.se/app/uploads/sites/2/2020/11/Biokraftkartan2020.pdf (accessed on 17 September 2021).
  98. Söderenergi, Teknik i Framkant|Söderenergi—Tillsammans för en Hållbar Uppvärmning. Available online: https://www.soderenergi.se/teknik-i-framkant/ (accessed on 17 September 2021).
  99. Tekniska Verken, Kraftvärmeverket i Linköping—Tekniska Verken. Available online: https://www.tekniskaverken.se/om-oss/anlaggningar/kraftvarmeverk/kraftvarmeverket-i-linkoping/ (accessed on 17 September 2021).
  100. Göteborg Energi, Miljörapport 2020—Sävenäsverket. 2020. Available online: https://www.goteborgenergi.se/Files/Webb20/Kategoriserad%20information/Informationsmaterial/Milj%C3%B6rapporter/2020/MR%20S%C3%A4ven%C3%A4sverket%202020.pdf?TS=637570015939206198 (accessed on 17 September 2021).
  101. Stockholm Exergi, Värtaverket Stockholm Exergi, Miljörapport 2020 [Värtaverket Stockholm Exergi, Environmental Report 2020]. 2021. Available online: https://www.stockholmexergi.se/content/uploads/2021/05/VARME-678899-v1-Milj%C3%B6rapport-V%C3%A4rtaverket-2020.pdf (accessed on 17 September 2021).
  102. Mälarenergi, Kraftvärmeverket—Västerås Hjärta. Available online: https://www.malarenergi.se/om-malarenergi/framtidens-samhalle/vara-anlaggningar/kraftvarmeverket/kraftvarmeverket-vasteras/ (accessed on 17 September 2021).
  103. Svenska Kraftnät, Varför Delades Sverige upp i Fyra Elområden? [Why was Sweden Divided into Four Electricity Pricing Areas?]. 2020. Available online: https://www.svk.se/utveckling-av-kraftsystemet/systemansvar–elmarknad/elomradesoversyn/fragor-och-svar-om-elomradesoversyn/varfor-delades-sverige-in-i-fyra-elomraden-2011/ (accessed on 15 May 2021).
  104. Swedish Energy Agency. Scenarier över Sveriges Energisystem 2020 [Scenarios of Sweden’s Energy System 2020]. 2021. Available online: https://www.energimyndigheten.se/nyhetsarkiv/2021/sveriges-energisystem-2050--sa-kan-det-se-ut/ (accessed on 1 April 2021).
  105. Nord Pool, Day-Ahead Prices. 2020. Available online: https://www.nordpoolgroup.com/Market-data1/Dayahead/Area-Prices/SE/Yearly/?view=table (accessed on 26 April 2021).
  106. OpenStreetMap contributors. Copyright and License. Available online: https://www.openstreetmap.org/copyright/en (accessed on 26 November 2020).
  107. Swedens’ County Administrative Board & S., E. Agency, Vindbrukskollen. Available online: https://vbk.lansstyrelsen.se/ (accessed on 26 April 2021).
  108. de Jong, S.; Hoefnagels, R.; Faaij, A.; Slade, R.; Mawhood, R.; Junginger, M. The feasibility of short-term production strategies for renewable jet fuels—a comprehensive techno-economic comparison. Biofuels Bioprod. Biorefining 2015, 9, 778–800. [Google Scholar] [CrossRef]
  109. Diederichs, G.W.; Mandegari, M.A.; Farzad, S.; Gorgens, J. Techno-economic comparison of biojet fuel production from lignocellulose, vegetable oil and sugar cane juice. Bioresour. Technol. 2016, 216, 331–339. [Google Scholar] [CrossRef] [PubMed]
  110. Statistics Sweden, CPI, Historical Numbers, 1830–2021. Available online: https://www.scb.se/en/finding-statistics/statistics-by-subject-area/prices-and-consumption/consumer-price-index/consumer-price-index-cpi/pong/tables-and-graphs/consumer-price-index-cpi/cpi-historical-numbers-1830/ (accessed on 26 April 2021).
  111. Sveriges Riksbank, Årsgenomsnitt Valutakurser (Ackumulerat)|Sveriges Riksbank. Available online: https://www.riksbank.se/sv/statistik/sok-rantor--valutakurser/arsgenomsnitt-valutakurser/?y=2021&m=8&s=Comma&f=y (accessed on 23 September 2021).
  112. Sveriges Riksbank [Sweden’s Central Bank], Årsgenomsnitt Valutakurser 2020 [Annual Average Exchange Rates 2020]. 2020. Available online: https://www.riksbank.se/sv/statistik/sok-rantor--valutakurser/valutakurser-till-deklarationen/ (accessed on 25 March 2021).
  113. Sorrels, J.L.; Walton, T.G. Chapter 2—Cost Estimation: Concepts and Methodology. In EPA Air Pollution Control Cost Manual; U.S. Environmental Protection Agency: Washington, DC, USA, 2017; p. 35. Available online: https://www.epa.gov/sites/production/files/2017-12/documents/epaccmcostestimationmethodchapter_7thedition_2017.pdf (accessed on 26 November 2020).
  114. Stockholm Vatten Och Avfall, Avgift för Vatten Och Avlopp [Fee for Water and Sewage]. 2021. Available online: https://www.stockholmvattenochavfall.se/kundservice/avgifter-och-taxor/avgift-for-vatten-och-avlopp/#!/flerbostadshus-industrier-och-andra-fastigheter (accessed on 25 March 2021).
  115. Göteborgs Stad, Vatten Och Avloppstaxa [Fee for Water and Sewage]. 2021. Available online: https://goteborg.se/wps/portal/start/vatten-och-avlopp/avgifter/vatten--och-avloppstaxa?uri=gbglnk%3Agbg.page.caf8bb3f-28f6-41fe-8158-314aa4cd49e1 (accessed on 25 March 2021).
  116. VASYD, Taxebilaga 2 Brukningsavgifter (inkl. moms) [Tax Appendix 2 Usage Fees (incl. VAT)]. 2020. Available online: https://www.vasyd.se/-/media/Documents/Informationsmaterial/Avgifter-vatten-och-avlopp/Malmo/Taxebilaga2_brukningsavgifter_Malmo2021.pdf (accessed on 25 March 2021).
  117. Uppsala Vatten, Taxa för den Allmänna Vatten- Och Avloppsanläggningen i Uppsala Kommun [Fee for the Public Water and Sewage System in Uppsala Municipality]. 2020. Available online: https://www.uppsalavatten.se/hushall/betalning-och-avgifter/taxor-och-avgifter/ny-va-taxa-2020/va-taxa/ (accessed on 25 March 2021).
  118. Tekniska Verken, TAXA/PRISLISTA 2021—för Linköpings Kommuns Allmänna Vatten- Och Avloppsanläggning [TAX/PRICE LIST 2021—for Linköping Municipality’s General Water and Sewage System]. 2021. Available online: https://www.tekniskaverken.se/siteassets/tekniska-verken/vatten-och-avlopp/prislistor/ao_vatten_avlopp_prislista_2021.pdf (accessed on 25 March 2021).
  119. Swedish Energy Agency. Trädbränsle Och Torvpriser, per år Exklusive Skatt, Från Och Med 1993, Kronor/MWh Fritt Förbrukare, Löpande Priser [Wood Fuel and Peat Prices, per Year Excluding Tax, from 1993, SEK/MWh Free Consumer, Current Prices]. 2020. Available online: http://pxexternal.energimyndigheten.se/sq/c92731ba-13e3-445d-9fe6-eea55da29701 (accessed on 24 March 2021).
  120. IEA. Oil Product Spot Prices. 2016; Available online: https://www.oecd-ilibrary.org/content/data/data-00450-en (accessed on 1 April 2021). [CrossRef]
  121. IEA. Fossil Jet Kerosene Market Price Compared with HEFA aviation Biofuel Production Cost, 2019–2020. 2020. Available online: https://www.iea.org/data-and-statistics/charts/fossil-jet-kerosene-market-price-compared-with-hefa-aviation-biofuel-production-cost-2019-2020 (accessed on 1 April 2021).
  122. Transportstyrelsen, Analys av en Ökad Risk för Ekonomitankning Till Följd av Införande av en Nationell Skatt på Fossilt Flygfotogen vid Kommersiella Resor [Analysis of an Increased Risk of Refueling as a Result of Introduction of a National Tax on Fossil Fuels Aviation Kerosene on Commercial Trips]. 2020. Available online: https://www.transportstyrelsen.se/4a8215/globalassets/global/publikationer/luftfart/slutrapport-transportstyrelsen_fi2020_01022_s2_-200928.pdf (accessed on 1 April 2021).
  123. WSP. Sweden and 21st Century Water Challenges. 2020. Available online: https://www.wsp.com/en-SE/insights/sweden-and-21st-century-water-challenges (accessed on 25 March 2021).
  124. Duić, N.; Štefanić, N.; Lulić, Z.; Krajačić, G.; Pukšec, T.; Novosel, T. EU28 Fuel Prices for 2015, 2030 and 2050—Appendix 2. 2017. Available online: https://heatroadmap.eu/wp-content/uploads/2020/01/HRE4_D6.1-Future-fuel-price-review.pdf (accessed on 24 March 2021).
  125. Berglund, M.; Torsby Flygplats AB, Torsby, Sweden. Personal communication through e-mail correspondence, January 2021.
  126. Eriksson, J.; Härjedalen Sveg Airport, Sveg, Sweden. Personal communication through e-mail correspondence, January 2021.
  127. Schwartz, P.; Henriksson, L.; Sundsvall Timrå Airport, Sundsvall, Sweden. Personal communication through e-mail correspondence, January 2021.
  128. Jansson, P.; Norrköping Airport, Norrköping, Sweden. Personal communication through e-mail correspondence, January 2021.
  129. Scherman, T.; Pajala Airport, Pajala, Sweden. Personal communication through e-mail correspondence, January 2021.
  130. Mjöberg, A.; AB Dalaflyget, Borlänge, Sweden. Personal communication through e-mail correspondence, January 2021.
  131. Vänersborgs TR M 2251-18 Deldom 2019-11-27. Available online: https://www.naturvardsverket.se/upload/stod-i-miljoarbetet/rattsfall/domar/V%c3%a4nersborgs%20TR%20M%202251-18%20Deldom%202019-11-27.pdf (accessed on 11 October 2020).
  132. ICAO. ICAO Carbon Emissions Calculator Methodology—Version 9. 2016. Available online: https://www.icao.int/environmental-protection/CarbonOffset/Documents/Methodology_ICAO_Carbon_Calculator_v9_2016.pdf (accessed on 1 December 2020).
  133. Eurostat Database. Air Transport (2015–2019). 2019. Available online: https://ec.europa.eu/eurostat/web/transport/data/database (accessed on 25 January 2021).
  134. Swedish Transport Administration. Resandeprognos för Flygtrafiken 2040 [Travel Forecast for Air Traffic 2040]. 2020. Available online: http://trafikverket.diva-portal.org/smash/get/diva2:1443411/FULLTEXT01.pdf (accessed on 1 December 2020).
  135. QGIS. QGIS—A Free and Open Source Geographic Information System. 2020. Available online: https://qgis.org/en/site/ (accessed on 26 November 2020).
  136. Swedish Transport Administration, Kapitel 7 Värdering av Kortare Restid och Transporttid [Chapter 7 Valuation of Shorter Travel Time and Transport Time]. Analysmetod och Samhällsekonomiska Kalkylvärden för Transportsektorn: ASEK 7.0 [Analysis Method and Socio-Economic Calculation Values for the Transport Sector: ASEK 7.0]. 2020, p. 15. Available online: https://www.trafikverket.se/contentassets/4b1c1005597d47bda386d81dd3444b24/asek-7.0--2020/07_restid_o_transporttid_a70.pdf (accessed on 25 January 2021).
  137. Swedish Transport Administration, Kapitel 14 Operativa Trafikeringskostnader för Godstransporter [Chapter 14 Operative traffic Costs for Freight Transports]. Analysmetod och Samhällsekonomiska Kalkylvärden för Transportsektorn: ASEK 7.0 [Analysis Method and Socio-Economic Calculation Values for the Transport Sector: ASEK ASEK 7.0]. 2020, pp. 6–12. Available online: https://www.trafikverket.se/contentassets/4b1c1005597d47bda386d81dd3444b24/14_trafikeringskostnad_gods_a70.pdf (accessed on 25 January 2021).
  138. Swedish Transport Administration, Kapitel 12 Samhällsekonomisk Kostnad för Klimateffekter [Chapter 12 Socio-Economic Cost for Climate Effects]. Analysmetod och Samhällsekonomiska Kalkylvärden för Transportsektorn: ASEK 7.0 [Analysis method and Socio-Economic Calculation Values for the Transport Sector: ASEK 7.0]. 2020, p. 3. Available online: https://www.trafikverket.se/contentassets/4b1c1005597d47bda386d81dd3444b24/asek-7.0--2020/12_klimateffekter_a70_200624.pdf (accessed on 25 January 2021).
  139. De Jong, S.; Antonissen, K.; Hoefnagels, R.; Lonza, L.; Wang, M.; Faaij, A.; Junginger, M. Life-cycle analysis of greenhouse gas emissions from renewable jet fuel production. Biotechnol. Biofuels 2017, 10, 64. [Google Scholar] [CrossRef] [Green Version]
  140. Bokinge, P.; Heyne, S.; Nyström, I.; Hentschel, J.; Magnus, E.; Skaret-Thoresen, L.; Zafosching, L.A.; Behm, K.; Fabritius, T.; Koponen, K.; et al. Nordic P2X for Sustainable Road Transport. 2020. Available online: https://www.nordicenergy.org/wp-content/uploads/2020/09/Nordic-Power-2X-for-Sustainable-Road-Transport.pdf (accessed on 6 May 2021).
  141. CORSIA. Corsia Supporting Document—Corsia Eligible Fuels—Life Cycle Assessment Methodology. 2019. Available online: https://www.icao.int/environmental-protection/CORSIA/Documents/CORSIA%20Supporting%20Document_CORSIA%20Eligible%20Fuels_LCA%20Methodology.pdf (accessed on 26 April 2021).
  142. PuLP. A Transportation Problem. 2009. Available online: https://coin-or.github.io/pulp/CaseStudies/a_transportation_problem.html (accessed on 26 November 2020).
  143. Pedroso, J.P.; Rais, A.; Kubo, M.; Muramatsu, M. Facility Location Problems. 2012. Available online: https://scipbook.readthedocs.io/en/latest/flp.html (accessed on 26 November 2020).
  144. Ismiguzel, I. How to Develop Optimization Models in Python. 2020. Available online: https://towardsdatascience.com/how-to-develop-optimization-models-in-python-1a03ef72f5b4 (accessed on 26 November 2020).
  145. Prussi, M.; O’Connell, A.; Lonza, L. Analysis of current aviation biofuel technical production potential in EU28. Biomass- Bioenergy 2019, 130, 105371. [Google Scholar] [CrossRef]
  146. Swedish Energy Agency. Ökning av Förnybar Elproduktion under 2020 [Increase in Renewable Electricity Production in 2020]. 2021. Available online: https://www.energimyndigheten.se/nyhetsarkiv/2021/okning-av-fornybar-elproduktion-under-2020/ (accessed on 20 May 2021).
  147. World Economic Forum (WEF). Clean Skies for Tomorrow: Sustainable Aviation Fuels as a Pathway to Net-Zero Aviation. 2020. Available online: https://www.weforum.org/reports/clean-skies-for-tomorrow-sustainable-aviation-fuels-as-a-pathway-to-net-zero-aviation (accessed on 1 December 2020).
Figure 1. Technological readiness level of different conversion pathways from concept to commercialization. Modified from source: de Jong [42] with Power-to-liquid (PTL) added from O’Connell et al. [43].
Energies 14 07194 g001
Figure 2. Visualization of developed supply chain model. FT (Fischer–Tropsch); HTL (Hydrothermal liquefaction); PTL (Power to liquid). Graphic content illustrated with inspiration from [76,77,78,79,80].
Energies 14 07194 g002
Figure 3. Locations and annual capacity of sawmills (sources of biomass) and industrial facilities (sources of CO2). Base map data © OpenStreetMap contributors, available under the Open Database License, terms further described in [106].
Energies 14 07194 g003
Figure 4. Map of the electricity pricing areas in Sweden. SE1 and SE2 generally have lower electricity prices than SE3 and SE4 [95,96]. Based on the maps of electricity price areas in Vindbrukskollen [107]. Base map data © OpenStreetMap contributors, available under the Open Database License, terms further described in [106].
Energies 14 07194 g004
Figure 5. Airport locations in Sweden and annual jet fuel demand. Base map data © OpenStreetMap contributors, available under the Open Database License, terms further described in [106].
Energies 14 07194 g005
Figure 6. Estimation of annual jet fuel demand in Sweden (2020–2050).
Energies 14 07194 g006
Figure 7. Annual jet fuel supply in scenarios REF, SC1-HCT and SC2-HBM with different policy configurations for 2025–2050. REF (Reference scenario); SC1-HCT (Higher carbon tax); SC2-HBM (Higher blending mandate. FT (Fischer–Tropsch); HTL (Hydrothermal liquefaction); PTL (Power-to-liquid); CJF (Conventional jet fuel); HEFA (Hydroprocessed esters and fatty acids).
Energies 14 07194 g007
Figure 8. Annual jet fuel supply in scenarios SC3-HCT-B, SC4-RMA and SC5-PF with different policy configurations for 2025–2050. SC3-HCT-B (Higher carbon tax without blending mandate); SC4-RMA (High/Low raw material availability); SC5-PF (With penalty fee); CJF (Conventional jet fuel). FT (Fischer–Tropsch); HTL (Hydrothermal liquefaction); PTL (Power-to-liquid); CJF (Conventional jet fuel); HEFA (Hydroprocessed esters and fatty acids).
Energies 14 07194 g008
Figure 9. Optimal RJF production sites from all scenarios. REF (Reference scenario); SC1-HCT (Higher carbon tax); SC2-HBM (Higher blending mandate); SC4-RMA (High/Low raw material availability). FT (Fischer–Tropsch); HTL (Hydrothermal liquefaction); PTL (Power-to-liquid); CJF (Conventional jet fuel); HEFA (Hydroprocessed esters and fatty acids). Base map data © OpenStreetMap contributors, available under the Open Database License, terms further described in [106].
Energies 14 07194 g009
Figure 10. Annual emissions from the total system. REF (Reference scenario); SC1-HCT (Higher carbon tax); SC2-HBM (Higher blending mandate); SC4-RMA (High/Low raw material availability); SC5-PF (with penalty fee); CJF (Conventional jet fuel).
Energies 14 07194 g010
Table 1. Approved technology pathways for RJF by ASTM until November 2020.
TechnologyFeedstocksMaximum BlendYear
Fisher–Tropsch (FT-SPK)Wastes (MSW, etc.) coal, gas, sawdust50%2009
Hydroprocessed Esters and Fatty Acids (HEFA)Vegetable oils: palm, camelina, jatropha, used cooking oil50%2011
Synthesized Isoparaffin (SIP)Sugarcane and sugar beet10%2014
Fisher–Tropsch containing aromatics (FT-SPK/A)Wastes (MSW, etc.) coal, gas, sawdust50%2015
Alcohol-to-Jet (AtJ) (Isobutanol and Ethanol)Sugar, sugar beet, saw dust, lignocellulosic residues (straw)50%2016/2018
Hydroprocessed Hydrocarbons (HH-SPK or HC-HEFA)Oils produced from algae10%2020
Hydrothermal liquefaction (HTL)Waste oils or energy oils50%2020
Source: International Airport Transport Association [38].
Table 2. Economic parameters to estimate annual investment cost.
ParameterValueUnit
Plant lifetime30Year
Discount rate10%
Start of time frame2020
End of time frame2050
Table 3. Reference studies used to determine total capital investment (TCI) and the capacity for each conversion pathway in this study.
Conversion PathwayFeedstockProduct OutputInput Capacity of the Ref. Study [tin/Year] 1Output Capacity of the Ref. Study [tout/Year]TCI [MEUR]TCI [MSEK] 2Ref.
Gasification-based Fischer–Tropsch (FT)Forestry residueJet fuel, Diesel, Naphtha614,01079,820482 34842[109]
Hydrothermal
liquefaction (HTL)
Forestry residueJet fuel, Diesel, Gasoline164,670 457,320 5132.3 61240[26]
Power-to-Liquid (PTL) through the FT routeCO2 7Jet fuel, Diesel, Gasoline58,16214,08065682[65]
1 The output capacity is based on total product output (jet fuel, diesel, naphtha and gasoline). 2 Total capital investment (TCI) has been adjusted to SEK2020 using consumer price index [110]. 3 TCI in EUR2016, currency data presented in Supplementary Materials in Table S2 from [111,112]. 4 Calculated based on a biomass density of 16.7 MJ/kg from [26]. 5 Calculated based on a biofuel density of 40.3 MJ/kg from [26]. 6 TCI in EUR2015, currency data presented in Supplementary Materials in Table S2 from [111,112]. 7 Based on CO2 input, the H2 input is considered in the costs related to the PTL production.
Table 4. Assumed production yields for the included production pathways.
Conversion PathwayTotal Product YieldJet FuelNaphthaGasolineDieselUnitRef.
Gasification-based Fischer–Tropsch (FT) 10.130.10--0.01tout/tin[109]
Hydrothermal
liquefaction (HTL)
0.350.06-0.090.25tout/tin[26]
Power-to-Liquid (PTL) through the FT route 20.240.10-0.090.03tout/tCO2, in[65]
1 The yields of jet fuel, naphtha, gasoline and diesel were based of [108]. 2 The yield for PTL has been adjusted to CO2 as input feedstock.
Table 5. Economic parameters of the studied RJF conversion pathways.
ParameterFT [108]HTL [26]PTL [65]Unit
RJF ProductionCO2 Capture
Annualized capital cost (CAPEX)792413,42012,900-SEK/tRJF,out
Fixed cost317537516-SEK/tRJF,out
Utilities for variable cost
Electricity demand0.060.0910.300.54 2MWh/tin
Water demand-0.8614.5019.70m3/tin
Catalysts and chemicals808.671.76--SEK/tin
Hydrogen-411See footnote. 1-SEK/tin
1 The cost of hydrogen is internalized in the CAPEX, fixed costs, and operational costs of PTL. 2 The unit is defined as MWh/tCO2 out from the capturing process and into the PTL production.
Table 6. Annual utility prices and market prices of HEFA and CJF.
Parameter2020203020402050UnitRef.
Water 112.418.3527.1740.22SEK/m3[114,115,116,117,118]
Forestry residue 2952.78996.41 043.741093.33SEK/t[119]
Naphtha 34239.965596.746439.897554.39SEK/t[120]
Gasoline 35595.967386.678499.479970.41SEK/t[120]
Diesel875115513291559SEK/t[104]
HEFA13,450.68 (10.81)13,450.68 (10.81)13,450.68 (10.81)13,450.68 (10.81)SEK/t (SEK/liter)[121]
CJF 32918 (2.35)3851 (3.10)4431.38 (3.56)5198.28 (4.18)SEK/t (SEK/liter)[122]
1 Average water price for 2020 based on Stockholm, Gothenburg, Malmö, Uppsala and Linköping. The annual increase is assumed to be 4% based on [123]. 2 The annual increase has been calculated based on the increase of biomass prices for 2020–2050 in [124]. 3 The annual increase was calculated based on the annual increase for diesel.
Table 7. Parameters used to calculate fuel demand for small Swedish airports.
ParameterVariableValueUnitRef.
Average domestic trip length δ domestic 486.9km[134]
Average European trip length δ Europe 3000kmSee footnote. 1
Average fuel burn/passenger f ~ passenger 0.03liter/km[32]
Departing passengers domestic p ~ a , domestic --[74,75]
Departing passengers to Europe p ~ a , Europe --[74,75]
1 The average trip length to a destination in Europe was determined with a straight-line approximation to the most common destinations from the airports and by taking the average of that.
Table 8. Emission factors used in the modeling.
Emission FactorValueUnitRef.
Forestry residue feedstock cultivation and collection2.4gCO2, eq/MJ jet fuel[141]
Feedstock to fuel conversion for FT production0.03gCO2, eq/MJ jet fuel[141]
Chemicals and catalysts used in PTL production0.1gCO2, eq/MJ jet fuel[140]
HEFA16gCO2, eq/MJ jet fuel[32]
CJF94gCO2, eq/MJ jet fuel[32]
Table 9. Summary of scenarios development and key parameters altered in each scenario.
ScenarioBlending RatioCarbon TaxRaw Material AvailabilityPenalty FeeDescription
SEK/kg CO2Forestry ResidueCO2 from PP, CHP, CI and WT/WI Plants 1CO2 from BG and BF Plants 1SEK/kgCO2
Reference (REF)0–75%1.230%70%100%0The REF scenario is a base case to which the other scenarios are compared. The variables have been set to reflect the current situation in Sweden.
Scenario 1–Higher carbon tax (SC1-HCT)0–75%1.2–4.430%70%100%0In SC1-HCT, the carbon tax is increased to investigate how the life cycle GHG emissions affect the outcome of the model.
Scenario 2–Higher blending mandate (SC2-HBM)0–100%1.230%70%100%0In SC2-HBM, the blending mandate is increased to investigate how the policy will affect the outcome of the model.
Scenario 3–Higher carbon tax without a blending mandate (SC3-HCT-B)0%1.2–8.730%70%100%0In SC3-HCT-B, the carbon tax is further increased while the blending mandate has been removed.
Scenario 4–Raw material availability (SC4-RMA)0–75%1.210–30%70–100%100%0In SC4-RMA, the raw material availability is changed. Due to rising demand in other sectors the availability of forestry residue is reduced, and the availability of CO2 is increased due to technological improvements.
Scenario 5–Penalty fee (SC5-PF)0–75%1.230%70100%6In SC5-PF, the penalty fee from the blending mandate has been added. In the optimization model, a constraint has also been changed which is described in the Supplementary Materials in Section S3, Equations (S23)–(S27).
1 PP (pulp and paper industries); CHP (combined heat and power plants); CI (chemical industries); WT/WI (waste treatment and incineration plants); BF (biofuel plants); BG (biogas upgrading plants).
Table 10. Production costs per unit jet fuel output in 2025–2050.
FTPTL
SEK/literSEK/GJSEK/literSEK/GJ
Total production cost excl. transport costs15.3–16.3432.9–460.316.8–23.1474.9–652.8
Total production cost incl. transport costs21.5–22.4606.9–634.022.9–29.2646.6–826.1
Revenues from by-products0.1–0.23.0–4.65.0–7.7142.1–218.3
Total production cost excl. transport costs minus revenues of by-products15.2–16.1429.9–455.711.8–15.4332.8–434.6
Table 11. Annual emissions reduction potential from all scenarios relative REF.
ScenarioEmissions Reduction Relative REFEmissions Reduction Relative CJF
202520302035204020452050202520302035204020452050
REF------4.43%19.60%26.18%31.51%36.54%42.17%
SC1-HCT0.00%0.22%0.35%0.40%95.19%57.08%4.43%19.78%26.43%31.78%67.49%63.18%
SC2-HBM0.99%8.56%13.24%17.09%22.24%29.11%5.34%25.94%34.81%44.22%48.08%55.21%
SC3-HCT-B−4.41%372.35%333.71%302.37%272.85%239.75%0.00%82.98%82.98%82.98%82.98%82.98%
SC4-RMA0.00%−1.59%−1.38%−1.36%−1.35%−1.33%4.41%18.37%25.15%30.62%35.71%41.43%
SC5-PF2025203020352040204520503.73%22.40%32.36%42.32%52.28%62.23%
Notes: REF (Reference scenario); SC1-HCT (Higher carbon tax); SC2-HBM (Higher blending mandate); SC3-HCT-B (Higher carbon tax without blending mandate); SC4-RMA (High/Low raw material availability); SC5-PF (With penalty fee); CJF (Conventional jet fuel).
Publisher’s Note: MDPI stays neutral with regard to jurisdictional claims in published maps and institutional affiliations.

