Article

Application of Gene Expression Programming (GEP) in Modeling Hydrocarbon Recovery in WAG Injection Process

by
Shokufe Afzali
,
Mohamad Mohamadi-Baghmolaei
and
Sohrab Zendehboudi
*
Faculty of Engineering and Applied Science, Memorial University, St. John’s, NL A1B 3X5, Canada
*
Author to whom correspondence should be addressed.
Energies 2021, 14(21), 7131; https://doi.org/10.3390/en14217131
Submission received: 11 August 2021 / Revised: 11 October 2021 / Accepted: 12 October 2021 / Published: 1 November 2021
(This article belongs to the Special Issue State of the Art of Carbon Capture and Sequestration)

Abstract

:
Water alternating gas (WAG) injection has been successfully applied as a tertiary recovery technique. Forecasting WAG flooding performance using fast and robust models is of great importance to attain a better understanding of the process, optimize the operational conditions, and avoid high-cost blind tests in laboratory or pilot scales. In this study, we introduce a novel correlation to determine the performance of the near-miscible WAG flooding in strongly water-wet sandstones. We conduct dimensional analysis with Buckingham’s π theorem technique to generate dimensionless numbers using eight key parameters. Seven dimensionless numbers are employed as the input variables of the desired correlation for predicting the recovery factor of a near-miscible WAG injection. A verified mathematical model is used to generate the required training and testing data for the development of the correlation using a gene expression programming (GEP) algorithm. The provided data points are then separated into two subsets: training (67%) to develop the model and testing (33%) to assess the models’ capability. Conducting error analysis, statistical measures and graphical illustrations are provided to assess the effectiveness of the introduced model. The statistical analysis shows that the developed GEP-based correlation can generate target data with high precision such that the training phase leads to R2 = 92.85% and MSE = 1.38 × 10⁻³ and R2 = 91.93% and MSE = 4.30 × 10⁻³ are attained for the testing phase. The relative importance of the input dimensionless groups is also determined. According to the sensitivity analysis, decreasing the oil–water capillary number results in a significant reduction in RF in all cycles. Increasing the magnitudes of oil to gas viscosity ratio and oil to water viscosity ratio lowers the RF of each cycle. It is found that oil to gas viscosity ratio has a higher impact on RF value compared to oil to water viscosity ratio due to a higher viscosity gap between the gas and oil phases. It is expected that the GEP, as a fast and reliable tool, will be useful to find vital variables including relative permeability in complex transport phenomena such as three-phase flow in porous media.

1. Introduction

Water alternating gas (WAG) injection is a common enhanced oil recovery (EOR) technique; this recovery method has been recognized as a cost-effective and successful method for greater oil production [1,2]. Over recent decades, there have been some field applications, numerical simulations, and laboratory experiments on WAG injection processes [1,2]. In a study conducted by Skauge et al. [3], it was reported that WAG injection can increase the oil recovery factor by 5–10% in the field scale.
Simulation and numerical modeling of the WAG flooding processes have been investigated in the literature to explore the effect of various key parameters such as the number of injected cycles, WAG ratio [4,5], wettability [6,7], relative permeability and hysteresis [7,8] on the WAG performance. One of the main problems in simulating and optimizing a WAG injection process is the development of reliable and accurate correlations for rock and fluid characteristics and the number of trapped phases in the porous medium [9]. The cyclic process of the WAG operation and the three-phase flow in the reservoir cause extra burden in terms of computational costs and modeling robustness. The main focus of most previous simulation and optimization research investigations related to the WAG flooding has been on the analytical methods of solving the governing equations of three-phase flow, and auxiliary equations such as relative permeability models in the oil production process [10,11].
Despite the availability of several correlations for determination of three-phase relative permeability and capillary pressure for WAG flooding [12,13], they fail in different situations where there is mass transfer between phases, especially when one phase disappears. Dynamic behaviors caused by the evaporation of the trapped oil and dissolution of the injected gas in the residual oil also add extra complications to the WAG process. Many past studies were not able to have a proper evaluation of WAG process performance due to incorporation of inappropriate three-phase relative permeability or capillary pressure expressions/data in their models [14,15,16,17].
In the oil and gas industry, laboratory coreflood experiments have been conventionally used as a representative of actual hydrocarbon reservoirs to evaluate the effectiveness of EOR processes such as WAG flooding prior to field applications. Coreflood experiments can be also used to quantify flow properties such as capillary pressure and relative permeability curves. The acquired data from a small laboratory model can be utilized to predict the behavior of other similar systems. In recent decades, several research investigations have focused on WAG efficiency evaluation [18], process simulation [19], pilot tests [1,2], process governing mechanisms [20], hysteresis effects [21], and management of WAG implementations [22]. However, the WAG process has not been well-developed or understood yet. One of the overlooked aspects in the WAG process is the development of predictive tools prior to conducting pilot and field tests [23]. In some cases, complicated and timely simulations and modeling approaches are employed to examine the efficiency of the WAG process. For instance, the computational time for simulation and optimization of some reservoirs, particularly heterogeneous cases, might be thousands of hours [24]. Moreover, the optimization process conducted by simulation modeling approaches is based on a one parameter at a time process, without involving the effect of interactions between uncertain parameters on the process output [25]. Therefore, fast and low-cost tools for the assessment of WAG injection are required to overcome this issue.
As the first step in the prediction process, it is required to provide a set of relationships between the two systems, i.e., the given system or experimental model which is used to estimate the behavior of the target equivalent system, and the one of actual interest (the prototype system). These relationships are generally known as the scaling laws, similarity laws, or similarity requirements [26]. The scaling process eventually leads to developing dimensionless numbers, which are known as dimensionless scaling groups.
Smart computational tools have been extensively utilized for the prediction of various properties and parameters in health, safety, and chemical and petroleum engineering, including reservoir fluid and rock properties, process optimization, and performance assessment of EOR techniques [27,28,29,30,31,32]. For instance, machine learning and artificial intelligence have been employed to investigate/forecast the unloading gradient pressure in continuous gas-lift systems [33], air specific heat ratios [34], CO2 absorption in piperazine [35], CO2 conversion to urea [36], permeate flux during the filtration [37], CO2 storage efficiency [38], fouling occurrence in membrane bioreactors [39], and the recovery performance of CO2-WAG injection processes [40,41]. In recent years, various optimization techniques such as genetic algorithm (GA) and particle swarm optimization (PSO) have been widely used as reliable approaches to optimize different upstream and downstream processes in the oil and gas industry [42]. The primary version of GA was then modified into a new algorithm, called the genetic programming (GP) approach. Gene expression programming (GEP) is a new and updated version of GA that addresses most of the drawbacks and concerns around previous versions [43]. Generally, GEP is able to obtain a solution for regression problems [44]. Unlike in the GP program where the individuals’ populations are symbolically considered as expression trees (ETs), the individuals’ populations are regarded as the linear chromosomes in the GEP algorithm [45,46]. The GEP method has been employed in various research subjects in petroleum engineering, including estimating mixture viscosity in solvent-assisted oil recovery process [47], CO2 solubility in crude oil [48], minimum miscibility pressure (MMP) of live oil systems [49], petroleum emulsions’ viscosity [50], surfactant retention in porous media [51], residual gas saturation in spontaneous and forced imbibition processes [52], and oil price [53]. However, the application of this smart technique has not been reported for predicting the oil recovery of the near-miscible WAG injection process in the open-source literature. Near-miscible WAG injection studies are limited to few experimental investigations, which are highly time-consuming, expensive, and more importantly not comprehensive in terms of sensitivity analysis. Today, with significant developments in computer and data science, it is feasible to introduce robust, fast, and reliable models to forecast the performance of complex EOR processes such as WAG injection. The main objective of this work is to conduct the scaling analysis using the data provided by the validated and reliable implicit-pressure-explicit-saturation (IMPES) mathematical model for the development of a robust empirical model, which is able to predict the recovery factor of a WAG injection at the near-miscible condition.
This manuscript is structured as follows. After the introduction, in the theory and background section, we discuss a proper description of the WAG injection technique and a background on dimensional analysis approaches, and the introduction and fundamentals of GEP algorithms. In the methodology section, the application of a dimensionless model and its principles for generating the required data are discussed. Then, the design of experiment is provided, which is required to know the number of required runs, data, and dimensionless scaling groups. Afterwards, the analysis of variance (ANOVA), procedure of the GEP algorithm, and the model development are described. In the results and discussions section, the results of the ANOVA test and the relative importance of the input parameters are elaborated. We also discuss the results of the testing and training phases, statistical error analysis, GEP correlation, and sensitivity analysis. In the last section of this manuscript, the summary and main conclusions are given.

2. Theory and Background

2.1. WAG Mechanisms

Primary water flooding (WF) and gas injection (GI) processes are the two most conventional and common techniques in hydrocarbon production among the tertiary and secondary methods [54]. The efficiency of these processes relies on the volumetric sweep efficiency (the macroscopic scale) and the microscopic displacement efficiency [55].
The major drawbacks during GI processes are the gas fingering phenomenon caused by unfavorable (high) mobility ratio and insignificant macroscopic (volumetric) production efficiency [56]; and early gas breakthrough occurrence which has been reported in various pilot and field applications [57,58,59,60] caused by gas fingering and channeling in layers with high permeability. The main issues with the GI performance are related to the mobility of the fluids and reservoir conformance [56]. On the other hand, the cyclic injection of water and gas (in a WAG injection process) reduces the effective permeability of the gas phase, resulting in stabilized fluids’ fronts, and thereby enhancing the overall sweep efficiency of the system. Gravity segregation is another governing mechanism during a WAG flooding process, which is caused by the density difference between the active phases in the medium [61]. During the WF cycles, through displacing the oil bank at the bottom layers of the reservoir (bypassed during the GI cycle), gravity segregation enhances the vertical sweep efficiency of the system [61]. Figure 1 schematically depicts a general WAG flooding process including the distribution of the injecting (gas and water) and displaced (oil) phases in a typical porous medium.
The immiscible WAG (IWAG) is generally regarded as a WAG injection process in which the gas phase does not develop any miscibility with the oil phase. However, during a IWAG process, a slight mass transfer between the gas slug and the oil bank may occur, which improves the oil recovery. For a flow system with high gas–oil IFT (IWAG), despite the connectivity of the oil phase, the recovered oil by the film flow is insignificant when there are no other driving forces such as gravity forces. In a miscible gas-injection process, since there is no interface between the oil and gas phases, the fluids’ behavior is the same as a single-phase flow in which the oil recovery occurs only through dispersion of phases and molecular diffusion mechanisms. However, WAG injection in the near-miscible gas-injection model is another effective process from operational and economic points of view [20].

2.2. Dimensional Analysis

Two conventional techniques are proposed to generate the dimensionless groups: inspectional analysis [63,64], and dimensional analysis [61,62]. The inspectional analysis runs based on the governing differential equations of fluid displacement, while the dimensional analysis performs based on the pertaining variables that directly affect the system’s behavior. In the inspectional analysis procedure, the differential governing equations of the process, including the boundary and initial conditions, are transformed into dimensionless configurations through employing normalized variables into the differential equations [63,64]. This transformation leads to obtaining dimensionless forms of both dependent and independent variables, and dimensionless forms of scaling groups. In contrast to the inspectional analysis, in the dimensionless analysis, only the pertinent variables are required, and the governing equations are not transformed. In this technique, to obtain the dimensionless scaling groups, the power products of the variables are rendered to dimensionless forms. This leads to generating a set of homogeneous, linear, and algebraic equations [61,62]. The solutions of these equations provide a series of complete independent, meanwhile not unique, dimensionless numbers. Applying Buckingham’s π theorem on a set of selected variables results in generating the number and the forms of the dimensionless groups. Many studies have focused on applications of the scaling theory and similarity laws for flow in porous systems [61,65,66,67,68,69,70,71,72,73,74,75,76]. Initially, Leverett et al. [77] used the dimensionless groups in a research work on immiscible displacement of oil by water, which was later extended by Engleberts and Klinkenberg [78]. Asghari et al. [79] used the data provided by the previous performance of WF in the Weyburn field to generate an empirical correlation for estimating CO2 injection performance. Two different correlations were introduced with respect to different injection scenarios in the Weyburn field. The primary correlation was developed according to the WAG injection in vertical wells and the second correlation was generated based on the horizontal well injection by applying the Kinder Morgan CO2 Scoping model and utilizing the field production data. However, in their proposed model, only the oil production rate and CO2 and water injection rates were accounted for, and other field or operational variables were not included. Liu et al. [80] suggested a new model for developing dimensionless CO2 injection performance such as total injection (DTI), CO2 injection (DCI), tertiary oil production (DEOR), and CO2 production (DCP) for various WAG injection approaches. A Microsoft Excel VBA program (for injecting CO2 pulses) was applied to develop the prototypes for forecasting the system performance. Their new methodology (pulse method) was verified using mechanistic simulation results of finite elements for different WAG injection processes or different CO2 injection slug sizes, or both [80]. Jaber et al. [25] introduced a simple data-driven model to evaluate the miscible CO2-WAG injection performance in an Iraqi oil field. They employed a central composite design (CCD) to introduce a proxy model. They implemented an ANOVA to examine the effectiveness of the variables and their combinations within the model. The proposed proxy model determined the incremental oil recovery ( Δ F O E ) as a function of reservoir properties and operational conditions including permeability, porosity, ratio of vertical to horizontal permeability, cyclic length, bottomhole pressure, ratio of injected CO2 over water slug size, and injected CO2 slug size.

2.3. Fundamentals of GEP

Current genetic algorithm (GA) and genetic programing (GP) techniques have been widely used in common regression engineering problems such as function fitting and time series predictions [81,82,83]. In the GA algorithm, individuals are represented as the linear strings with specified lengths (chromosomes) during all evolution levels. This prevents GA from being applied in some complex-function fitting problems [84]. However, in the GP algorithm, individuals are represented as nonlinear elements with different sizes and forms. The GP algorithm is generally able to analyze complicated functions; however, in some cases different object size variations hinder the evolutionary procedure to obtain an optimum solution. On the other hand, gene expression programming (GEP) is a new method in developing computer programs with a focus on learning models and discovering knowledge [43]. GEP combines the features of the GA and GP algorithms, while the chromosome encoding makes it different from these two evolutionary approaches. In the GEP algorithm, the individuals are encoded as the chromosomes and are considered as the linear strings with specified lengths [43]. GEP is more flexible and rigorous in probing the search space by separating the genotype and phenotype. The designed chromosomes in GEP are simple and linear. GEP demonstrates significant advantages over its peers; for instance, compared to the GA, GEP performs approximately 2–4 orders of magnitude faster in analyzing the conventional problems due to its unique individual functioning [43]. GEP is a mature genotype/phenotype system in which the genotype is completely separated from the phenotype. However, in the GP technique, the genotype and phenotype are one element; indeed, it is a simple replicator system. GEP works based on two elements (e.g., chromosomes and ETs). The chromosomes encode the candidate solution and transform the actual solution candidates into an ET. The transition process of the chromosomes into an ET is inspired by the biological process of genes encoded (in DNA) into proteins [85].

3. Methodology

3.1. Data Collection

The accuracy and reliability of any proposed correlation are strongly linked to the identified appropriate input variables as well as the validity and reliability of employed data points used in the development stage [36,86]. The most important parameters affecting a WAG injection process include the fluid and rock properties and operational conditions. Due to the unavailability of adequate laboratory data for near-miscible WAG flooding processes, a suitable and reliable mathematical model is used [20]. The mathematical simulator approach is a two-dimensional model, with an implicit-pressure-explicit-saturation (IMPES) solution scheme. In the following subsections, the main and auxiliary equations required for developing the mathematical model are provided. For more details about the model development, technical readers may visit the study conducted by Afzali et al. [20].

3.2. Governing and Auxiliary Equations

For a three-phase and incompressible flow system, the governing equations to be solved include the mass or molar balances for all present fluids. The final form of the governing equations for an immiscible system with three phases (e.g., oil, water, and gas), after neglecting the phase dispersion and gravity effects and applying the Darcy’s Law (as the momentum balance equation) can be written as follows:
. ρ i K k r i μ i   p i x   +   q i = t ϕ ρ i s i ;       i o ,   w , g
Equation (2) introduces the relationship between the saturations of three phases existing in the system:
s o + s w + s g = 1
For an accurate simulation of a WAG injection process in which three phases are involved, selecting reliable relative permeability and capillary-pressure models accountable for three-phase flow systems is essential. Using direct measurement methods of capillary pressure data (for three-phase systems) from laboratory coreflood tests is a tedious and practically difficult process [87].
The pressure difference between two nonmiscible phases (i.e., nonwetting and wetting phases) is called capillary pressure (pc) (see Equation (3)). Capillary pressure is a function of fluids’ saturations and distribution, and porosity and permeability are the rock characteristics.
p c = p n w p w
The descriptions of all parameters of Equations (1)–(3) are provided in Table 1.
In the current work, we apply a capillary pressure model appropriate for three-phase systems, suggested by Neshat and Pope [88], derived based on the Gibbs free energy. The proposed model is an extended/modified version of a two-phase capillary pressure model introduced by Skjaveland et al. [89]. This capillary pressure model is capable of being applied on all wettability states including water-wet, mixed-wet, and oil-wet systems. The general form and description of the parameters of the employed capillary pressure model are presented by Equation (A1), as given in Appendix A.

3.3. Model Assumptions and Limitations

The following assumptions are considered to develop the mathematical model:
  • Gravity forces are neglected.
  • The flow direction is considered as 1D horizontal in the system.
  • The core and fluids are considered incompressible.
  • Core is strongly water-wet and homogeneous.
  • The equilibrium of capillary forces is held in the system.
  • The temperature of the system is 38 °C and the thermal equilibrium holds in the system.
  • The capillary end effects are neglected.
In the current work, we simulate an experimental case, in which a 2-inch core sample was utilized.
Since the diameter of the core is small, the gravity effects are insignificant, and assuming one dimensional flow is satisfactory for simulations. For each cycle, the two-phase relative permeability parameters are needed to be tuned and optimized. To do so, experimental two-phase data are used for tuning the two-phase relative permeability models. Afterwards, the tuned two-phase relative permeability models are utilized in the three-phase relative permeability model. For each of the WF and GI injection modes in the WAG flooding model, these parameters are optimized repeatedly to incorporate the hysteresis involved in the saturation of phases in the cyclic injection of fluids.
In the GEP algorithm, the number of constants per gene determines the maximum number of constants that can be allocated for a gene. The higher the number of constants, the more complicated the model is and a more accurate algorithm is obtained. Therefore, there should be a balance between the accuracy and degree of complexity while selecting the optimized GEP configuration. The optimal parameters are normally found randomly for development of any new correlation through GEP. Another limitation of the proposed model is impotence of the system analysis during each injection mode. Since the developed correlation only reports the recovery factor at the end of each cycle or injection mode (N = 1–3), other vital features such as instant RF and breakthrough time are not detected or determined.

3.4. Design of Experiment (DOE)

Due to the three-phase flow in the porous medium and the cyclic nature of the WAG flooding, the number of influential variables is higher than other conventional oil recovery techniques. Using a design of experiment (DOE) approach can reduce the computational costs required for mathematical modeling runs. The key aspect of a DOE is the selection of controlling factors. In this study, oil viscosity ( μ o ), gas and water injection rates (qg and qw), system permeability (K), pore volume injection of fluids (PVI), and number of cycles (N) are chosen to determine the dimensionless numbers and their significance. Using a two-level full factorial DOE, each parameter is studied at two levels with the upper and lower bounds coded as +1 and −1. Table 2 lists the upper and lower levels of all variables.
In the case of six factors (variables) at two levels, the model run design is called 26 full factorial design. Thus, a total of 96 runs are required with no replicates of each run to obtain the response.

3.5. Dimensionless Scaling Groups

As mentioned before, having an adequate knowledge of WAG processes helps use Buckingham’s π theorem and derive the dimensional groups in the dimensional analysis. We consider six variables, four fixed parameters, and the recovery factor (RF) as the response variable to obtain the dimensionless numbers (see Table 3).
Hence, seven dimensionless numbers are introduced using Buckingham’s π theorem, which are listed below:
π 1 = σ o w   K μ w   q w
π 2 = σ o g   K μ g   q g
π 3 = μ o μ g
π 4 = μ o μ w
π 5 = q w q g
π 6 = P V I
π 7 = N
where σ o g and σ o w denote the interfacial tension between the oil–gas and oil–water phases, respectively; μ i refers to the viscosity of the phase i; qw and qg represent the water and gas injection rates; PVI is the pore volume injection during each injection mode (WF or GI); and N introduces the number of injected cycles.

3.6. Analysis of Variance (ANOVA)

Lorenzen and Anderson [90] reported that ANOVA is the most accurate method to investigate the significant effects of factors. In the ANOVA table, the F test and p values represent the main and interaction effects, respectively [91]. The p value denotes the probability of error involved in the obtained results [92,93]. Accordingly, the smaller the values of p, the more significant the corresponding coefficient term is [94]. The p value corresponds to an α value of 0.05. For a factor with α lower than 0.05, the factor is considered as a significant parameter. In this study, we perform an ANOVA analysis for the simulation results and corresponding dimensionless numbers. Table 4 presents the results of the ANOVA to statistically assess the significance of each factor. Thus, the relevancy and importance of the input variables in a WAG flooding process can be determined through implementing the ANOVA.

3.7. GEP Procedure

As previously mentioned, the GEP algorithm uses two entities: the ETs and chromosomes. A chromosome consists of constant and variable terminals as well as prearranged functions in one or more genes with equal lengths [85]. The function and variables are the input data, while the constant values are generated by the algorithm within a range specified by the user. Each gene contains a head made of functions, variables, and constants, and a tail of terminals [85]. The size of the head (h) is specified by the user; however, the size of the tail (t) is computed as a function of “h” and a parameter “n”, which is defined as the number of elements in the function sets. The tail size of a chromosome can be obtained using the following equation:
t = h(n − 1) + 1
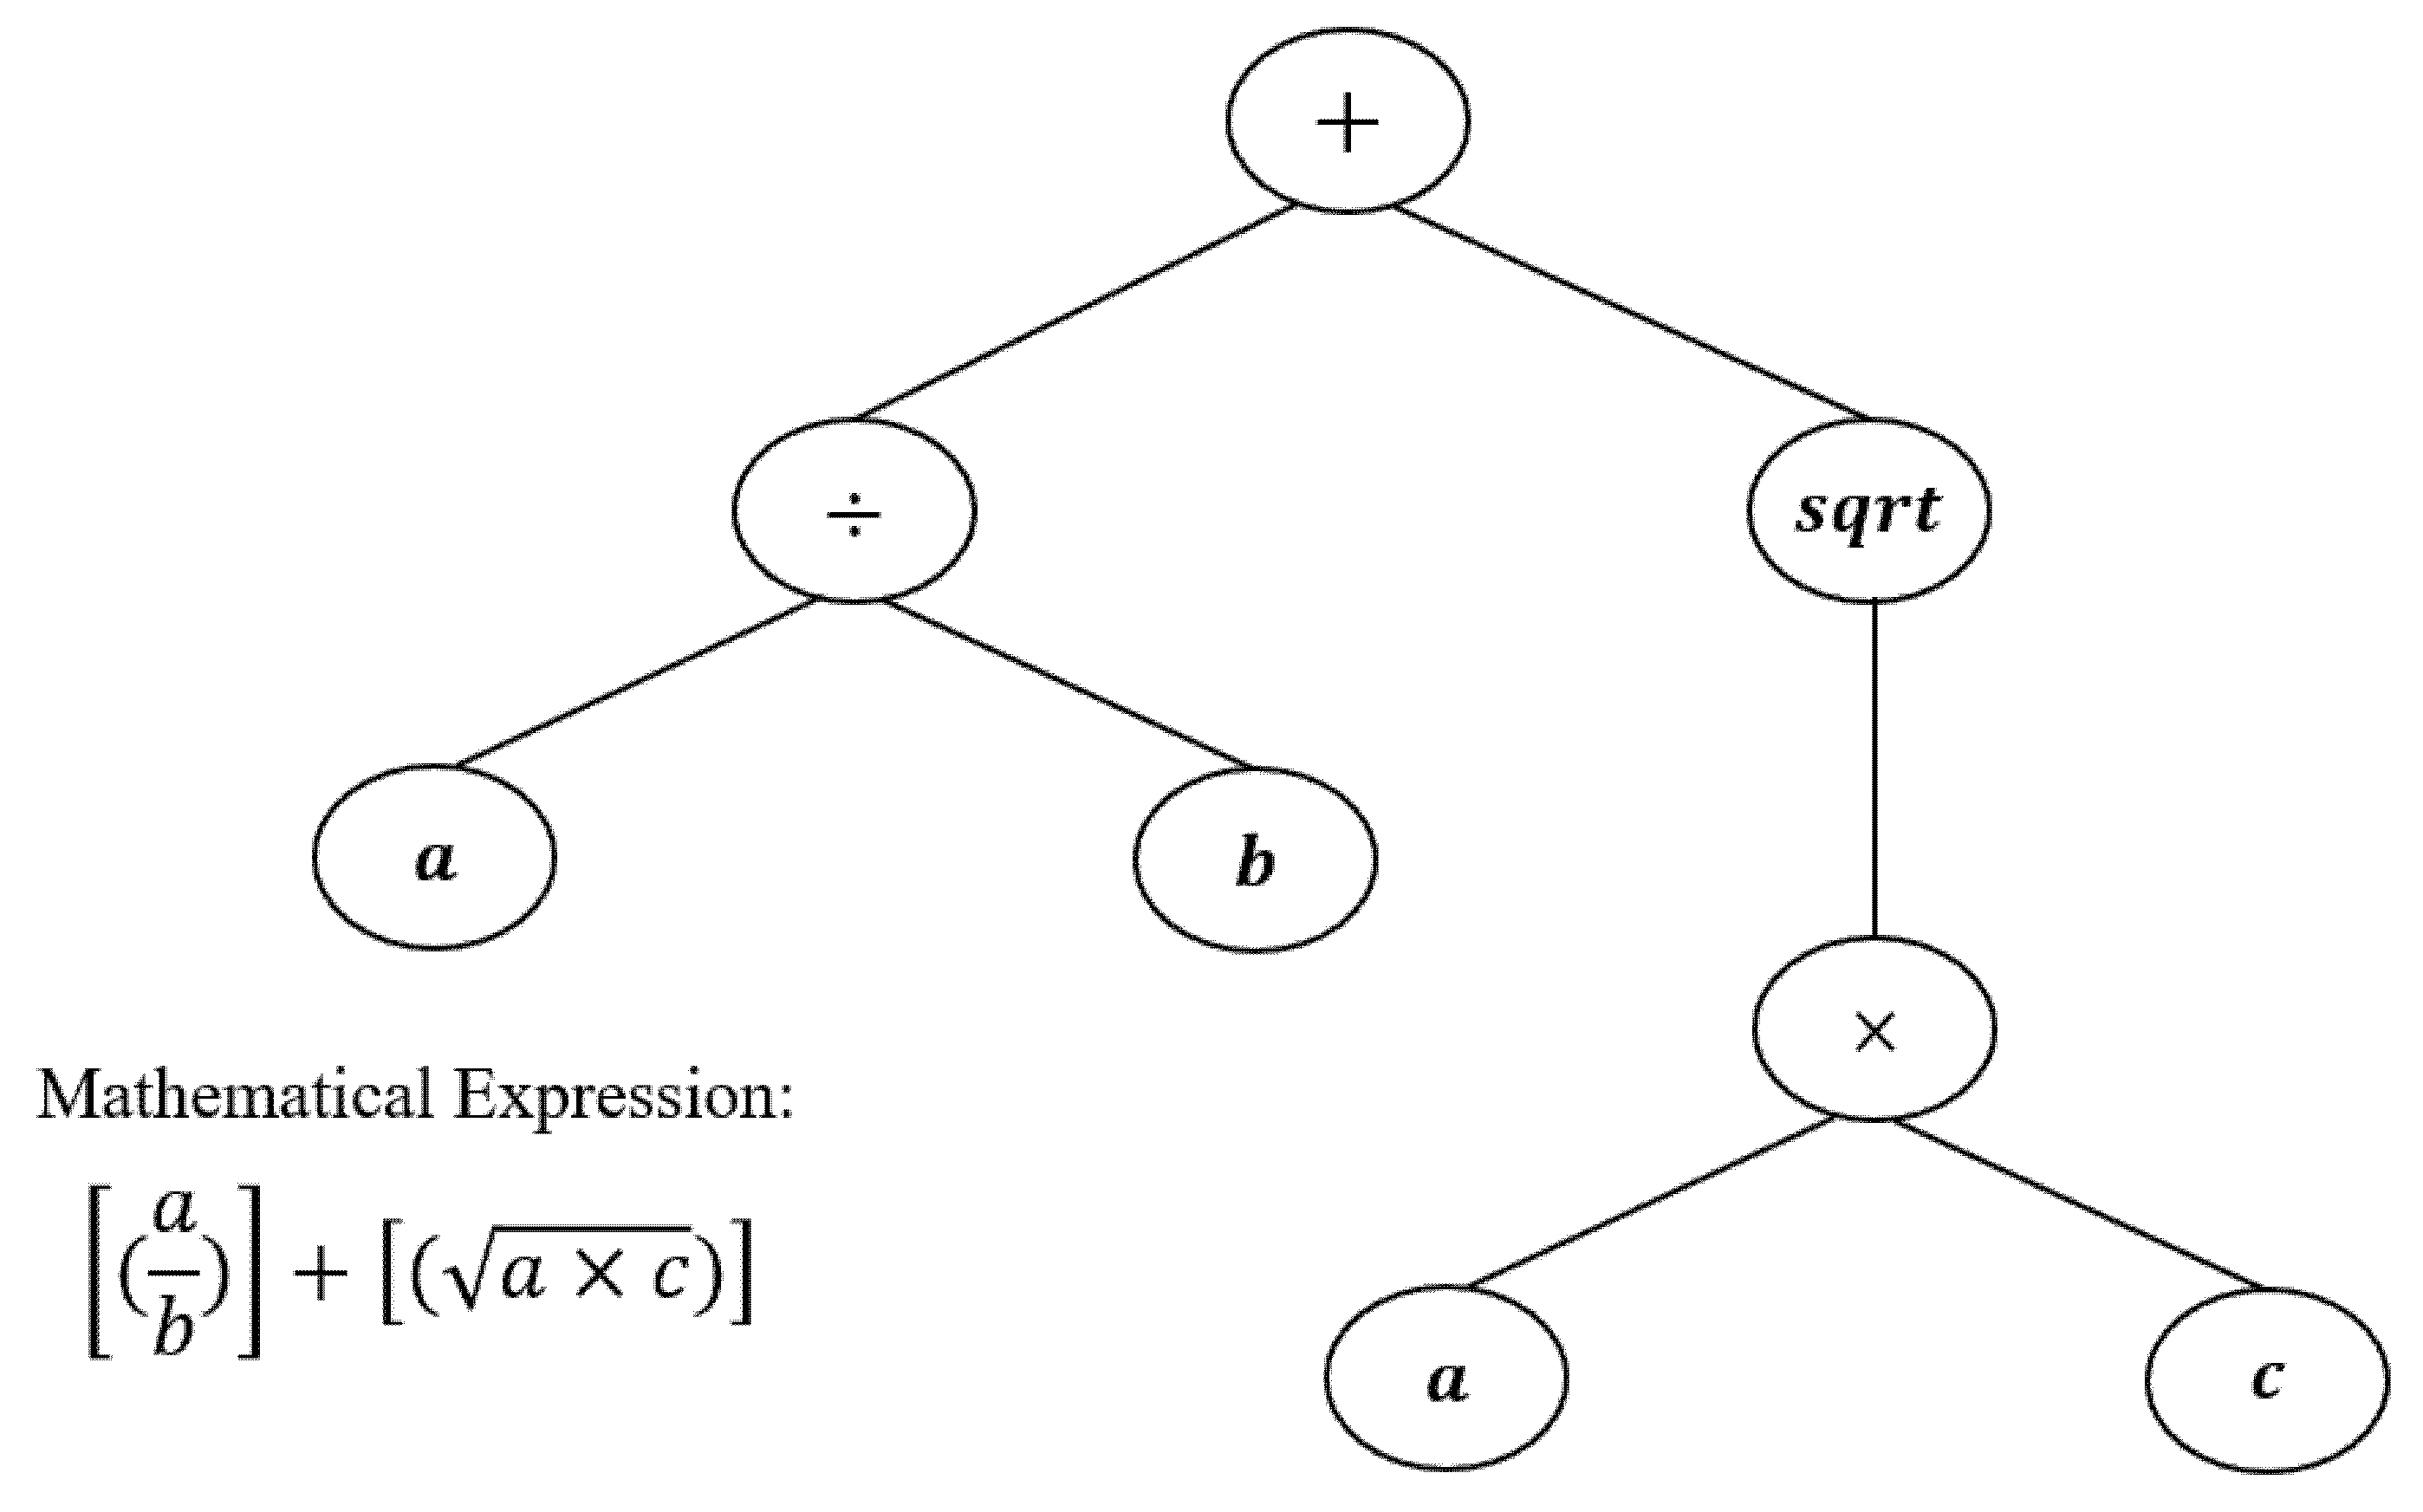
where t and h are the tail and head of the gene; and n represents the number of elements of the function utilized in the head of the gene. Figure 2 demonstrates an example of a two-gene chromosome containing four functions of × ,     ÷ ,   + ,     and   , and three terminals including a, b, and c. In Figure 2, both the mathematical and the equivalent expression tree forms using Kara language are illustrated.
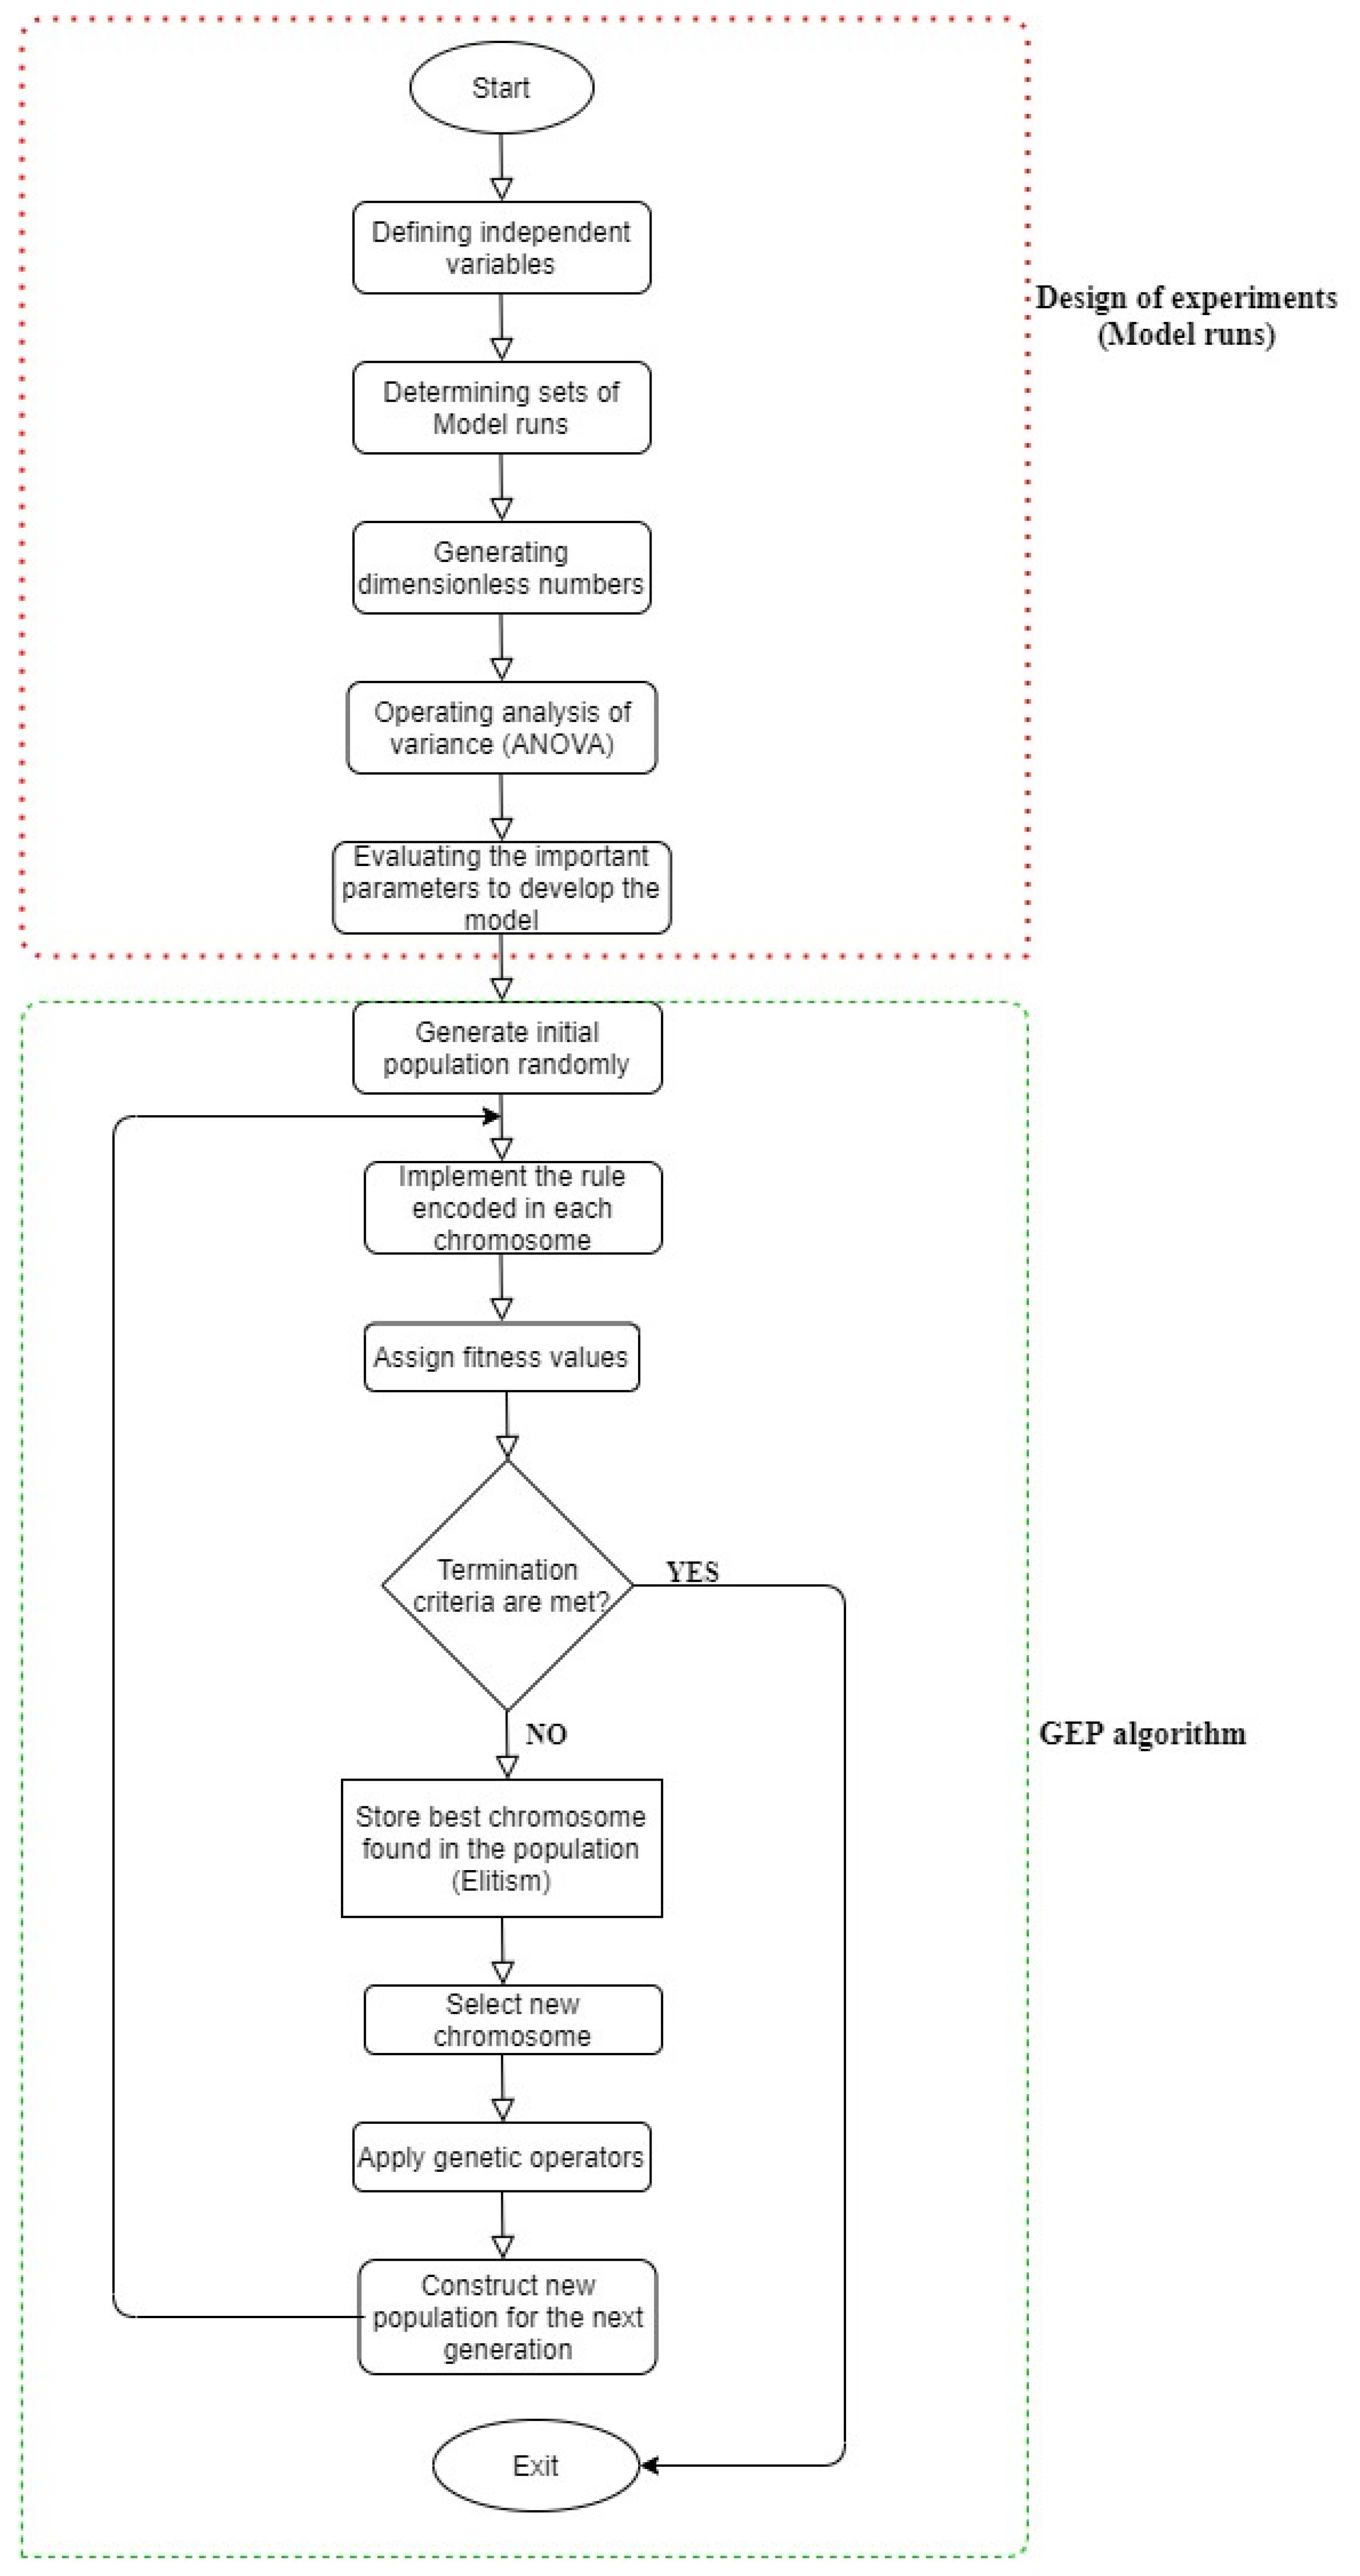
Every character is set in one spot from zero to seven, which is shown by 01234567. In the case of multigenetic chromosomes, all ETs are connected by their root nodes through a linking function such as Boolean function [95]. The computational procedure of the GEP algorithm is summarized in the following steps [45]:
  • Initializing the population through generating random chromosomes of a certain number of individuals.
  • Fitting the population individuals according to the fitness functions.
  • Selecting some individuals and copying them for the next generation based on their fitness (simple elitism) [96].
  • Applying the same procedure for the new population including the selection of the environment, expression of genomes, selection of the population individuals, and reproduction with modification.
  • Repeating the previous steps until the termination criteria are met.

3.8. Model Development Steps

Using the GEP algorithm, there is no need to assume prespecified correlation formats for accurate prediction of target data. Hence, the GEP’s computation process finds the most accurate forms of independent parameters by itself. As previously discussed, the main parameters affecting the RF of a WAG injection process are the oil viscosity, water and gas injection flowrates, permeability of the system, PVI, and the number of injected cycles (N). Therefore, the variables are used to generate the dimensionless numbers; these groups are assumed to be correlating parameters for predicting the RF of WAG flooding:
π i = f μ o , q w , q g , P V I , K , N , Fixed   Parameters
where R F W A G = f π i .
The following steps are taken to develop a new WAG RF correlation:
  • Generating the population using random chromosome individuals and applying correlation formats as pars trees using the functions or operators (×, +, −), and terminals which are functions of input variables and output results (RF of WAG).
  • Computing the fitness value for each individual of the generated population using the following objective function (OF):
O F = 100 N i N R F p r d i R F e x p i R F e x p i
where N is the number of data points used for the GEP implementation, and subscriptions “prd” and “exp” denote the RF values predicted by the GEP algorithm and the RF values generated by the verified mathematical model to be used as the experimental (or target) data, respectively.
  • Selecting some individuals and copying them into the next generation based on their fitness (simple elitism). In this work, the tournament method is employed to select adequate varieties of the population in each generation [44,45].
  • Applying the genetic operators on selected chromosomes, including:
    -
    Replication operator: This operator copies the chromosome’s structure selected in step 3.
    -
    Mutation operator: As the most important step in the GEP algorithm, the mutation can occur anytime and at any position in a genome, as long as the mutated chromosome meets the validity criteria. The mutation operator changes the head and tail terminals, while the original structure of the chromosome is preserved.
    -
    Inversion: The inversion operator is only applied to the heads of genes, where any sequence is randomly selected and employed. The inversion operator selects the chromosome, the gene to be modified, and the initiation and termination points of the sequence to be inverted at random.
  • Transposition and insertion sequence elements: A portion of the genomes, which can be activated and jump to another place in the chromosome, are called the transposable elements of the GEP program. Ferreira [45] divided these elements into three types: “short fragments with either a terminal or function in the first position transpose to the head of genes, short fragments with a function in the first position that transpose to the rest of the head of genes (root IS elements or RIS elements), and entire genes that transpose to commencing of chromosomes.”
  • Recombination: This step normally involves two parent chromosomes to produce two new chromosomes through combining various parts of the parents through three approaches: linking one-point recombination, two-point recombination, and gene recombination [35]. Accordingly, the new generation will be reproduced, and the procedure is continued until the termination criteria are met.
In this study, the data are distributed into two categories: training and testing/validating data subsets by a ratio of 67% and 33%, respectively. The training phase is carried out for the developing the model. After this stage, the validation data set is used to assess the validity of the model. Figure 3 illustrates a schematic flowchart of the procedure applied in this study to develop a correlation for the RF of WAG.

4. Results and Discussions

4.1. Model Development

In order to develop a new reliable correlation for estimating the RF of a WAG injection using the GEP approach, some important factors/parameters in the GEP strategy including population size, number of chromosomes, head size, number of genes, type of the fitness function, map operators, and number of constants per genes, are required. The optimal or adjusted parameters for this work are listed in Table 5. For instance, the number of constants per gene determines the maximum number of constants that can be allocated for a gene. The higher the number of constants, the more complicated and accurate the algorithm becomes. Therefore, a balance should be reached between the accuracy and degree of complexity while selecting the optimized GEP configuration. The optimal parameters are normally found randomly for the development of any new correlation through GEP.
In this modeling method, 67% of data for the oil recovery factor is allocated to the training step. Then, 33% of the entire database is considered as unseen data for the testing phase. It is found that the model is satisfactory and can predict the unseen data within almost the same accuracy obtained in the training phase. The model is developed based on the GEP algorithm using the GeneXproTools software [97]. To examine the accuracy of the newly developed model, a systematic error analysis should be conducted. The statistical parameters including mean square error (MSE), root-mean-square error (RMSE), mean absolute error (MAE), residual standard error (RSE), relative absolute error (RAE), and coefficient of determination (R2) are used for statistical analysis of the developed model. Thus, the error analysis can effectively test the reliability and accuracy of the proposed model. For instance, the R2 parameter demonstrates the degree of a match between the target data generated by the mathematical model and the calculated RF data using the newly proposed correlation. Equations (A2) to (A6) in Appendix A express the mathematical formulas of the statistical measures used in this study. Table 6 presents the results of statistical error analysis for both the training and testing phases. The low values of error as well as the high magnitudes of correlation of determination (R2Training = 0.93 and R2Testing = 0.92) for both phases confirm the effectiveness and precision of the new GEP correlation.
Moreover, cross plots or parity diagrams and residual scattering error-distribution plots are provided to graphically investigate the error analysis. After conducting the ANOVA test, the selected dimensionless numbers ( π 1 to π 7 ) are introduced as the variables to the GEP simulator for generating the correlation. The final form of the developed correlation using the GEP algorithm for predicting the recovery factor of a WAG process is expressed as follows:
A 1 = 1 1 π 1 × 10 2 × C 11 × π 4 C 10 2 C 13 × C 15 × C 18 × d 2 d 5
A 2 = ( π 7 C 22 × π 1 3 × π 2 × C 28 × 10 10 4 + π 7 C 29 4 ) 2
A 3 = C 35 C 32 + π 6 × π 7 2 + π 5 × C 32 + π 6 × π 7 4 × π 4 2 π 3
A 4 = exp 1 + π 5 π 3 × C 49 × π 2 . π 7 × 10 4 + π 3 π 5 π 2 × 10 2 C 42 2
R F = A 1 + A 2 + A 3 + A 4
The constant values of Equations (14)–(18) are listed in Table 7.
Table 8 shows the statistical information of the input variables, i.e., dimensionless numbers ( π 1 to π 7 ) including the minimum, maximum, standard deviation, slope, intercept, correlation, and R-square versus the response variable which is the RF.
Figure 4 demonstrates the newly developed correlation in the form of an expression tree (ET) diagram. The generated ET consists of four sub-ETs (four genes) and each sub-ET is linked with the “addition” operator to the others. The input values to the model ( π 1 to π 7 ) are expressed as d 0 to d 6 within the sub-ETs.

4.2. Relative Importance (RI) of Input Variables

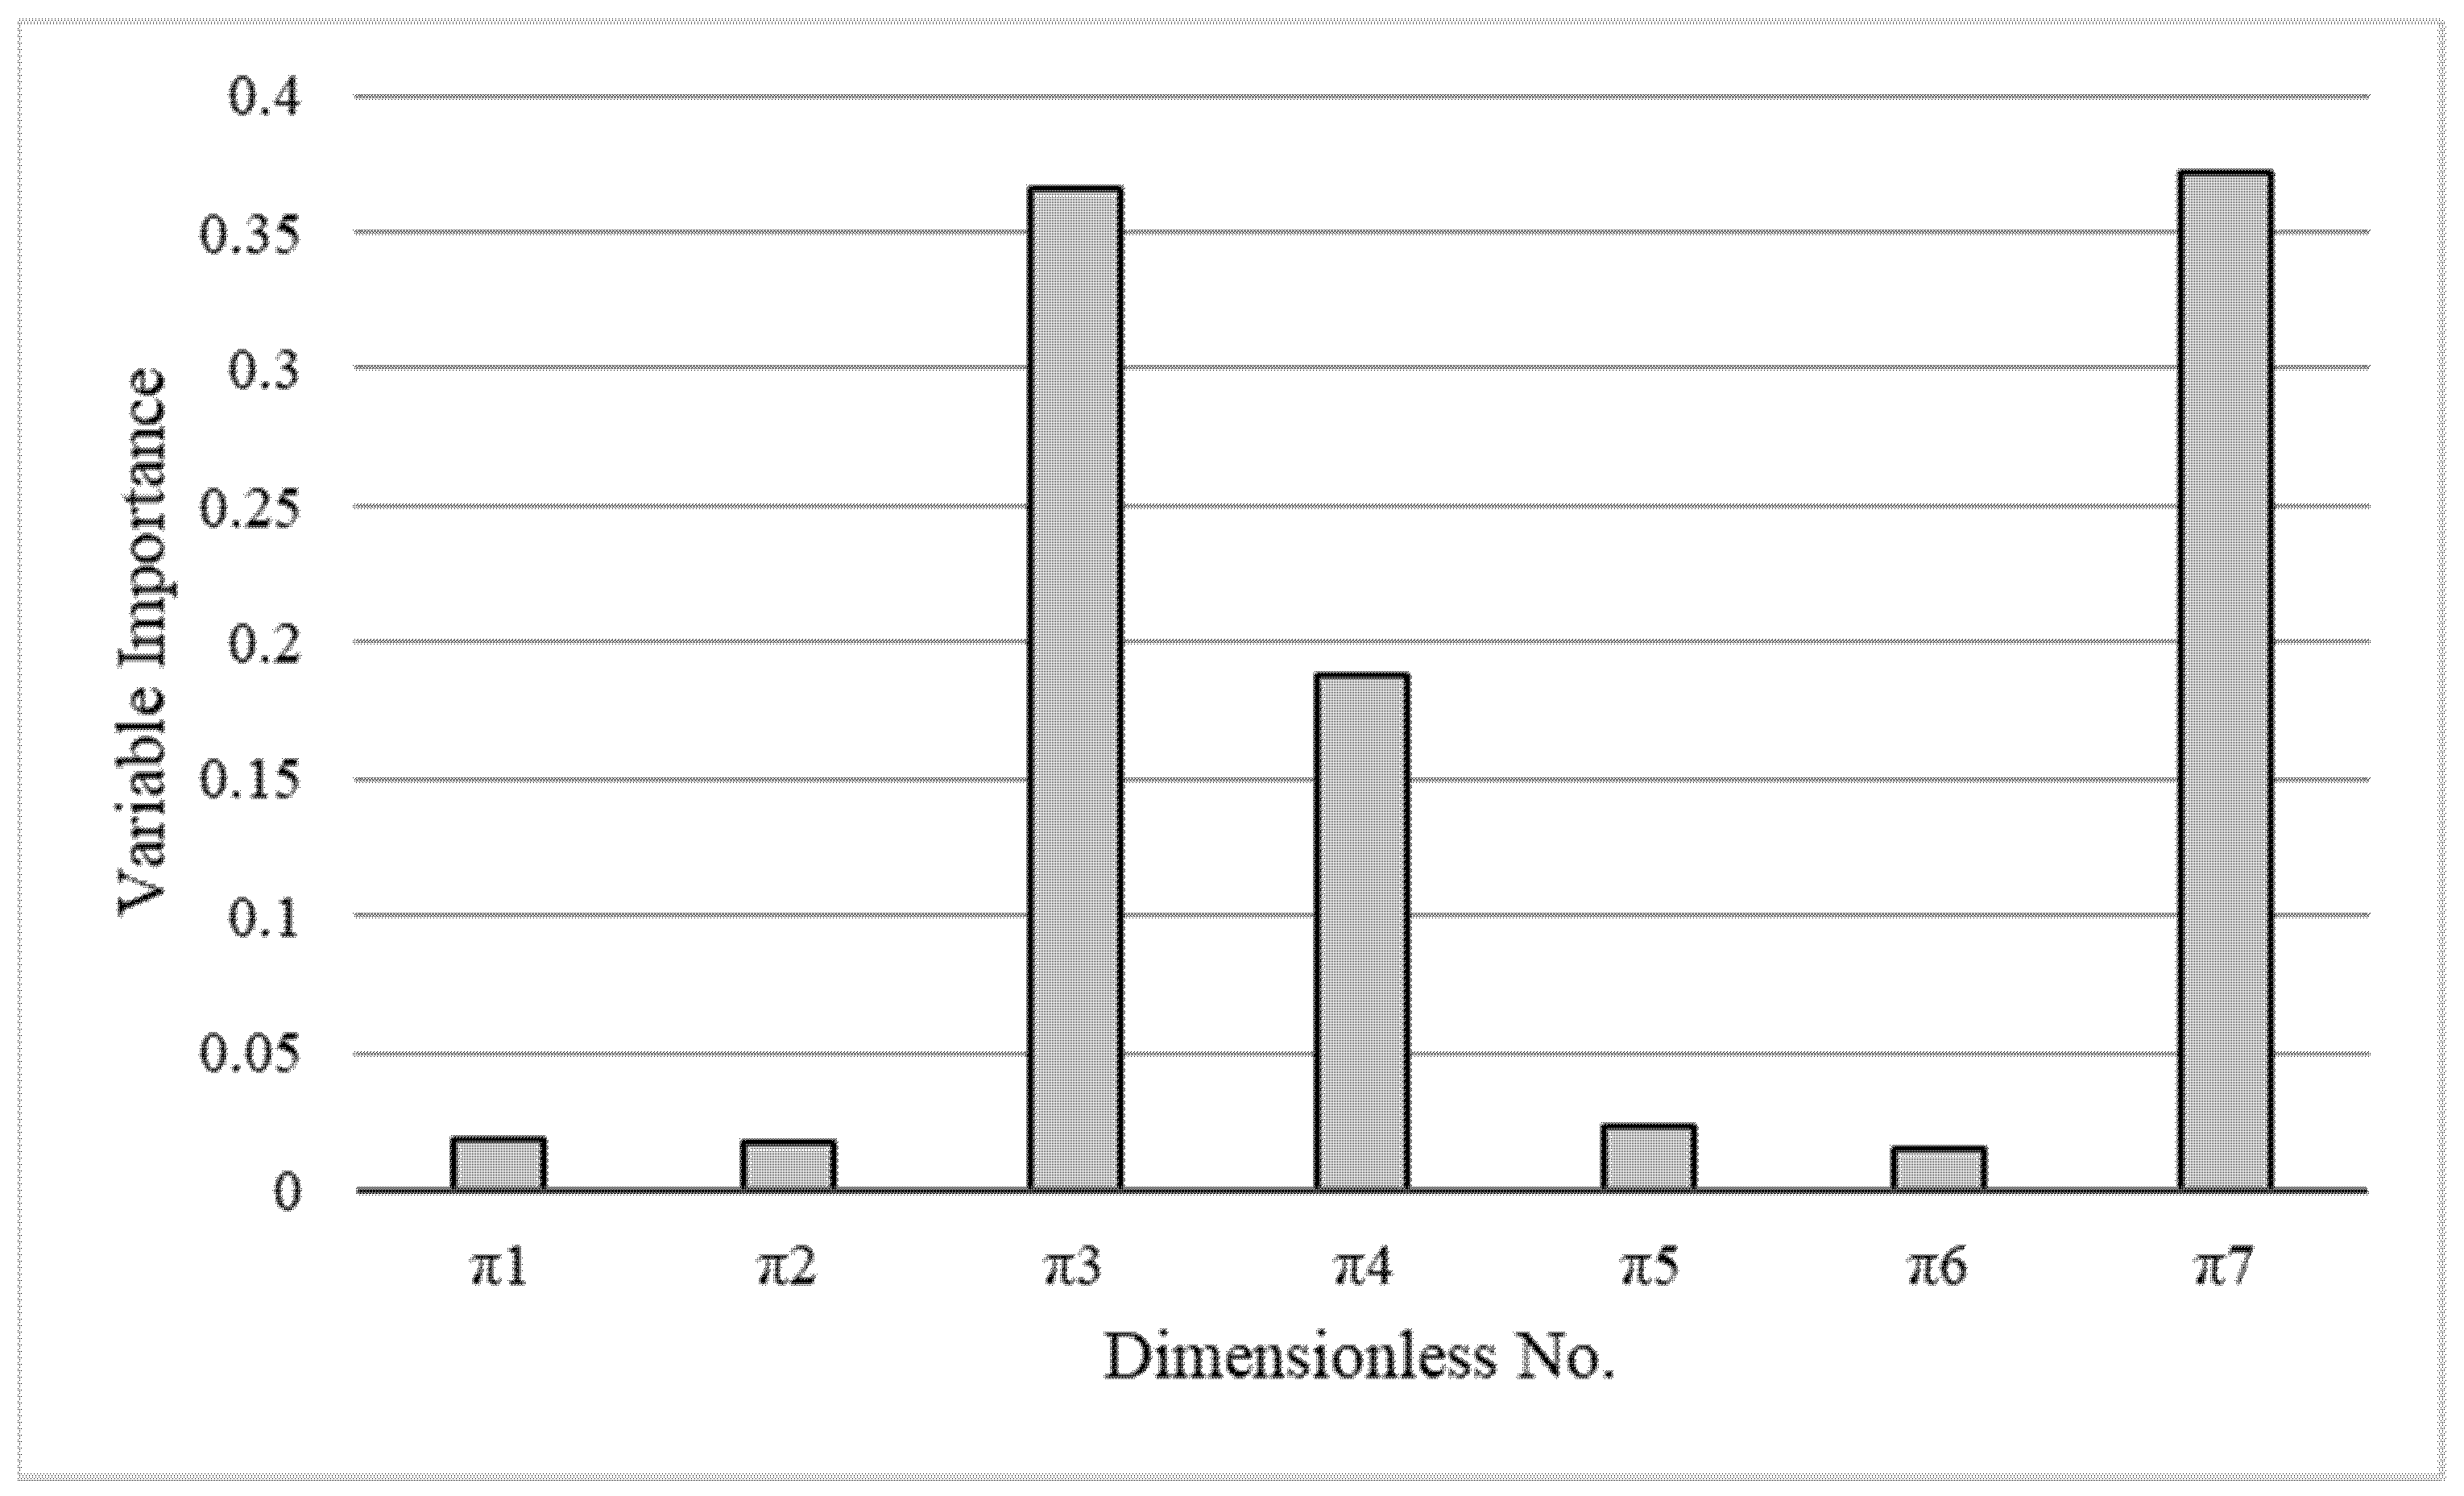
The importance of each input variable (e.g., dimensionless numbers) used for developing a correlation is associated with the weight and effect of the variable on the objective function; this is important for better design and optimization of the corresponding operation. The relative importance of the dimensionless numbers generated in this study is depicted in Figure 5. According to Figure 5, π 7 , or the number of WAG cycles, has the highest impact on the developed correlation with a relative importance (RI) of 37.14%. This is logical since through injecting consecutive WAG injection cycles (and thereby increasing the number of cycles (N)), a higher recovery factor is expected from the porous system. After π 7 , π 3 and π 4 are reported as the most important parameters. According to Figure 5, there is a noticeable difference between the ratio of oil to gas viscosities ( π 3 ) and the viscosity ratio of oil to water ( π 4 ) in terms of variable importance. This is due to a considerable viscosity difference between the hydrocarbon phase and the injected gas phase, compared to the oil and water viscosity difference. Moreover, the injection rate ratio of the water to the gas ( π 5 ), inverse of oil–water capillary number π 1 , inverse of oil–gas capillary number ( π 2 ), and PVI injection ( π 6 ) have relative importance values of 2.30%, 1.89%, 1.69%, and 1.52%, respectively.
In Figure 6, the cross plots show a part of the error analysis for the training and testing phases of the employed connectionist tool. As is clear from Figure 6 (panels a and b), a good match is observed between the target data and RF predictions based on the newly developed correlation. The magnitudes of the coefficient of determination R2 = 0.9285 for the training phase, and the coefficient of determination R2 = 0.9193 for the testing phase confirm that the proposed correlation is reliable and accurate for predicting oil recovery factor in a WAG injection process.
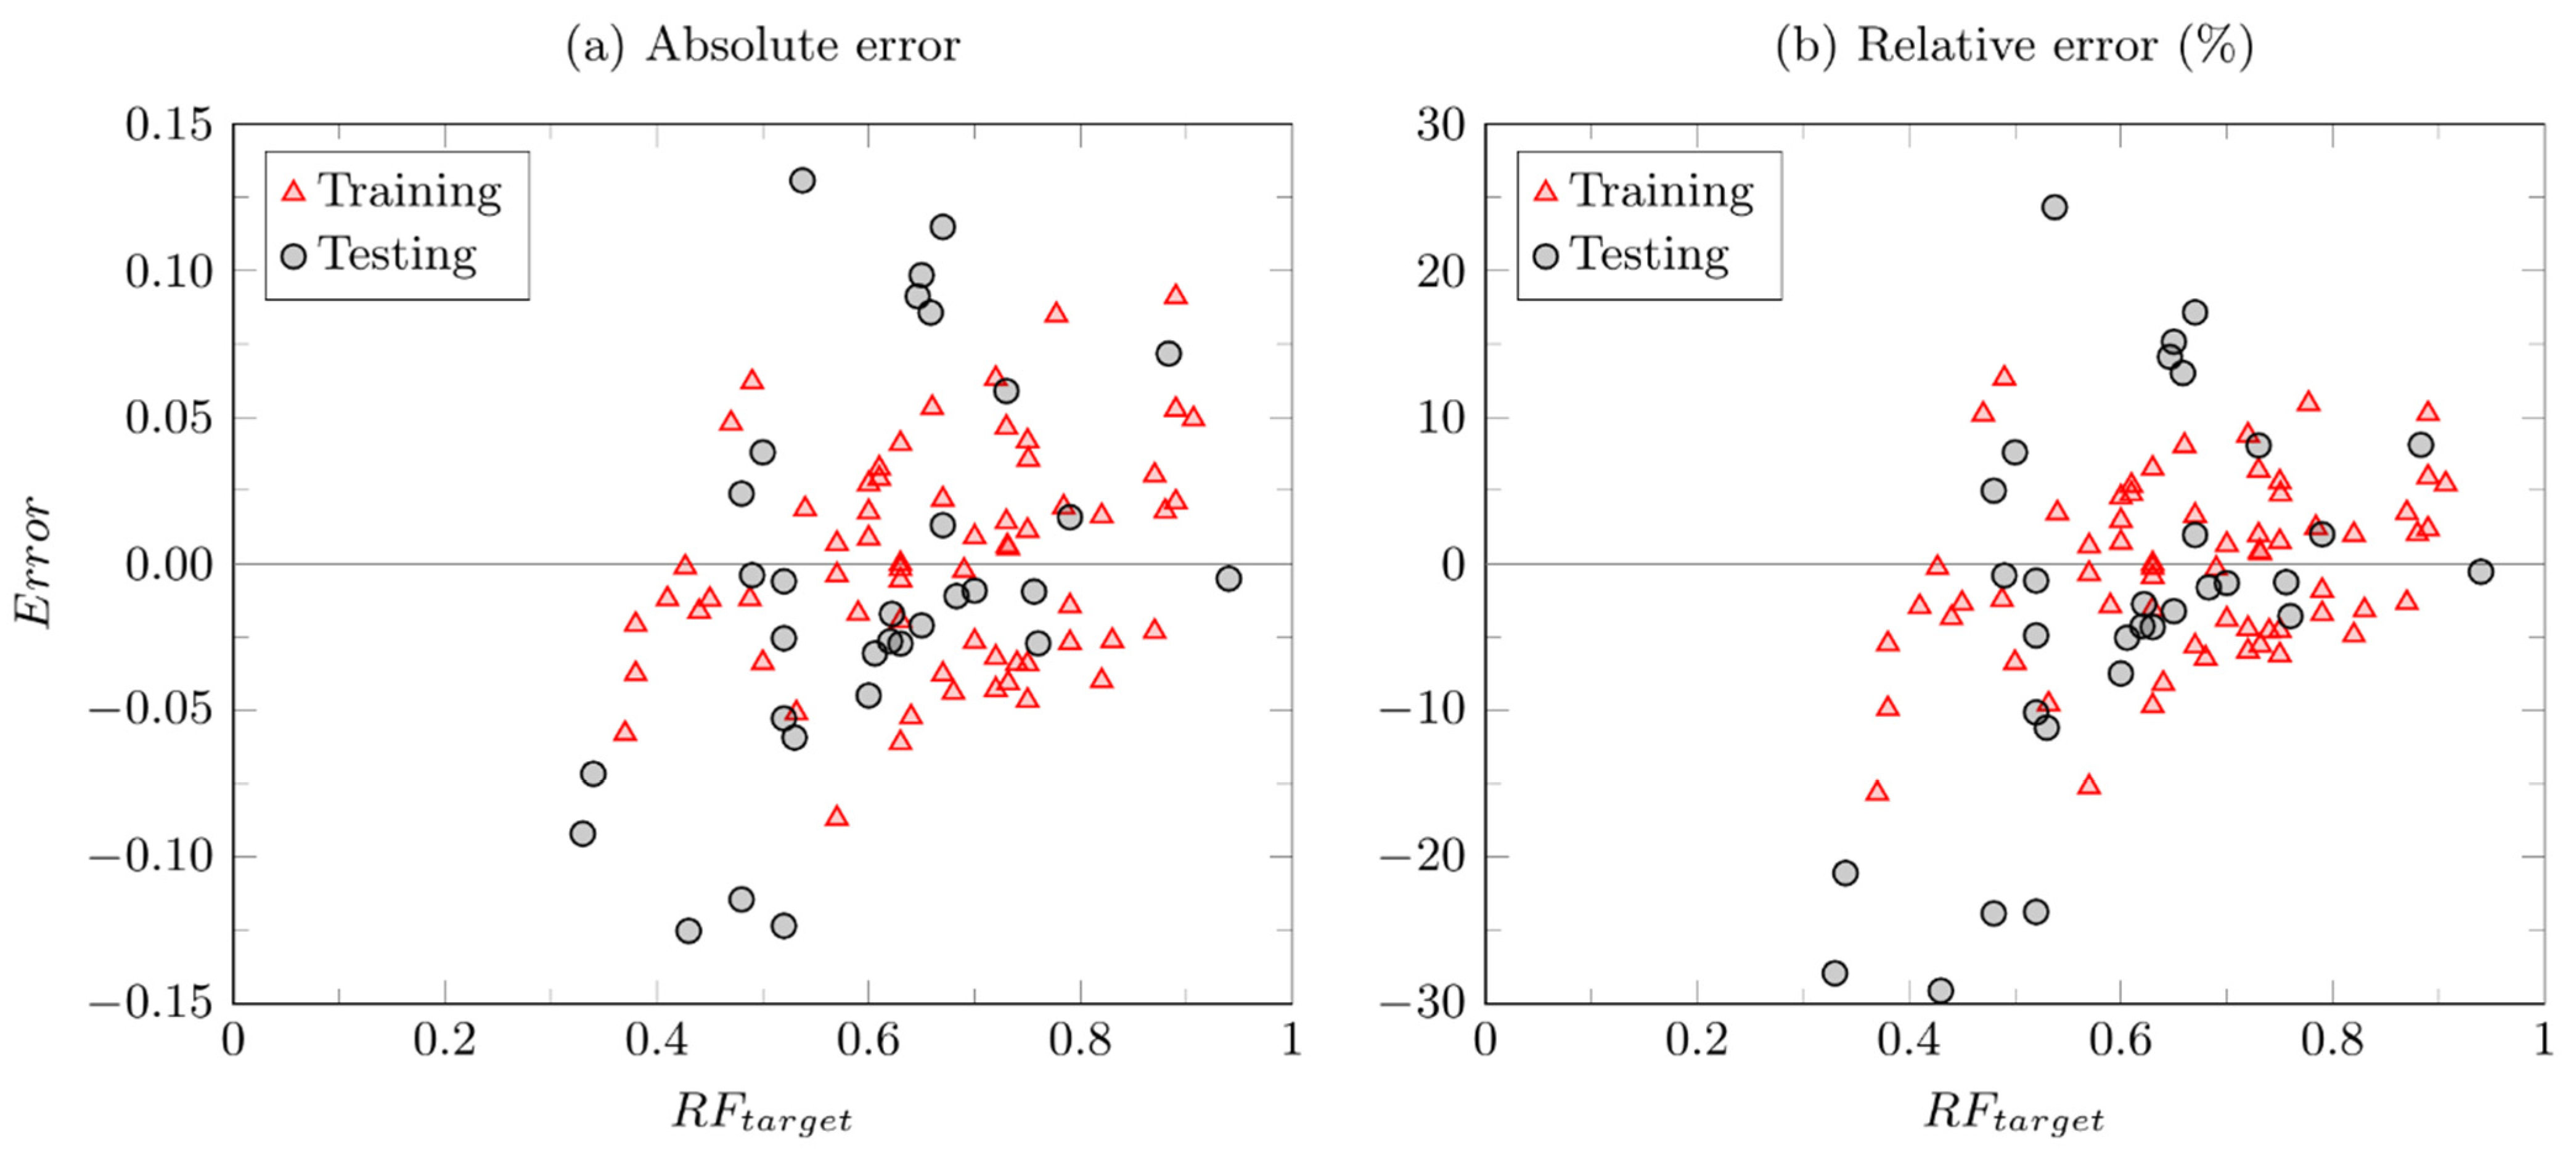
Figure 7 shows the residual plot with the residual error, e i (Equation (19)) on the y-axis and the predicted recovery factor values on the x-axis.
e i = R F i , T a r g e t R F i , G E P
According to Figure 7, for both testing and training phases, the absolute residual error values are less than 0.1. It is concluded that the obtained data are unbiased within an average of approximately zero around the zero residual line; it also indicates a homoscedastic behavior (constant variance).

4.3. Evaluation of Developed Correlation

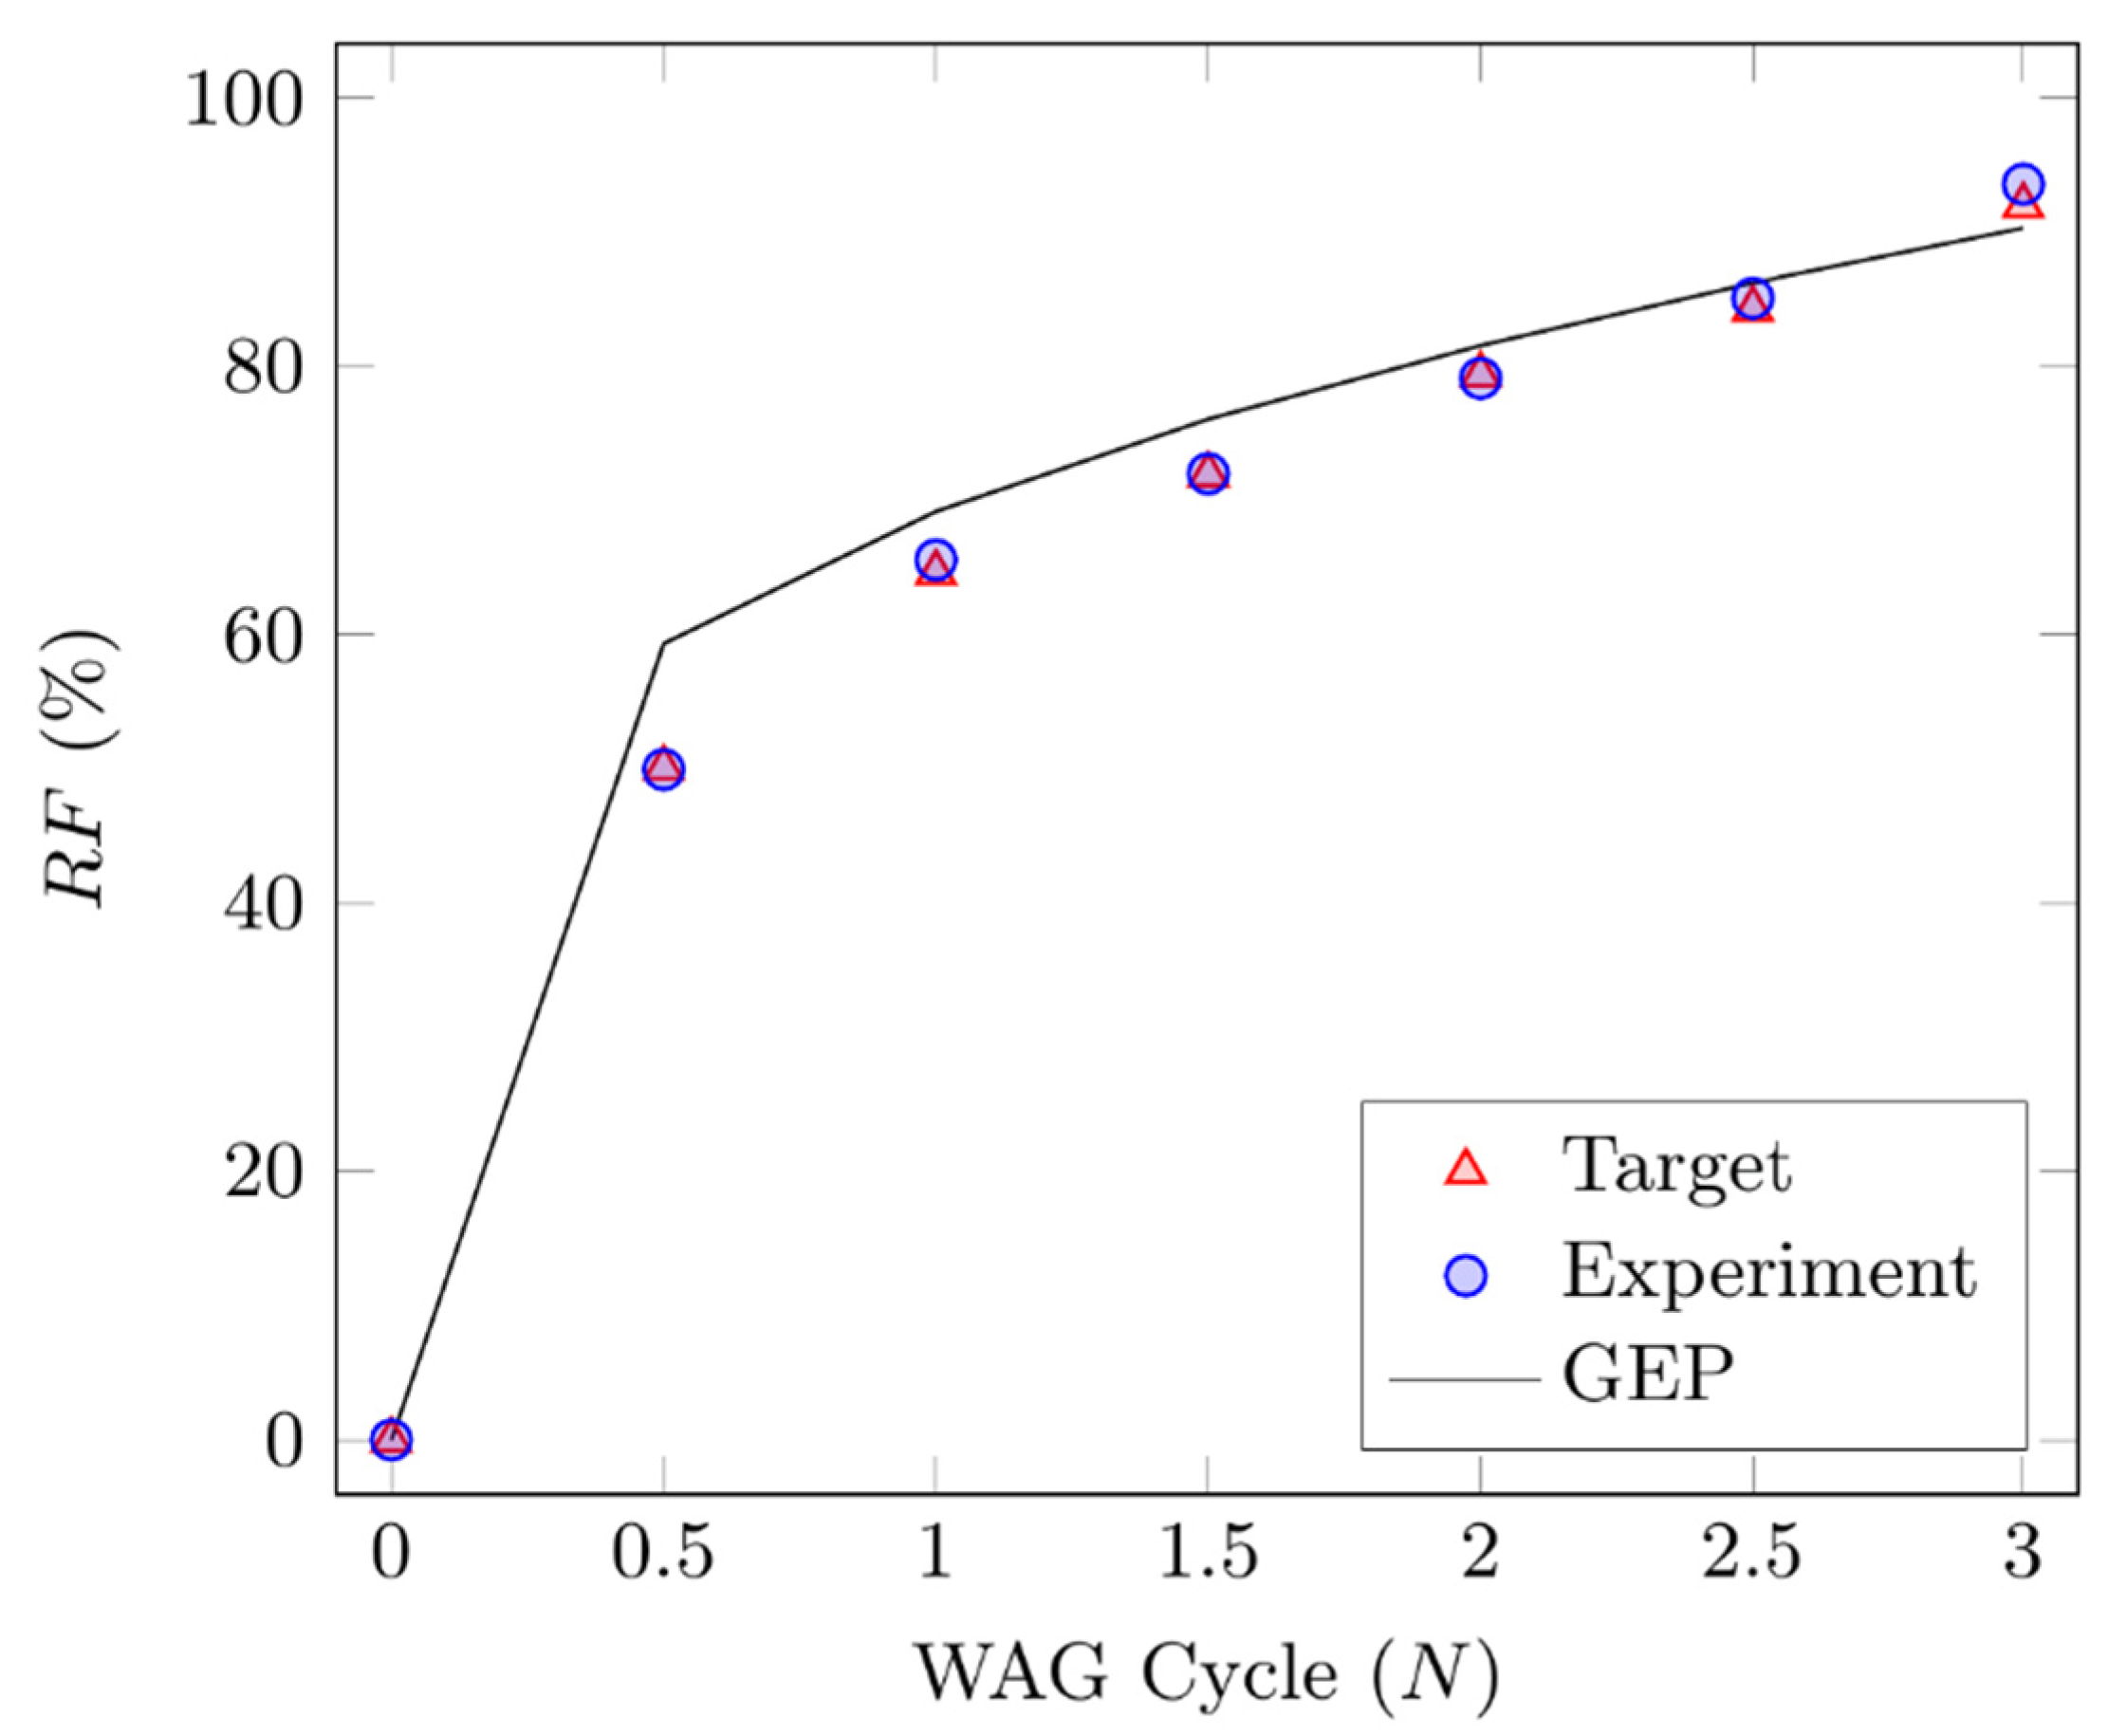
To assess the performance of the newly developed correlation (Equations (14)–(18)), the predicted recovery factors of a three-cycle WAG injection process are compared with the experimental data and the results obtained by the mathematical model. In the selected experiments, the WAG flooding process was conducted at the near-miscible condition (T = 38 °C, and p = 12.7 MPa), and in a strongly water-wet sandstone starting with a primary waterflooding (two-phase flow where sgi = 0). The process was then followed with the first gas injection in which the first cycle of the WAG injection was complete (N = 1). The consecutive flooding of water and gas continued for three cycles (N = 3). The process was terminated after the third gas injection where no significant amount of oil was recovered from the porous system. In the experiments, the process was conducted at a WAG ratio of 1:1 with a constant gas injection rate (e.g., qinj = 25 cm3/h). The RF against the number of injected cycles (N), based on the experimental data, predicted values by the new correlation, and the estimated values by the mathematical model, is presented in Table 9 and Figure 8.
After the primary water flooding (N = 0.5), the recovery factor of RF = 50.00% was obtained in the experimental run. The mathematical model can compute a magnitude of RF = 50.08%, confirming the accuracy and reliability of the numerical model. The newly developed correlation forecasts a RF = 59.35% at the end of the primary waterflooding. Following the production operation by conducting the first gas injection (N = 1), the experiment resulted in the RF= 65.59%; this was predicted by the mathematical model with a value of RF = 64.64%, implying excellent agreement. The proposed correlation predicts the RF = 69.20% for this stage. After that, two more cycles were injected into the porous medium and the final RF = 93.58%, 92.00%, and 90.32% were obtained through the experimental phase, numerical model, and newly developed correlation, respectively. The details of the RF at each injection mode are given in Table 9. The relative errors in estimating the RF at different cycles (N = 1 to 3) are also listed in Table 9. According to Table 9 and Figure 8, it is found that the correlation developed by the GEP algorithm is able to successfully predict the RF of the intermediate cycles, and more importantly, the ultimate RF with a relative error of 3.48% at N = 3.

4.4. Effect of Capillary Number

The efficiency of oil recovery techniques depends on the interplay between various forces at the pore scale and the macroscopic scale [98]. The capillary and viscous forces are not in favor of each other when implementing an EOR/IOR process. The capillary forces are the cause of fluid entrapment during immiscible/near-miscible processes. However, viscous forces of the injecting phase act in opposite to the capillary forces. The capillary forces are affected by the interfacial tension (IFT) between phases, wettability state of the system, and the pore geometry in which the blob entrapment of phases occurs. On the contrary, viscous forces are controlled by the rock permeability, applied pressure drop, and the viscosity of the injected fluid (the displacing phase) [99]. In the oil and gas industry, capillary desaturation curves are well recognized for highlighting the properties and geometry of the porous systems as well as the fluids distribution within the pores [100]. Increasing the capillary number has always been set as a target for designing EOR/IOR processes in order to achieve a higher oil recovery from reservoirs. Capillary number (Nca) is defined as the ratio of viscous forces to capillary forces [101]. There are numerous expressions for the capillary number (Nca). Among the proposed versions, the capillary number introduced by Saffman and Taylor [102] is the most common form, as given below:
N c a = v μ σ
where the v is the superficial velocity; μ stands for the viscosity of the displacing phase; and σ refers to the interfacial tension between fluids.
In this work, after applying Buckingham’s π theorem, variations (inverse) of the capillary number between the oil–water ( N c a o w ) and oil–gas ( N c a o g ) systems are generated as follows:
π 1 = σ o w   K μ w   q w = 1 N c a o w
π 2 = σ o g   K μ g   q g = 1 N c a o g
where σ o g and σ o w denote the interfacial tension between the oil–gas and oil–water phases, respectively; μ i refers to the viscosity of phase i; qw and qg represent the water and gas injection rates; and K is the permeability of the medium. Since π 1 and π 2 show approximately the same relative importance within the developed correlation for predicting the RF of the WAG flooding process, a sensitivity analysis on the impact of π 1 on the RF of a WAG injection is conducted. To investigate the impact of capillary number (the inverse of π 1 ) on oil RF, the results of WAG RF for three cycles (N = 1, 2, 3) at three orders of magnitude of π 1 are compared in Figure 9. According to the results presented in Figure 9, by increasing the π 1 from the initial value of 8.16 × 10⁻⁵ (corresponding to the value at the experimental condition) to 8.16 × 10⁻², and 8.16 × 10⁻¹, the ultimate RF of WAG injection decreases from 90.32% to 85.79%, and 75.03%, respectively. This implies that the RF of a WAG injection process decreases by 16.92% upon a decrease in the capillary number by four orders of magnitude. The same trend of RF reduction at higher values of π 1 is noticed at the end of the first and middle injection cycles. Increasing π 1 by four orders of magnitude (corresponding to decreasing the capillary number by four orders of magnitude) lowers the ultimate RFs of the first (N = 1), and the second (N = 2) cycles by 22% and 23.1%, respectively. This result highlights the dominancy of viscous forces at high capillary numbers, resulting in more oil trapping in the porous medium and a decrease in oil RF during various cycles of a WAG flooding process.

4.5. Effect of Viscosity Ratio ( π 3 , π 4 )

The viscosity of fluids in a three-phase flow of oil, water, and gas affects the mobility ratio (M) of the displaced (oil) and displacing phases, residual oil saturation, and finally the recovery factor of a WAG flooding process. The mobility ratio is defined as follows:
M = k r , i n g μ i n g k r , e d μ e d
In Equation (23) k r i n g and k r e d represent the relative permeability of the displacing (water or gas) and displaced (oil) phases, respectively. μ i n g and μ e d denote the viscosities of the displacing and displaced phases.
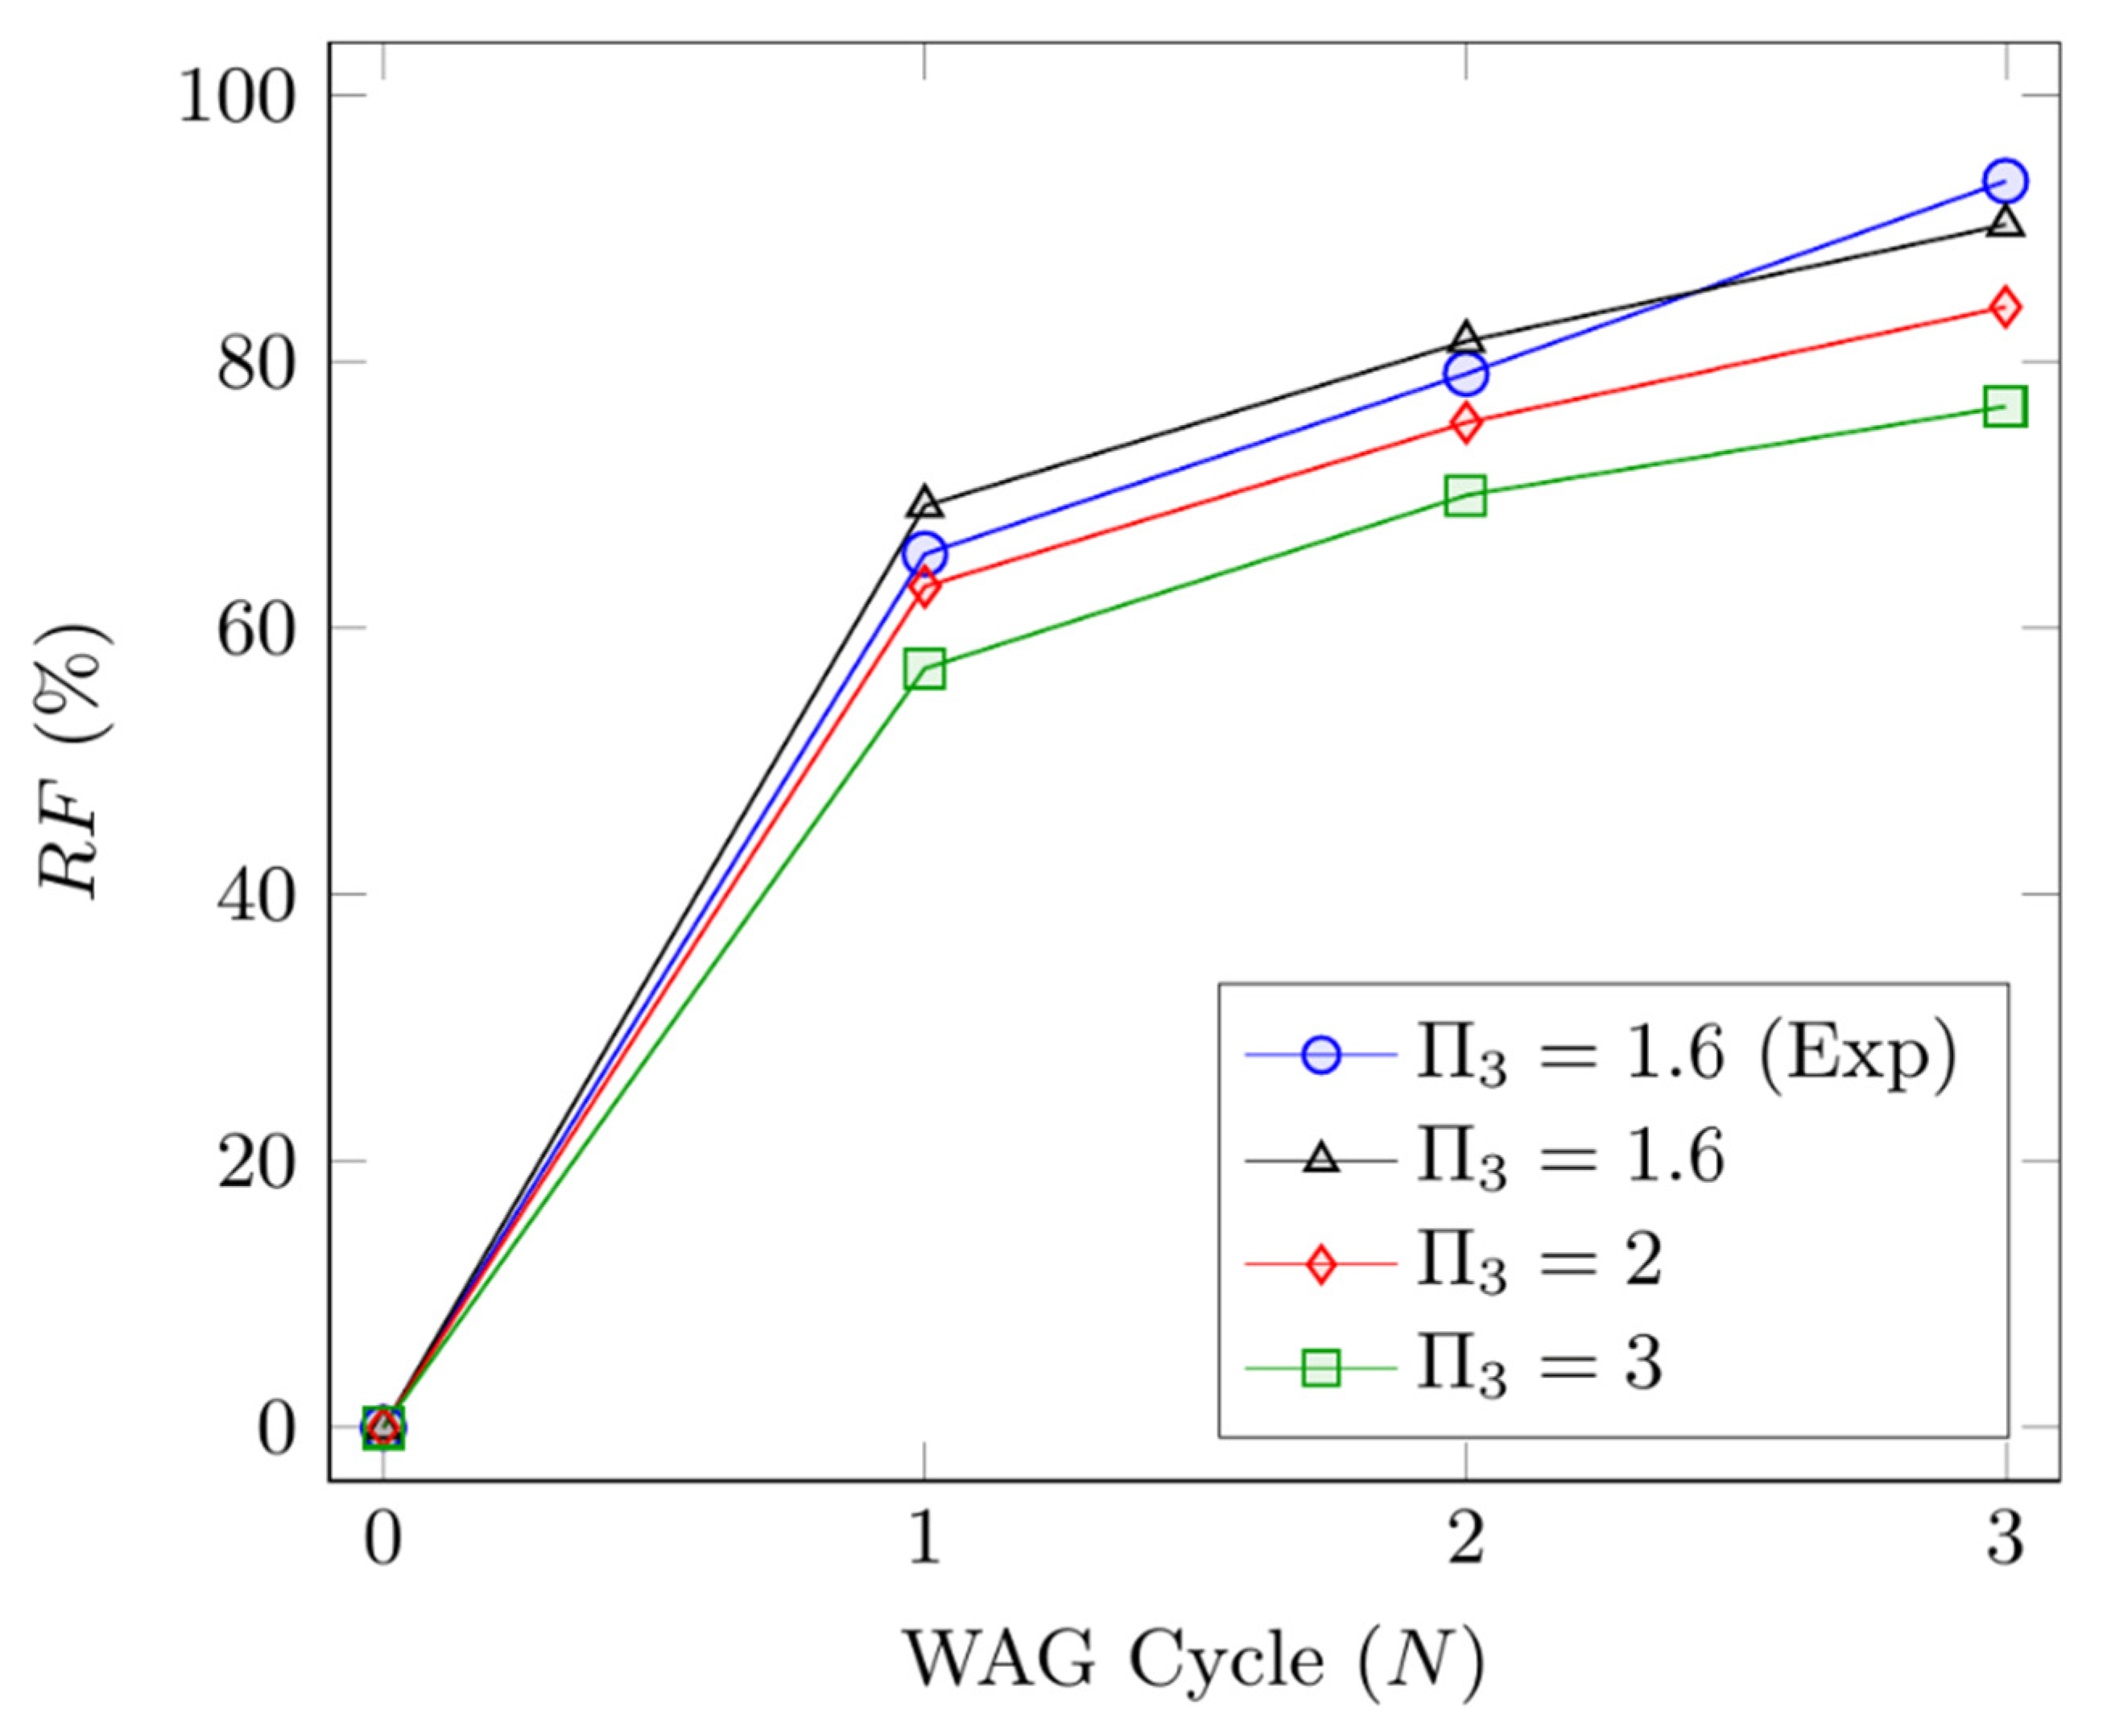
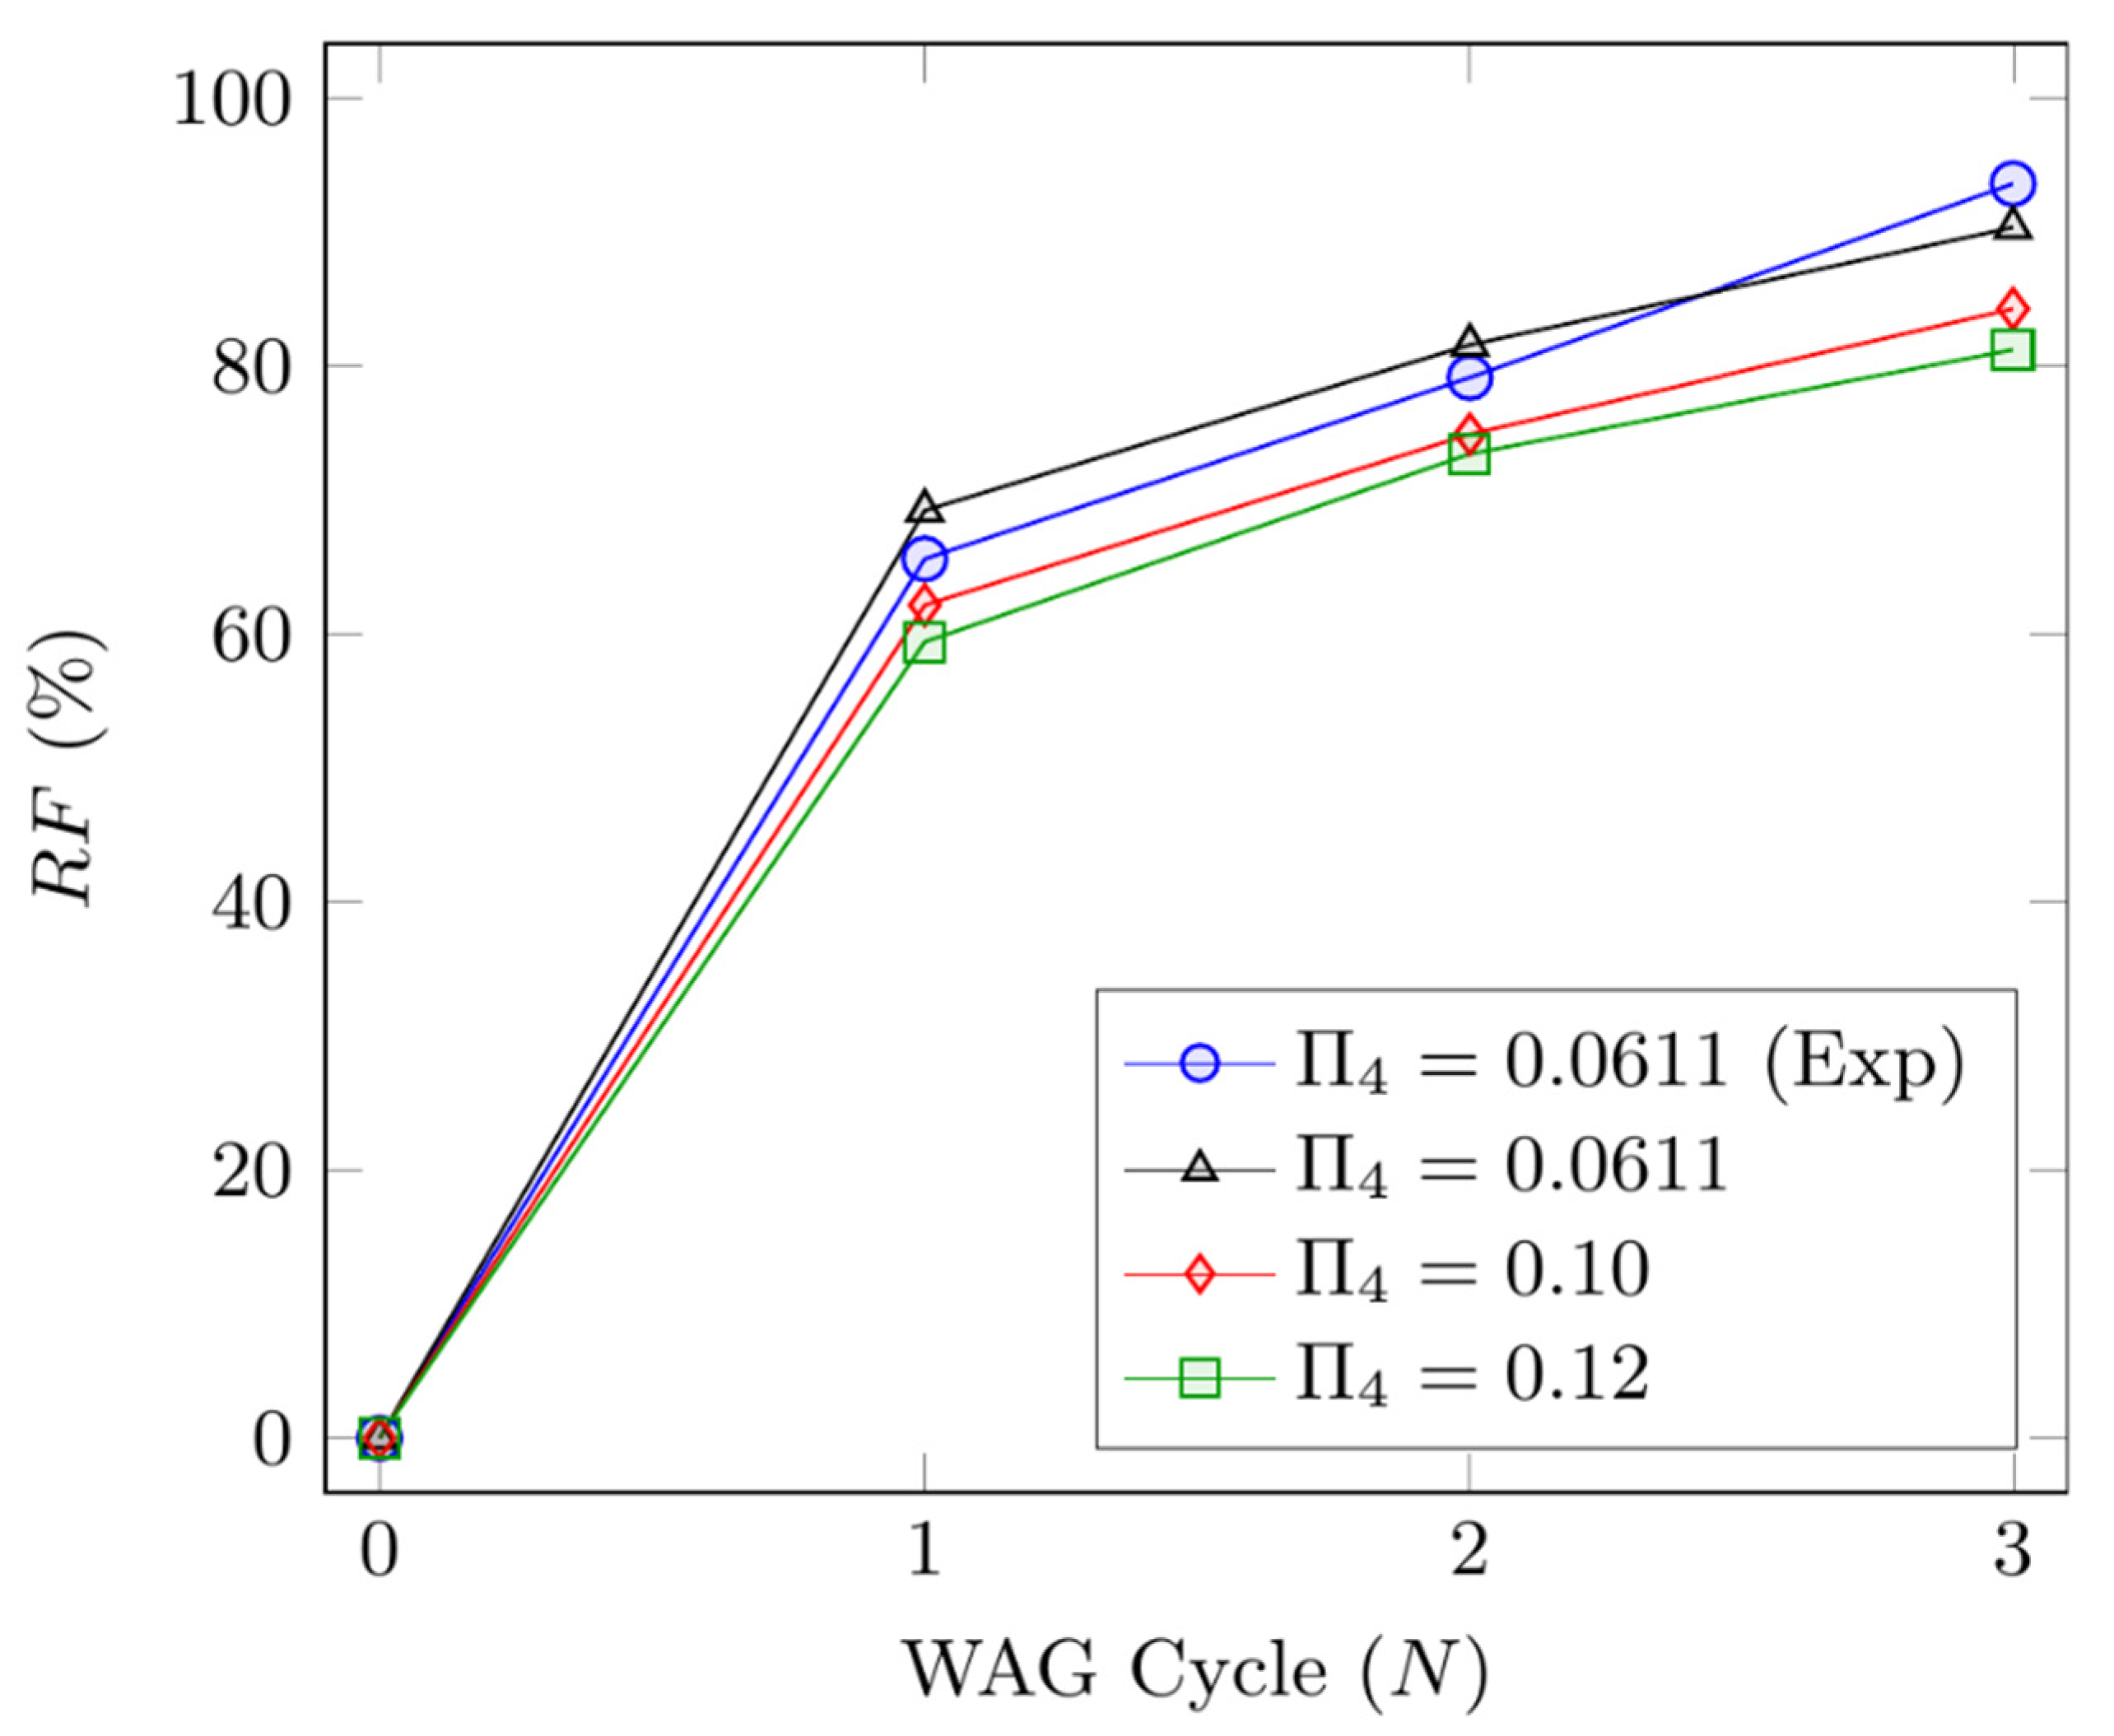
In this research, two of the introduced dimensionless groups describe the ratio of oil to gas, and oil to water viscosities ( π 3 = μ o μ g ,   π 4 = μ o μ w ), which considerably affect the RF of the WAG flooding. To evaluate the impact of the viscosity ratio, WAG simulations are conducted at different values of π 3 and π 4 (Figure 10 and Figure 11). All cases are simulated using the developed correlation in all three cycles (N = 1, 2, 3), where the rest of the dimensionless groups are fixed at the base condition corresponding to the experimental data. We evaluate the performance of the WAG flooding process at three values of π 3 : 1.59 (the base value), 2, and 3. The simulation outputs are shown in Figure 10. The RF results reveal that in all cycles, by increasing the π 3 value, the RF decreases. When π 3 increases from 1.59 (RF ultimate = 90.32%) to 2 (RF ultimate = 84.14%), and 3 (RF ultimate = 76.66%), the ultimate recovery factors of WAG injection after three cycles of injection decrease by 6.84% and 15.12%, for π 3 = 2, and π 3 = 3, respectively. Increasing π 3 also decreases the oil recovery at the first and second injection cycles, significantly. The RF results at each cycle are provided in Table 10. The results are consistent with the previous studies in which the greater viscosity gap between the oil and gas leads to unfavorable high mobility ratio, bypassing the oil bank (gas channeling), and early gas breakthrough [20].
The sensitivity analysis is also performed, considering different values of π 4 = μ o μ w . The simulations are conducted using the experimental conditions and at three cycles of consecutive injections of water and gas for three values of π 4 : 0.061 (reference value corresponding to the experimental condition), 0.10, and 0.12. The outputs of the simulations for three cycles of WAG injection are demonstrated in Figure 11 and Table 10. According to the simulation outputs of the WAG process using the GEP correlation (Equations (14)–(18)), increasing the values of π 4 from 0.061 to 0.10, and 0.12, lowers the ultimate RF by 6.72% and 10.11%, respectively. This appears to be logical as the π 4 (the ratio of oil to water viscosity) increases the mobility ratio of the oil (as the displaced phase) and water (as the displacing phase) which is unfavorable, resulting in front instability of fluids and considerable residual oil saturation. Comparing Figure 10 and Figure 11 also highlights the superior impact of π 3 on RF of WAG injection over the impact of π 4 ; this is also confirmed while assessing the relative importance of the variables (dimensionless groups). This is due to a higher viscosity difference between oil and gas compared to the difference of oil–water viscosities, leading to higher potential of oil trapping and early breakthrough, and thereby the RF is affected more (greater reduction) at higher values of π 3 , compared to π 4 .

5. Summary and Conclusions

In this study, we develop a new correlation for predicting the recovery factor (RF) of a near-miscible water alternating gas (WAG) injection process. The model is developed using dimensionless groups made of the key fluid, rock, and process characteristics that impact the RF of a near-miscible WAG flooding process. Seven dimensionless groups are generated using the dimensional analysis approach through employing Buckingham’s π theorem. The dimensionless numbers are used as the input variables for the newly introduced evolutionary algorithm gene expression programming (GEP) model to develop a reliable predictive tool for the RF of WAG processes. The accuracy of the proposed correlation is verified using modeling results and data from a laboratory case study taken from the literature in which near-miscible WAG flooding was conducted on a strongly water-wet sandstone core sample at 38 °C and 12.7 MPa. Based on the error analysis, the newly proposed GEP model shows a very good match with the target data. For example, R2 = 92.85% and MSE = 1.38 × 10⁻³ are attained for the training phase. The results of the relative importance (RI) of the input variables indicate that the number of injected cycles (N, π 7 ) has the highest impact on the developed correlation with an RI of 37.14%. After π 7 , π 3 and π 4 are reported as the most essential parameters with RI values of 36.61%, 18.84%, and 2.30%, respectively.
The predicted recovery factors of a three-cycle WAG injection process are compared with the experimental data; the results obtained by the mathematical model show that the correlation developed by the GEP algorithm is able to successfully predict the RF of the intermediate cycles, and more importantly, the ultimate RF with a relative error of 3.48% at N = 3.
According to the sensitivity analysis, increasing oil–water capillary number leads to an increase in RF for all cycles. In addition, an increase in the magnitudes of oil to gas viscosity ratio or oil to water viscosity ratio causes a reduction in RF of each cycle in the WAG flooding process. It is found that the viscosity ratio of oil and gas has a greater influence on the RF value, compared to viscosity ratio of oil and water because of a greater viscosity difference between the oil and gas phases.
For future work, due to the lack of predictive tools for WAG injection processes, it is recommended to conduct similar procedures to develop empirical correlations for WAG injection in other porous systems such as fractured and/or heterogeneous porous media. The presented results in this work are based on experimental data of a near-miscible WAG injection in a strongly water-wet sandstone core. This research can be extended for other miscibility conditions such as miscible/immiscible, at other wettability states and rock lithologies.

Author Contributions

Conceptualization, S.A., S.Z. and M.M.-B.; methodology, S.A. and M.M.-B.; software, S.A.; validation, S.A., S.Z. and M.M.-B.; formal analysis, S.A., M.M.-B. and S.Z.; investigation, S.A.; resources, S.A. and S.Z.; data curation, S.A.; writing—original draft preparation, S.A.; writing—review and editing, S.A., S.Z. and M.M.-B.; visualization, S.A.; supervision, S.Z.; project administration, S.Z.; funding acquisition, S.Z. All authors have read and agreed to the published version of the manuscript.

Funding

This research received no external funding.

Institutional Review Board Statement

Not applicable.

Informed Consent Statement

Not applicable.

Data Availability Statement

Not applicable.

Acknowledgments

We highly appreciate the support of Equinor Canada, InnovateNL, Natural Sciences and Engineering Research Council of Canada (NSERC), and Memorial University (Canada) over this research study.

Conflicts of Interest

The authors declare no conflict of interest.

Nomenclatures

Acronyms
ANOVAAnalysis of variance
CCDCentral composite design
DCIDimensionless CO2 injection
DCPDimensionless CO2 production
DEORDimensionless tertiary oil recovery
DOEDesign of experiment
DTIDimensionless total injection
EOREnhanced oil recovery
ETExpression tree
GAGenetic algorithm
GEPGene expression programming
GIGas injection
GPGenetic programming
IFTInterfacial tension
IORImproved oil recovery
IMPESImplicit-pressure-explicit-saturation
MMobility ratio
MMPMinimum miscible pressure
MSEMean square error
NNumber of injected cycles
OFObjective function
PSOParticle swarm optimization
PVIPore volume injection
RAERelative absolute error
RFRecovery factor
RIRelative importance
RMSERoot-mean-square error
RSEResidual standard error
WFWaterflooding
WAGWater-alternating-gas
Variables and Parameters
aCapillary exponent
CijCorrelation constant values
CiCapillary constant [Pa]
FThe main effect of factors in ANOVA
KAbsolute permeability [md]
kriRelative permeability of phase i
pPressure [Pa]
p valueThe interaction effect of factors in ANOVA
qFlowrate [m3/h]
R2Coefficient of determination
siSaturation of phase i
tTime [h]
vvelocity [m/h]
xLength [m]
Greek Letters
µViscosity [cP]
ρDensity [kg/m3]
σInterfacial tension [N/m]
ϕPorosity
θContact angle
π i Dimensionless number
Subscripts and Superscripts
aveAverage
caCapillary
DDrainage
edDisplaced phase (oil)
expExperiment
gGas phase
ingDisplacing phase
IImbibition
nwNonwetting phase
oOil phase
ogOil–gas system
owOil–water system
rResidual phase
wWetting phase

Appendix A

The general form of the employed capillary pressure model is presented by Equation (A1), as given below:
p c ,   i j = σ i j   c o s ( θ i j ) φ K ( c o s n w s n w r 1 s n w r a o + c w s w s w r 1 s w r a w )
The description of the parameters seen in Equation (A1) is given in Table A1.
Table A1. Description of parameters used in Equation (A1) [88].
ParameterDescription
p c , i j Capillary pressure (in a three-phase system)
σ i j Interfacial tension
θ i j Contact angle
c i , c j Capillary entry pressure
sSaturation
a Capillary exponent
nw, wNonwetting and wetting phases, respectively.
i, jExisting phases (oil, water, or gas)
Equations (A2)–(A6) introduce the mathematical formulas of the statistical measures used in this study.
M S E = 1 n i = 1 n ( R F i e x p R F i p r d ) 2
R M S E = 1 n i = 1 n ( R F i e x p R F i p r d ) 2
M A E = 1 n i = 1 n ( R F i e x p R F i p r d )
R S E = 1 n 2 i = 1 n ( R F i e x p R F i p r d ) 2
R A E = i = 1 n R F i e x p R F i p r d i = 1 n R F i e x p a v e R F exp

References

  1. Afzali, S.; Rezaei, N.; Zendehboudi, S. A comprehensive review on enhanced oil recovery by water alternating gas (WAG) injection. Fuel 2018, 227, 218–246. [Google Scholar] [CrossRef]
  2. Christensen, J.R.; Stenby, E.H.; Skauge, A. Review of WAG field experience. In Proceedings of the International Petroleum Conference and Exhibition of Mexico, Villahermosa, Mexico, 3 March 1998. [Google Scholar]
  3. Skauge, A.; Stensen, J.Å. Review of WAG field experience. In Proceedings of the Oil Recovery–2003, 1st International Conference and Exhibition, Modern Challenges in Oil Recovery, Moscow, Russia, 19–23 May 2003; pp. 19–23. [Google Scholar]
  4. Al-Mamari, F.; Al-Shuraiqi, H.; Al-Wahaibi, Y.M. Numerical simulation and experimental studies of oil recovery via first-contact miscible water alternating gas injection within shaley porous media. In Proceedings of the SPE/EAGE Reservoir Characterization and Simulation Conference, Abu Dhabi, United Arab Emirates, 28–31 October 2007. [Google Scholar]
  5. Bequette, B.W. Nonlinear control of chemical processes: A review. Ind. Eng. Chem. Res. 1991, 30, 1391–1413. [Google Scholar] [CrossRef]
  6. Agada, S.; Geiger, S. Wettability, trapping and fracture-matrix interaction during WAG injection in fractured carbonate reservoirs. In Proceedings of the SPE Improved Oil Recovery Symposium, Tulsa, OK, USA, 12–16 April 2014. [Google Scholar]
  7. Larsen, J.A.; Skauge, A. Simulation of the immiscible WAG process using cycle-dependent three-phase relative permeabilities. In Proceedings of the SPE Annual Technical Conference and Exhibition, Houston, TX, USA, 3–6 October 1999. [Google Scholar]
  8. Duchenne, S.; de Loubens, R.; Petitfrere, M.; Joubert, T. Modeling and simultaneous history-matching of multiple WAG coreflood experiments at reservoir conditions. In Proceedings of the Abu Dhabi International Petroleum Exhibition and Conference, Abu Dhabi, United Arab Emirates, 9–12 November 2015. [Google Scholar]
  9. Dale, E.I.; Skauge, A. Fluid Flow Properties of WAG Injection Processes. In Proceedings of the 13th European Symposium on Improved Oil Recovery, Budapest, Hungary, 25–27 April 2008. [Google Scholar]
  10. Juanes, R.; Patzek, T.W. Analytical solution to the Riemann problem of three-phase flow in porous media. Transp. Porous Media 2004, 55, 47–70. [Google Scholar] [CrossRef] [Green Version]
  11. Stone, H. Probability model for estimating three-phase relative permeability. J. Pet. Technol. 1970, 22, 214–218. [Google Scholar] [CrossRef]
  12. Kulkarni, M.M.; Rao, D.N. Experimental investigation of miscible and immiscible Water-Alternating-Gas (WAG) process performance. J. Pet. Sci. Eng. 2005, 48, 1–20. [Google Scholar] [CrossRef]
  13. Larsen, J.; Skauge, A. Methodology for numerical simulation with cycle-dependent relative permeabilities. SPE J. 1998, 3, 163–173. [Google Scholar] [CrossRef] [Green Version]
  14. Delshad, M.; Pope, G.A. Comparison of the three-phase oil relative permeability models. Transp. Porous Media 1989, 4, 59–83. [Google Scholar] [CrossRef]
  15. Fenwick, D.H.; Blunt, M.J. Network modeling of three-phase flow in porous media. SPE J. 1998, 3, 86–96. [Google Scholar] [CrossRef]
  16. Shahverdi, H.; Sohrabi, M. Relative Permeability Characterization for Water-Alternating-Gas Injection in Oil Reservoirs. SPE J. 2016, 21, 0799–0808. [Google Scholar] [CrossRef]
  17. Spiteri, E.J.; Juanes, R. Impact of relative permeability hysteresis on the numerical simulation of WAG injection. J. Pet. Sci. Eng. 2006, 50, 115–139. [Google Scholar] [CrossRef]
  18. Giordano, R.; Redman, R.; Bratvedt, F. A new approach to forecasting miscible WAG performance at the field scale. SPE Reserv. Eval. Eng. 1998, 1, 192–200. [Google Scholar] [CrossRef]
  19. Kohata, A.; Willingham, T.; Yunus Khan, M.; Al Sowaidi, A. Extensive miscible water alternating gas WAG simulation study for a giant offshore oil field. In Proceedings of the Abu Dhabi International Petroleum Exhibition & Conference, Abu Dhabi, United Arab Emirates, 13–16 November 2017. [Google Scholar]
  20. Afzali, S.; Ghamartale, A.; Rezaei, N.; Zendehboudi, S. Mathematical modeling and simulation of water-alternating-gas (WAG) process by incorporating capillary pressure and hysteresis effects. Fuel 2020, 263, 116362. [Google Scholar] [CrossRef]
  21. Belazreg, L.; Raub, M.R.A.; Hanifah, M.A.B.; Ghadami, N. WAG cycle dependent hysteresis modelling through an integrated approach from laboratory to field scale, Malaysia oil fields. In Proceedings of the SPE/IATMI Asia Pacific Oil & Gas Conference and Exhibition, Jakarta, Indonesia, 17–19 October 2017. [Google Scholar]
  22. Sanchez, N.L. Management of water alternating gas (WAG) injection projects. In Proceedings of the Latin American and Caribbean Petroleum Engineering Conference, Caracas, Venezuela, 21–23 April 1999. [Google Scholar]
  23. Belazreg, L.; Mahmood, S.M. Water alternating gas incremental recovery factor prediction and WAG pilot lessons learned. J. Pet. Explor. Prod. Technol. 2020, 10, 249–269. [Google Scholar] [CrossRef] [Green Version]
  24. Jaber, A.K.; Awang, M.B.; Lenn, C.P. Box-Behnken design for assessment proxy model of miscible CO2-WAG in heterogeneous clastic reservoir. J. Nat. Gas Sci. Eng. 2017, 40, 236–248. [Google Scholar] [CrossRef]
  25. Jaber, A.K.; Alhuraishawy, A.K.; AL-Bazzaz, W.H. A Data-Driven Model for Rapid Evaluation of Miscible CO-WAG Flooding in Heterogeneous Clastic Reservoirs. In Proceedings of the SPE Kuwait Oil & Gas Show and Conference, Mishref, Kuwait, 13–16 October 2019. [Google Scholar]
  26. Gharbi, R.B. Neural Network Prediction Model of Miscible Displacements in Heterogeneous Reservoirs. In Proceedings of the Middle East Oil Show, Manama, Bahrain, 9–12 June 2003. [Google Scholar]
  27. Ghiasi, M.M.; Shahdi, A.; Barati, P.; Arabloo, M. Robust modeling approach for estimation of compressibility factor in retrograde gas condensate systems. Ind. Eng. Chem. Res. 2014, 53, 12872–12887. [Google Scholar] [CrossRef]
  28. Le Van, S.; Chon, B.H. Evaluating the critical performances of a CO2–Enhanced oil recovery process using artificial neural network models. J. Pet. Sci. Eng. 2017, 157, 207–222. [Google Scholar] [CrossRef]
  29. Thanh, H.V.; Sugai, Y.; Sasaki, K. Application of artificial neural network for predicting the performance of CO2 enhanced oil recovery and storage in residual oil zones. Sci. Rep. 2020, 10, 18204. [Google Scholar] [CrossRef]
  30. Zendehboudi, S.; Shafiei, A.; Bahadori, A.; James, L.A.; Elkamel, A.; Lohi, A. Asphaltene precipitation and deposition in oil reservoirs–Technical aspects, experimental and hybrid neural network predictive tools. Chem. Eng. Res. Des. 2014, 92, 857–875. [Google Scholar] [CrossRef]
  31. Ghiasi, M.M.; Zendehboudi, S.; Mohsenipour, A.A. Decision tree-based diagnosis of coronary artery disease: CART model. Comput. Methods Programs Biomed. 2020, 192, 105400. [Google Scholar] [CrossRef]
  32. Eshraghi, S.E.; Rasaei, M.R.; Zendehboudi, S. Optimization of miscible CO2 EOR and storage using heuristic methods combined with capacitance/resistance and Gentil fractional flow models. J. Nat. Gas Sci. Eng. 2016, 32, 304–318. [Google Scholar] [CrossRef]
  33. Kamari, A.; Bahadori, A.; Mohammadi, A.H.; Zendehboudi, S. Evaluating the unloading gradient pressure in continuous gas-lift systems during petroleum production operations. Pet. Sci. Technol. 2014, 32, 2961–2968. [Google Scholar] [CrossRef]
  34. Kamari, A.; Mohammadi, A.H.; Bahadori, A.; Zendehboudi, S. Prediction of air specific heat ratios at elevated pressures using a novel modeling approach. Chem. Eng. Technol. 2014, 37, 2047–2055. [Google Scholar] [CrossRef]
  35. Dashti, A.; Raji, M.; Razmi, A.; Rezaei, N.; Zendehboudi, S.; Asghari, M. Efficient hybrid modeling of CO2 absorption in aqueous solution of piperazine: Applications to energy and environment. Chem. Eng. Res. Des. 2019, 144, 405–417. [Google Scholar] [CrossRef]
  36. Zendehboudi, S.; Zahedi, G.; Bahadori, A.; Lohi, A.; Elkamel, A.; Chatzis, I. A dual approach for modelling and optimisation of industrial urea reactor: Smart technique and grey box model. Can. J. Chem. Eng. 2014, 92, 469–485. [Google Scholar] [CrossRef]
  37. Rajabzadeh, A.R.; Ruzich, N.; Zendehboudi, S.; Rahbari, M. Biomass leachate treatment and nutrient recovery using reverse osmosis: Experimental study and hybrid artificial neural network modeling. Energy Fuels 2012, 26, 7155–7163. [Google Scholar] [CrossRef]
  38. Zendehboudi, S.; Bahadori, A.; Lohi, A.; Elkamel, A.; Chatzis, I. Practical and economic aspects of the ex-situ process: Implications for CO2 sequestration. Energy Fuels 2013, 27, 401–413. [Google Scholar] [CrossRef]
  39. Hamedi, H.; Ehteshami, M.; Mirbagheri, S.A.; Zendehboudi, S. New deterministic tools to systematically investigate fouling occurrence in membrane bioreactors. Chem. Eng. Res. Des. 2019, 144, 334–353. [Google Scholar] [CrossRef]
  40. Sun, Q.; Ampomah, W.; You, J.; Cather, M.; Balch, R. Practical CO2—WAG Field Operational Designs Using Hybrid Numerical-Machine-Learning Approaches. Energies 2021, 14, 1055. [Google Scholar] [CrossRef]
  41. Thanh, H.V.; Sugai, Y.; Nguele, R.; Sasaki, K. Robust optimization of CO2 sequestration through a water alternating gas process under geological uncertainties in Cuu Long Basin, Vietnam. J. Nat. Gas Sci. Eng. 2020, 76, 103208. [Google Scholar] [CrossRef]
  42. Holland, J.H. Adaptation in Natural and Artificial Systems: An Introductory Analysis with Applications to Biology, Control, and Artificial Intelligence; MIT Press: Cambridge, MA, USA, 1992. [Google Scholar]
  43. Ferreira, C. Gene expression programming: A new adaptive algorithm for solving problems. arXiv 2001, arXiv:cs/0102027. [Google Scholar]
  44. Koza, J.R.; Koza, J.R. Genetic Programming: On the Programming of Computers by Means of Natural Selection; MIT Press: Cambridge, MA, USA, 1992. [Google Scholar]
  45. Ferreira, C. Gene Expression Programming: Mathematical Modeling by an Artificial Intelligence; Springer: Berlin, Germany, 2006. [Google Scholar]
  46. Gharagheizi, F.; Ilani-Kashkouli, P.; Farahani, N.; Mohammadi, A.H. Gene expression programming strategy for estimation of flash point temperature of non-electrolyte organic compounds. Fluid Phase Equilibria 2012, 329, 71–77. [Google Scholar] [CrossRef]
  47. Rostami, A.; Hemmati-Sarapardeh, A.; Mohammadi, A.H. Estimating n-tetradecane/bitumen mixture viscosity in solvent-assisted oil recovery process using gep and gmdh modeling approaches. Pet. Sci. Technol. 2019, 37, 1640–1647. [Google Scholar] [CrossRef]
  48. Rostami, A.; Arabloo, M.; Kamari, A.; Mohammadi, A.H. Modeling of CO2 solubility in crude oil during carbon dioxide enhanced oil recovery using gene expression programming. Fuel 2017, 210, 768–782. [Google Scholar] [CrossRef]
  49. Kamari, A.; Arabloo, M.; Shokrollahi, A.; Gharagheizi, F.; Mohammadi, A.H. Rapid method to estimate the minimum miscibility pressure (MMP) in live reservoir oil systems during CO2 flooding. Fuel 2015, 153, 310–319. [Google Scholar] [CrossRef]
  50. Umar, A.A.; Saaid, I.M.; Sulaimon, A.A.; Pilus, R.M. Predicting the Viscosity of Petroleum Emulsions Using Gene Expression Programming (GEP) and Response Surface Methodology (RSM). J. Appl. Math. 2020, 2020, 6215352. [Google Scholar] [CrossRef] [Green Version]
  51. Kamari, A.; Sattari, M.; Mohammadi, A.H.; Ramjugernath, D. Reliable method for the determination of surfactant retention in porous media during chemical flooding oil recovery. Fuel 2015, 158, 122–128. [Google Scholar] [CrossRef]
  52. Rostami, A.; Raef, A.; Kamari, A.; Totten, M.W.; Abdelwahhab, M.; Panacharoensawad, E. Rigorous framework determining residual gas saturations during spontaneous and forced imbibition using gene expression programming. J. Nat. Gas Sci. Eng. 2020, 84, 103644. [Google Scholar] [CrossRef]
  53. Mostafa, M.M.; El-Masry, A.A. Oil price forecasting using gene expression programming and artificial neural networks. Econ. Model. 2016, 54, 40–53. [Google Scholar] [CrossRef] [Green Version]
  54. Mashayekhizadeh, V.; Kord, S.; Dejam, M. EOR potential within Iran. Spec. Top. Rev. Porous Media Int. J. 2014, 5, 325–354. [Google Scholar] [CrossRef]
  55. Ahmed, T. Reservoir Engineering Handbook; Elsevier: Austin, TX, USA, 2006. [Google Scholar]
  56. Pudugramam, V.S. A Numerical Study of CO2-EOR With Emphasis on Mobility Control Processes: Water Alternating Gas (WAG) and Foam; The University of Texas at Austin: Austin, TX, USA, 2013. [Google Scholar]
  57. Holm, L. Propane-gas-water miscible floods in watered-out areas of the adena field, Colorado. J. Pet. Technol. 1972, 24, 1264–1270. [Google Scholar] [CrossRef]
  58. Moffitt, P.; Zornes, D. Postmortem analysis: Lick creek meakin sand unit immiscible CO2 waterflood project. In Proceedings of the SPE Annual Technical Conference and Exhibition, Washington, DC, USA, 4–7 October 1992. [Google Scholar]
  59. Esene, C.; Rezaei, N.; Aborig, A.; Zendehboudi, S. Comprehensive review of carbonated water injection for enhanced oil recovery. Fuel 2019, 237, 1086–1107. [Google Scholar] [CrossRef]
  60. Watts, R.J.; Conner, W.D.; Wasson, J.A.; Yost, A.B. CO2 injection for tertiary oil recovery, Granny’s Creek Field, Clay County, West Virginia. In Proceedings of the SPE Enhanced Oil Recovery Symposium, Tulsa, OK, USA, 4–7 April 1982. [Google Scholar]
  61. Gharbi, R.; Peters, E.; Elkamel, A. Scaling miscible fluid displacements in porous media. Energy Fuels 1998, 12, 801–811. [Google Scholar] [CrossRef]
  62. Shahverdi, H. Characterization of Three-Phase Flow and WAG Injection in Oil Reservoirs; Heriot-Watt University: Edinburgh, UK, 2012. [Google Scholar]
  63. Birkhoff, G. Hydrodynamics, a study in logic, fact, and similitude. Bull. Am. Math. Soc. 1951, 57, 497–499. [Google Scholar]
  64. Ruark, A.E. Inspectional analysis: A method which supplements dimensional analysis. J. Elisha Mitchell Sci. Soc. 1935, 51, 127–133. [Google Scholar]
  65. Bear, J. Dynamics of Fluids in Porous Media; Courier Corporation, Dover Publications: New York, NY, USA, 2013. [Google Scholar]
  66. Peters, E.J.; Afzal, N.; Gharbi, R. On scaling immiscible displacements in permeable media. J. Pet. Sci. Eng. 1993, 9, 183–205. [Google Scholar] [CrossRef]
  67. Collins, R.E. Flow of Fluids Through Porous Materials; U.S. Department of Energy Office of Scientific and Technical Information: Oak Ridge, TN, USA, 1976.
  68. Greenkorn, R. Flow models and scaling laws for flow through porous media. Ind. Eng. Chem. 1964, 56, 32–37. [Google Scholar] [CrossRef]
  69. Li, D.; Lake, L.W. Scaling fluid flow through heterogeneous permeable media. SPE Adv. Technol. Ser. 1995, 3, 188–197. [Google Scholar] [CrossRef]
  70. Loomis, A.G.; Crowell, D.C. Theory and Application of Dimensional and Inspectional Analysis to Model Study of Fluid Displacements in Petroleum Reservoirs; US Department of the Interior, Bureau of Mines: Washington, DC, USA, 1964.
  71. Nielsen, R.L.; Tek, M. Evaluation of scale-up laws for two-phase flow through porous media. Soc. Pet. Eng. J. 1963, 3, 164–176. [Google Scholar] [CrossRef]
  72. Rapoport, L.; Leas, W. Properties of linear waterfloods. J. Pet. Technol. 1953, 5, 139–148. [Google Scholar] [CrossRef]
  73. Shook, M.; Li, D.; Lake, L.W. Scaling immiscible flow through permeable media by inspectional analysis. In Situ (United States) 1992, 16, 311. [Google Scholar]
  74. Sorbie, K.; Feghi, F.; Pickup, G.; Ringrose, P.; Jensen, J. Flow regimes in miscible displacements in heterogeneous correlated random fields. SPE Adv. Technol. Ser. 1994, 2, 78–87. [Google Scholar] [CrossRef]
  75. Waggoner, J.; Castillo, J.; Lake, L.W. Simulation of EOR processes in stochastically generated permeable media. SPE Form. Eval. 1992, 7, 173–180. [Google Scholar] [CrossRef]
  76. Wygal, R. Construction of models that simulate oil reservoirs. Soc. Pet. Eng. J. 1963, 3, 281–286. [Google Scholar] [CrossRef]
  77. Leverett, M.; Lewis, W.; True, M. Dimensional-model studies of oil-field behavior. Trans. AIME 1942, 146, 175–193. [Google Scholar] [CrossRef]
  78. Engleberts, W.; Klinkenberg, L. Laboratory Experiments on the Displacement of Oil by Water From Packs of Granular Materials. In Proceedings of the 3rd World Petroleum Congress, The Hague, The Netherlands, 28 May–6 June 1951. [Google Scholar]
  79. Asghari, K.; Dong, M.; Shire, J.; Coleridge, T.J.; Nagrampa, J.; Grassick, J. Development of a correlation between performance of CO2 flooding and the past performance of waterflooding in Weyburn oil field. SPE Prod. Oper. 2007, 22, 260–264. [Google Scholar] [CrossRef]
  80. Liu, S.; Sahni, V.; Hsu, C.-F. A novel method of forecasting CO2 flood performance for various WAG injection schemes by analyzing injection pulses. In Proceedings of the SPE Improved Oil Recovery Symposium, Tulsa, OK, USA, 12–16 April 2014. [Google Scholar]
  81. Chung, S.H.; Chan, H.K. A two-level genetic algorithm to determine production frequencies for economic lot scheduling problem. IEEE Trans. Ind. Electron. 2011, 59, 611–619. [Google Scholar] [CrossRef]
  82. Tsai, C.-C.; Huang, H.-C.; Chan, C.-K. Parallel elite genetic algorithm and its application to global path planning for autonomous robot navigation. IEEE Trans. Ind. Electron. 2011, 58, 4813–4821. [Google Scholar] [CrossRef]
  83. Zhang, X.; Hu, S.; Chen, D.; Li, X. Fast covariance matching with fuzzy genetic algorithm. IEEE Trans. Ind. Inform. 2011, 8, 148–157. [Google Scholar] [CrossRef]
  84. Varadan, V.; Leung, H. Reconstruction of polynomial systems from noisy time-series measurements using genetic programming. IEEE Trans. Ind. Electron. 2001, 48, 742–748. [Google Scholar] [CrossRef]
  85. Teodorescu, L.; Sherwood, D. High energy physics event selection with gene expression programming. Comput. Phys. Commun. 2008, 178, 409–419. [Google Scholar] [CrossRef]
  86. Gharagheizi, F.; Abbasi, R.; Tirandazi, B. Prediction of Henry’s law constant of organic compounds in water from a new group-contribution-based model. Ind. Eng. Chem. Res. 2010, 49, 10149–10152. [Google Scholar] [CrossRef]
  87. Virnovsky, G.; Vatne, K.; Iversen, J.; Signy, C. Three-phase capillary pressure measurements in centrifuge at reservoir conditions. In Proceedings of the International Symposium of the Society of Core Analysts, Abu Dhabi, United Arab Emirates, 5–9 October 2004. [Google Scholar]
  88. Neshat, S.S.; Pope, G.A. Compositional Three-Phase Relative Permeability and Capillary Pressure Models Using Gibbs Free Energy. In Proceedings of the SPE Reservoir Simulation Conference, Montgomery, TX, USA, 20–22 February 2017. [Google Scholar]
  89. Skjaeveland, S.; Siqveland, L.; Kjosavik, A.; Hammervold, W.; Virnovsky, G. Capillary pressure correlation for mixed-wet reservoirs. In Proceedings of the SPE India Oil and Gas Conference and Exhibition, New Delhi, India, 17–19 February 1998. [Google Scholar]
  90. Lorenzen, T.; Anderson, V. Design of Experiments: A No-Name Approach; CRC Press: Boca Raton, FL, USA, 1993. [Google Scholar]
  91. Safa, Y.; Bhatti, H.N. Biosorption of Direct Red-31 and Direct Orange-26 dyes by rice husk: Application of factorial design analysis. Chem. Eng. Res. Des. 2011, 89, 2566–2574. [Google Scholar] [CrossRef]
  92. Antony, J. Training for design of experiments using a catapult. Qual. Reliab. Eng. Int. 2002, 18, 29–35. [Google Scholar] [CrossRef] [Green Version]
  93. Montgomery, D.C. Design and Analysis of Experiments; Wiley: Hoboken, NJ, USA, 1997. [Google Scholar]
  94. George, E.; Hunter, J.S.; Hunter, W.G.; Bins, R.; Kirlin IV, K.; Carroll, D. Statistics for Experimenters: Design, Innovation, and Discovery; Wiley: New York, NY, USA, 2005. [Google Scholar]
  95. Chen, Y.; Chen, D.; Khan, S.U.; Huang, J.; Xie, C. Solving symbolic regression problems with uniform design-aided gene expression programming. J. Supercomput. 2013, 66, 1553–1575. [Google Scholar] [CrossRef]
  96. Ferreira, C. Function finding and the creation of numerical constants in gene expression programming. In Advances in Soft Computing; Springer: Berlin/Heidelberg, Germany, 2003; pp. 257–265. [Google Scholar]
  97. Cândida, F. GeneXproTools; Gepsoft Ltd.: Capelo, Portugal. Available online: https://www.gepsoft.com/ (accessed on 27 August 2020).
  98. Agbalaka, C.C.; Dandekar, A.Y.; Patil, S.L.; Khataniar, S.; Hemsath, J. The effect of wettability on oil recovery: A review. In Proceedings of the SPE Asia Pacific Oil and Gas Conference and Exhibition, Perth, Australia, 20–22 October 2008. [Google Scholar]
  99. Delshad, M.; Bhuyan, D.; Pope, G.; Lake, L. Effect of capillary number on the residual saturation of a three-phase micellar solution. In Proceedings of the SPE Enhanced Oil Recovery Symposium, Tulsa, OK, USA, 20–23 April 1986. [Google Scholar]
  100. Bethel, F.; Calhoun, J.C. Capillary desaturation in unconsolidated beads. J. Pet. Technol. 1953, 5, 197–202. [Google Scholar] [CrossRef]
  101. Chatzis, I.; Morrow, N.R. Correlation of capillary number relationships for sandstone. Soc. Pet. Eng. J. 1984, 24, 555–562. [Google Scholar] [CrossRef]
  102. Saffman, P.G.; Taylor, G.I. The penetration of a fluid into a porous medium or Hele-Shaw cell containing a more viscous liquid. Proc. R. Soc. Lond. Ser. A Math. Phys. Sci. 1958, 245, 312–329. [Google Scholar]
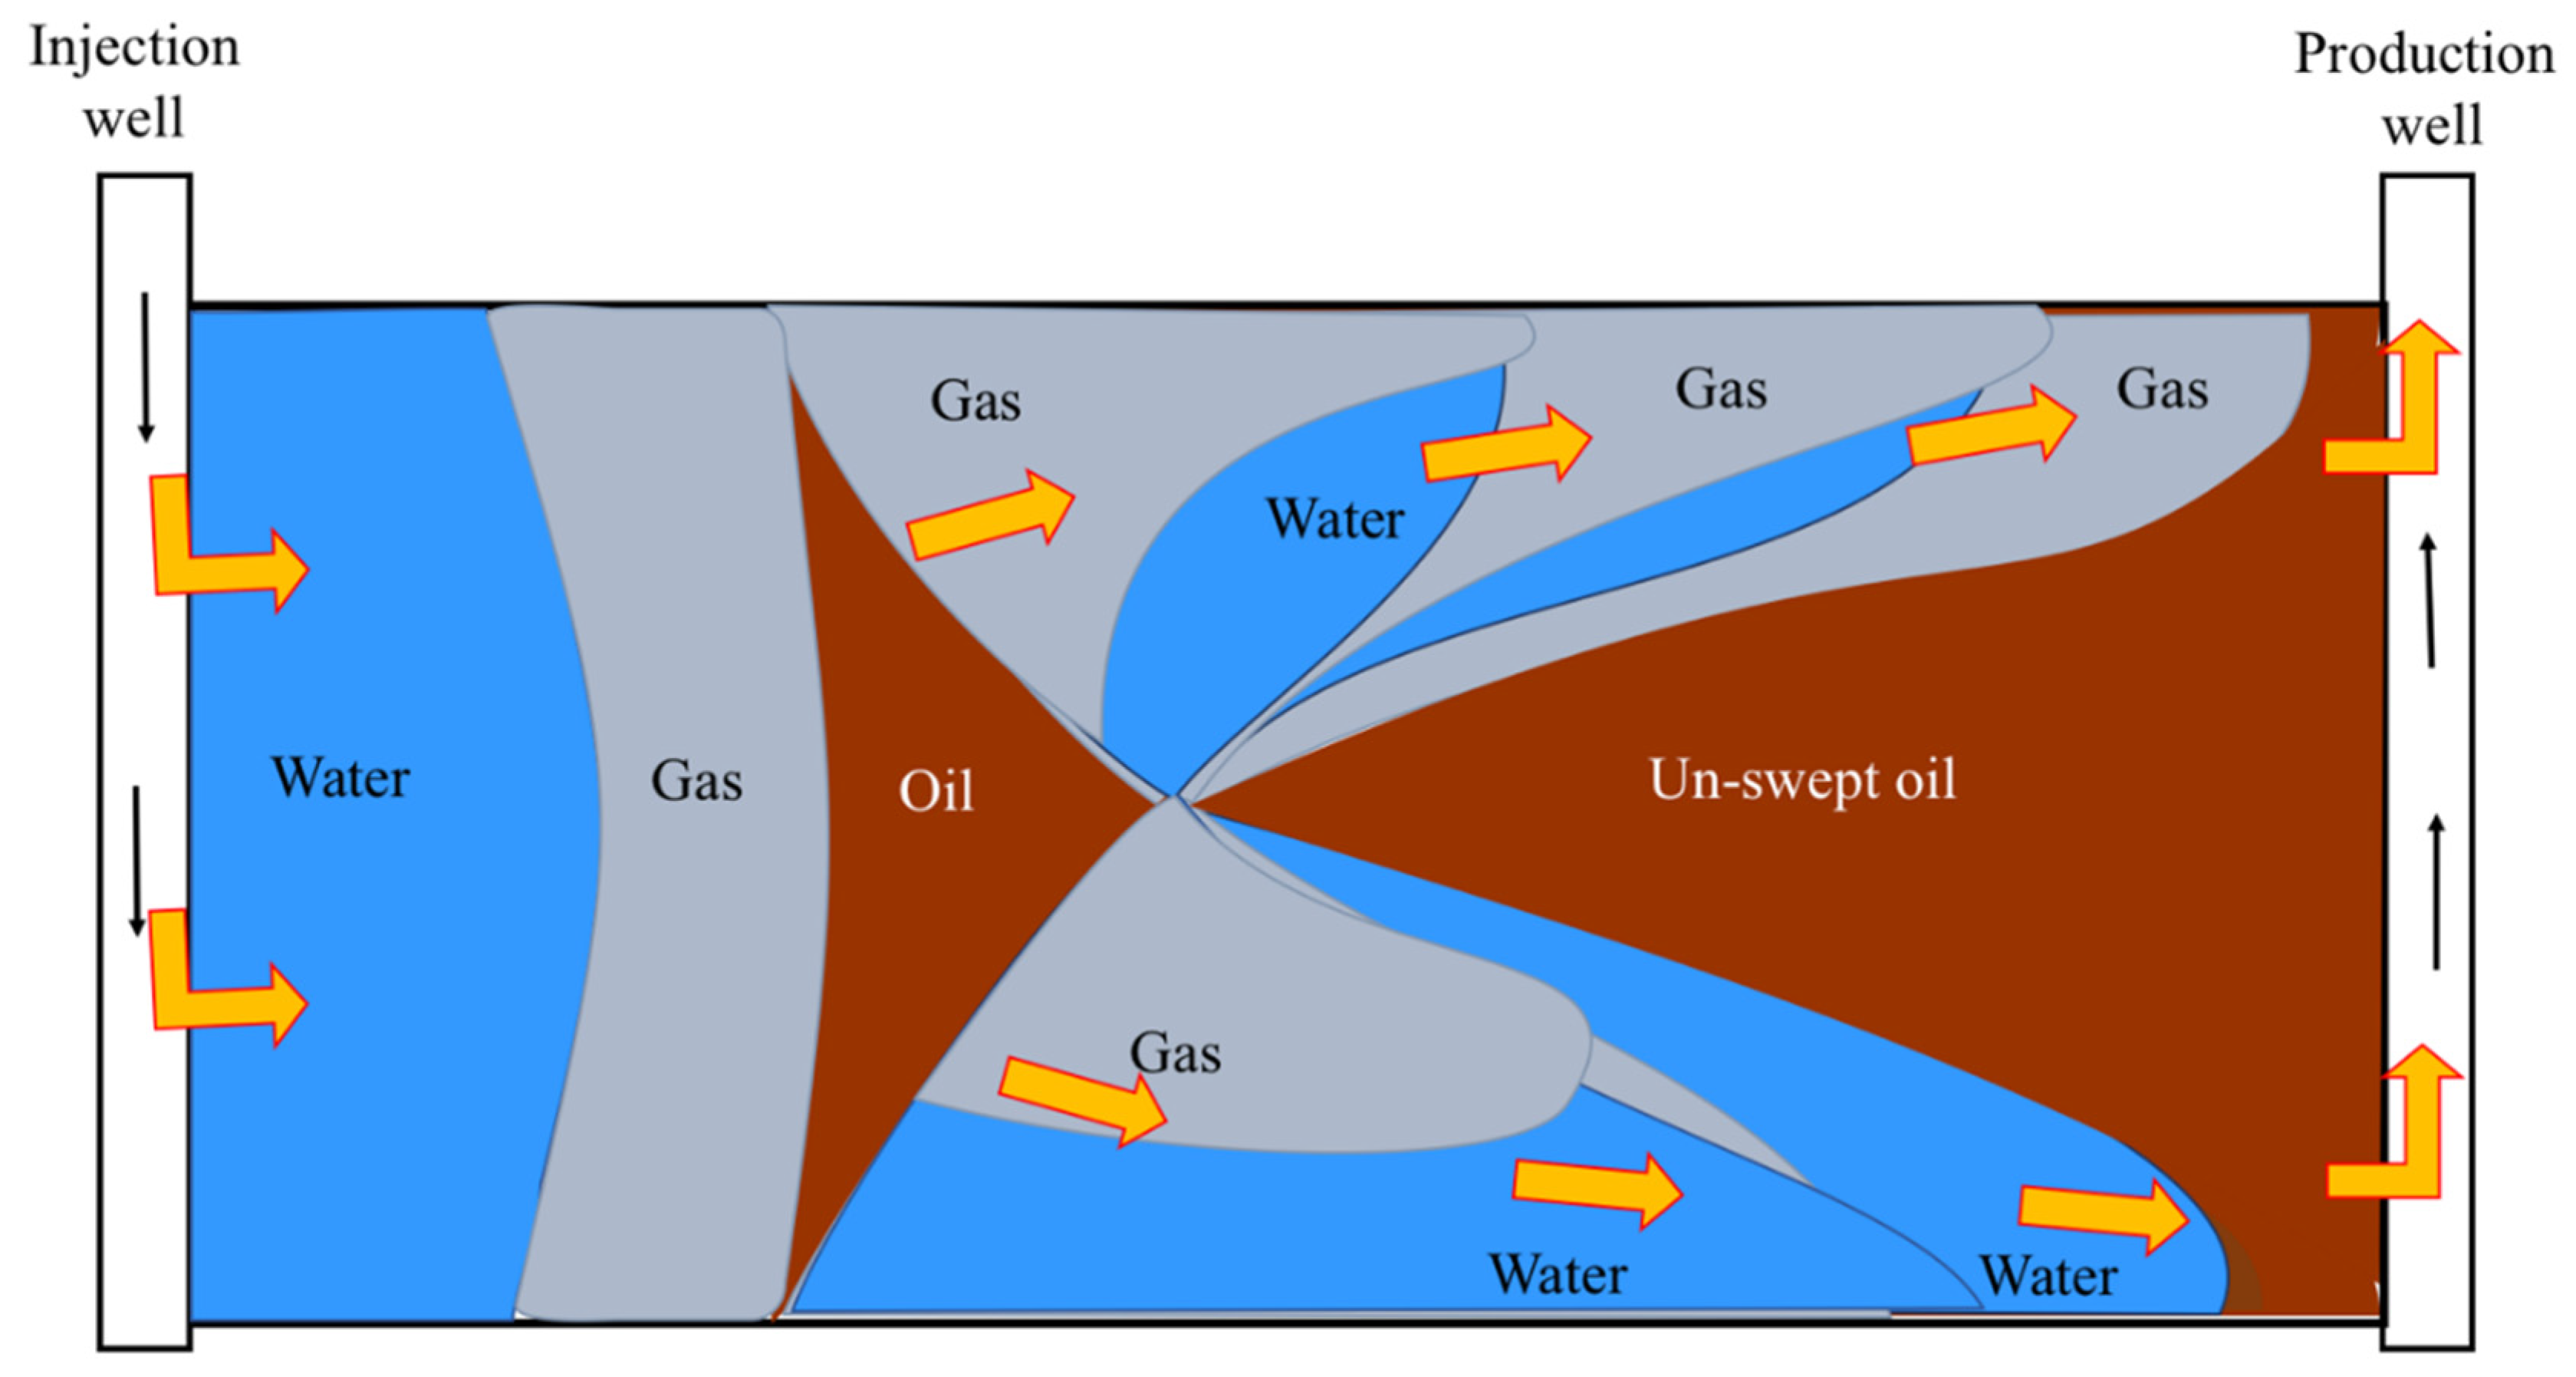
Figure 1. A WAG injection process and distribution of phases in a typical reservoir (Modified after [62]).
Energies 14 07131 g001
Figure 2. A typical two-gene chromosome with its corresponding mathematical expression (Modified after Gharagheizi et al. [46]).
Energies 14 07131 g002
Figure 3. A schematic flowchart of workflow for developing the RF correlation of WAG in this research.
Energies 14 07131 g003
Figure 4. The correlation introduced for prediction of WAG RF in the form of an expression tree.
Energies 14 07131 g004
Figure 5. Relative importance of all input variables included in the new correlation for RF determination of WAG injection process.
Energies 14 07131 g005
Figure 6. Cross plot of training data against the target values.
Energies 14 07131 g006
Figure 7. Scatter absolute error (a) and relative error (b) plots of training and testing phases.
Energies 14 07131 g007
Figure 8. Comparison of RF of the WAG process generated by the developed correlation, mathematical model, and experimental tests.
Energies 14 07131 g008
Figure 9. Effect of oil inverse capillary number ( π 1 ) on the RF of the WAG injection using the GEP correlation.
Energies 14 07131 g009
Figure 10. Effect of oil to water viscosity ratio ( π 3 ) on the recovery performance of near-miscible WAG injection based on the developed correlation.
Energies 14 07131 g010
Figure 11. Impact of oil to gas viscosity ratio ( π 4 ) on the recovery performance of near-miscible WAG injection based on the GEP correlation.
Energies 14 07131 g011
Table 1. Description of governing and auxiliary equations parameters (Equations (1)–(3)).
Governing EquationsAuxiliary Equations
. ρ i K k r i μ i   p i x + q i = t ϕ ρ i s i       i o ,   w , g s o + s w + s g = 1
ρ Density of the fluid p c = p n w p w
K Rock permeability p c Capillary pressure
k r i Relative permeability of phase i p n w Pressure of the nonwet phase
μViscosity of the fluid p w Pressure of the wet phase
p Pressure s Saturation of phases
x Spatial locationoOil phase
qSource/sink termwWater phase
t TimegGas phase
Table 2. Design matrix of factors.
FactorsLevel
Low (−1)High (+1)
μ o (Pa.h)1.11 × 10−81.11× 10−7
q w (m3/h)25 × 10−640 × 10−6
q g (m3/h)25 × 10−640 × 10−6
K (mD)65200
PVI0.51
N13
Table 3. Variables needed to develop the dimensionless numbers.
VariablesFixed ParametersResponse Variable
μ o (cP) σ o w (N/m)RF
qw (m3/h) σ o g (N/m)
qg (m3/h) μ w (cP)
K (mD) μ g (cP)
PVI
N
Table 4. Analysis of variance (ANOVA) table to assess design parameters (dimensionless groups) in a WAG injection process [d.f stands for the degree of freedom].
SourceSum Sqd.fFp
π 1 0.009226.660.0018
π 2 0.0159110.450.0010
π 3 0.01004200.24<0.0001
π 4 0.0153140.340.0013
π 5 0.0189112.390.0007
π 6 0.063514.670.0023
π 7 0.06144348.21<0.0001
Error0.15648
Total0.194222
Table 5. The optimal GEP parameters.
ConfigurationValue
Population size96
No. of chromosomes33
Head size8
No. of genes4
Fitness functionOF
Map operators + , , ^ , × , ÷ , , L n ,   L o g ,
No. of constants per gene10
Table 6. Statistical analysis of training and testing results.
Statistical MeasuresTrainingTesting
MSE1.38 × 10−34.30 × 10⁻³
RMSE3.72 × 10−26.56 × 10⁻²
MAE3.06 × 10−25.25 × 10⁻²
RSE7.15 × 10−223.29 × 10⁻²
RAE26.85 × 10−247.87 × 10⁻²
Correlation coefficient (%)96.3687.68
R2 (%)92.8591.93
Table 7. The constant values obtained for Equations (14)–(18).
ConstantValue
C13−4.7530
C15−5.4106
C18−7.5887
C116.7068
C102.2652
C2811.5608
C290.7480
C22−59.7849
C35−7.7281
C329.5931
C490.0875
C420.4019
Table 8. The statistics of the input variables to develop the new correlation with regards to the response variable (RF).
Attribute π 1 π 2 π 3 π 4 π 5 π 6 π 7
Importance1.89 × 10 2 1.70 × 10 2 3.66 × 10 1 1.88 × 10 1 2.30 × 10 2 1.53 × 10 2 3.71 × 10 1
Minimum3.16 × 10 2 4.71 × 10 2 1.616.17 × 10 2 6.25 × 10 1 5.00 × 10 1 1.00
Maximum1.56 × 10 1 2.32 × 10 1 16.096.17 × 10 1 1.601.003.00
Average8.22 × 10 2 1.25 × 10 1 8.623.30 × 10 1 1.067.58 × 10 1 2.14
Median7.39 × 10 2 1.10 × 10 1 1.616.17 × 10 2 1.001.002.00
Standard deviation4.63 × 10 2 7.19 × 10 2 7.292.79 × 10 1 3.58 × 10 1 2.52 × 10 1 8.33 × 10 1
R2 (vs. Response)2.62 × 10 3 2.30 × 10 4 3.24 × 10 1 3.24 × 10 1 4.51 × 10 3 4.12 × 10 3 5.67 × 10 1
Table 9. Comparison of RF and relative errors of WAG injection generated by the developed correlation, mathematical model, and experimental work.
NRFGEP
(%)
Relative ErrorGEP-Exp
(%)
RFTarget
(%)
Relative ErrorGEP-Target
(%)
RFExp
(%)
0.559.3518.7750.0818.5149.97
169.205.5064.647.0565.59
1.576.085.6571.945.7572.01
281.563.0879.372.7679.12
2.586.221.3384.302.2885.09
390.323.4892.001.8393.58
Table 10. π 3 and π 4 sensitivity analysis to assess the WAG flooding process.
π 3 = μ o μ g NRF (%) π 4 = μ o μ w RF (%)
1.59169.200.061169.20
281.5681.56
390.3290.32
2.00163.150.10062.14
275.4674.89
384.1484.25
3.00157.000.12059.40
270.0073.42
376.6681.19
Publisher’s Note: MDPI stays neutral with regard to jurisdictional claims in published maps and institutional affiliations.