
Analysis of Shielding Properties of Head Covers Made of Conductive Materials in Application to 5G Wireless Systems


Abstract
:1. Introduction
2. Materials and Methods
3. Results
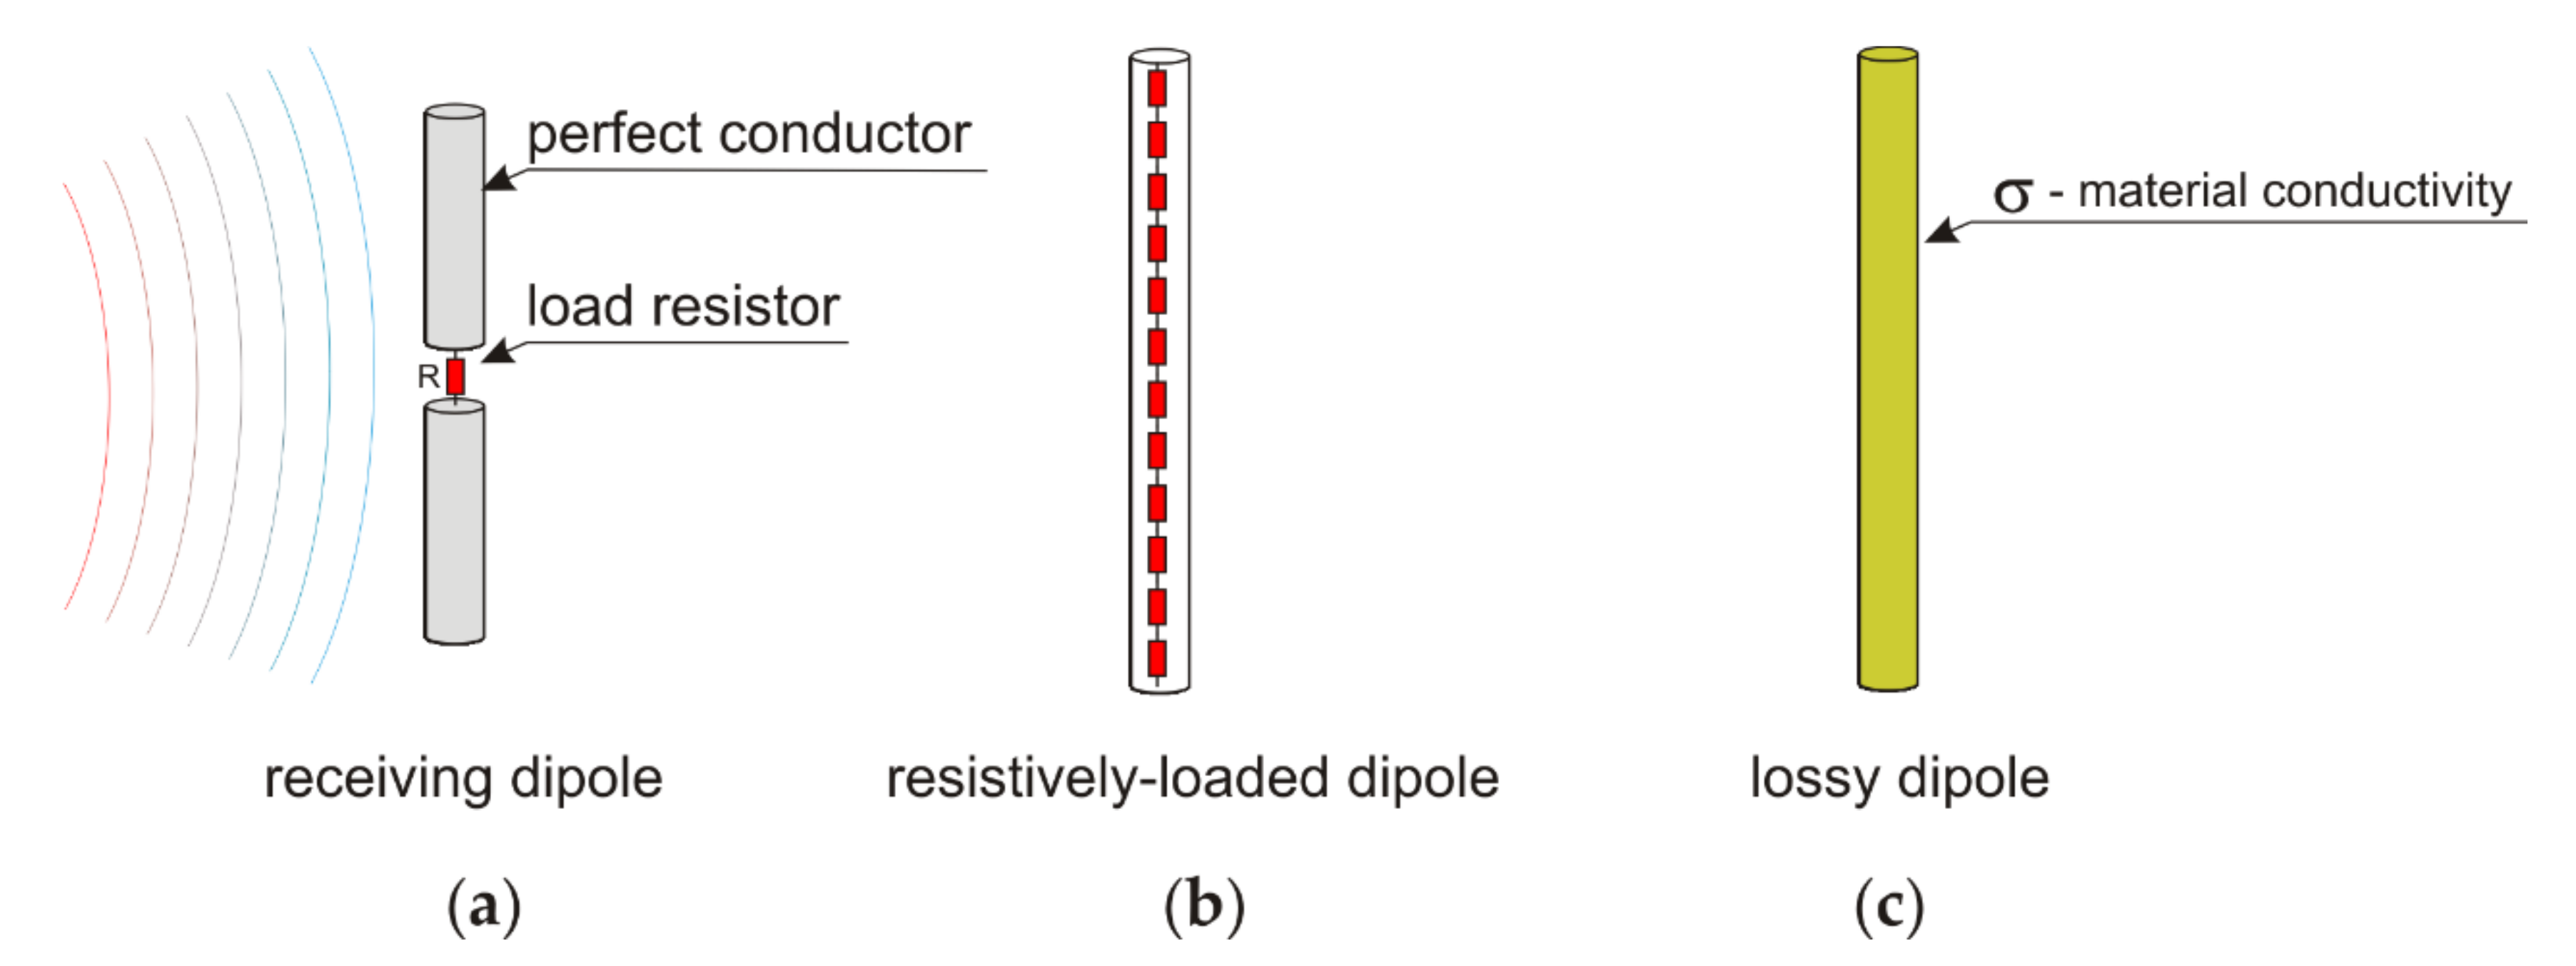
- σ—electrical conductivity (S/m)
- E—electric field strength (V/m)
- ρ—tissue density (kg/m3)
4. Discussion
5. Conclusions
Funding
Data Availability Statement
Conflicts of Interest
Appendix A. Human Body Model Properties

| Nr | Tissue | Number of Voxels | Mass (kg) |
|---|---|---|---|
| 1 | blood | 18,933 | 0.0200311 |
| 2 | blood vessel | 25,454 | 0.0264722 |
| 3 | body fluid | 10,748 | 0.0108555 |
| 4 | bone marrow | 144,568 | 0.150351 |
| 5 | cancellous bone | 301,298 | 0.579492 |
| 6 | cartilage | 45,541 | 0.0499585 |
| 7 | cerebellum | 128,873 | 0.13377 |
| 8 | cerebro spinal fluid | 162,548 | 0.163718 |
| 9 | cortical bone | 361,577 | 0.719538 |
| 10 | eye cornea | 239 | 0.000257164 |
| 11 | eye lens | 898 | 0.00137394 |
| 12 | eye sclera | 3320 | 0.00340632 |
| 13 | eye vitreoushumor | 11,822 | 0.0119272 |
| 14 | fat | 1,635,230 | 1.49787 |
| 15 | glands | 95,665 | 0.100449 |
| 16 | gray matter | 524,953 | 0.544901 |
| 17 | ligaments | 347,454 | 0.423906 |
| 18 | lymph | 15,619 | 0.0162438 |
| 19 | mucous membrane | 174,946 | 0.181944 |
| 20 | muscle | 2,041,626 | 2.13739 |
| 21 | nerve spine | 36,430 | 0.1379143 |
| 22 | outer lung | 125 | 0.00013125 |
| 23 | skin | 591,141 | 0.665034 |
| 24 | tooth | 13,198 | 0.0285077 |
| 25 | white matter | 447,594 | 0.464696 |
Appendix B. SAR Parameters for All Considered Combinations of Angles
| φ Angle (◦) | θ Angle (◦) | SAR Parameter | SAR Value No Shield (W/kg) | SAR Value Metal Surface Shield (W/kg) |
|---|---|---|---|---|
| 0 | 90 | 10 g average, maximum | 0.51 | 0.72 |
| 0 | 90 | 10 g average, average | 0.084 | 0.058 |
| 0 | 90 | 1 g average, maximum | 0.6 | 0.92 |
| 0 | 90 | 1 g average, average | 0.084 | 0.058 |
| 0 | 60 | 10 g average, maximum | 0.49 | 0.57 |
| 0 | 60 | 10 g average, average | 0.078 | 0.048 |
| 0 | 60 | 1 g average, maximum | 0.81 | 0.87 |
| 0 | 60 | 1 g average, average | 0.078 | 0.048 |
| 0 | 30 | 10 g average, maximum | 0.53 | 0.57 |
| 0 | 30 | 10 g average, average | 0.078 | 0.046 |
| 0 | 30 | 1 g average, maximum | 0.87 | 1.22 |
| 0 | 30 | 1 g average, average | 0.078 | 0.046 |
| 0 | 0 | 10 g average, maximum | 0.39 | 0.90 |
| 0 | 0 | 10 g average, average | 0.082 | 0.049 |
| 0 | 0 | 1 g average, maximum | 0.61 | 3.37 |
| 0 | 0 | 1 g average, average | 0.082 | 0.049 |
| 30 | 90 | 10 g average, maximum | 0.46 | 0.63 |
| 30 | 90 | 10 g average, average | 0.083 | 0.056 |
| 30 | 90 | 1 g average, maximum | 0.55 | 0.88 |
| 30 | 90 | 1 g average, average | 0.083 | 0.056 |
| 30 | 60 | 10 g average, maximum | 0.41 | 0.51 |
| 30 | 60 | 10 g average, average | 0.081 | 0.047 |
| 30 | 60 | 1 g average, maximum | 0.69 | 0.75 |
| 30 | 60 | 1 g average, average | 0.081 | 0.047 |
| 30 | 30 | 10 g average, maximum | 0.43 | 0.48 |
| 30 | 30 | 10 g average, average | 0.080 | 0.045 |
| 30 | 30 | 1 g average, maximum | 0.73 | 1.68 |
| 30 | 30 | 1 g average, average | 0.080 | 0.045 |
| 30 | 0 | 10 g average, maximum | 0.48 | 1.05 |
| 30 | 0 | 10 g average, average | 0.082 | 0.046 |
| 30 | 0 | 1 g average, maximum | 0.63 | 3.86 |
| 30 | 0 | 1 g average, average | 0.082 | 0.046 |
| 60 | 90 | 10 g average, maximum | 0.34 | 0.50 |
| 60 | 90 | 10 g average, average | 0.083 | 0.049 |
| 60 | 90 | 1 g average, maximum | 0.51 | 0.90 |
| 60 | 90 | 1 g average, average | 0.083 | 0.049 |
| 60 | 60 | 10 g average, maximum | 0.41 | 0.55 |
| 60 | 60 | 10 g average, average | 0.083 | 0.045 |
| 60 | 60 | 1 g average, maximum | 0.59 | 1.30 |
| 60 | 60 | 1 g average, average | 0.083 | 0.045 |
| 60 | 30 | 10 g average, maximum | 0.37 | 0.53 |
| 60 | 30 | 10 g average, average | 0.081 | 0.040 |
| 60 | 30 | 1 g average, maximum | 0.59 | 0.85 |
| 60 | 30 | 1 g average, average | 0.63 | 0.040 |
| 60 | 0 | 10 g average, maximum | 0.38 | 0.70 |
| 60 | 0 | 10 g average, average | 0.081 | 0.038 |
| 60 | 0 | 1 g average, maximum | 0.53 | 2.48 |
| 60 | 0 | 1 g average, average | 0.081 | 0.038 |
| 90 | 90 | 10 g average, maximum | 0.42 | 0.48 |
| 90 | 90 | 10 g average, average | 0.083 | 0.04 |
| 90 | 90 | 1 g average, maximum | 0.59 | 1.66 |
| 90 | 90 | 1 g average, average | 0.083 | 0.04 |
| 90 | 60 | 10 g average, maximum | 0.44 | 0.59 |
| 90 | 60 | 10 g average, average | 0.084 | 0.042 |
| 90 | 60 | 1 g average, maximum | 0.58 | 2.15 |
| 90 | 60 | 1 g average, average | 0.084 | 0.042 |
| 90 | 30 | 10 g average, maximum | 0.38 | 0.61 |
| 90 | 30 | 10 g average, average | 0.081 | 0.035 |
| 90 | 30 | 1 g average, maximum | 0.51 | 2.18 |
| 90 | 30 | 1 g average, average | 0.081 | 0.035 |
| 90 | 0 | 10 g average, maximum | 0.44 | 0.46 |
| 90 | 0 | 10 g average, average | 0.080 | 0.035 |
| 90 | 0 | 1 g average, maximum | 0.75 | 0.82 |
| 90 | 0 | 1 g average, average | 0.080 | 0.035 |
| 120 | 90 | 10 g average, maximum | 0.42 | 0.84 |
| 120 | 90 | 10 g average, average | 0.079 | 0.035 |
| 120 | 90 | 1 g average, maximum | 0.57 | 2.93 |
| 120 | 90 | 1 g average, average | 0.079 | 0.035 |
| 120 | 60 | 10 g average, maximum | 0.48 | 1.05 |
| 120 | 60 | 10 g average, average | 0.086 | 0.042 |
| 120 | 60 | 1 g average, maximum | 0.72 | 3.6 |
| 120 | 60 | 1 g average, average | 0.086 | 0.042 |
| 120 | 30 | 10 g average, maximum | 0.43 | 0.92 |
| 120 | 30 | 10 g average, average | 0.085 | 0.037 |
| 120 | 30 | 1 g average, maximum | 0.64 | 3.24 |
| 120 | 30 | 1 g average, average | 0.085 | 0.037 |
| 120 | 0 | 10 g average, maximum | 0.38 | 0.80 |
| 120 | 0 | 10 g average, average | 0.080 | 0.038 |
| 120 | 0 | 1 g average, maximum | 0.63 | 2.54 |
| 120 | 0 | 1 g average, average | 0.080 | 0.038 |
| 150 | 90 | 10 g average, maximum | 0.34 | 1.00 |
| 150 | 90 | 10 g average, average | 0.08 | 0.036 |
| 150 | 90 | 1 g average, maximum | 0.61 | 3.48 |
| 150 | 90 | 1 g average, average | 0.08 | 0.036 |
| 150 | 60 | 10 g average, maximum | 0.43 | 1.32 |
| 150 | 60 | 10 g average, average | 0.089 | 0.048 |
| 150 | 60 | 1 g average, maximum | 0.80 | 4.50 |
| 150 | 60 | 1 g average, average | 0.089 | 0.048 |
| 150 | 30 | 10 g average, maximum | 0.43 | 1.05 |
| 150 | 30 | 10 g average, average | 0.088 | 0.044 |
| 150 | 30 | 1 g average, maximum | 0.68 | 3.67 |
| 150 | 30 | 1 g average, average | 0.088 | 0.044 |
| 150 | 0 | 10 g average, maximum | 0.46 | 1.05 |
| 150 | 0 | 10 g average, average | 0.082 | 0.046 |
| 150 | 0 | 1 g average, maximum | 0.58 | 3.59 |
| 150 | 0 | 1 g average, average | 0.082 | 0.046 |
| 180 | 90 | 10 g average, maximum | 0.34 | 1.0 |
| 180 | 90 | 10 g average, average | 0.082 | 0.038 |
| 180 | 90 | 1 g average, maximum | 0.63 | 3.58 |
| 180 | 90 | 1 g average, average | 0.082 | 0.038 |
| 180 | 60 | 10 g average, maximum | 0.44 | 1.23 |
| 180 | 60 | 10 g average, average | 0.090 | 0.052 |
| 180 | 60 | 1 g average, maximum | 0.86 | 4.4 |
| 180 | 60 | 1 g average, average | 0.090 | 0.052 |
| 180 | 30 | 10 g average, maximum | 0.38 | 0.93 |
| 180 | 30 | 10 g average, average | 0.088 | 0.047 |
| 180 | 30 | 1 g average, maximum | 0.68 | 3.42 |
| 180 | 30 | 1 g average, average | 0.088 | 0.047 |
| 180 | 0 | 10 g average, maximum | 0.39 | 0.90 |
| 180 | 0 | 10 g average, average | 0.082 | 0.049 |
| 180 | 0 | 1 g average, maximum | 0.61 | 3.37 |
| 180 | 0 | 1 g average, average | 0.082 | 0.049 |
| φ Angle (◦) | θ Angle (◦) | SAR Parameter | SAR No Shield (W/kg) | SAR Metal Surface Shield (W/kg) | SAR Wire Shield (W/kg) |
|---|---|---|---|---|---|
| 0 | 90 | 10 g average, maximum | 0.45 | 0.45 | 0.45 |
| 0 | 90 | 10 g average, average | 0.032 | 0.024 | 0.025 |
| 0 | 90 | 1 g average, maximum | 1.02 | 1 | 1 |
| 0 | 90 | 1 g average, average | 0.32 | 0.024 | 0.024 |
| 0 | 60 | 10 g average, maximum | 0.42 | 0.44 | 0.34 |
| 0 | 60 | 10 g average, average | 0.030 | 0.019 | 0.028 |
| 0 | 60 | 1 g average, maximum | 0.97 | 1.0 | 0.92 |
| 0 | 60 | 1 g average, average | 0.030 | 0.019 | 0.028 |
| 0 | 30 | 10 g average, maximum | 0.50 | 0.45 | 0.45 |
| 0 | 30 | 10 g average, average | 0.027 | 0.012 | 0.031 |
| 0 | 30 | 1 g average, maximum | 1.09 | 1.13 | 1 |
| 0 | 30 | 1 g average, average | 0.027 | 0.012 | 0.031 |
| 0 | 0 | 10 g average, maximum | 0.38 | 0.36 | 0.38 |
| 0 | 0 | 10 g average, average | 0.032 | 0.012 | 0.032 |
| 0 | 0 | 1 g average, maximum | 0.98 | 0.98 | 1 |
| 0 | 0 | 1 g average, average | 0.032 | 0.012 | 0.032 |
| 30 | 90 | 10 g average, maximum | 0.44 | 0.44 | 0.46 |
| 30 | 90 | 10 g average, average | 0.035 | 0.023 | 0.025 |
| 30 | 90 | 1 g average, maximum | 1.23 | 0.44 | 1 |
| 30 | 90 | 1 g average, average | 0.035 | 0.023 | 0.025 |
| 30 | 60 | 10 g average, maximum | 0.40 | 0.42 | 0.38 |
| 30 | 60 | 10 g average, average | 0.033 | 0.018 | 0.029 |
| 30 | 60 | 1 g average, maximum | 0.80 | 0.86 | 0.78 |
| 30 | 60 | 1 g average, average | 0.033 | 0.018 | 0.029 |
| 30 | 30 | 10 g average, maximum | 0.48 | 0.56 | 0.42 |
| 30 | 30 | 10 g average, average | 0.031 | 0.013 | 0.034 |
| 30 | 30 | 1 g average, maximum | 1.23 | 1.52 | 0.99 |
| 30 | 30 | 1 g average, average | 0.031 | 0.013 | 0.034 |
| 30 | 0 | 10 g average, maximum | 0.30 | 0.29 | 0.30 |
| 30 | 0 | 10 g average, average | 0.032 | 0.011 | 0.032 |
| 30 | 0 | 1 g average, maximum | 0.77 | 0.77 | 0.8 |
| 30 | 0 | 1 g average, average | 0.032 | 0.011 | 0.032 |
| 60 | 90 | 10 g average, maximum | 0.43 | 0.50 | 0.44 |
| 60 | 90 | 10 g average, average | 0.040 | 0.022 | 0.025 |
| 60 | 90 | 1 g average, maximum | 0.81 | 1.29 | 0.85 |
| 60 | 90 | 1 g average, average | 0.040 | 0.022 | 0.025 |
| 60 | 60 | 10 g average, maximum | 0.35 | 0.34 | 0.31 |
| 60 | 60 | 10 g average, average | 0.038 | 0.12 | 0.029 |
| 60 | 60 | 1 g average, maximum | 0.71 | 0.69 | 0.68 |
| 60 | 60 | 1 g average, average | 0.038 | 0.12 | 0.029 |
| 60 | 30 | 10 g average, maximum | 0.43 | 0.56 | 0.32 |
| 60 | 30 | 10 g average, average | 0.036 | 0.013 | 0.038 |
| 60 | 30 | 1 g average, maximum | 0.97 | 1.32 | 0.67 |
| 60 | 30 | 1 g average, average | 0.036 | 0.013 | 0.038 |
| 60 | 0 | 10 g average, maximum | 0.20 | 0.32 | 0.25 |
| 60 | 0 | 10 g average, average | 0.034 | 0.01 | 0.034 |
| 60 | 0 | 1 g average, maximum | 0.45 | 0.77 | 0.55 |
| 60 | 0 | 1 g average, average | 0.034 | 0.01 | 0.034 |
| 90 | 90 | 10 g average, maximum | 0.33 | 0.53 | 0.3 |
| 90 | 90 | 10 g average, average | 0.04 | 0.019 | 0.023 |
| 90 | 90 | 1 g average, maximum | 0.85 | 1.18 | 0.63 |
| 90 | 90 | 1 g average, average | 0.04 | 0.019 | 0.023 |
| 90 | 60 | 10 g average, maximum | 0.37 | 0.42 | 0.32 |
| 90 | 60 | 10 g average, average | 0.040 | 0.015 | 0.029 |
| 90 | 60 | 1 g average, maximum | 0.68 | 1.20 | 0.80 |
| 90 | 60 | 1 g average, average | 0.040 | 0.015 | 0.029 |
| 90 | 30 | 10 g average, maximum | 0.38 | 0.49 | 0.34 |
| 90 | 30 | 10 g average, average | 0.038 | 0.012 | 0.039 |
| 90 | 30 | 1 g average, maximum | 0.72 | 1.08 | 0.97 |
| 90 | 30 | 1 g average, average | 0.038 | 0.012 | 0.039 |
| 90 | 0 | 10 g average, maximum | 0.20 | 0.27 | 0.30 |
| 90 | 0 | 10 g average, average | 0.034 | 0.01 | 0.035 |
| 90 | 0 | 1 g average, maximum | 0.40 | 0.64 | 0.66 |
| 90 | 0 | 1 g average, average | 0.034 | 0.01 | 0.035 |
| 120 | 90 | 10 g average, maximum | 0.29 | 0.32 | 0.35 |
| 120 | 90 | 10 g average, average | 0.037 | 0.018 | 0.022 |
| 120 | 90 | 1 g average, maximum | 0.67 | 0.93 | 0.94 |
| 120 | 90 | 1 g average, average | 0.037 | 0.018 | 0.022 |
| 120 | 60 | 10 g average, maximum | 0.33 | 0.38 | 0.26 |
| 120 | 60 | 10 g average, average | 0.038 | 0.014 | 0.027 |
| 120 | 60 | 1 g average, maximum | 0.64 | 0.88 | 0.51 |
| 120 | 60 | 1 g average, average | 0.038 | 0.014 | 0.027 |
| 120 | 30 | 10 g average, maximum | 0.32 | 0.37 | 0.36 |
| 120 | 30 | 10 g average, average | 0.038 | 0.01 | 0.039 |
| 120 | 30 | 1 g average, maximum | 0.69 | 0.73 | 1.04 |
| 120 | 30 | 1 g average, average | 0.038 | 0.01 | 0.039 |
| 120 | 0 | 10 g average, maximum | 0.20 | 0.23 | 0.28 |
| 120 | 0 | 10 g average, average | 0.034 | 0.01 | 0.035 |
| 120 | 0 | 1 g average, maximum | 0.51 | 0.60 | 0.53 |
| 120 | 0 | 1 g average, average | 0.034 | 0.01 | 0.035 |
| 150 | 90 | 10 g average, maximum | 0.27 | 0.3 | 0.33 |
| 150 | 90 | 10 g average, average | 0.036 | 0.02 | 0.024 |
| 150 | 90 | 1 g average, maximum | 0.52 | 1.17 | 0.71 |
| 150 | 90 | 1 g average, average | 0.036 | 0.02 | 0.024 |
| 150 | 60 | 10 g average, maximum | 0.28 | 0.37 | 0.26 |
| 150 | 60 | 10 g average, average | 0.036 | 0.015 | 0.028 |
| 150 | 60 | 1 g average, maximum | 0.51 | 0.75 | 0.45 |
| 150 | 60 | 1 g average, average | 0.036 | 0.015 | 0.028 |
| 150 | 30 | 10 g average, maximum | 0.28 | 0.31 | 0.27 |
| 150 | 30 | 10 g average, average | 0.037 | 0.014 | 0.038 |
| 150 | 30 | 1 g average, maximum | 0.70 | 0.54 | 0.70 |
| 150 | 30 | 1 g average, average | 0.037 | 0.014 | 0.038 |
| 150 | 0 | 10 g average, maximum | 0.30 | 0.27 | 0.30 |
| 150 | 0 | 10 g average, average | 0.033 | 0.012 | 0.03 |
| 150 | 0 | 1 g average, maximum | 0.76 | 0.74 | 0.80 |
| 150 | 0 | 1 g average, average | 0.033 | 0.012 | 0.03 |
| 180 | 90 | 10 g average, maximum | 0.25 | 0.3 | 0.27 |
| 180 | 90 | 10 g average, average | 0.037 | 0.02 | 0.025 |
| 180 | 90 | 1 g average, maximum | 0.48 | 0.55 | 0.53 |
| 180 | 90 | 1 g average, average | 0.037 | 0.02 | 0.025 |
| 180 | 60 | 10 g average, maximum | 0.31 | 0.38 | 0.30 |
| 180 | 60 | 10 g average, average | 0.036 | 0.017 | 0.03 |
| 180 | 60 | 1 g average, maximum | 0.62 | 0.77 | 0.55 |
| 180 | 60 | 1 g average, average | 0.036 | 0.017 | 0.03 |
| 180 | 30 | 10 g average, maximum | 0.23 | 0.36 | 0.27 |
| 180 | 30 | 10 g average, average | 0.037 | 0.016 | 0.037 |
| 180 | 30 | 1 g average, maximum | 0.48 | 0.69 | 0.51 |
| 180 | 30 | 1 g average, average | 0.037 | 0.016 | 0.037 |
| 180 | 0 | 10 g average, maximum | 0.38 | 0.36 | 0.38 |
| 180 | 0 | 10 g average, average | 0.032 | 0.012 | 0.032 |
| 180 | 0 | 1 g average, maximum | 0.98 | 0.98 | 1.03 |
| 180 | 0 | 1 g average, average | 0.032 | 0.012 | 0.032 |
References
- Pretz, K. Will 5G Be Bad for Our Health? IEEE Spectr. 2019. Available online: https://spectrum.ieee.org/news-from-around-ieee/the-institute/ieee-member-news/will-5g-be-bad-for-our-health (accessed on 20 February 2021).
- Bowes, S.M.; Costello, T.H.; Ma, W.; Lilienfeld, S.O. Looking under the tinfoil hat: Clarifying the personological and psychopathological correlates of conspiracy beliefs. J. Pers. 2021, 89, 422–436. [Google Scholar] [CrossRef]
- Goldsby, M.; Koolage, W.J. Should You Be Wearing a Tinfoil Hat. In Conspiracy Theories: Philosophers Connect the Dots; Greene, R., Robison-Greene, R., Eds.; Open Court Publishing: Chicago, IL, USA, 2020; pp. 179–192. [Google Scholar]
- Tomovski, B.; Gräbner, F.; Hungsberg, A.; Kallmeyer, C.; Linsel, M. Effects of Electromagnetic Field Over a Human Body, Sar Simulation with and Without Nanotextile in the Frequency Range 0.9-1.8GHZ. J. Electron. Eng. 2011, 62, 349–354. [Google Scholar] [CrossRef]
- Li, Y.; Zhang, X.; Yu, J.; Wang, Q.; Tan, B. Simulation of EM Field in Head Model and Shielding Effectiveness for Cellular Handset with PIFA. In Proceedings of the 2008 World Automation Congress, Waikoloa, HI, USA, 28 September–2 October 2008; pp. 1–4. [Google Scholar]
- Dutta, P.K.; Jayasree, P.V.Y.; Baba, V.S.S.N.S. SAR reduction in the modelled human head for the mobile phone using different material shields. Hum. Cent. Comput. Inf. Sci. 2016, 6, 44. [Google Scholar] [CrossRef] [Green Version]
- Tserpes, K.; Tzatzadakis, V.; Bachmann, J. Electrical Conductivity and Electromagnetic Shielding Effectiveness of Bio-Composites. J. Compos. Sci. 2020, 4, 28. [Google Scholar] [CrossRef] [Green Version]
- Raagulan, K.; Ghim, J.S.; Braveenth, R.; Jung, M.J.; Lee, S.B.; Chai, K.Y.; Kim, B.M.; Lee, J. EMI Shielding of the Hydrophobic, Flexible, Lightweight Carbonless Nano-Plate Composites. Nanomaterials 2020, 10, 2086. [Google Scholar] [CrossRef] [PubMed]
- Sivasamy, R.; Kanagasabai, M.; Baisakhiya, S.; Natarajan, R.; Pakkathillam, J.K.; Palaniswamy, S.K. A Novel Shield for GSM 1800 Mhz Band Using Frequency Selective Surface. Prog. Electromagn. Res. Lett. 2013, 38, 193–199. [Google Scholar] [CrossRef] [Green Version]
- Farooq, U.; Iftikhar, A.; Shafique, M.; Khan, M.; Fida, A.; Mughal, M.; Anagnostou, D. C-Band and X-Band Switchable Frequency-Selective Surface. Electronics 2021, 10, 476. [Google Scholar] [CrossRef]
- Mohamadzade, B.; Hashmi, R.M.; Simorangkir, R.B.V.B.; Gharaei, R.; Rehman, S.U.; Abbasi, Q.H. Recent Advances in Fabrication Methods for Flexible Antennas in Wearable Devices: State of the Art. Sensors 2019, 19, 2312. [Google Scholar] [CrossRef] [Green Version]
- Ali, S.M.; Sovuthy, C.; Imran, M.A.; Socheatra, S.; Abbasi, Q.H.; Abidin, Z.Z. Recent Advances of Wearable Antennas in Materials, Fabrication Methods, Designs, and Their Applications: State-of-the-Art. Micromachines 2020, 11, 888. [Google Scholar] [CrossRef]
- Korzeniewska, E.; Krawczyk, A.; Mróz, J.; Wyszyńska, E.; Zawiślak, R. Applications of Smart Textiles in Post-Stroke Rehabilitation. Sensors 2020, 20, 2370. [Google Scholar] [CrossRef] [PubMed] [Green Version]
- Korzeniewska, E.; Szczęsny, A.; Lipiński, P.; Dróżdż, T.; Kiełbasa, P.; Miernik, A. Prototype of a Textronic Sensor Created with a Physical Vacuum Deposition Process for Staphylococcus aureus Detection. Sensors 2020, 21, 183. [Google Scholar] [CrossRef] [PubMed]
- IEEE. C95.3-2002, Recommended Practice for Measurements and Computations of Radio Frequency Electromagnetic Fields with Respect to Human Exposure to Such fields, 100 kHz to 300 GHz; IEEE Standards and Coordinating Committee 28 on Non-Ionizing Radiation Hazards; IEEE: Piscataway, NJ, USA, 2002; pp. 1–126. [Google Scholar]
- Decision (EU) 2017/899 of the European Parliament and of the Council of 17 May 2017 on the Use of the 470–790 MHz Frequency Band in the Union. Off. J. Eur. Union 2017, L 138/131, 131–137.
- Commission Implementing Decision (EU) 2019/235 of 24 January 2019 on Amending Decision 2008/411/EC as Regards an Update of Relevant Technical Conditions Applicable to the 3400-3800 MHz Fre-quency Band (Notified under Document C(2019) 262). Off. J. Eur. Union 2019, L 37/135, 135–143.
- Luebbers, R. XFDTD and Beyond-from Classroom to Corporation. In Proceedings of the 2006 IEEE Antennas and Propagation Society International Symposium, Albuquerque, NM, USA, 9–14 July 2006; IEEE: Albuquerque, NM, USA, 2006; pp. 119–122. [Google Scholar]
- Homsup, N.; Breakall, J. Application of XFDTD and FEKO Program to the Analysis of Planar Antennas. In Proceedings of the 2010 10th International Symposium on Communications and Information Technologies, Tokyo, Japan, 26–29 October 2010; pp. 646–650. [Google Scholar]
- Samoi, E.; Benezra, Y.; Malka, D. An ultracompact 3 × 1 MMI power-combiner based on Si slot-waveguide structures. Photon. Nanostruct. Fundam. Appl. 2020, 39, 100780. [Google Scholar] [CrossRef]
- Gindi, M.; Melamed, A.; Malka, D. A four green-light demultiplexer using a multi gallium nitride slot-waveguide structure. Photon. Nanostruct. Fundam. Appl. 2020, 42, 100855. [Google Scholar] [CrossRef]
- Li, J.; Nie, Z.; Liu, Y.; Wang, L.; Hao, Y. Evaluation of Propagation Characteristics Using the Human Body as an Antenna. Sensors 2017, 17, 2878. [Google Scholar] [CrossRef] [Green Version]
- Rahman, M.M.; Hosain, M.K.; Ahmed, S.; Al Azad, M.W. Investigation of Coil Designs for Transcranial Magnetic Stimula-tion on Realistic Head Model. In Proceedings of the 2017 IEEE Region 10 Humanitarian Technology Conference (R10-HTC), Dhaka, Bangladesh, 21–23 December 2017; pp. 279–283. [Google Scholar]
- Gajsek, P.; Walters, T.J.; Hurt, W.D.; Ziriax, J.M.; Nelson, D.A.; Mason, P.A. Empirical validation of SAR values predicted by FDTD modeling. Bioelectromagnetics 2001, 23, 37–48. [Google Scholar] [CrossRef] [PubMed]
- Collins, C.M.; Smith, M.B. Spatial resolution of numerical models of man and calculated specific absorption rate using the FDTD method: A study at 64 MHz in a magnetic resonance imaging coil. J. Magn. Reson. Imaging 2003, 18, 383–388. [Google Scholar] [CrossRef]
- Wang, Z.; Lin, J.C.; Vaughan, J.T.; Collins, C. Consideration of physiological response in numerical models of temperature during MRI of the human head. J. Magn. Reson. Imaging 2008, 28, 1303–1308. [Google Scholar] [CrossRef] [PubMed] [Green Version]
- Cole, K.S.; Cole, R.H. Dispersion and Absorption in Dielectrics I. Alternating Current Characteristics. J. Chem. Phys. 1941, 9, 341–351. [Google Scholar] [CrossRef] [Green Version]
- Gabriel, C. Compilation of the Dielectric Properties of Body Tissues at RF and Microwave Frequencies. Air Force Materiel Command, Brooks Air Force Base, Texas: AL/OE-TR- 1996-0037. 1996. Available online: https://apps.dtic.mil/sti/pdfs/ADA303903.pdf (accessed on 24 October 2021).
- Dz.U. 2019 poz. 2448. Rozporządzenie Ministra Zdrowia z Dnia 17 Grudnia 2019 r. w Sprawie Dopuszczalnych Poziomów pól Elektromagnetycznych w Środowisku. Dziennik Ustaw, 19 December 2019.
- Mannaa, Y.; Aldhaheri, R. Dual-Band Frequency Selective Surface for GSM Shielding in Modern Buildings. Aljouf Univ. Sci. Eng. J. AUSEJ 2017, 4, 12–17, ISSN: 1658-6670. [Google Scholar]
- Koohestani, M.; Perdriau, R.; Ramdani, M.; Carlsson, J. Frequency Selective Surfaces for Electromagnetic Shielding of Pocket-Sized Transceivers. IEEE Trans. Electromagn. Compat. 2020, 62, 2785–2792. [Google Scholar] [CrossRef]
- Stoppa, M.; Chiolerio, A. Wearable Electronics and Smart Textiles: A Critical Review. Sensors 2014, 14, 11957–11992. [Google Scholar] [CrossRef] [PubMed] [Green Version]
- Kim, J.; Kang, W.; Kim, K. A resistive dipole antenna excited by an impulse generator for ultra-wideband radar applications. In Proceedings of the 2010 IEEE Antennas and Propagation Society International Symposium, Toronto, ON, Canada, 11–17 July 2010; pp. 1–4. [Google Scholar] [CrossRef]


| L (mm) | σ (S/m) | S (W/m2) |
|---|---|---|
| 30 | 200 | 6.5 |
| 30 | 500 | 7.2 |
| 30 | 1000 | 7.6 |
| 47 | 200 | 0.68 |
| 47 | 500 | 0.47 |
| 47 | 1000 | 0.52 |
| 60 | 200 | 3.03 |
| 60 | 500 | 3.33 |
| 60 | 1000 | 3.5 |
| φ Angle (◦) | SAR Parameter | SAR Value No Shield (W/kg) | SAR Value Metal Surface Shield (W/kg) |
|---|---|---|---|
| 0 | 10 g averaged, maximum | 0.51 | 0.72 |
| 0 | 10 g averaged, average | 0.084 | 0.058 |
| 0 | 1 g averaged, maximum | 0.6 | 0.92 |
| 0 | 1 g averaged, average | 0.084 | 0.058 |
| 90 | 10 g averaged, maximum | 0.425 | 0.488 |
| 90 | 10 g averaged, average | 0.083 | 0.04 |
| 90 | 1 g averaged, maximum | 0.59 | 1.66 |
| 90 | 1 g averaged, average | 0.083 | 0.04 |
| 180 | 10 g averaged, maximum | 0.344 | 1.0 |
| 180 | 10 g averaged, average | 0.082 | 0.038 |
| 180 | 1 g averaged, maximum | 0.634 | 3.58 |
| 180 | 1 g averaged, average | 0.082 | 0.038 |
| φ Angle (◦) | SAR Parameter | SAR No Shield (W/kg) | SAR Metal Surface Shield (W/kg) | SAR Wire Shield (W/kg) |
|---|---|---|---|---|
| 0 | 10 g averaged, maximum | 0.454 | 0.45 | 0.45 |
| 0 | 10 g averaged, average | 0.032 | 0.024 | 0.025 |
| 0 | 1 g averaged, maximum | 1.02 | 1 | 1 |
| 0 | 1 g averaged, average | 0.32 | 0.024 | 0.024 |
| 90 | 10 g averaged, maximum | 0.33 | 0.53 | 0.3 |
| 90 | 10 g averaged, average | 0.04 | 0.019 | 0.023 |
| 90 | 1 g averaged, maximum | 0.85 | 1.18 | 0.63 |
| 90 | 1 g averaged, average | 0.04 | 0.019 | 0.023 |
| 180 | 10 g averaged, maximum | 0.25 | 0.3 | 0.27 |
| 180 | 10 g averaged, average | 0.037 | 0.02 | 0.025 |
| 180 | 1 g averaged, maximum | 0.48 | 0.55 | 0.53 |
| 180 | 1 g averaged, average | 0.037 | 0.02 | 0.025 |
| t (ns) | E (V/m) |
|---|---|
| 0.5 | 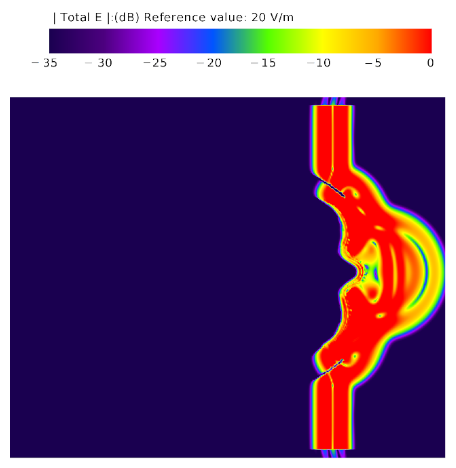 |
| 0.9 | 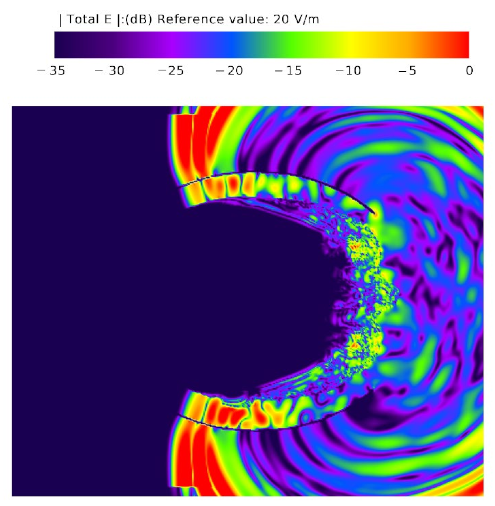 |
| 1.5 | 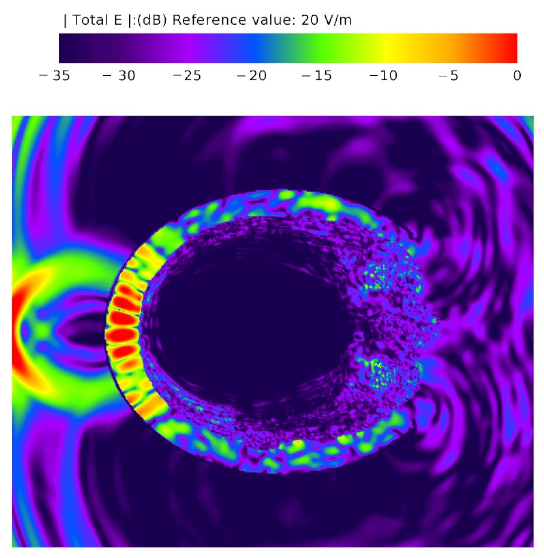 |
| 2 | 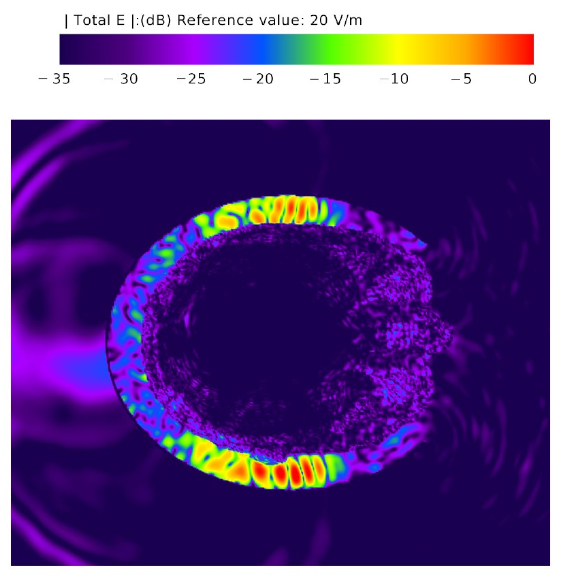 |
| 2.5 |  |
| 3 |  |
Publisher’s Note: MDPI stays neutral with regard to jurisdictional claims in published maps and institutional affiliations. |
© 2021 by the author. Licensee MDPI, Basel, Switzerland. This article is an open access article distributed under the terms and conditions of the Creative Commons Attribution (CC BY) license (https://creativecommons.org/licenses/by/4.0/).
Share and Cite
Januszkiewicz, Ł. Analysis of Shielding Properties of Head Covers Made of Conductive Materials in Application to 5G Wireless Systems. Energies 2021, 14, 7004. https://doi.org/10.3390/en14217004
Januszkiewicz Ł. Analysis of Shielding Properties of Head Covers Made of Conductive Materials in Application to 5G Wireless Systems. Energies. 2021; 14(21):7004. https://doi.org/10.3390/en14217004
Chicago/Turabian StyleJanuszkiewicz, Łukasz. 2021. "Analysis of Shielding Properties of Head Covers Made of Conductive Materials in Application to 5G Wireless Systems" Energies 14, no. 21: 7004. https://doi.org/10.3390/en14217004
APA StyleJanuszkiewicz, Ł. (2021). Analysis of Shielding Properties of Head Covers Made of Conductive Materials in Application to 5G Wireless Systems. Energies, 14(21), 7004. https://doi.org/10.3390/en14217004