
Injection Treatment for Tunneling Excavation in Sandy Soils with High Fines Content


 and
and
Abstract
1. Introduction
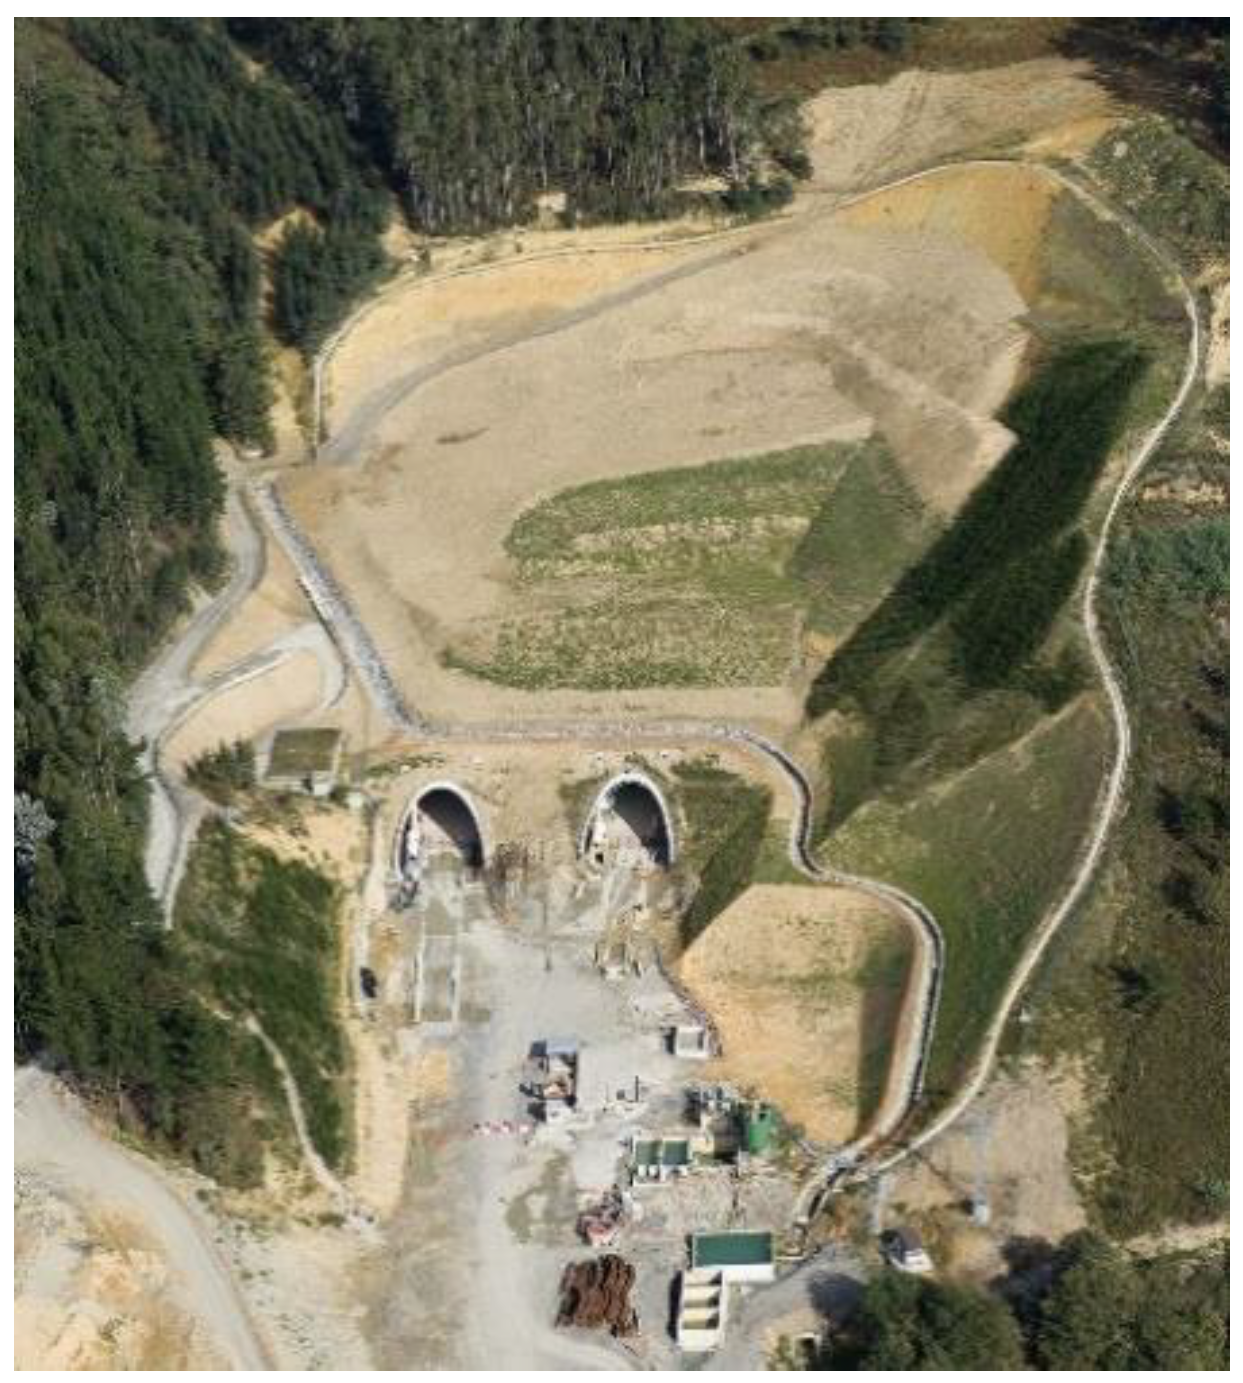
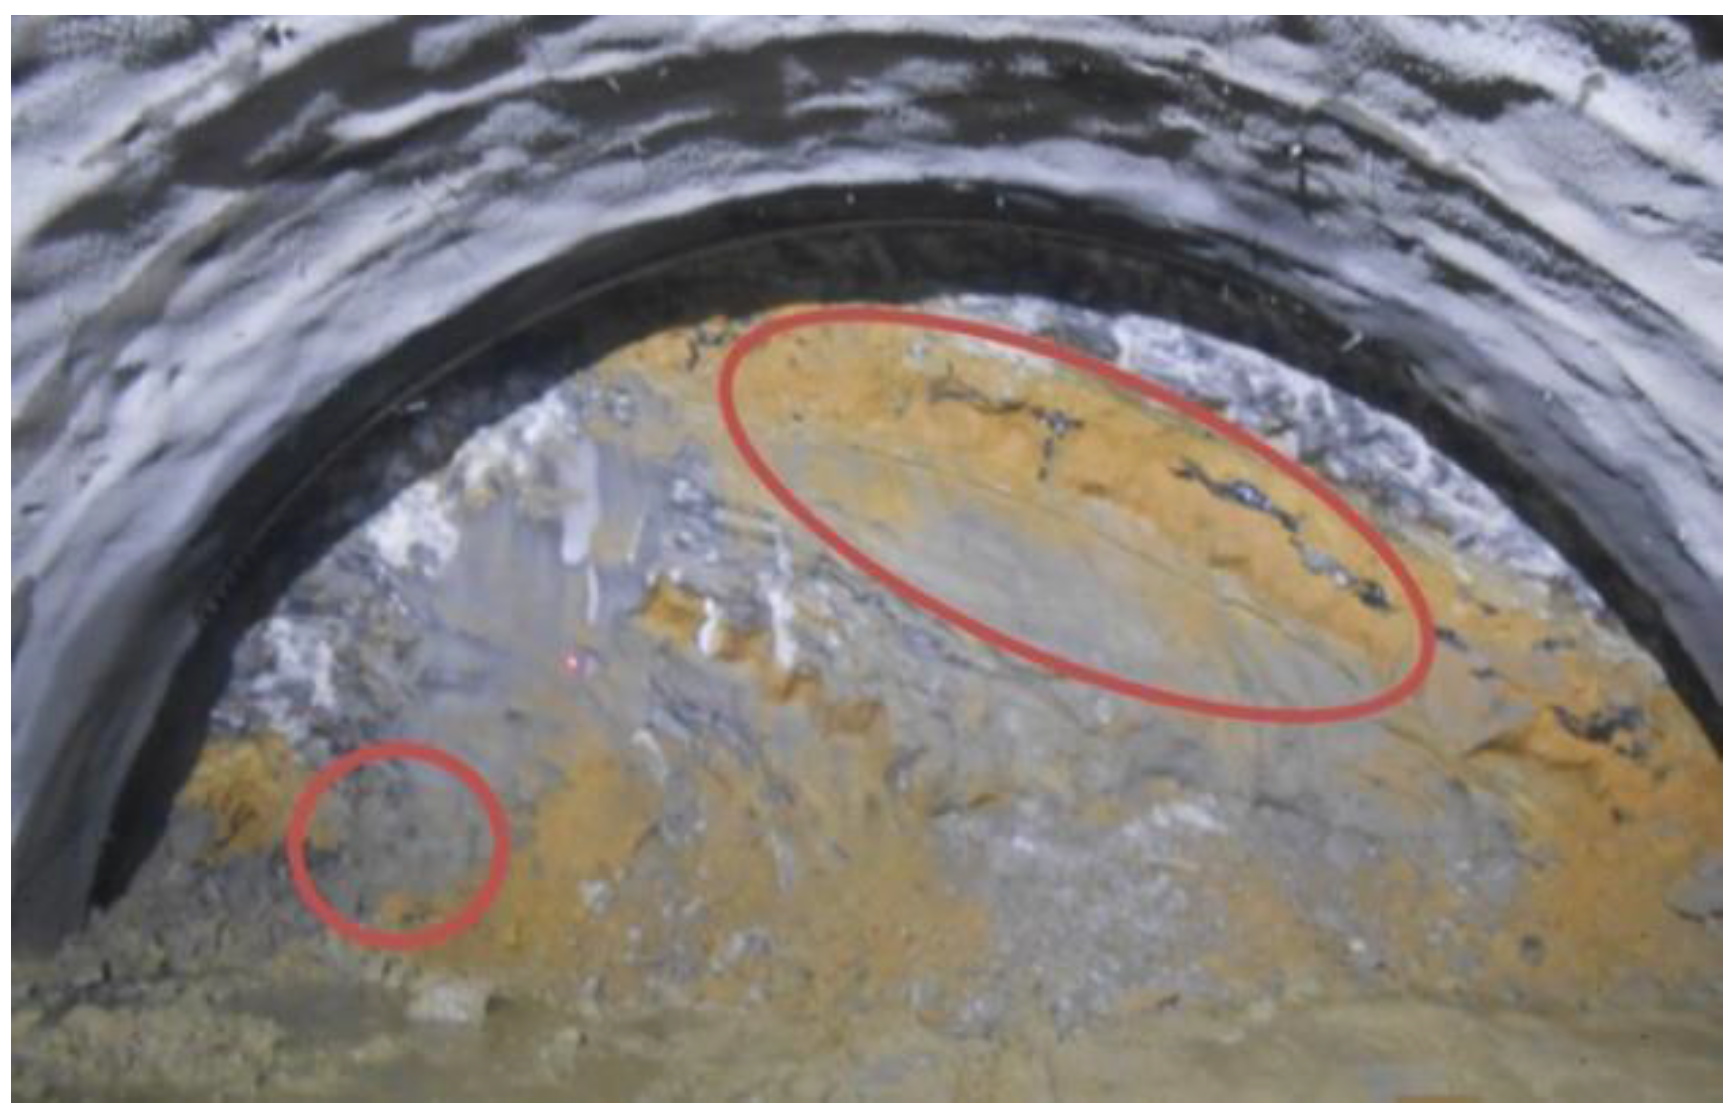
2. Description of the Problem
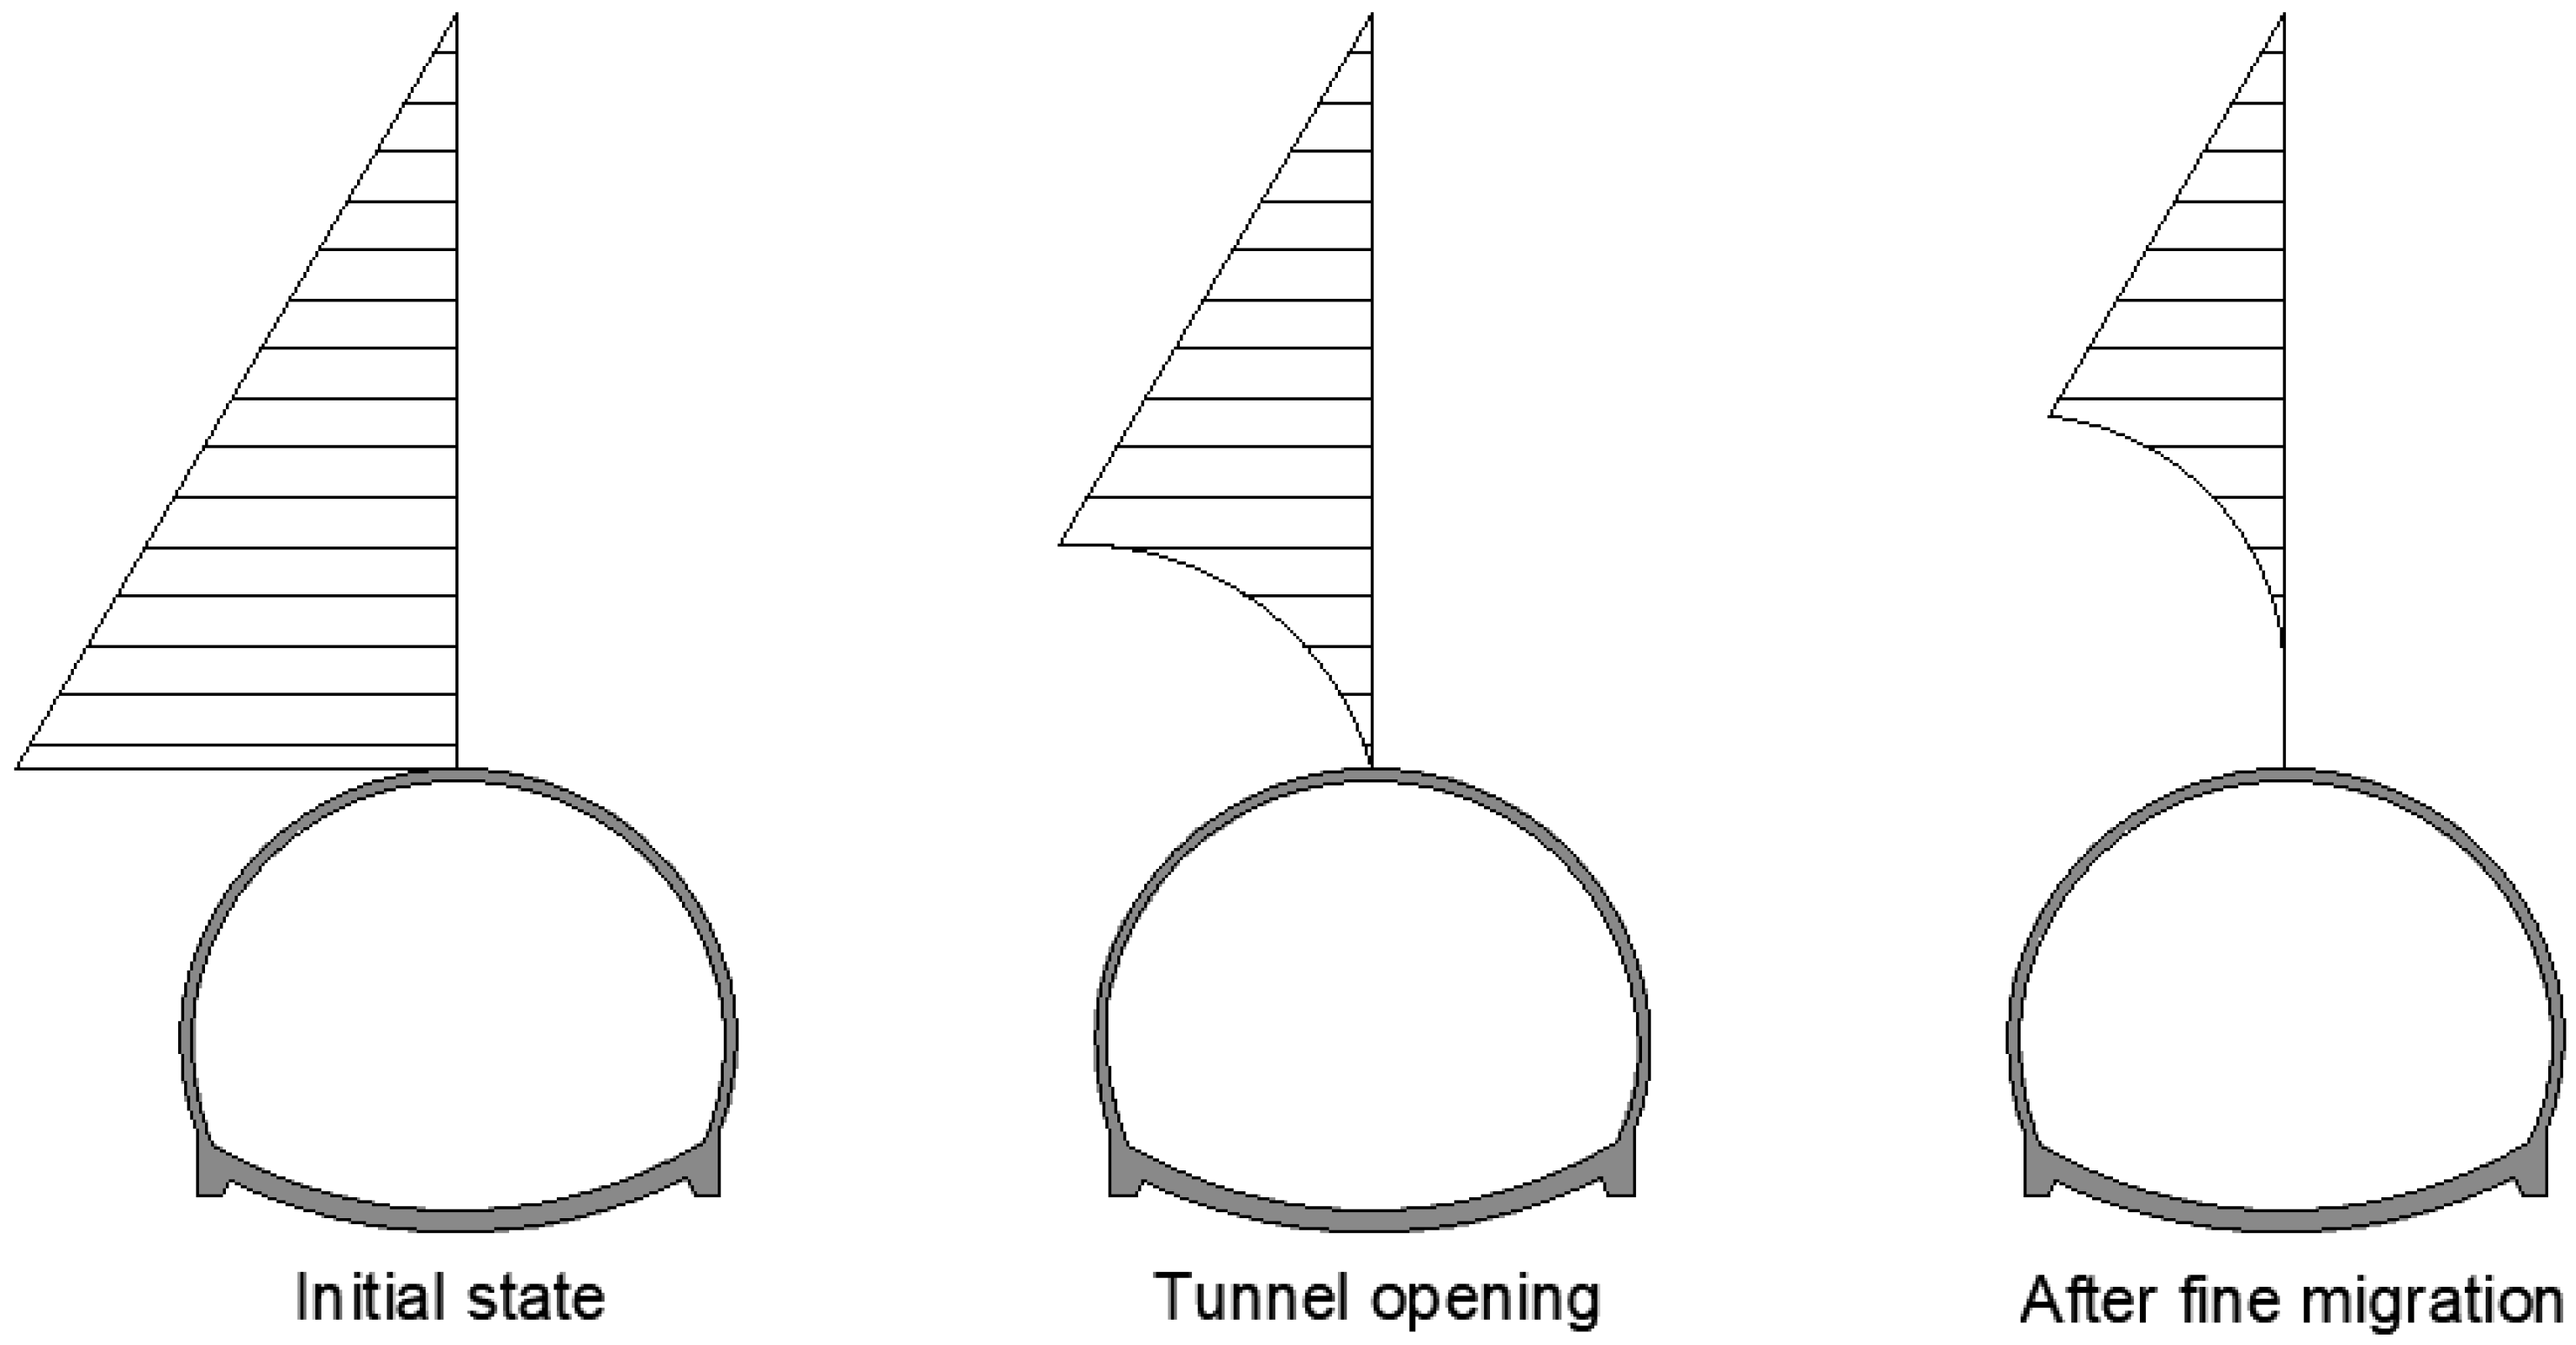
- In the initial state, at the tunnel level, the hydrostatic pressure at a point is defined by (1).
- When a section of the tunnel is opened, the pressure on the roof is zero, while the pressure around the tunnel follows the expression of (1), generating a very high pressure gradient. This gradient causes a higher flow rate which facilitates the migration of the finer sands and, therefore, an increase in the permeability of the sands in the vicinity of the tunnel.
- Once most of the fine sands are migrated, the pressure gradient rises successively, which causes the sands at higher elevations to increase their permeability, leading to a progression of the phenomenon.
3. Methodology
3.1. Recognition of the Rock Mass
- In the first group of materials, the fundamental series consists of grey massive marls, grey leafy shales, somewhat micaceous, and micritic and massive limestones of a dark grey to blackish color with fine alternations of tabular banks. It is a material that is considered practically impermeable due to effective porosity and semi-permeable due to fracturing or surface alteration.
- The sandstone and microconglomerate banks are decametric to metric in thickness and alternate with impermeable shale levels. They consist of sandstones with a highly variable percentage of carbonate cement and a silty-clay matrix with a massive or finely laminated structure. Their permeability is high due to fissuring and alteration, but is also associated with a secondary porosity generated by washing and dissolution of calcareous cement, decomposing into sandy levels (sometimes coarse) with percentages of fines between 40 and 70%. This high permeability is what causes the high water flows in the tunnel sections that cross the aquifer and the lowering of the water table of the aquifer.
3.2. Selection of the Material to Be Injected
- Grouts of cement CEM II/B-M (V-L) 32.5R, with particle size less than 65 microns, Blaine grinding surface between 350 and 600 m2/kg, and settlements of less than 4%. In addition, superplasticising additives are used to increase fluidity and facilitate grouting, as well as accelerators to speed up setting. The w/c ratios considered are between 0.5 and 0.7 and the most representative properties of the grouts are given in Table 1, including viscosity with the Marsh Cone [28], setting time and seven-day simple compressive strength.
- Microcement grouts with a penetrability superior to cement injections, a particle size less than 32 microns, a Blaine grinding surface greater than 1000 m2/kg and a w/c ratio of 1.5. To ensure that the fine particles of the microcement do not agglutinate and form larger clusters that reduce their penetration capacity, dispersants are added. In addition, and in order to avoid migration of the grout, it must have the shortest possible setting time. For the selection of the microcement, the properties of different commercial microcements such as wet bulk density, water exudation, setting time, viscosity with the Marsh Cone, and seven-day compressive strength are analysed. Table 2 shows the results of these analyses for two micro-cements with two maximum particle sizes (12 and 32 microns). The microcement with a particle size of 32 microns stands out, with lower viscosity and higher compressive strength. Therefore, this will be the microcement selected to carry out the injections.
3.3. Laboratory Tests
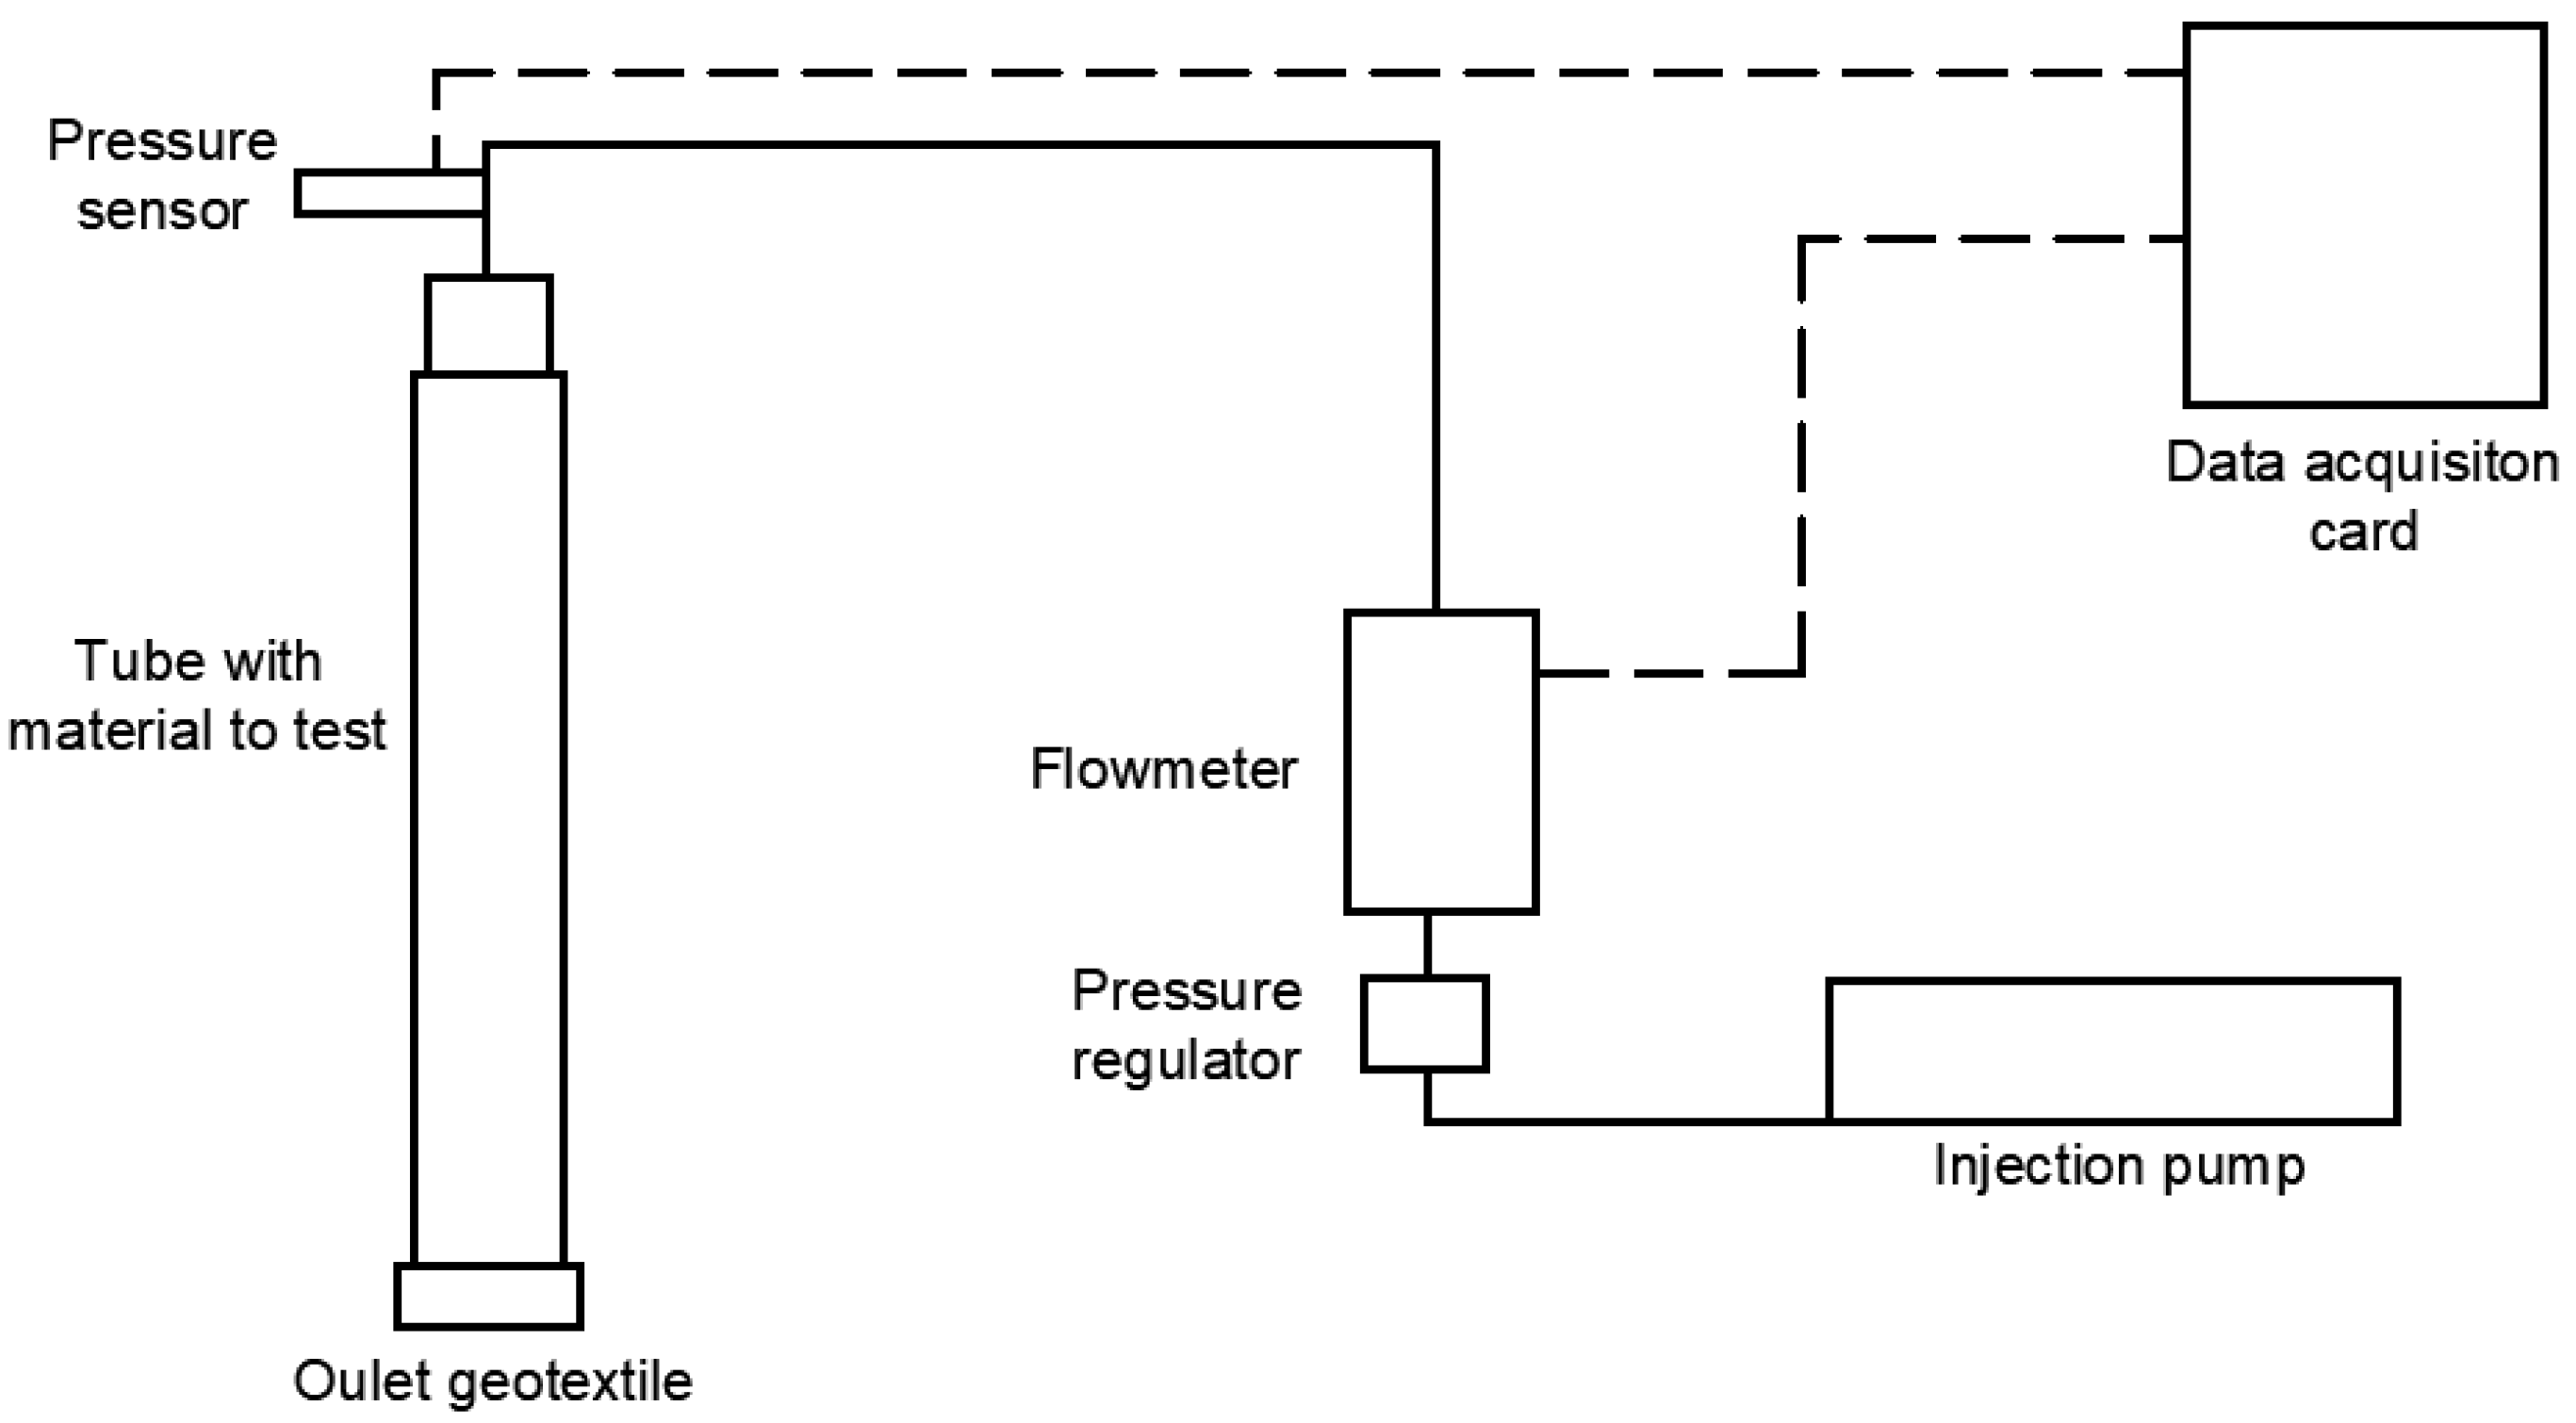
3.3.1. Test Equipment
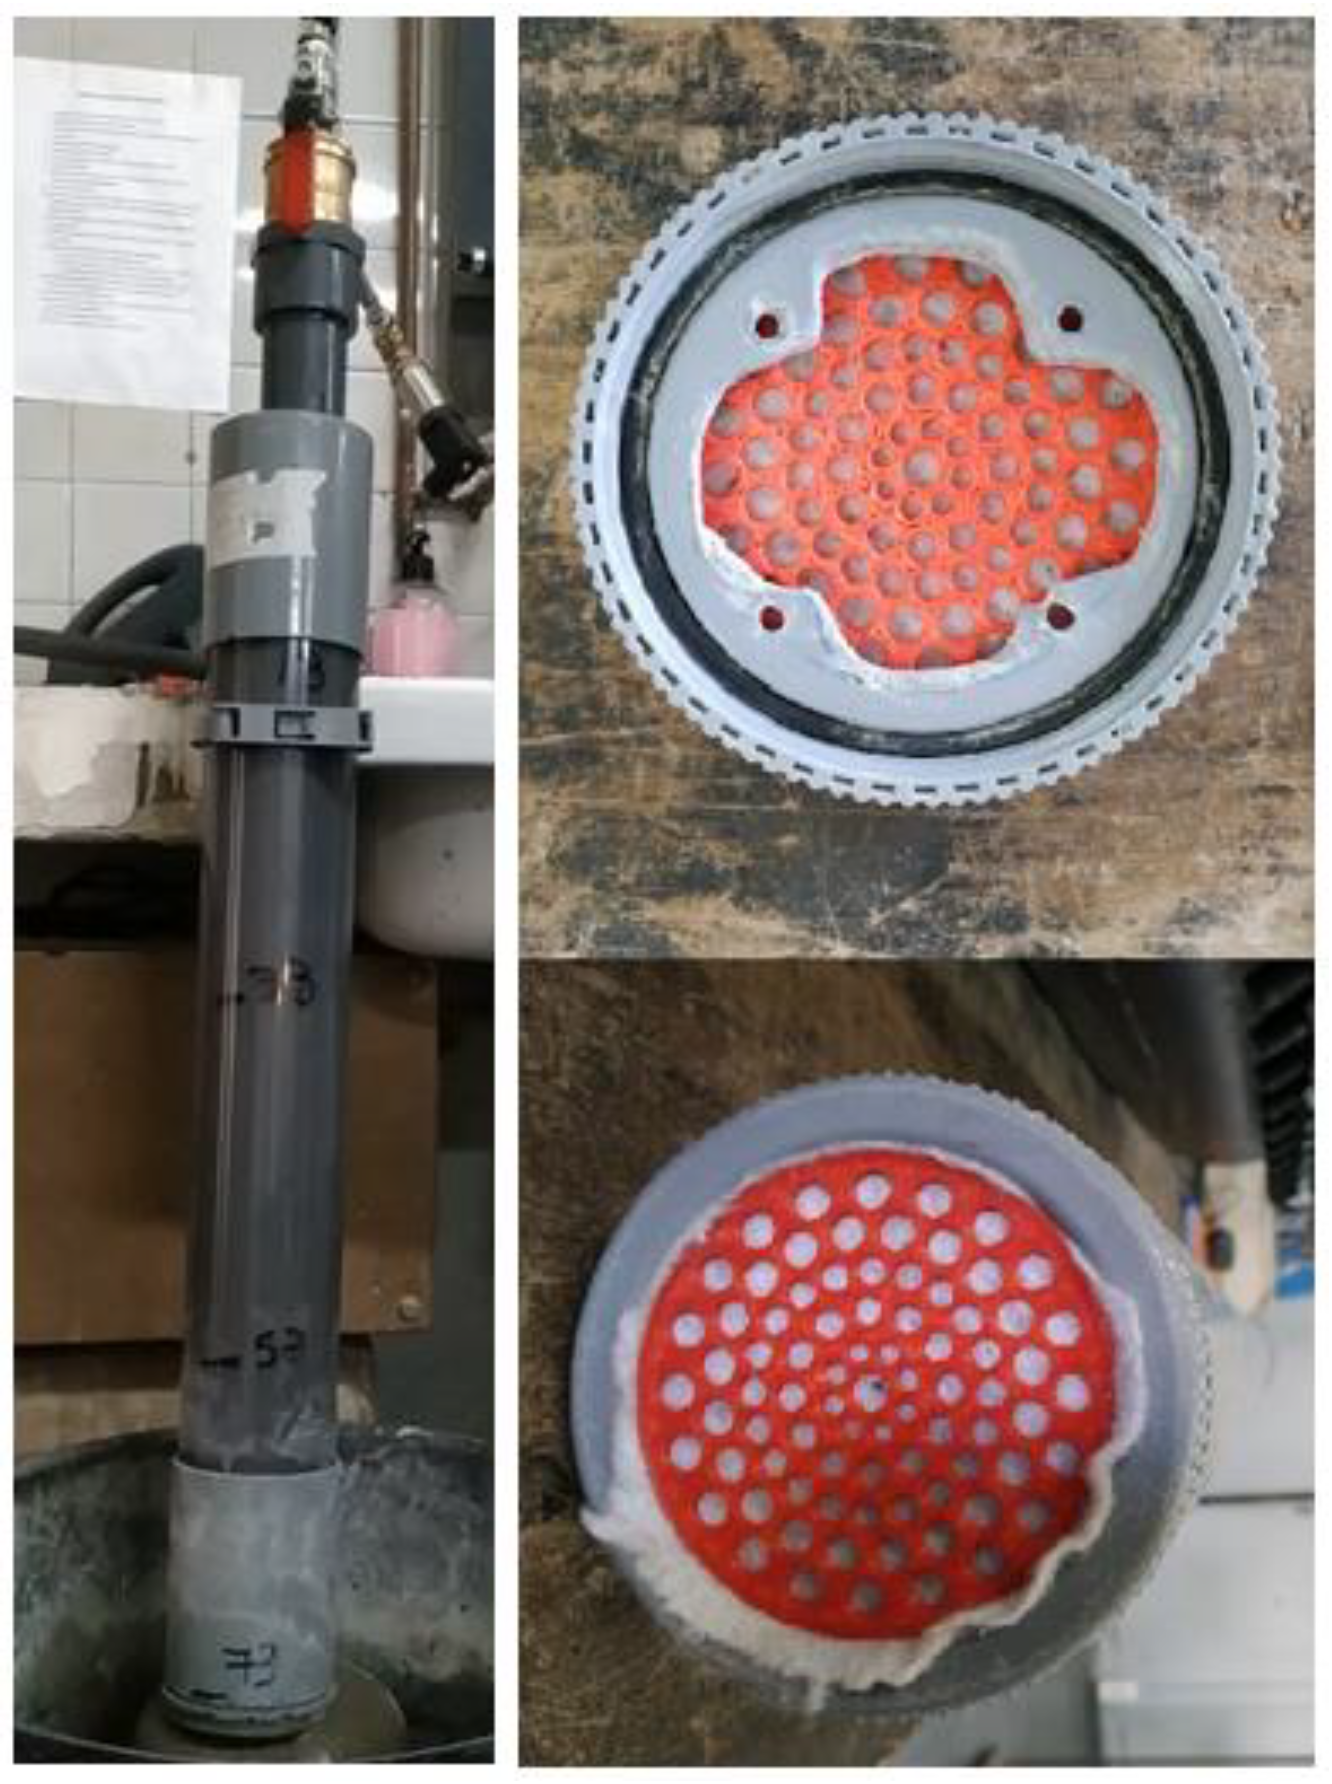
- A transparent PVC glass tube, 90 mm in diameter and 1 m long. In its upper part, it has a head and a key that allows the tube to be connected to the injection circuit. At the bottom, it has a coupling that allows the insertion of a 150 kg/m2 geotextile, which acts as a filter to prevent the material from leaving. The geotextile is placed between two custom-designed pieces manufactured using a 3D printer, which allow the geotextile to be perfectly fixed to the mouth of the tube (Figure 5);
- An IFM SM7000 magneto-inductive flowmeter, which can record flow rates from 0.2 to 30 L/min;
- A pressure sensor with a 2 MPa full scale and a protective membrane, so that the grout does not come into direct contact with the sensor and damage it;
- A pressure regulator which, by means of a screw, allows the circuit to be set to a fixed pressure over time;
- A Comet Systems MS6D Data Logger data acquisition card, which records the analogue signals from the different sensors every second, stores the data in its card memory and then downloads and exports them to an Excel file for further processing and analysis;
- An auxiliary circuit formed by the set of pipes and couplings that allows the correct assembly of all the aforementioned elements and the circulation of the fluids to be injected from the feeding point;
- A Desol PowerInject SP20 injection pump that supplies the fluid with energy, in the form of pressure, to circulate through the soil sample. It is a screw pump that allows a maximum pressure of 1.5 MPa, and a variable flow rate of 1.5–13.5 L/min.
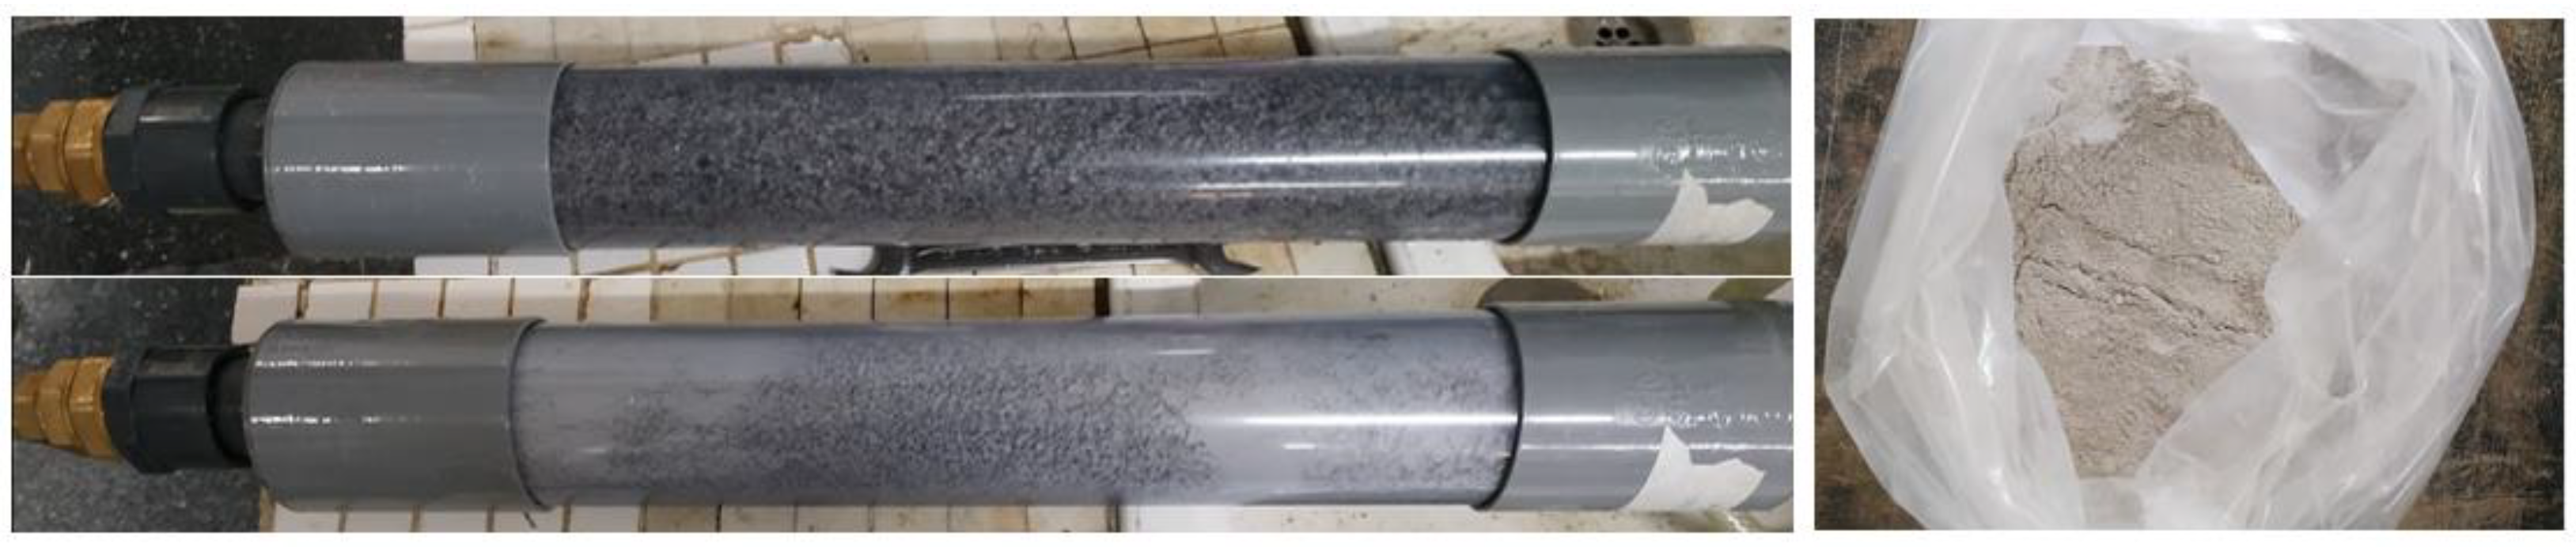
3.3.2. Analysis of Fines Migration and Washing
- The first test is carried out with approximately 5 kg of soil composed of two different fractions (>2 mm; 0.063–0.250 mm). After a first washing, 0.537 kg of fine material are collected, i.e., 10.3% of the total material and 41% of the finer sands. A second wash is then carried out with the material still remaining in the tube, in which another 0.031 kg of fine material are collected. In other words, of the finest fraction introduced into the tube, 50% is migrated in just 2 min with a hydraulic gradient of 0.5 MPa (Table 4).
- In the second test, the coarser fraction (>2 mm) is replaced by a fraction with a smaller granulometry (0.5–2 mm). However, no migration is observed for hydraulic gradients of 0.5 MPa and 0.9 MPa (i.e., the initial permeability of these materials is so low that the flow rate cannot move the fines).
- In the third test, the migration of an intermediate soil between the two previous tests is analysed and, its effect on permeability is studied. Four washes of 1 min each are carried out, subjecting the tube to a pressure of 0.5 MPa between each wash. Table 5 shows that, of the fine fraction, 82.29% remains inside the tube, while the rest leaves with the outlet effluent.
- A fourth test is carried out with the same granulometric fractions as in the previous test, but varying the percentages of these fractions. 4 washes of 1 min are carried out with hydraulic gradients of 0.5 MPa between each wash. Table 6 shows that, of the fine fraction, 72.83% remains inside the tube while the rest is extracted in the outlet effluent.
3.3.3. Analysis of Re-Injection
4. Proposed Solution
- Achieve a strip of “improved” ground with a minimum thickness of 3 m around the perimeter of the excavation to ensure the stability of the tunnel during its execution;
- Reduce the permeability until water infiltration from the tunnel does not exceed the maximum flow that can be withdrawn without significantly affecting the upper aquifer, which according to previous hydrological studies is 3 L/s.
4.1. Preinjection
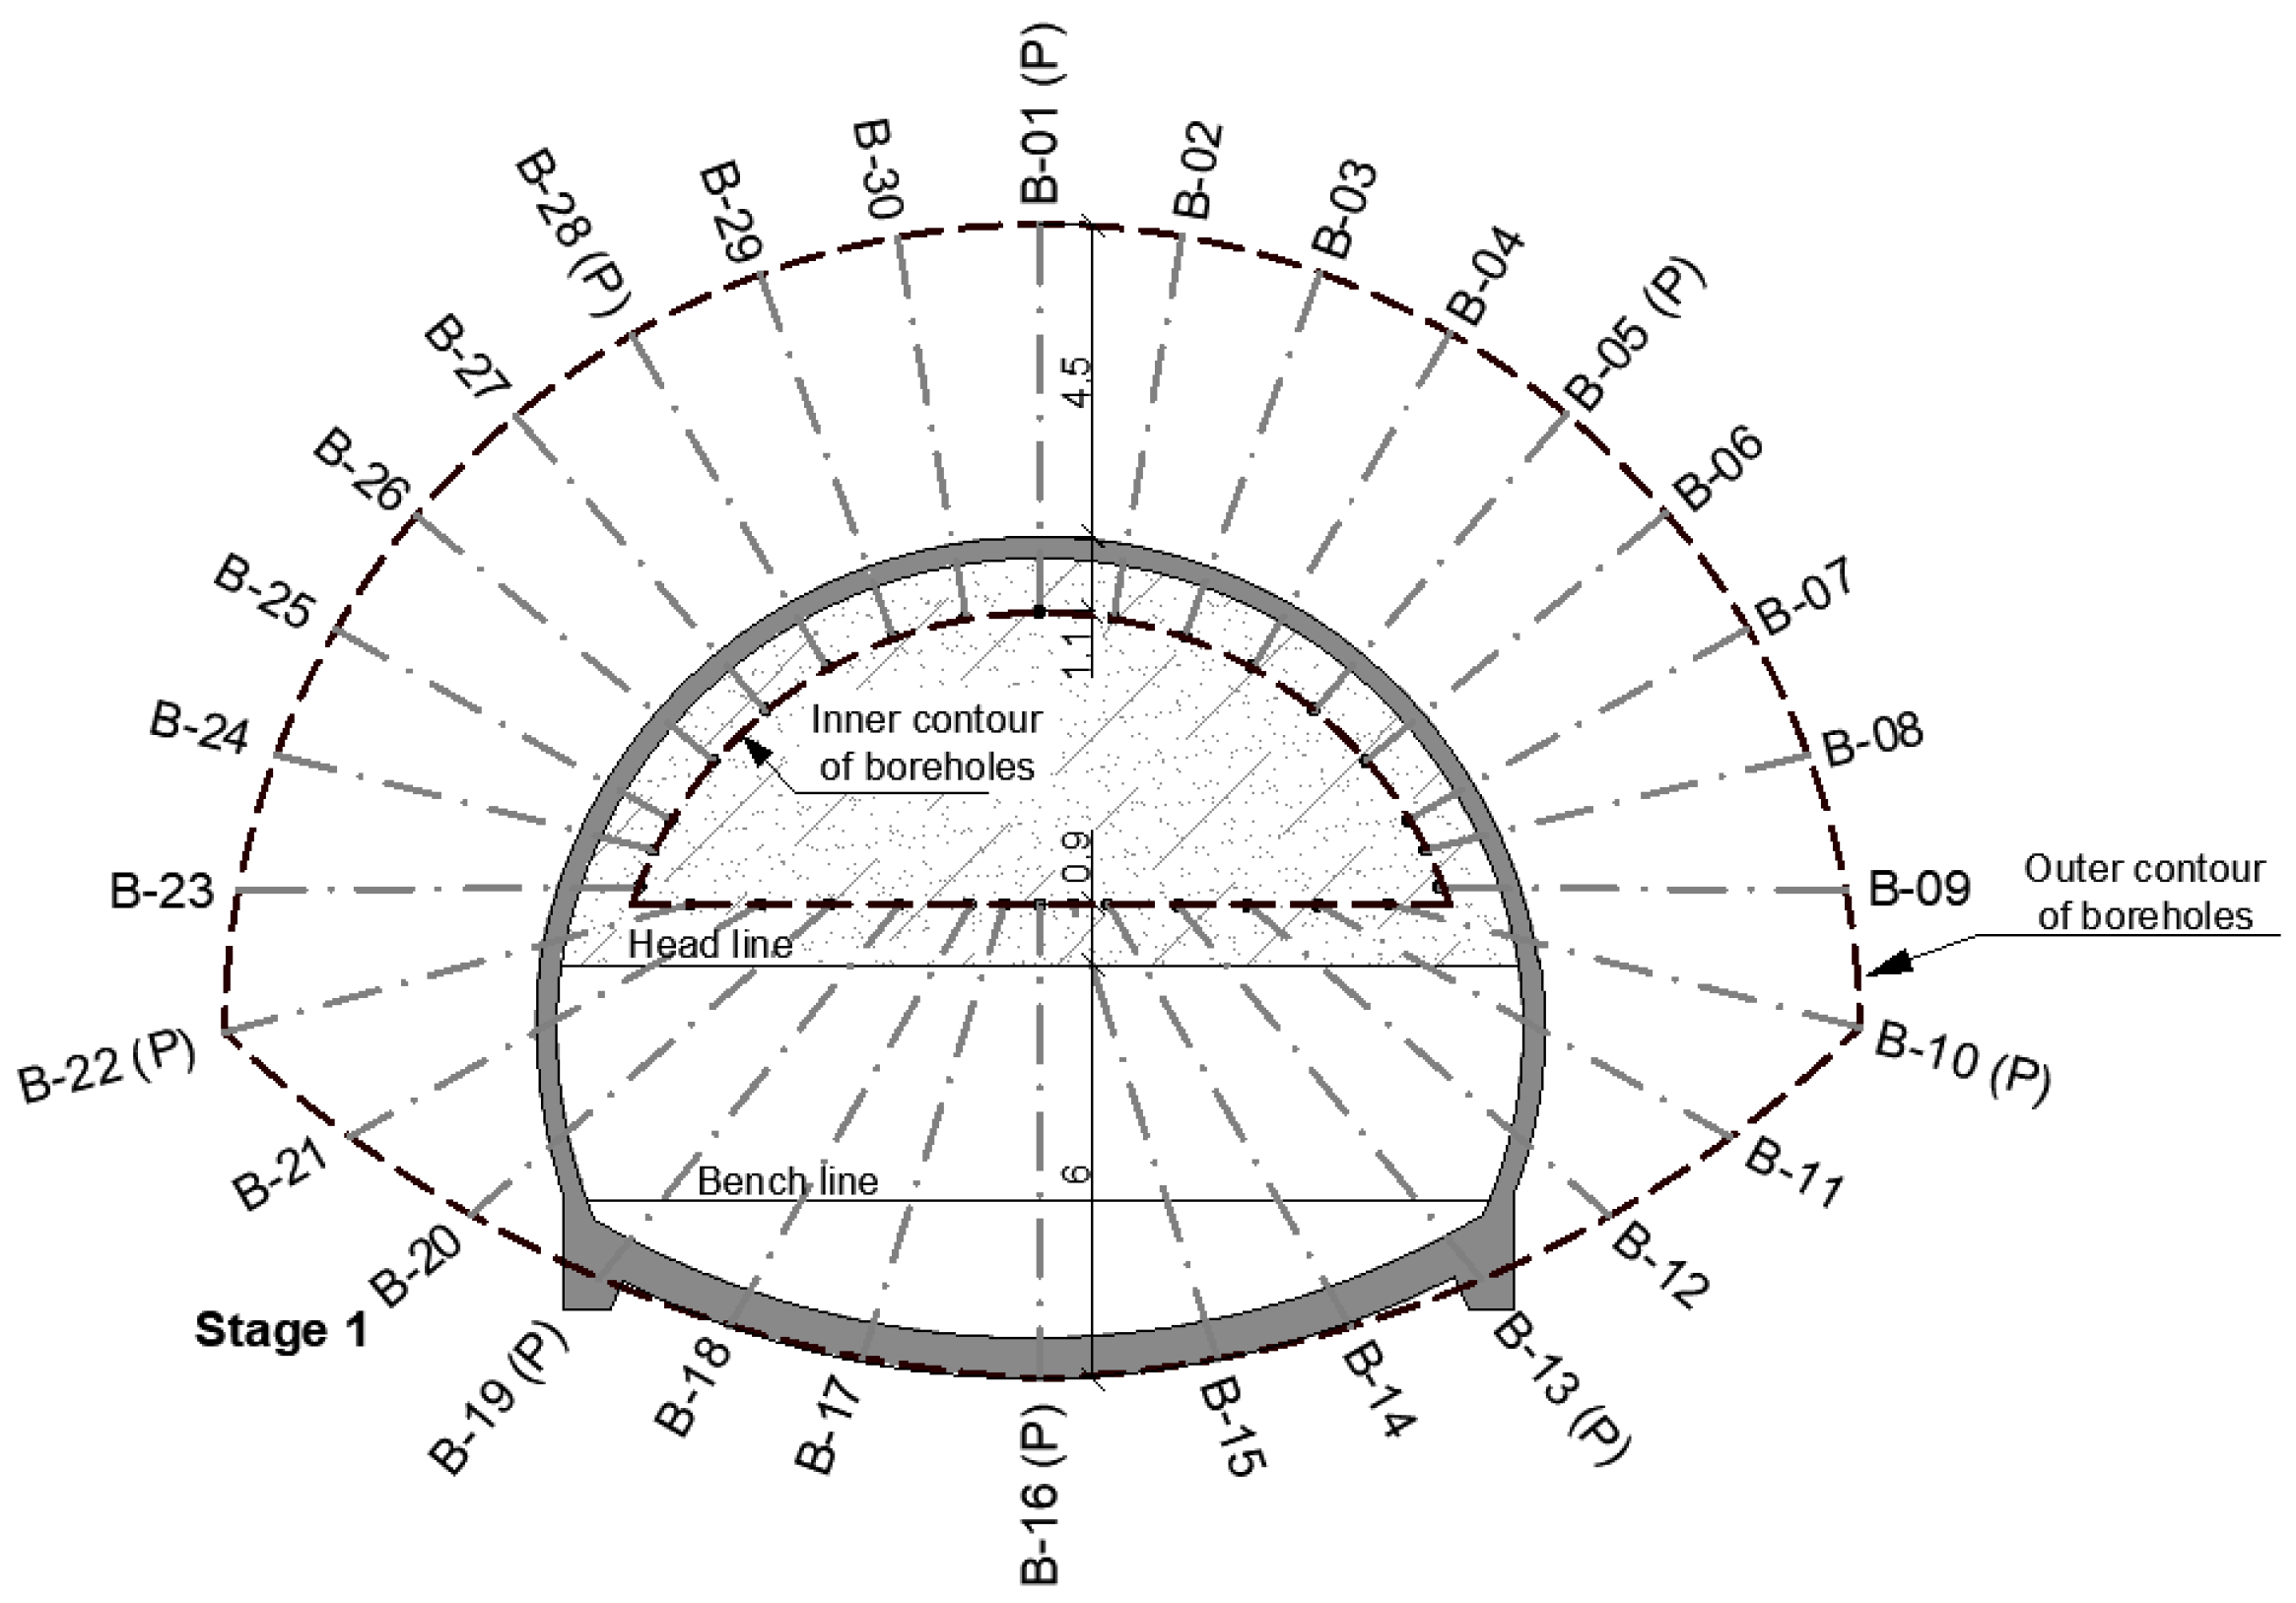
4.1.1. Stage 1 in the Top Heading
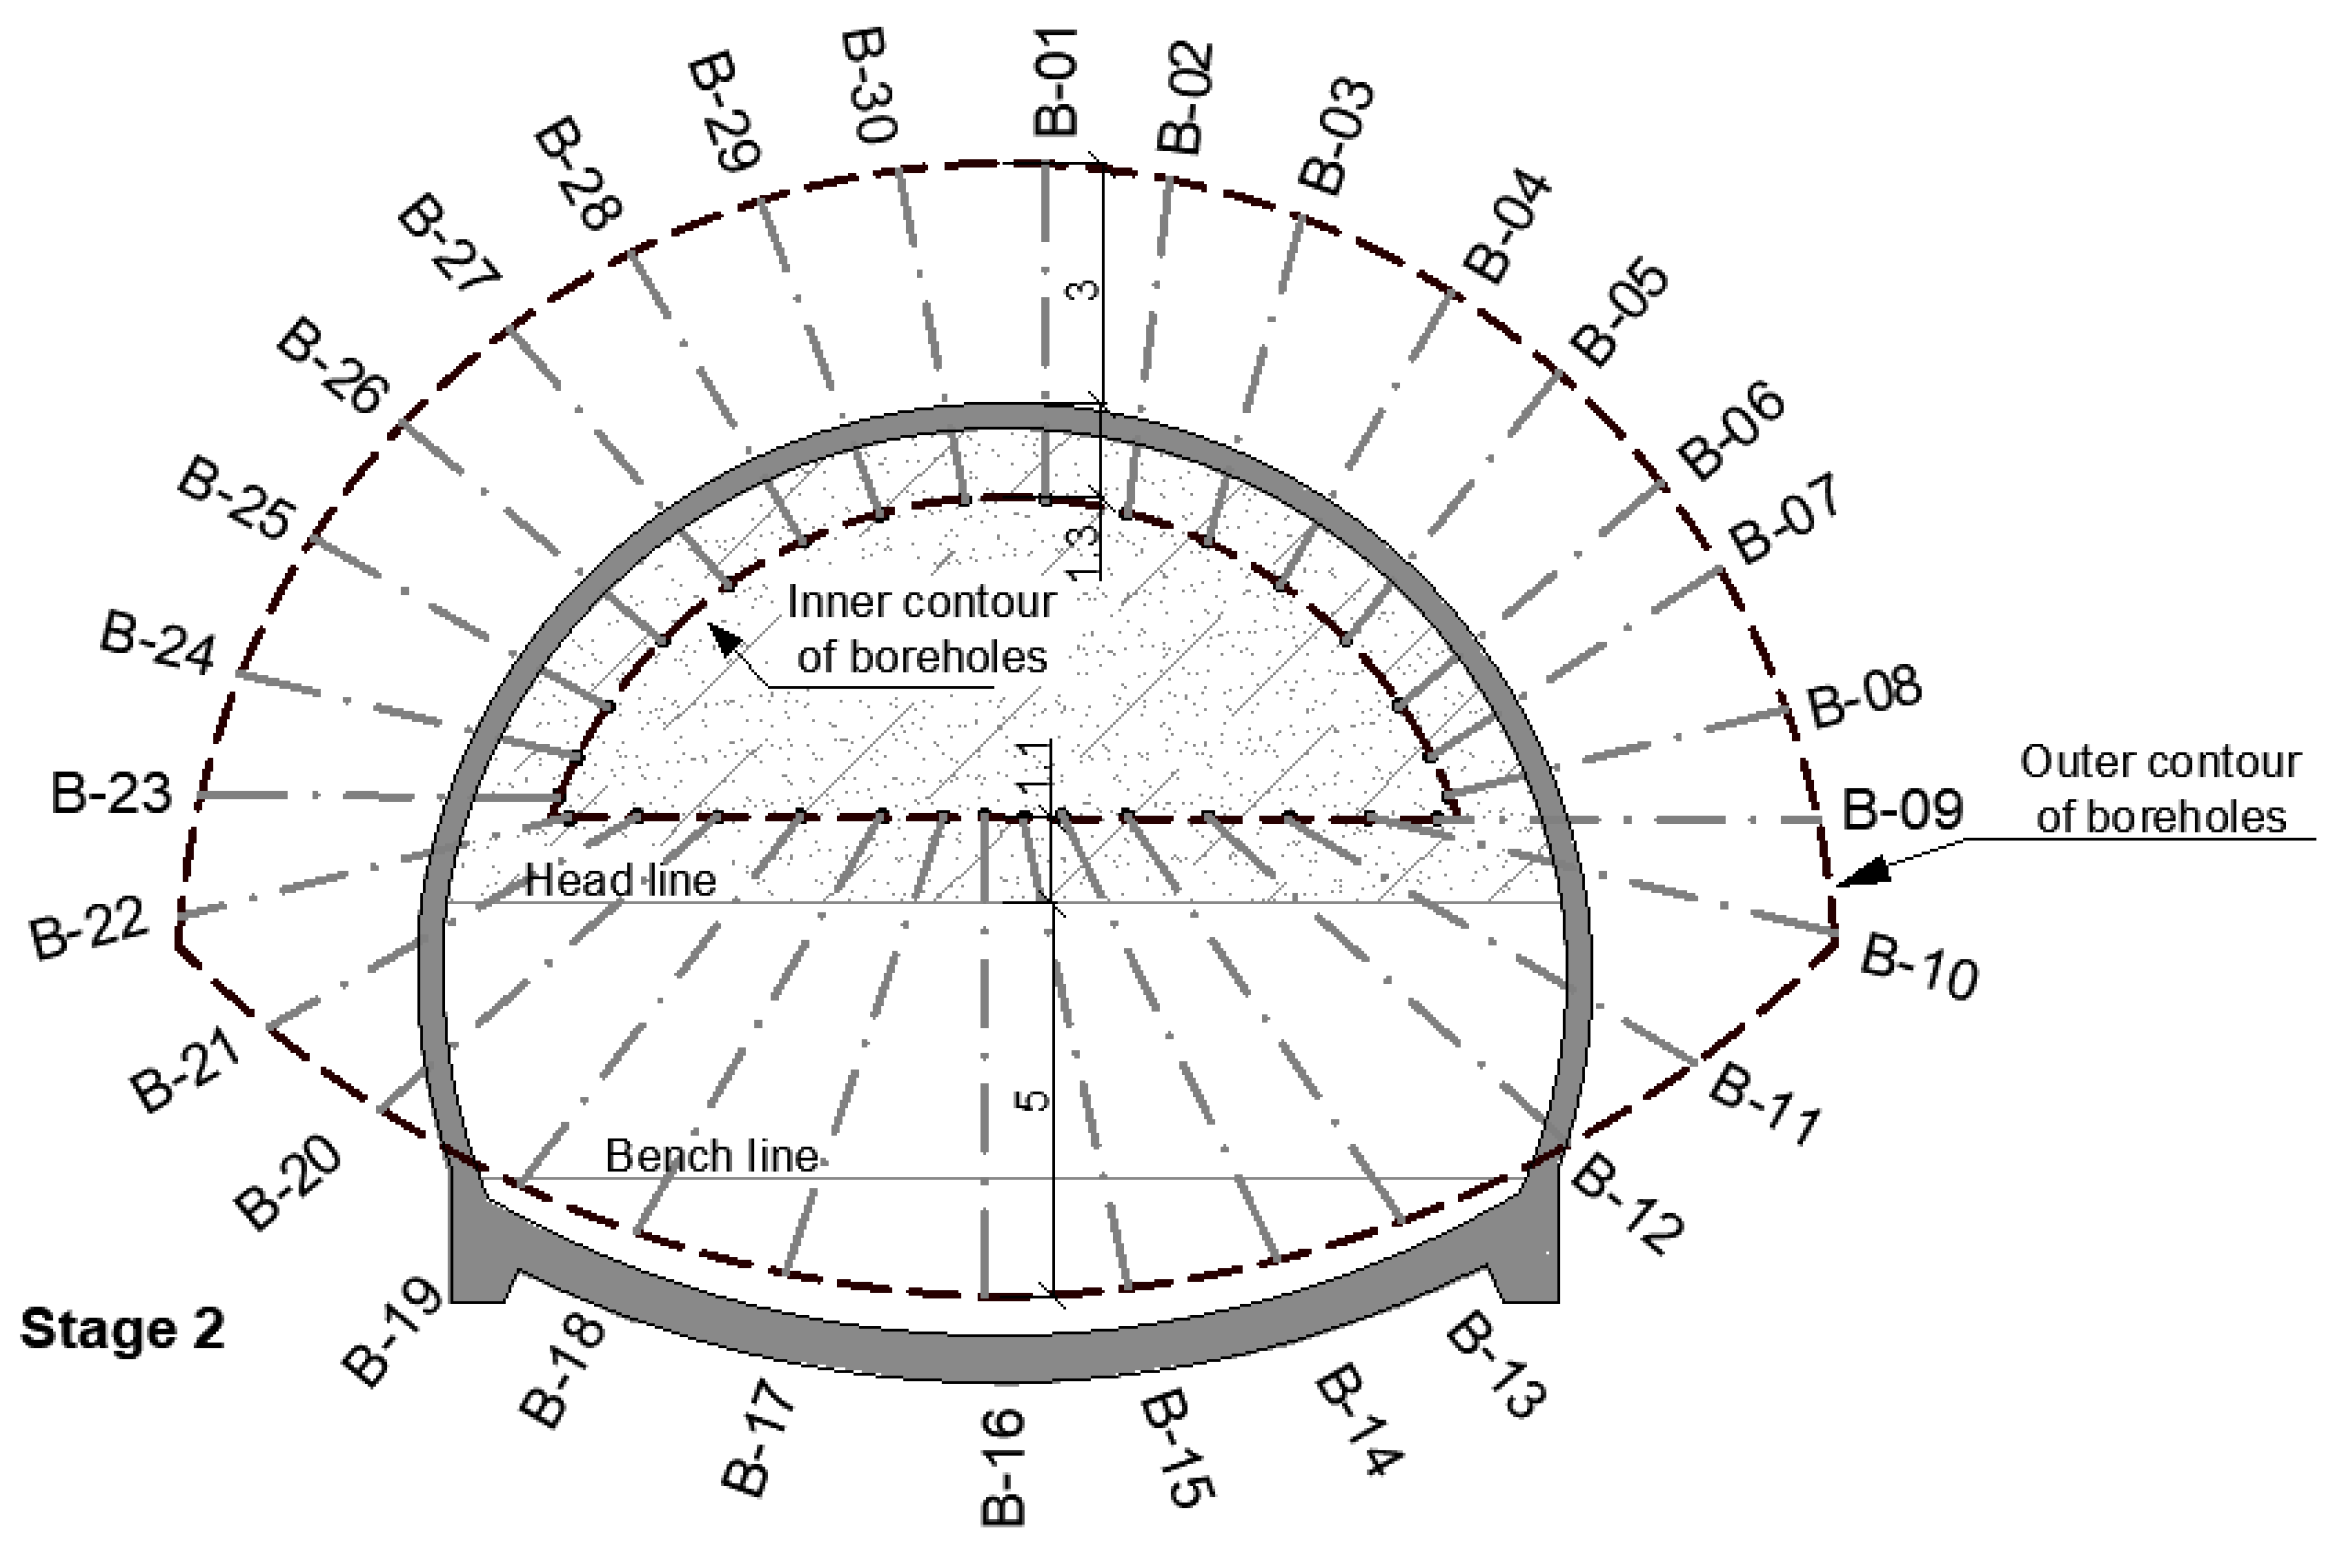
4.1.2. Stage 2 in the Top Heading
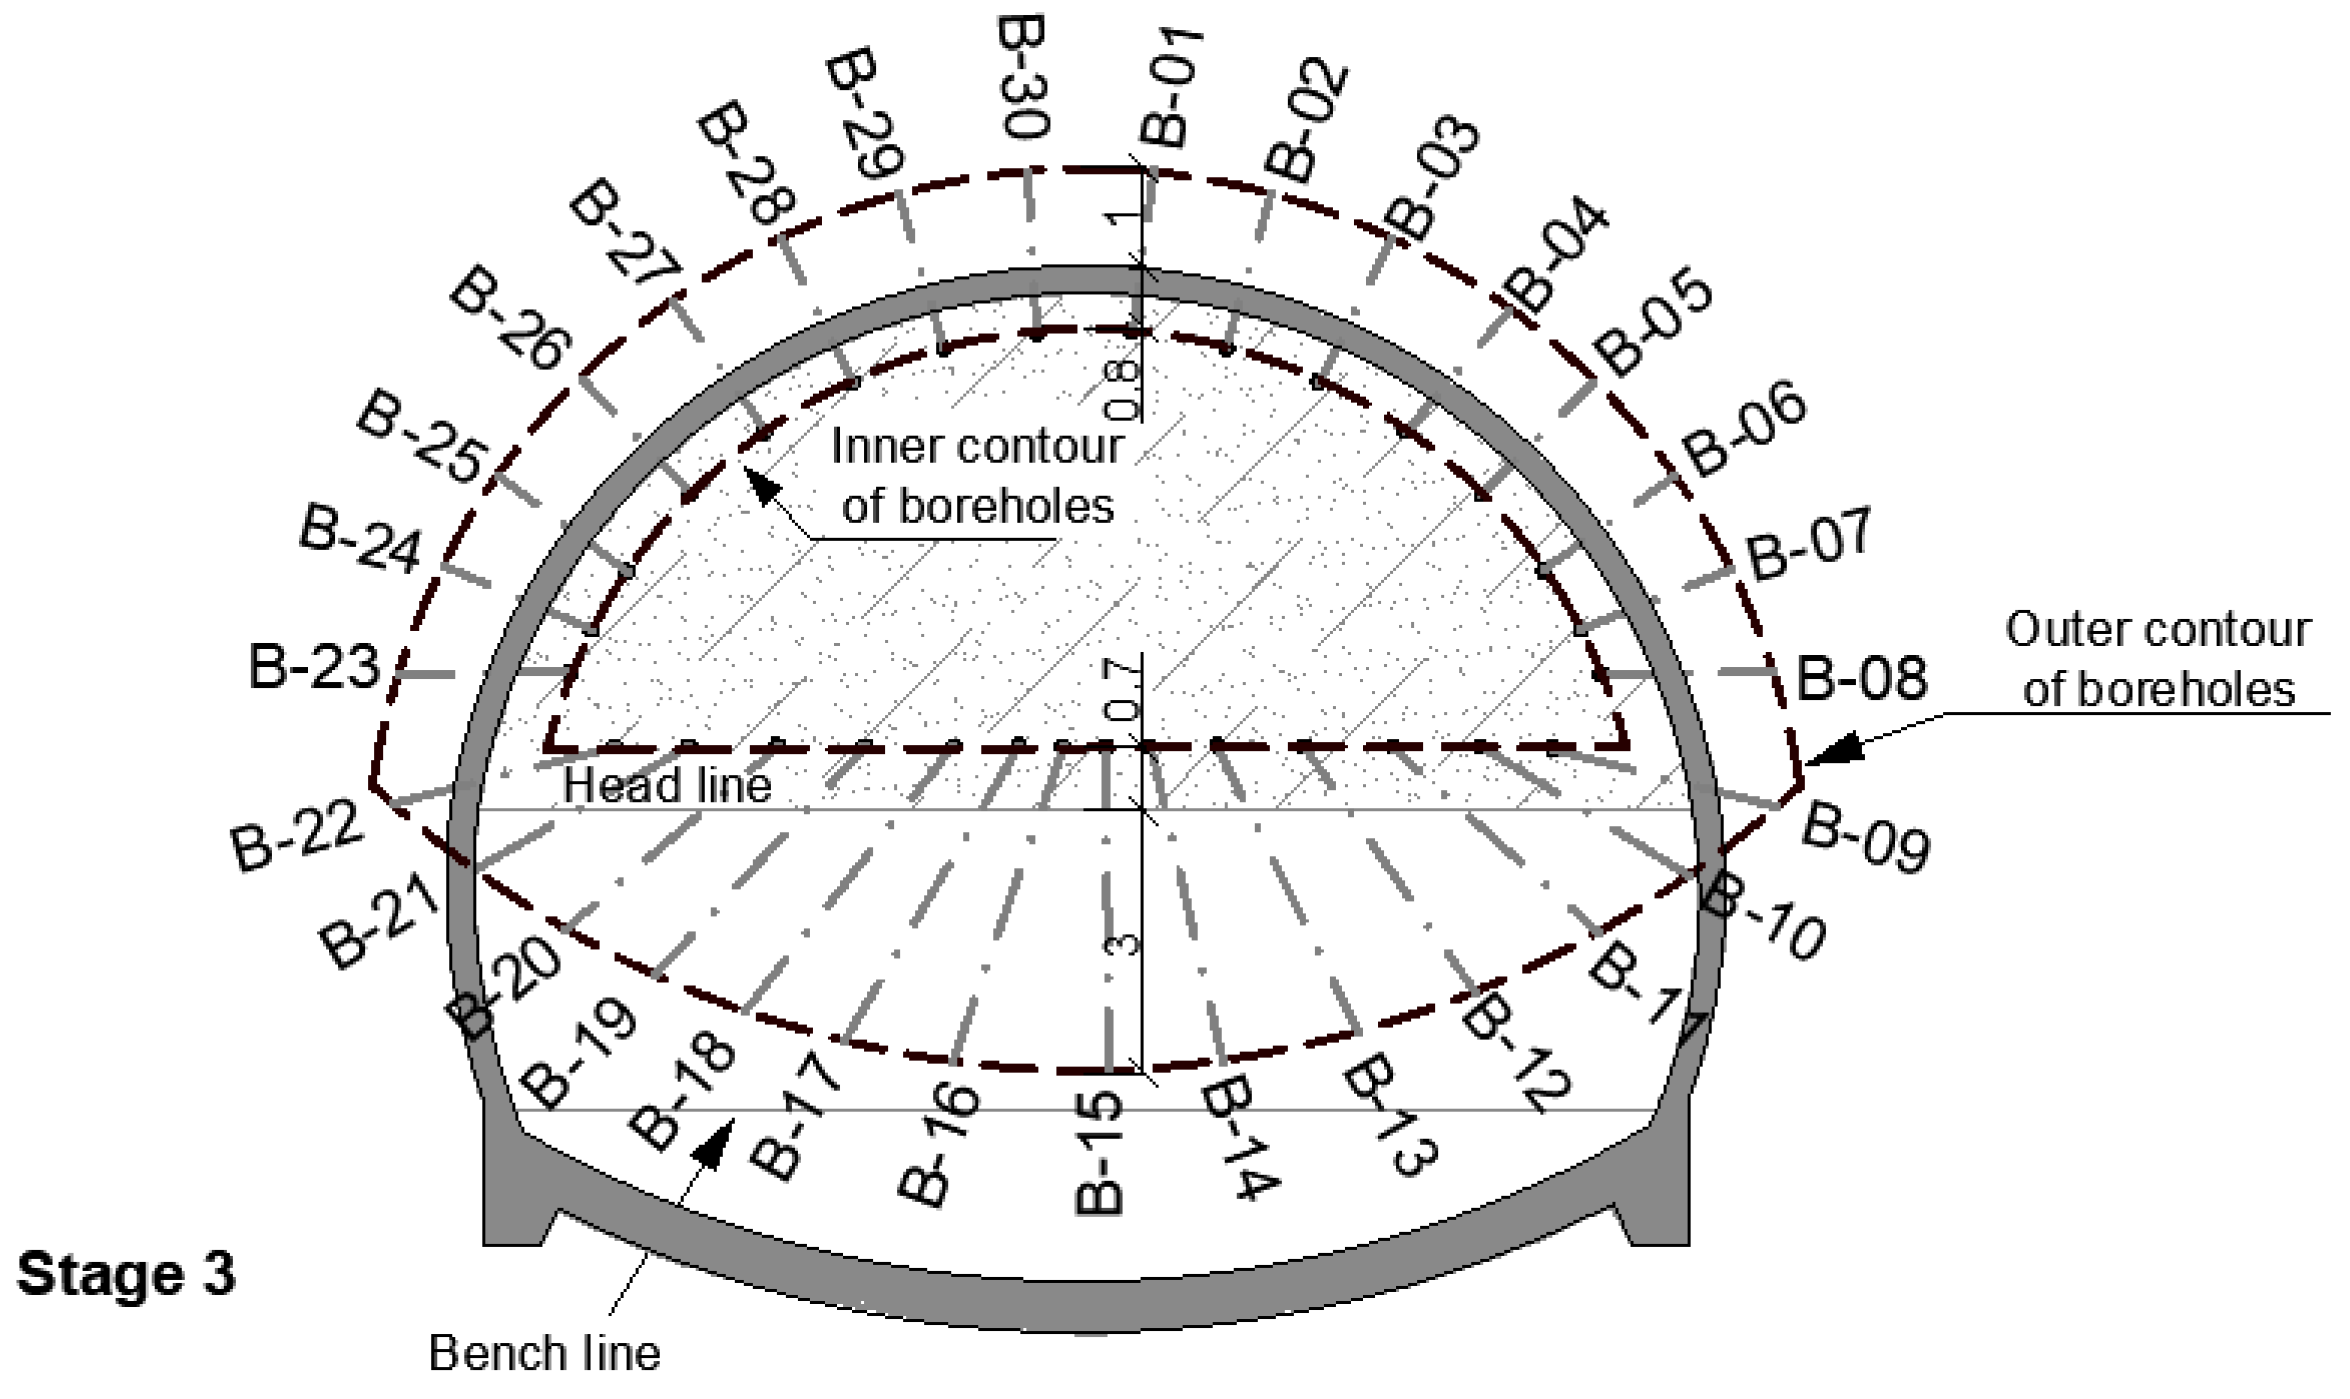
4.1.3. Stage 3 in the Top Heading
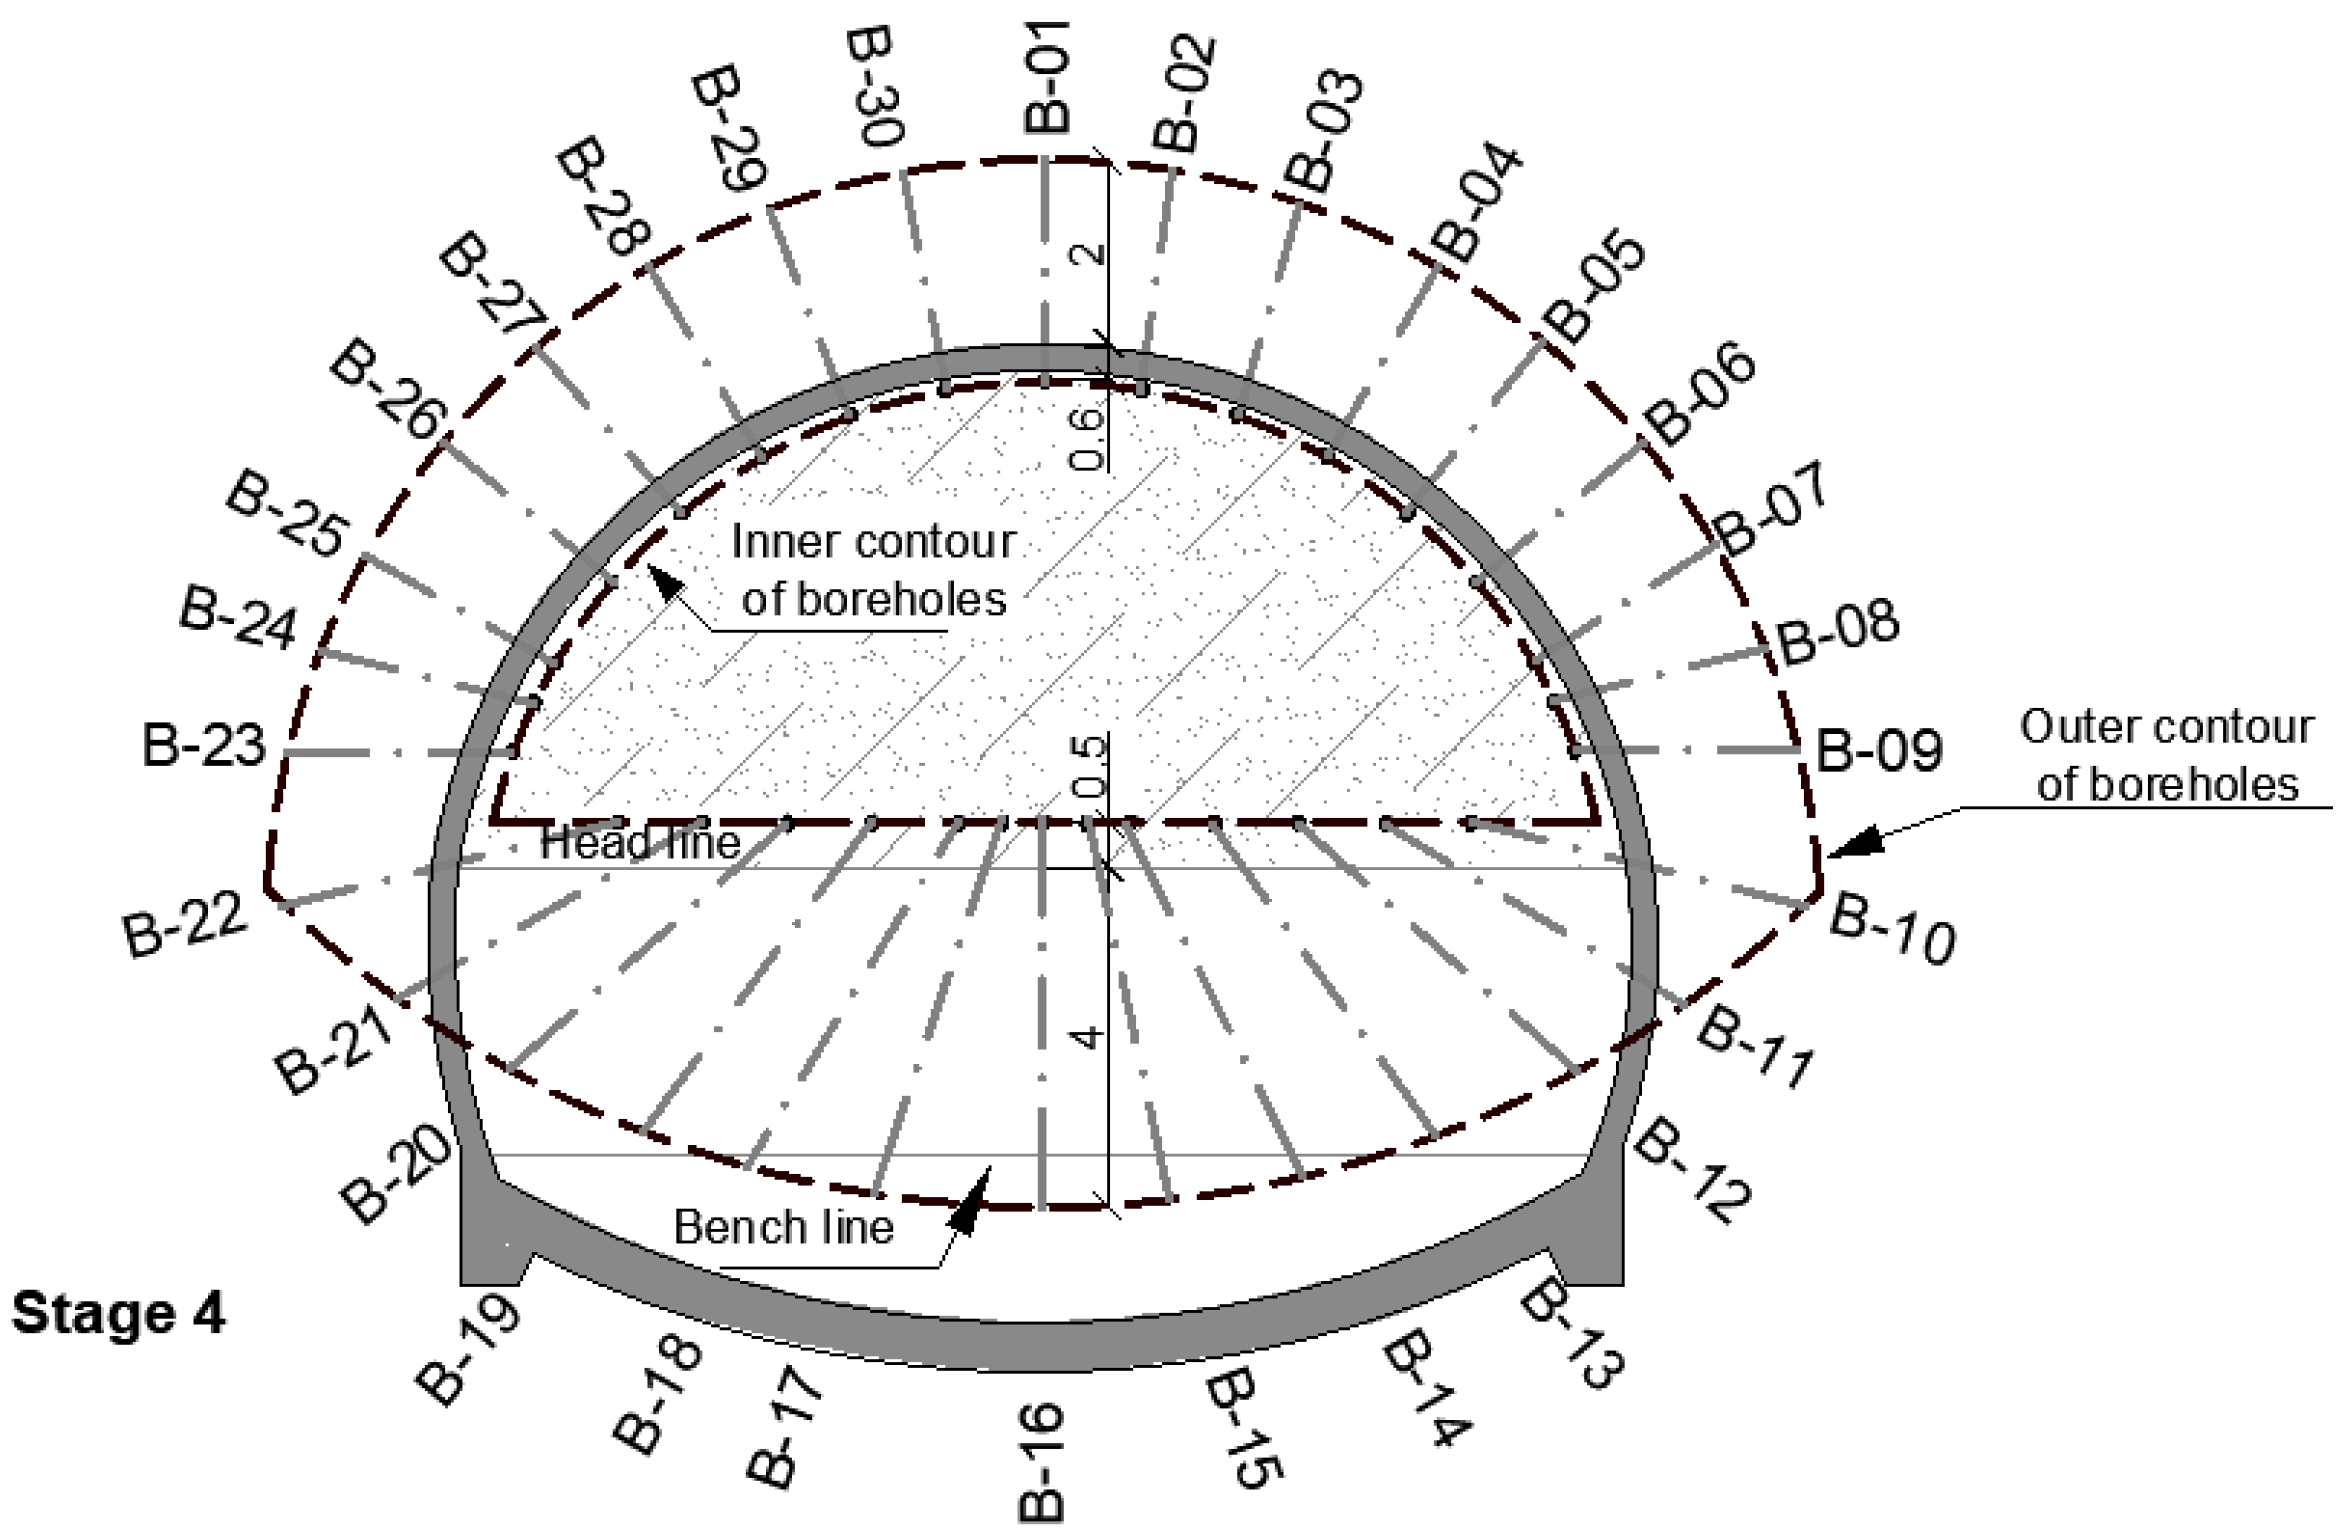
4.1.4. Stage 4 in the Top Heading
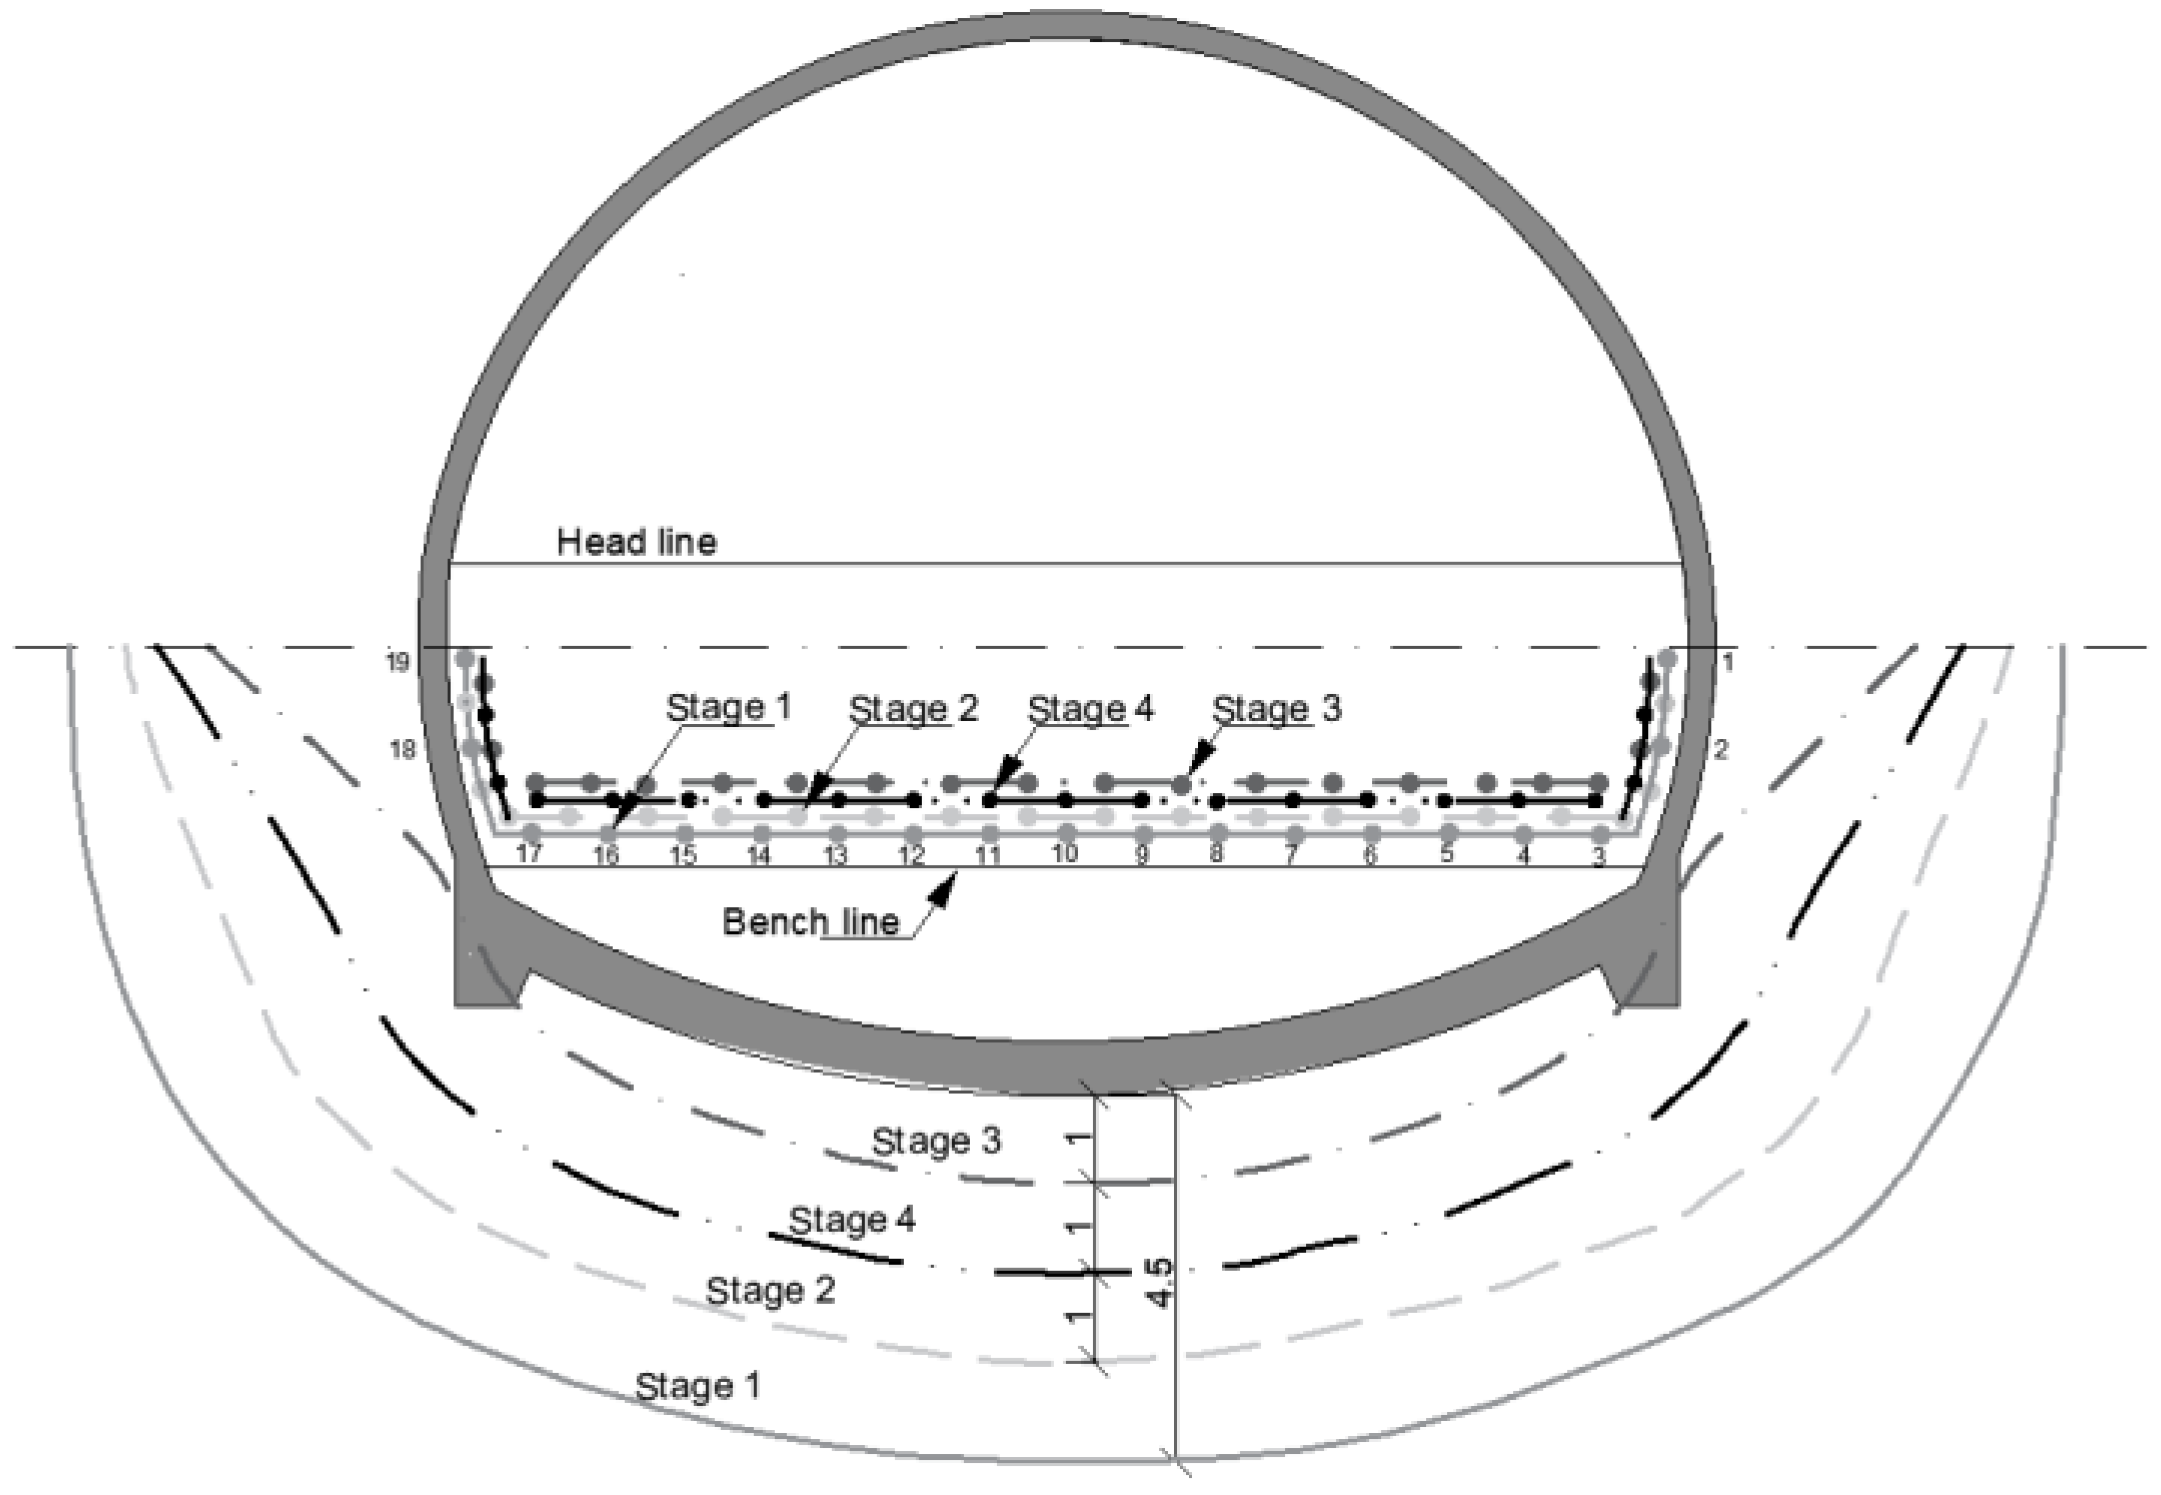
4.1.5. Pre-injection in Bench
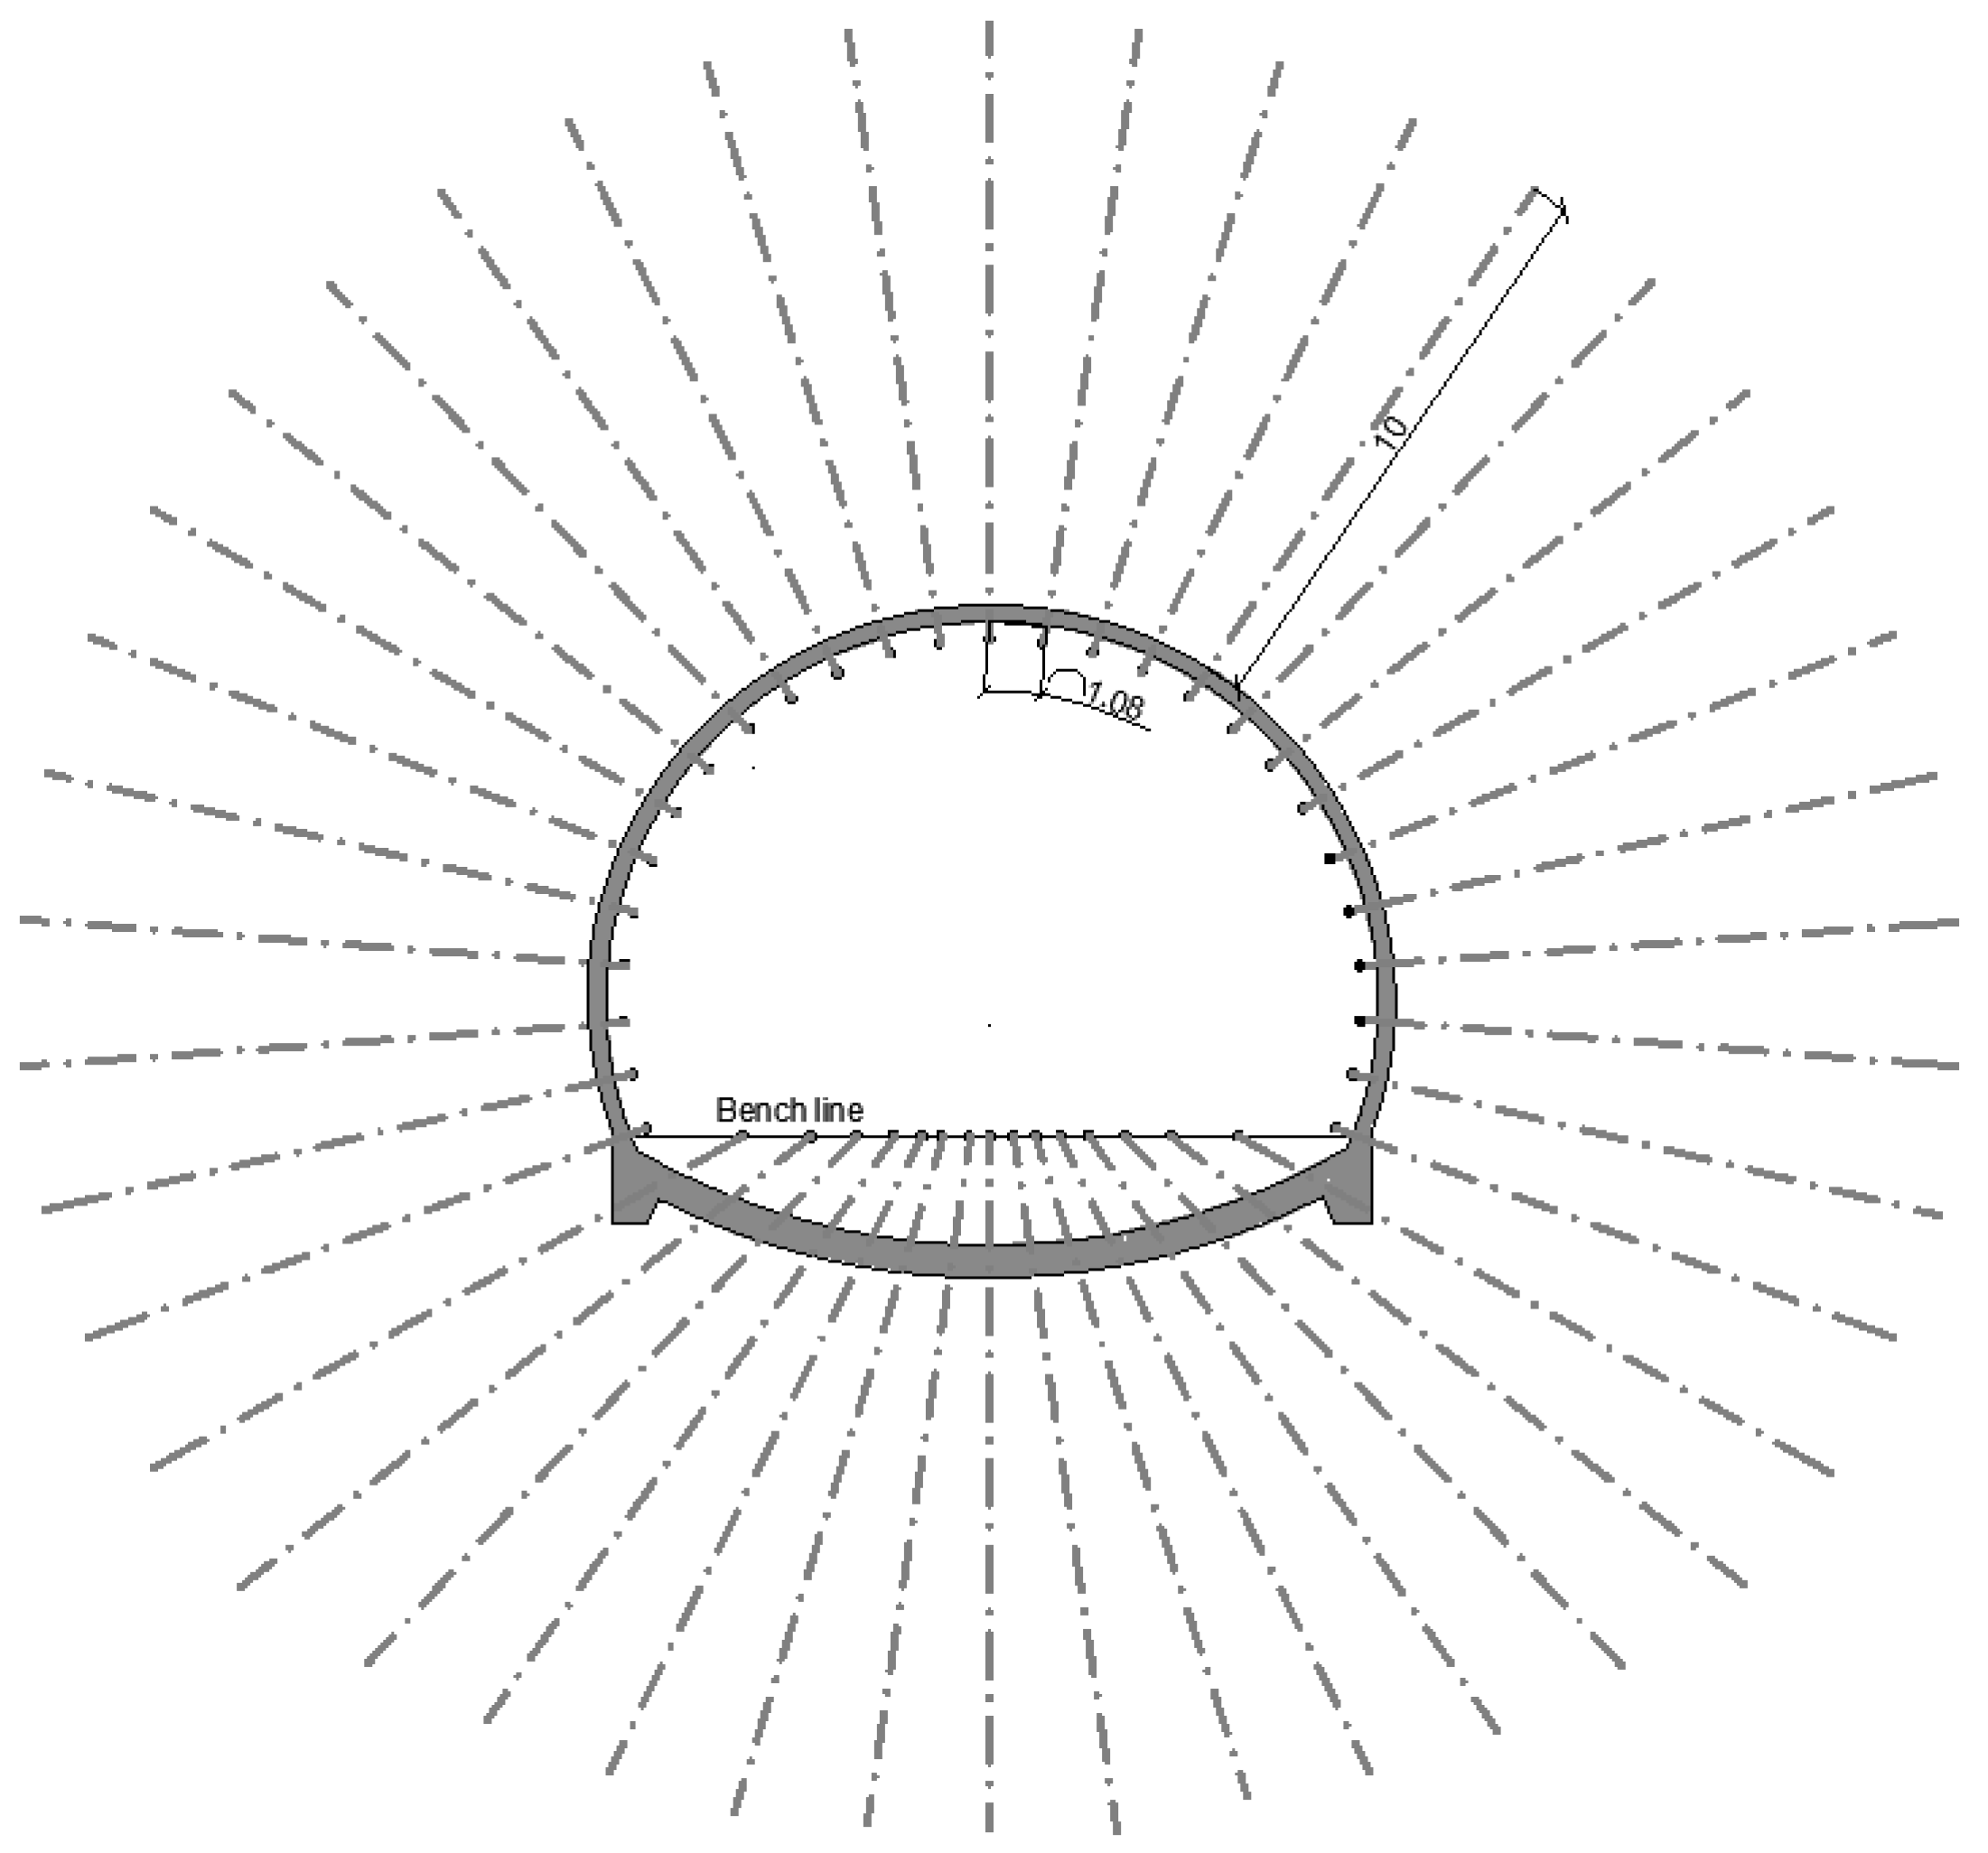
4.2. Post-Injection
5. Discussions
6. Conclusions
- High degrees of waterproofing together with large stable zones, are only achieved by a combination of treatments and stages using different materials and densities;
- The test equipment designed by the DinRock research group of the University of Oviedo allows to analyze the migration of fines due to high pressure injection and the effect that the re-injections with different densities of grout produce in the permeability of the ground;
- The test equipment allows to test the soil to be injected, analysing the penetrability for different grouts and their effect on the permeability, and optimizing the injection stages in each case;
- Although the injection of grouts, must be carried out at the highest possible injection pressures [29,30], the tests carried out limit the maximum pressure of injection in each stage depending on the different grouting conditions, as the type of grout and the permeability of the soil are successively modified;
- The limit of the maximum pressure together with the limit of the flow rate of injection requires a permanent monitoring of the injection process. Besides, this monitoring in real time allows to automate the stop of the injection;
- The designed injection treatment allows one to stabilize the ground and reduce the inflow of water employing one pre-injection in four stages with 30 boreholes drilled in the top heading and 19–20 boreholes drilled in the bench, and one post-injection with boreholes drilled around the perimeter of the tunnel in those areas where the pre-injection does not achieve the desired degree of waterproofing.
Author Contributions
Funding
Institutional Review Board Statement
Informed Consent Statement
Data Availability Statement
Acknowledgments
Conflicts of Interest
References
- Dayakar, P.; Venkat-Raman, K.; Raju, K.V.B. Study on permeation grouting using cement grout in sandy soils. IOSR J. Mech. Civil. Eng. 2012, 4, 5–10. [Google Scholar] [CrossRef]
- Wang, S.Y.; Chan, D.H.; Lam, K.C. Experimental study of the effect of fines content on dynamic compaction grouting in completely decomposed granite of Hong Kong. Constr. Build. Mater. 2009, 23, 1249–1264. [Google Scholar] [CrossRef]
- Jafari, M.; Nasri, V.; Liu, J. Compensation grouting, laboratory and field investigations. In Geotechnical Engineering for Transportation Projects; American Society of Civil Engineers: Reston, VA, USA, 2004; pp. 1894–1904. [Google Scholar] [CrossRef]
- Hamderi, M.; Gallagher, P.M. Pilot-scale modeling of colloidal silica delivery to liquefiable sands. Soils Found. 2015, 55, 143–153. [Google Scholar] [CrossRef]
- Yin, J.H.; Su, L.J.; Cheung, R.W.M.; Shui, Y.K. The influence of grouting pressure on the pullout resistance of soil nails in compacted completely decomposed granite fill. Géotechnique 2009, 59, 103–113. [Google Scholar] [CrossRef]
- Hong, C.Y.; Yin, J.H.; Pei, H.F.; Zhou, W.H. Experimental study on the pullout resistance of pressure-grouted soil nails in the field. Can. Geotech. J. 2013, 50, 693–704. [Google Scholar] [CrossRef]
- Hossain, M.A.; Yin, J.H. Influence of grouting pressure on the behavior of an unsaturated soil–cement interface. J. Geotech. Geoenviron. Eng. 2012, 138, 193–202. [Google Scholar] [CrossRef]
- Bezuijen, A.; Van-Tol, A.F. Compensation grouting in sand, fractures and compaction. In Proceedings of the XIV European Conference on Soil Mechanics and Geotechnical Engineering, Rotterdam, The Netherlands, 24–27 September 2007; pp. 1257–1262. [Google Scholar]
- Seo, H.J.; Jeong, K.H.; Choi, H.; Lee, I.N. Pullout resistance increase of soil nailing induced by pressurized grouting. J. Geotech. Geoenviron. Eng. 2012, 138, 604–613. [Google Scholar] [CrossRef]
- Wannenmacher, H.; Wenner, D. Strategies of rock mass grouting for tunnel operations. In Proceedings of the 1st Regional and 8th Iranian Tunneling Conference, Tehran, Iran, 18 May 2009. [Google Scholar]
- Garshol, K.F. Pre-Excavation Grouting in Tunneling; MBT, International Underground Construction Group: Zurich, Switzerland, 2003; p. 138. [Google Scholar]
- Rollins, K.; Adsero, M.; Brown, D. Jet grouting to increase lateral resistance of pile group in soft clay. In Proceedings of the International Foundation Congress and Equipment Expo 2009, Orlando, FL, USA, 15–19 March 2009; pp. 265–272. [Google Scholar] [CrossRef]
- Zhang, D.; Fang, Q.; Lou, H. Grouting techniques for the unfavorable geological conditions of Xiang’an subsea tunnel in China. J. Rock Mech. Geotech. Eng. 2014, 6, 438–446. [Google Scholar] [CrossRef]
- Zou, L.; Håkansson, U.; Cvetkovic, V. Two-phase cement grout propagation in homogeneous water-saturated rock fractures. Int. J. Rock Mech. Min. Sci. 2018, 106, 243–249. [Google Scholar] [CrossRef]
- Guatteri, G.; Koshima, A.; Lopes, J.R.; Ravaglia, A.; Pieroni, M.R. Historical cases and use of horizontal jet grouting solutions with 360° distribution and frontal septum to consolidate very weak and saturated soils. In Proceedings of the 6th International Symposium Geotechnical Aspects of Underground Construction in Soft Ground, Shanghai, China, 10–12 April 2008. [Google Scholar]
- Guatteri, G.; Koshima, A.; Lopes, R.; Ravaglia, A.; Pieroni, M.R.; Rocha, P.; Castanheira, M. Prototype tunnel in Barcelona—Test to check the construction feasibility with the 360º horizontal jet grouting and frontal septum. In Proceedings of the 17th International Conference on Soil Mechanics and Geotechnical Engineering, Alexandria, Egypt, 5–8 October 2009. [Google Scholar] [CrossRef]
- Blindheim, O.T.; Oevstedal, E. Design Principles and Construction Methods for Water Control in Subsea Road Tunnels in Rock; Norwegian Tunneling Society: Oslo, Norway, 2002. [Google Scholar]
- Høien, A.; Nilsen, B. Rock mass grouting in the Løren Tunnel: Case study with the main focus on the groutability and feasibility of drill parameter interpretation. Rock Mech. Rock Eng. 2014, 47, 967–983. [Google Scholar] [CrossRef][Green Version]
- Guatteri, G.; Koshima, A.; Lopes, J.; Doro Altan, V. 360° Jet grouted conical chamber allow safe tunneling under river within a highly pervious environment. In Proceedings of the GeEnge 2000—An International Conference on Geotechnical & Geological Engineering, Melbourne, Australia, 19–24 November 2000. [Google Scholar]
- Eriksson, M.; Friedrich, M.; Vorschulze, C. Variations in the rheology and penetrability of cement-based grouts-an experimental study. Cem. Concr. Res. 2004, 34, 1111–1119. [Google Scholar] [CrossRef]
- Bohloli, B.; Skjølsvold, O.; Justnes, H.; Olsson, R.; Grøv, E.; Aarset, A. Cements for tunnel grouting–Rheology and flow properties tested at different temperatures. Tunn. Undergr. Space Technol. 2019, 91, 103011. [Google Scholar] [CrossRef]
- Elkhadiri, I.; Palacios, M.; Puertas, F. Effect of curing temperature on cement hydration. Ceram. Silik. 2009, 53, 65–75. [Google Scholar]
- Wang, Q.; Wang, S.; William-Sloan, S.; Sheng, D.; Pakzad, R. Experimental investigation of pressure grouting in sand. Soils Found. 2016, 56, 161–173. [Google Scholar] [CrossRef]
- Pradhan, B.; Tham, L.G.; Yue, Z.Q.; Junaideen, S.M.; Lee, C.F. Soil-nail pullout interaction in loose fill materials. Int. J. Geomech. 2006, 6, 238–247. [Google Scholar] [CrossRef]
- Paans, W.J.M. The Influence Zone and Effectiveness of Fracture Grouting on Piled Foundations. Ph.D. Thesis, TU Delft, Delft, The Netherlands, 2002. [Google Scholar]
- Kolymbas, D. Tunnelling and Tunnel Mechanics: A Rational Approach to Tunnelling; Springer Science & Business Media: Berlin/Heidelberg, Germany, 2005. [Google Scholar] [CrossRef]
- Stille, B.; Stille, H.; Gustafson, G.; Kobayashi, S. Experience with the real time grouting control method. Geomech. Tunn. 2009, 2, 447–459. [Google Scholar] [CrossRef]
- Spanish Association for Standardization and Certification. (AENOR). Paints and Varnishes—Determination of Flow Time by Use of Flow Cups (UNE-EN ISO 2431:2012.). Available online: https://www.aenor.com/ (accessed on 17 May 2021).
- Sun, Z.; Yan, X.; Han, W.; Ma, G.; Zhang, Y. Simulating the Filtration Effects of Cement-Grout in Fractured Porous Media with the 3D Unified Pipe-Network Method. Processes 2019, 7, 46. [Google Scholar] [CrossRef]
- Draganovi’c, A.; Stille, H. Filtration and penetrability of cement-based grout: Study performed with a short slot. Tunn. Undergr. Space Tech. 2011, 26, 548–559. [Google Scholar] [CrossRef]


| w/c Ratio | Density (g/cm3) | Exudation (%) 2 h | Setting Time (h) | Viscosity (s) | Compressive Strength (MPa) |
|---|---|---|---|---|---|
| 0.5 | 1.62 ± 0.1 | 2.5 ± 0.5 | 3.0 ± 0.20 | 65 ± 0.5 | 30.7 ± 2.0 |
| 0.6 | 1.61 ± 0.1 | 2.7 ± 0.5 | 3.5 ± 0.20 | 41 ± 0.5 | 24.6 ± 1.8 |
| 0.7 | 1.59 ± 0.1 | 4.0 ± 0.5 | 4.5 ± 0.35 | 40 ± 0.5 | 17.9 ± 1.6 |
| Micro- cement | Density (g/cm3) | Exudation (%) 2 h | Setting Time (h) | Viscosity (s) | Compressive Strength (MPa) |
|---|---|---|---|---|---|
| 12 | 1.36 ± 0.1 | 8 ± 0.5 | 18 ± 1.0 | 34 ± 0.5 | 23.7 ± 2 |
| 32 | 1.35 ± 0.1 | 8 ± 0.5 | 5 ± 0.5 | 29 ± 0.5 | 25.0 ± 2 |
| Test | Total Weight (kg) | Granulometry (mm) | Percentages (%) | Fractions (kg) |
|---|---|---|---|---|
| 1 | 5.2 | 0.063–0.250 >2 | 25 75 | 1.302 3.906 |
| 2 | 6.0 | 0.063–0.250 0.5–2 | 25 75 | 1.5 4.5 |
| 3 | 6.0 | 0.063–0.25 0.5–2 >2 | 25 50 25 | 1.5 3.0 1.5 |
| 4 | 6.0 | 0.063–0.25 0.5–2 >2 | 25 25 50 | 1.5 1.5 3.0 |
| 1er Washing | 2° Washing | |||
|---|---|---|---|---|
| kg | % | kg | % | |
| Material that leaves | 0.537 | 41.32 | 0.031 | 2.38 |
| Material that remains | 4.671 | 58.68 | 4.640 | 56.30 |
| 1er Washing | 2° Washing | 3er Washing | 4° Washing | |||||
|---|---|---|---|---|---|---|---|---|
| kg | % | kg | % | kg | % | kg | % | |
| Material that leaves | 0.006 | 0.43 | 0.005 | 3.94 | 0.127 | 8.49 | 0.073 | 4.84 |
| Material that remains | 5.994 | 99.57 | 5.987 | 95.63 | 5.860 | 87.14 | 5.787 | 82.29 |
| 1er Washing | 2° Washing | 3er Washing | 4° Washing | |||||
|---|---|---|---|---|---|---|---|---|
| kg | % | kg | % | kg | % | kg | % | |
| Material that leaves | 0.019 | 1.26 | 0.011 | 7.69 | 0.252 | 16.80 | 0.021 | 1.41 |
| Material that remains | 5.981 | 99.98 | 5.969 | 91.05 | 5.718 | 74.25 | 5.696 | 72.83 |
| Test 3 | Test 4 | |||||
|---|---|---|---|---|---|---|
| Permeability (m/s) | Volume (L) | Fines (kg) | Permeability (m/s) | Volume (L) | Fines (kg) | |
| 1er Minute | 1.13 × 10⁻⁵ | 0.21 | 0.006 | 2.29 × 10⁻⁵ | 0.20 | 0.019 |
| 2° Minute | 1.04 × 10⁻⁵ | 0.20 | 0.005 | 1.42 × 10⁻⁵ | 0.25 | 0.011 |
| 3er Minute | 6.65 × 10⁻⁴ | 11.91 | 0.127 | 1.05 × 10⁻³ | 14.71 | 0.252 |
| 4° Minute | 6.49 × 10⁻⁴ | 11.86 | 0.073 | 1.06 × 10⁻³ | 14.41 | 0.021 |
| Stage | Permeability (m/s) | Length of Penetration (m) | Maximum Pressure (MPa) | Flow rate (L/min) |
|---|---|---|---|---|
| Initial | 7.7 × 10⁻³ | - | - | - |
| Injection 0.5 | 9.5 × 10⁻⁴ | 1.05 | 0.470 ± 0.05 | 10 |
| Injection 0.6 | 7.5 × 10⁻⁵ | 0.60 | 1.160 ± 0.1 | 5 |
| Injection 0.7 | 3.2 × 10⁻⁵ | 0.25 | 1.520 ± 0.1 | 2 |
| Number | Length (m) | Azimuth (°) | Inclination (°) | Number | Length (m) | Azimuth (°) | Inclination (°) |
|---|---|---|---|---|---|---|---|
| B-01 | 16.09 | 0 | 23 | B−16 | 31.50 | 0 | −13 |
| B-02 | 15.23 | 3 | 22 | B−17 | 28.14 | −5 | −14 |
| B-03 | 16.65 | 6 | 19 | B−18 | 26.76 | −8 | −13 |
| B-04 | 18.33 | 9 | 15 | B−19 | 27.13 | −10 | −13 |
| B-05 | 22.21 | 10 | 12 | B−20 | 23.31 | −13 | −11 |
| B-06 | 22.25 | 11 | 9 | B−21 | 21.35 | −16 | −9 |
| B-07 | 24.37 | 11 | 7 | B−22 | 21.23 | −21 | −5 |
| B-08 | 26.52 | 12 | 3 | B−23 | 17.11 | −20 | 0 |
| B-09 | 28.64 | 11 | 0 | B−24 | 15.57 | −21 | 5 |
| B-10 | 31.50 | 12 | −3 | B−25 | 14.35 | −20 | 11 |
| B-11 | 31.04 | 10 | −6 | B−26 | 13.46 | −19 | 15 |
| B-12 | 31.42 | 9 | −8 | B−27 | 12.90 | −17 | 19 |
| B-13 | 31.50 | 7 | −10 | B−28 | 14.69 | −14 | 22 |
| B-14 | 31.27 | 6 | −12 | B−29 | 12.82 | −10 | 24 |
| B-15 | 30.70 | 3 | −13 | B−30 | 13.29 | −5 | 24 |
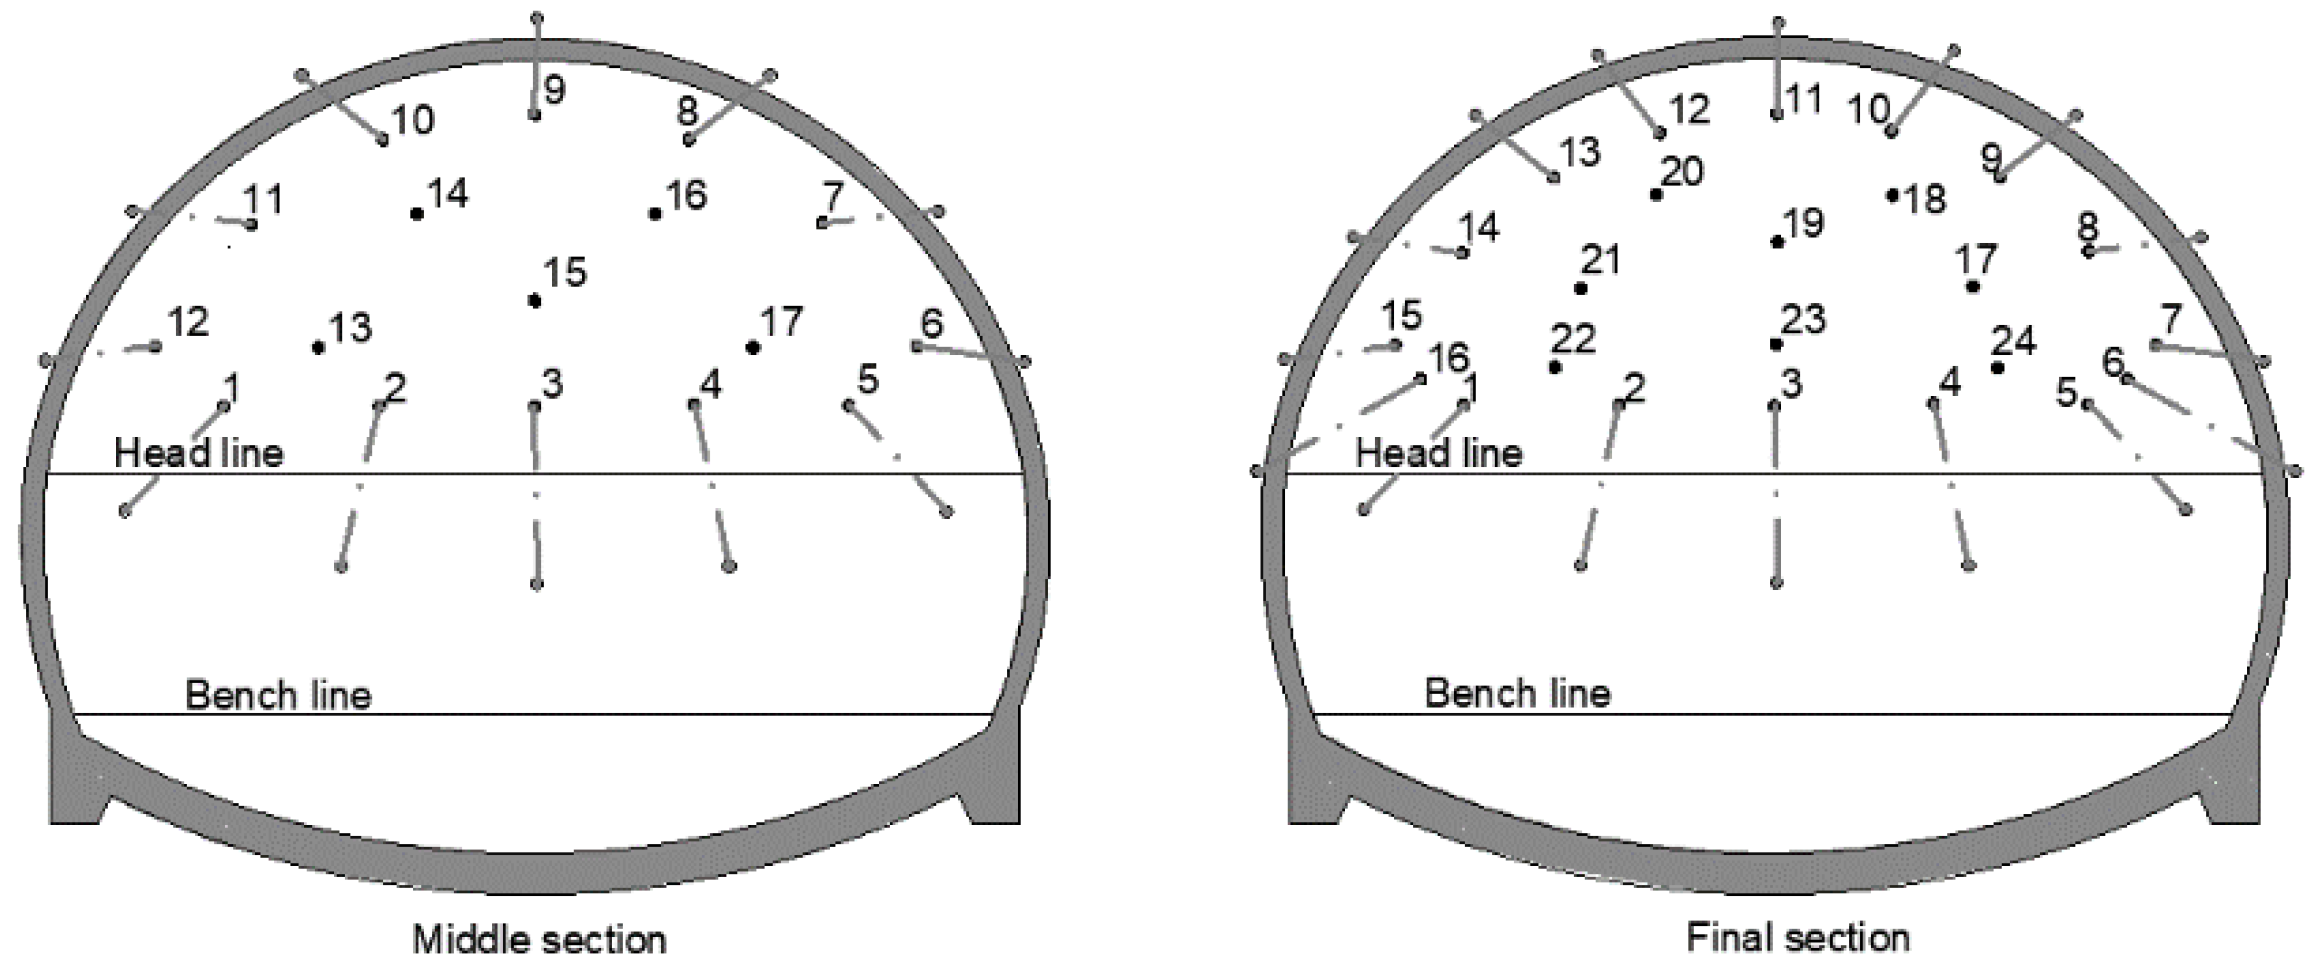
| Middle Section | Final Section | ||||
|---|---|---|---|---|---|
| Number | Azimuth (°) | Inclination (°) | Number | Azimuth (°) | Inclination (°) |
| 1 | −7 | −7 | 1 | −7 | −7 |
| 2 | −3 | −11 | 2 | −3 | −12 |
| 3 | 0 | −12 | 3 | 0 | −12 |
| 4 | 3 | −11 | 4 | 3 | −11 |
| 5 | 7 | −7 | 5 | 7 | −7 |
| 6 | 7 | −1 | 6 | 11 | −6 |
| 7 | 8 | 1 | 7 | 7 | −1 |
| 8 | 6 | 4 | 8 | 7 | 1 |
| 9 | 0 | 6 | 9 | 5 | 4 |
| 10 | −6 | 4 | 10 | 4 | 5 |
| 11 | −8 | 1 | 11 | 0 | 6 |
| 12 | −7 | −1 | 12 | −4 | 5 |
| 13 | 0 | 0 | 13 | −5 | 4 |
| 14 | 0 | 0 | 14 | −7 | 1 |
| 15 | 0 | 0 | 15 | −7 | −1 |
| 16 | 0 | 0 | 16 | −11 | −6 |
| Number | Length (m) | Azimuth (°) | Inclination (°) | Number | Length (m) | Azimuth (°) | Inclination (°) |
|---|---|---|---|---|---|---|---|
| B-01 | 14.09 | 0 | 18 | B-16 | 29.60 | 0 | −11 |
| B-02 | 15.23 | 2 | 16 | B-17 | 28.14 | −4 | −11 |
| B-03 | 16.65 | 4 | 14 | B-18 | 26.76 | −7 | −11 |
| B-04 | 18.33 | 7 | 12 | B-19 | 25.13 | −8 | −11 |
| B-05 | 20.21 | 8 | 10 | B-20 | 23.31 | −10 | −9 |
| B-06 | 22.25 | 9 | 7 | B-21 | 21.35 | −12 | −7 |
| B-07 | 24.37 | 9 | 6 | B-22 | 19.23 | −14 | −4 |
| B-08 | 26.52 | 9 | 2 | B-23 | 17.11 | −15 | 0 |
| B-09 | 28.64 | 9 | 0 | B-24 | 15.57 | −16 | 4 |
| B-10 | 30.85 | 10 | −3 | B-25 | 14.35 | −15 | 9 |
| B-11 | 31.04 | 9 | −5 | B-26 | 13.46 | −14 | 12 |
| B-12 | 31.42 | 8 | −7 | B-27 | 12.90 | −13 | 15 |
| B-13 | 31.50 | 6 | −9 | B-28 | 12.69 | −10 | 17 |
| B-14 | 31.27 | 5 | −10 | B-29 | 12.82 | −7 | 18 |
| B-15 | 30.70 | 2 | −11 | B-30 | 13.29 | −4 | 18 |
| Number | Length (m) | Azimuth (°) | Inclination (°) | Number | Length (m) | Azimuth (°) | Inclination (°) |
|---|---|---|---|---|---|---|---|
| B-01 | 14.09 | 1 | 7 | B-16 | 29.60 | −2 | −7 |
| B-02 | 15.23 | 2 | 6 | B-17 | 28.14 | −4 | −7 |
| B-03 | 16.65 | 3 | 5 | B-18 | 26.76 | −5 | −6 |
| B-04 | 18.33 | 3 | 4 | B-19 | 25.13 | −5 | −6 |
| B-05 | 20.21 | 3 | 3 | B-20 | 23.31 | −5 | −5 |
| B-06 | 22.25 | 4 | 2 | B-21 | 21.35 | −6 | −3 |
| B-07 | 24.37 | 4 | 1 | B-22 | 19.23 | −7 | −2 |
| B-08 | 26.52 | 4 | 0 | B-23 | 17.11 | −6 | 0 |
| B-09 | 28.64 | 4 | −1 | B-24 | 15.57 | −6 | 3 |
| B-10 | 30.85 | 4 | −2 | B-25 | 14.35 | −6 | 4 |
| B-11 | 31.04 | 4 | −4 | B-26 | 13.46 | −5 | 6 |
| B-12 | 31.42 | 3 | −5 | B-27 | 12.90 | −5 | 6 |
| B-13 | 31.50 | 3 | −6 | B-28 | 12.69 | −4 | 7 |
| B-14 | 31.27 | 1 | −6 | B-29 | 12.82 | −2 | 8 |
| B-15 | 30.70 | 0 | −7 | B-30 | 13.29 | −1 | 8 |
| Case | Flow Rate (L/min) | Phase 1 | Phase 2 |
|---|---|---|---|
| 1 | >60 | Cement (0.7) | Microcement (1.5) |
| 2 | <60 | Microcement (1.5) | |
| Number | Length (m) | Azimuth (°) | Inclination (°) | Number | Length (m) | Azimuth (°) | Inclination (°) |
|---|---|---|---|---|---|---|---|
| B-01 | 14.09 | 0 | 11 | B-16 | 29.60 | 0 | −8 |
| B-02 | 15.23 | 1 | 10 | B-17 | 28.14 | −3 | −8 |
| B-03 | 16.65 | 3 | 9 | B-18 | 26.76 | −5 | −8 |
| B-04 | 18.33 | 4 | 7 | B-19 | 25.13 | −6 | −8 |
| B-05 | 20.21 | 5 | 6 | B-20 | 23.31 | −8 | −7 |
| B-06 | 22.25 | 5 | 4 | B-21 | 21.35 | −9 | −5 |
| B-07 | 24.37 | 5 | 3 | B-22 | 19.23 | −11 | −3 |
| B-08 | 26.52 | 5 | 1 | B-23 | 17.11 | −9 | 0 |
| B-09 | 28.64 | 5 | 0 | B-24 | 15.57 | −9 | 2 |
| B-10 | 30.85 | 7 | −2 | B-25 | 14.35 | −9 | 5 |
| B-11 | 31.04 | 6 | −4 | B-26 | 13.46 | −8 | 7 |
| B-12 | 31.42 | 6 | −5 | B-27 | 12.90 | −7 | 9 |
| B-13 | 31.50 | 4 | −6 | B-28 | 12.69 | −6 | 10 |
| B-14 | 31.27 | 4 | −7 | B-29 | 12.82 | −4 | 11 |
| B-15 | 30.70 | 2 | −8 | B-30 | 13.29 | −2 | 11 |
| Stage 1 | Stage 4 | ||||||
|---|---|---|---|---|---|---|---|
| Number | Length (m) | Azimuth (°) | Inclination (°) | Number | Length (m) | Azimuth (°) | Inclination (°) |
| 1 | 31.47 | 9 | 0 | 1 | 30.21 | 8 | 2 |
| 2 | 29.48 | 10 | −1 | 2 | 28.72 | 8 | 2 |
| 3 | 27.47 | 10 | −4 | 3 | 27.22 | 8 | 0 |
| 4 | 25.51 | 11 | −8 | 4 | 25.84 | 9 | −3 |
| 5 | 23.60 | 11 | −12 | 5 | 24.49 | 10 | −5 |
| 6 | 21.90 | 9 | −15 | 6 | 23.14 | 11 | −8 |
| 7 | 20.47 | 7 | −17 | 7 | 21.81 | 10 | −10 |
| 8 | 19.25 | 5 | −19 | 8 | 20.53 | 9 | −12 |
| 9 | 18.20 | 3 | −20 | 9 | 19.29 | 8 | −14 |
| 10 | 17.28 | 0 | −21 | 10 | 18.12 | 6 | −15 |
| 11 | 16.60 | −3 | −22 | 11 | 17.10 | 4 | −17 |
| 12 | 16.48 | −6 | −22 | 12 | 16.22 | 1 | −18 |
| 13 | 16.49 | −9 | −21 | 13 | 15.67 | −3 | −17 |
| 14 | 16.63 | −12 | −19 | 14 | 15.40 | −6 | −15 |
| 15 | 16.53 | −15 | −17 | 15 | 15.28 | −10 | −13 |
| 16 | 16.45 | −17 | −13 | 16 | 15.56 | −12 | −9 |
| 17 | 16.43 | −17 | −7 | 17 | 16.34 | −12 | −4 |
| 18 | 17.78 | −15 | −2 | 18 | 17.44 | −12 | 0 |
| 19 | 19.56 | −14 | 0 | 19 | 18.72 | −12 | 2 |
| Stage 2 | Stage 3 | ||||||
|---|---|---|---|---|---|---|---|
| Number | Length (m) | Azimuth (°) | Inclination (°) | Number | Length (m) | Azimuth (°) | Inclination (°) |
| 1 | 30.11 | 7 | 2 | 1 | 30.11 | 7 | 2 |
| 2 | 28.73 | 7 | 2 | 2 | 28.73 | 7 | 2 |
| 3 | 27.41 | 7 | 1 | 3 | 27.41 | 7 | 1 |
| 4 | 26.11 | 7 | −1 | 4 | 26.11 | 7 | −1 |
| 5 | 24.86 | 8 | −3 | 5 | 24.86 | 8 | −3 |
| 6 | 23.66 | 8 | −6 | 6 | 23.66 | 8 | −6 |
| 7 | 22.48 | 9 | −8 | 7 | 22.48 | 9 | −8 |
| 8 | 21.33 | 8 | −9 | 8 | 21.33 | 8 | −9 |
| 9 | 20.22 | 8 | −11 | 9 | 20.22 | 8 | −11 |
| 10 | 19.16 | 7 | −12 | 10 | 19.16 | 7 | −12 |
| 11 | 18.18 | 5 | −13 | 11 | 18.18 | 5 | −13 |
| 12 | 17.31 | 3 | −15 | 12 | 17.31 | 3 | −15 |
| 13 | 16.55 | 1 | −16 | 13 | 16.55 | 1 | −16 |
| 14 | 16.12 | −2 | −15 | 14 | 16.12 | −2 | −15 |
| 15 | 15.92 | −4 | −13 | 15 | 15.92 | −4 | −13 |
| 16 | 15.79 | −7 | −11 | 16 | 15.79 | −7 | −11 |
| 17 | 16.11 | −9 | −7 | 17 | 16.11 | −9 | −7 |
| 18 | 16.84 | −10 | −3 | 18 | 16.84 | −10 | −3 |
| 19 | 17.74 | −10 | −1 | 19 | 17.74 | −10 | −1 |
| 20 | 18.81 | −11 | 1 | 20 | 18.81 | −11 | 1 |
Publisher’s Note: MDPI stays neutral with regard to jurisdictional claims in published maps and institutional affiliations. |
© 2021 by the authors. Licensee MDPI, Basel, Switzerland. This article is an open access article distributed under the terms and conditions of the Creative Commons Attribution (CC BY) license (https://creativecommons.org/licenses/by/4.0/).
Share and Cite
González-García, J.; González-Nicieza, C.; Álvarez-Fernández, M.-I.; Prendes-Gero, M.-B. Injection Treatment for Tunneling Excavation in Sandy Soils with High Fines Content. Energies 2021, 14, 6930. https://doi.org/10.3390/en14216930
González-García J, González-Nicieza C, Álvarez-Fernández M-I, Prendes-Gero M-B. Injection Treatment for Tunneling Excavation in Sandy Soils with High Fines Content. Energies. 2021; 14(21):6930. https://doi.org/10.3390/en14216930
Chicago/Turabian StyleGonzález-García, Johnatan, Celestino González-Nicieza, Martina-Inmaculada Álvarez-Fernández, and María-Belén Prendes-Gero. 2021. "Injection Treatment for Tunneling Excavation in Sandy Soils with High Fines Content" Energies 14, no. 21: 6930. https://doi.org/10.3390/en14216930
APA StyleGonzález-García, J., González-Nicieza, C., Álvarez-Fernández, M.-I., & Prendes-Gero, M.-B. (2021). Injection Treatment for Tunneling Excavation in Sandy Soils with High Fines Content. Energies, 14(21), 6930. https://doi.org/10.3390/en14216930