Article

Field-Scale Experiment on Deformation Characteristics and Bearing Capacity of Tunnel-Type Anchorage of Suspension Bridge

1
School of Earth Sciences and Engineering, Hohai University, Nanjing 211100, China
2
Changjiang Survey, Planning, Design and Research Co., Ltd., Wuhan 430010, China
3
Faculty of Engineering, China University of Geosciences (Wuhan), Wuhan 430074, China
*
Author to whom correspondence should be addressed.
Energies 2022, 15(13), 4772; https://doi.org/10.3390/en15134772
Submission received: 19 May 2022 / Revised: 23 June 2022 / Accepted: 24 June 2022 / Published: 29 June 2022
(This article belongs to the Special Issue Innovative Techniques in Underground Excavation)

Abstract

:
The suspension pipe bridge has become the main span type due to its large span, light structure, and other characteristics, playing an important role in the construction of the oil and gas backbone network and energy layout. Tunnel-type anchorage (TTA) is a special underground structure that provides anchorage tension for the suspension bridge. Since its form and bearing mechanism are complex, there is no general design method for tunnel-type anchorage so far, and the theoretical and normative research is not mature. In this paper, a field-scale experiment was carried out to study the north side tunnel of Wujiagang Bridge in Yichang, China. According to the similarity principle, the 1:12 tunnel anchor scale model was established. The tunnel anchor scale model is selected in the area adjacent to the actual project site to ensure the similarity of stratigraphic conditions. Through the use of a displacement meter, inclinometer hole, strain gauge, micrometers, and other comprehensive monitoring methods, the design load test, overload test, overload rheological test, and ultimate bearing capacity failure test were carried out. Through the structural deformation observation and stress observation of the anchorage body and surrounding rock, the stress deformation characteristics and rheological characteristics of the anchorage body and surrounding rock in the field-scale experiment were analyzed. The deformation failure mechanism, deformation failure process, potential failure mode, and overload capacity of solid tunnel anchor were studied. The control indexes such as deformation and stress values of key parts of the solid tunnel anchor at different stages are predicted. Based on the limit equilibrium analysis results of the model, the safety and rationality of the tunnel anchorage structure design of the actual suspension bridge were evaluated.

1. Introduction

The construction of long-distance oil and gas pipelines and other energy transportation pipelines which are affected by geological conditions and topography, often use the crossing method through rivers and canyons. The suspension pipe bridge has become the main span type due to its large span, light structure, and other characteristics, playing an important role in the construction of the oil and gas backbone network and energy layout (Gosteev, 2022). TTA (tunnel-type anchorage) is a special underground engineering structure that provides anchorage tension for a suspension bridge. Its structural form and bearing mechanism are complex, and it is generally used in places with fewer joints and better rock mass performance [1,2,3,4,5]. However, due to the engineering needs, it will inevitably encounter soft rock and other strata conditions, and soft rock mechanical properties are poor. Under a huge load of cables, the TTA and surrounding rock may be damaged as a whole, endangering the safety of the bridge. In addition, during the construction and operation of TTA, the deformation will continue to develop, and the suspension bridge is a flexible structure [6,7,8,9,10,11]. To meet the overall operational requirements of the bridge, the maximum horizontal displacement and the maximum vertical displacement of the TTA must be strictly controlled in a certain range. Therefore, it is necessary to study the deformation of TTA in soft rock, especially the long-term deformation under cable tension load.
At present, there is no general TTA design method for tunnel anchorage structure, and the relevant theories and regulations are not mature. Studies have shown [12,13,14] that to demonstrate the feasibility of the TTA scheme, in addition to the conventional rock mechanics test and numerical analysis, the field-scale model experiment and model experiment were also the research methods commonly used in TTA engineering in the past. In terms of laboratory tests, Seo et al. [15] analyzed the tensile behavior of TTA of suspension bridges through laboratory-scale model experiments. Jiang et al. [16] took the TTA of the Jinsha River Suspension Bridge of Lijiang Shangri-La Railway as the prototype and carried out the laboratory model experiment of TTA under three different contact conditions of anchor solid and surrounding rock. The stress and deformation distribution of the anchorage body and its surrounding rock were studied, and the ultimate bearing capacity and failure mode of TTA were analyzed. Based on laboratory tests, Liu et al. [17] studied the pull-out behavior of TTA during loading using a finite element program and conducted extensive parametric studies to evaluate the safety factor of TTA.
In the field test, Zhou et al. [18] carried out an overload failure test by 1:10 tunnel anchorage field model to study the failure mechanism and failure mode of TTA on soft rock. Li et al. [19] conducted model experiments using cylindrical and truncated cone plugs to study the bearing mechanism of TTA of suspension bridges. Liu et al. [20] analyzed the load transfer and rock deformation characteristics of TTA with weak interlayer in soft rock strata based on the field-scale model experiment. Lim et al. [21] studied the pull-out behavior of tunnel anchorage by considering the characteristics of geometry and rock connection. Dong et al. [22] evaluated the maximum load that the rock anchor system can withstand by comprehensively considering the ability of transmission components and rock anchor system through model experiments. The above research shows that the stability of TTA is studied by field-scale experiments, which has the advantages of accurate simulation and practical operation. The obtained experimental data can be used for subsequent numerical research and theoretical calculation. Xu et al. [23], based on the experimental test, used the discontinuous deformation analysis method based on discontinuous medium mechanics to carry out the relevant research; the three-dimensional (3D) model experiment and numerical analysis were carried out to study the pull-out behavior of tunnel anchorage of a suspension bridge. Han et al. [24] analyzed the bearing behavior of tunnel anchorage in the soft rock through a field model experiment and studied the influence of the geometric parameters of the plug body and the distance between the left and right plug bodies on the stress state of the weak interlayer combined with FLAC3D. To study the interaction between the left and right tunnels of the tunnel anchorage of a suspension bridge, Li et al. [25] used finite difference numerical software to analyze the mechanical properties of surrounding rock during construction. Therefore, the field-scale experiment is of great significance to the stability and design of TTA.
In this paper, Wujiagang Bridge’s north side of the river tunnel anchor was used as the background of the study. A 1:12 scale model of the tunnel anchor was constructed based on the similarity principle at the site adjacent to the project site with the same geological conditions using a field-scale model test. The load test, overload test, overload rheological test, and ultimate bearing capacity failure were carried out by using the comprehensive test methods of displacement meter, inclinometer, strain gauge, and micrometer. By monitoring the deformation and stress of the anchor plug body and the surrounding rock structure, this paper analyzed the force-deformation characteristics and rheological characteristics of the anchor plug body and surrounding rock in the test. This paper studied the deformation damage mechanism, deformation damage process, potential damage mode, and overload capacity of solid TTA. Controlled indicators such as deformation and stress values were predicted for each critical part of the solid tunnel anchor at different stages. Based on the results of the limit equilibrium analysis, the safety and rationality of the TTA structure design of the actual suspension bridge were evaluated. The stability and damage characteristics of anchored tunnels were analyzed and studied by the multi-method integrated test technique, and the test method and test means have important reference values for similar projects.

2. Engineering Overview

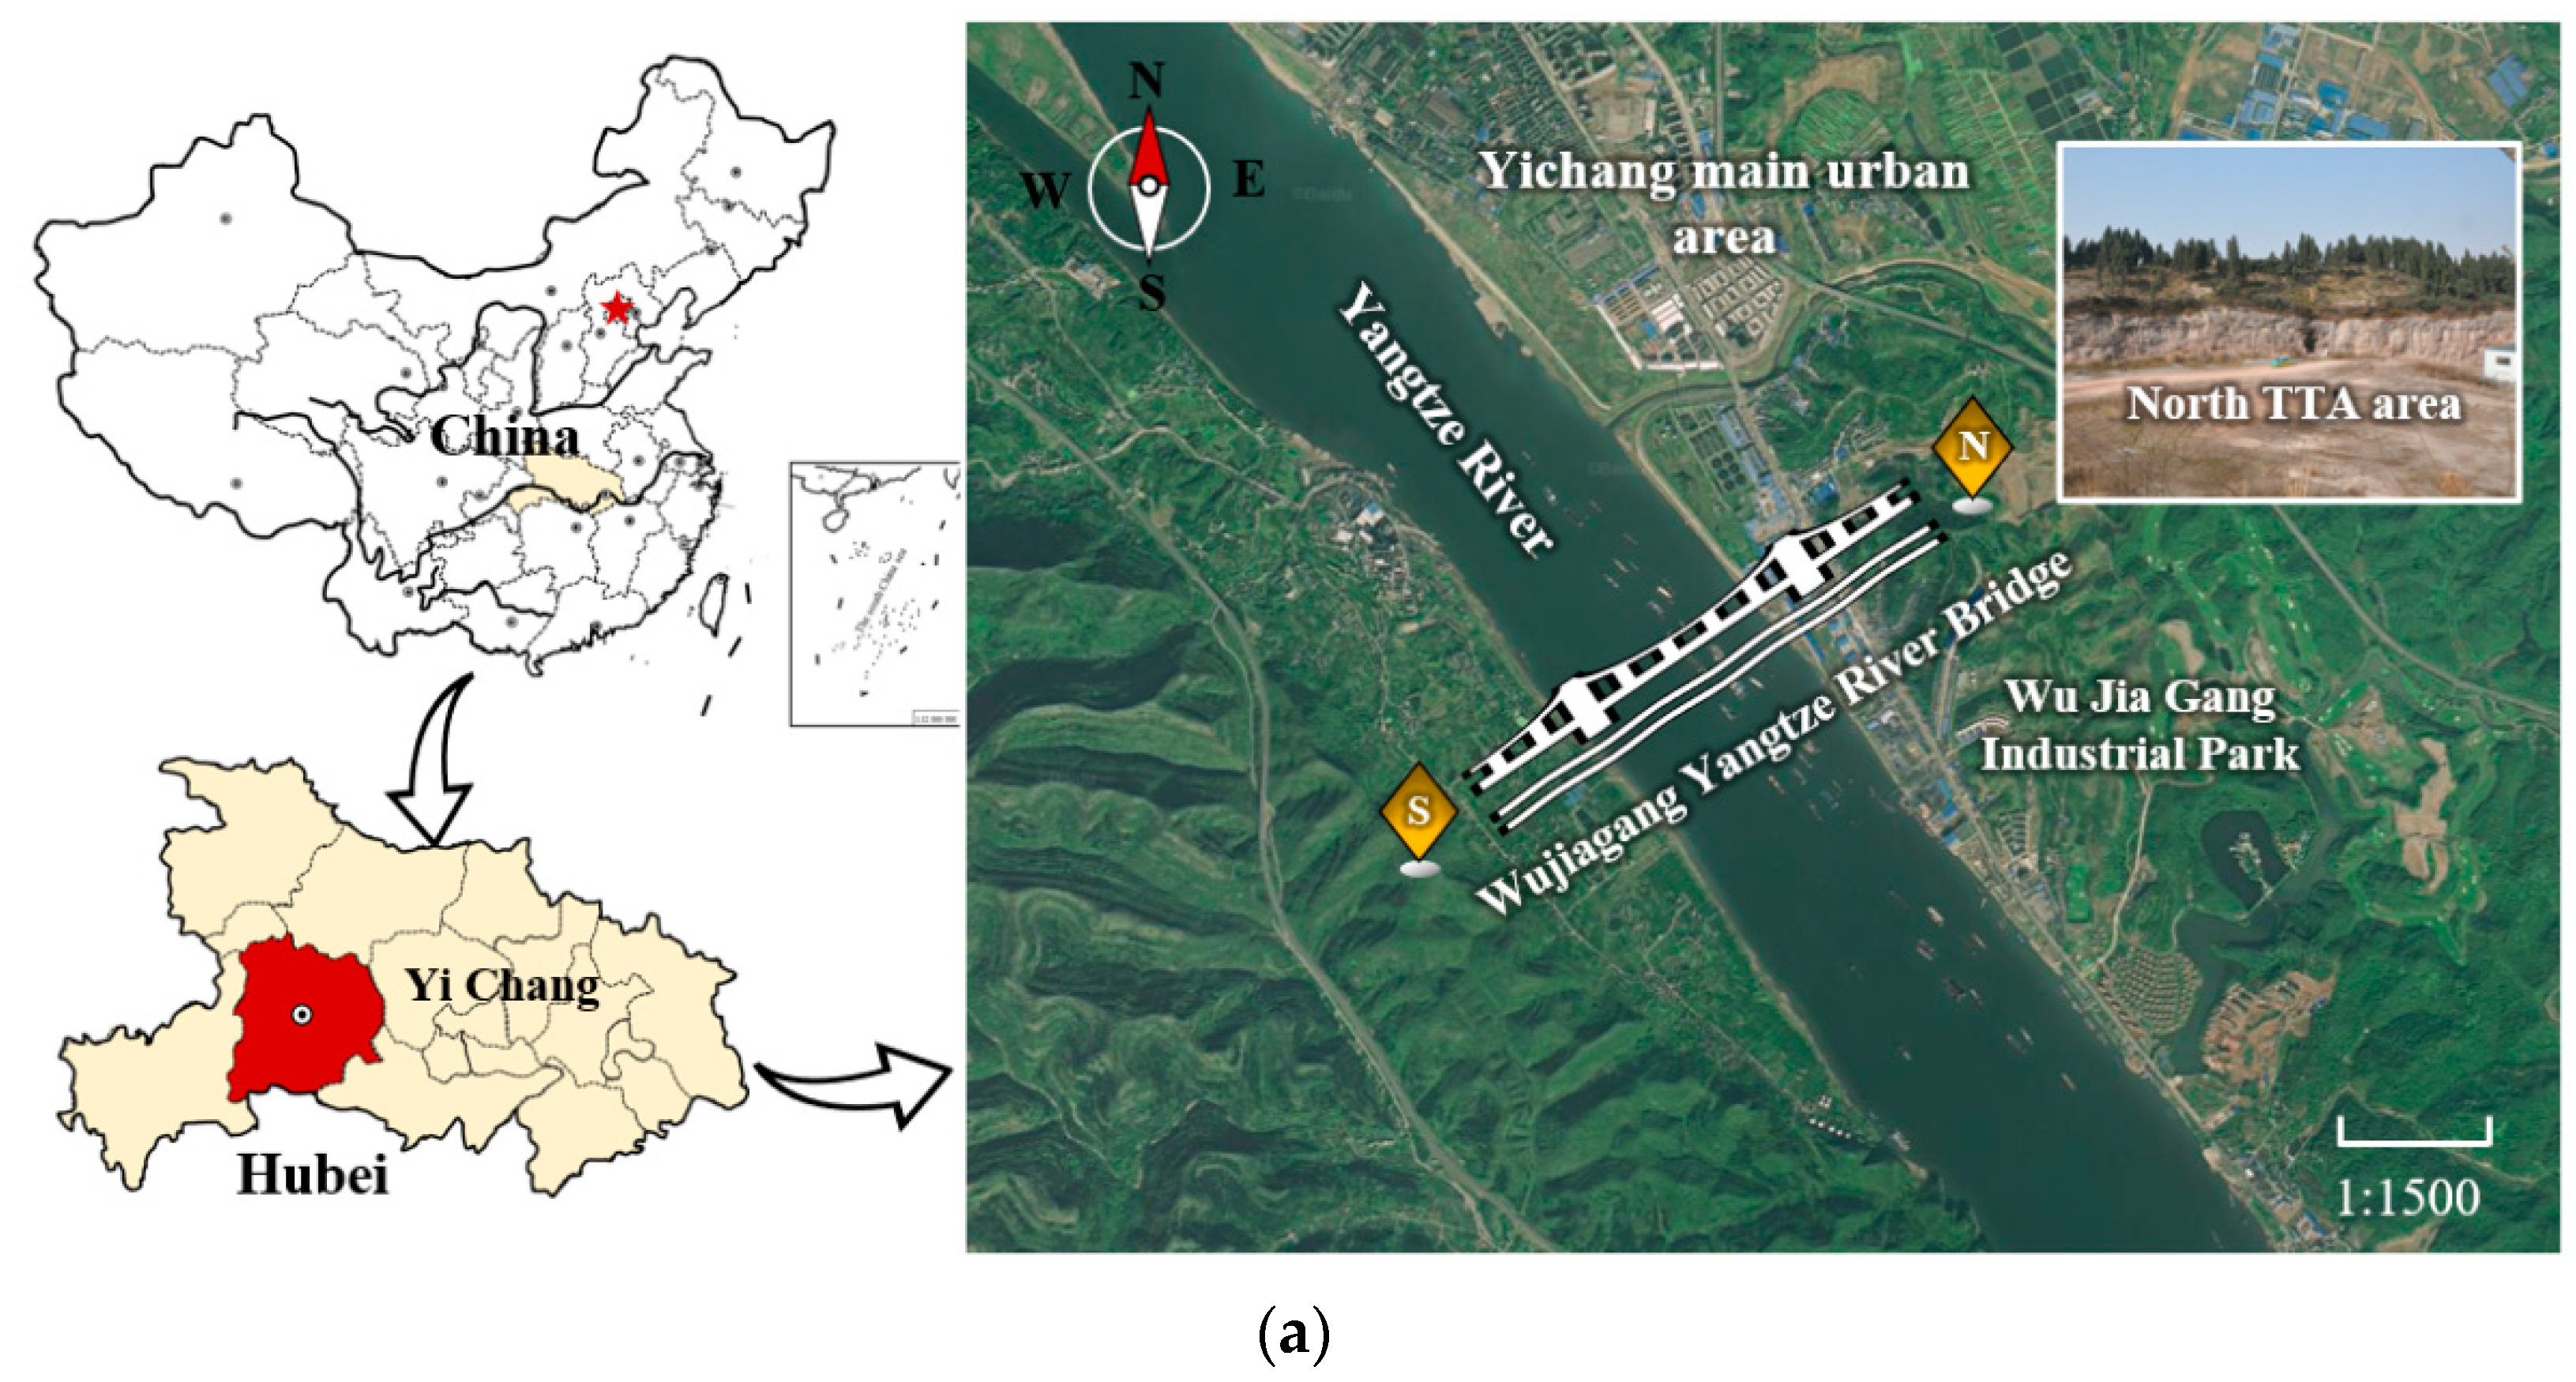
2.1. Overview of Engineering Site

Yichang Wujiagang Yangtze River Bridge is a river-crossing channel which opened up by connecting Wujiagang East Station New Area and Dianjun Riverside Ecological New Area. The project starts from the east of Jiangnan 1st Road, crosses Tanan Road, Binjiang Road, Changjiang River, and Wulin Road, and ends at Huaxi Road, with a construction mileage of 2560.229 m. The main bridge across the Yangtze River adopts the steel box girder suspension bridge with a main span of 1160 m, the Jiangnan side approach bridge is 319.4 m, and the north side lead is 1080.829 m. The south side of the main bridge is proposed to adopt gravity anchor, and the north of the river is proposed to adopt a tunnel anchor scheme to anchor the anchor plug in the bedrock low hill. The project location is shown in Figure 1a. The anchor design of the north side tunnel is proposed to adopt the concrete gravity structure. The anchor entry angle is −40°, the length of the front anchor chamber section is 45.000 m, the length of the anchor plug body section is 45.000 m, the bottom elevation of the saddle chamber entrance is 54.533 m, and the bottom elevation of the anchor surface under the anchor plug body is −11.906 m. The excavation chamber of the anchor plug body is in the shape of a city gate. The front anchor chamber section is 9.04~9.60 m wide and 10.49~12.00 m high, with an arrangement elevation of 22.012~54.686 m. The anchor plug section is 12.00~16.00 m wide and 12.00~20.00 m high, with an arrangement elevation of 31.205~−11.906 m and a single anchor load of 2.2 × 10⁴. The layout of the anchored plane and section of the tunnel on the north side of the river is shown in Figure 1b,c.

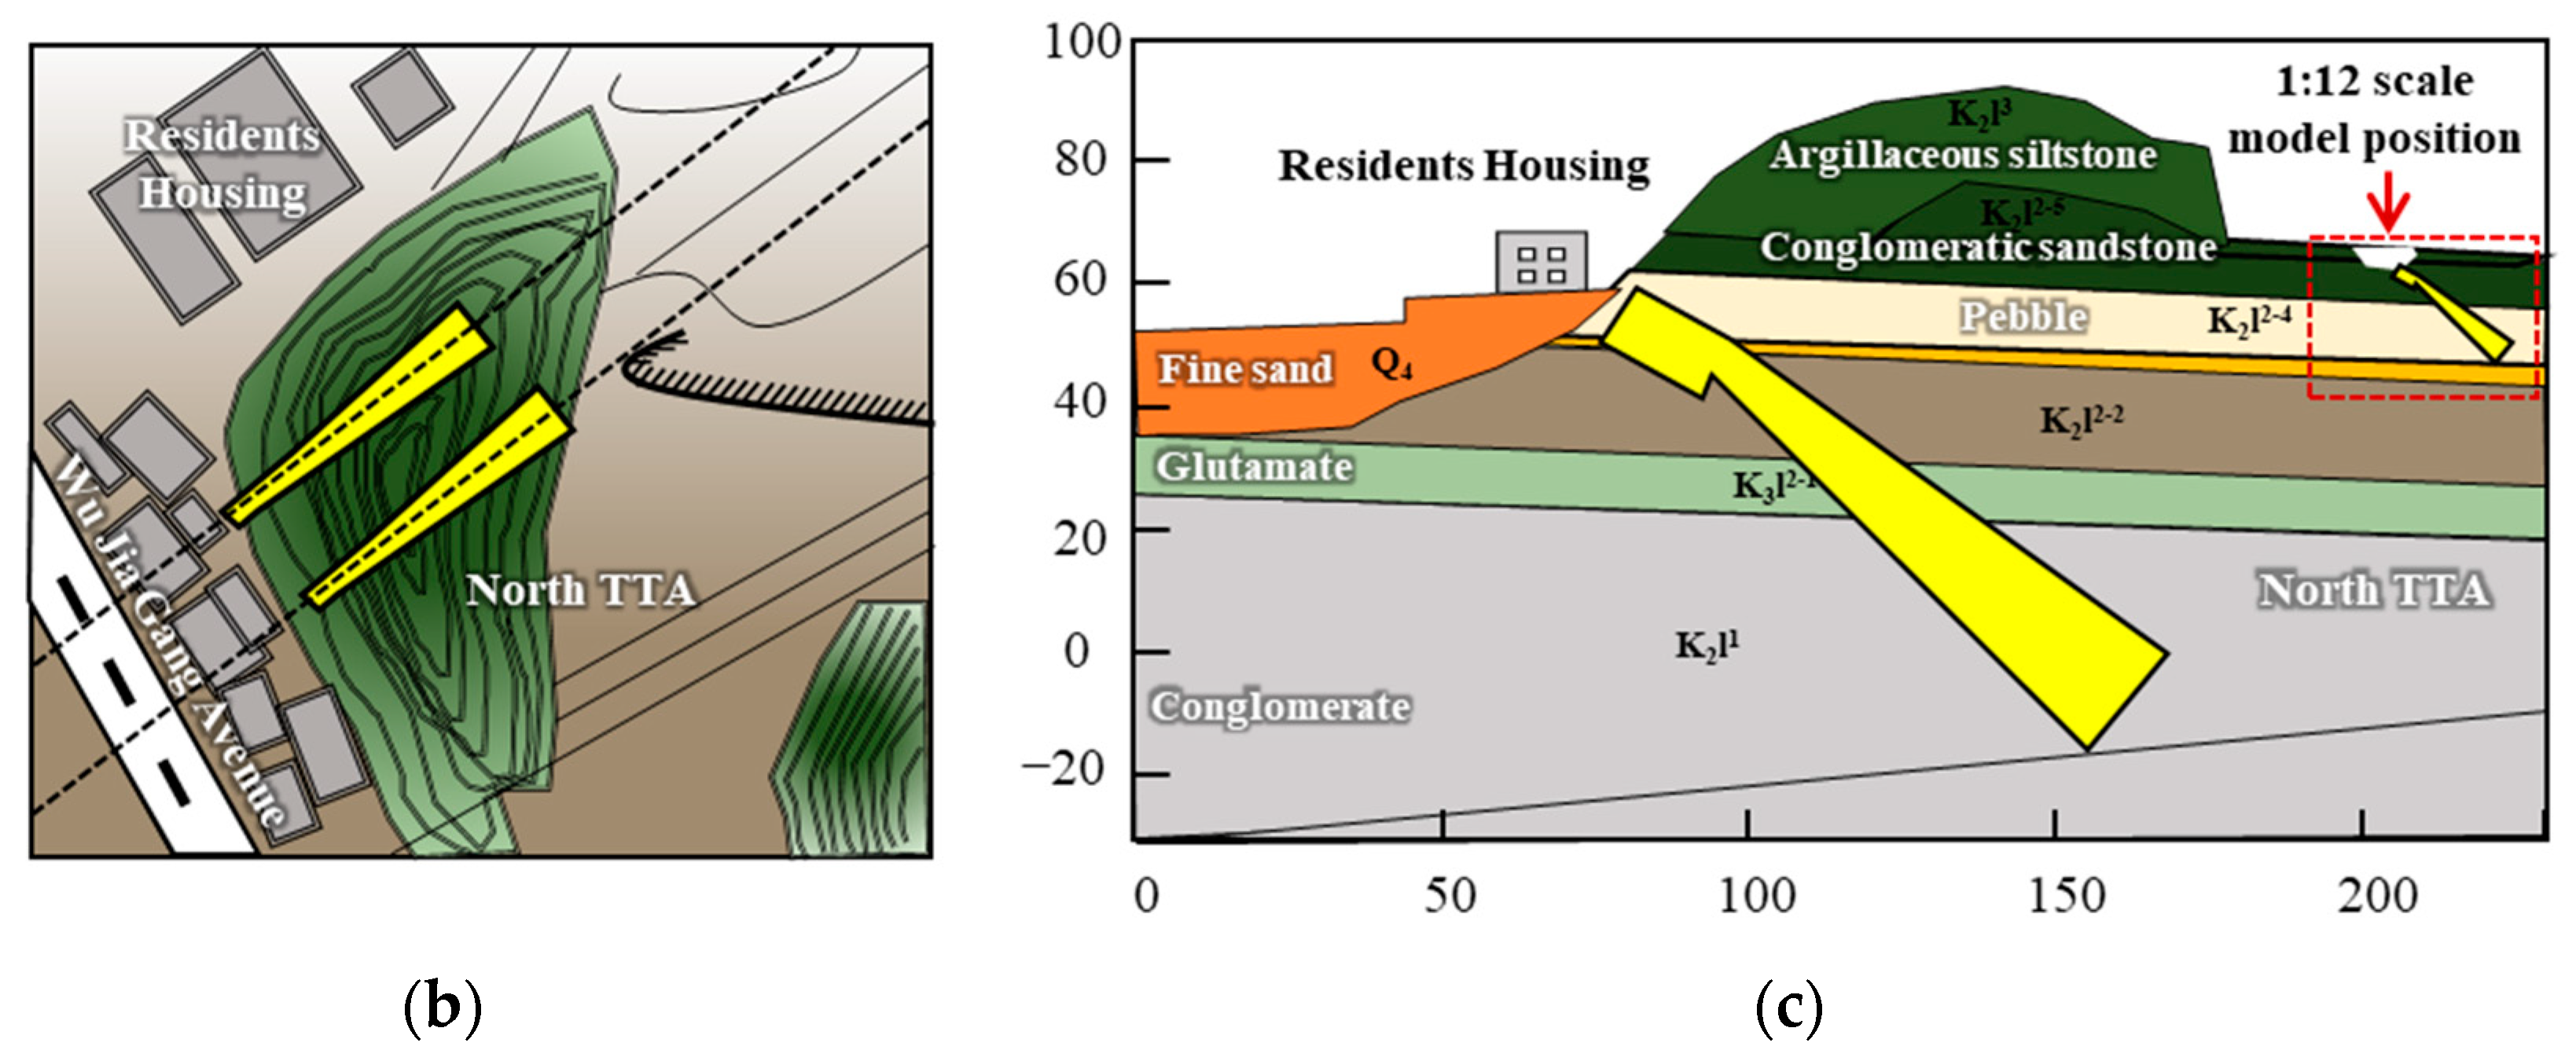
2.2. Engineering Geological Conditions

The anchor layout of the tunnel on the north side of the river is placed on the low hill on the east side of Wulin Road. The ground elevation of the top of the mountain is 90.5~91.5 m, the length is about 230 m, the width is 60~130 m, and the topographic slope angle is 15°~20°. The anchor plug section of the main stress-bearing part of the tunnel anchor is mainly arranged below the elevation of 31.205 m, which is about 60 m thick, relative to the overlying mountain on the top of the mountain, about 102 m deep at the lowest part, and more than 20 m below the lowest part of the depression around the mountain. As shown in Figure 1a, the mountain bedrock at the anchor of the north side tunnel is exposed, and the rock stratum is in a nearly horizontal and gently inclined slope, intersecting with the mountain trend and the axial direction of the tunnel anchor at a large angle. Except for that the upper part is about 6.2~10.6 m thick, which is K2l2-5 sandy conglomerate (accounting for about 66%), silty fine sandstone (accounting for about 33%) with a small amount of argillaceous siltstone (accounting for about 1%) interlayer, it is mainly K2l1 argillaceous calcareous cemented conglomerate, which belongs to relatively soft rock. The structure of the rock body is not developed, and there are no faults and fractures. The rock mass is slightly new. There is no groundwater in the rock mass. The main stress-bearing part of the tunnel anchor—the anchor plug body is deeply buried underground, and the thickness of the overlying mountain is large. Although the mud calcareous cemented conglomerate around the anchor plug is relatively soft, the rock mass is fresh and complete, and the overall rock mass quality is mainly grade III. The rock classification of this project and the experimental site is based on the Chinese national standard specification “Engineering Rock Classification Standard GBT50218-2014” [26]. There is no groundwater in the rock mass. Generally speaking, the topographic and geological conditions of the anchor part of the north side tunnel are good, and the tunnel anchor scheme is well combined with the topographic and geological conditions.

3. Field-Scale Experiment

3.1. Test Basis and Site Conditions

The scale model experiment of tunnel anchor is based on the similarity principle of elasticity [27,28]. According to the similarity principle, the model and prototype shall be made of the same materials, and the geometric size of the model shall be reduced by the geometric size of the prototype in a certain proportion. When the physical strength is not considered, the parameters of the model and prototype meet the Equation (1).
{ R m = R p E m = E p L m = L p C N m = N p C 2
where Rm and Rp are the strength of the model and prototype, respectively; Em and Ep are the elastic (deformation) modulus of the model and prototype, respectively; Lm and Lp are the geometric dimensions of the model and prototype, respectively; Nm and Np are loads of the model and prototype, respectively; C is the geometric similarity ratio.
When carrying out the tunnel anchor scale model experiment on site, in addition to scaling the geometric size of the tunnel anchor according to the similarity ratio, the model experiment part shall also meet the terrain similarity. In the open flat area where the model experiment is to be carried out, a certain depth shall be excavated manually. After forming a tunnel face similar to the terrain of the solid anchor, then excavate the test anchor hole on the tunnel face according to the structural size of the tunnel anchor and the similar ratio, as shown in the right part of Figure 1c. Therefore, after excavation, according to the above methods, the layout of the on-site scale-model experiment in this topic can meet the terrain shape similarity conditions. Moreover, it should be representative of information lithology in addition to satisfying the above terrain similarity [29,30]. In this study, the stratum distribution after anchor tunnel excavation in the model experiment is shown in Figure 1c. To ensure the similarity of the properties of the stratum in the model experiment, an acoustic wave test was carried out on the stratum in the model experiment. The anchor of the solid tunnel is located in the upper part of the first member (K2l1) and the lower part of the second member (K2l2) of the Luojingtan Formation, and the lithology of the stratum is a micro-new conglomerate. The model anchors are located in the upper part of the second member (K2l2) and the lower part of the third member (K2l3), and the lithology of the strata is a medium-weathered conglomerate and sandy conglomerate. The instrument used for rock acoustic testing is RSM-SY6 foundation pile acoustic detector, which is composed of mainframe, cross-hole transducer, cable, plane transducer, and other major parts. It has two channels, with separate sampling mode of emission and receipt, sampling interval 0.1~200 μs, emission voltage up to 500 V~1000 V, acoustic frequency band width 1~500 kHz, and minimum measurement distance up to 1 cm. The acoustic wave velocity of rock mass at the solid anchor position is 4000–5000 m/s, and that of rock mass at the model anchor position is 3000–4000 m/s. Compared with a solid anchor, the model experiment site has similar lithologic distribution, but the quality of rock mass is slightly worse than that of a solid anchor. However, according to the discussion and analysis of the test results, the test site is similar to the topography and geological conditions of the real bridge anchor, and the rock quality of the real bridge anchor is slightly better than that of the model anchor; therefore, the test results can represent the deformation and strength characteristics of the real bridge anchor and are on the safe side.

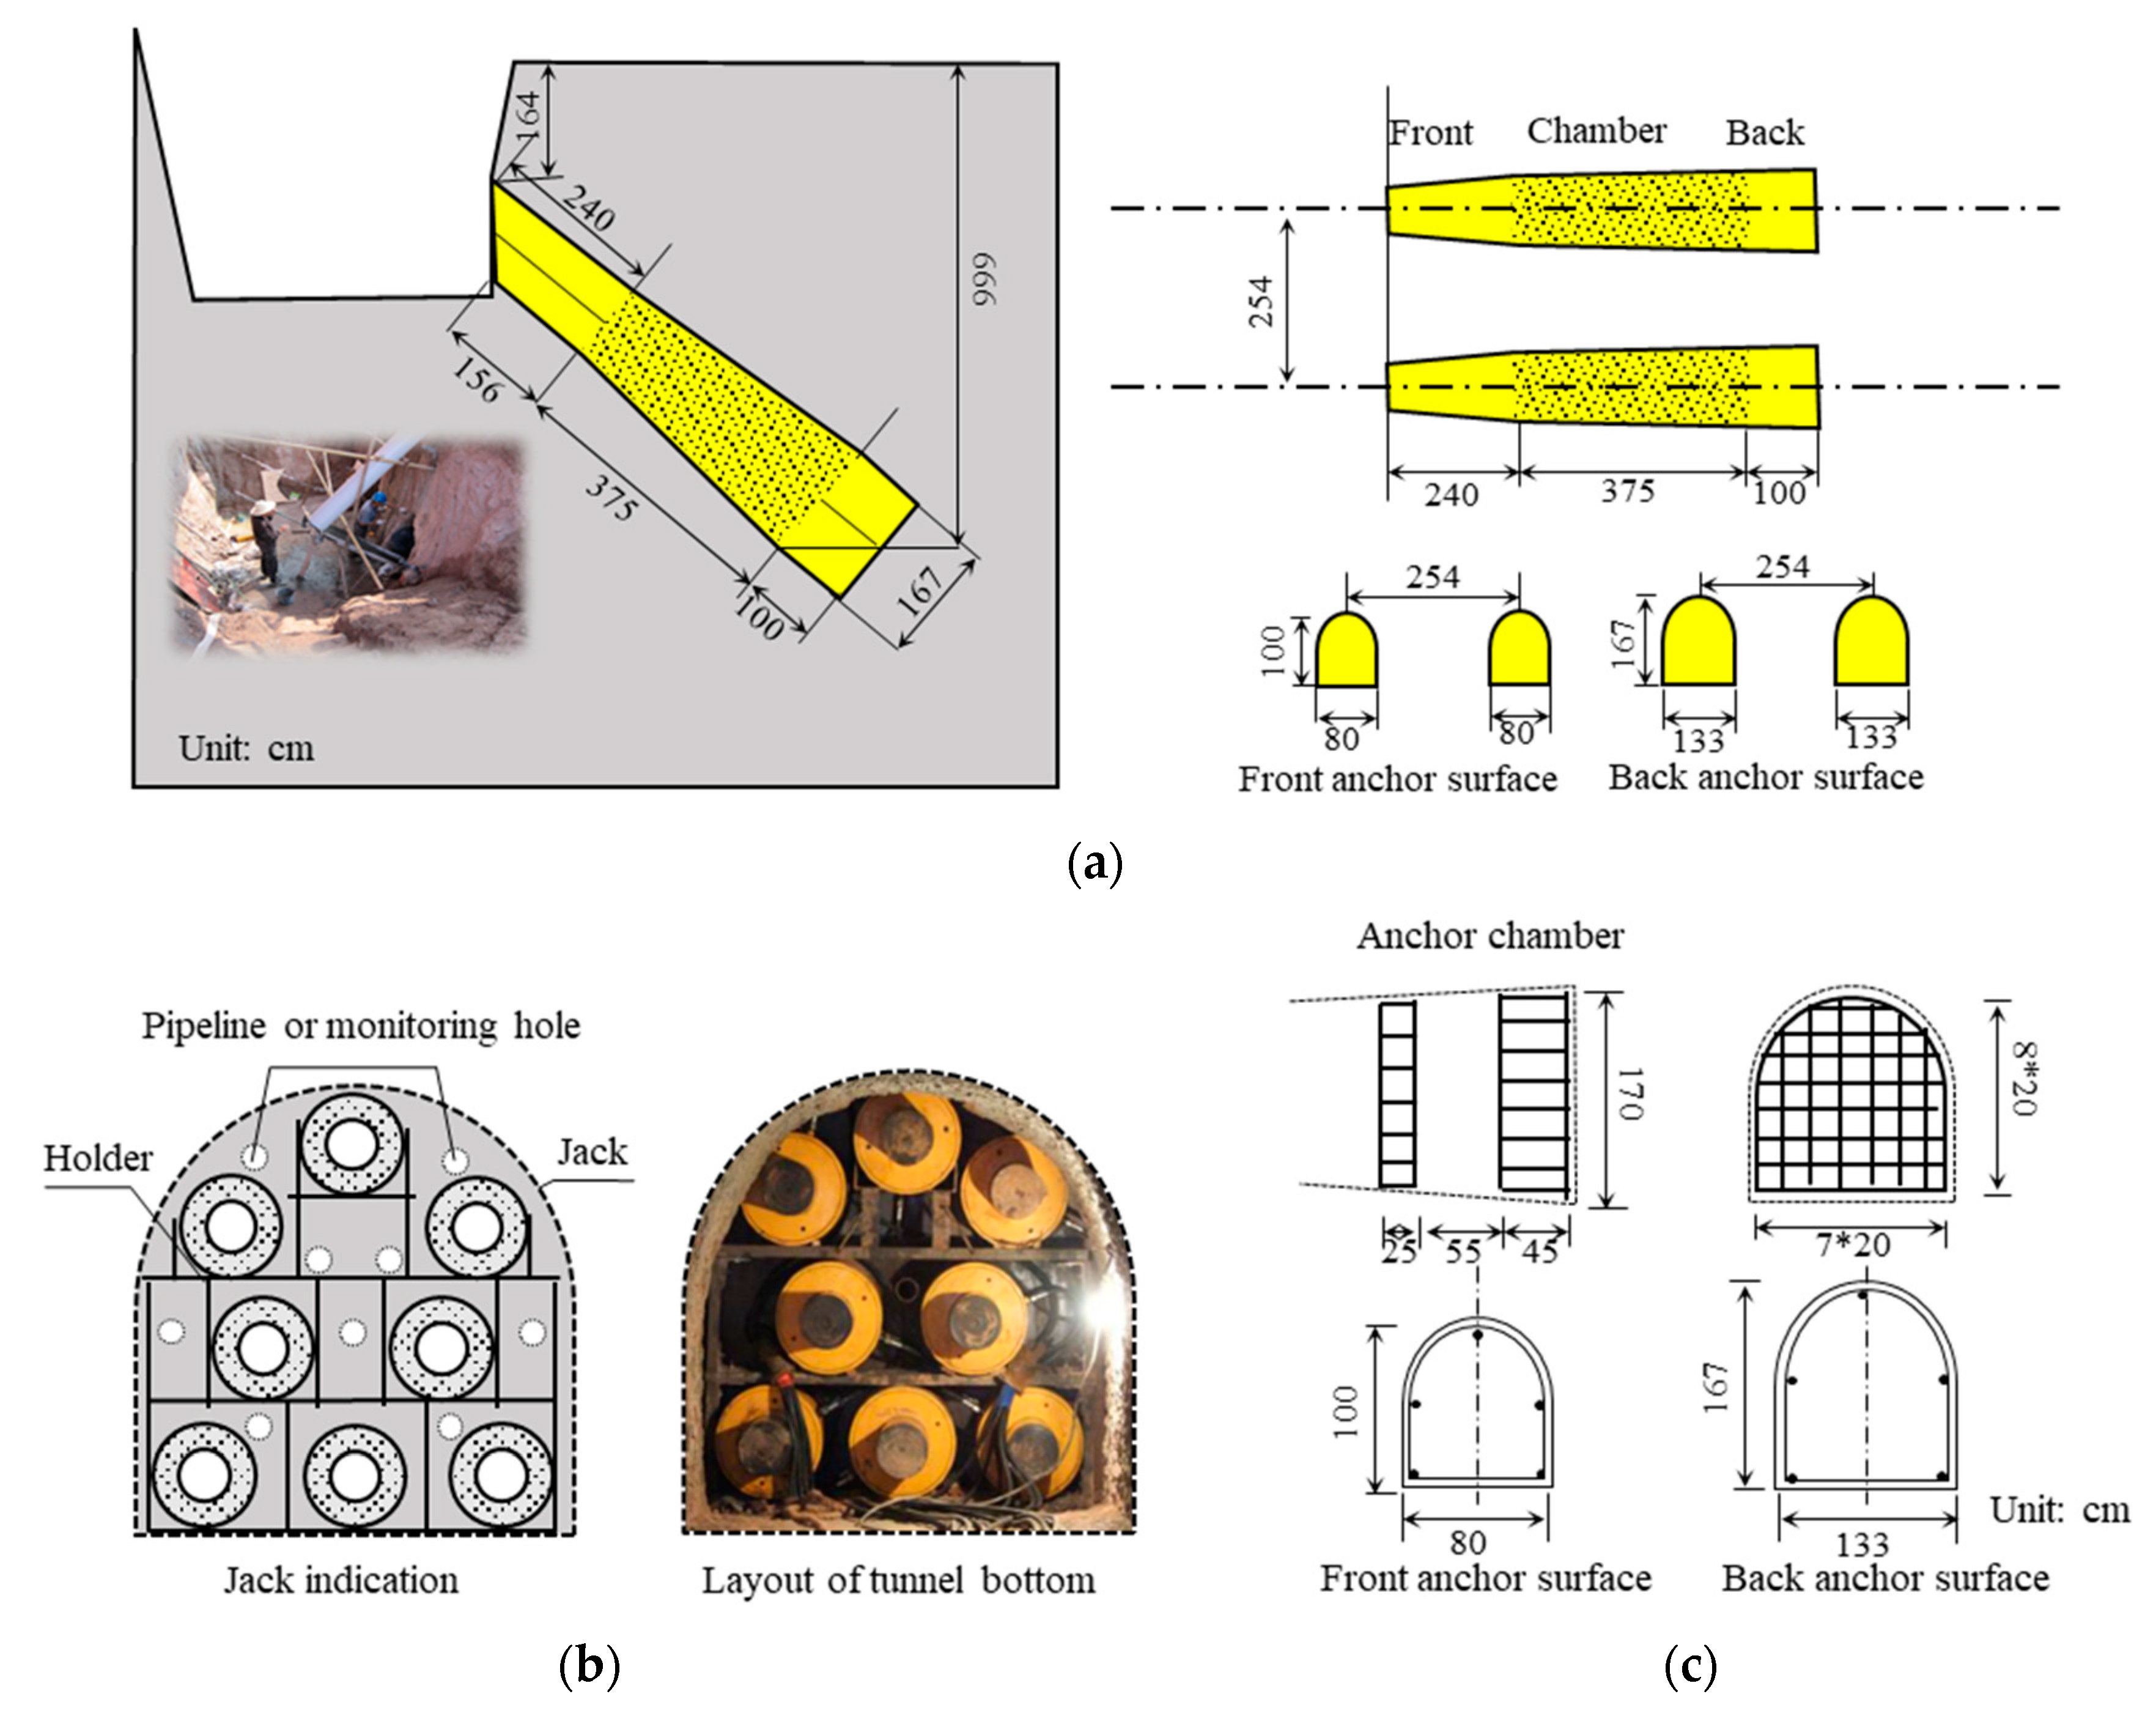
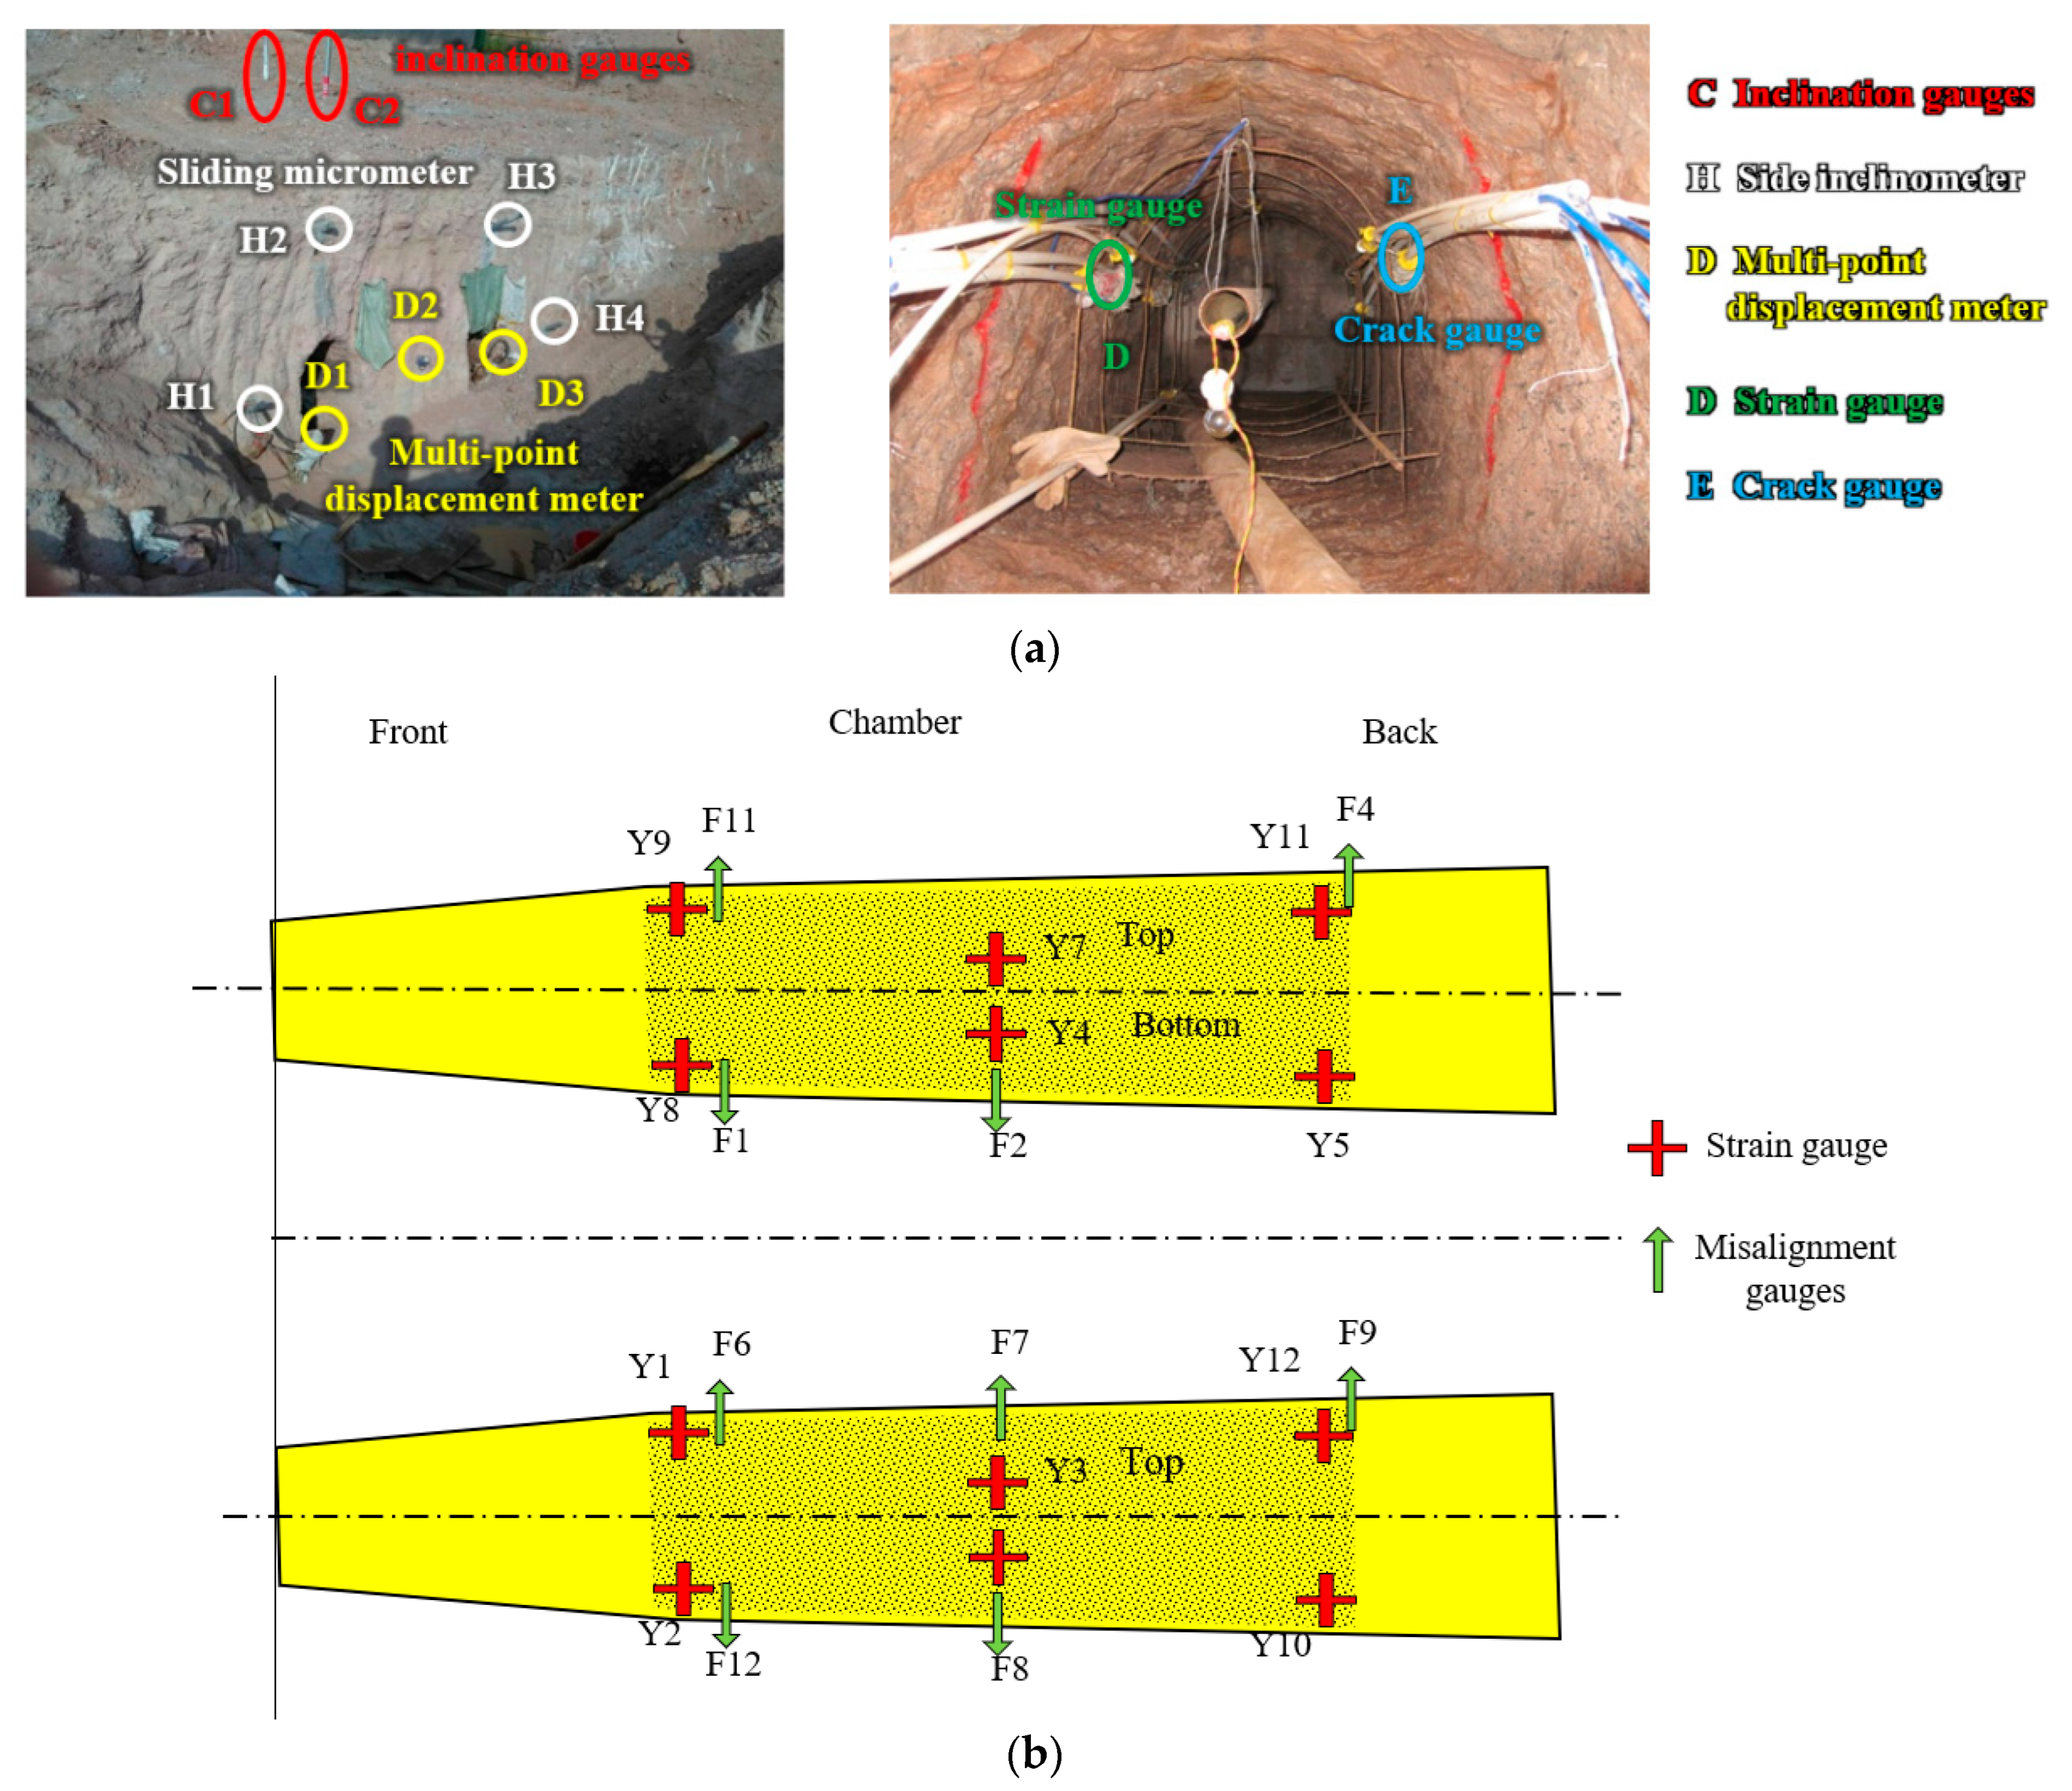
3.2. Model Construction and Measuring Point Layout

3.2.1. Layout of Measuring Points

During the test, three multi-point displacement meter holes, four sliding micrometer holes, and two inclination holes were set in the anchor plug body enclosure to monitor the enclosure deformation. Twelve strain gauges are arranged in the anchor plug body to monitor the deformation law of the anchor plug body. Twelve staggered joint meters are arranged on the contact surface between the anchor plug body and the surrounding rock to monitor the relative deformation between the anchor plug body and the surrounding rock. The specific layout and quantity are shown in Figure 2b. Where H1~H4 are sliding micrometer holes, D1~D3 are multi-point displacement gauges, and C1~C2 are inclination gauges. The schematic diagram of the measurement points in the model anchor is shown in Figure 2b, where Y1~Y12 are strain gauge measurement points, and F1~F12 are misalignment gauges.

3.2.2. Model Building
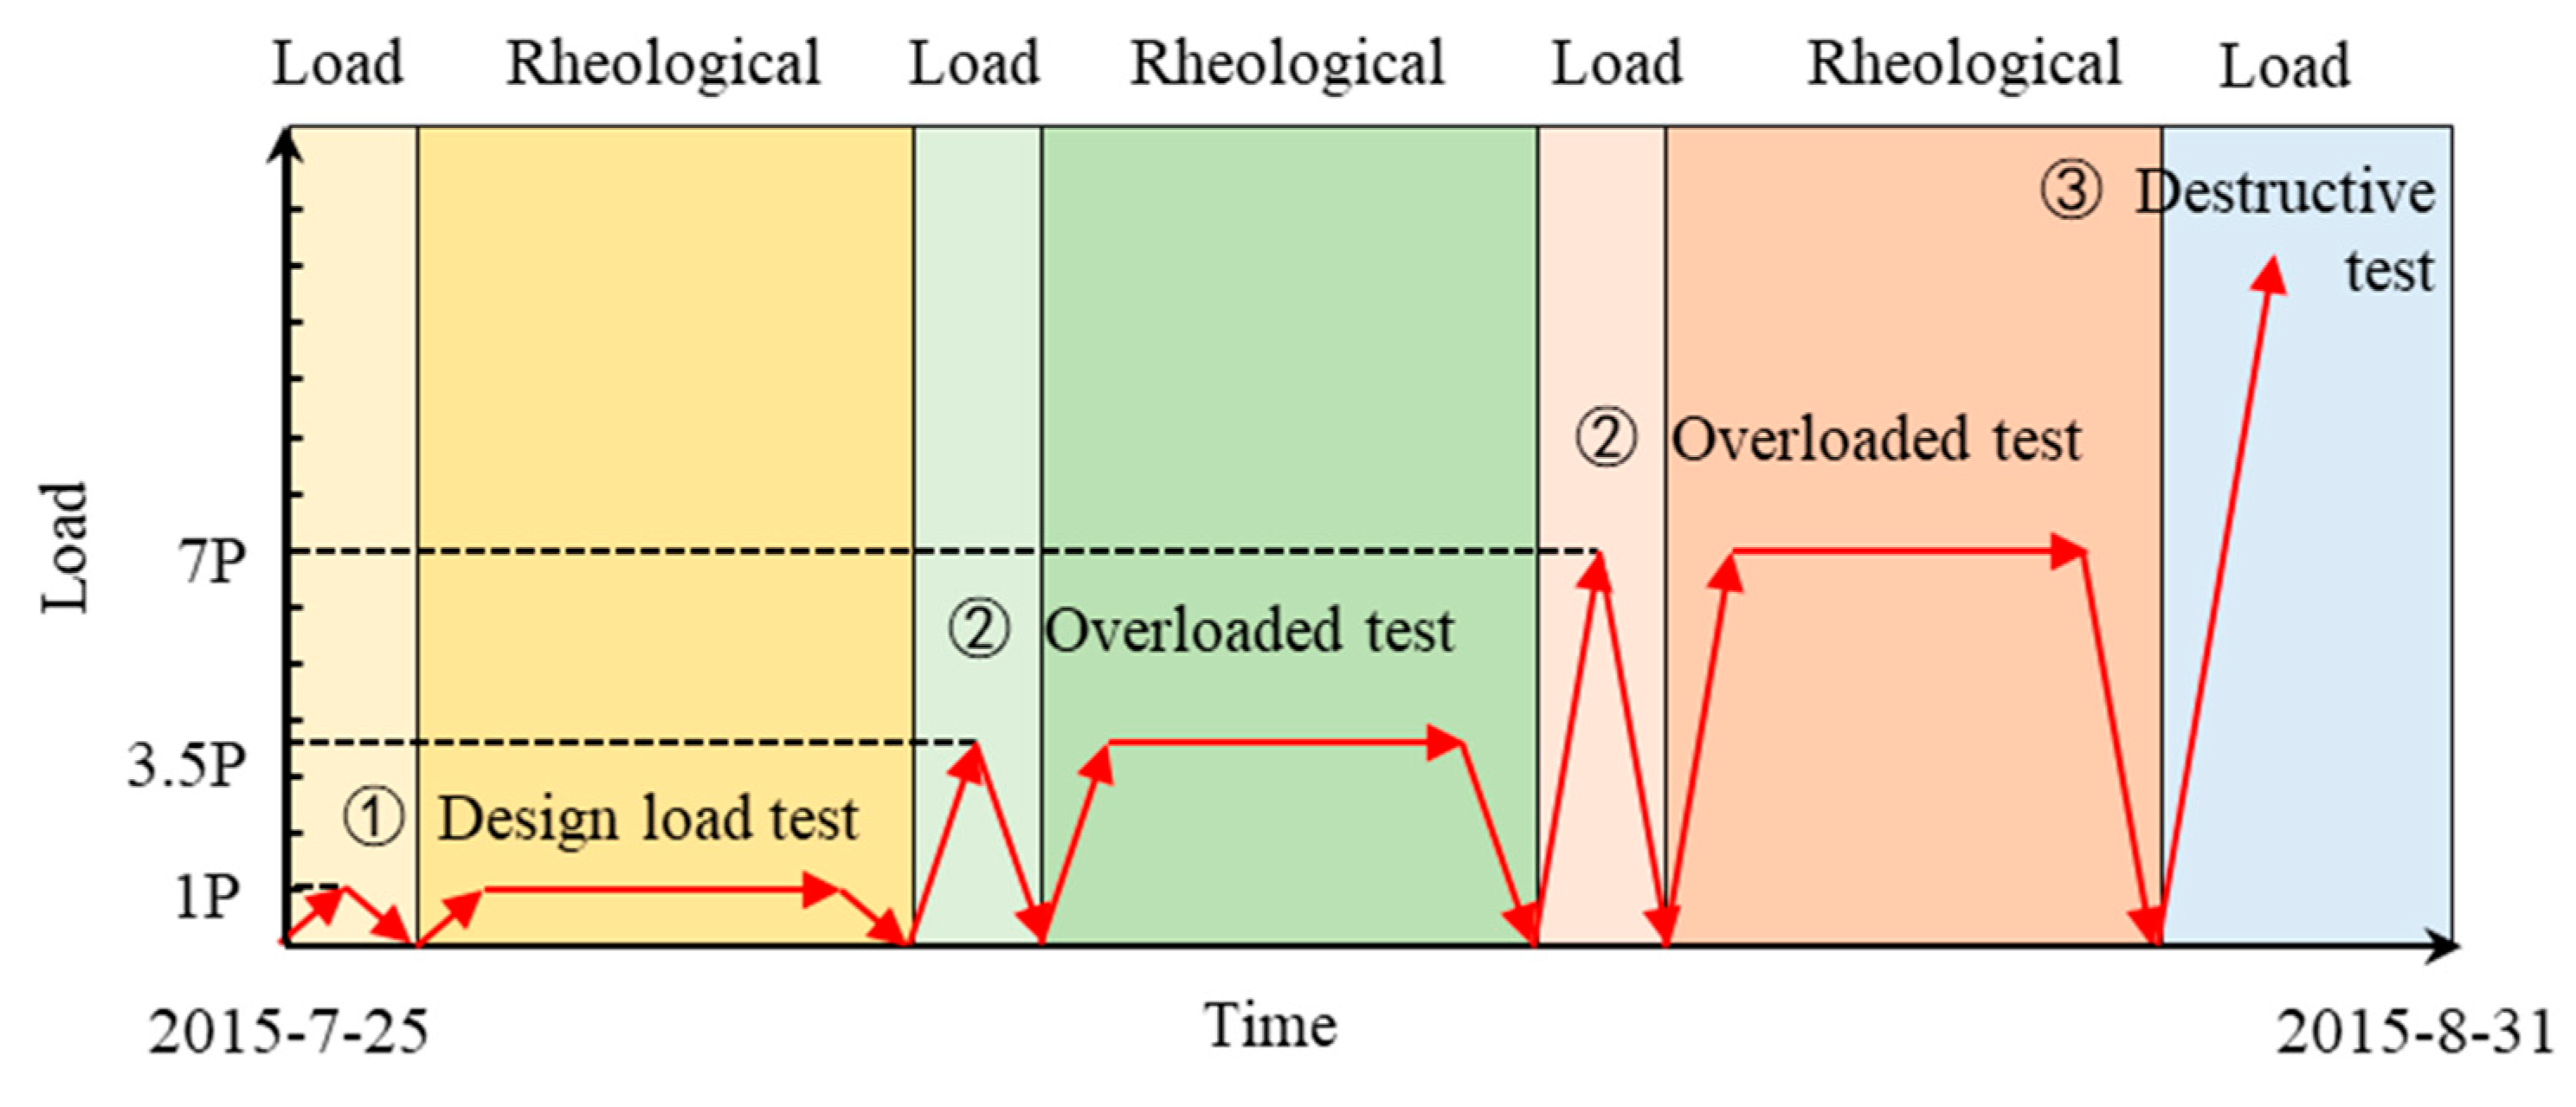
The scale model is made according to 1:12 (C = 12). The model anchor hole should meet the boundary requirements: the maximum buried depth is 6.66 m. The distance between the axes of two model anchor holes is 2.54 m. The model anchor hole is divided into a front anchor chamber, anchor chamber, and rear anchor chamber. The length of the front anchor chamber is 2.4 m, the length of the anchor chamber is 3.75 m, and the length of the rear anchor chamber is 1.0 m. The cross-section of the model hole adopts a circular arc at the top and a straight line at the sidewall and bottom. The size of the front anchor surface is 0.8 m × 1 m, and the radius of the top arc is 0.4 m. The size of the rear anchor surface is 1.33 m × 1.67 m, and the radius of the top arc is 0.66 m. The size of the bottom of the hole is 1.5 m × 1.7 m, and the radius of the top arc is 0.75 m. The front anchor chamber, the anchor chamber, and the rear anchor chamber are all wedges with a small front and large back. The inclination angle of the whole model anchor hole axis and a horizontal line is 40°. The model is shown in Figure 3.
The test loading method is pushed back, the jacks are arranged at the rear end of the anchor body, and the reaction force is provided by the rock mass behind the anchor body. After the excavation of the anchor hole, install 8 jacks in the rear anchor chamber. To make the jacking force evenly transmitted to the rock mass and the anchor body, the front and rear ends of the jack are poured with reinforced concrete reaction plates. The thickness of the rear end reaction plate is 50 cm, and the thickness of the front end reaction plate is 30 cm. Jack installation is shown in Figure 3b. Eight 300 t jacks are arranged at the trailing edge of a single anchor plug body, and the maximum output can reach 2000 t. According to the similarity principle, it is equivalent to applying a maximum load of 288,000 t on the trailing edge of a single solid anchor plug body, which is about 13 times the design load NP (22,000 t). The reinforcement of the reaction plate adopts φ 10 mm deformed steel bar with a spacing of 25~30 cm. See Figure 3c for location and reinforcement. The reinforcement arrangement of the model anchor body is shown in Figure 3c. Use φ 10 mm deformed steel bar, 5 single anchor longitudinal bars, and 3 stirrups. The anchor plug body adopts C40 commercial concrete.

3.3. Test Procedure

According to the above test design scheme, to comprehensively study and test the stress, deformation, and failure characteristics of TTA in soft rock stratum, this experiment needs to carry out a design load test, overload test, and failure test, respectively. Its loading and time are shown in Figure 4. Among them, two data tests, a load-bearing test, and a rheological test are carried out for loading tests at all levels. The specific implementation steps are as follows.
  • Design load test (1P)
1.
Load test. The single cycle method of step loading (unloading) is adopted. Firstly, the apparatus is loaded from zero and added to 1P in 5 steps (P is double the design load, the same below) and then decompressed to 0 in 5 steps. Each stage forms a pressurization and relief cycle. Stability criteria: Read immediately after the load is added, and then every 10 min. When the deformation difference of two consecutive times is less than 0.002 mm, it is considered that the deformation under this level of the load has been stable. The first level load can be applied (unloaded), and the reading method in the unloading process is the same as that in loading. Among them, the most advanced stabilization time is 20 min. If necessary, repeat the above steps 1~2 times, and the interval between the two times shall not be less than 60 min.
2.
Load rheological test. After loading to 1p load in a large cycle step-by-step, keep the load unchanged, and measure the readings of all instruments at 5 min, 10 min, 15 min, 20 min, 25 min, 30 min, 1 h, 2 h, 4 h, 8 h, 16 h, and 24 h, respectively. After 24 h, read twice a day. Rheological stability standard: the difference between two readings in 24 h shall not be greater than 0.002 mm, and the loading duration shall not be less than 5 days.
  • Overload test (3.5P, 7P)
1.
Overload test. Using graded loading (unloading) large cycle method, respectively, use 3.5P, 7P overload test each time. The load is applied in 5~7 levels, each level is stabilized for 20 min, and the difference between two readings is not more than 0.002 mm, then unloaded to 0 in 5 levels.
2.
Rheology test. The rheological observations were carried out under 3.5P and 7P loads, respectively, and the observation time and stability criteria were the same as those in Figure 4.
  • Destruction test
The load loading rate is always kept less than 0.05 MPa/s during the test. Destruction tests were performed after the completion of 7P rheological observations. Destruction test followed the 1P grade difference graded large cycle, until the maximum force out of the jack. If one of the levels becomes damaged, this should make the anchor body displacement to the maximum load before the first level of load corresponding to the deformation of more than two times. If the maximum out of the jack still cannot destroy, then terminate the loading, and divide into 5 levels of unloading to zero.

4. Field-Scale Experiment Results

4.1. Design Load (1P) Test Results

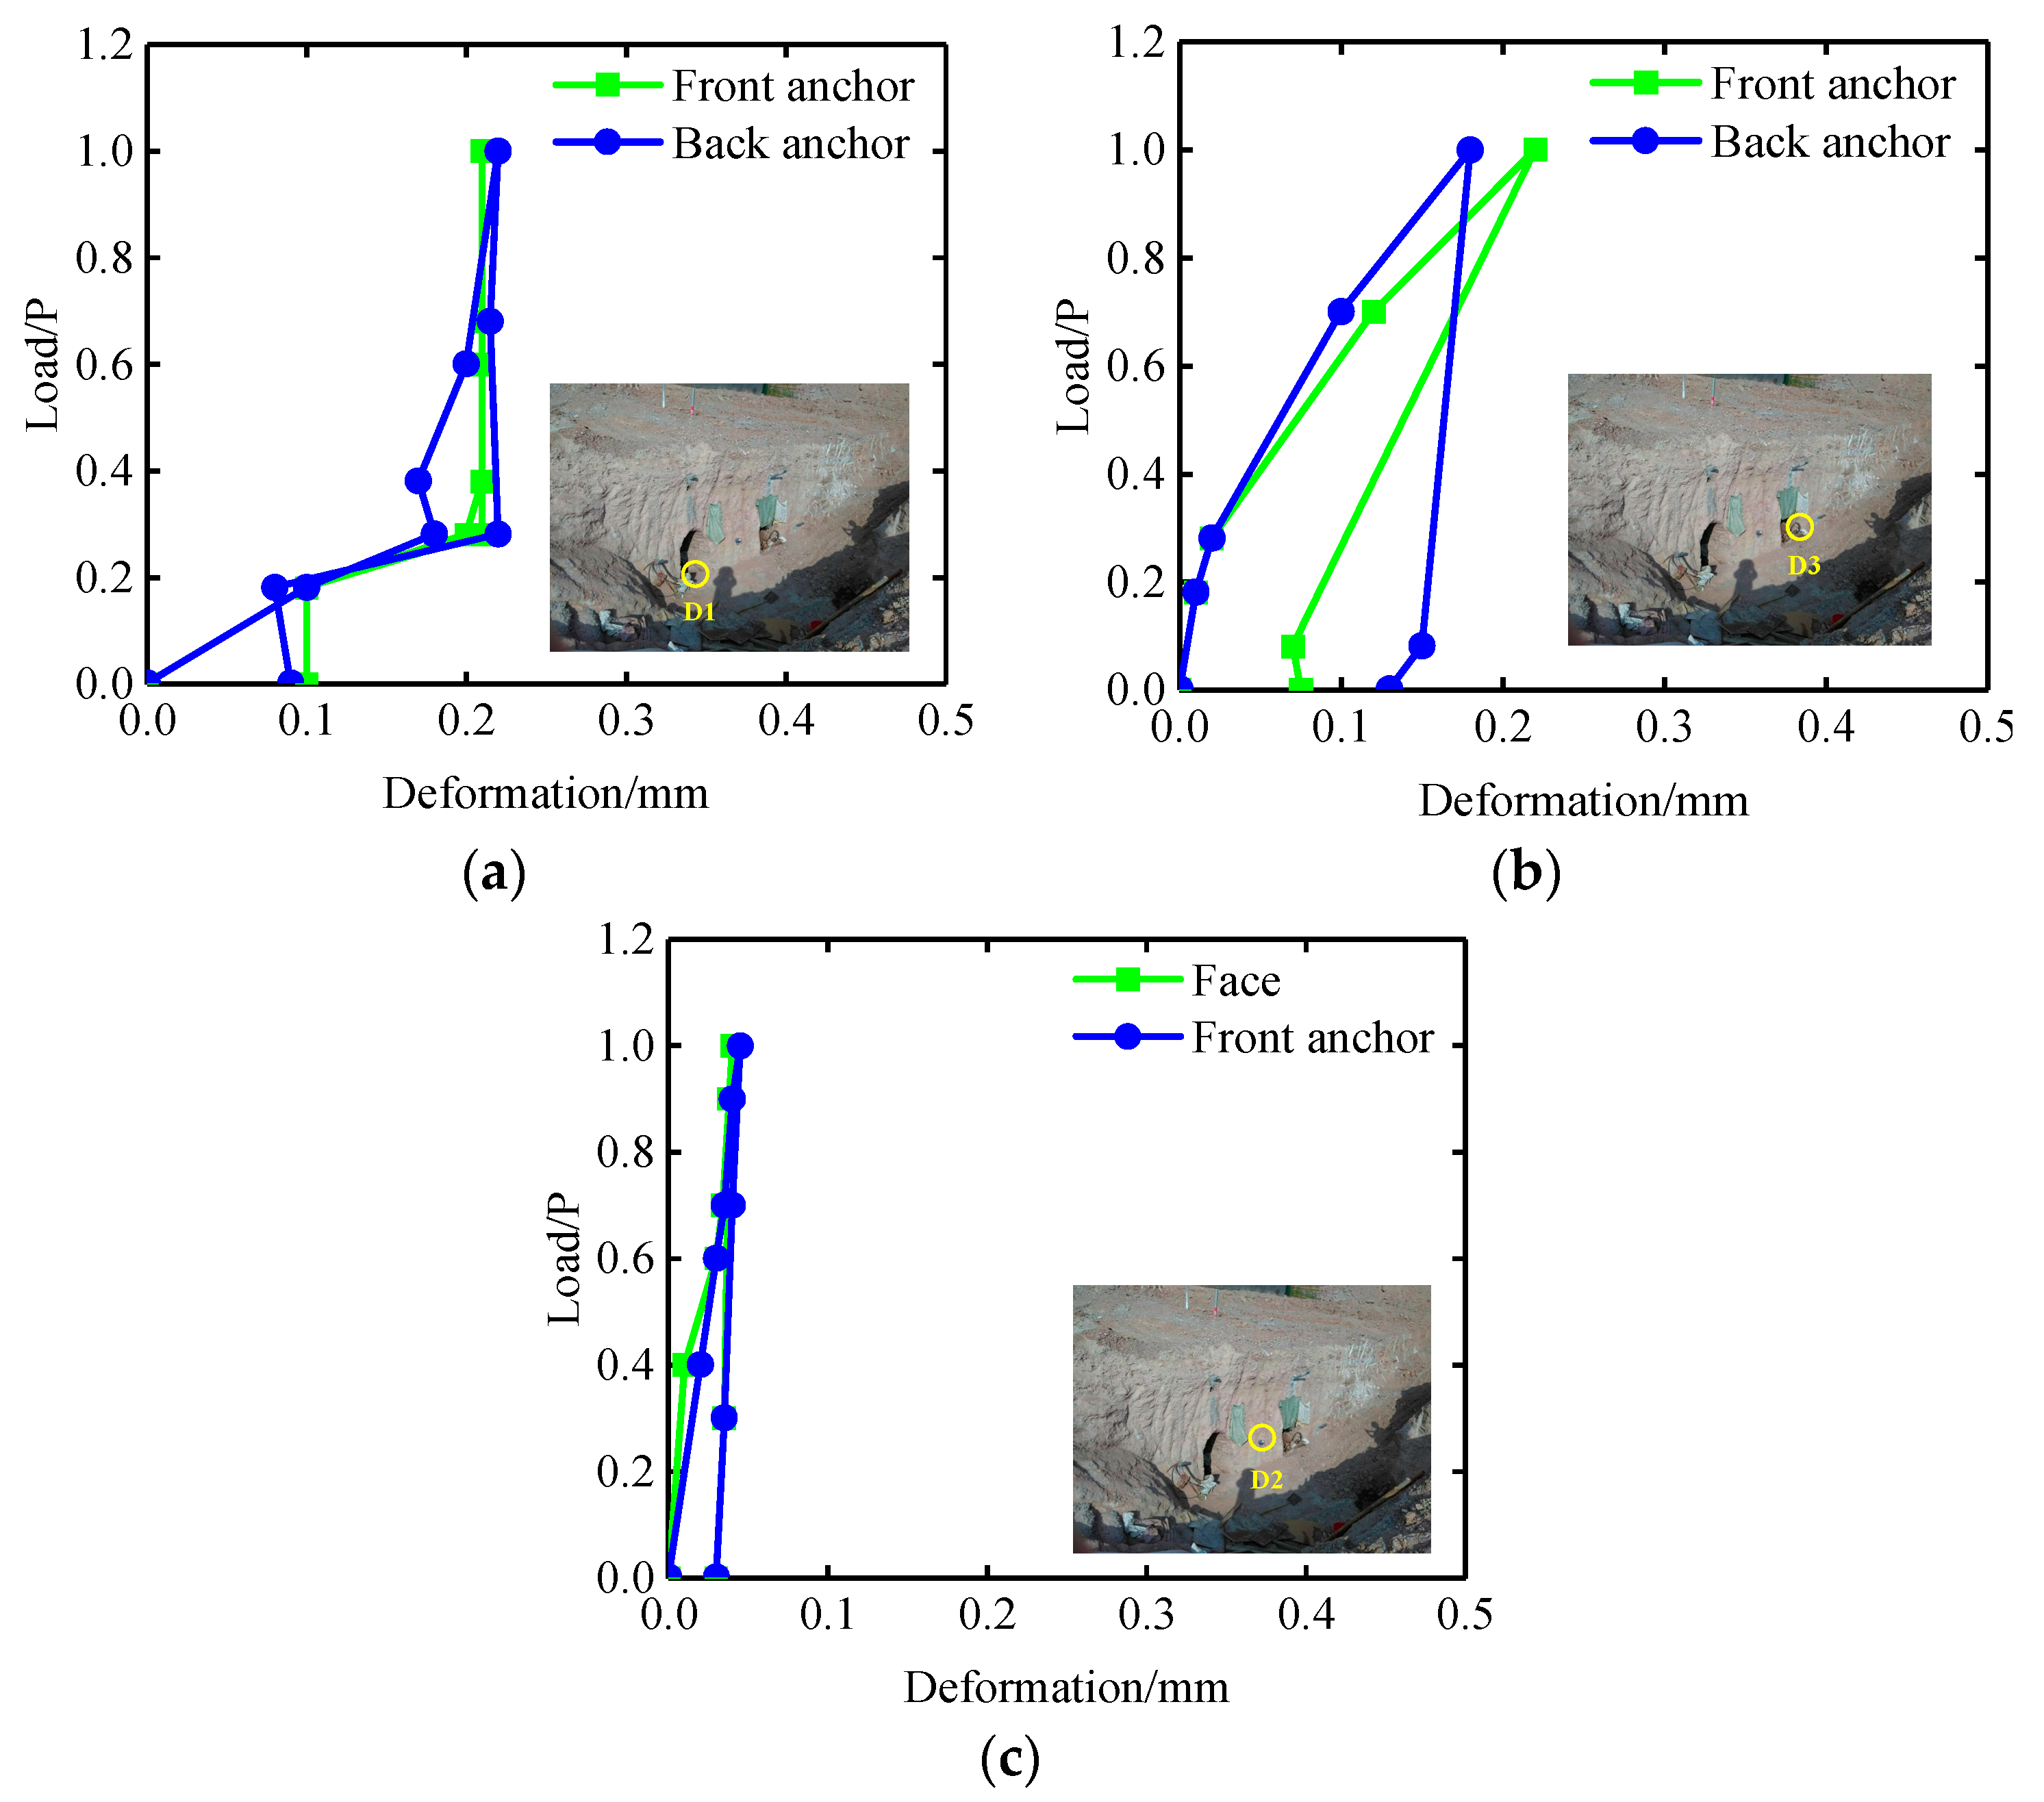
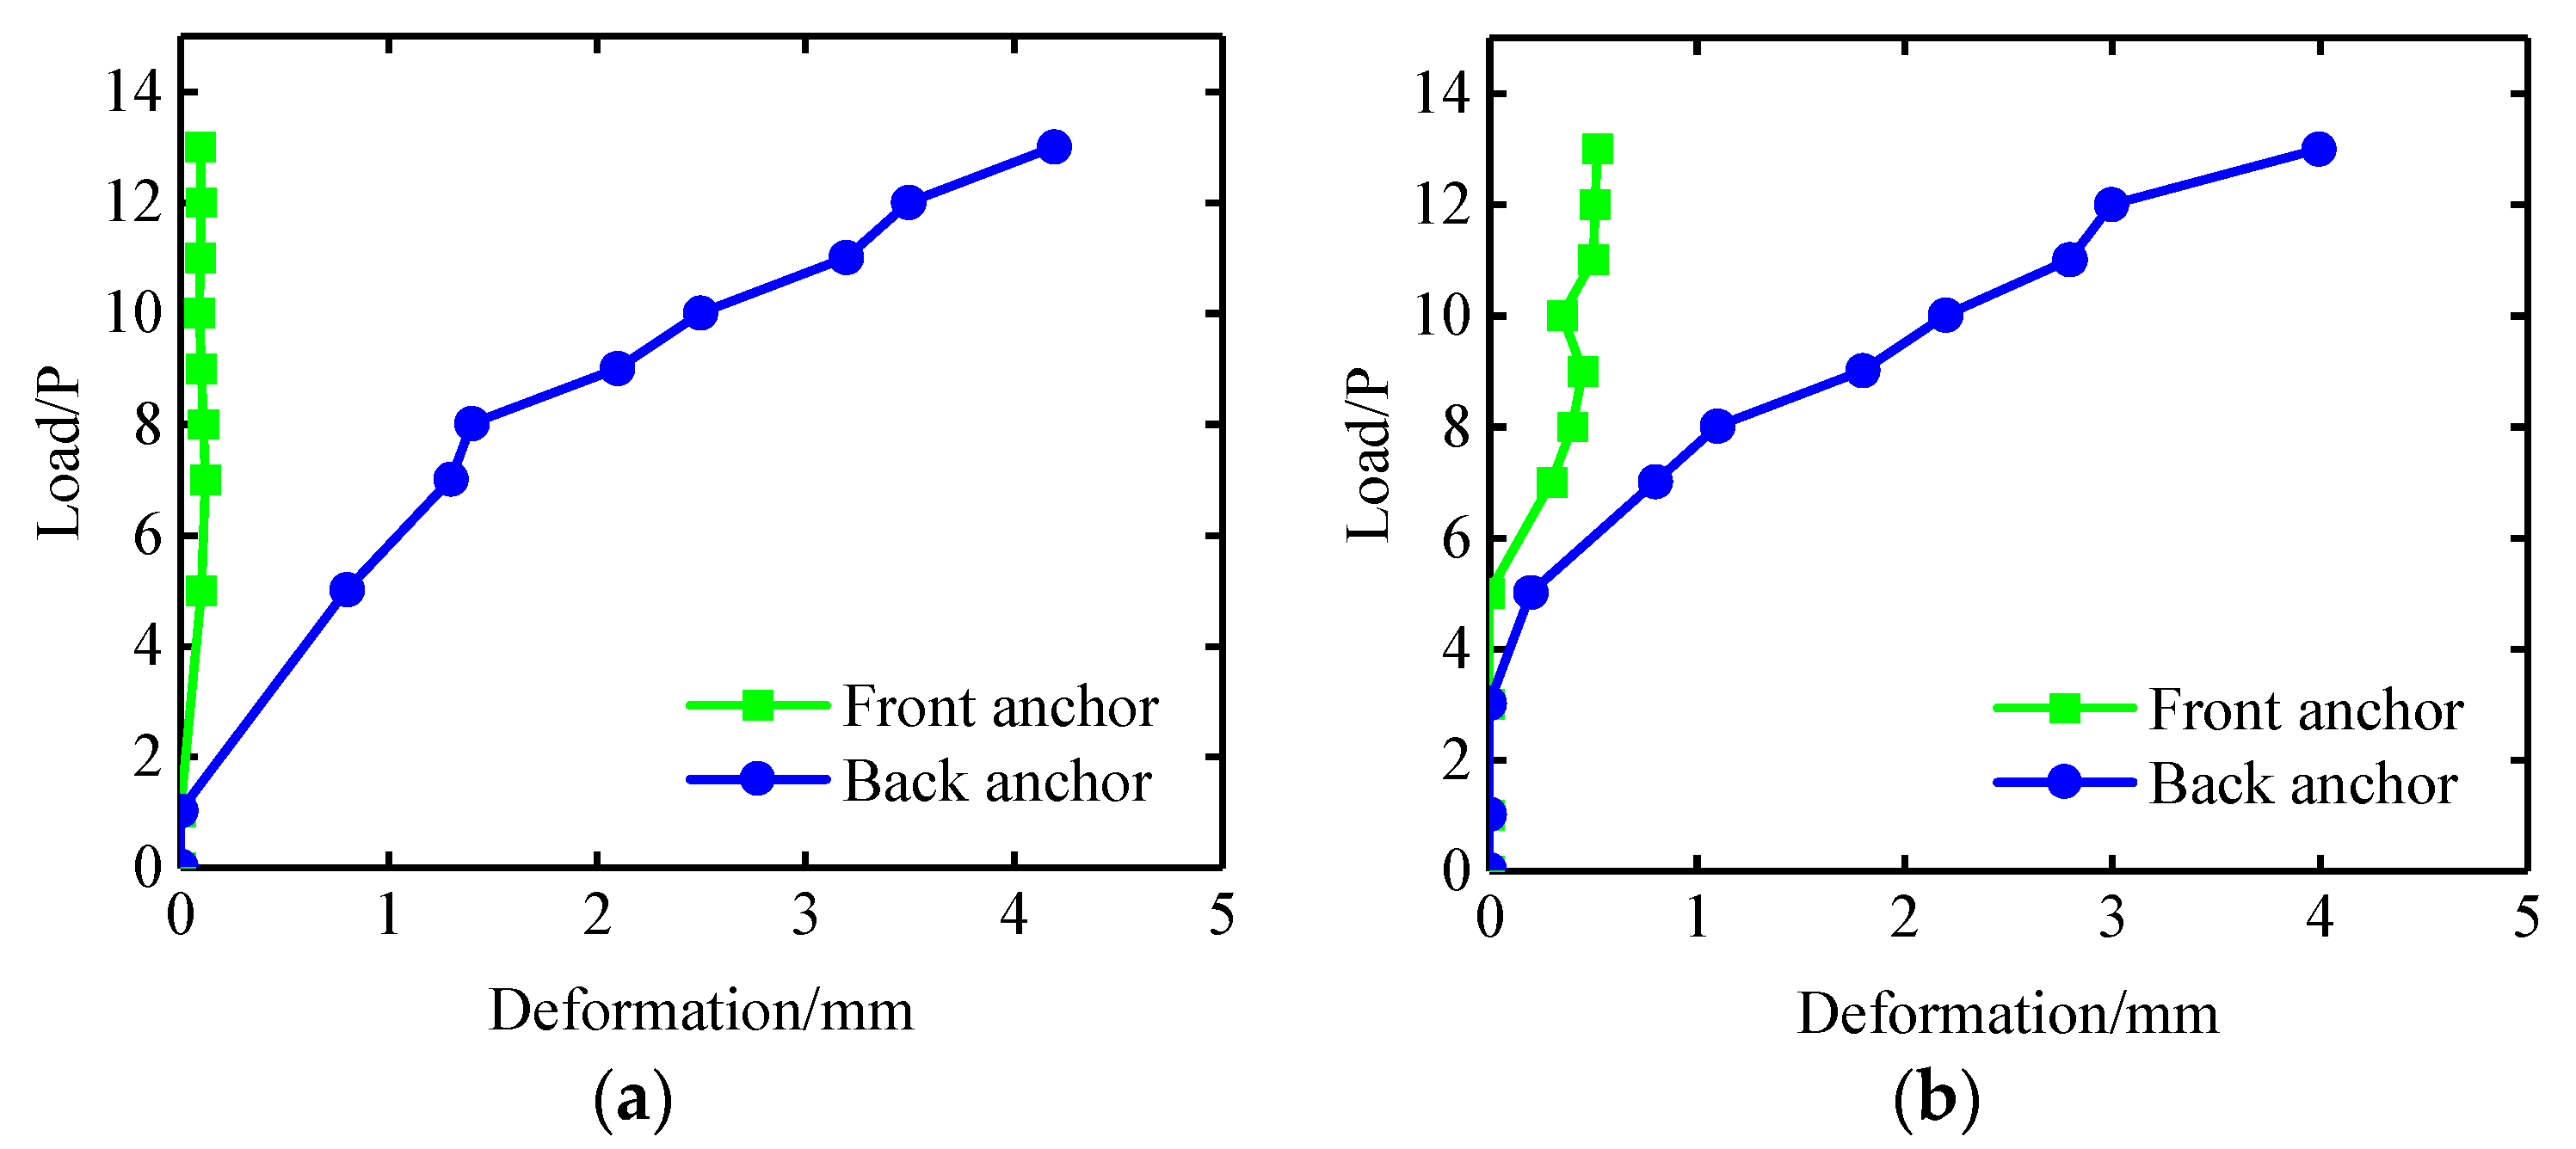
4.1.1. Test Results of Multipoint Displacement Meter

In the design load (1P) loading experiment, the test results of the multi-point displacement meter of the front and rear anchor surfaces of the left and right anchor plugs are shown in Figure 5a,b. It can be found from Figure 5 that the deformation of the left and right anchor plugs has little difference, about 0.2 mm, and the deformation of the front anchor surface and the rear anchor surface is only about 0.02 mm in the first stage of loading to 1P. In the design load (1P) loading test process, the test results of the multi-point displacement meter of the middle pier face are shown in Figure 5c. By analyzing Figure 5c, it can be found that the axial deformation of the middle pier rock mass in the tunnel anchor gradually increases in the test process of applying load to 1P in the initial classification. Under the design load (1P), the deformation of the middle pier face is 0.04 mm.

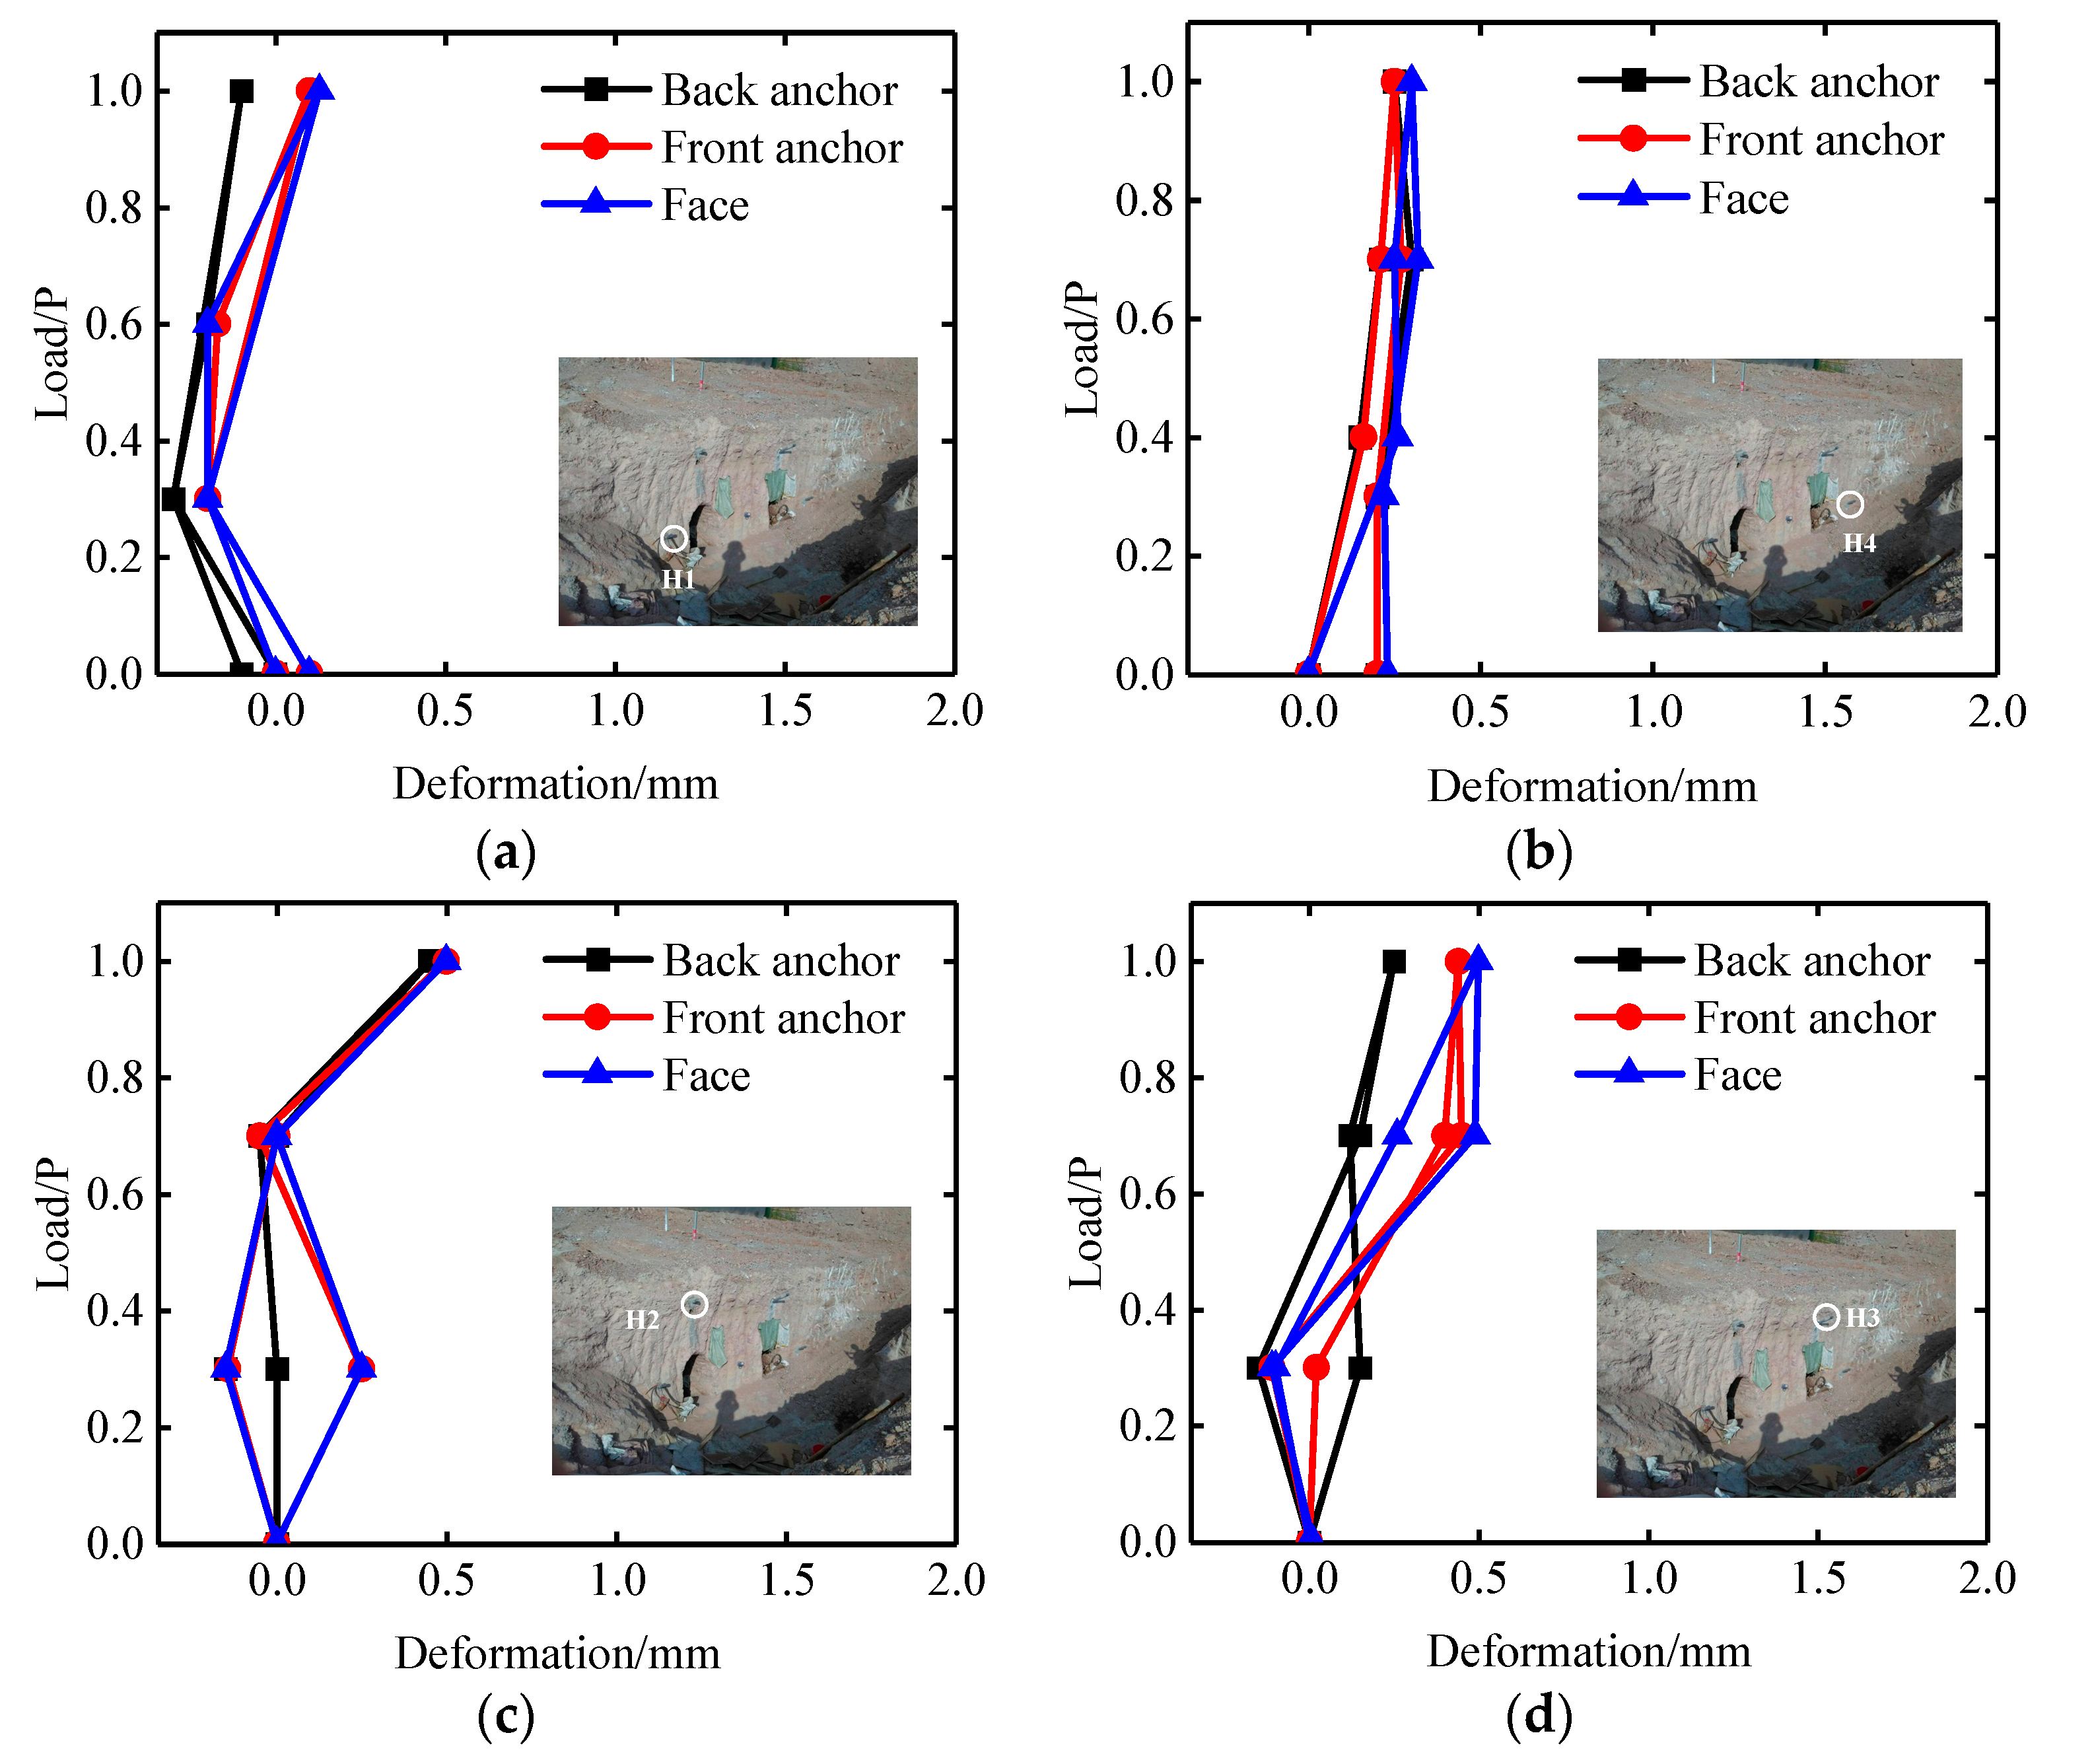
4.1.2. Test Results of Sliding Micrometer

During the design load (1P) loading experiment, the deformation monitoring curves of the three key points of the tunnel face, the front anchor face, and the back anchor face were measured by two sliding micrometers H1 and H4 of the surrounding rock outside the two anchor holes which are shown in Figure 6a,b. In the loading process, the deformation of the tunnel face of the surrounding rock outside the anchor hole is the largest, the deformation of the rock mass in the front anchor face is the second, and the deformation of the rock mass in the back anchor face is the smallest. Under the action of 1P load, the deformation of the tunnel face outside the left anchor tunnel is 0.1 mm, and that of the tunnel face outside the right anchor tunnel is 0.34 mm. During the design load (1P) loading test, the deformation monitoring curves of the three key points of the tunnel face, the front anchor face, and the back anchor face were measured by two sliding micrometers H2 and H3 at the top of the two anchor holes which are shown in Figure 6c,d. During the loading process, the deformation of the rock mass at the tunnel top is the largest, followed by the deformation of the rock mass at the front anchorage, and the deformation of the rock mass at the back anchorage is the smallest. Under the action of 1P load, the deformation of the tunnel face outside the left anchor tunnel is 0.46 mm, and that of the tunnel face outside the right anchor tunnel is 0.44 mm.

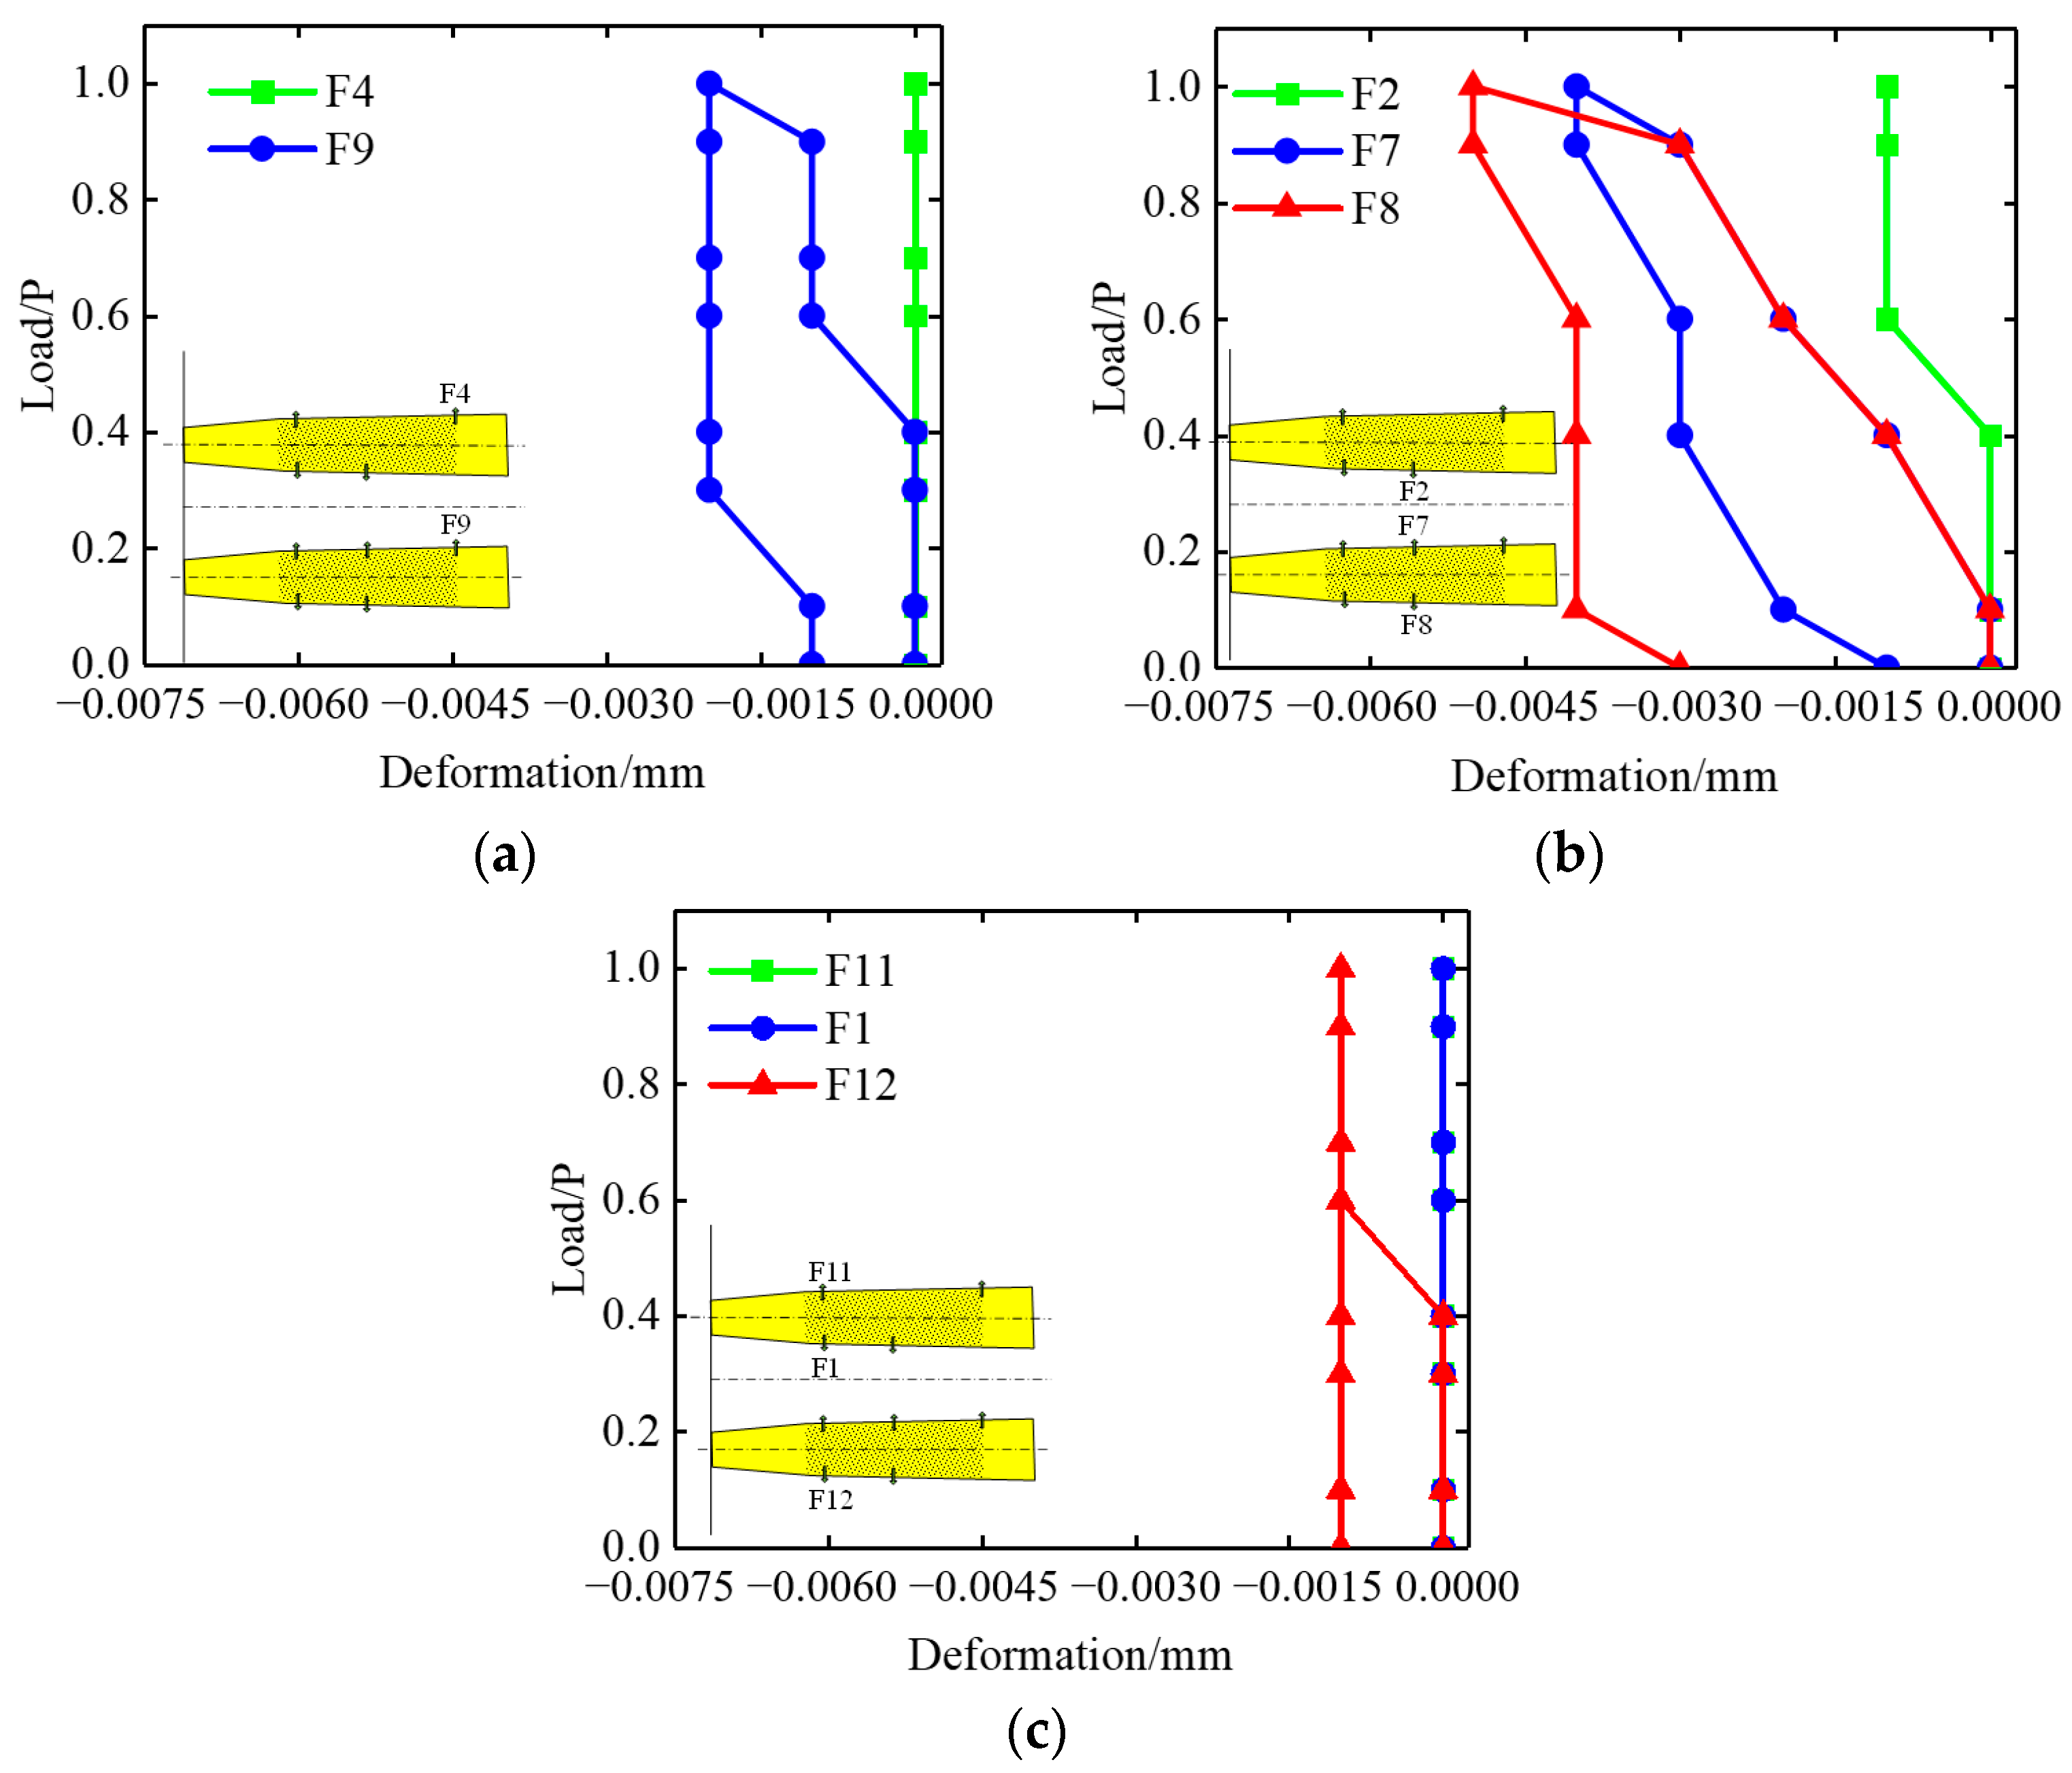
4.1.3. Test Results of Dislocation Meter

During the design load (1P) loading test, the relative deformation between the anchor plug and the surrounding rock measured by dislocation gauges arranged on the rear, middle, and front anchor surfaces of the left and right anchor plugs is shown in Figure 7. The test results show that under the design load (1P), the maximum deformation of the dislocation gauge in the middle of the anchor body is 0.005 mm, followed by 0.002 mm in the rear anchor surface and 0.001 mm in the front anchor surface.

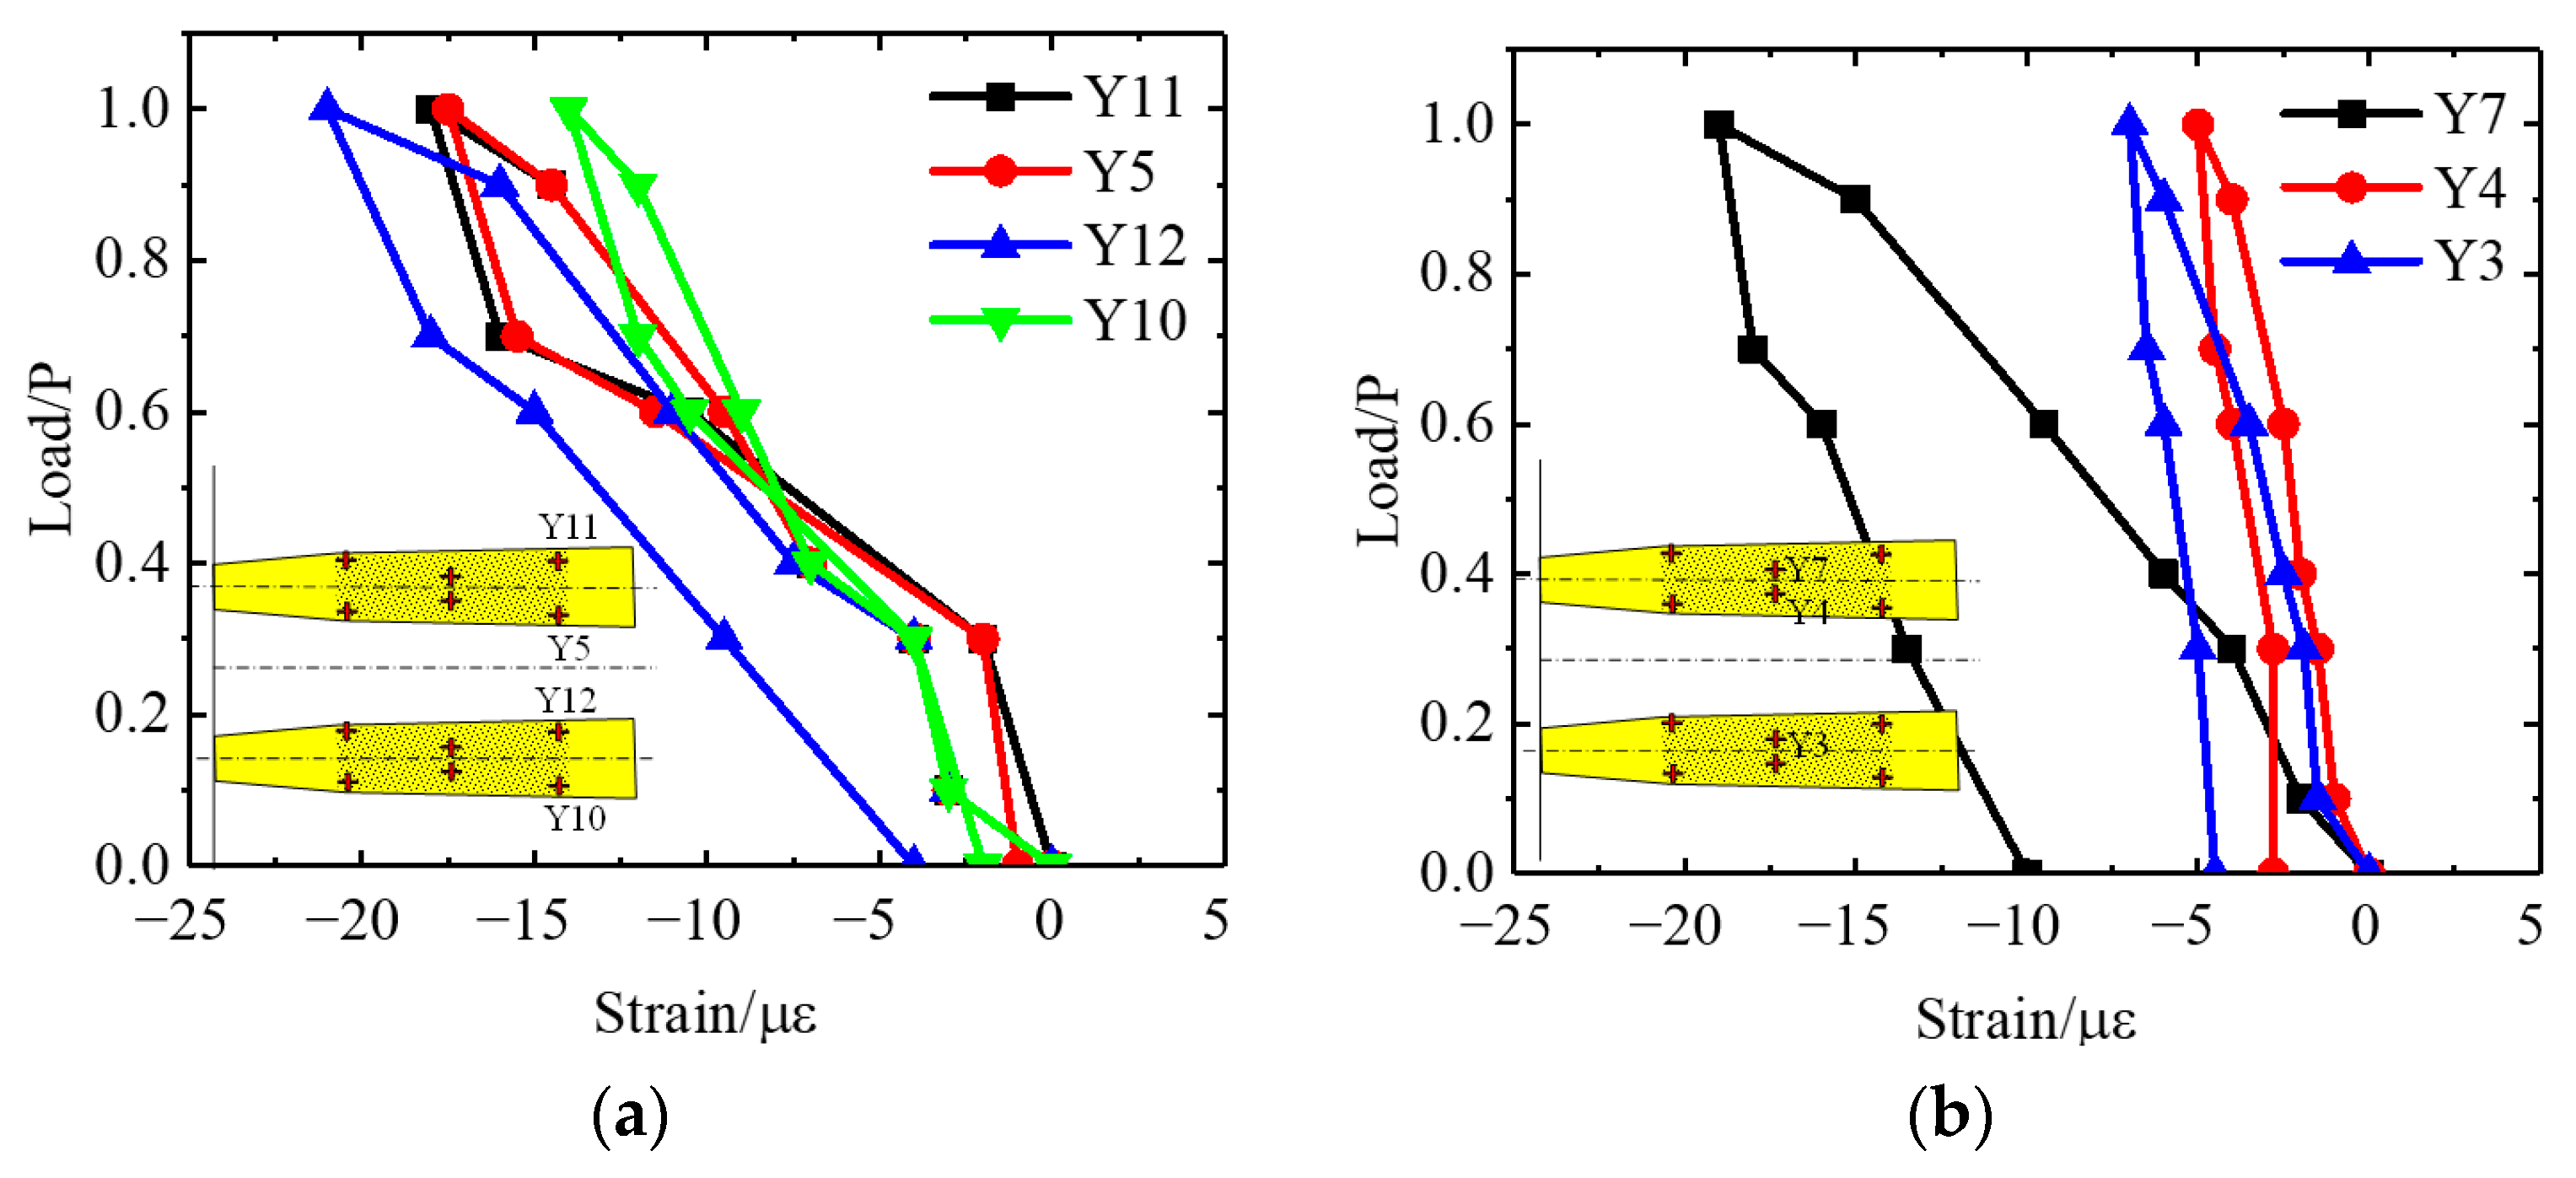
4.1.4. Test Results of Strain Gauge

In the design load (1P) loading test process, the strain gauge test results of the two anchor plugs arranged in the rear anchor surface, the middle of the anchor body, and the front anchor surface are shown in Figure 8. The test results show that under the design load (1P), the maximum strain generated at the back of the anchor plug body is 21.5 με, the middle part of the anchor plug body took the second place, and the maximum was about 21 με; the strain in the front of the anchor plug body is the smallest, only about 3.5 με.

4.2. Stepwise Loading and Failure Test Results

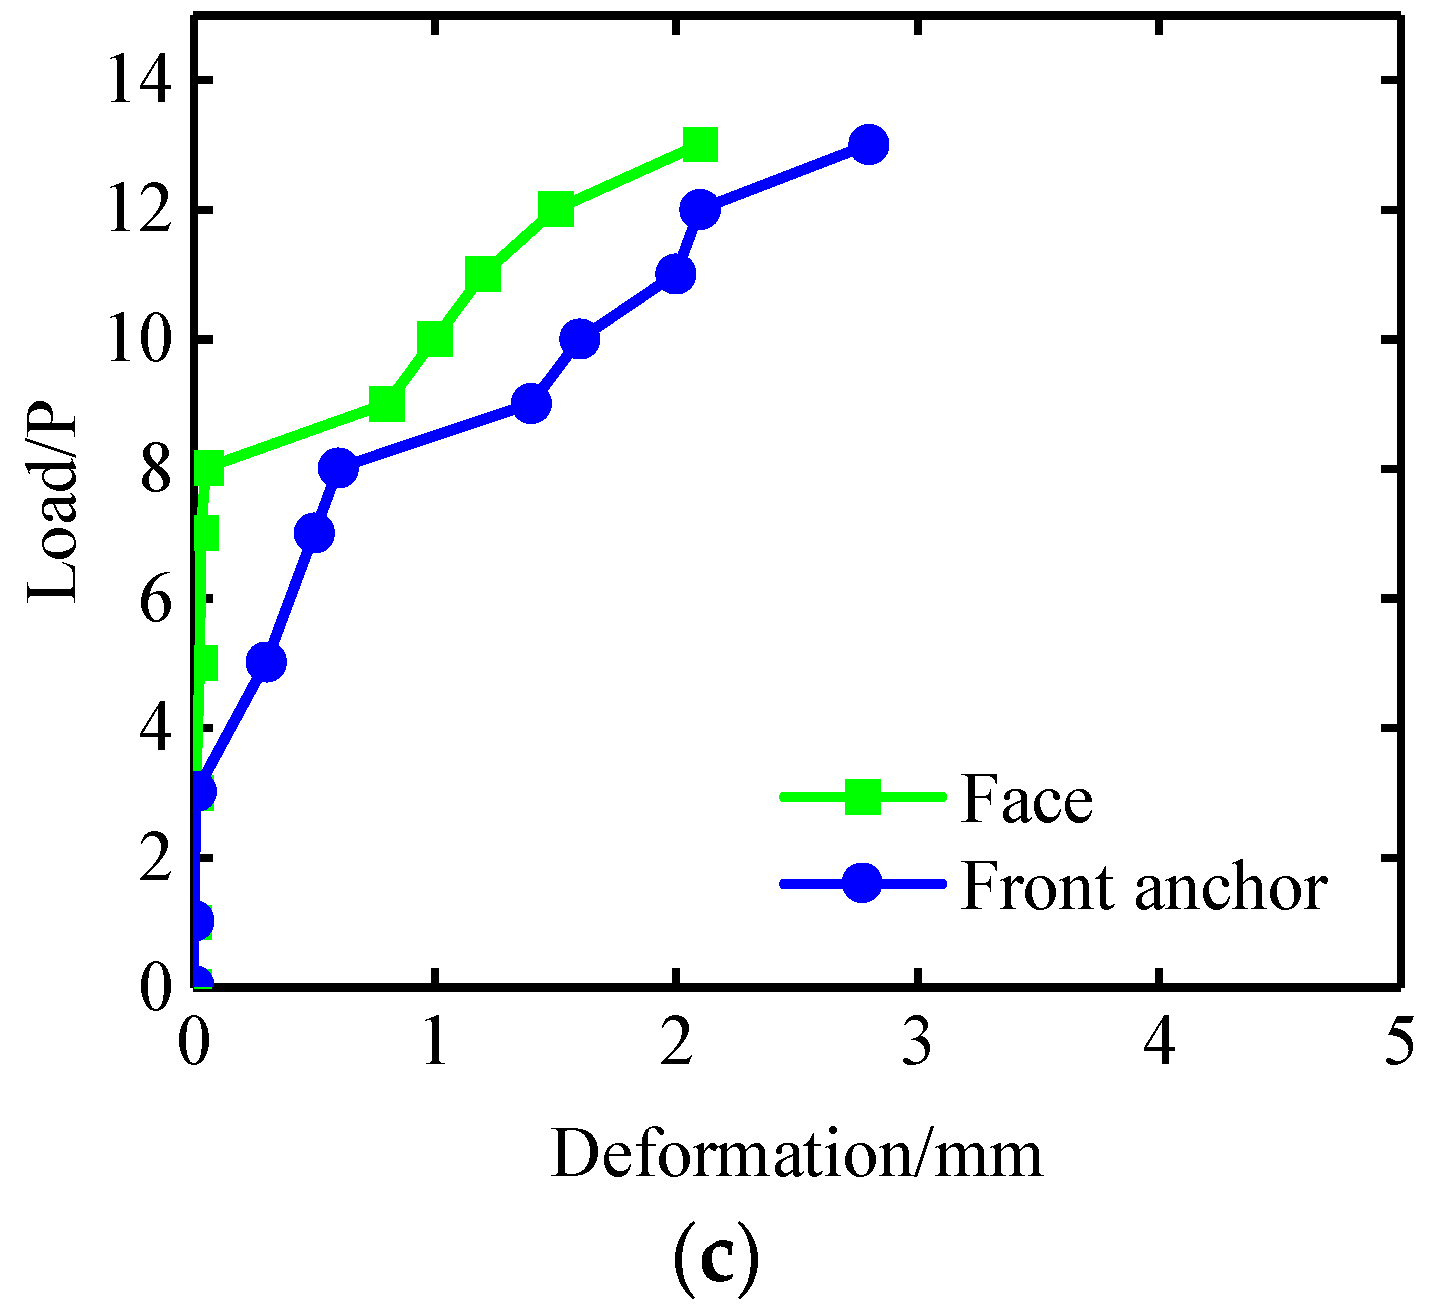
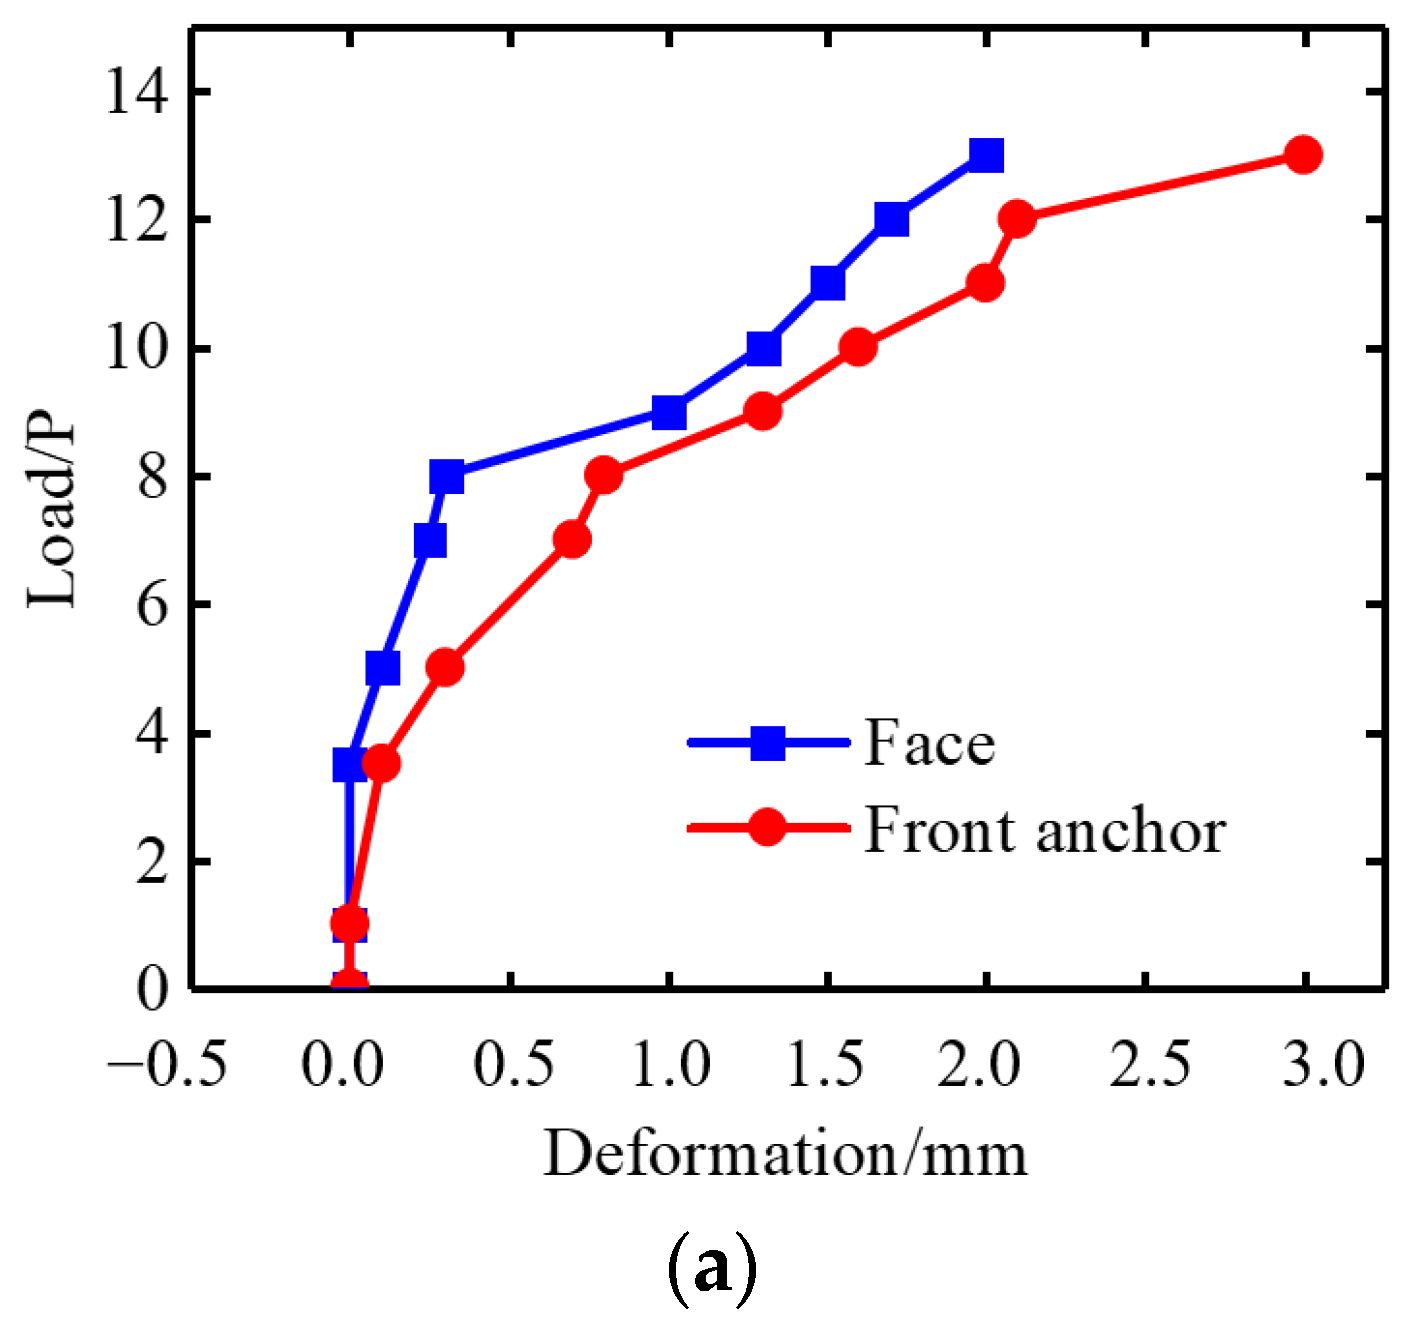
4.2.1. Test Results of Multipoint Displacement Meter

In the process of the overload failure experiment, the multi-point displacement meter test results of the front and rear anchor surface of the left and right anchor plugs are shown in Figure 9a,b. It can be found that both the left and right anchor plugs show the same deformation law during the initial stage loading to 13P, and the deformation is similar. Under the 8P load, the deformation curves of the left and right anchor plugs show obvious inflection points. In the process of the overload failure test, the test results of the multi-point displacement meter of the middle pier face are shown in Figure 9c. By analyzing Figure 9c, it can be found that the axial deformation of the middle pier rock mass in the tunnel anchor gradually increases in the test process of applying load to 13P in the initial classification. After the action of more than 8P, the deformation of rock mass on the working face of the middle pier and the front anchor surface increases significantly. Under the action of an 8P load, the deformation of the working face of the middle pier is 0.33 mm, and the deformation of the surrounding rock on the front anchor surface is 0.528 mm. Under the load of 13P, the deformation of the middle pier is 1.98 mm, and the deformation of the surrounding rock at the front anchor surface is 2.76 mm.

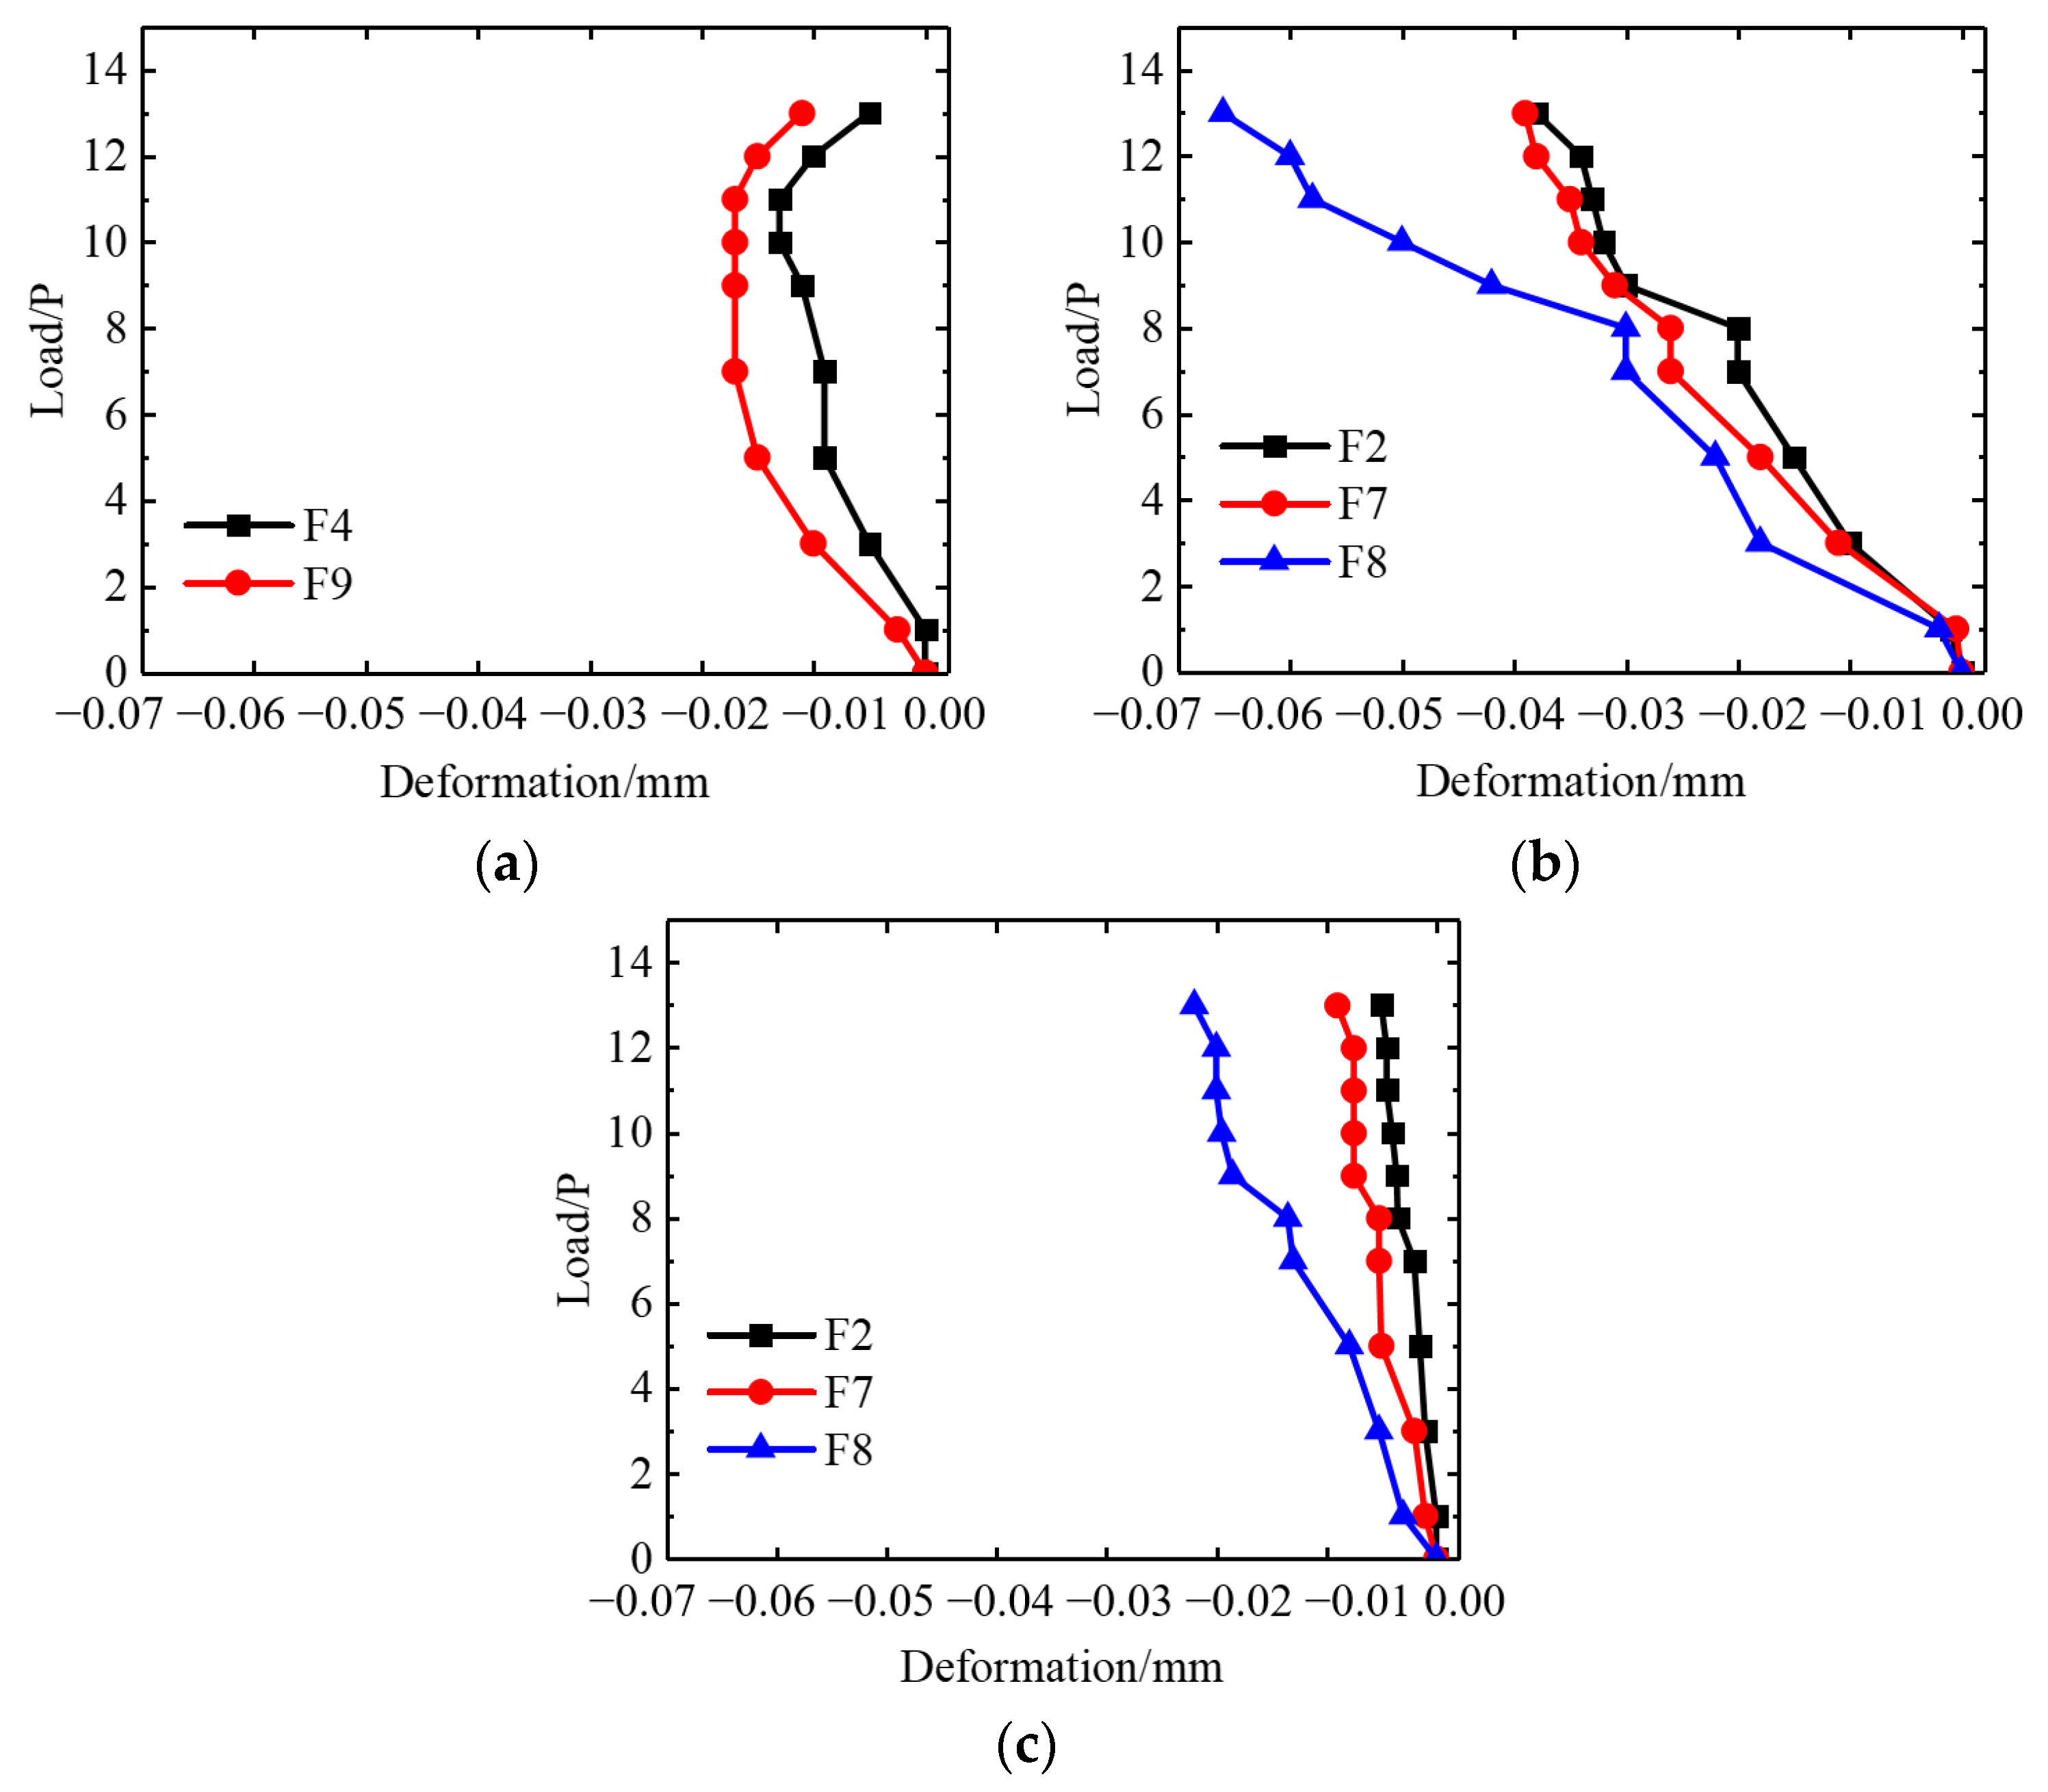
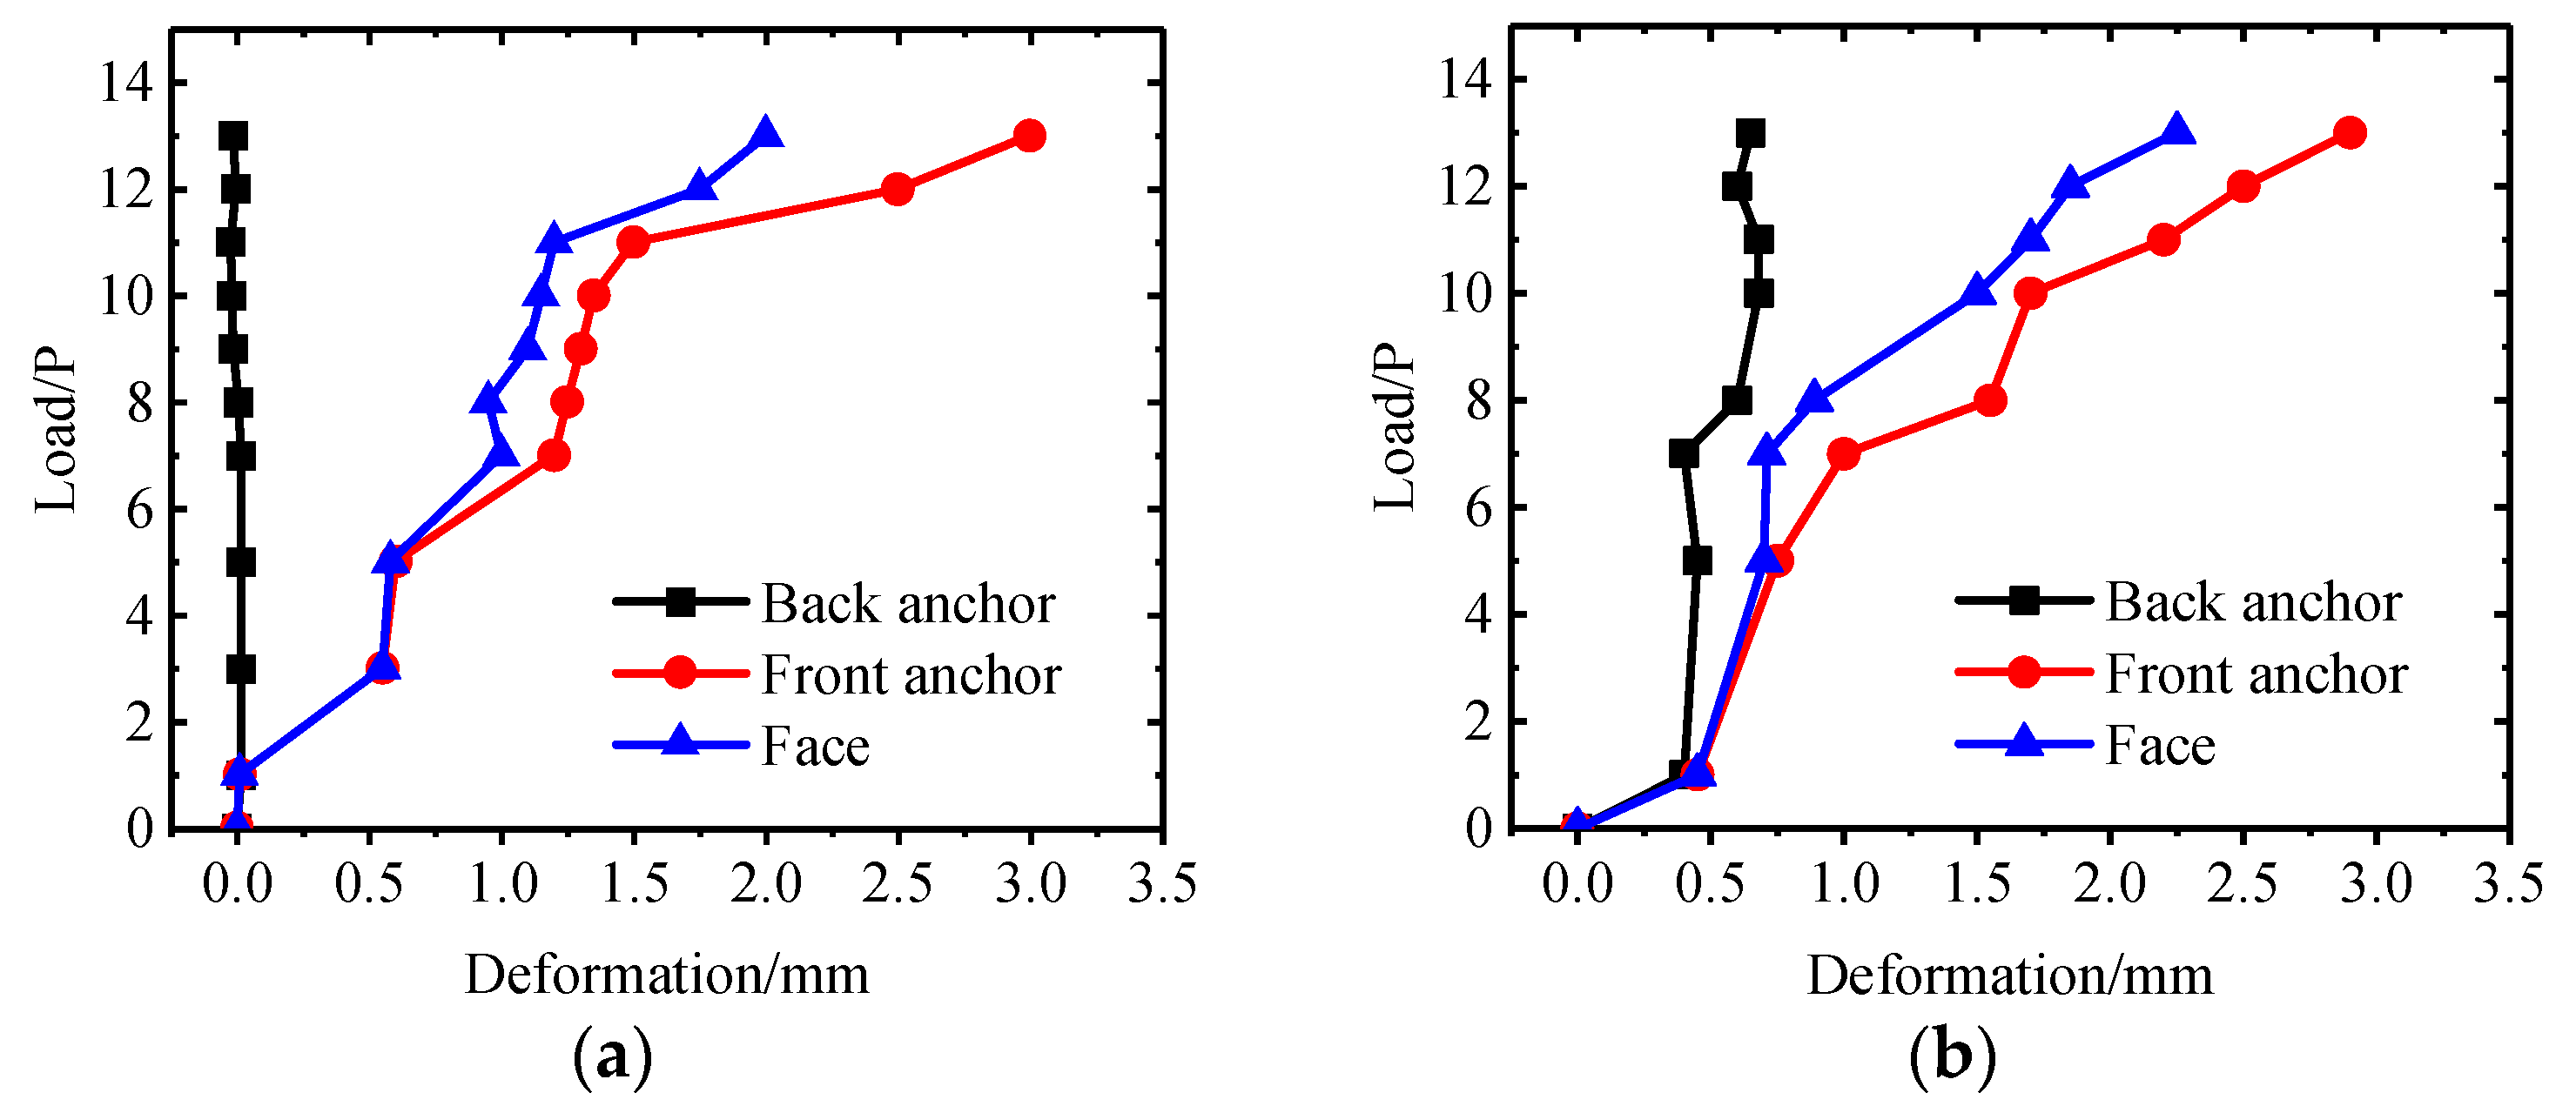
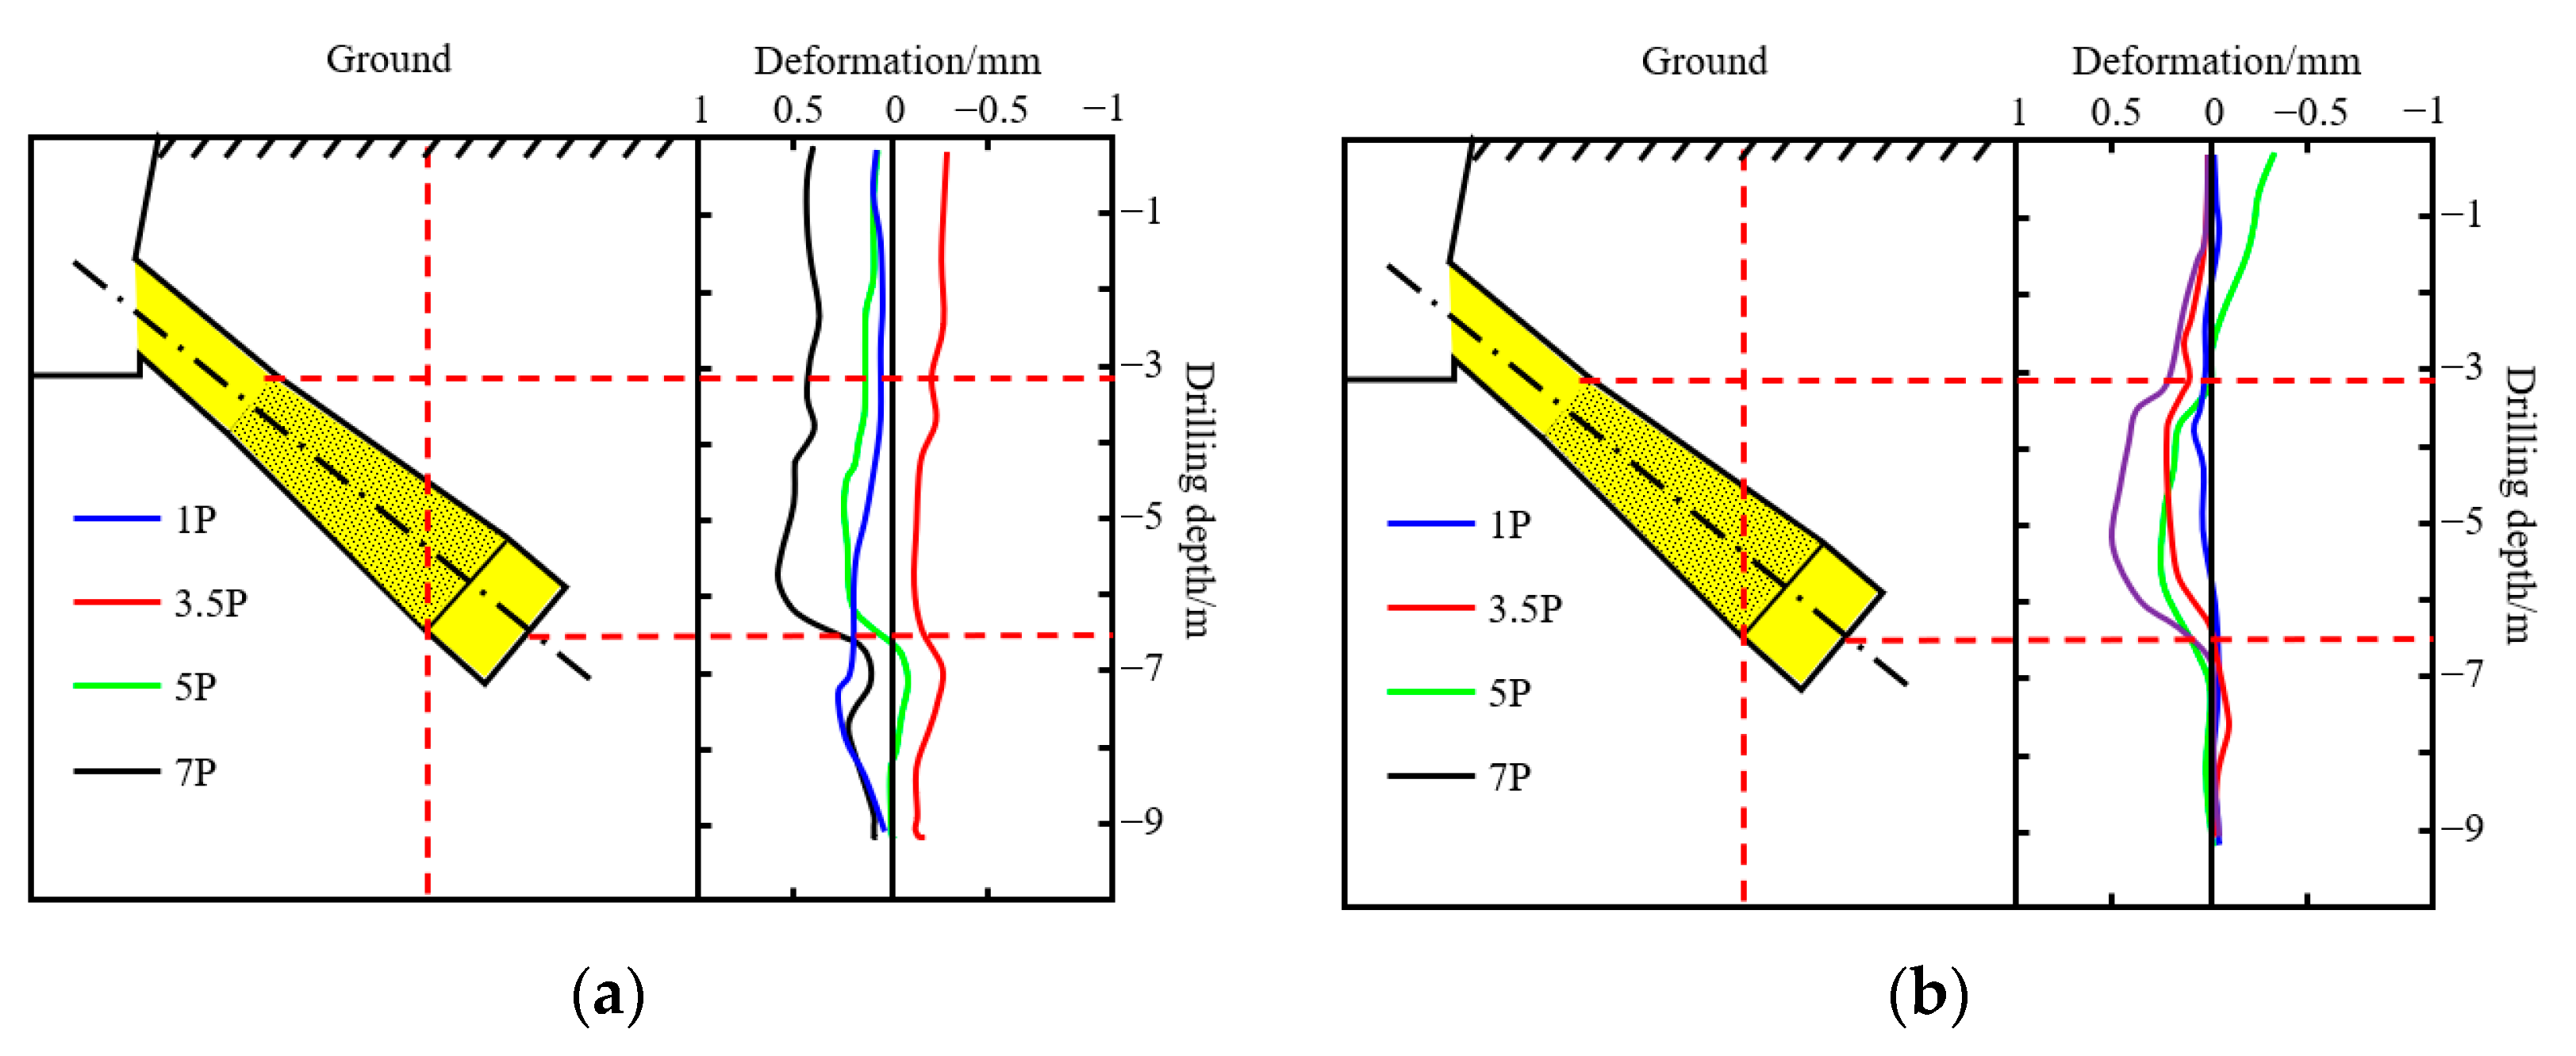
4.2.2. Test Results of Sliding Micrometer

In the process of the overload failure test, the deformation monitoring curves of the three key points of the working face, the front anchor face, and the rear anchor face of the two sliding micrometer holes H1 and H4 of the surrounding rock outside the two anchor holes are shown in Figure 10a,b. During the loading process, the deformation of the front anchor face of the surrounding rock outside the anchor hole is the largest, the deformation of the rock mass at the palm face is the second, and the deformation of the rock mass at the back anchor face is the smallest. Under the action of 8P load, the deformation of the surrounding rock at the tunnel face outside the left anchor tunnel is 0.83 mm, and that at the tunnel face front is 1.04 mm. The deformation of the surrounding rock in the lateral face of the right anchor hole is 0.82 mm, and the deformation of the surrounding rock in the front anchor face is 0.90 mm. In the process of the overload failure test, the deformation monitoring curves of the three key points, i.e., the working face, the front anchor face, and the rear anchor face, of the surrounding rock H2 and H3 at the top of the two anchor tunnels are shown in Figure 10c,d. During the loading process, the deformation of the front anchor face of the surrounding rock at the top of the anchor hole is the largest, followed by the deformation of the rock mass at the tunnel face, and the deformation of the rock mass at the back anchor face is the smallest. Under 8P load, the deformation of the surrounding rock at the top of the left anchor tunnel is 0.74 mm, and that at the front anchor tunnel is 0.75 mm. The deformation of the top face of the right anchor hole is 0.61 mm, and the deformation of the front anchor face is 0.68 mm.

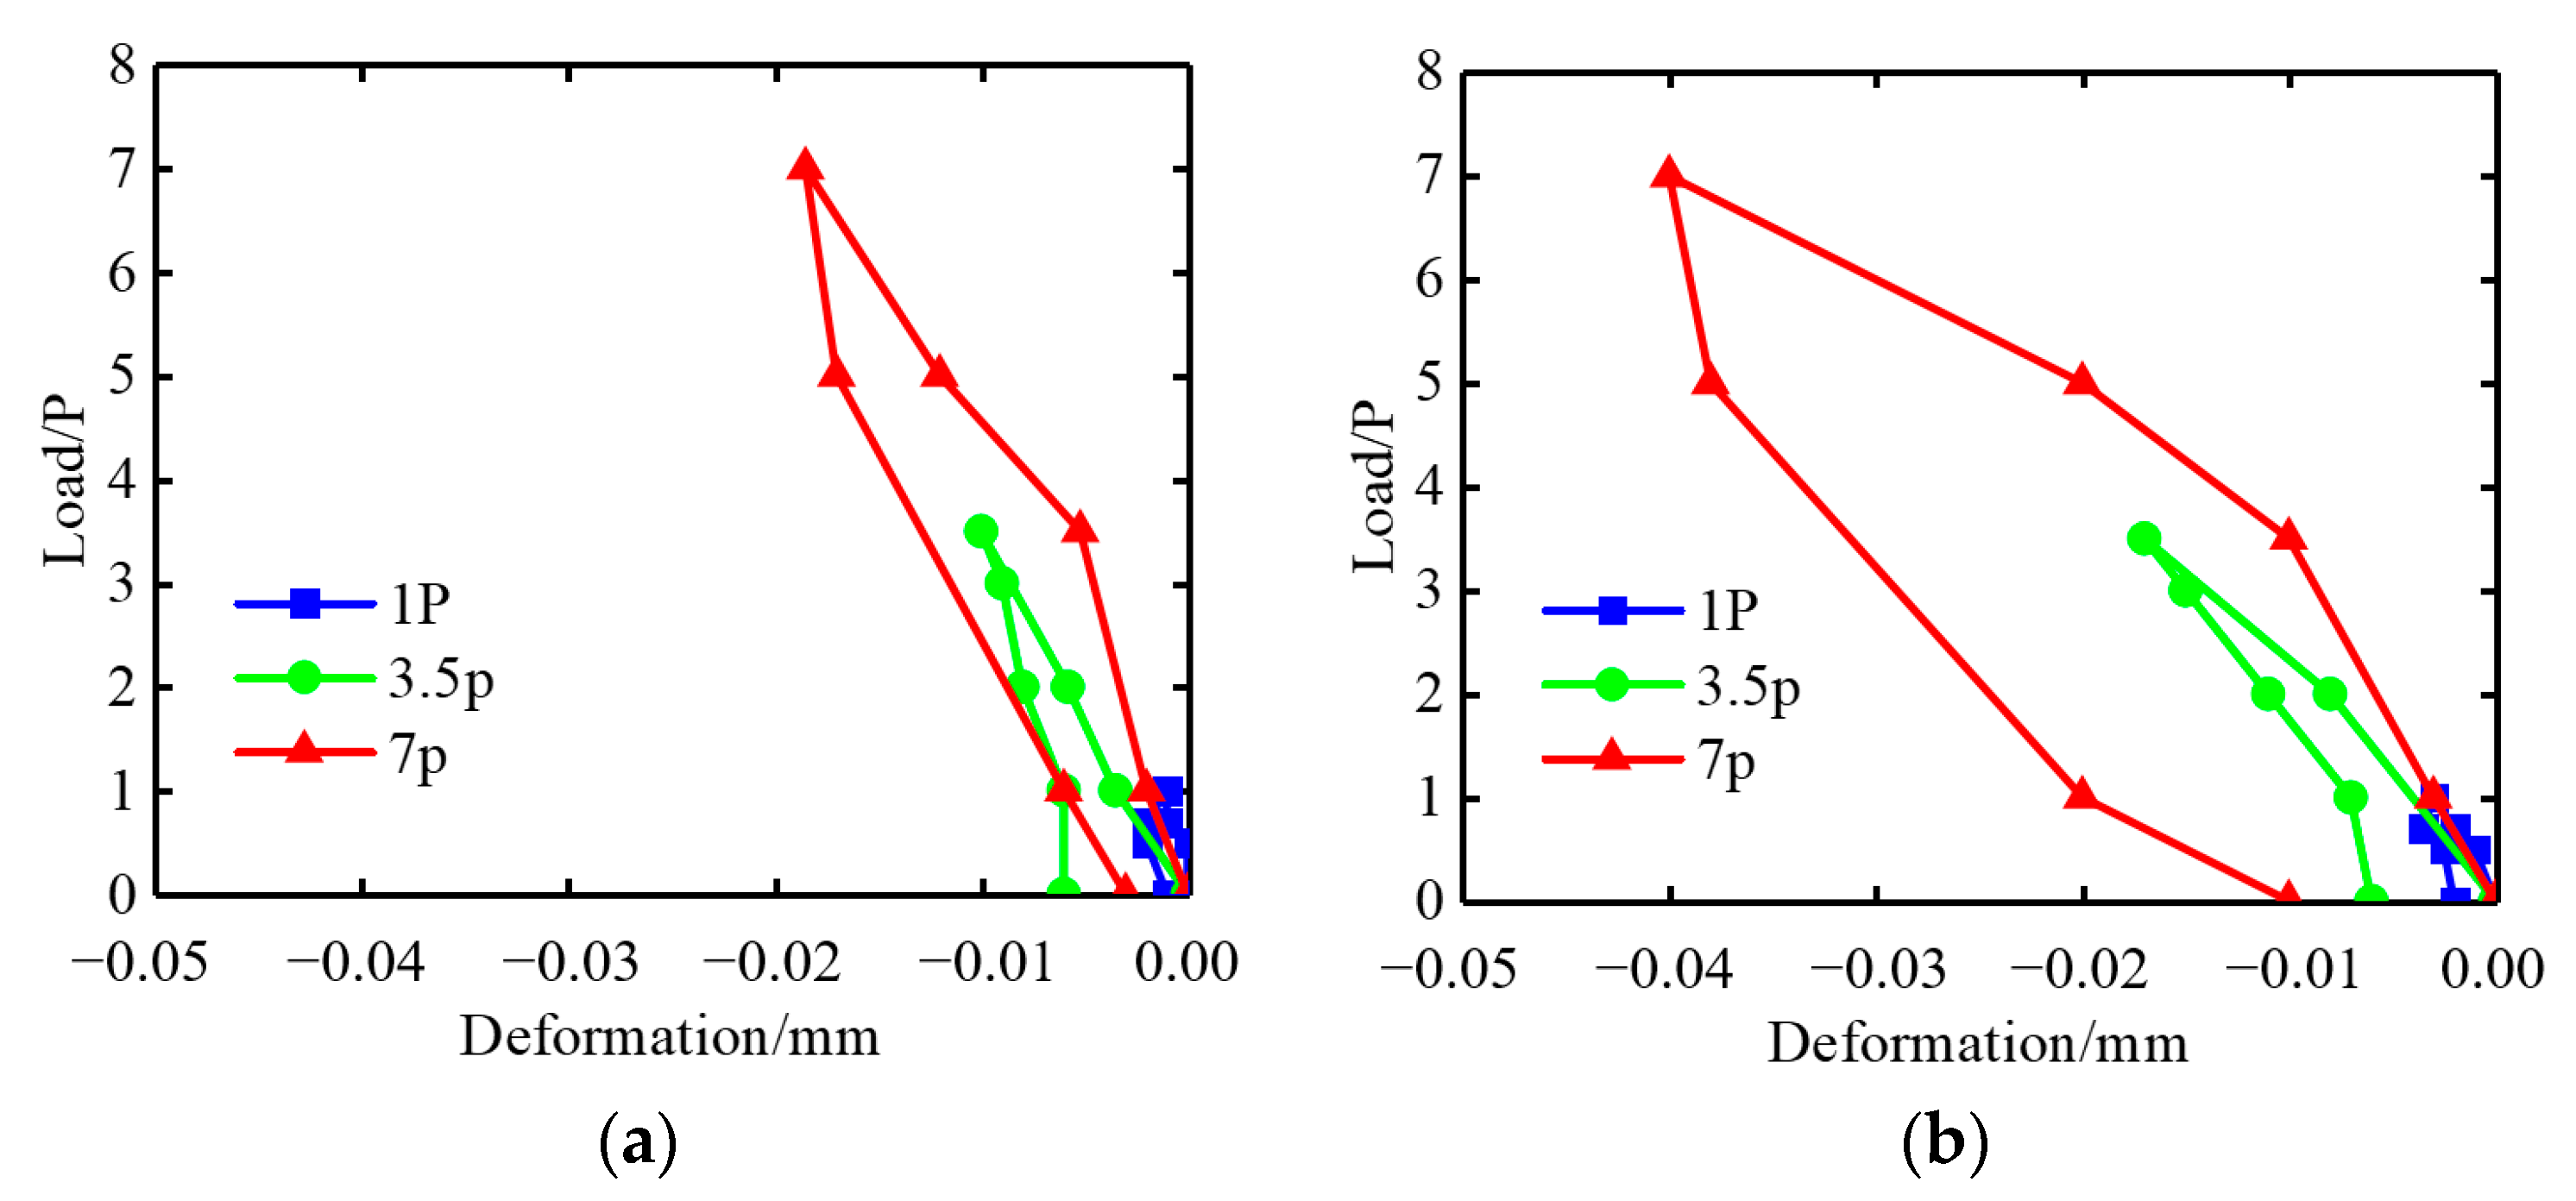
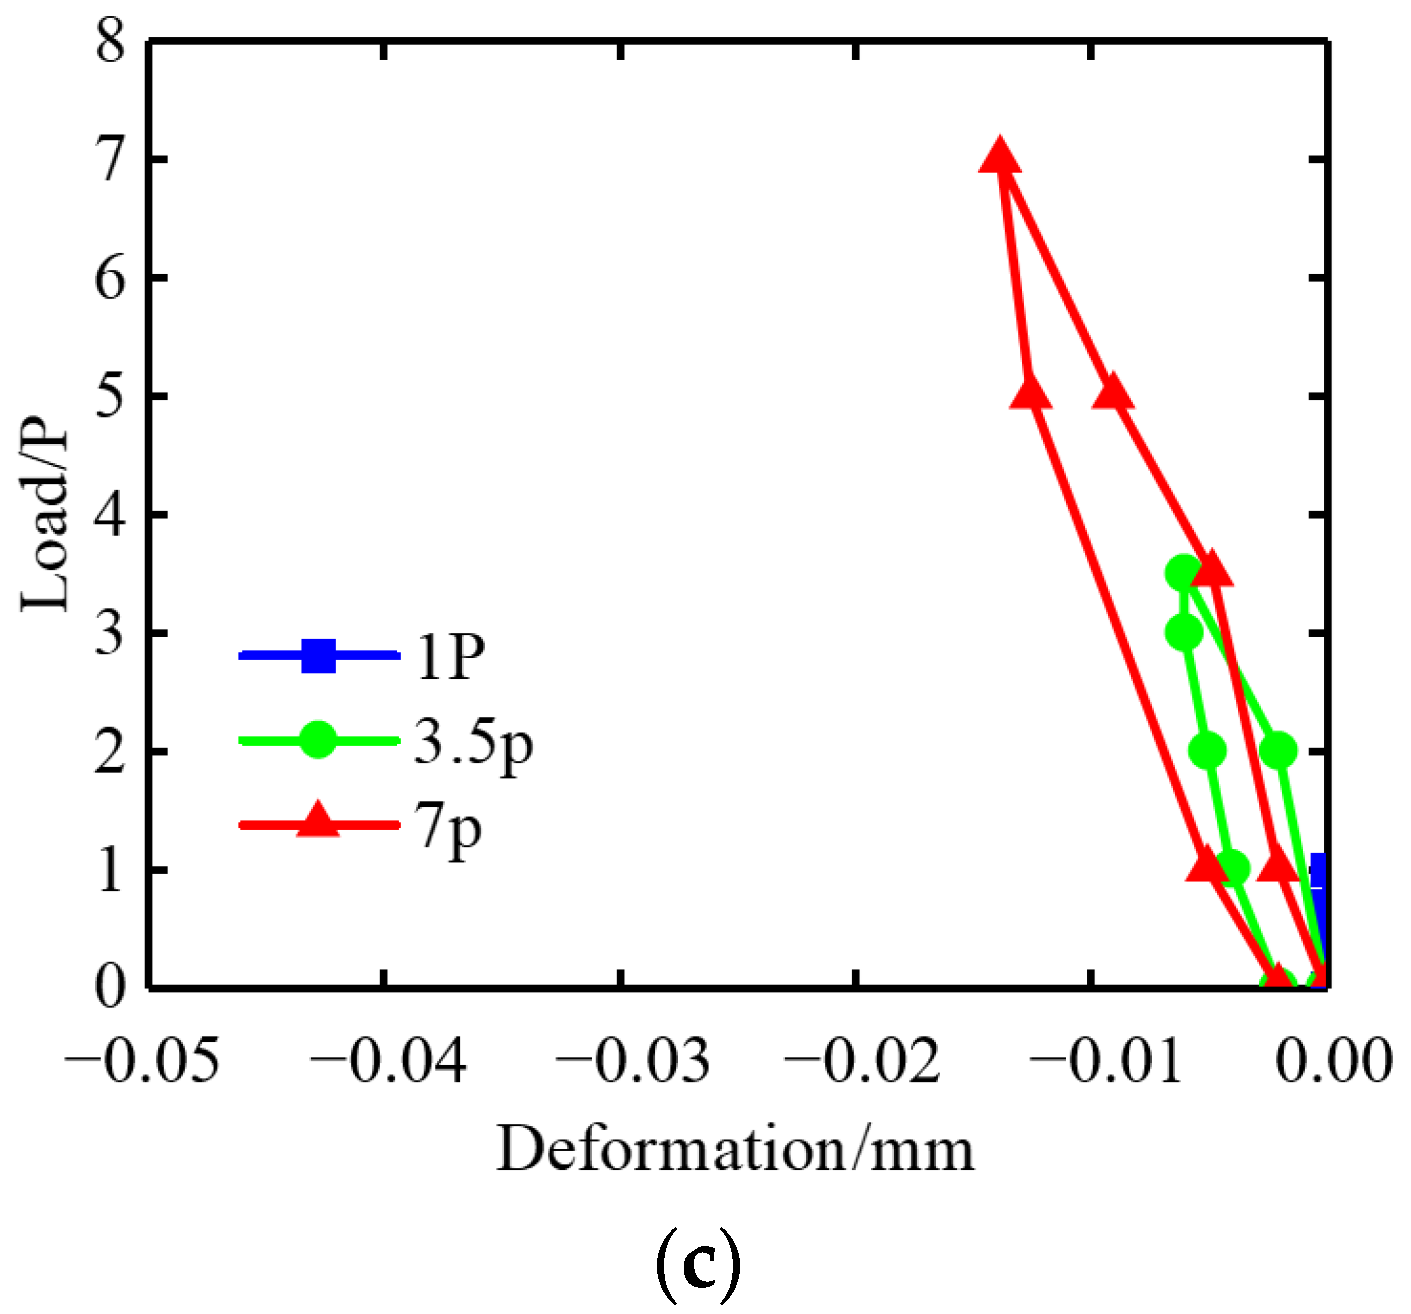
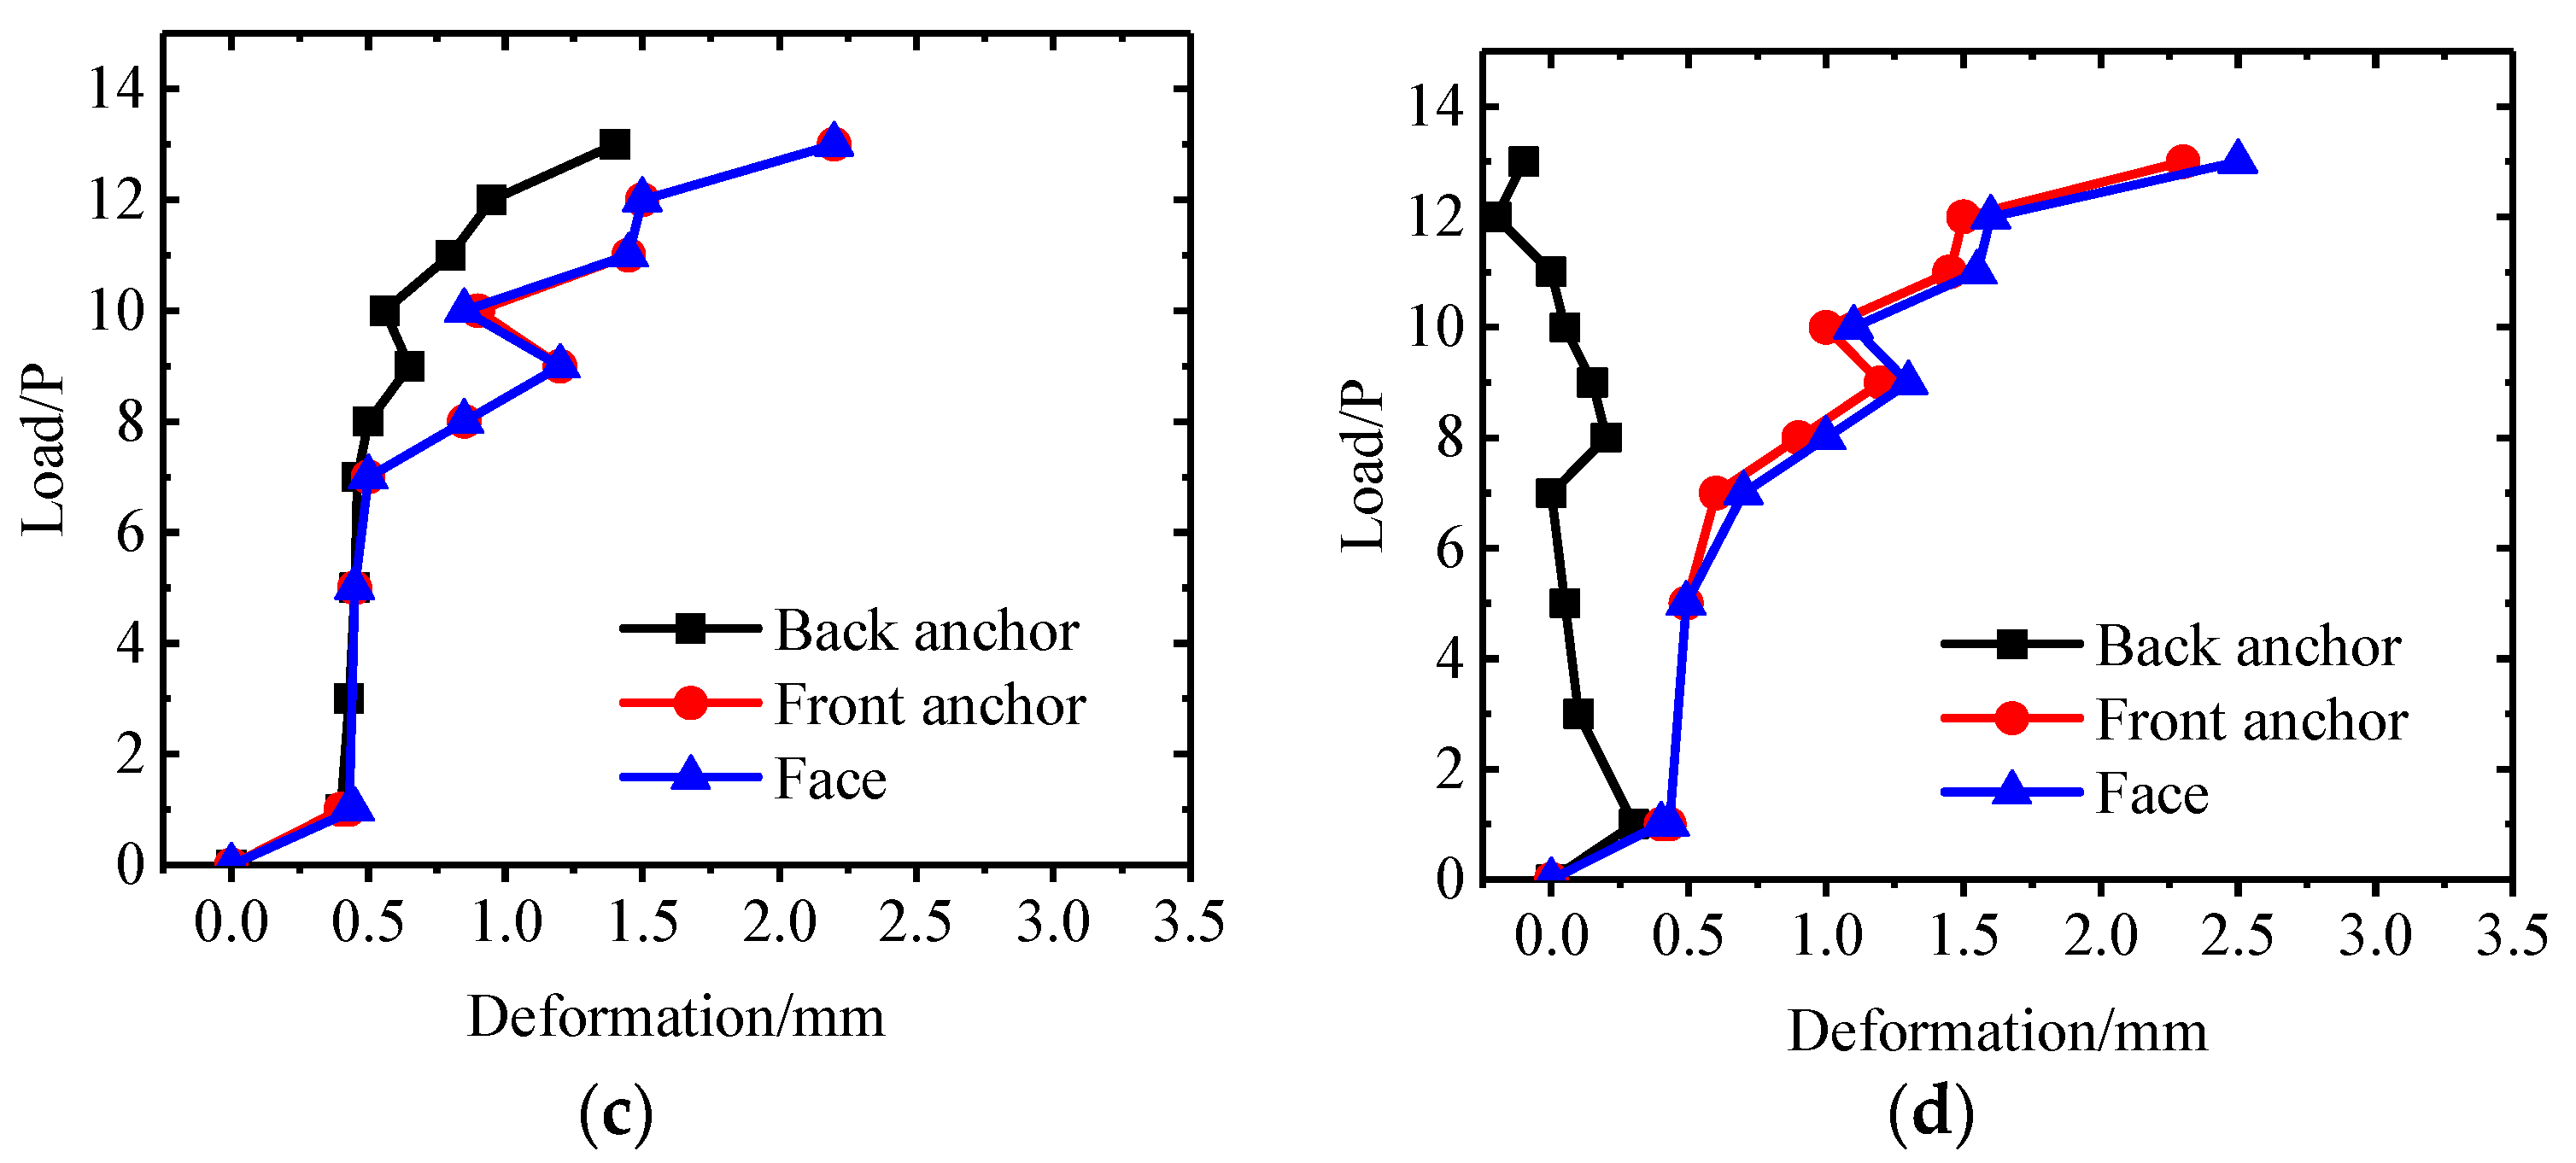
4.2.3. Test Results of Dislocation Meter

In the process of the overload failure test, the relative deformation between the anchor plug and the surrounding rock measured by dislocation gauges arranged on the rear, middle, and front anchor surfaces of the left and right anchor plugs is shown in Figure 11a–c. The test results show that during the whole loading process, the relative deformation of the anchor plug body and the surrounding rock is not large, and around 8P load, the deformation of the dislocation meter in the middle of the anchor body, and the front anchor surface generates an inflection point. Under 8P load, the maximum deformation of dislocation meter in the middle of the anchor body is 0.033 mm, the maximum deformation of dislocation meter in the rear anchor surface is 0.02, and the maximum deformation of dislocation meter in the front anchor surface is 0.014 mm. Under 13P load, the maximum deformation of dislocation gauge at the rear anchor surface is 0.011 mm, that at the middle anchor body is 0.066 mm, and that at the front anchor surface is 0.021 mm.

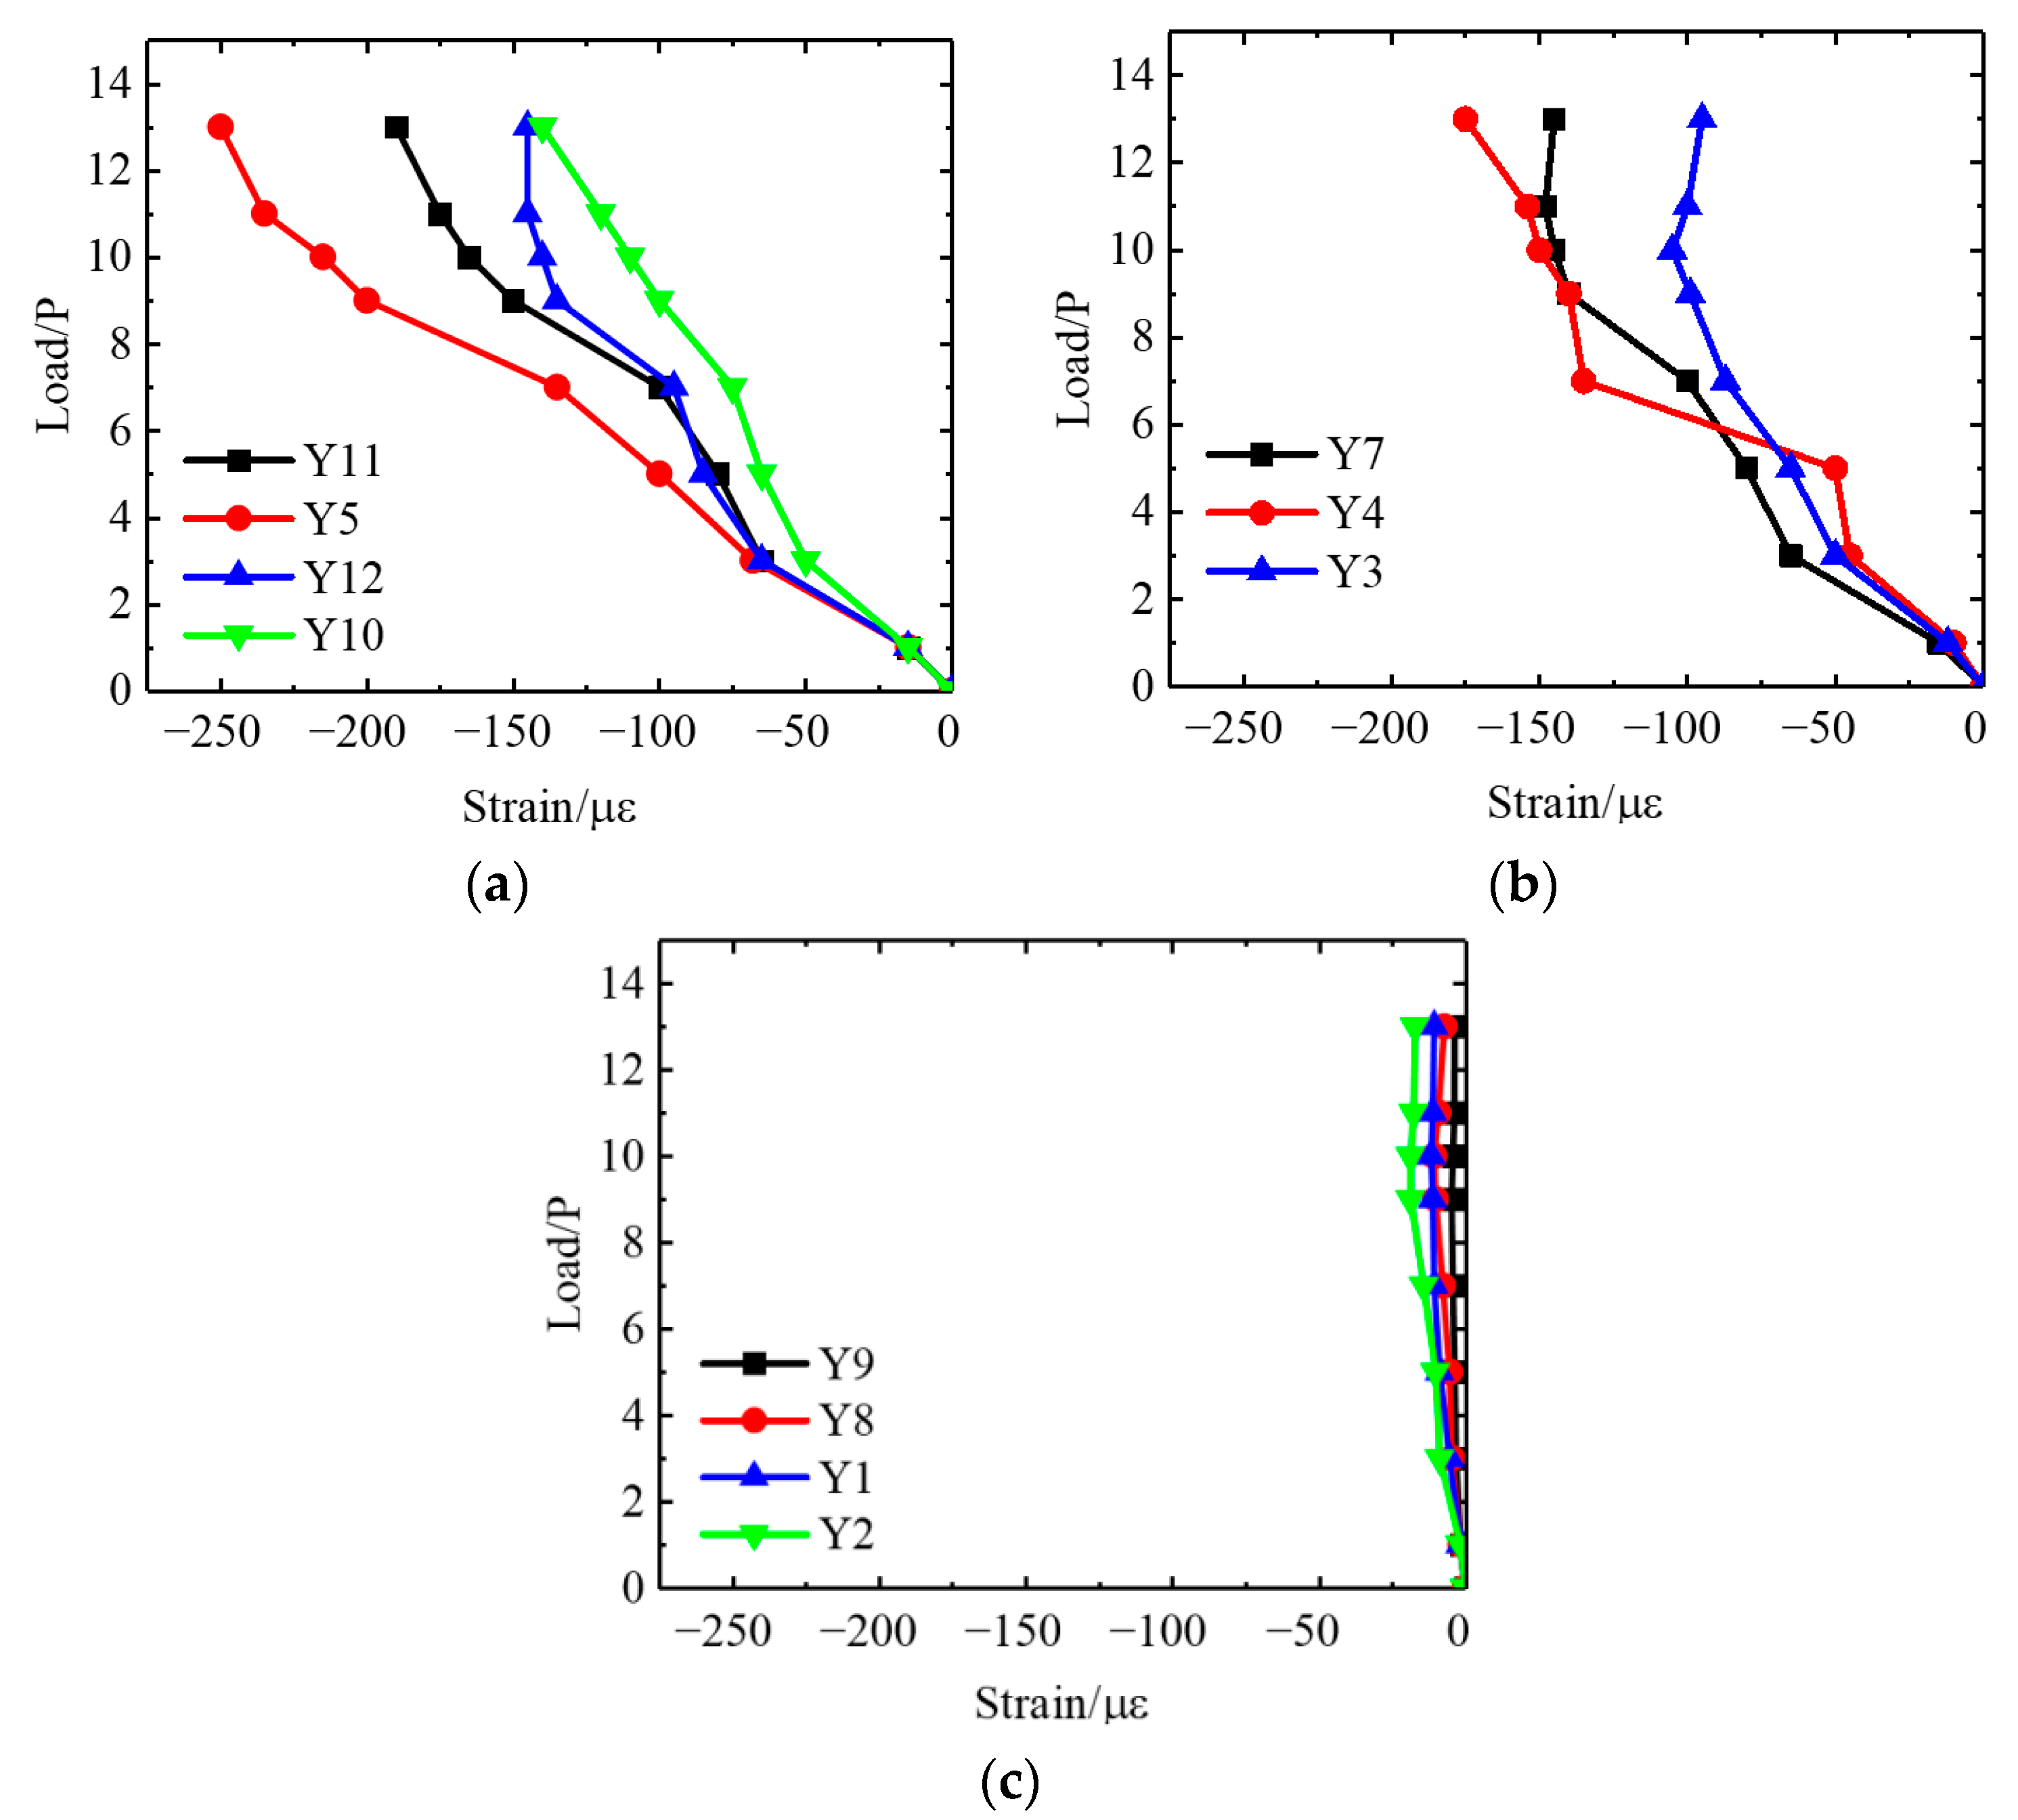
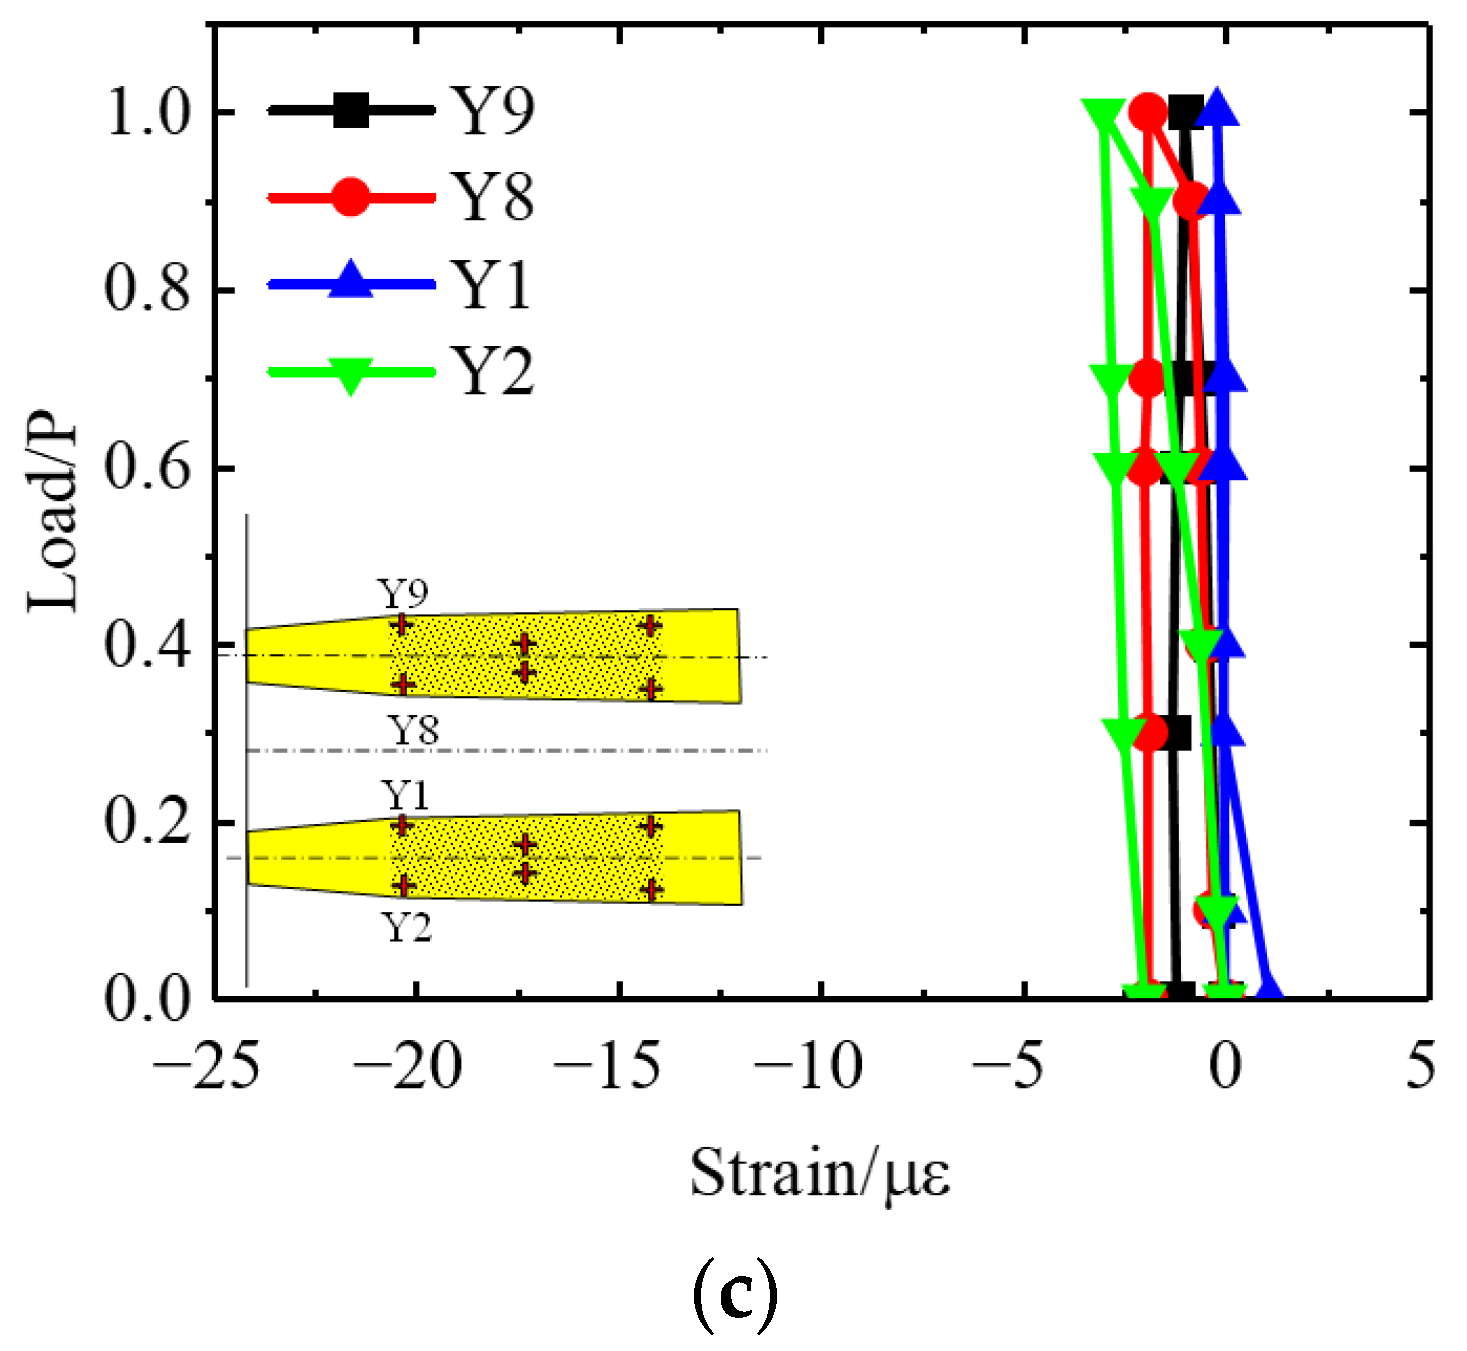
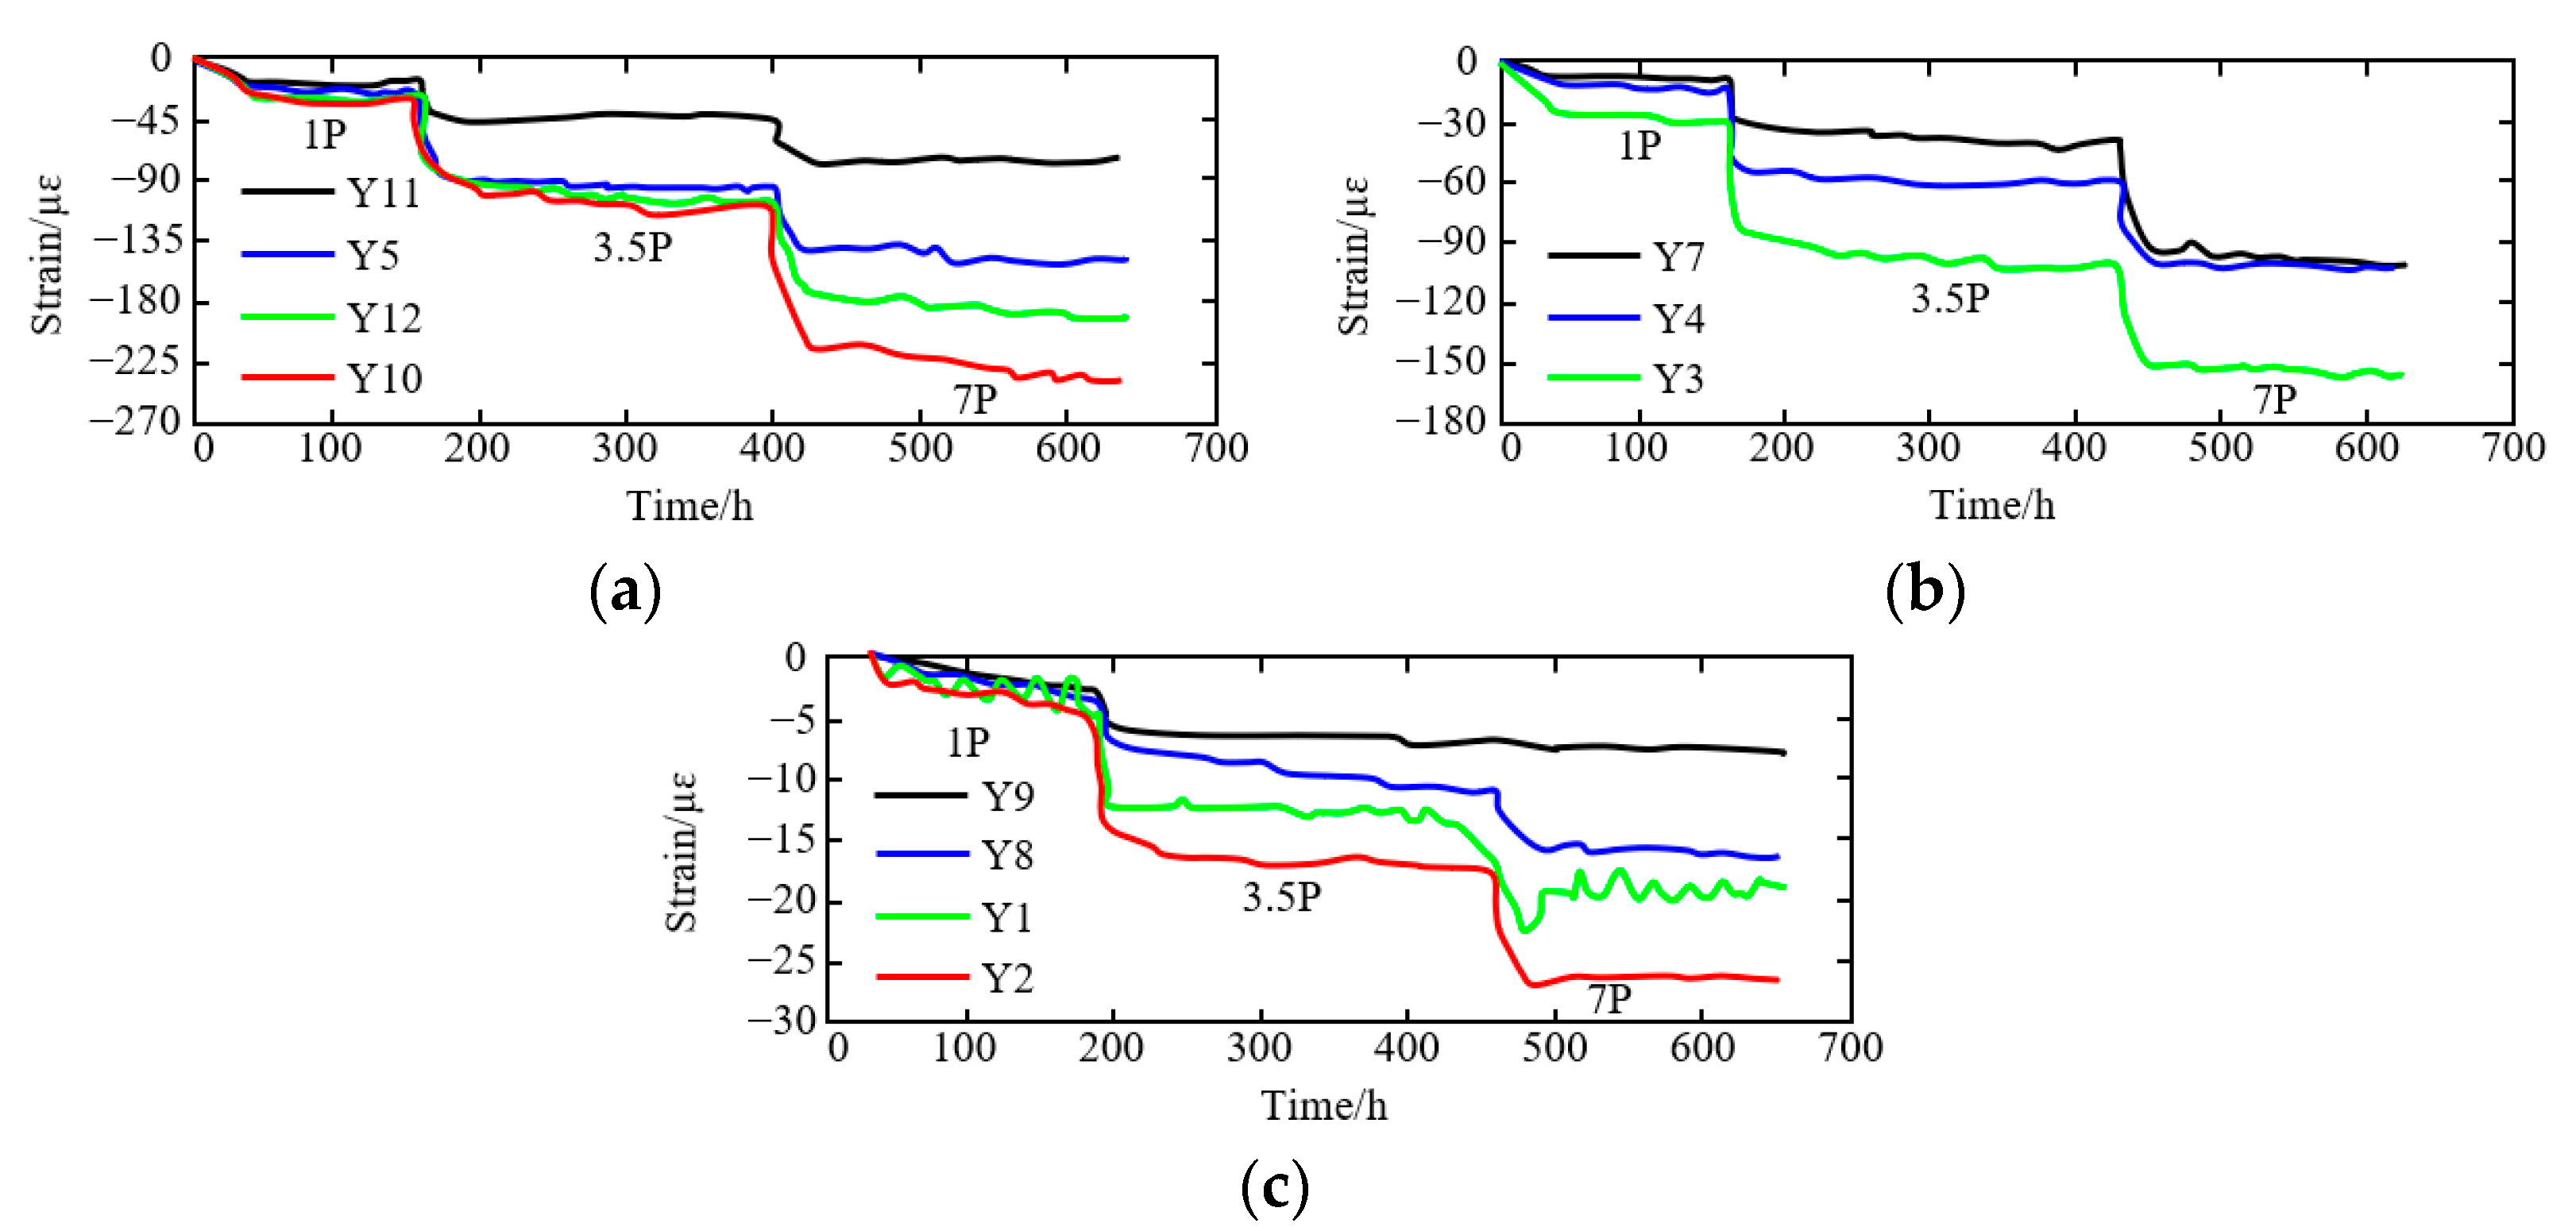
4.2.4. Test Results of Strain Gauge

In the process of the overload failure test, the strain gauge test results of two anchor plugs arranged in the rear anchor surface, the middle of the anchor body, and the front anchor surface are shown in Figure 12. The test results show that the strain gauge deformation curve inside the anchor plug body changes significantly at about 8P load. Under the 8P load, the strain generated at the back of the anchor plug body is the largest, about 200 με. The middle part of the anchor plug is the second, and the maximum is about 120 με. The strain in front of the anchor plug body is still small, only about 15 με. Under the action of 13P load, the maximum strain of the strain gauge at the back of the anchor body is about 257 με, and that at the middle of the anchor body is about 175 με. The strain in front of the anchor plug is still small, only about 17 με.

4.3. Rheological Experiment Results

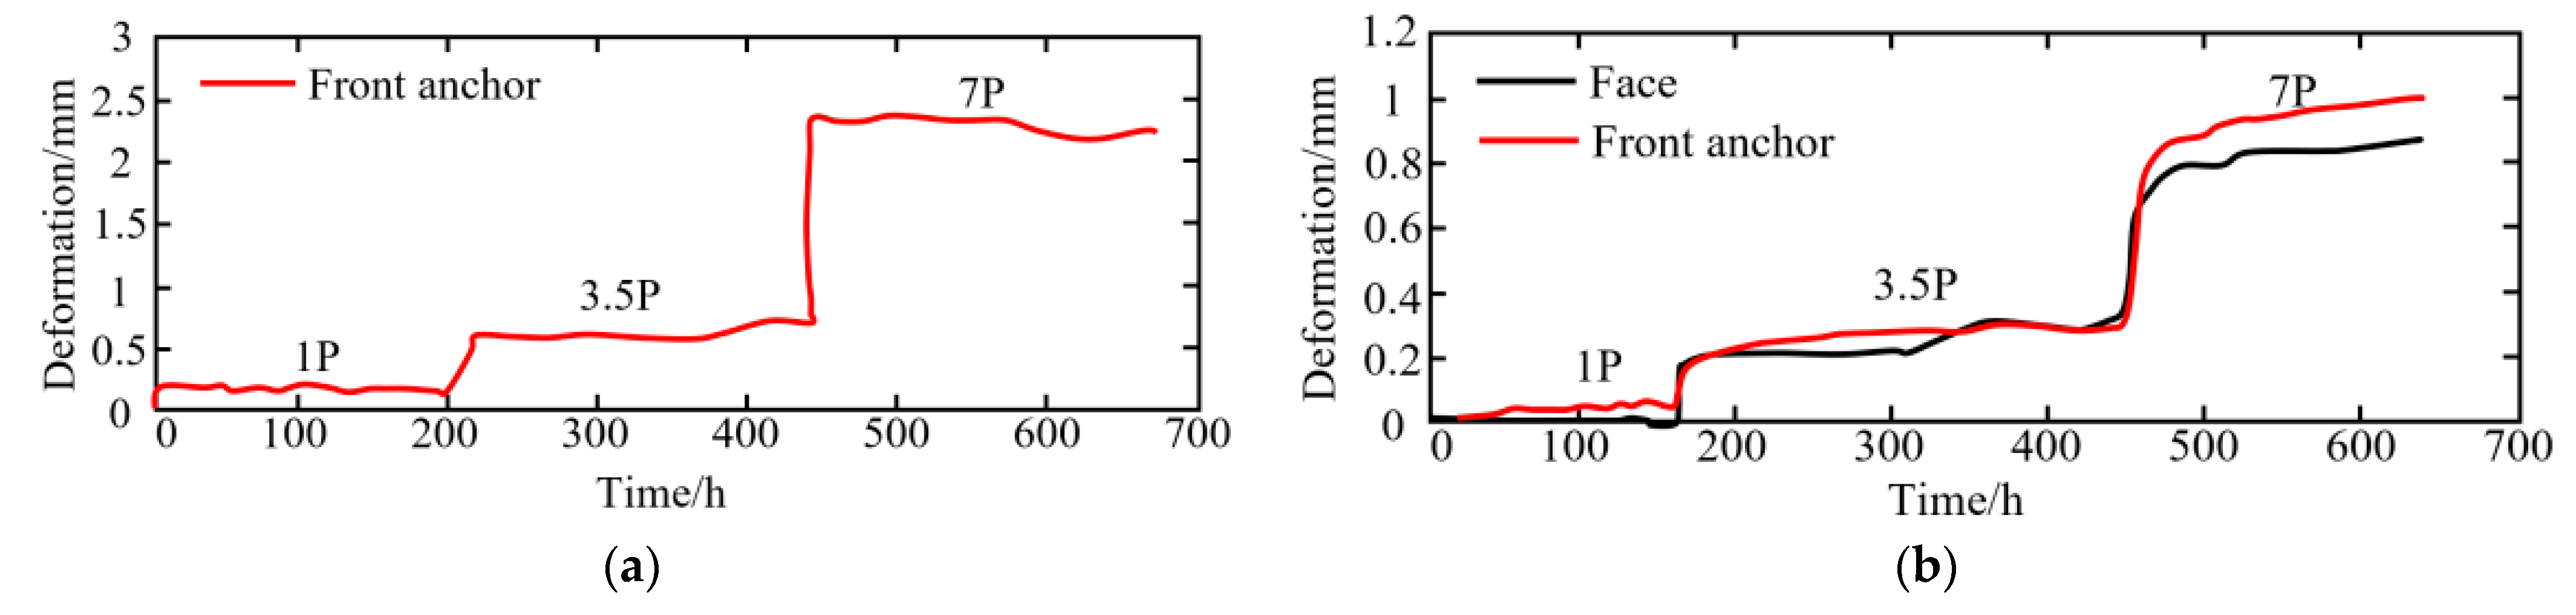
4.3.1. Anchor Plug and Rock Mass of Middle Partition Wall

The deformation duration curve of the D1 hole multi-point displacement meter in front of the left anchor plug is shown in Figure 13a. According to Figure 13a, the rheological characteristics of the anchor plug under 1P, 3.5P, and 7P loads are not obvious.
The deformation duration curve of the D2 multi-point displacement meter at the middle of the pier in the two anchor holes is shown in Figure 13b. The rheological deformation of the middle pier is not obvious under 1P load. Under 3.5P and 7P load, it shows certain rheological deformation. Under different loads, the rheological deformation of rock mass in the middle pier face and front anchor face is shown in Table 1.

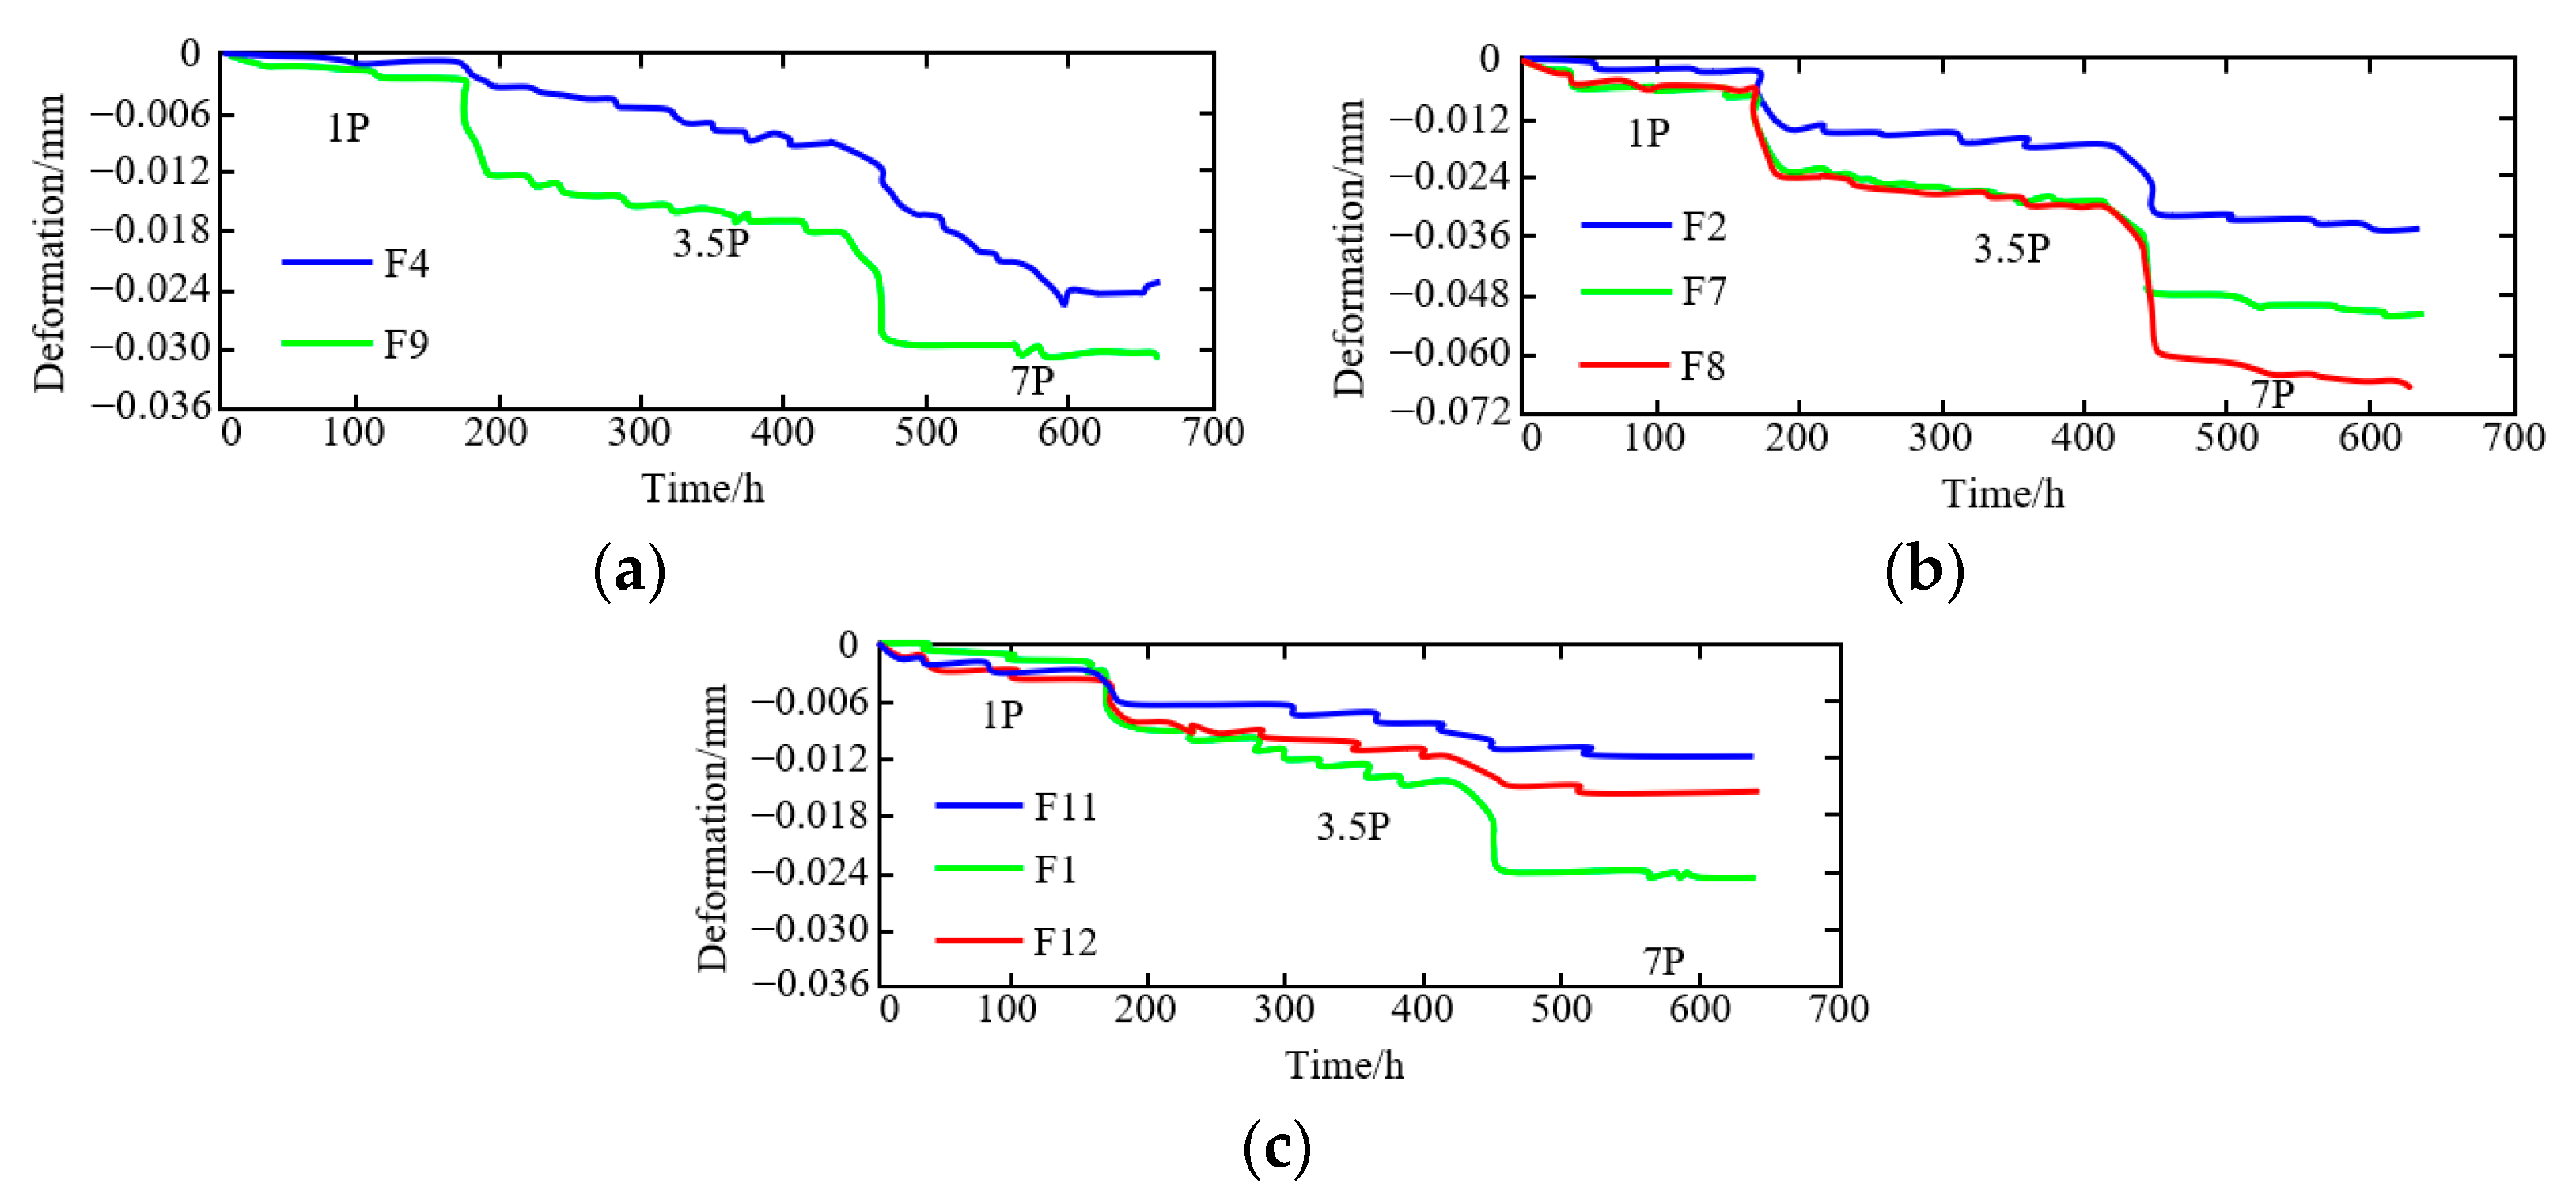
4.3.2. Contact Surface between Anchor Plug Body and Surrounding Rock

The deformation–time curves of dislocation gauges arranged in the rear, middle, and front of the two anchor plugs under 1P, 3.5P, and 7P loads are shown in Figure 14a–c. The test results show that the relative deformation between the anchor plug body and the surrounding rock is generally small. Under 1P load, the rheological deformation is not obvious, and under 3.5P and 7P loads, it shows a certain rheological deformation. Under different loads, the flow deformation of each mismeter is shown in Table 2.

4.3.3. Internal Strain of Anchor Plug

The deformation–time curves of the strain gauges arranged in the rear, middle, and front anchors of the left and right anchors under 1P, 3.5P, and 7P loads are shown in Figure 15a–c. The test results show that the internal strain of the anchor plug has certain rheological characteristics. The flow deformation of each strain gauge under different loads is shown in Table 3.

5. Discussion

5.1. Deformation Characteristics of Surrounding Rock of Anchoring Tunnel

According to the test results of inclined holes C1 and C2 arranged by the middle pier of the tunnel anchor, the horizontal deformation curve of the surrounding rock of the middle pier is shown in Figure 16a,b when the model anchor is loaded with 1~7P load. In the loading process, corresponding to the front and rear anchor surfaces of the anchor plug body, the surrounding rock of the middle pier has an obvious horizontal dislocation. Under the 1P design load, the horizontal deformation is 0.18 mm. Under the action of 3.5P overload, the horizontal deformation was 0.24 mm. Under 7P overload, the horizontal deformation is 0.57 mm.

5.2. Relative Deformation Characteristics of Anchor Plug and Surrounding Rock

The test results of dislocation gauges arranged at the rear anchor surface are shown in Figure 17a. It can be seen from the figure that under the 1P design load, the maximum deformation of the dislocation meter at the rear anchor surface is 0.002 mm. Under 3.5P overload, the maximum deformation was 0.01 mm, and under 7P overload, the maximum deformation was 0.019 mm. The maximum deformation is 0.019 mm under 7P overload. The test results of dislocation gauges arranged in the middle of the anchor are shown in Figure 17b. Under 1P design load, the maximum deformation of the dislocation meter in the middle of the anchor body is 0.005 mm, under 3.5P overload, the maximum deformation is 0.018 mm, and under 7P overload, the maximum deformation is 0.042 mm. The test results of dislocation gauges arranged at the front anchor surface are shown in Figure 17c. Under 1P design load, the maximum deformation of the dislocation gauge at the rear anchor surface is 0.002 mm, 0.006 mm under 3.5P overload, and 0.014 mm under 7P overload.
By comparing the test results of dislocation gauges arranged in three sections of the rear anchor surface, the middle of the anchor body, and the front anchor surface, it is found that the deformation of the dislocation gauge in the middle of the anchor body is relatively larges, followed by the rear anchor surface and the front anchor surface.

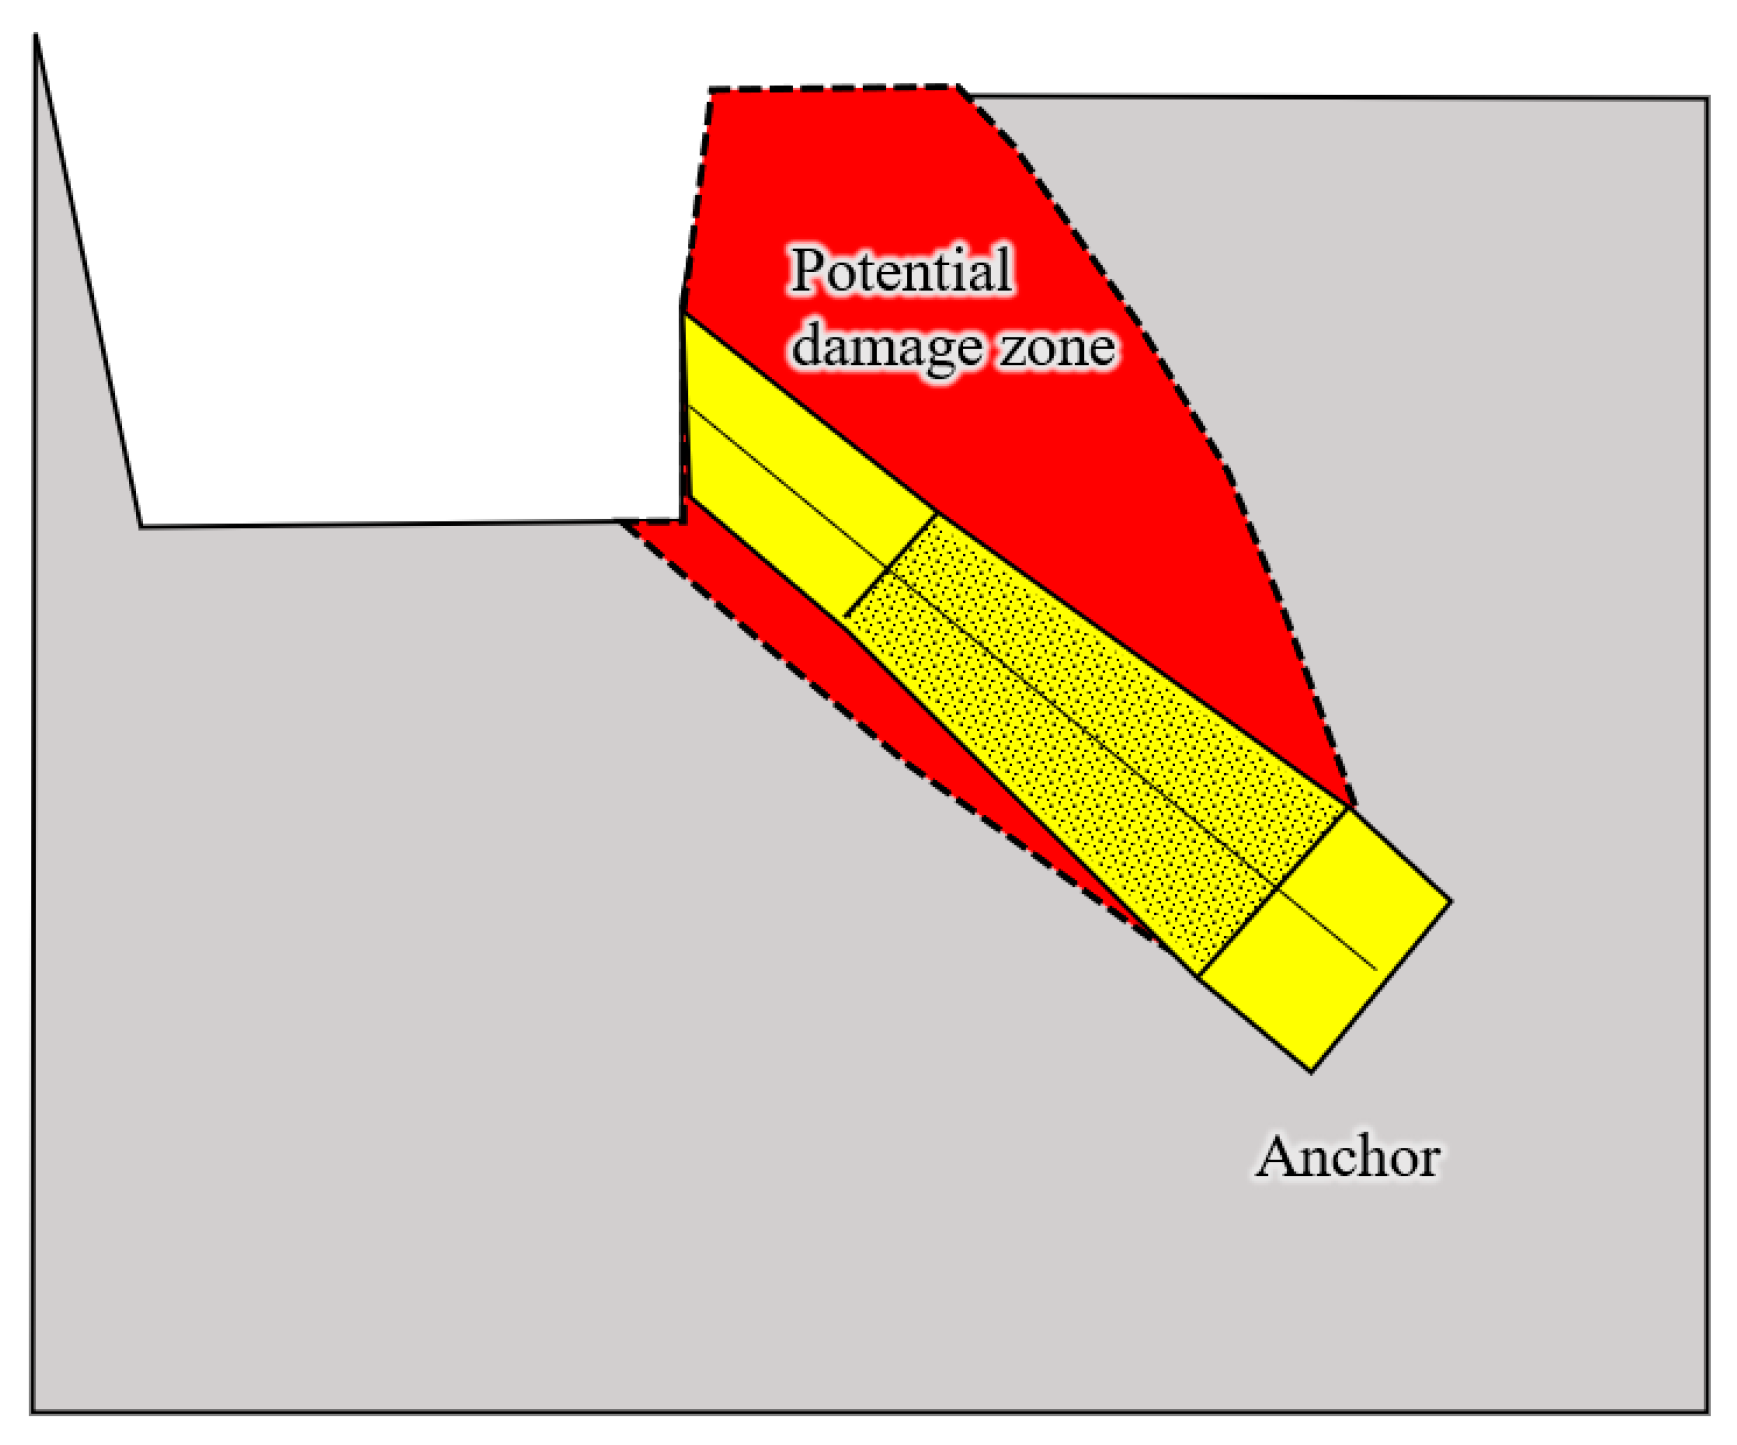
5.3. Tunnel Anchoring Bearing Capacity and Failure Mode

In the process of applying 1P to 13P load on the tunnel anchor, the test results of the multi-point displacement meter at two key points of the front anchor surface and the tunnel face are shown in Figure 18a. During the whole loading process, the axial deformation of the rock mass of the middle pier increases gradually in the tunnel anchor, and under the 8P load, the deformation of the surrounding rock of the middle pier has an obvious inflection point. In the process of applying 1P to 13P load on the tunnel anchor, the deformation curve of surrounding rock on the outside and top of the tunnel anchor hole is shown in Figure 18b,c.
According to the above analysis, during the loading process, the surrounding rock deformation of the two sides of the anchor tunnel and the surrounding rock of the tunnel roof at the front anchor surface and the tunnel face increases with the increase of load. When applied to an 8P load, the surrounding rock deformation produces an inflection point. Therefore, based on the test results of surrounding rock deformation in the model experiment, the bearing capacity of the tunnel anchor is determined as 8P. In summary, under the action of load, the anchor plug body drives the surrounding rock mass to produce pull-out failure. The potential failure mode is that under the action of a large overload, the anchorage body and the surrounding rock mass are pulled out as a whole, and the failure mode is shown in Figure 19.

6. Conclusions

In this paper, Wujiagang Bridge’s north side of the river tunnel anchor was used as the background of the study. A 1:12 scale model of the tunnel anchor was constructed based on the similarity principle at the site adjacent to the project site with the same geological conditions using a field-scale model test. The scale model experiments such as design load test, overload test, overload rheological test, and ultimate bearing capacity failure were carried out by using comprehensive test methods such as displacement meter, inclinometer, strain gauge, and micrometer, and the following research conclusions were obtained.
1.
The 1:12 scale model experiment and the solid tunnel anchor meet the geometric similarity and geological similarity conditions, and the lithology of the model experiment site is the same as the solid anchor site.
2.
According to the model experiment results, under the design load of 1P, the deformation of the rock mass at the top of the anchor tunnel is the largest, which is 0.005 mm followed by the deformation of the rock mass at the front anchor surface, and the deformation of the rock mass at the rear anchor surface is the smallest, which is 0.001 mm. According to the similarity principle, it is speculated that the maximum deformation of the front anchor surface of the solid anchor is about 1.2 mm under 1P load.
3.
In the step-by-step loading process, the deformation at the back of the anchor plug is the largest, which is 2.76 mm, followed by the middle of the anchor plug, and the deformation at the front of the anchor plug is small, which is 0.33 mm. According to the similarity principle, the bearing capacity of the current design scheme of tunnel anchors on the north side of the Yangtze River of Wujiagang Bridge is determined to be 8P. The failure load test results show that under the action of a large load, the anchor plug body drives the surrounding rock mass to produce pull-out failure, and its potential failure mode is that the anchor plug body and the surrounding rock mass of the anchor plug body are pulled out as a whole.
4.
Rheological test results show that the long-term rheological characteristics of tunnel anchorage are not obvious under the action of design load and step-by-step overload load, and the anchorage can be in a long-term stable state under rheological load. The scheme of tunnel anchorage on the north side of Wujiagang Yangtze River Bridge in Yichang can meet the engineering requirements.
Due to the difference in time effect between the loading process of the model test and the loading of the actual project, the effect of the random loads that occurred during the period was not considered. Therefore, for similar studies in the future, the effects of seismic loading and construction-blasting dynamic loading on the stability and ultimate bearing capacity of the anchor body can continue to be considered.

Author Contributions

Experimental design, Z.S.; test operation, J.J. and N.J.; field testing, B.Z. and W.S.; writing—original draft preparation, N.J. and B.Z.; writing—review and editing, W.S. and Z.S.; supervision, J.J.; project administration, N.J.; funding acquisition, N.J. All authors have read and agreed to the published version of the manuscript.

Funding

This research was funded by the National Natural Science Foundation of China, grant number 41807265.

Conflicts of Interest

The authors declare no conflict of interest.

References

  1. Gosteev, Y.; Konovalov, I.; Lebedev, A.; Obukhovskiy, A.; Salenko, S.; Yashnov, A. Numerical and Experimental Studies of the Use of Fiber-Reinforced Polymers in Long-Span Suspension Bridges. Energies 2022, 15, 1864. [Google Scholar] [CrossRef]
  2. Zhao, K.; Jiang, N.; Zhou, C.; Li, H.; Cai, Z.; Zhu, B. Dynamic behavior and failure of buried gas pipeline considering the pipe connection form subjected to blasting seismic waves. Thin-Walled Struct. 2022, 170, 108495. [Google Scholar] [CrossRef]
  3. Wu, T.; Jiang, N.; Zhou, C.; Luo, X.; Li, H.; Zhang, Y. Experimental and numerical investigations on damage assessment of high-density polyethylene pipe subjected to blast loads. Eng. Fail. Anal. 2022, 131, 105856. [Google Scholar] [CrossRef]
  4. Gwon, S.G.; Choi, D.H. Continuum model for static and dynamic analysis of suspension bridges with a floating girder. J. Bridge Eng. 2018, 23, 04018079. [Google Scholar] [CrossRef]
  5. Fenerci, A.; Øiseth, O.; Rønnquist, A. Long-term monitoring of wind field characteristics and dynamic response of along-span suspension bridge in complex terrain. Eng. Struct. 2017, 147, 269–284. [Google Scholar] [CrossRef]
  6. Li, D.; Liu, X.; Wu, X.; Li, W. Three-dimensional elastoplastic analysis on the stability of tunnel anchorage in soft rock. Geo-China 2016, 2016, 166–175. [Google Scholar]
  7. Larsen, A.; Larose, G.L. Dynamic wind effects on suspension and cable-stayed bridges. J. Sound Vib. 2015, 334, 2–28. [Google Scholar] [CrossRef]
  8. Chen, S.R.; Wu, J. Modeling stochastic live load for longspan bridge based on microscopic traffic flow simulation. Comput. Struct. 2011, 89, 813–824. [Google Scholar] [CrossRef]
  9. Chen, G.S.; Xiao, F.; Zatar, W.; Hulsey, J.L. Characterization of nonstationary mode interaction of bridge by considering deterioration of bearing. Adv. Mater. Sci. Eng. 2018, 2018, 5454387. [Google Scholar] [CrossRef] [Green Version]
  10. Xu, Y.-L.; Zhang, C.D.; Zhan, S.; Spencer, B.F. Multi-level damage identification of a bridge structure: A combined numerical and experimental investigation. Eng. Struct. 2018, 156, 53–67. [Google Scholar] [CrossRef]
  11. Matarazzo, T.J.; Santi, P.; Pakzad, S.N.; Carter, K.; Ratti, C.; Moaveni, B.; Osgood, C.; Jacob, N. Crowdsensing framework for monitoring bridge vibrations using moving smartphones. Proc. IEEE 2018, 106, 577–593. [Google Scholar] [CrossRef]
  12. Seo, S.; Park, J.; Lee, S.; Chung, M. Analysis of pull-out behavior of tunnel-type anchorage for suspended bridge using 2-D model experiments and numerical analysis. J. Korean Geotech. Soc. 2018, 34, 61–74. [Google Scholar]
  13. Yu, Z.; Jun, W.; Manjuan, Y.; Hao, L.; Hongqing, L. Analysis on Bearing Capacity of Tunnel Type Anchorage of a Long Span Suspension Bridge. J. Earth Sci. 2005, 16, 277–282. [Google Scholar]
  14. Seo, S.; Lim, H.; Chung, M. Evaluation of failure mode of tunnel-type anchorage for a suspension bridge via scaled model experiments and image processing. Geomech. Eng. 2021, 24, 457–470. [Google Scholar]
  15. Liu, Y.; Ji, F.Q.; Chen, P.S. Analysis of Space-Time Effect for Footage of Tunnel-type Anchorage by Tunneling Cycle. Appl. Mech. Mater. 2014, 501, 1749–1752. [Google Scholar]
  16. Seo, S.; Chung, M. Analysis of Pull-out Behavior of Tunnel-type Anchorage for Suspended Bridge using Scaled Model experiment. In Proceedings of the 29th International Ocean and Polar Engineering Conference, Honolulu, HI, USA, 16–21 June 2019. [Google Scholar]
  17. Jiang, N.; Wang, D.; Feng, J.; Zhang, S.-L.; Huang, L. Bearing mechanism of a tunnel-type anchorage in a railway suspension bridge. J. Mt. Sci. 2021, 18, 2143–2158. [Google Scholar] [CrossRef]
  18. Liu, X.; Han, Y.; Yu, C.; Xiong, F.; Zhou, X.; Deng, Z. Reliability assessment on stability of tunnel-type anchorages. Comput. Geotech. 2020, 125, 103661. [Google Scholar] [CrossRef]
  19. Zhou, H.; Li, W.; Wang, S.; Wu, X.C.; Wang, Z.H. Scale Model experiment on the Deformation and Failure Mechanism of Tunnel-type Anchorage Surrounded by Soft Rock. J. Yangtze River Sci. Res. Inst. 2016, 33, 67. [Google Scholar]
  20. Li, Y.; Luo, R.; Zhang, Q.; Xiao, G.; Zhou, L.; Zhang, Y. Model experiment and numerical simulation on the bearing mechanism of tunnel-type anchorage. Geomech. Eng. 2017, 12, 139–160. [Google Scholar] [CrossRef]
  21. Liu, X.; Han, Y.; Li, D.; Tu, Y.; Deng, Z.; Yu, C.; Wu, X. Anti-pull mechanisms and weak interlayer parameter sensitivity analysis of tunnel-type anchorages in soft rock with underlying weak interlayers. Eng. Geol. 2019, 253, 123–136. [Google Scholar] [CrossRef]
  22. Lim, H.; Seo, S.; Ko, J.; Chung, M. Effect of Joint Characteristics and Geometries on Tunnel-Type Anchorage for Suspension Bridge. Appl. Sci. 2021, 11, 11688. [Google Scholar] [CrossRef]
  23. Wang, D.-Y.; Tang, H.; Yin, X.T.; Qin, Y.-Q.; Deng, Q. Uplift Bearing Capacity and Safety Assessment Method of Tunnel-type Anchorage. China J. Highw. Transp. 2018, 31, 95. [Google Scholar]
  24. Xu, D.; Wu, A.; Lu, B.; Wang, B.; Hu, W.; Xiang, Q.; Wang, S.; Yi, T. Study on Failure Mechanism of Tunnel-Type Anchorage Using Discontinuous Deformation Analysis Method; IOP Conference Series: Earth and Environmental Science; IOP Publishing: Bristol, UK, 2021; Volume 861, p. 032017. [Google Scholar]
  25. Han, Y.; Liu, X.; Li, D.; Tu, Y.; Deng, Z.; Liu, D.; Wu, X. Model experiment on the bearing behaviors of the tunnel-type anchorage in soft rock with underlying weak interlayers. Bull. Eng. Geol. Environ. 2020, 79, 1023–1040. [Google Scholar] [CrossRef]
  26. GBT50218-2014; Standard for Engineering Classification of Rock Mass. Standardization Administration of China: Beijing, China, 2014; pp. 4–15.
  27. Li, N.; Zhou, Y.; Zhao, Y.; Li, G. Analysis of suspension bridge tunnel-type anchorage construction on the stability of surrounding rock. EDP Sci. 2020, 198, 02006. [Google Scholar] [CrossRef]
  28. Sedov, L.I.; Volkovets, A.G. Similarity and Dimensional Methods in Mechanics; CRC Press: Boca Raton, FL, USA, 2018. [Google Scholar]
  29. Zhu, J.B.; Wu, A.Q.; Huang, Z.J.; Peng, Y.C.; Zhong, Z.W. Pulling test of anchorage model of Siduhe suspension bridge. J. Yangtze River Sci. Res. Inst. 2006, 23, 51. [Google Scholar]
  30. Li, C.; Feng, Z.; Pan, R.; Ke, L.; He, J.; Dong, S. Experimental and numerical investigation on the anchorage zone of prestressed UHPC box-girder bridge. J. Bridge Eng. 2020, 25, 04020028. [Google Scholar] [CrossRef]
Figure 1. Schematic diagram of tunnel anchorage project on the north side of Wujiagang Bridge: (a) project location; (b) layout plan; (c) the profile.
Energies 15 04772 g001aEnergies 15 04772 g001b
Figure 2. Schematic diagram of the anchor body measurement point arrangement: (a) anchor plug body enclosure deformation measurement; (b) anchor body strain gauge and dislocation gauge.
Energies 15 04772 g002
Figure 3. Schematic diagram of the scaled-down model: (a) the size; (b) the model jack; (c) anchor room and jack bottom plate reinforcement.
Energies 15 04772 g003
Figure 4. Schematic diagram of the loading steps of the anchor test.
Energies 15 04772 g004
Figure 5. Deformation test results of anchor plug multi-point displacement meter: (a) D1; (b) D3; (c) D2.
Energies 15 04772 g005
Figure 6. Design load deformation test results of sliding micrometer for surrounding rock outside anchorage tunnel: (a) H1; (b) H4; (c) H2; (d) H3.
Energies 15 04772 g006
Figure 7. Test results of dislocation meter deformation experiment: (a) back anchor surface; (b) middle anchor; (c) front anchor.
Energies 15 04772 g007
Figure 8. Design load Strain gauge deformation test results: (a) back anchor surface; (b) middle anchor; (c) front anchor.
Energies 15 04772 g008aEnergies 15 04772 g008b
Figure 9. Deformation test results of anchor plug point displacement meter: (a) D1; (b) D3; (c) D2.
Energies 15 04772 g009aEnergies 15 04772 g009b
Figure 10. Overload and failure deformation test results of sliding micrometer for surrounding rock outside anchorage tunnel: (a) H1; (b) H4; (c) H2; (d) H3.
Energies 15 04772 g010aEnergies 15 04772 g010b
Figure 11. Deformation test results by dislocation gauge: (a) Back Anchor Surface; (b) Middle Anchor; (c) Front anchor surface.
Energies 15 04772 g011
Figure 12. Overload and failure Strain gauge deformation test results: (a) back anchor surface; (b) middle anchor; (c) front anchor.
Energies 15 04772 g012
Figure 13. Deformation–time curve of anchor plug multi-point displacement meter: (a) D1; (b) D2.
Energies 15 04772 g013
Figure 14. Deformation–time curve of dislocation gauge: (a) back anchor surface; (b) middle anchor; (c) front anchor.
Energies 15 04772 g014
Figure 15. Strain gauge deformation–time curve: (a) back anchor surface; (b) middle anchor; (c) front anchor.
Energies 15 04772 g015
Figure 16. The cumulative curve of borehole depth–deformation: (a) C1 hole (back anchor surface); (b) C2 hole (front anchor surface).
Energies 15 04772 g016
Figure 17. Test results of dislocation gauge: (a) back anchor surface; (b) middle anchor; (c) front anchor.
Energies 15 04772 g017aEnergies 15 04772 g017b
Figure 18. Test results of surrounding rock deformation outside anchor tunnel: (a) Middle pier; (b) Outside of left anchor hole (H1); (c) Top of left anchor hole (H2).
Energies 15 04772 g018aEnergies 15 04772 g018b
Figure 19. Diagram of potential failure model of tunnel anchor.
Energies 15 04772 g019
Table 1. Rheological deformation of surrounding rock of middle pier.
Load1.0P/mm3.5P/mm7.0P/mm
Position
Middle division pierPalm face0.0100.1440.155
Front anchor surface0.0480.1340.243
Table 2. Flow deformation of dislocation meter.
Load1.0P/mm3.5P/mm7.0P/mm
Position
Left anchorLeft wallF40.0010.0060.008
F110.0020.0030.001
Right wallF200.0040.003
F10.0020.0060.001
Right anchorLeft wallF90.0010.0060.002
F70.0020.0070.004
Right wallF80.0020.0060.006
F120.0030.0040.001
Table 3. Flow deformation of strain gauge.
Load1.0P/µε3.5P/µε7.0P/µε
Location
Left anchor plug bodyBack anchor surfaceY11−4.739−11.89−15.982
Y5−2.004−14.015−25.577
CentralY7−5.455−8.568−7.734
Y4−1.809−5.733−11.097
Front anchor surfaceY9−1.528−0.805−0.085
Y8−1.834−2.749−1.133
Right anchor plug bodyBack anchor surfaceY12−4.331−5.536−5.656
Y101.418−1.842.899
CentralY3−2.076−3.822−4.669
Front anchor surfaceY1−2.272−3.8963.166
Y2−2.103−1.7690.041
Publisher’s Note: MDPI stays neutral with regard to jurisdictional claims in published maps and institutional affiliations.

