
Cost Assessment of a Tokamak Fusion Reactor with an Inventive Method for Optimum Build Determination

Abstract
:1. Introduction
2. Model and Methods
2.1. Physics and Engineering Constraints
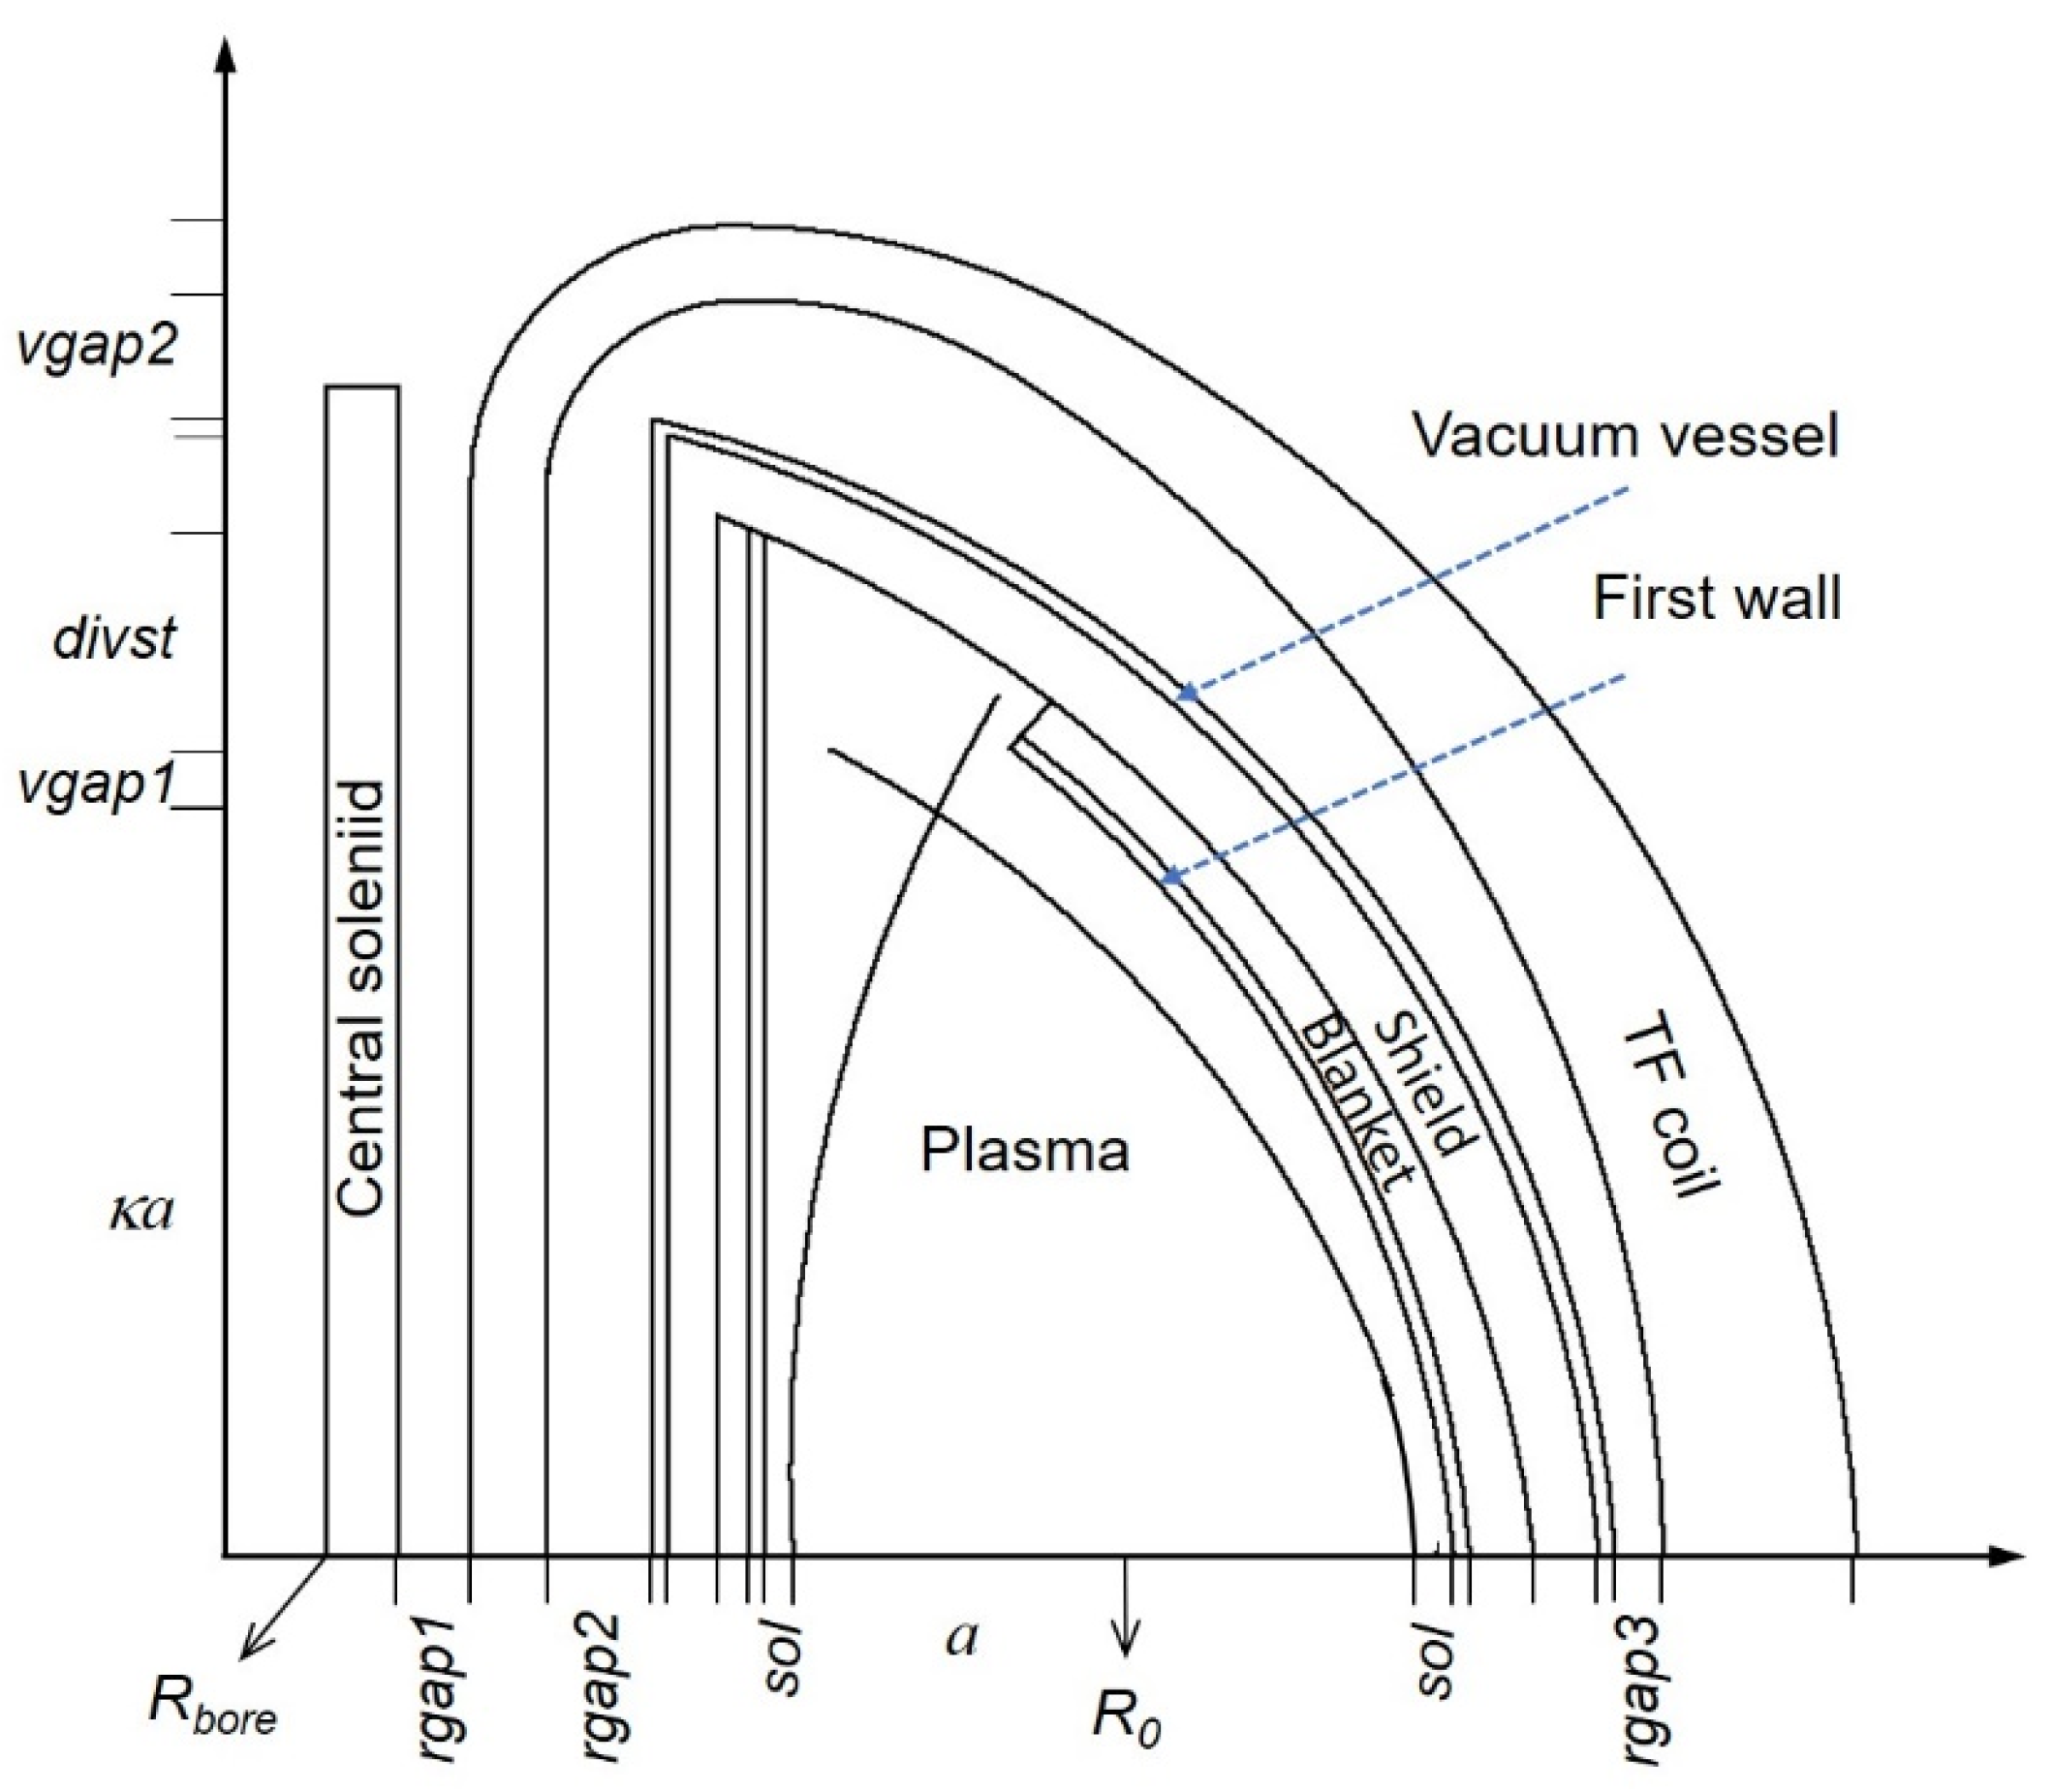
2.2. Determination of the Minimum Major Radius and the Optimum Build
2.3. Cost Model
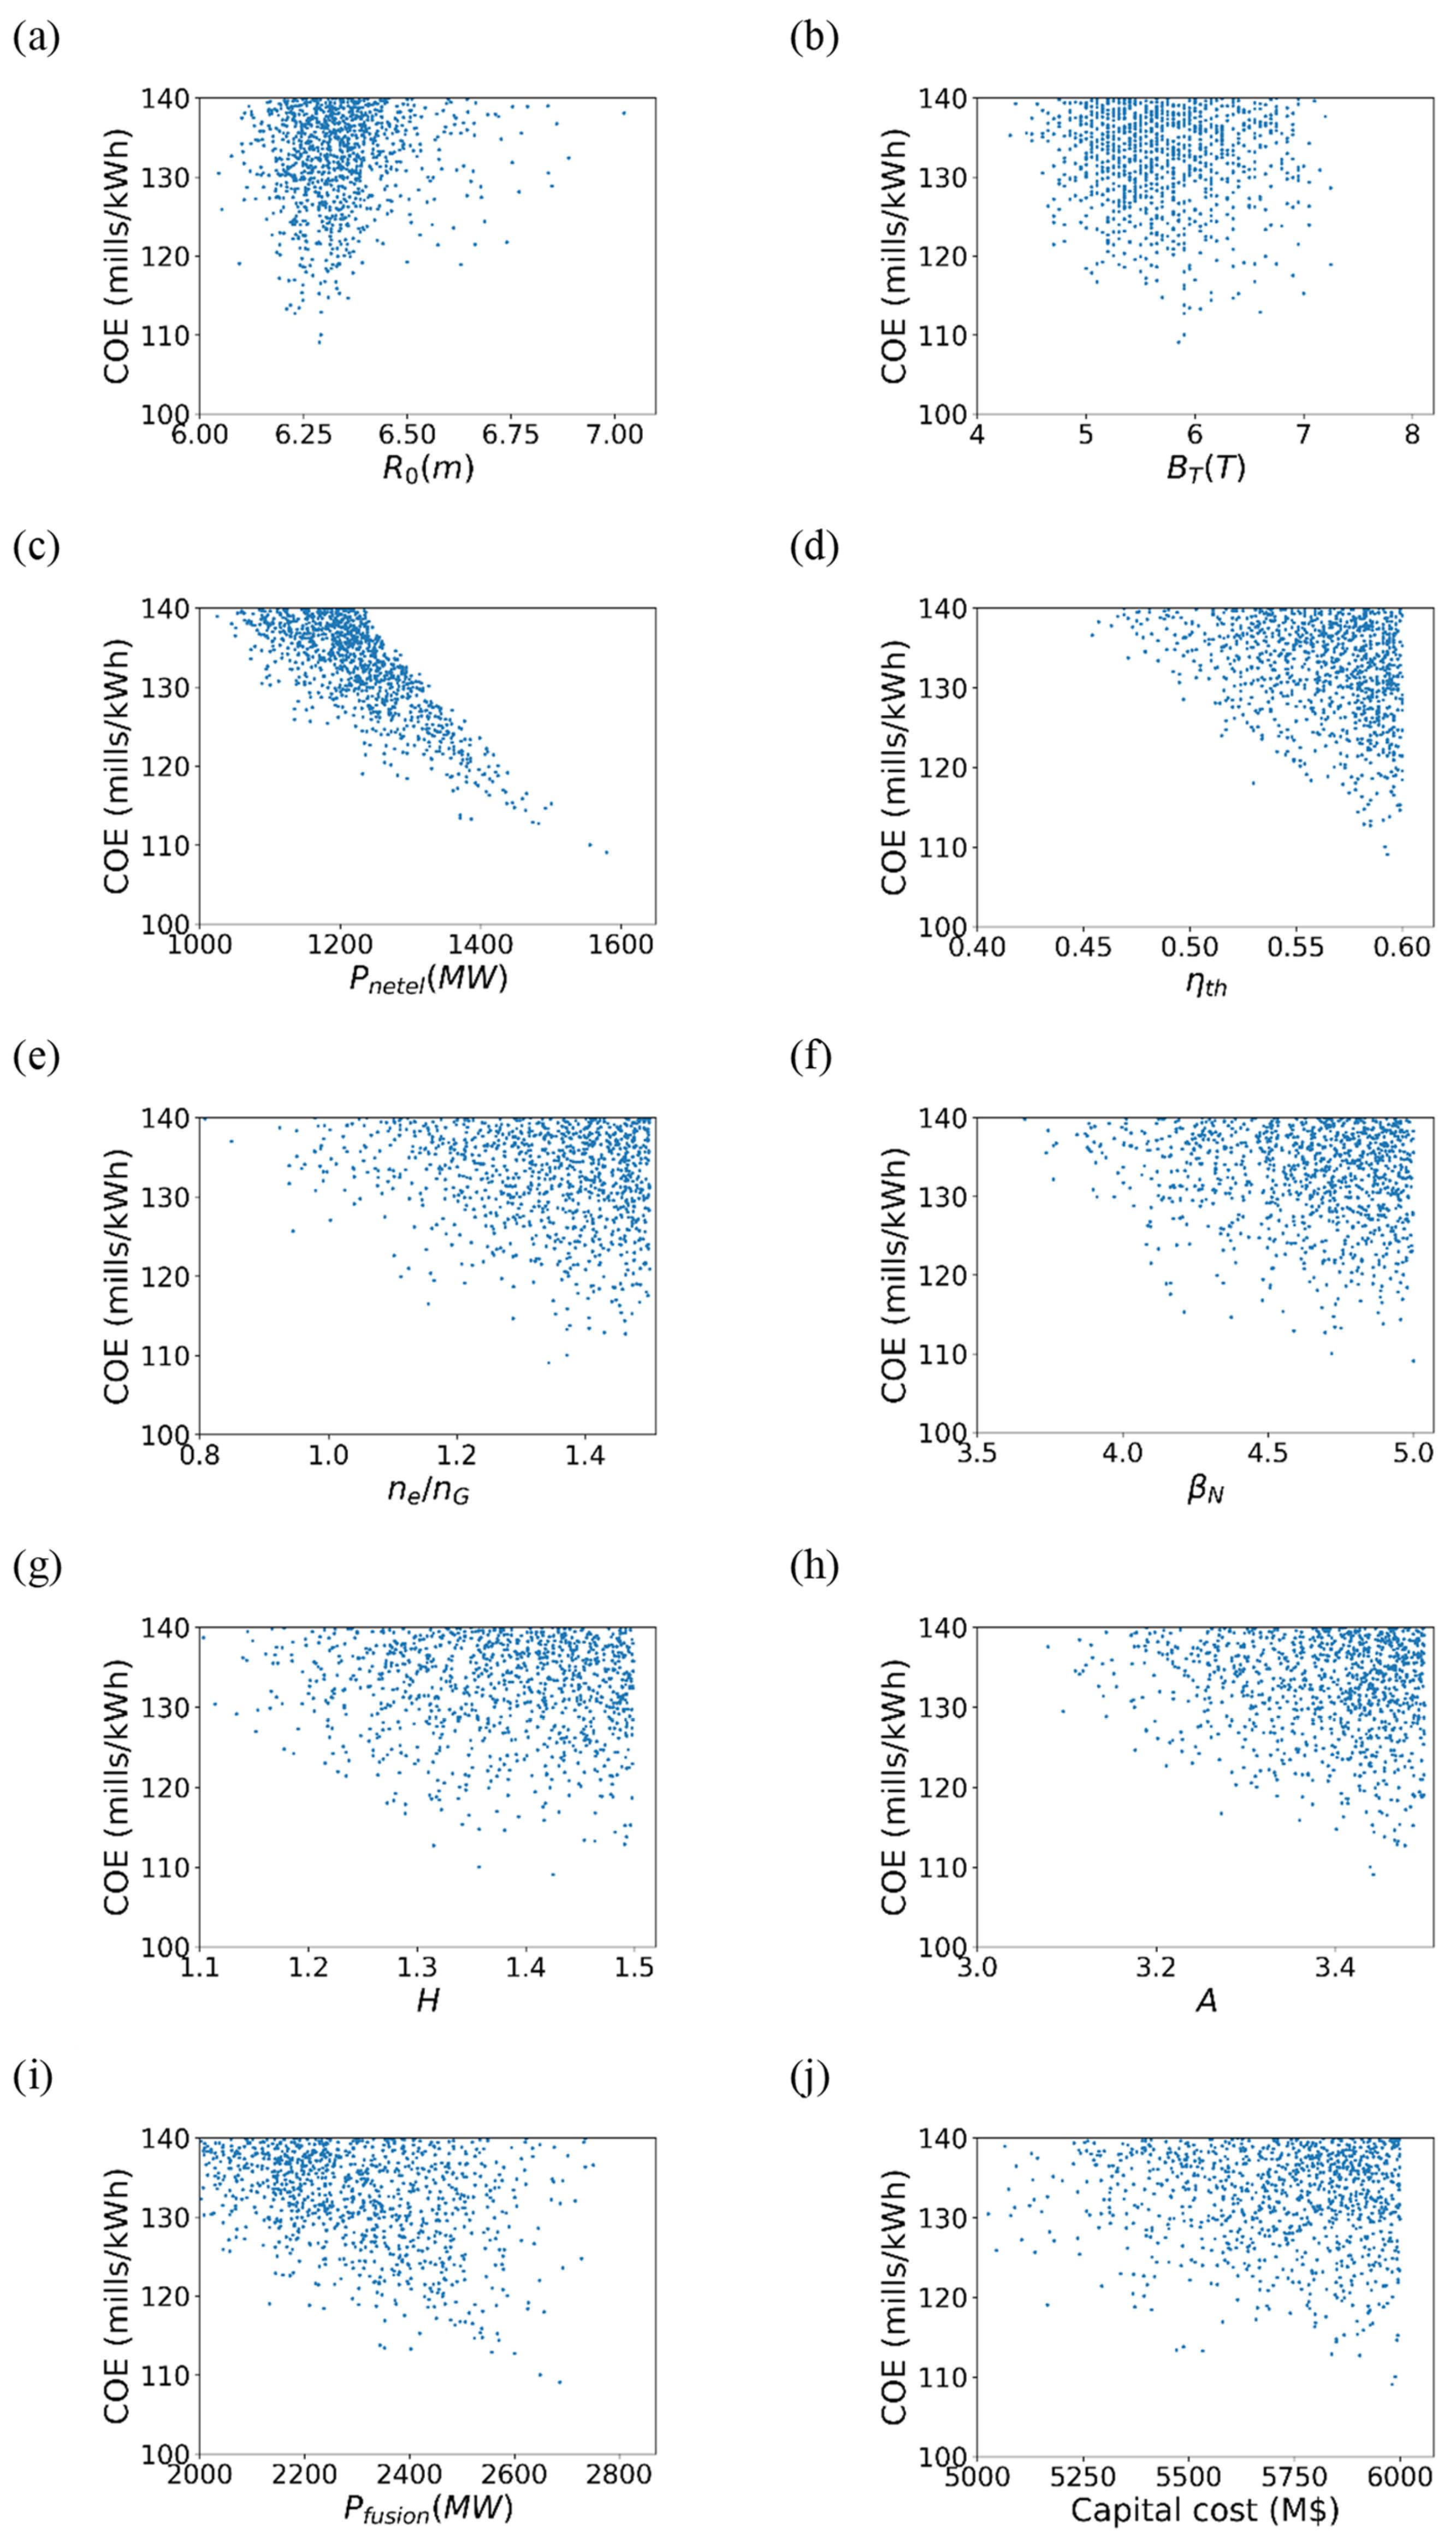
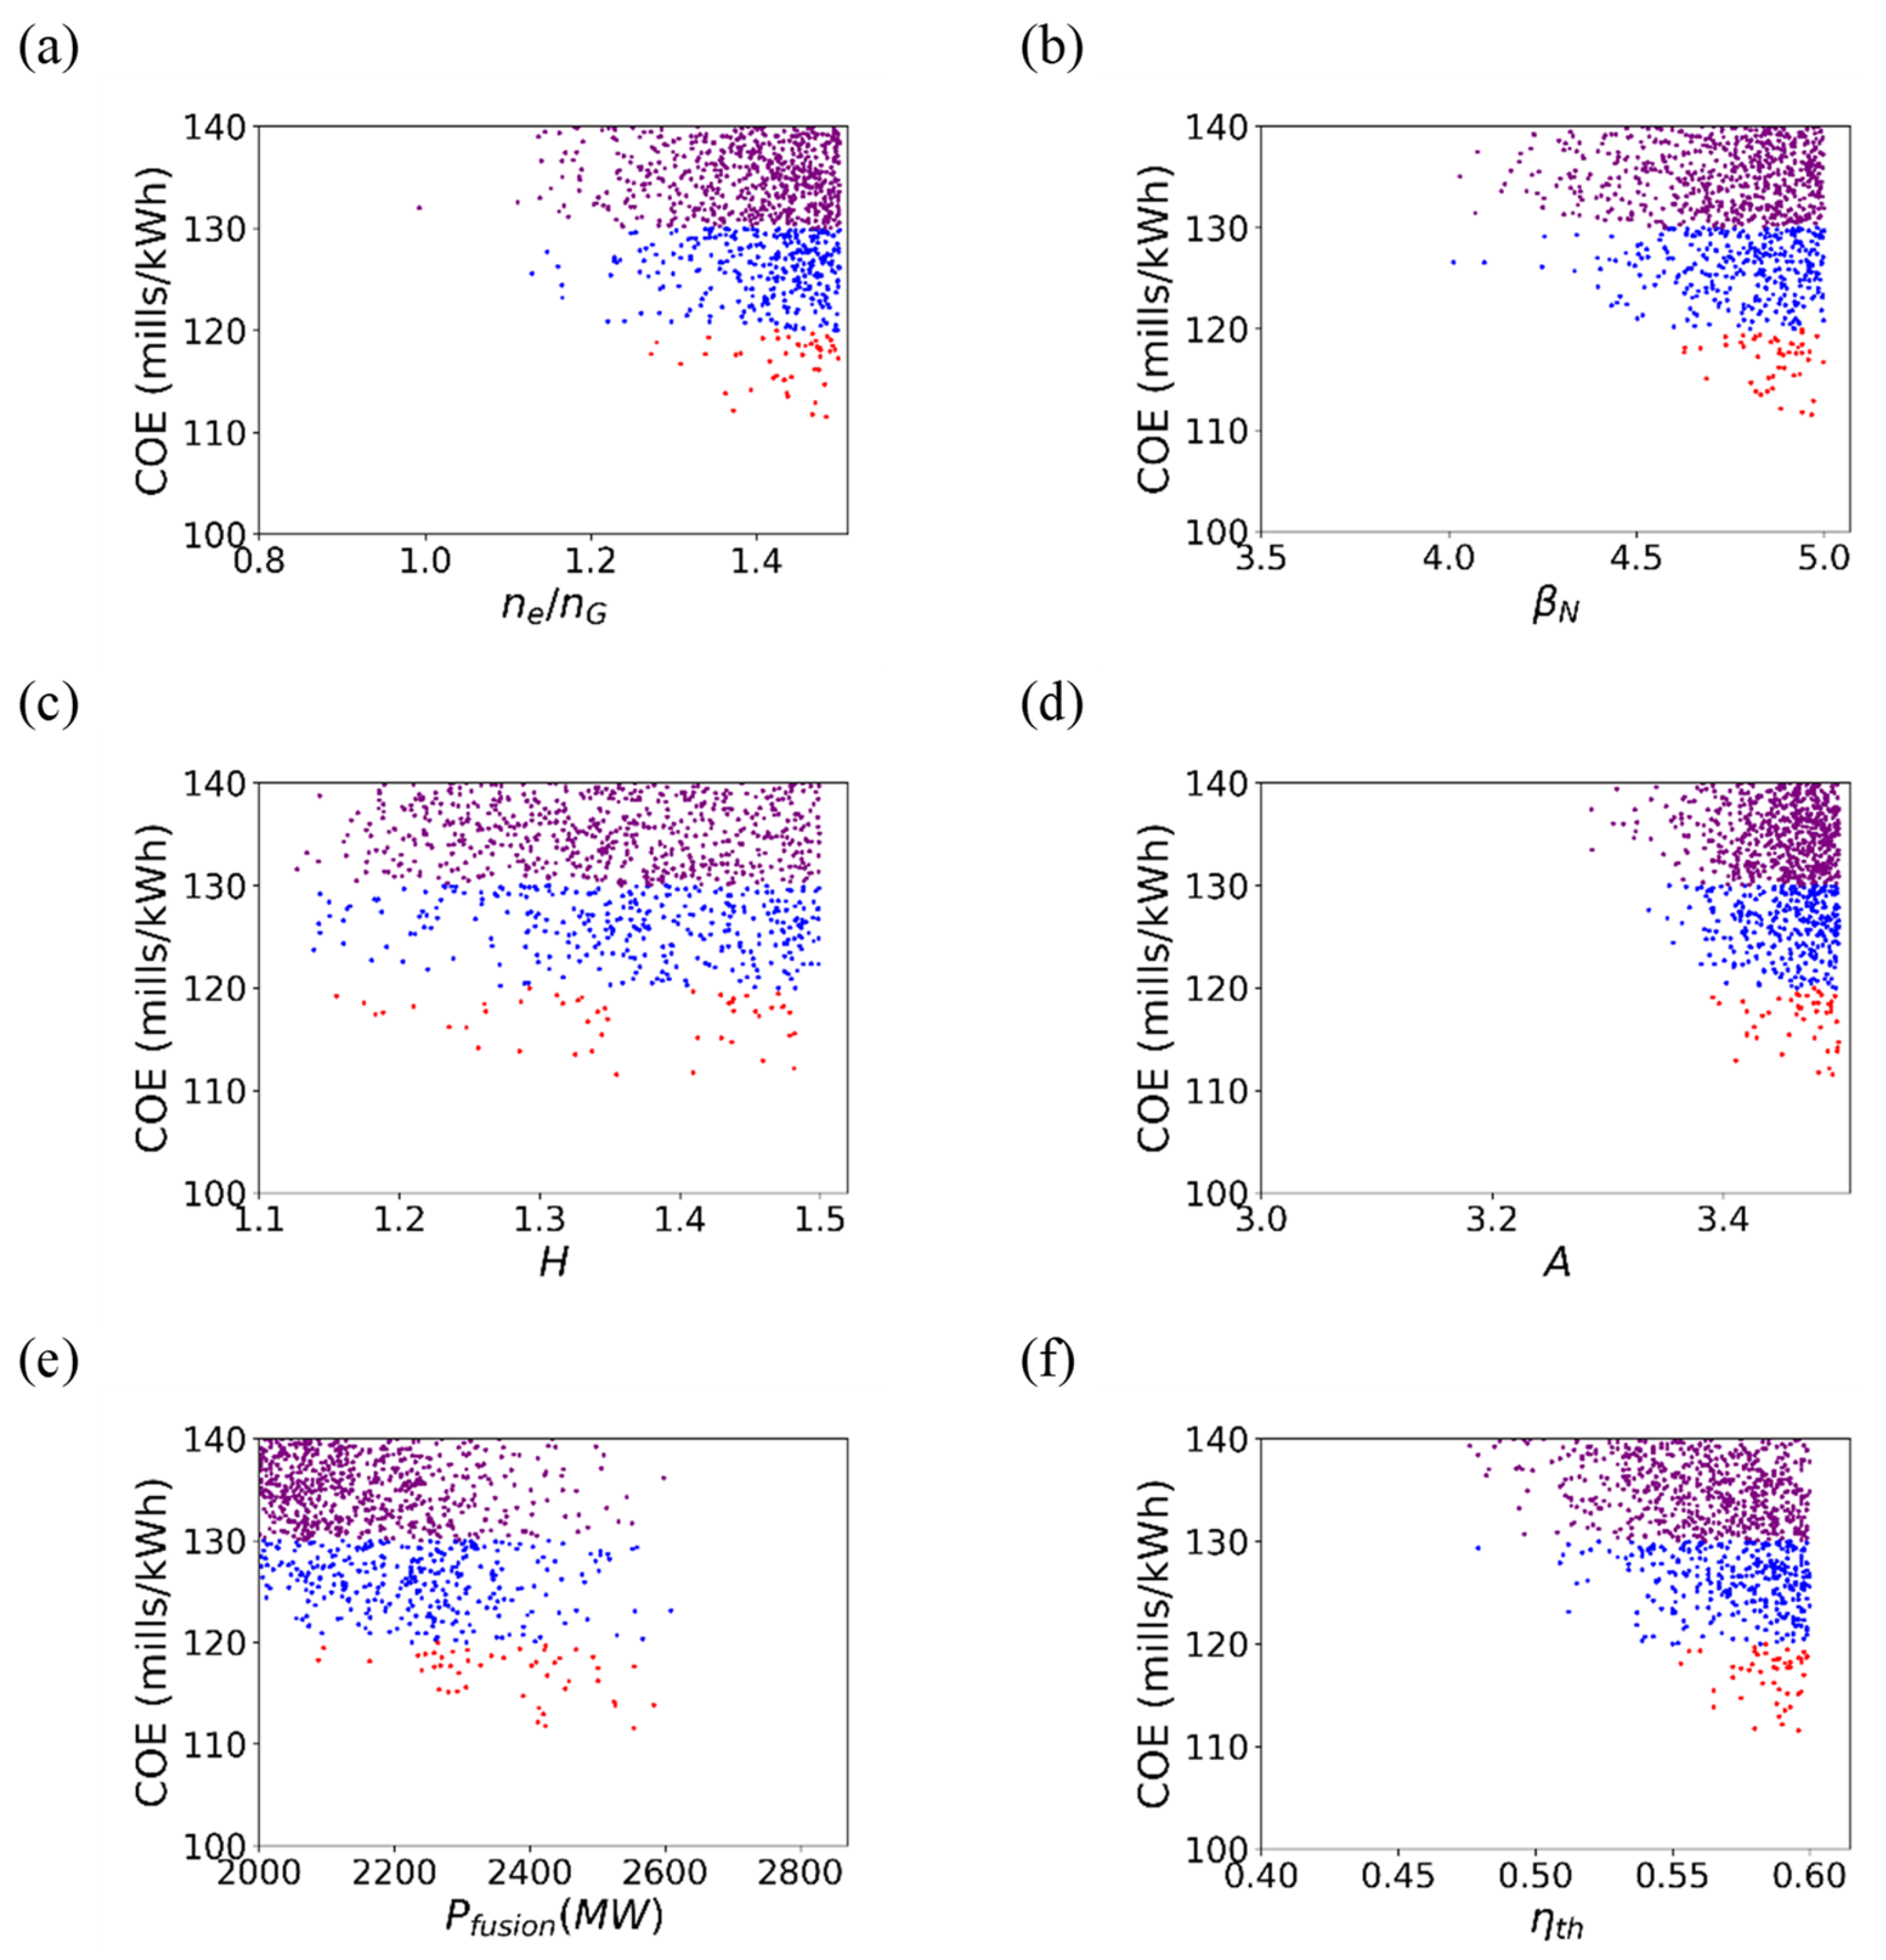
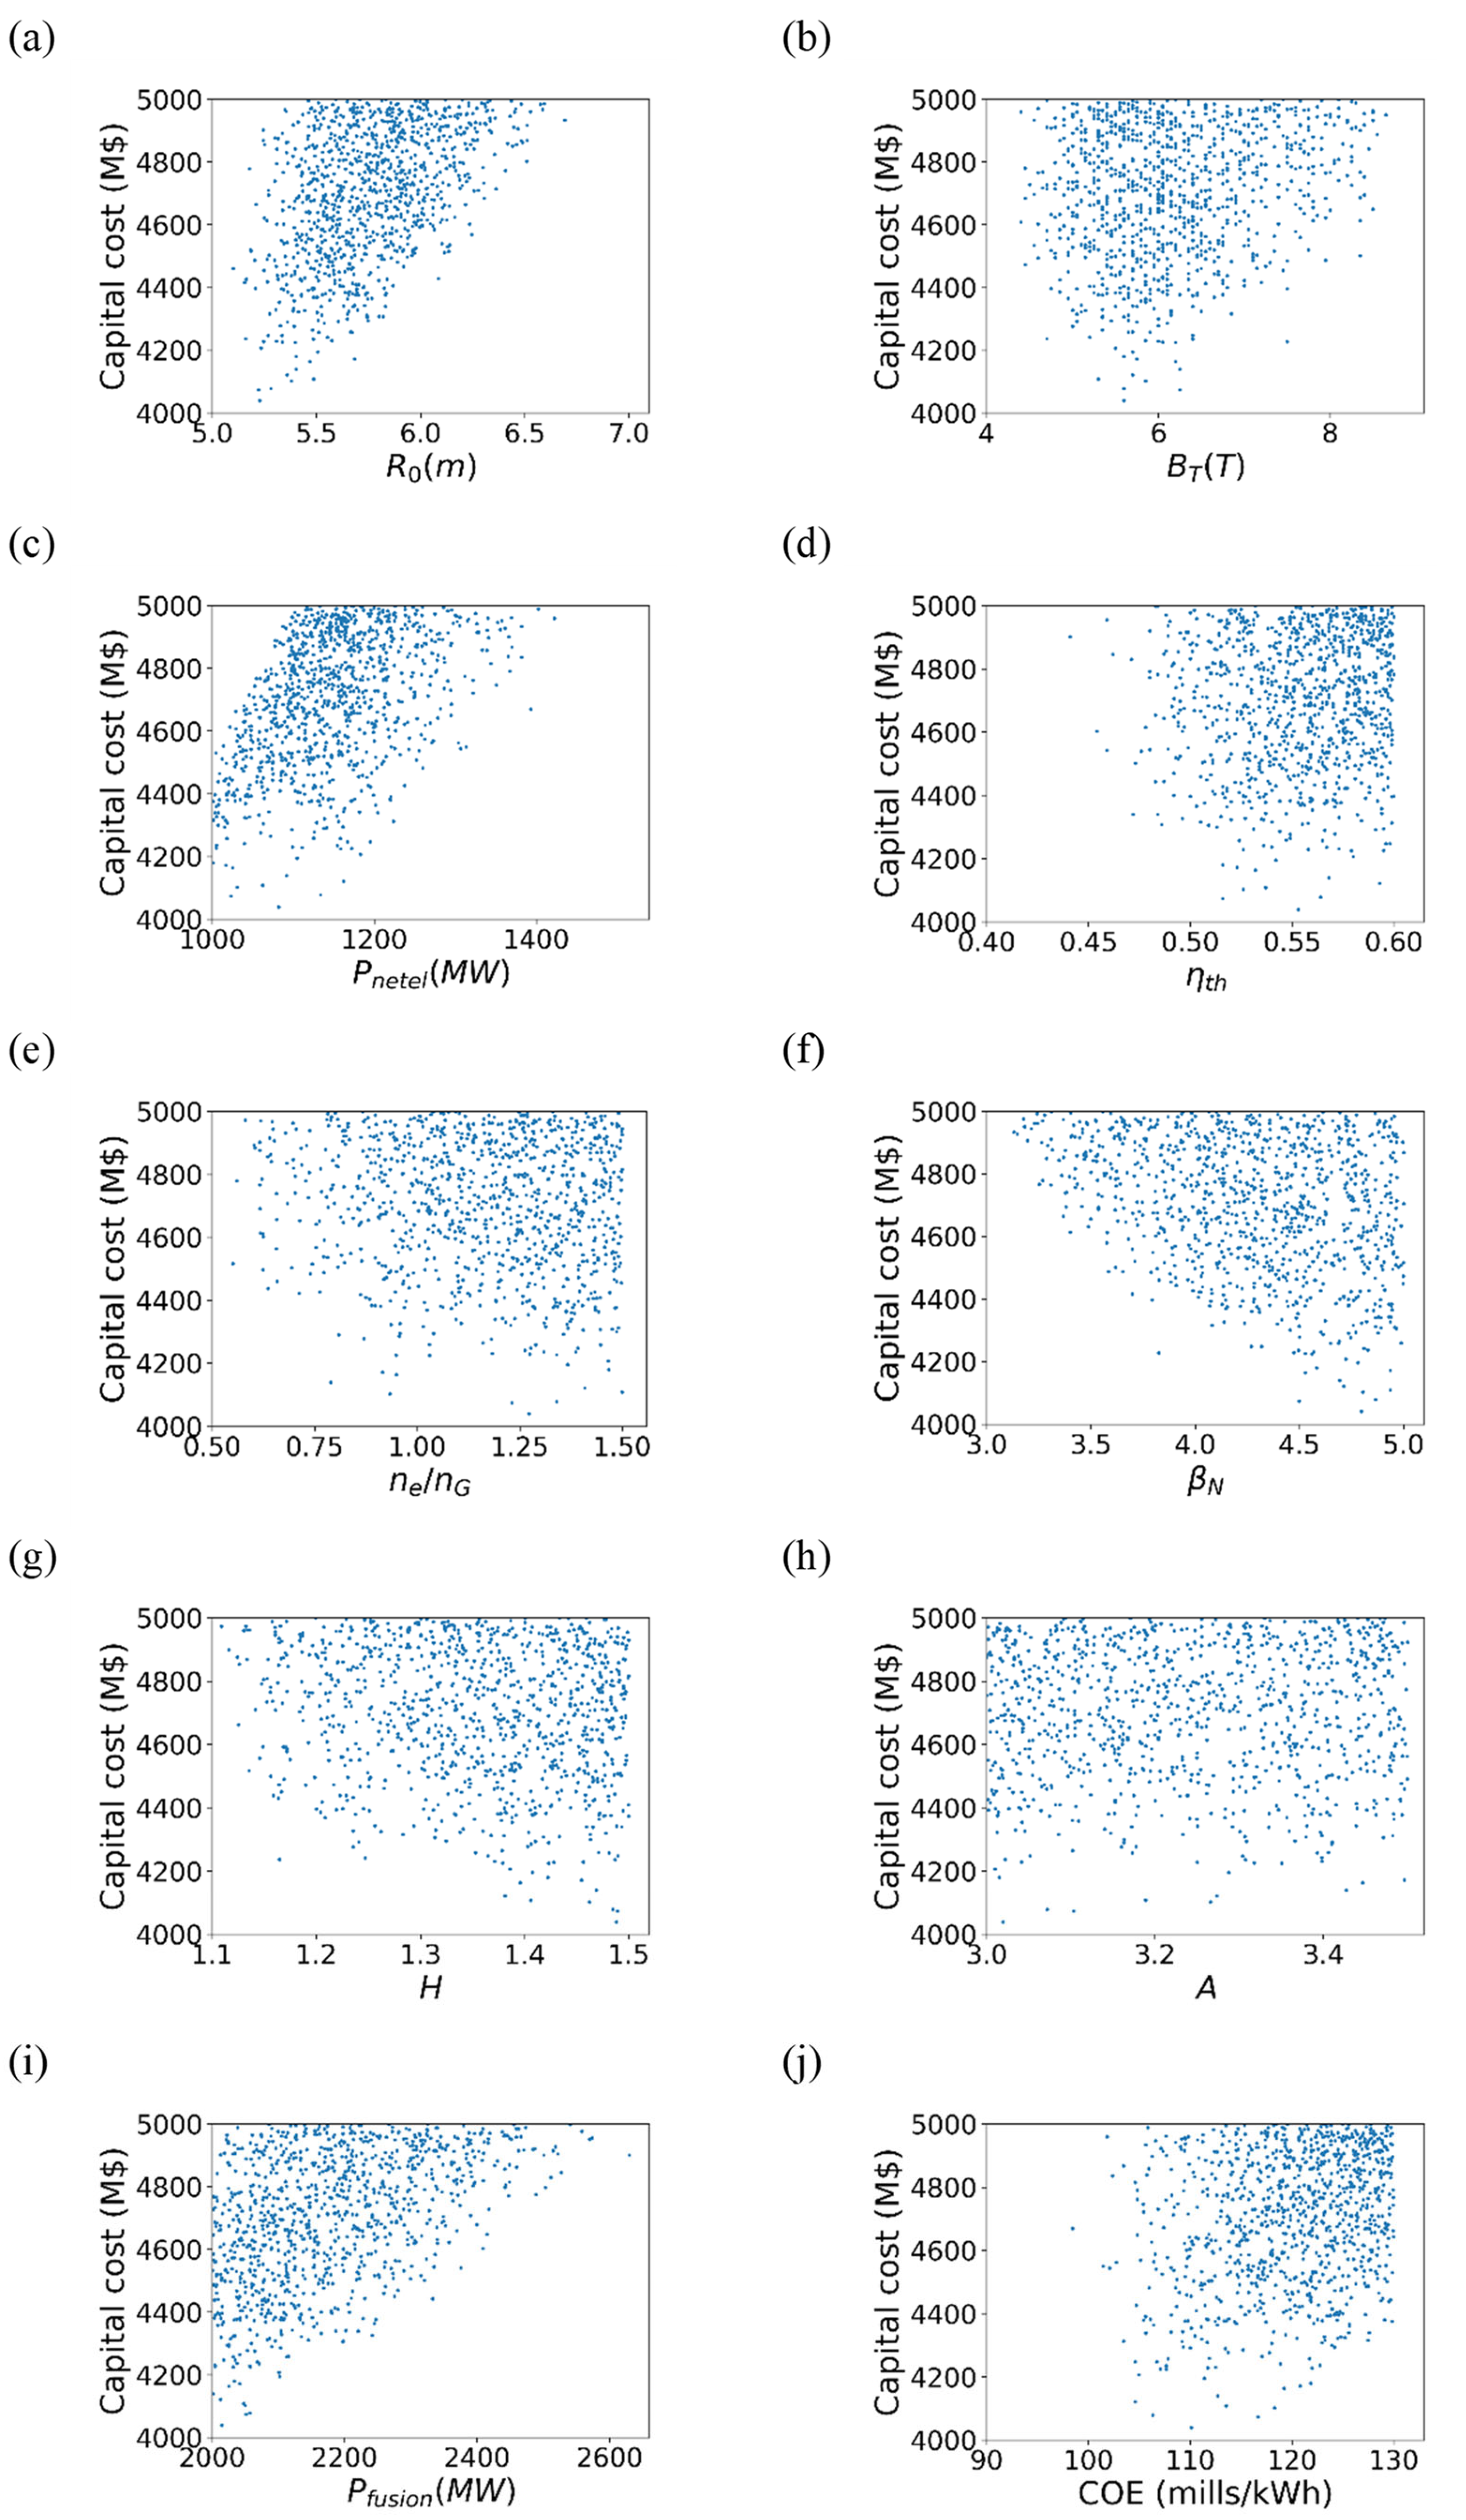
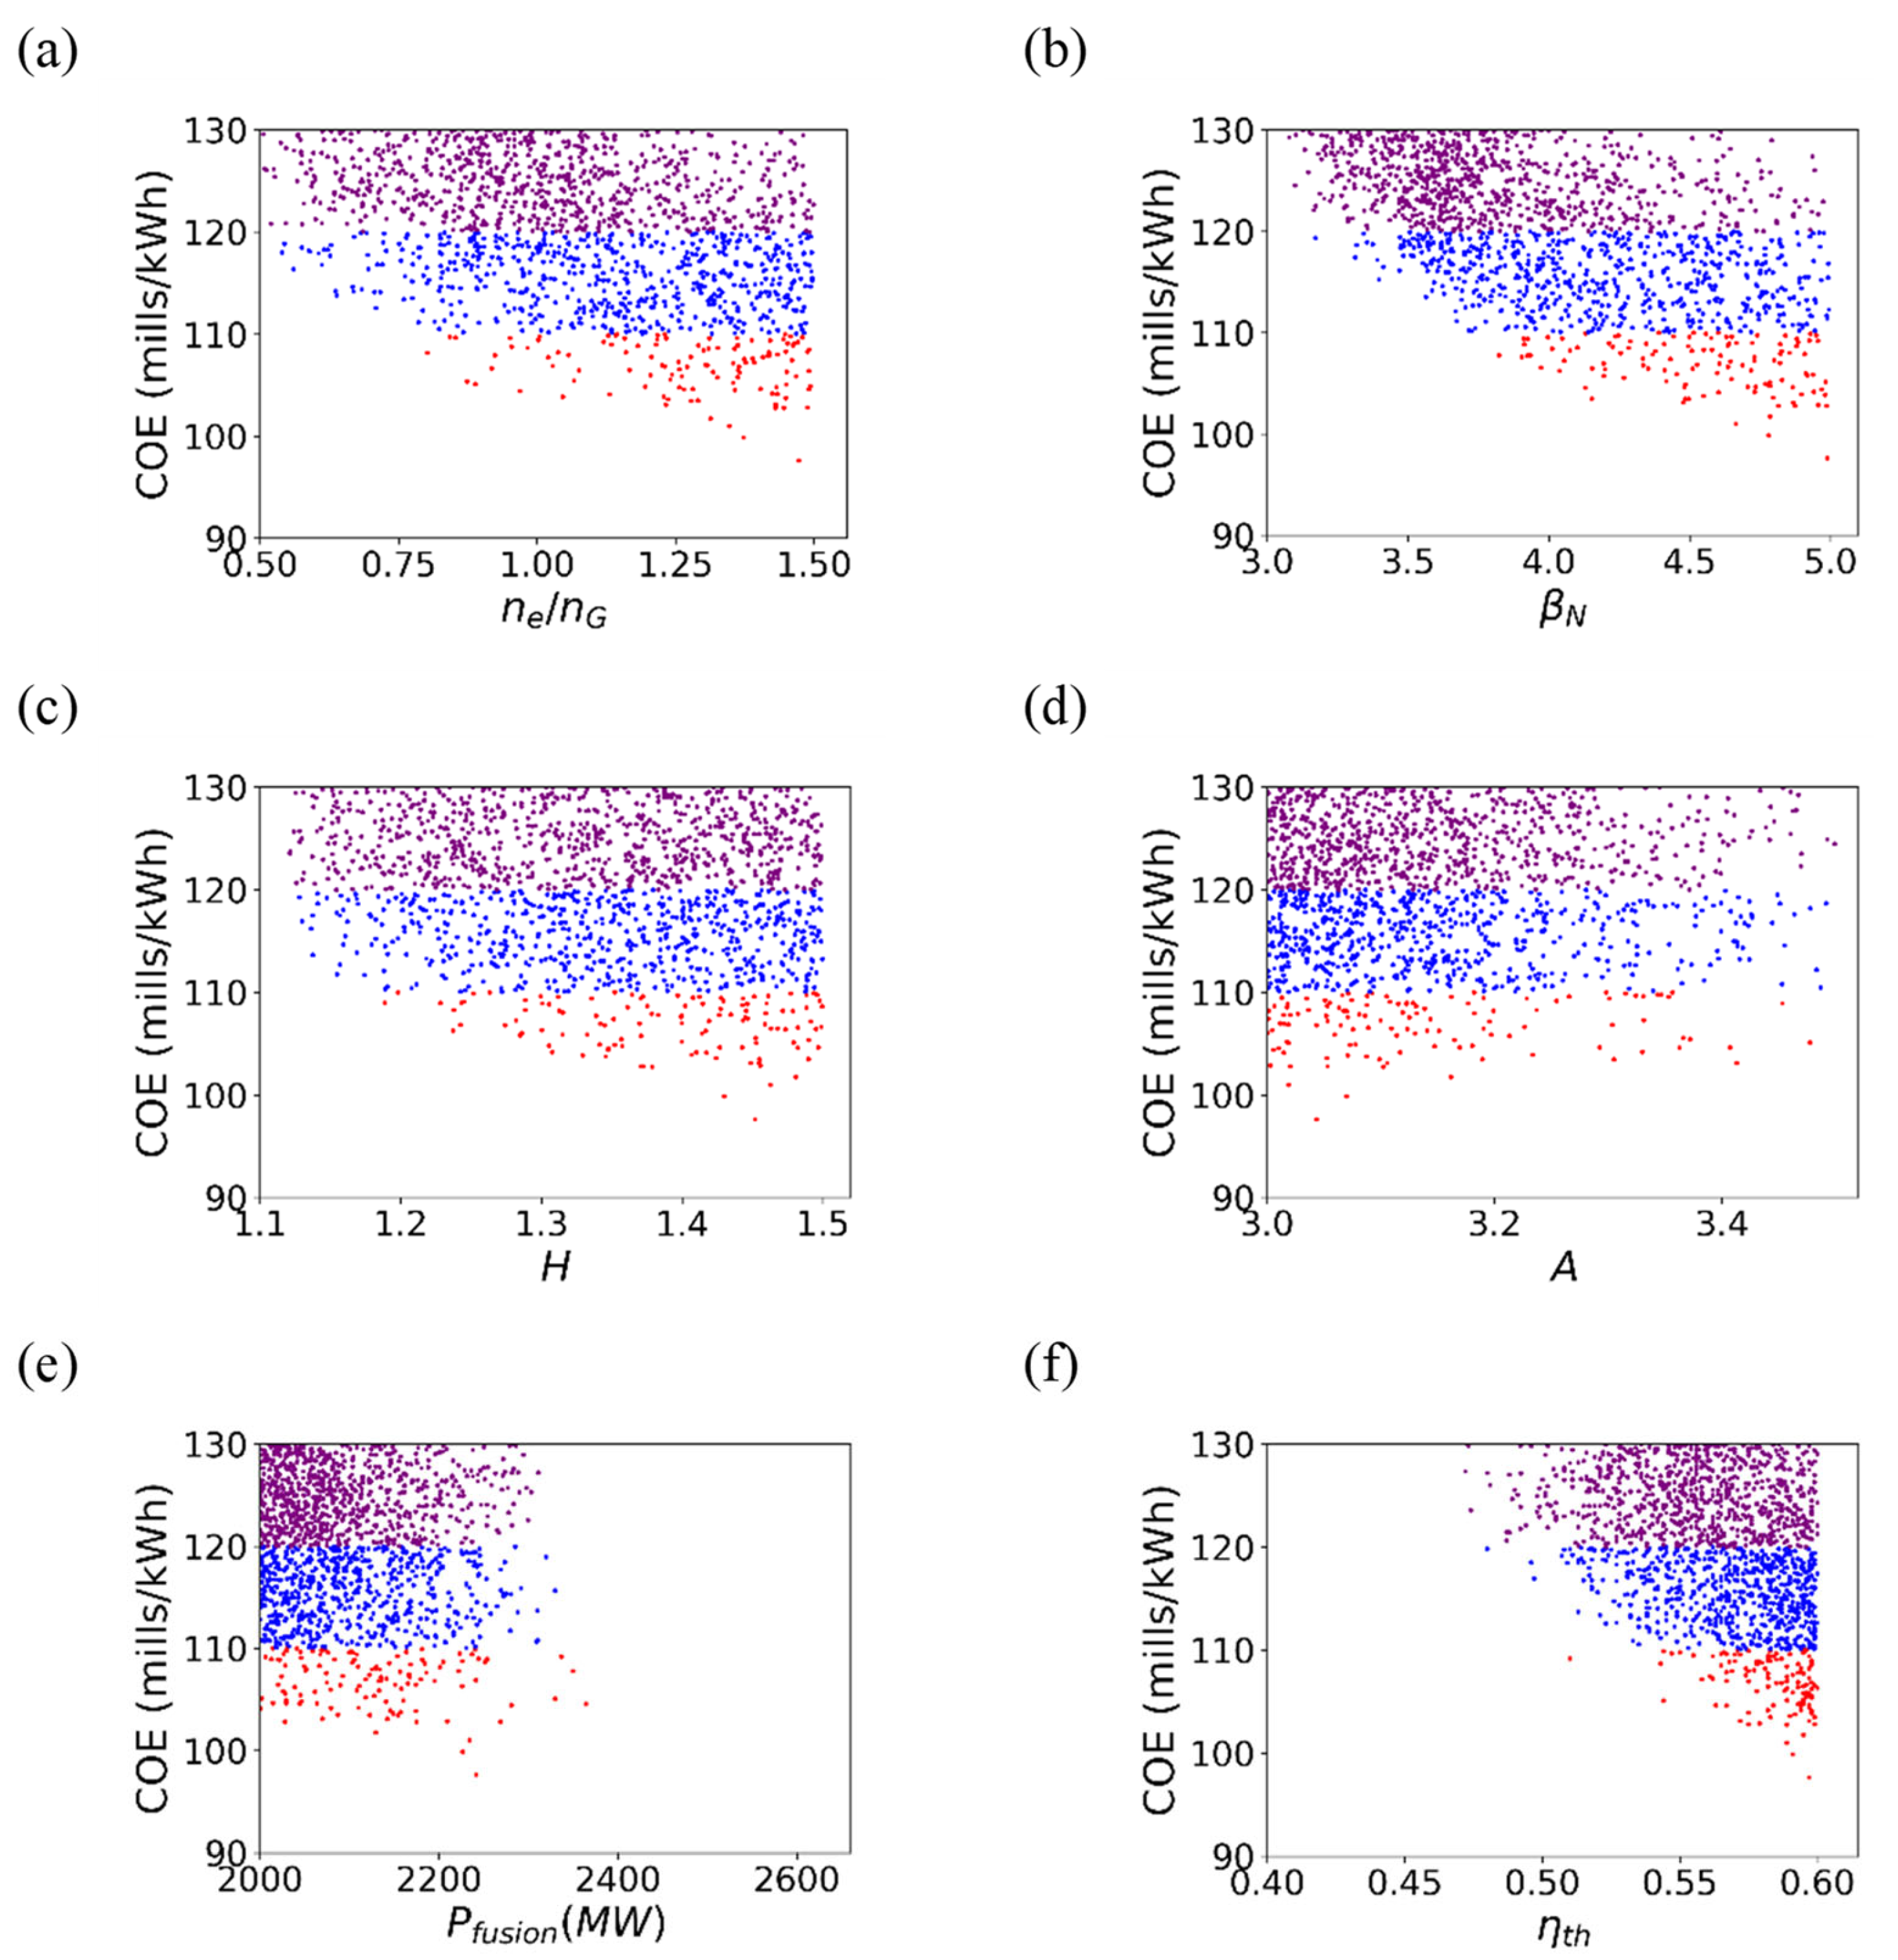
3. Results
4. Conclusions
Author Contributions
Funding
Acknowledgments
Conflicts of Interest
References
- Maisonnier, D.; Cook, I.; Sardain, P.; Andreani, R.; Di Pace, L.; Forrest, R.; Giancarli, L.; Hermsmeyer, S.; Norajitra, P.; Taylor, N.; et al. A Conceptual Study of Commercial Fusion Power Plants: Final Report of the European Fusion Power Plant Conceptual Study (PPCS); EFDA-RP-RE-5.0; European Fusion Development Agreement: Abingdon, UK, 2005. [Google Scholar]
- Maisonnier, D.; Cook, I.; Pierre, S.; Lorenzo, B.; Luciano, G.; Prachai, N.; Aldo, P.; PPCS Team. DEMO and fusion power plant conceptual studies in Europe. Fusion Eng. Des. 2006, 81, 1123–1130. [Google Scholar] [CrossRef]
- Najmabadi, F.; Team, T.A.; Bathke, C.G.; Billone, M.C.; Blanchard, J.P.; Bromberg, L.; Chin, E.; Cole, F.R.; Crowell, J.A.; Ehst, D.A.; et al. Overview of the ARIES-RS Reversed-Shear Tokamak Power Plant Study. Fusion Eng. Des. 1997, 38, 3–25. [Google Scholar] [CrossRef]
- Najmabadi, F.; Abdou, A.; Bromberg, L.; Brown, T.; Chan, V.C.; Chu, M.C.; Dahlgren, F.; El-Guebaly, L.; Heitzenroeder, P.; Henderson, D.; et al. The ARIES-AT Advanced Tokamak, Advanced Technology Fusion Power Plant. Fusion Eng. Des. 2006, 80, 3–23. [Google Scholar] [CrossRef]
- Okano, K.; Asaoka, Y.; Yoshida, T.; Furuya, M.; Tomabechi, K.; Ogawa, Y.; Sekimura, N.; Hiwatari, R.; Yamamoto, T.; Ishikawa, T.; et al. Compact reversed shear tokamak reactor with a superheated steam cycle. Nucl. Fusion 2000, 40, 635–646. [Google Scholar] [CrossRef]
- Hong, B.G.; Kim, T.-H. On the optimal radial build of a normal aspect ratio tokamak fusion system. Fusion Eng. Des. 2019, 139, 148–154. [Google Scholar] [CrossRef]
- Hong, B.G. A study regarding the optimal radial build of a low-aspect-ratio tokamak fusion system. Fusion Eng. Des. 2018, 135, 110–115. [Google Scholar] [CrossRef]
- Kim, K.; Oh, S.; Park, J.S.; Lee, C.; Im, K.; Kim, H.C.; Lee, G.S.; Neilson, G.; Brown, T.; Kessel, C.; et al. Conceptual design study of the K-DEMO magnet system. Fusion Eng. Des. 2015, 96–97, 281–285. [Google Scholar] [CrossRef]
- Smolentsev, S.; Morley, N.B.; Abdou, M.A.; Malang, S. Dual-coolant lead–lithium (DCLL) blanket status and R&D needs. Fusion Eng. Des. 2015, 100, 44–54. [Google Scholar]
- Malang, S.; Tillack, M.; Wong, C.P.; Morley, N.; Smolentsev, S. Development of the Lead Lithium (DCLL) Blanket Concept. Fusion Sci. Technol. 2011, 60, 249–256. [Google Scholar] [CrossRef]
- Uckan, N.A. The ITER Physics Group ITER Physics Design Guidelines; ITER Documentation Series No. 10; IAEA/ITER/DS/10; IAEA: Vienna, Austria, 1990. [Google Scholar]
- Costley, A.E.; Hugill, J.; Buxton, P.F. On the power and size of tokamak fusion pilot plants and reactors. Nucl. Fusion 2015, 55, 033001. [Google Scholar] [CrossRef] [Green Version]
- Stambaugh, R.D.; Chan, V.S.; Garofalo, A.M.; Sawan, M.; Humphreys, D.A.; Lao, L.L.; Leuer, J.A.; Petrie, T.W.; Prater, R.; Snyder, P.B.; et al. Fusion nuclear science facility candidates. Fusion Sci. Technol. 2011, 59, 279–307. [Google Scholar] [CrossRef]
- Ikeda, N. Progress in the ITER Physics Basis. Nucl. Fusion 2007, 47, E01. [Google Scholar] [CrossRef]
- Pomphrey, N. Princeton Plasma Physics Laboratory Report; PPPL-2854; Princeton Plasma Physics laboratory: Princeton, NJ, USA, 1992.
- Hirshman, S.P. Classical collisional theory of beam-driven plasma currents. Phys. Fluids 1980, 23, 1238–1243. [Google Scholar] [CrossRef]
- Lin-Liu, Y.R.; Hinton, F.L. Trapped electron correction to beam driven current in general tokamak equilibria. Phys. Plasmas 1997, 4, 4179–4181. [Google Scholar] [CrossRef]
- Kovari, M.; Kemp, R.; Lux, H.; Knight, P.; Morris, J.; Ward, D.J. “PROCESS”: A systems code for fusion power plants—Part 1: Physics. Fusion Eng. Des. 2014, 89, 3054–3069. [Google Scholar] [CrossRef]
- Kovari, M.; Fox, F.; Harrington, C.; Kembleton, R.; Knight, P.; Lux, H.; Morris, J. “PROCESS”: A systems code for fusion power plants—Part 2: Engineering. Fusion Eng. Des. 2016, 104, 9–20. [Google Scholar] [CrossRef] [Green Version]
- Nishio, S.; Tobita, K.; Konishi, S.; Ando, T.; Hiroki, S.; Kuroda, T.; Yamauchi, M.; Azumi, M.; Nagata, M. Tight Aspect Ratio Tokamak Power Reactor with Superconducting TF Coils. In Proceedings of the IAEA Fusion Energy Conference, IAEA-CN-77/FT/ Pl-21, Lyon, France, 14–19 October 2002. [Google Scholar]
- Sheffield, J.; Milora, S.L. Generic Magnetic Fusion Reactor Revisited. Fusion Sci. Technol. 2016, 70, 14–35. [Google Scholar] [CrossRef]
- Sheffield, J.; Dory, R.A.; Cohn, S.M.; Delene, J.G.; Parsly, L.; Ashby, D.E.; Reiersen, W.T. Cost Assessment of a Generic Magnetic Fusion Reactor. Fusion Technol. 1986, 9, 199–249. [Google Scholar] [CrossRef] [Green Version]


| Parameter | Value | Increment |
|---|---|---|
| Pfusion [MW] | 2000–4000 | Random |
| Aspect ratio, A | 3.0–3.5 | Random |
| Elongation, κ | 2.0 | |
| Triangularity, δ | 0.6 | |
| αN | 0.5 | |
| αT | 1.0 | |
| βN | 2.0–5.0 | Random |
| ne/nG | 0.4–1.5 | Random |
| qe | 3.0–5.0 | 0.25 |
| H | 1.0–1.5 | Random |
| ηth | 0.3–0.6 | Random |
| Component | Unit Cost |
|---|---|
| Creactor | |
| First wall | 6·104 USD/m2 |
| Divertor | 6·105 USD/m2 |
| Blanket | 20 USD/kg for PbLi |
| 90 USD/kg for FMS structure | |
| 100 USD/kg for SCI insert | |
| Shield | 40 USD/kg |
| Ccoil | |
| TF coil | 2·103 $/m |
| PF coil | 0.02 USD/(A-m-T) |
| CS | 1·103 USD/m |
| Case | 50 USD/kg |
| Caux | |
| NBI | 5.3 USD/W |
| Costing Parameter | Value |
|---|---|
| Neutron energy multiplication | 1.17 |
| Process contingency | 0.15 |
| Indirect charge, fIND | 0.375 |
| Construction time | 6 years |
| Constant-dollar capitalization factor, fCAP0 | 1.075 |
| Constant-dollar fixed-charge rate, FCR0 | 0.1 |
| Lifetime of reactor, N | 40 years |
| Reactor availability, fav | 0.75 |
| Blanket fluence limit, Fblk | 20.0 MW·year/m2 |
| Divertor heat fluence limit, Fdiv | 15.0 MW·year/m2 |
Publisher’s Note: MDPI stays neutral with regard to jurisdictional claims in published maps and institutional affiliations. |
© 2021 by the authors. Licensee MDPI, Basel, Switzerland. This article is an open access article distributed under the terms and conditions of the Creative Commons Attribution (CC BY) license (https://creativecommons.org/licenses/by/4.0/).
Share and Cite
Jo, G.; Kwon, J.-M.; Cho, A.; Chung, H.-K.; Hong, B.-G. Cost Assessment of a Tokamak Fusion Reactor with an Inventive Method for Optimum Build Determination. Energies 2021, 14, 6817. https://doi.org/10.3390/en14206817
Jo G, Kwon J-M, Cho A, Chung H-K, Hong B-G. Cost Assessment of a Tokamak Fusion Reactor with an Inventive Method for Optimum Build Determination. Energies. 2021; 14(20):6817. https://doi.org/10.3390/en14206817
Chicago/Turabian StyleJo, Gahyung, Jae-Min Kwon, Ara Cho, Hyun-Kyung Chung, and Bong-Guen Hong. 2021. "Cost Assessment of a Tokamak Fusion Reactor with an Inventive Method for Optimum Build Determination" Energies 14, no. 20: 6817. https://doi.org/10.3390/en14206817
APA StyleJo, G., Kwon, J.-M., Cho, A., Chung, H.-K., & Hong, B.-G. (2021). Cost Assessment of a Tokamak Fusion Reactor with an Inventive Method for Optimum Build Determination. Energies, 14(20), 6817. https://doi.org/10.3390/en14206817