
Oxidation Experiments and Kinetics Analysis of Nuclear Graphite ET-10 by Gas Analysis and Microstructure Observation


Abstract
:1. Introduction
2. Materials and Methods
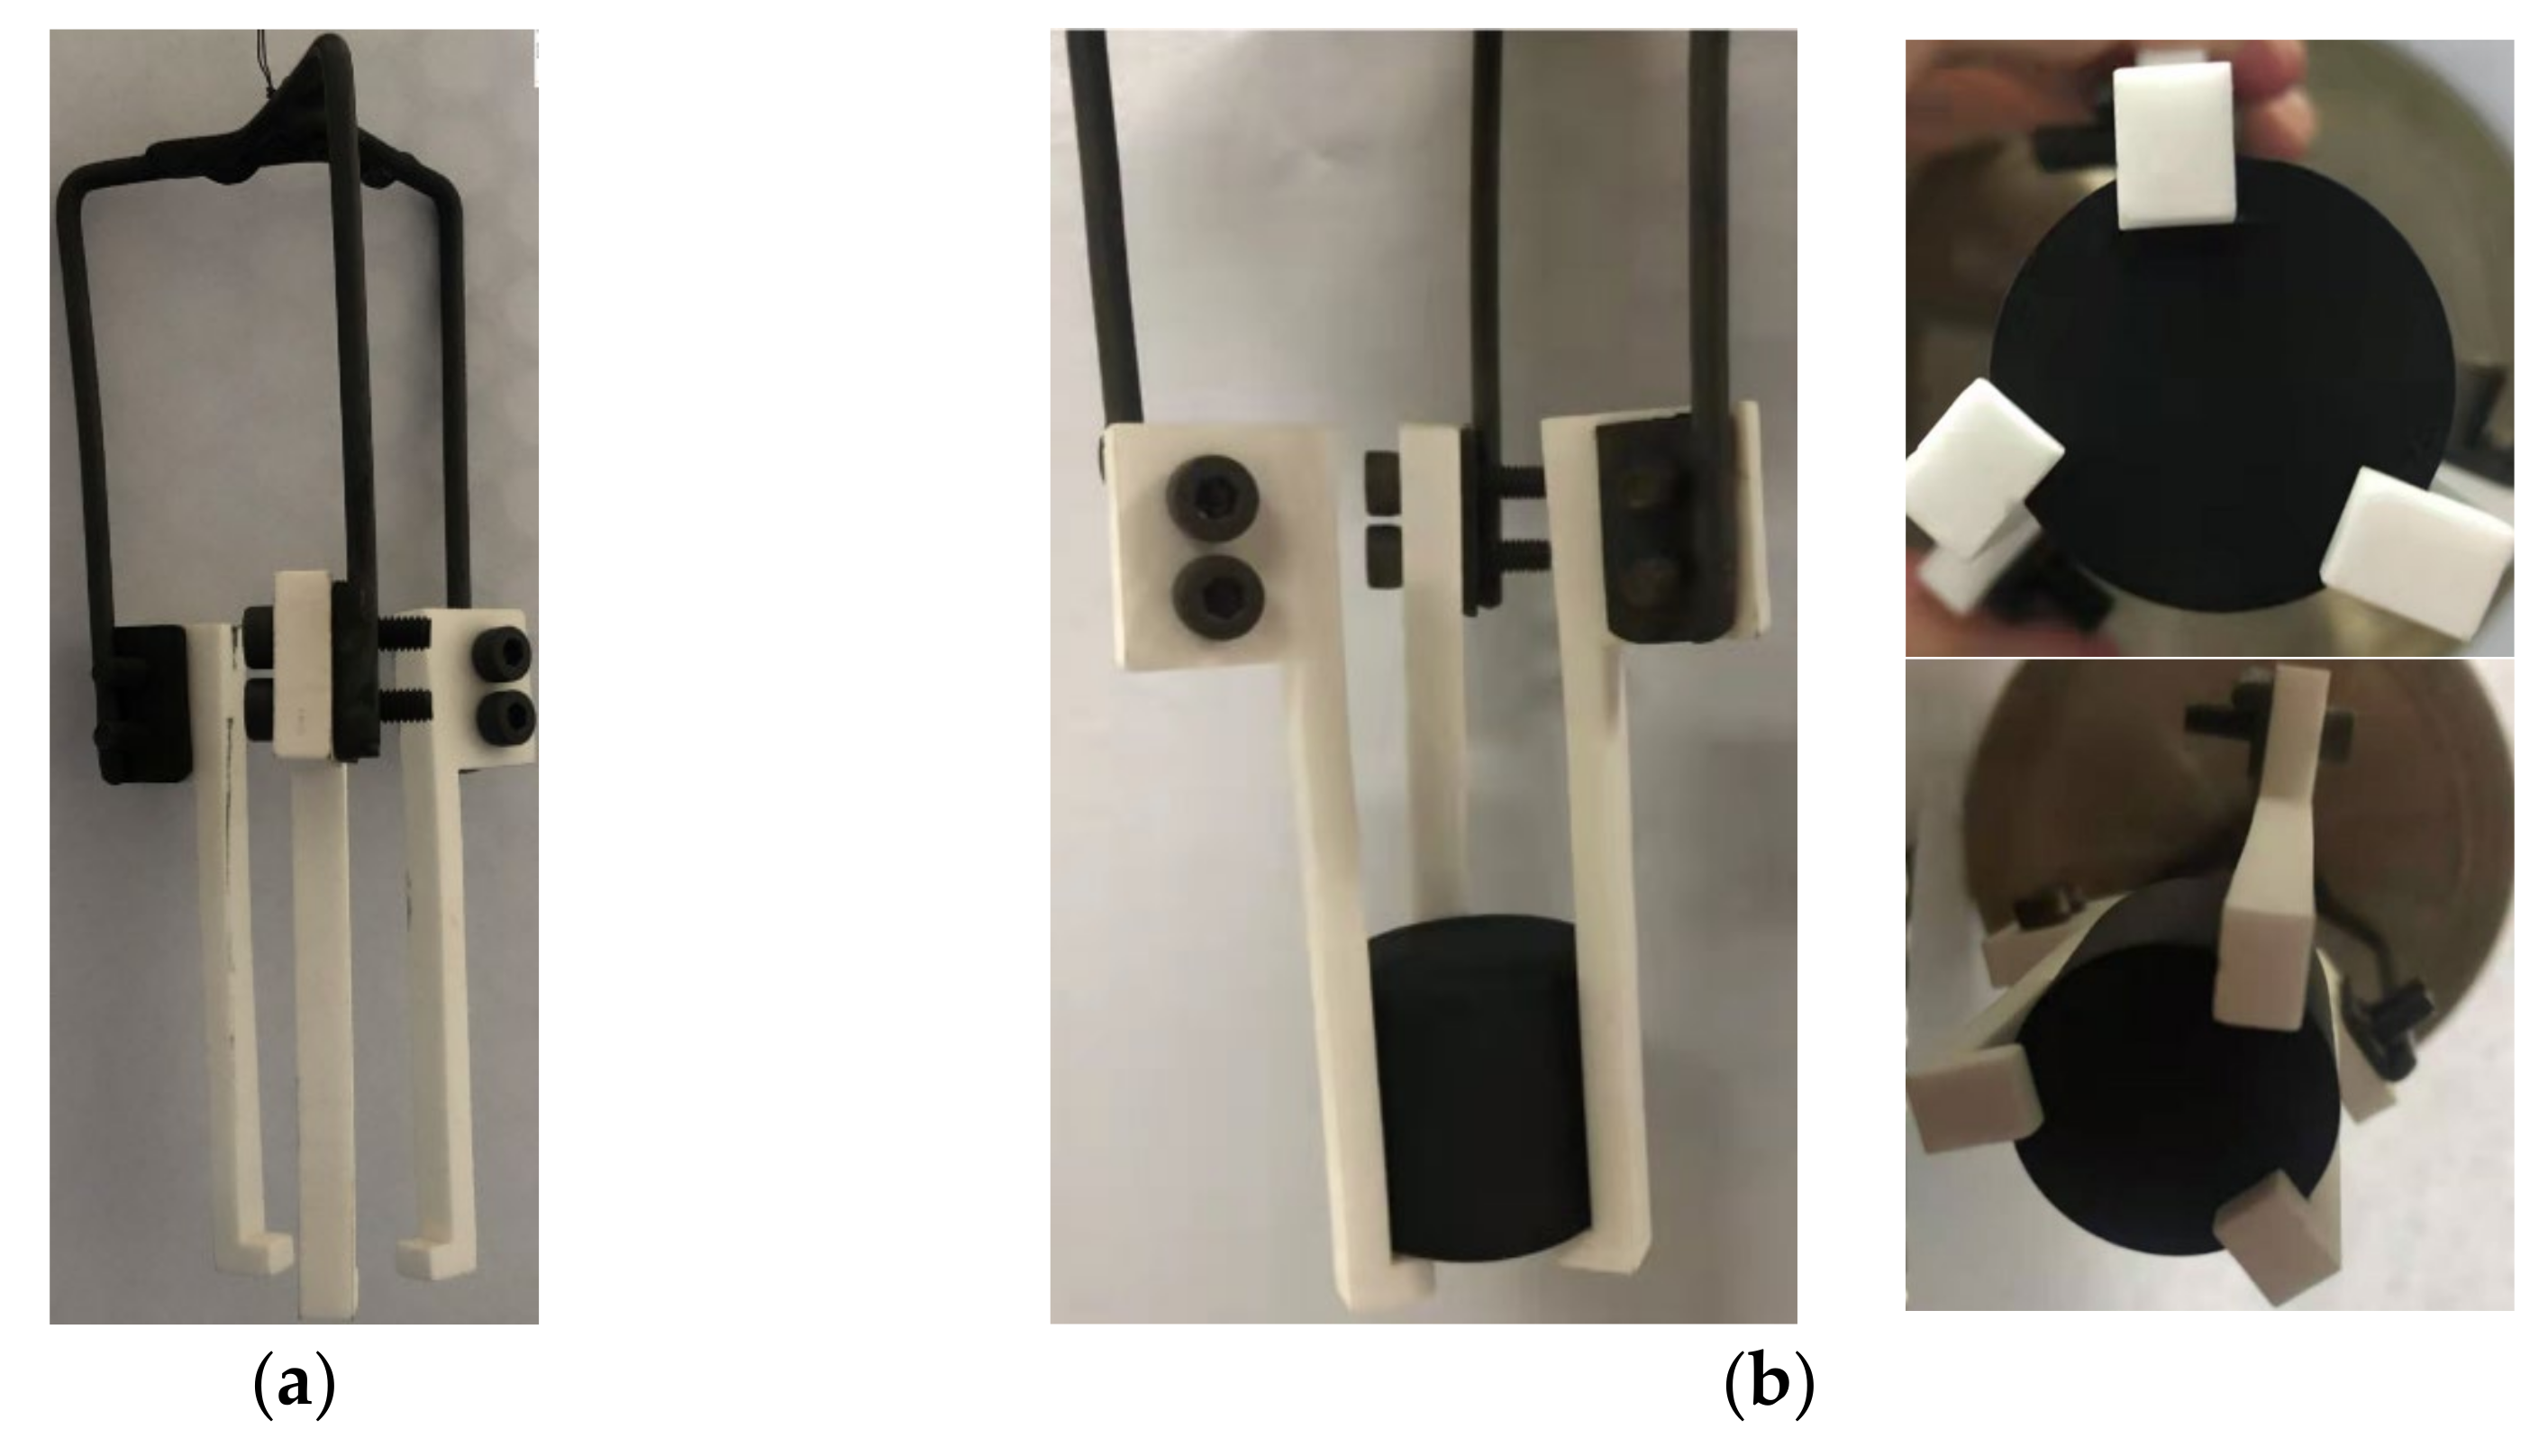
2.1. Graphite Specimen and Ceramic Basket
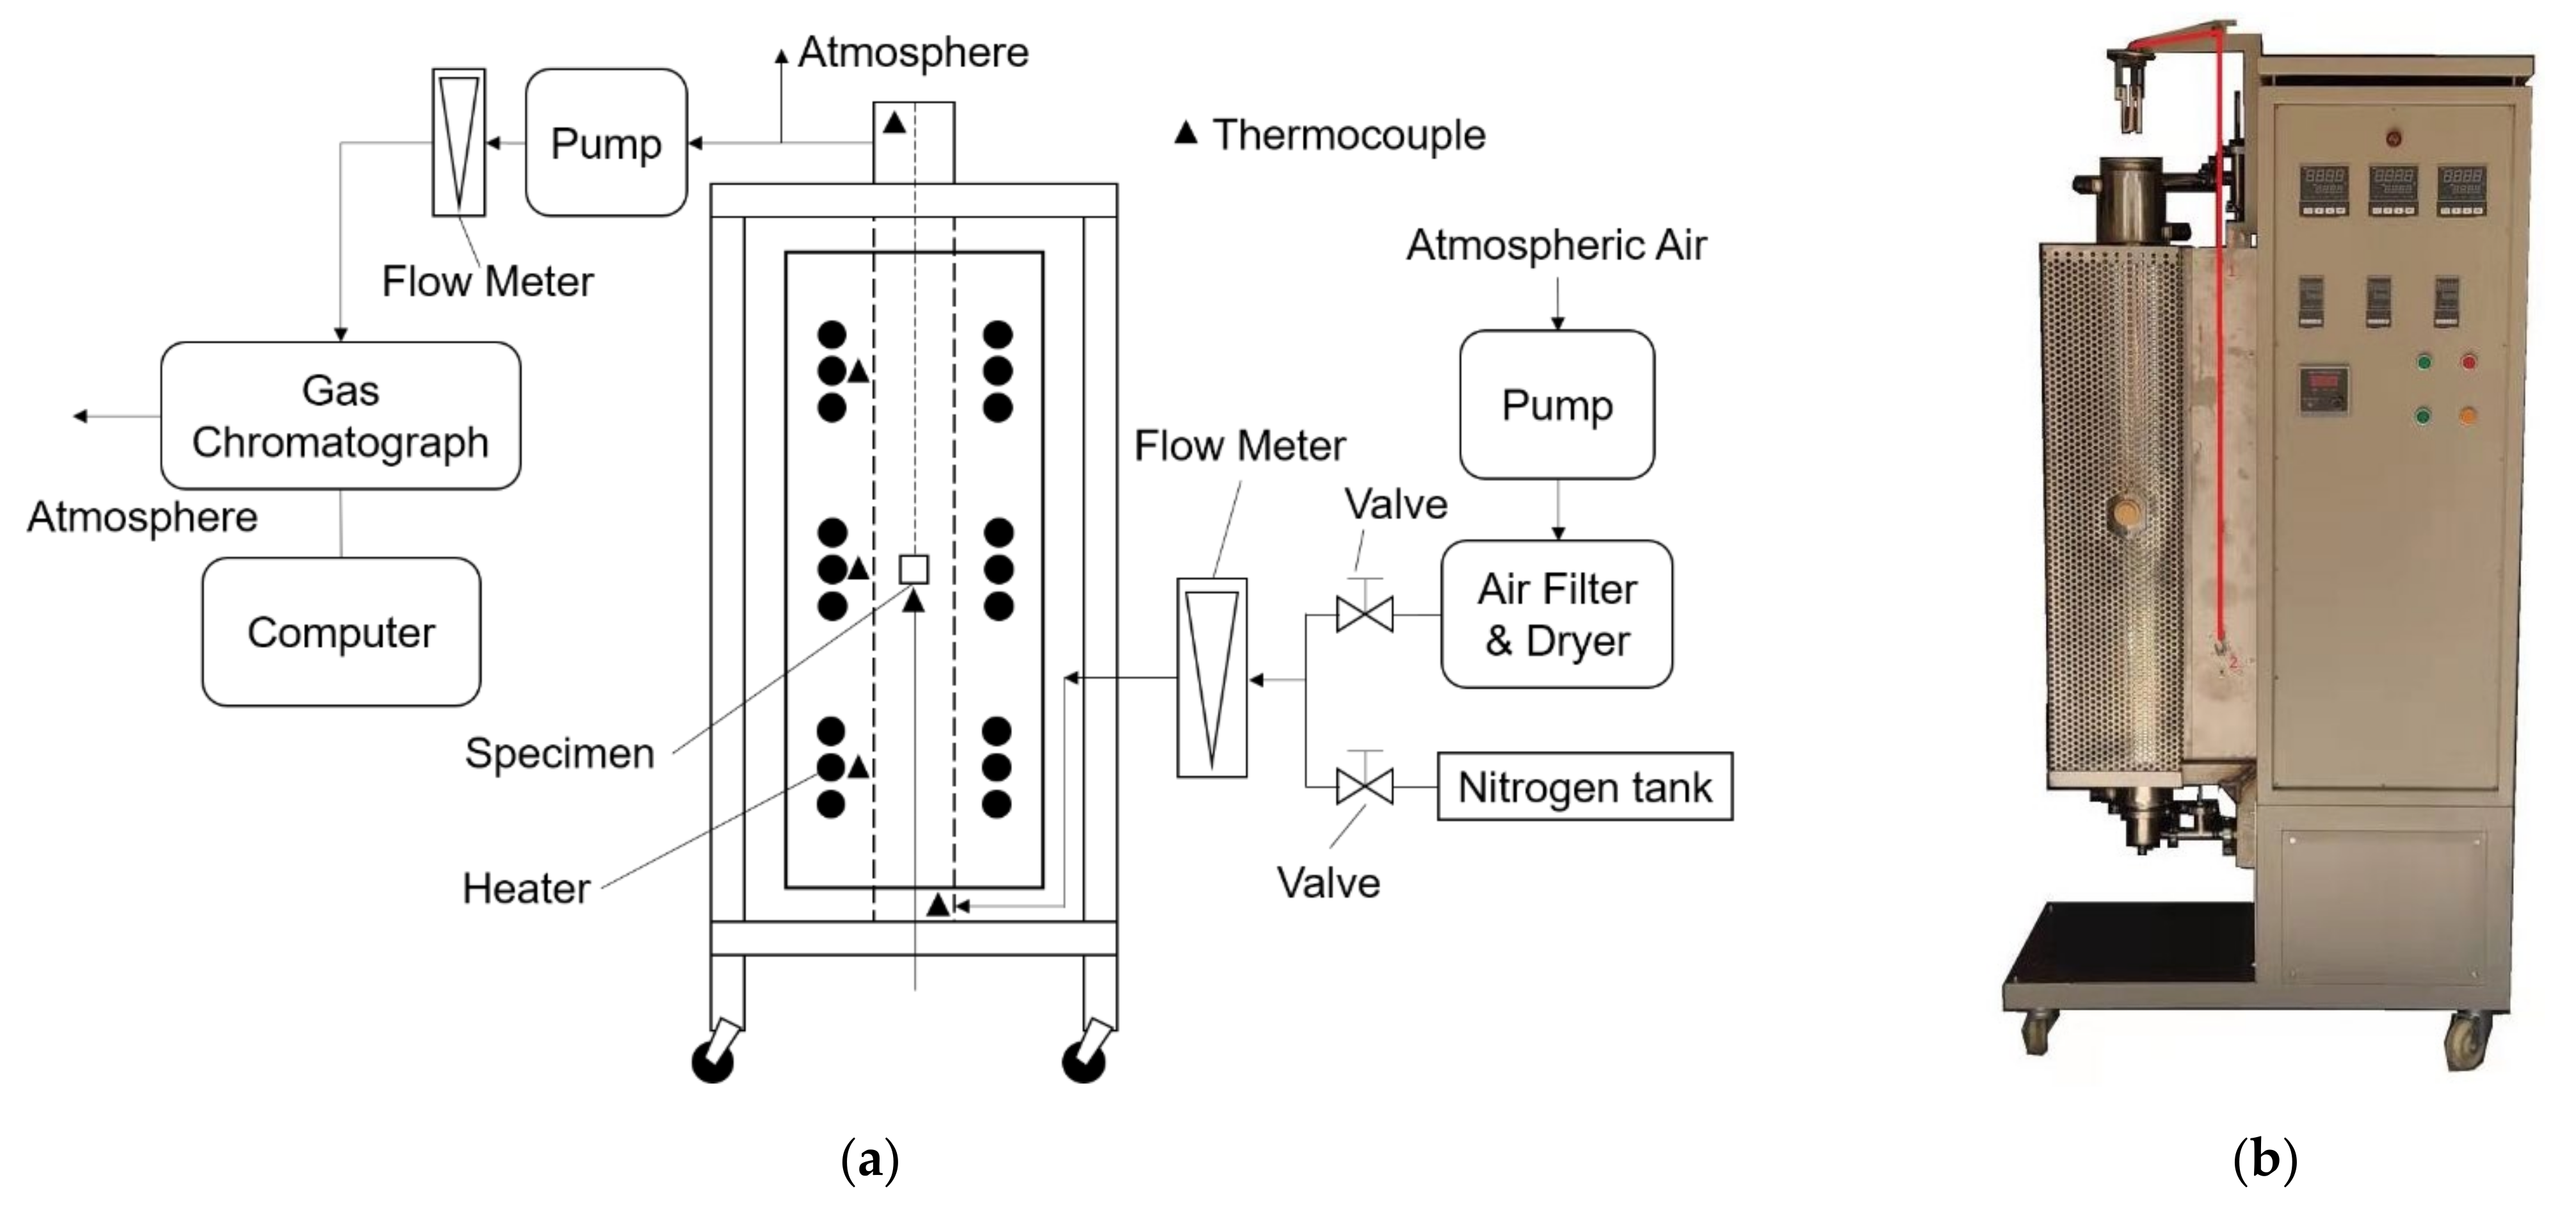
2.2. Test Facility and Procedures
2.3. Numerical Methods
2.4. Criteria to Determine Kinetics-Controlled Regime
3. Results
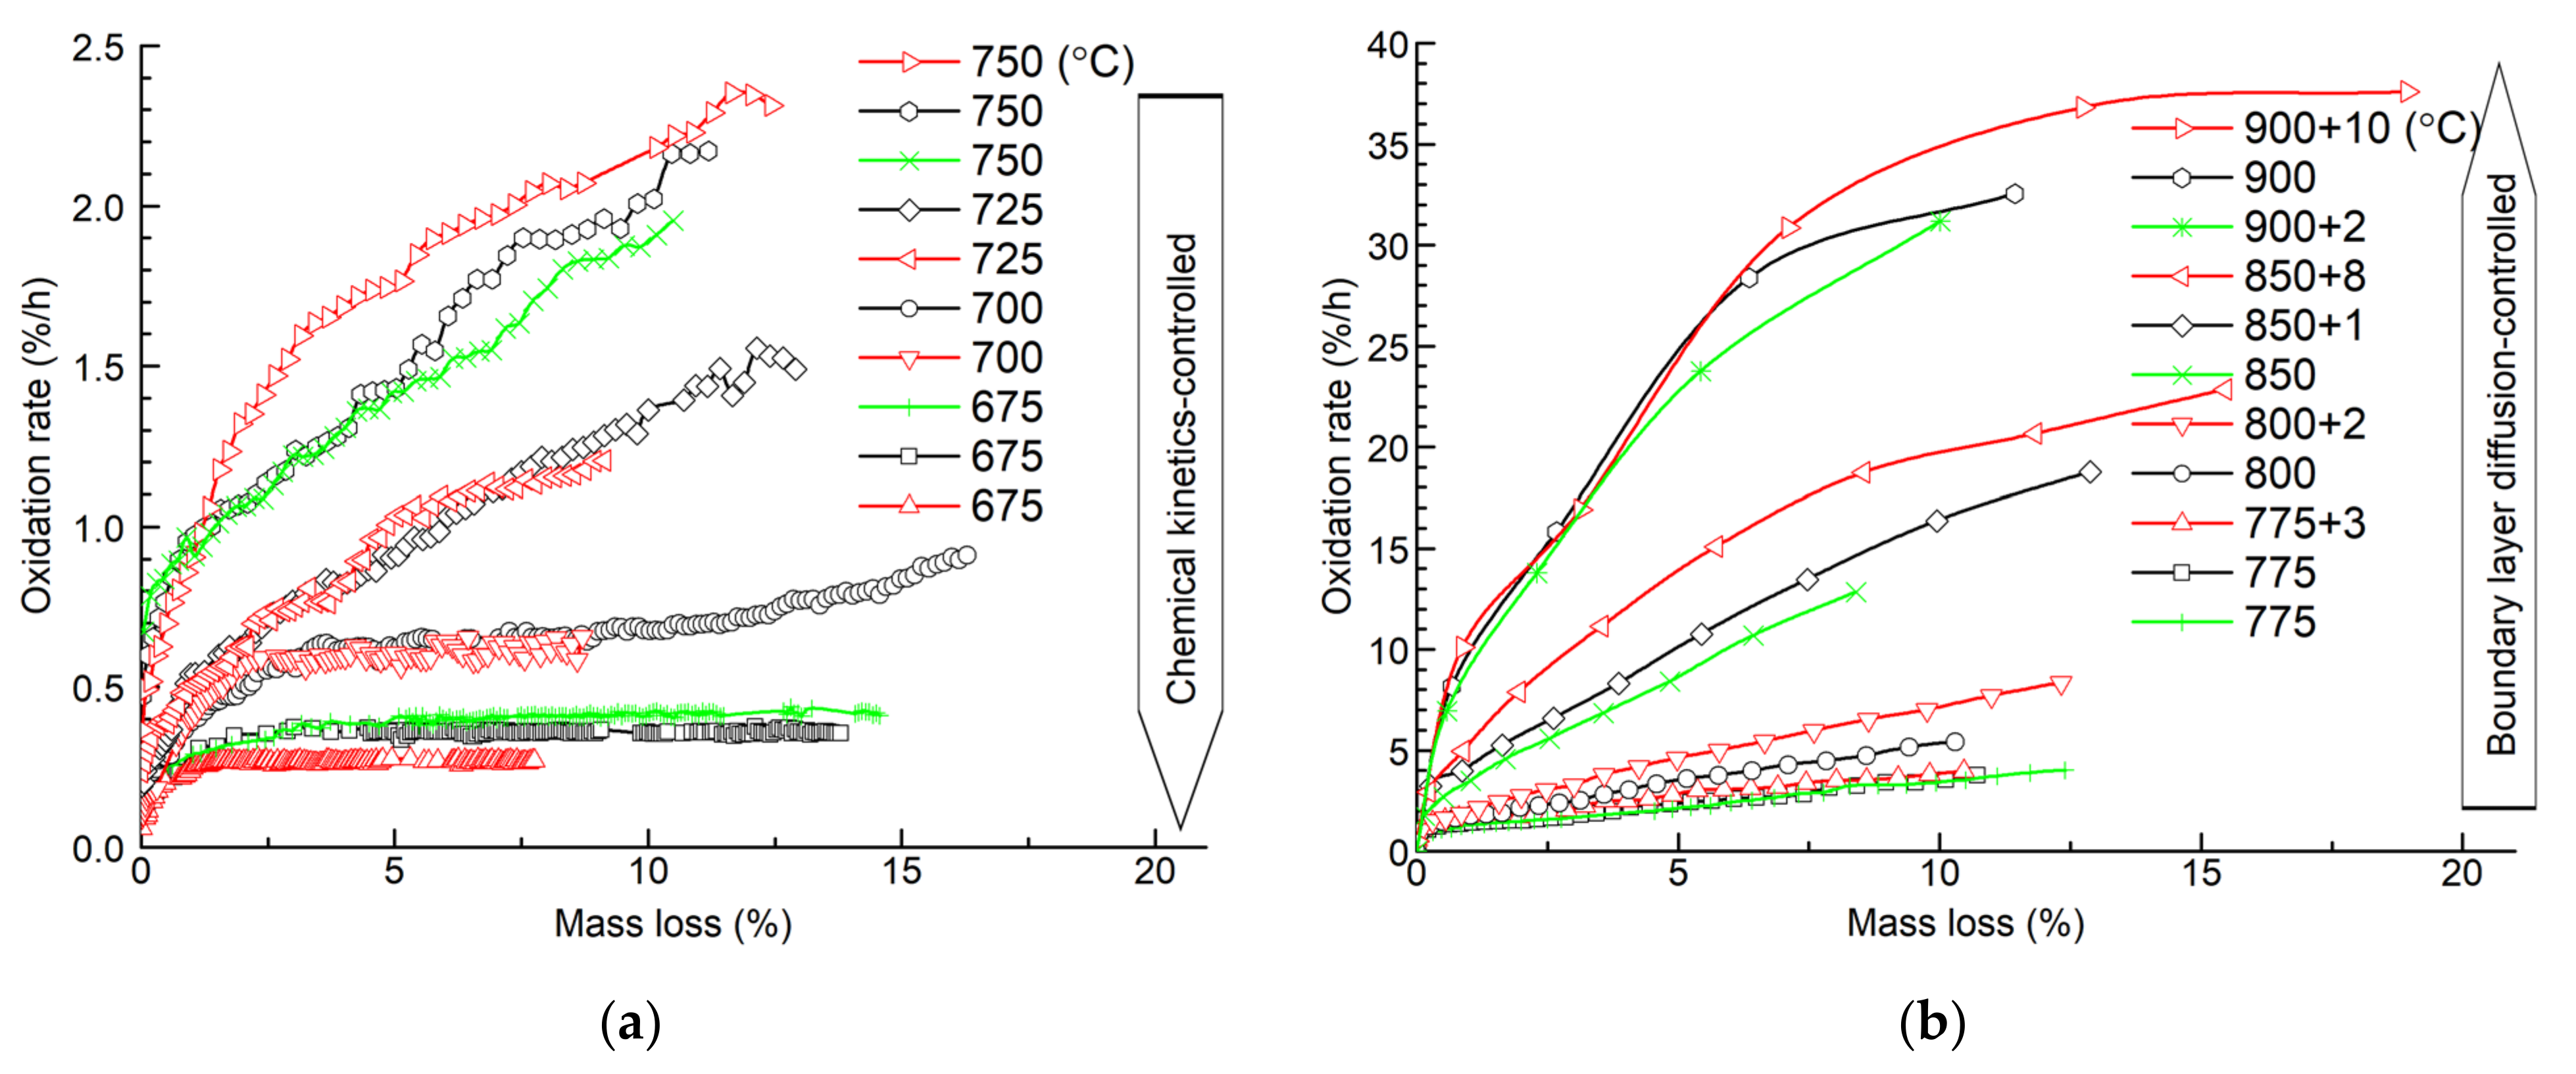
3.1. Oxidation Rate
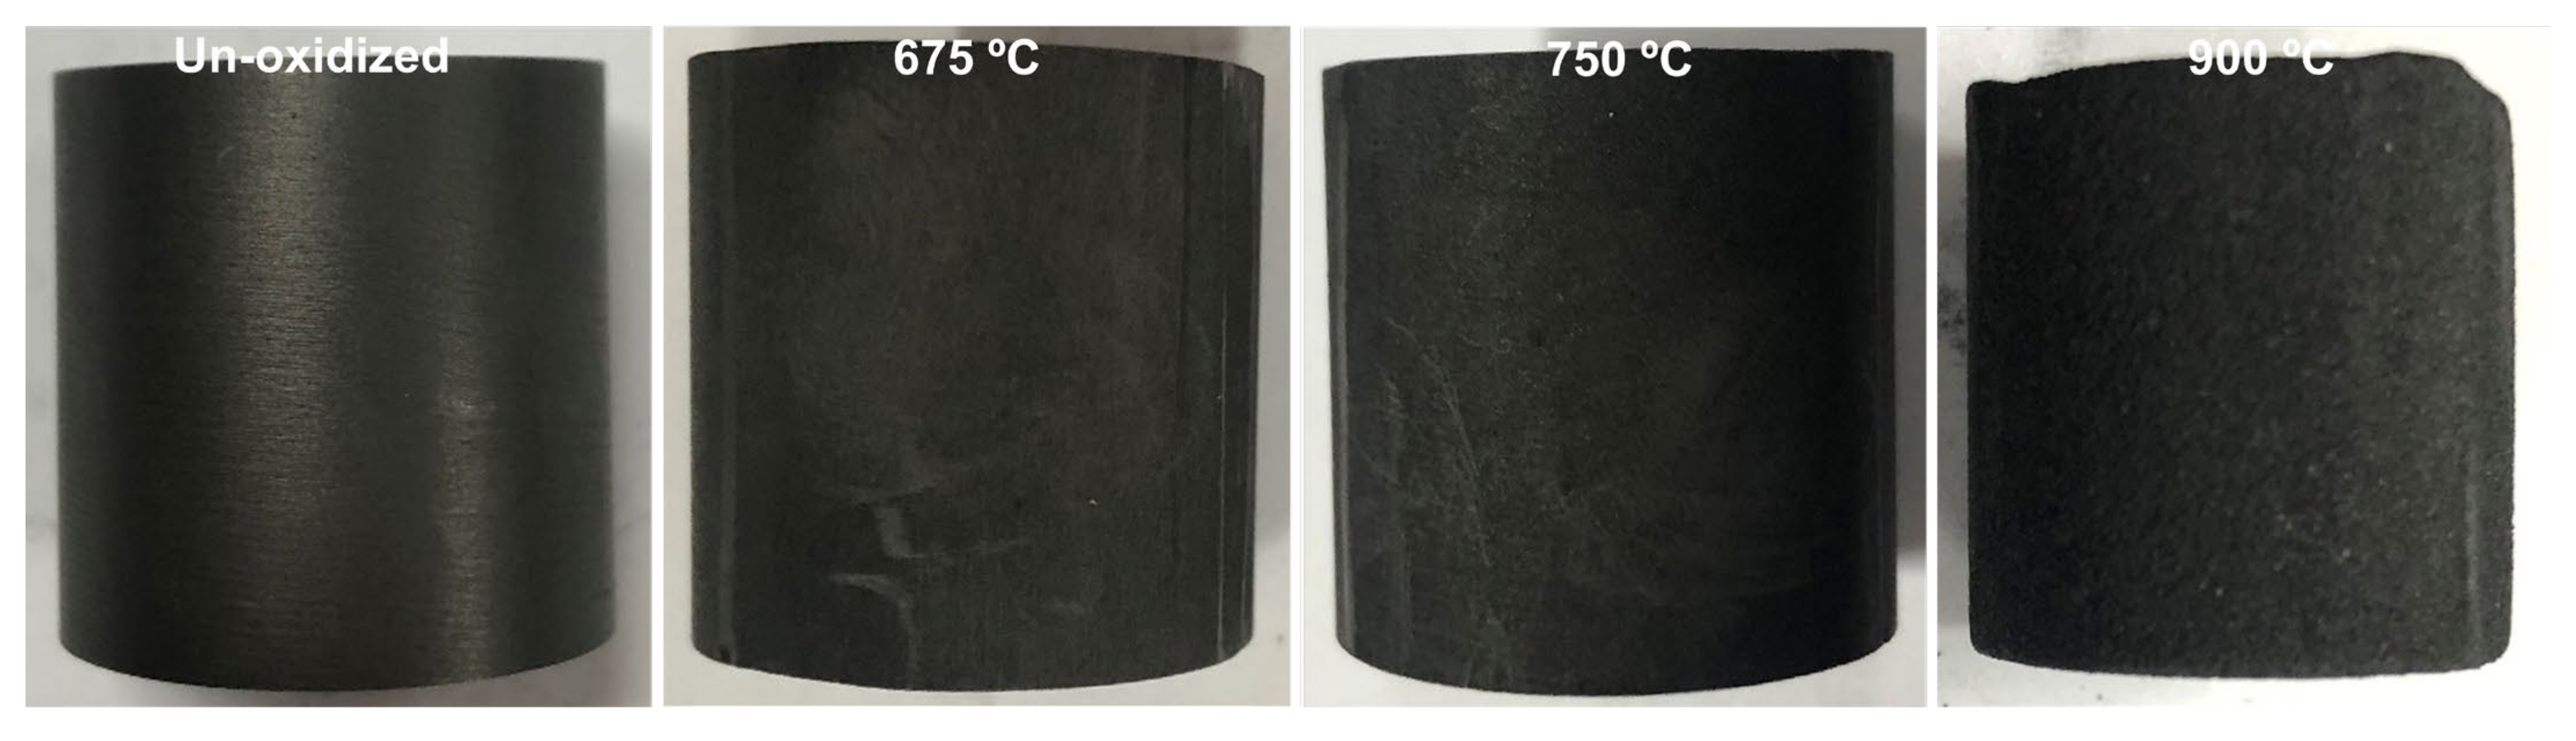
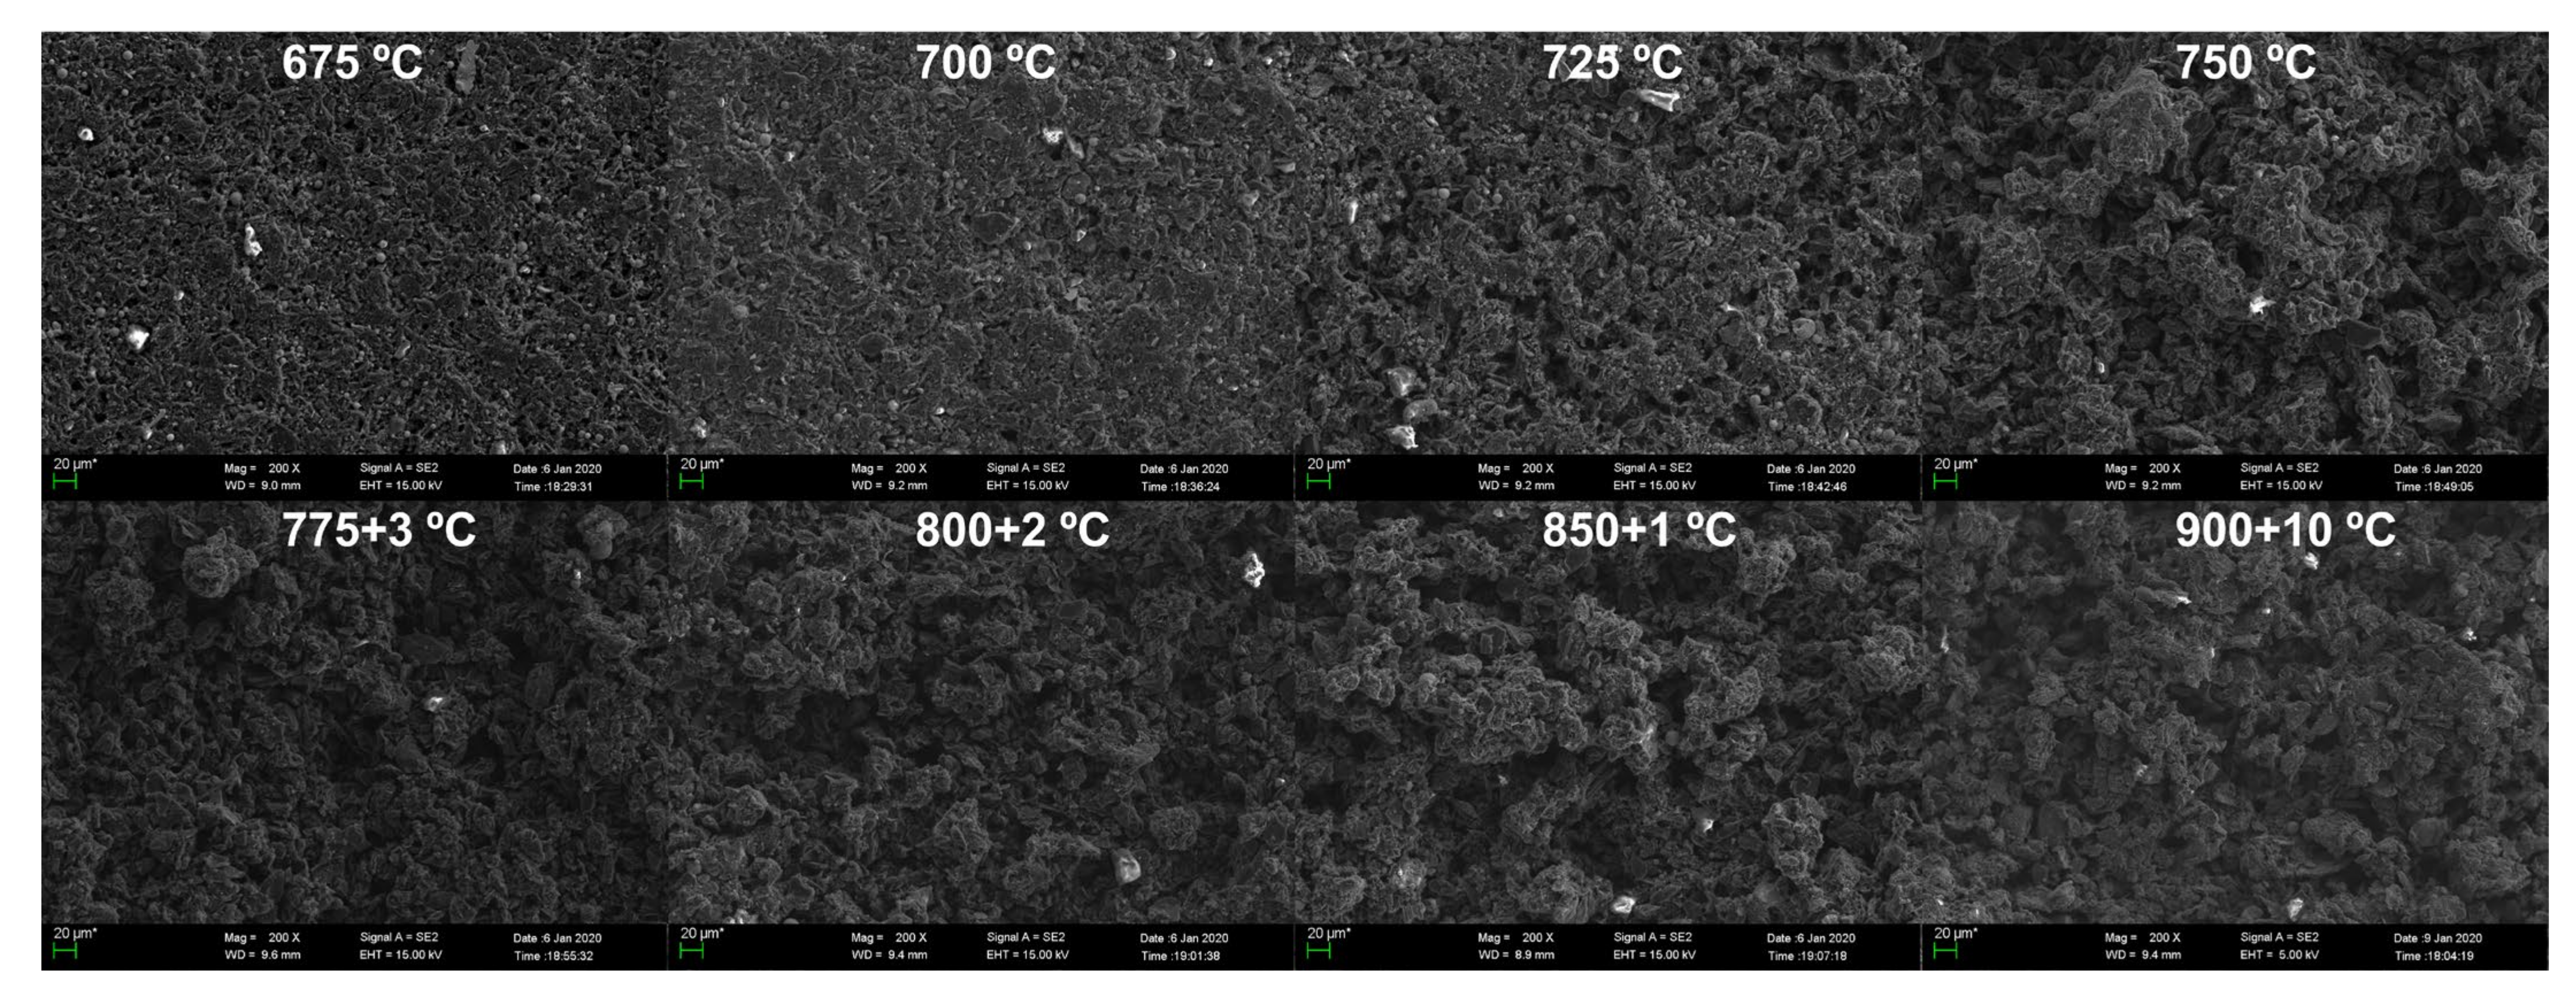
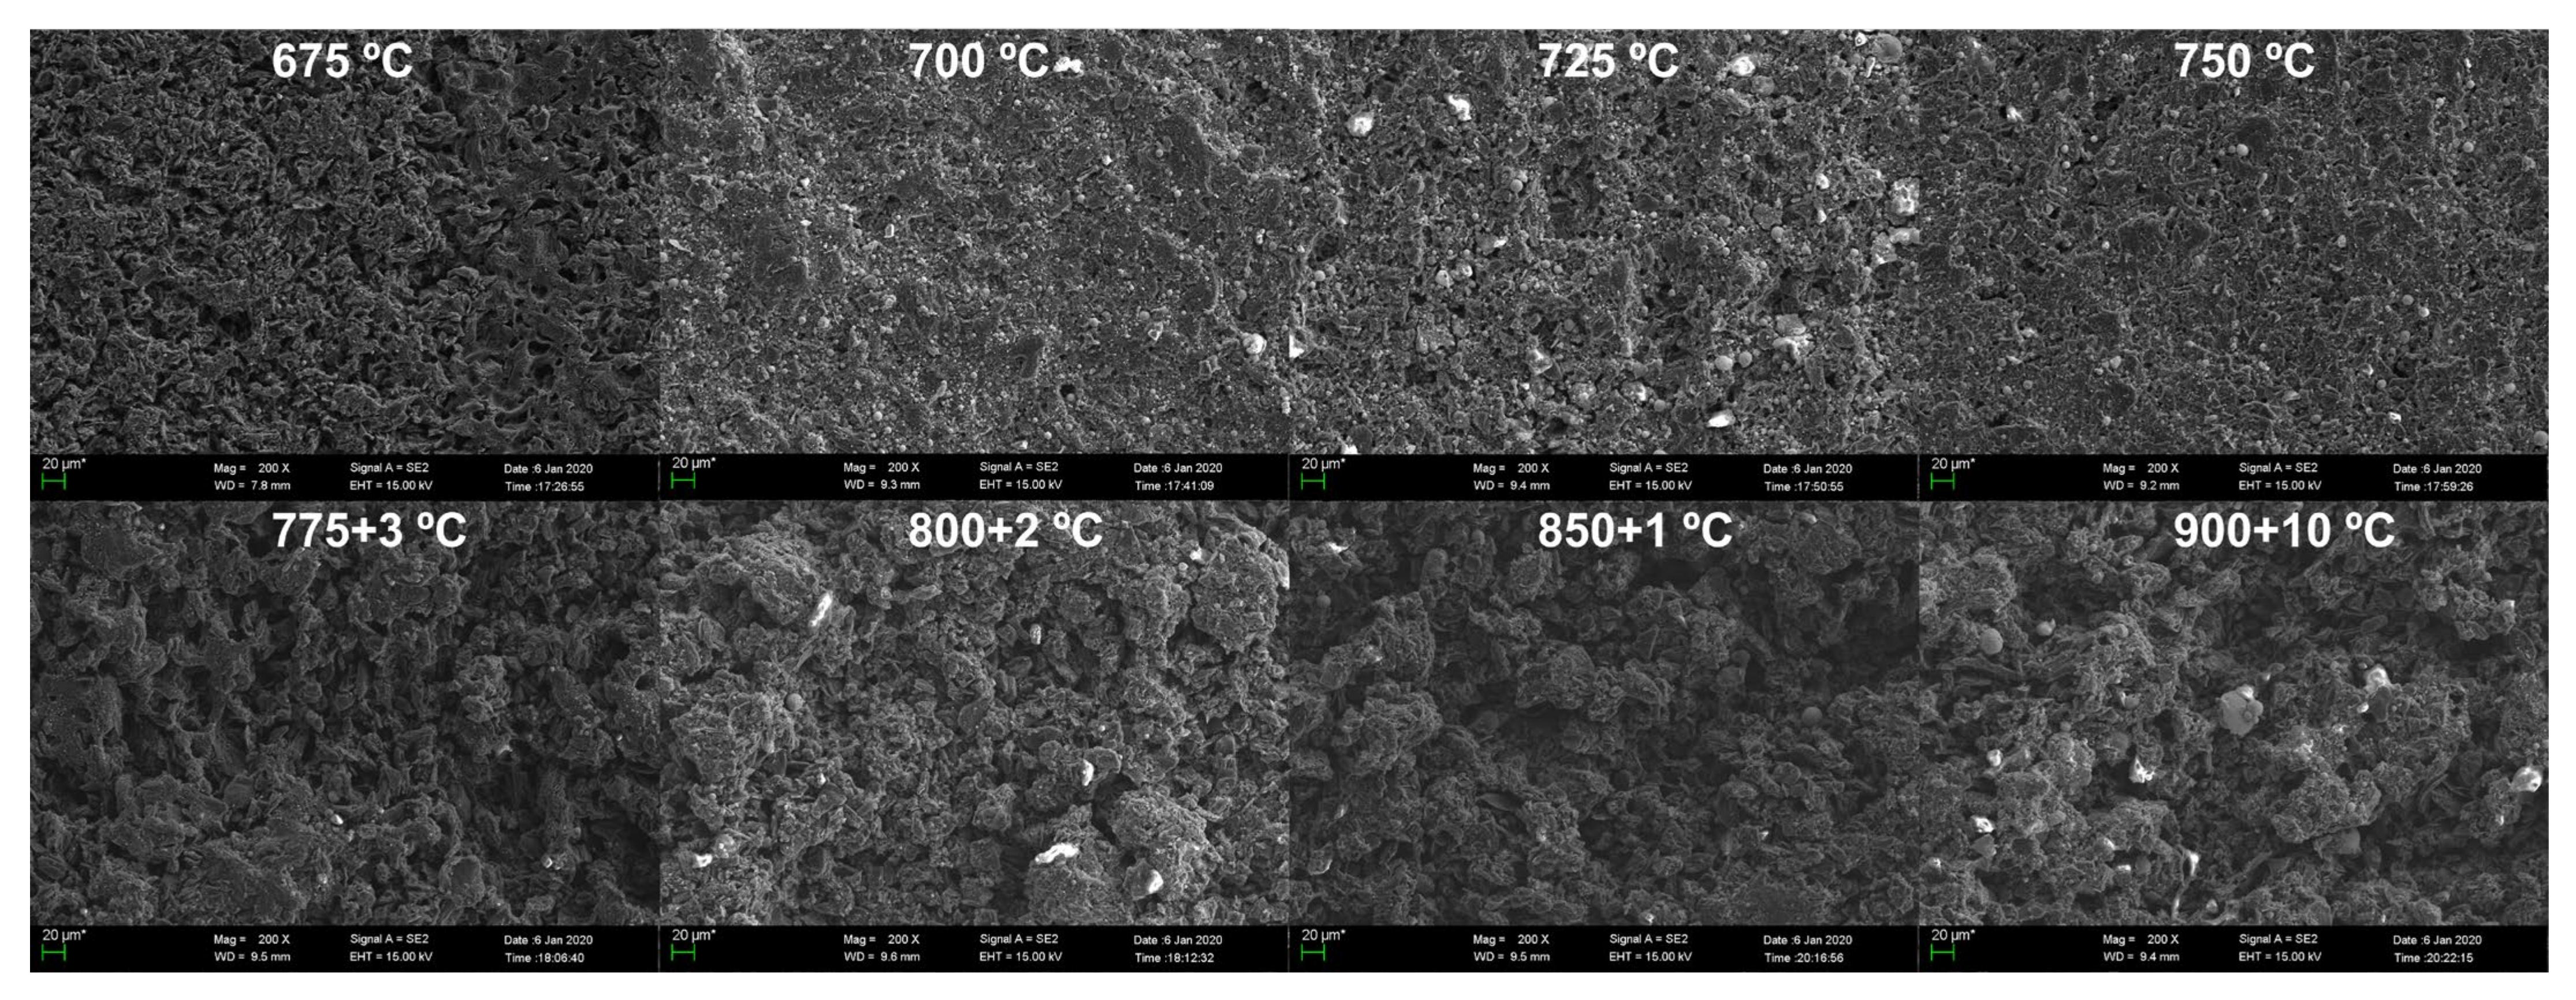
3.2. SEM Analysis
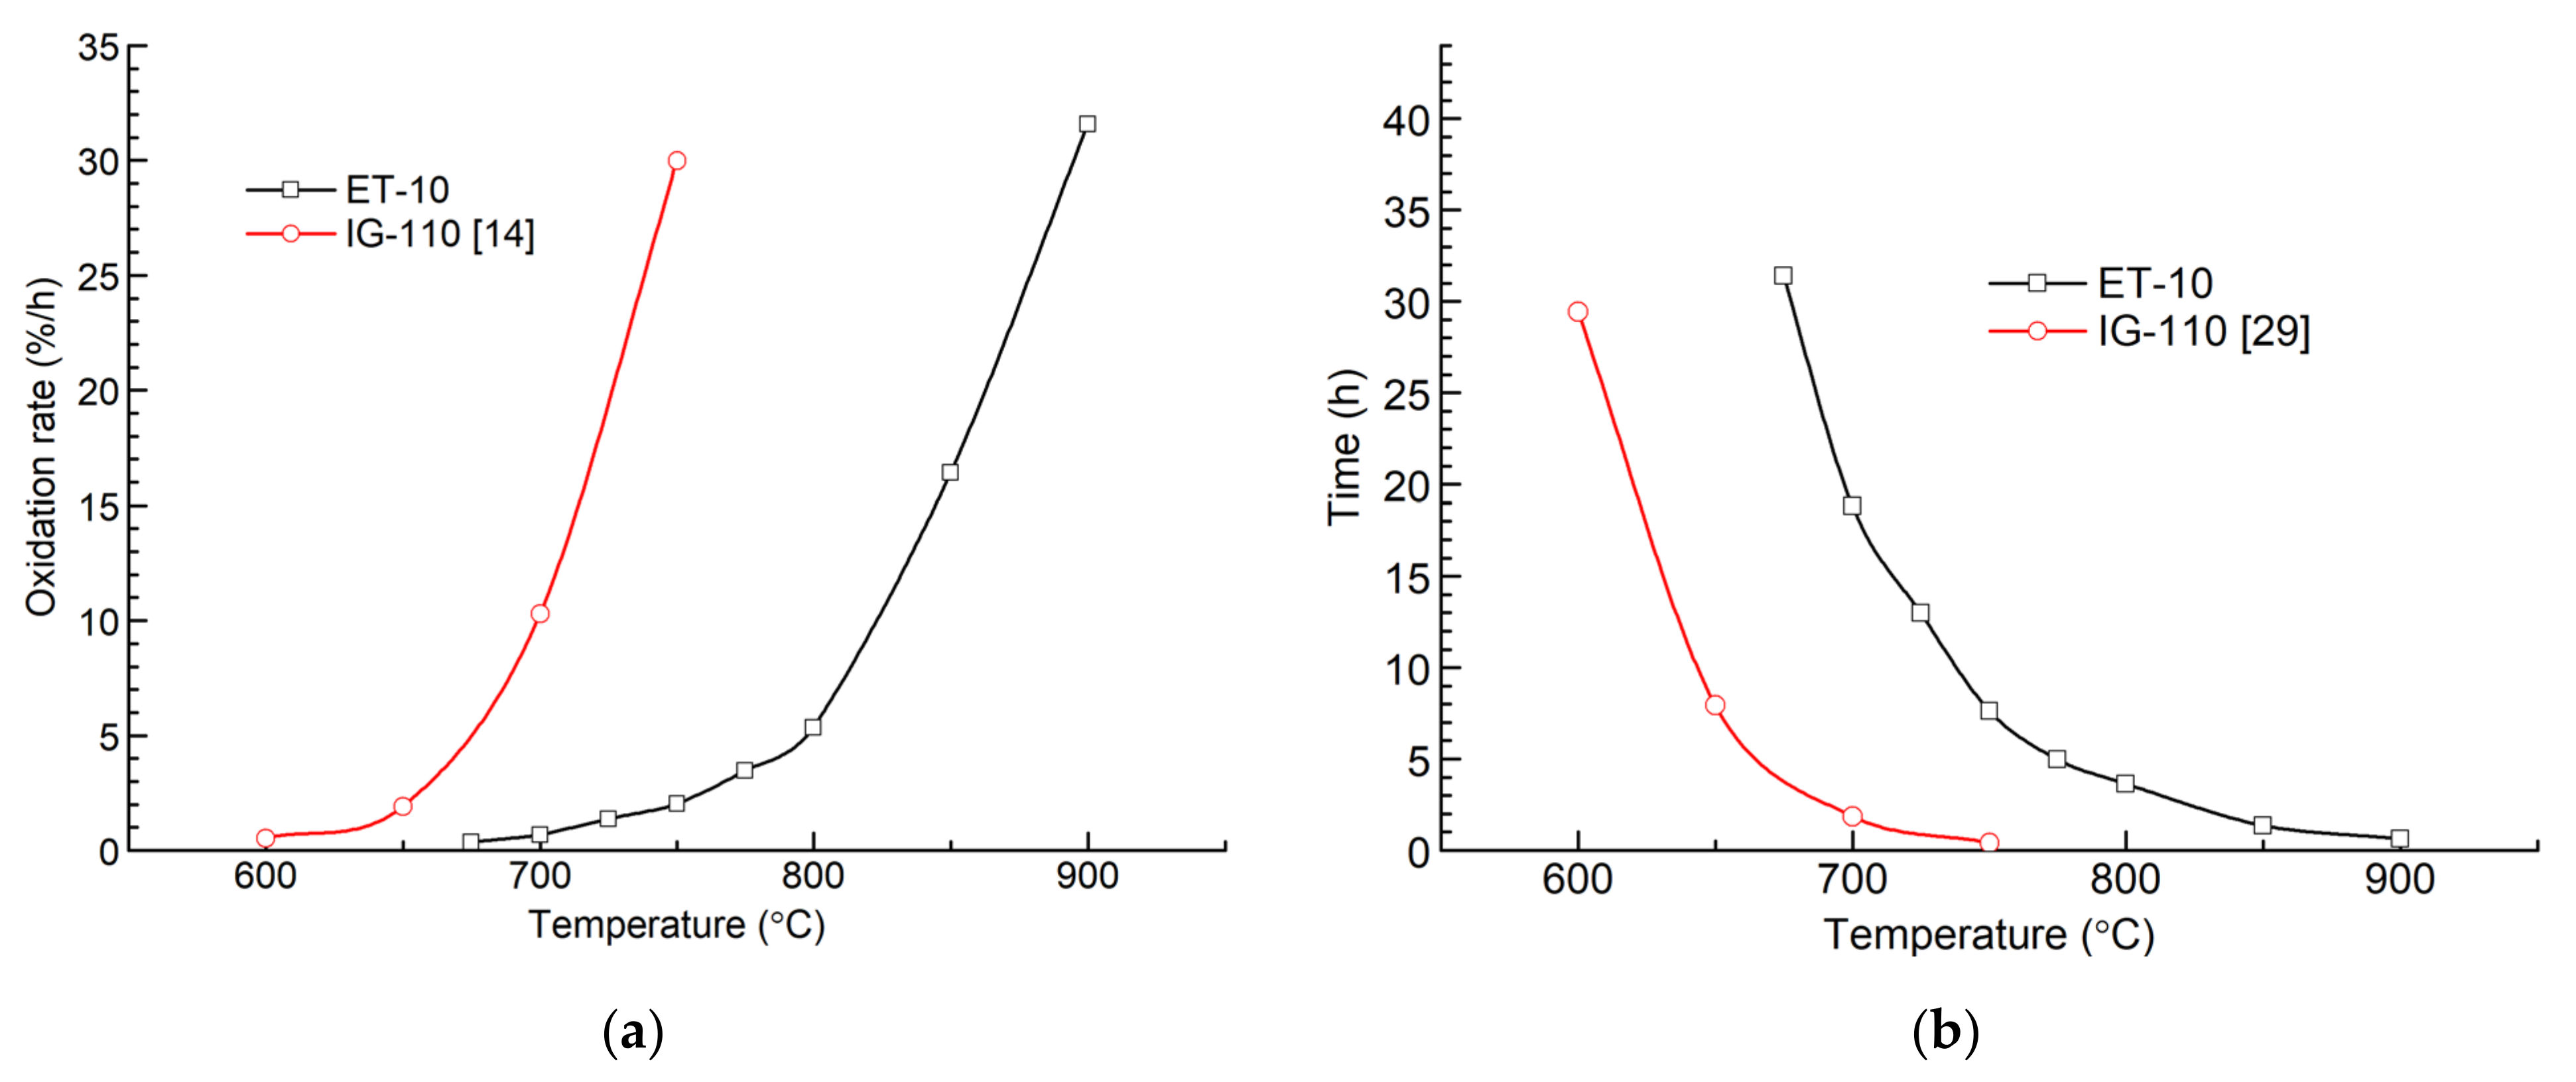
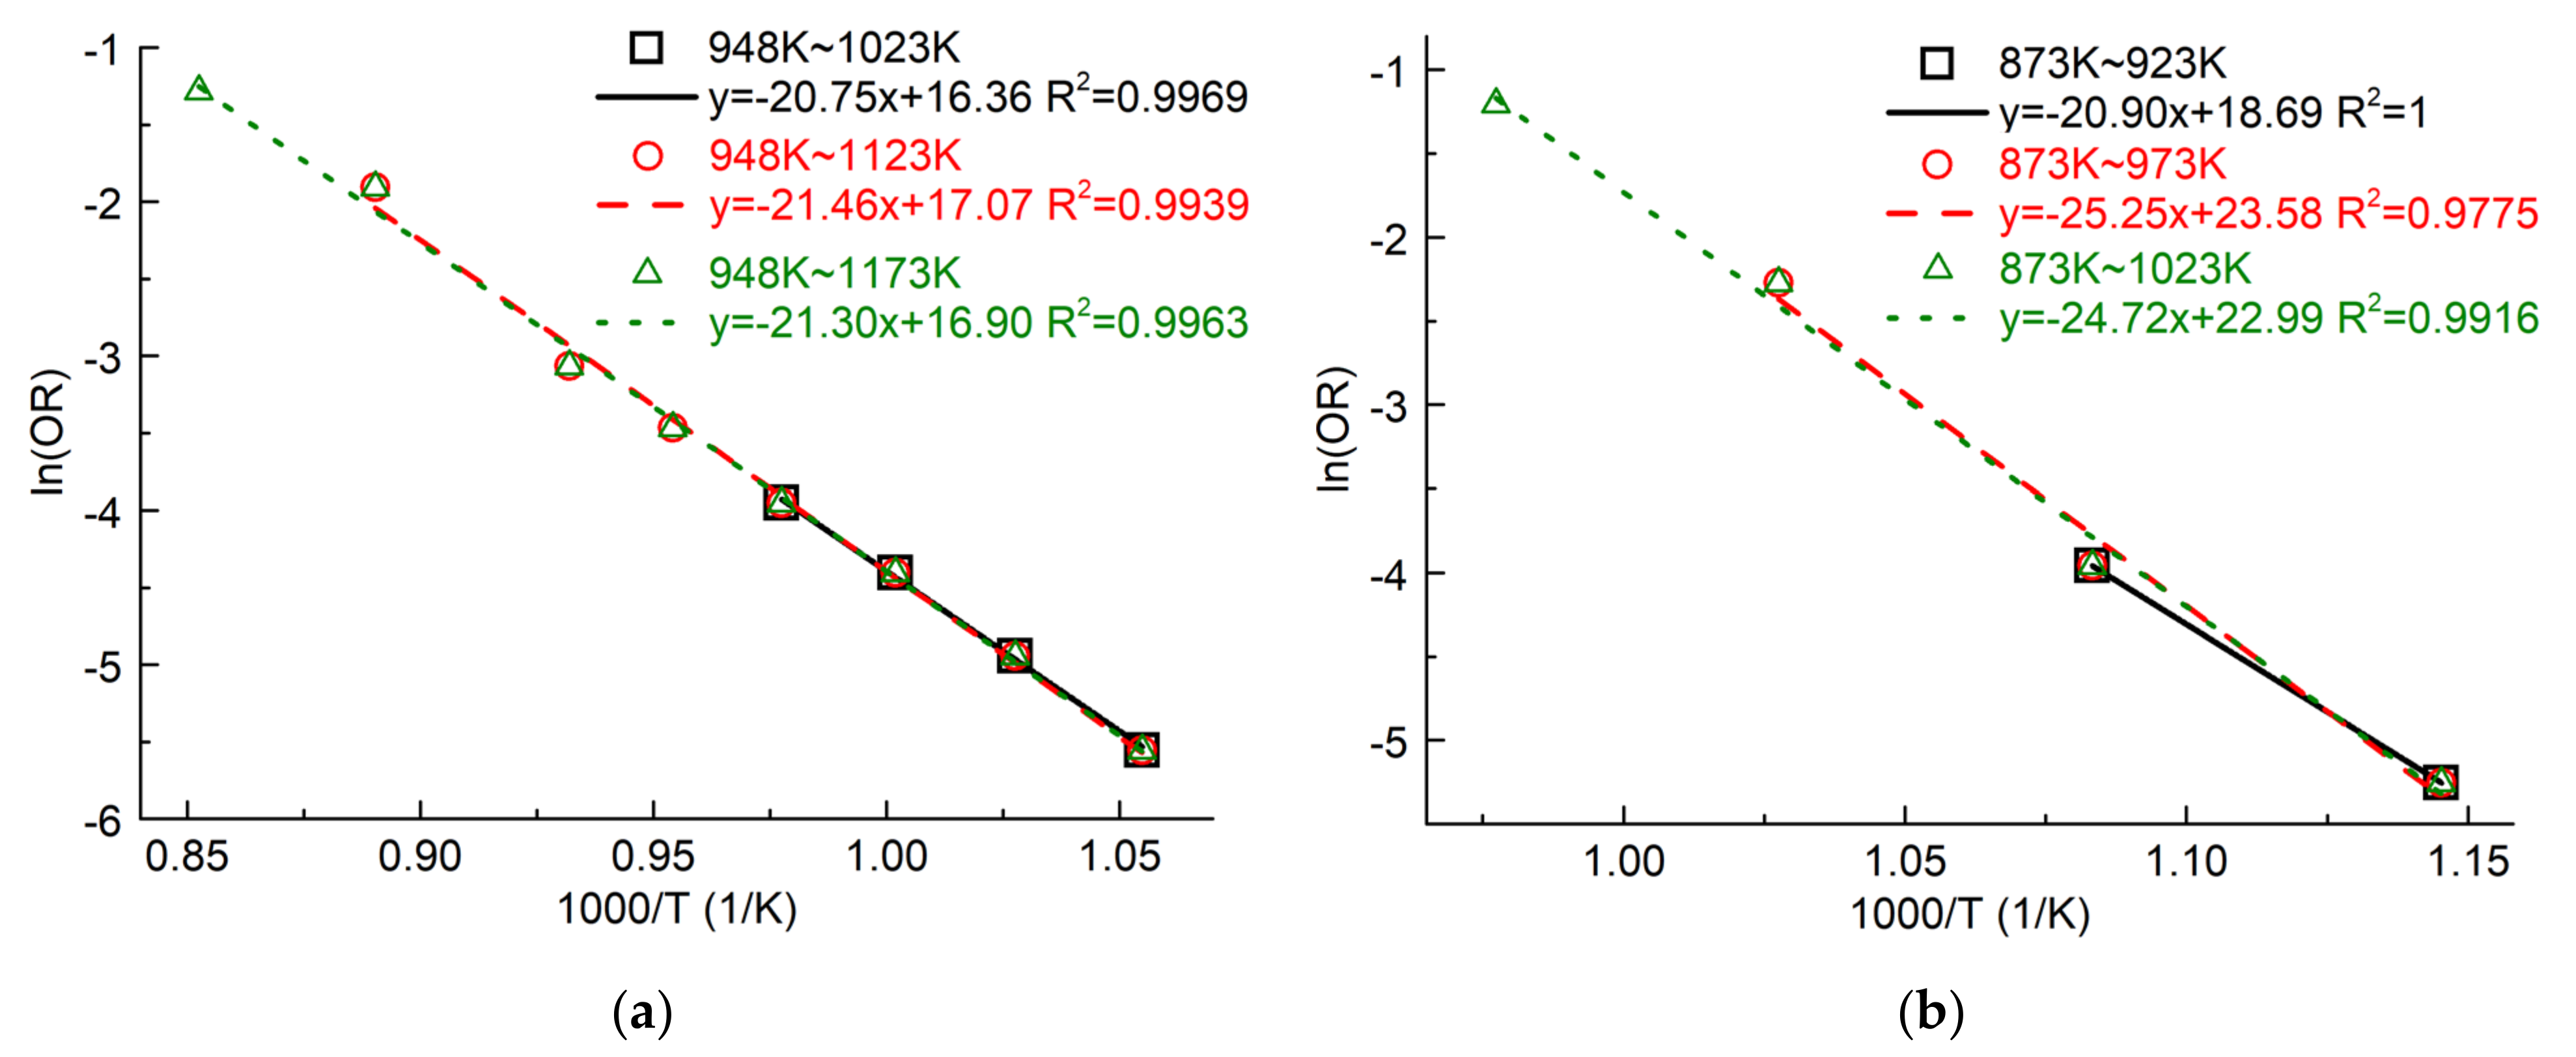
3.3. Arrhenius Plot and Oxygen Supply
3.4. Chemical Kinetics-Controlled Regime and Activation Energy
4. Discussion
5. Conclusions
Author Contributions
Funding
Data Availability Statement
Acknowledgments
Conflicts of Interest
References
- Shiozawa, S.; Fujikawa, S.; Iyoku, T.; Kunitomi, K.; Tachibana, Y. Overview of HTTR design features. Nucl. Eng. Des. 2004, 233, 11–21. [Google Scholar] [CrossRef]
- Zhang, Z.; Dong, Y.; Li, F.; Zhang, Z.; Wang, H.; Huang, X.; Li, H.; Liu, B.; Wu, X.; Wang, H.; et al. The Shandong Shidao Bay 200 MWe high-temperature gas-cooled reactor pebble-bed module (HTR-PM) demonstration power plant: An engineering and technological innovation. Engineering 2016, 2, 112–118. [Google Scholar] [CrossRef] [Green Version]
- Zhou, X.; Lu, Z.; Zhang, J.; Liu, B.; Zou, Y.; Tang, C.; Tang, Y. Preparation of spherical fuel elements for HTR-PM in INET. Nucl. Eng. Des. 2013, 263, 456–461. [Google Scholar]
- Fuks, L.; Herdzik-Koniecko, I.; Kiegiel, K.; Zakrzewska-Koltuniewicz, G. Management of Radioactive Waste Containing Graphite: Overview of Methods. Energies 2020, 13, 4638. [Google Scholar] [CrossRef]
- Marsden, B.J.; Jones, A.N.; Hall, G.N.; Treifi, P.M.; Mummery, P.M. Graphite as a core material for generation IV nuclear reactors. In Structural Materials for Generation IV Nuclear Reactors; Yvon, P., Ed.; Elsevier: Cambridge, UK, 2017; Volume 14, pp. 495–532. [Google Scholar]
- Bowden-Reid, R.; Khachan, J. An inertial electrostatic confinement fusion system based on graphite. Phys. Plasmas 2021, 28, 042703. [Google Scholar] [CrossRef]
- Tanabe, T. Revisiting carbon materials as plasma-facing material of a fusion reactor. Plasma Phys. Rep. 2019, 45, 300–314. [Google Scholar] [CrossRef]
- Goriaev, A.; Wauters, T.; Brakel, R.; Brezinsek, S.; Dinklage, A.; Fellinger, J.; Grote, H.; Moseev, D.; Sereda, S.; Volzke, O. Wall conditioning at the Wendelstein 7-X stellarator operating with a graphite divertor. Phys. Scr. 2020, T171, 014063. [Google Scholar] [CrossRef]
- Berre, C.; Fok, S.L.; Marsden, B.J.; Babout, L.; Hodgkins, A.; Marrow, T.J.; Mummery, P.M. Numerical modelling of the effects of porosity changes on the mechanical properties of nuclear graphite. J. Nucl. Mater. 2006, 352, 1–5. [Google Scholar] [CrossRef]
- Kurumada, A.; Oku, T.; Harada, K.; Kawamata, K.; Sato, S.; Hiraoda, T.; McEnaney, B. Effects of burn-off on thermal shock resistances of nuclear carbon materials. Carbon 2014, 35, 1157–1165. [Google Scholar] [CrossRef]
- Lim, Y.S.; Chi, S.H.; Cho, K.Y. Change of properties after oxidation of IG-11 graphite by air and CO2 gas. J. Nucl. Mater. 2008, 374, 123–128. [Google Scholar] [CrossRef]
- Yang, X.; Wang, X.; Tsang, D.K.L. The effect of thermal oxidation on the coefficient of thermal expansion of nuclear graphite. J. Mater. Sci. 2020, 55, 7805–7815. [Google Scholar] [CrossRef]
- Kim, E.S.; NO, H.C. Experimental study on the oxidation of nuclear graphite and development of an oxidation model. J. Nucl. Mater. 2006, 349, 182–194. [Google Scholar] [CrossRef]
- Contescu, C.I.; Azad, S.; Miller, D.; Lance, M.J.; Baker, F.S.; Burchell, T.D. Practical aspects for characterizing air oxidation of graphite. J. Nucl. Mater. 2008, 381, 15–24. [Google Scholar] [CrossRef]
- Choi, W.K.; Kim, B.J.; Kim, E.S.; Chi, S.H.; Park, S.J. Oxidation behavior of IG and NBG nuclear graphites. Nucl. Eng. Des. 2011, 241, 82–87. [Google Scholar] [CrossRef]
- Contescu, C.I.; Guldan, T.; Wang, P.; Burchell, T.D. The effect of microstructure on air oxidation resistance of nuclear graphite. Carbon 2012, 50, 3354–3366. [Google Scholar] [CrossRef]
- Zhou, X.; Lu, Z.; Li, X.; Zhang, J.; Liu, B.; Tang, Y. The oxidation behavior of a3-3 matrix graphite. New Carbon Mater. 2016, 31, 182–187. [Google Scholar] [CrossRef]
- Sun, X.; Dong, Y.; Zhou, Y.; Li, Z.; Shi, L.; Sun, Y.; Zhang, Z. Effects of reaction temperature and inlet oxidizing gas flow rate on IG-110 graphite oxidation used in HTR-PM. J. Nucl. Sci. Technol. 2017, 54, 196–204. [Google Scholar] [CrossRef]
- Yan, R.; Dong, Y.; Zhou, Y.; Sun, X.; Li, Z. Investigation of oxidation behaviors of nuclear graphite being developed and IG-110 based on gas analysis. J. Nucl. Sci. Technol. 2017, 54, 1168–1177. [Google Scholar] [CrossRef]
- Chi, S.H.; Kim, G.C. Effects of air flow rate on the oxidation of NBG-18 and NBG-25 nuclear graphite. J. Nucl. Mater. 2017, 491, 37–42. [Google Scholar] [CrossRef]
- Lee, J.J.; Ghosh, T.K.; Loyalka, S.K. Comparison of NBG-18, NBG-17, IG-110 and IG-11 oxidation kinetics in air. J. Nucl. Mater. 2018, 500, 64–71. [Google Scholar] [CrossRef]
- Smith, R.E.; Kane, J.J.; Windes, W.E. Determining the acute oxidation behavior of several nuclear graphite grades. J. Nucl. Mater. 2021, 545, 152648. [Google Scholar] [CrossRef]
- Rodriguez, D.J.; Lau, C.Y.; Long, B.A.; Tang, S.A.; Friese, A.M.; Anderson, S.L. O2-oxidation of individual graphite and graphene nanoparticles in the 1200–2200 K range: Particle-to-particle variations and the evolution of the reaction rates and optical properties. Carbon 2021, 173, 286–300. [Google Scholar] [CrossRef]
- Bratten, A.; Duan, J.; Hoffman, A.; Wen, H.; He, X.; Stempien, J.D. Effects of microstructure on the oxidation behavior of A3 matrix-grade graphite. J. Am. Ceram. Soc. 2021, 104, 584–592. [Google Scholar] [CrossRef]
- Lu, W.; Li, X.; Wu, X.; Sun, L.; Li, Z. Investigation on the oxidation behavior and multi-step reaction mechanism of nuclear graphite SNG742. J. Nucl. Sci. Technol. 2020, 57, 263–275. [Google Scholar] [CrossRef]
- Li, C.; Chen, X.; Shen, L.; Bao, N. Revisiting the oxidation of graphite: Reaction mechanism, chemical stability, and structure self-regulation. ACS Omega 2020, 5, 3397–3404. [Google Scholar] [CrossRef] [PubMed]
- Kane, J.J.; Matthews, A.C.; Swank, W.D.; Windes, W.E. Effects of air oxidation on the evolution of surface area within nuclear graphite and the contribution of macropores. Carbon 2020, 166, 291–306. [Google Scholar] [CrossRef]
- ASTM. Standard Test Method for Air Oxidation of Carbon and Graphite in The Kinetic Regime; ASTM D7542-15; ASTM: West Conshohocken, PA, USA, 2015. [Google Scholar]
- Zhou, Y.; Dong, Y.; Yin, H.; Li, Z.; Yan, R.; Li, D.; Gu, Z.; Sun, X.; Shi, L.; Zhang, Z. Characterizing thermal-oxidation behaviors of nuclear graphite by combining O2 supply and micro surface area of graphite. Sci. Rep. 2018, 8, 13400. [Google Scholar] [CrossRef] [PubMed]
- Wang, M.; Xu, F.; Sun, H.; Liu, Q.; Artyushkova, K.; Stach, E.A.; Xie, J. Nanoscale graphite-supported Pt catalysts for oxygen reduction reactions in fuel cells. Electrochim. Acta 2011, 56, 2566–2573. [Google Scholar] [CrossRef]
- El-Genk, M.S.; Tournier, J.M.P. Development and validation of a model for the chemical kinetics of graphite oxidation. J. Nucl. Mater. 2011, 411, 193–207. [Google Scholar] [CrossRef]
- Kane, J.J.; Contescu, C.I.; Smith, R.E.; Strydom, G.; Windes, W.E. Understanding the reaction of nuclear graphite with molecular oxygen: Kinetics, transport, and structural evolution. J. Nucl. Mater. 2017, 493, 343–367. [Google Scholar] [CrossRef]
- Wang, P.; Contescu, C.I.; Yu, S.; Burchell, T.D. Pore structure development in oxidized IG-110 nuclear graphite. J. Nucl. Mater. 2012, 430, 229–238. [Google Scholar] [CrossRef]
- Chi, S.H.; Kim, G.C. Comparison of the oxidation rate and degree of graphitization of selected IG and NBG nuclear graphite grades. J. Nucl. Mater. 2008, 381, 9–14. [Google Scholar] [CrossRef]
- El-Genk, M.S.; Tournier, J.M.P. Comparison of oxidation model predictions with gasification data of IG-110, IG-430 and NBG-25 nuclear graphite. J. Nucl. Mater. 2012, 420, 141–158. [Google Scholar] [CrossRef]
- Kim, E.S.; No, H.C.; Kim, B.J.; Oh, C.H. Estimation of graphite density and mechanical strength variation of VHTR during air-ingress accident. Nucl. Eng. Des. 2008, 238, 837–847. [Google Scholar] [CrossRef]


| Parameter | Value | ||
|---|---|---|---|
| Temperature (°C) | 675–750 | 675–850 | 675–900 |
| Activation energy (kJ/mol) | 172.52 | 178.50 | 177.09 |
| Adj. R2 | 0.9969 | 0.9939 | 0.9963 |
| 136.75 | 15.96 | 9.14 |
Publisher’s Note: MDPI stays neutral with regard to jurisdictional claims in published maps and institutional affiliations. |
© 2021 by the authors. Licensee MDPI, Basel, Switzerland. This article is an open access article distributed under the terms and conditions of the Creative Commons Attribution (CC BY) license (https://creativecommons.org/licenses/by/4.0/).
Share and Cite
Zhao, Y.; Dong, Y.; Zhou, Y.; Li, Z.; Zhang, Z. Oxidation Experiments and Kinetics Analysis of Nuclear Graphite ET-10 by Gas Analysis and Microstructure Observation. Energies 2021, 14, 6392. https://doi.org/10.3390/en14196392
Zhao Y, Dong Y, Zhou Y, Li Z, Zhang Z. Oxidation Experiments and Kinetics Analysis of Nuclear Graphite ET-10 by Gas Analysis and Microstructure Observation. Energies. 2021; 14(19):6392. https://doi.org/10.3390/en14196392
Chicago/Turabian StyleZhao, Yumeng, Yujie Dong, Yangping Zhou, Zhengcao Li, and Zuoyi Zhang. 2021. "Oxidation Experiments and Kinetics Analysis of Nuclear Graphite ET-10 by Gas Analysis and Microstructure Observation" Energies 14, no. 19: 6392. https://doi.org/10.3390/en14196392
APA StyleZhao, Y., Dong, Y., Zhou, Y., Li, Z., & Zhang, Z. (2021). Oxidation Experiments and Kinetics Analysis of Nuclear Graphite ET-10 by Gas Analysis and Microstructure Observation. Energies, 14(19), 6392. https://doi.org/10.3390/en14196392