1. Introduction
Electrical Rotating Machines (EMs) and especially Synchronous Generators (SGs) constitute the main source of electricity production. Therefore, SGs must be reliable, must have as long a lifespan as possible, and must operate reliably [
1,
2,
3,
4,
5]. One of the main reasons for the failure of SGs is their stator insulation system, which has three main insulation levels [
2,
3,
4,
5,
6]:
Ground wall insulation;
Insulation between turns/strands;
Semi-conductive coating.
The insulation system of the High Voltage (HV) EMs consists of [
6,
7,
8,
9]:
mica, which is used in order to minimize the Partial Discharge (PD) activity;
supporting material for proper mechanical strength;
resin that fills the voids between mica and the supporting material.
The insulation system is subjected to different stresses acting alone or in combination with each other. The stator winding is one of the most stressed components of a generator. If a winding fault occurs during operation, the consequential damages to the machine can lead to significant outage times. These stresses are Thermal, Electrical, various Ambient factors, and Mechanical (TEAM), which create faults, such as delaminations and cracks and these can lead to the breakdown and overall damage of the insulation system. More specifically, PDs appear to be one of the major problems of the EMs’ insulation system. If high PD magnitudes occur over a long period, deterioration of the EMs’ insulation system may ensue. PDs are small electric spikes, which take place within air-filled cavities of the insulation or on its surface. PDs occur because the breakdown strength of air is much lower than the strength of the surrounding solid insulation. PDs cause small current and voltage pulses, while they are due to charges bombarding the cavity walls. These events may lead to insulation erosion. One could say that PDs are both a symptom of insulation deterioration and a means for the identification of possible faults. PDs may cause accelerated insulation ageing. Air cavities or other delaminations due to TEAM stresses increase the possibility of PD creation and can lead to insulation system deterioration due to chemical degradation and physical attack by nitrogen ions [
10,
11,
12,
13,
14,
15].
Epoxy resin is widely used and is proven to be a very important material achieving reliable and safe EM operation without undesirable shutdowns or additional maintenance. It helps EMs to perform adequately with reduced maintenance. Moreover, epoxy resin has high mechanical strength, good physical and electrical properties, high chemical resistance, adhesiveness, and low shrink ability, and it can be combined with other insulating materials, such as mica. Furthermore, epoxy resin is resistant to moisture and radiation; however, it may be affected by PDs and flashover voltages [
2,
16].
The present paper deals with the factors that may affect the proper operation and condition of epoxy resin and are related to PDs and flashover voltages. One significant goal of this manuscript is to investigate whether the presence of humidity leads to an increase or decrease in PD activity and to pinpoint the factors that lead to this result. Research works are ambiguous. Some mention that humidity leads to an increase in PD activity while others a decrease. Another important factor that this manuscript deals with is the investigation of which factors, such as applied voltage, water conductivity, and the geometry of enclosed voids, affect epoxy resin. Epoxy resin is one of the most significant insulation materials and is also widely employed in the SG. Technical data, PD measurements, and PD activity of the SG are described below. A combination of simulation and experimental results will lead to conclusions for all of the aforementioned factors and an overall view of the way that epoxy resin reacts to them.
2. Partial Discharges (PDs)
PDs are electrical discharges, which partially bridge the insulation between conductors [
17]. They include internal discharges, slot discharges, and end-winding discharges.
2.1. PDs on EMs
SG are exposed to various defects in the insulation system. More specifically, TEAM [
3,
4,
5,
6] stresses are responsible for the deterioration of SGs’ insulation. PDs usually occur as a result of the various defects, as described above. PDs in EMs cause typical patterns, the analysis of which can identify the origin of different PDs [
18,
19,
20,
21]. PDs can be categorized as [
11]:
Internal PDs, which occur on windings and can be caused due to poor manufacturing and design;
Slot PDs, which occur on slot windings and are the most severe, and their cause can be poor manufacturing and improper maintenance;
End-winding PDs, the cause of which can also be poor design and a lack of maintenance.
Different faults and problems of electrical erosion occurred from the presence of PDs in a SG, with a rated power of 202 MVA and a rated voltage of 15.75 kV at 50 Hz, located in a power plant in Greece. The stator insulation type is epoxy resin. Its degradation and aging due to electrical activity, and especially PDs, increasingly worsen with time.
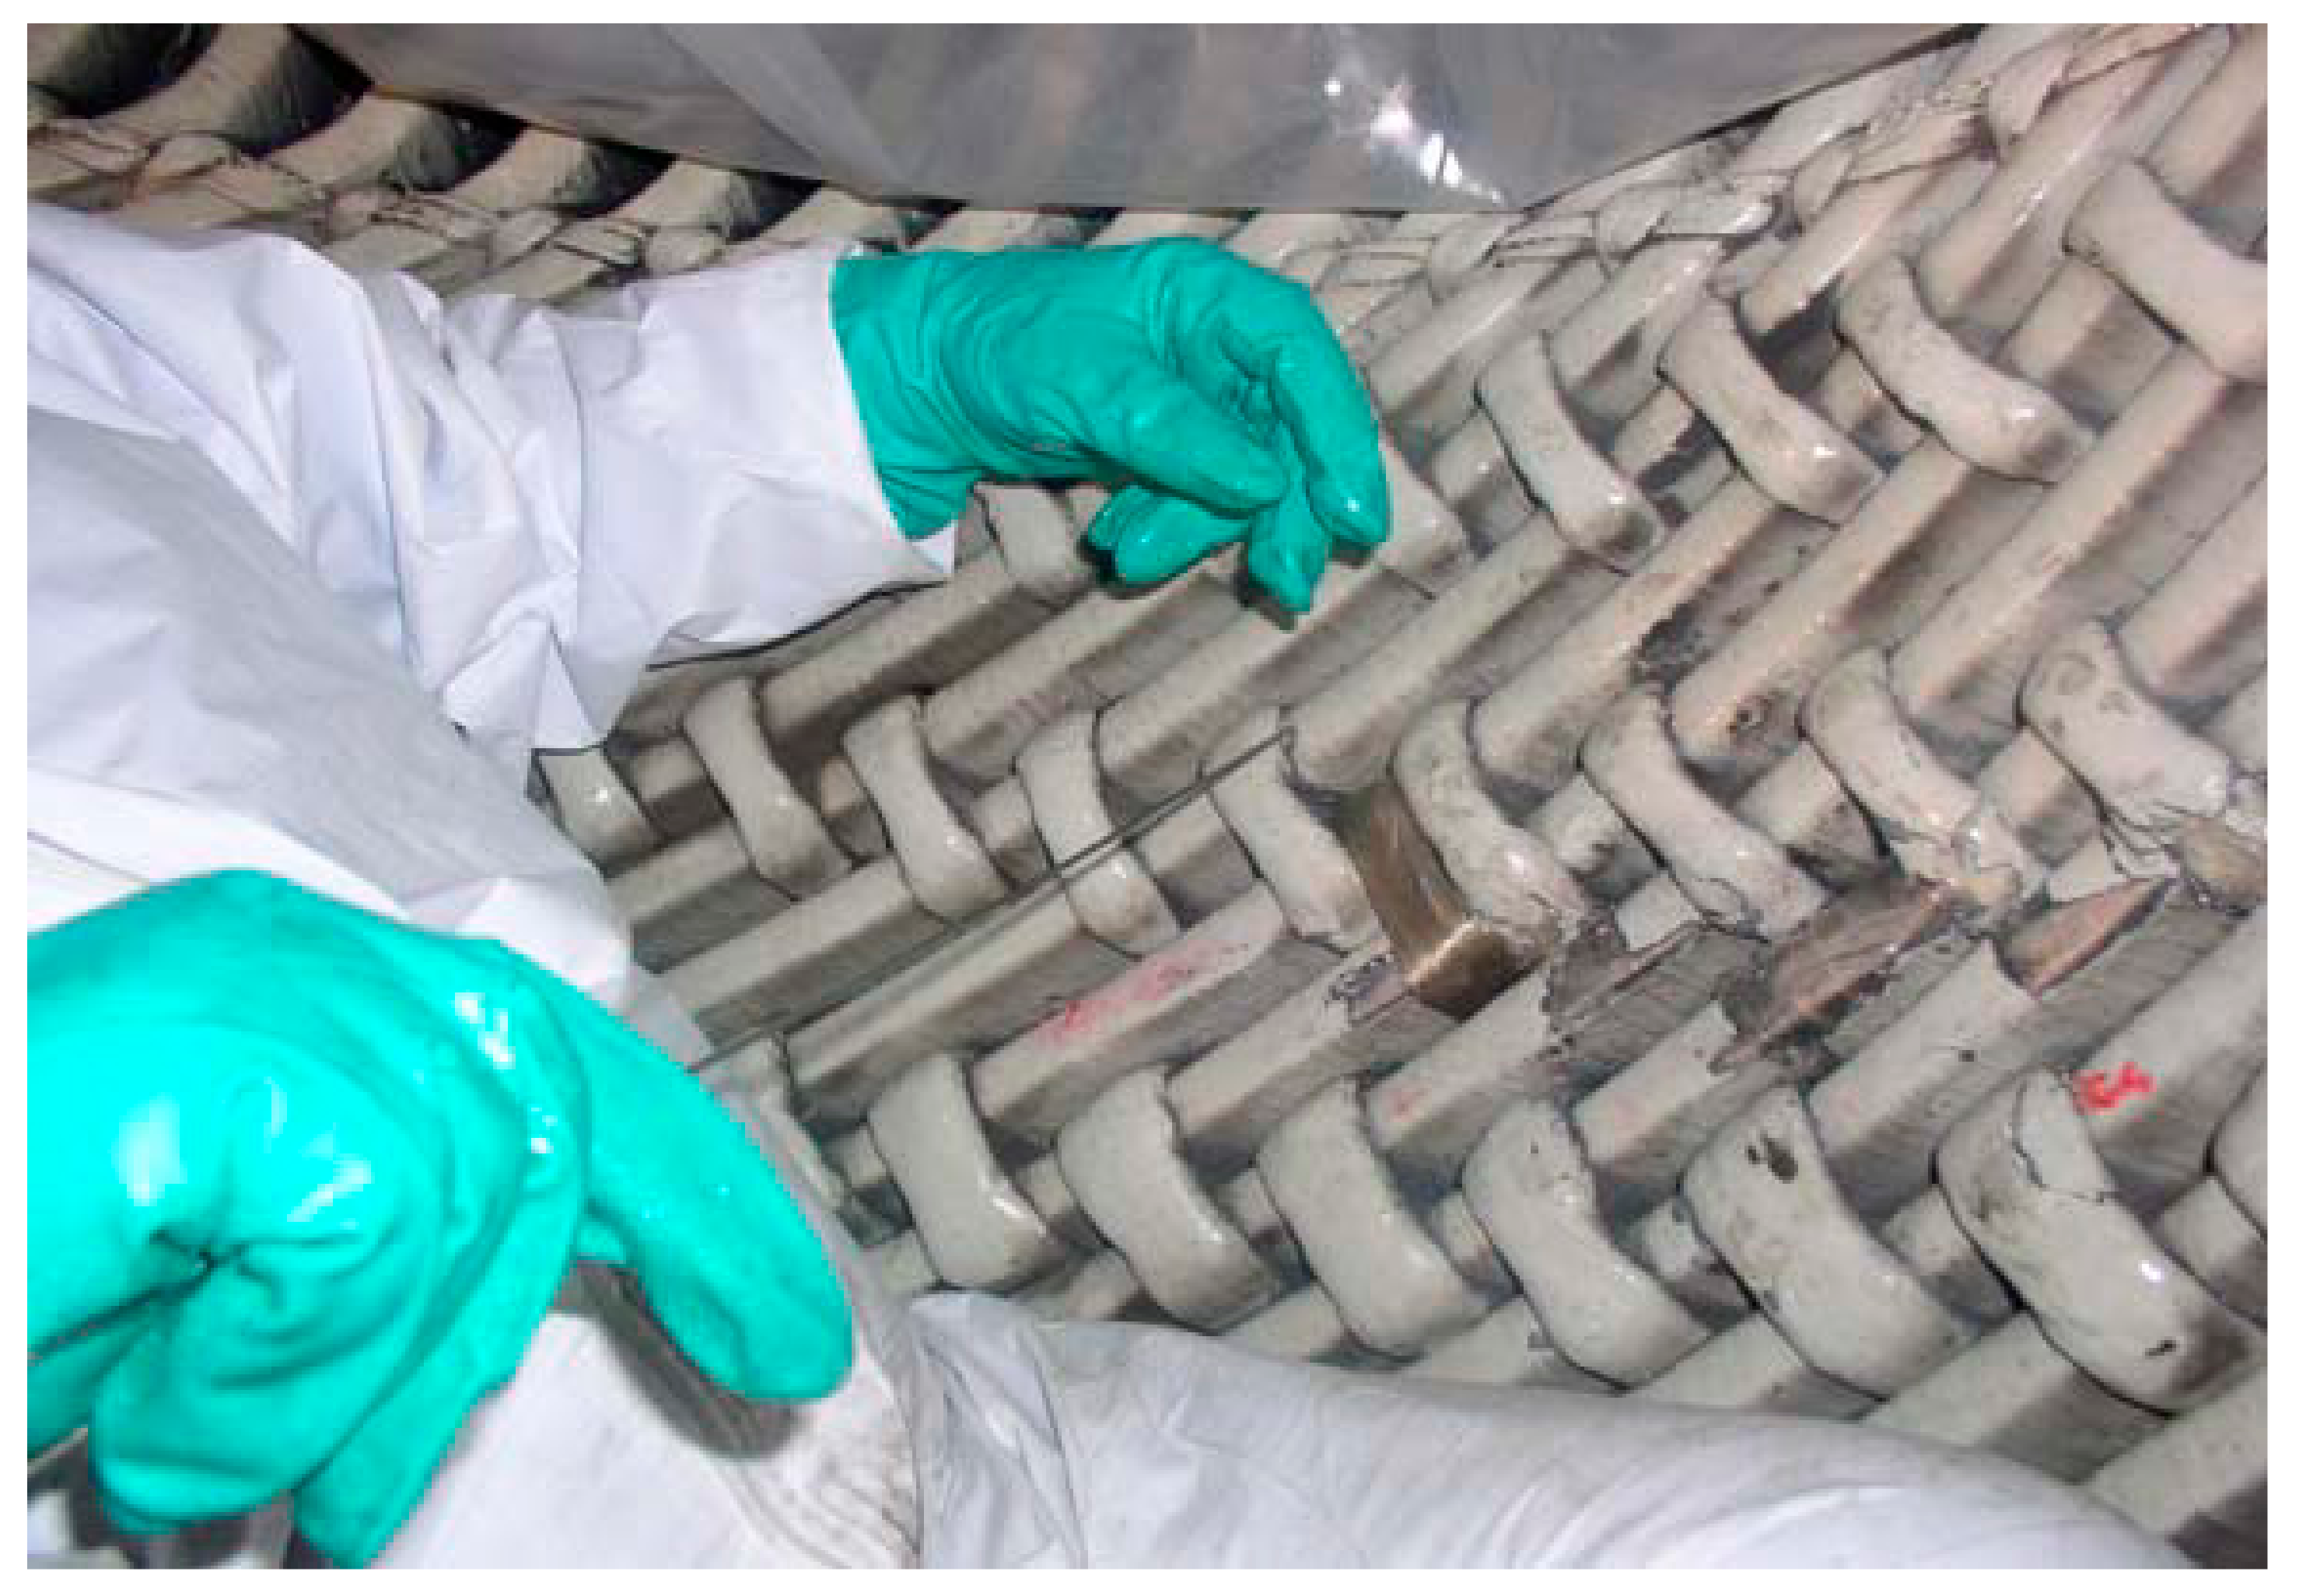
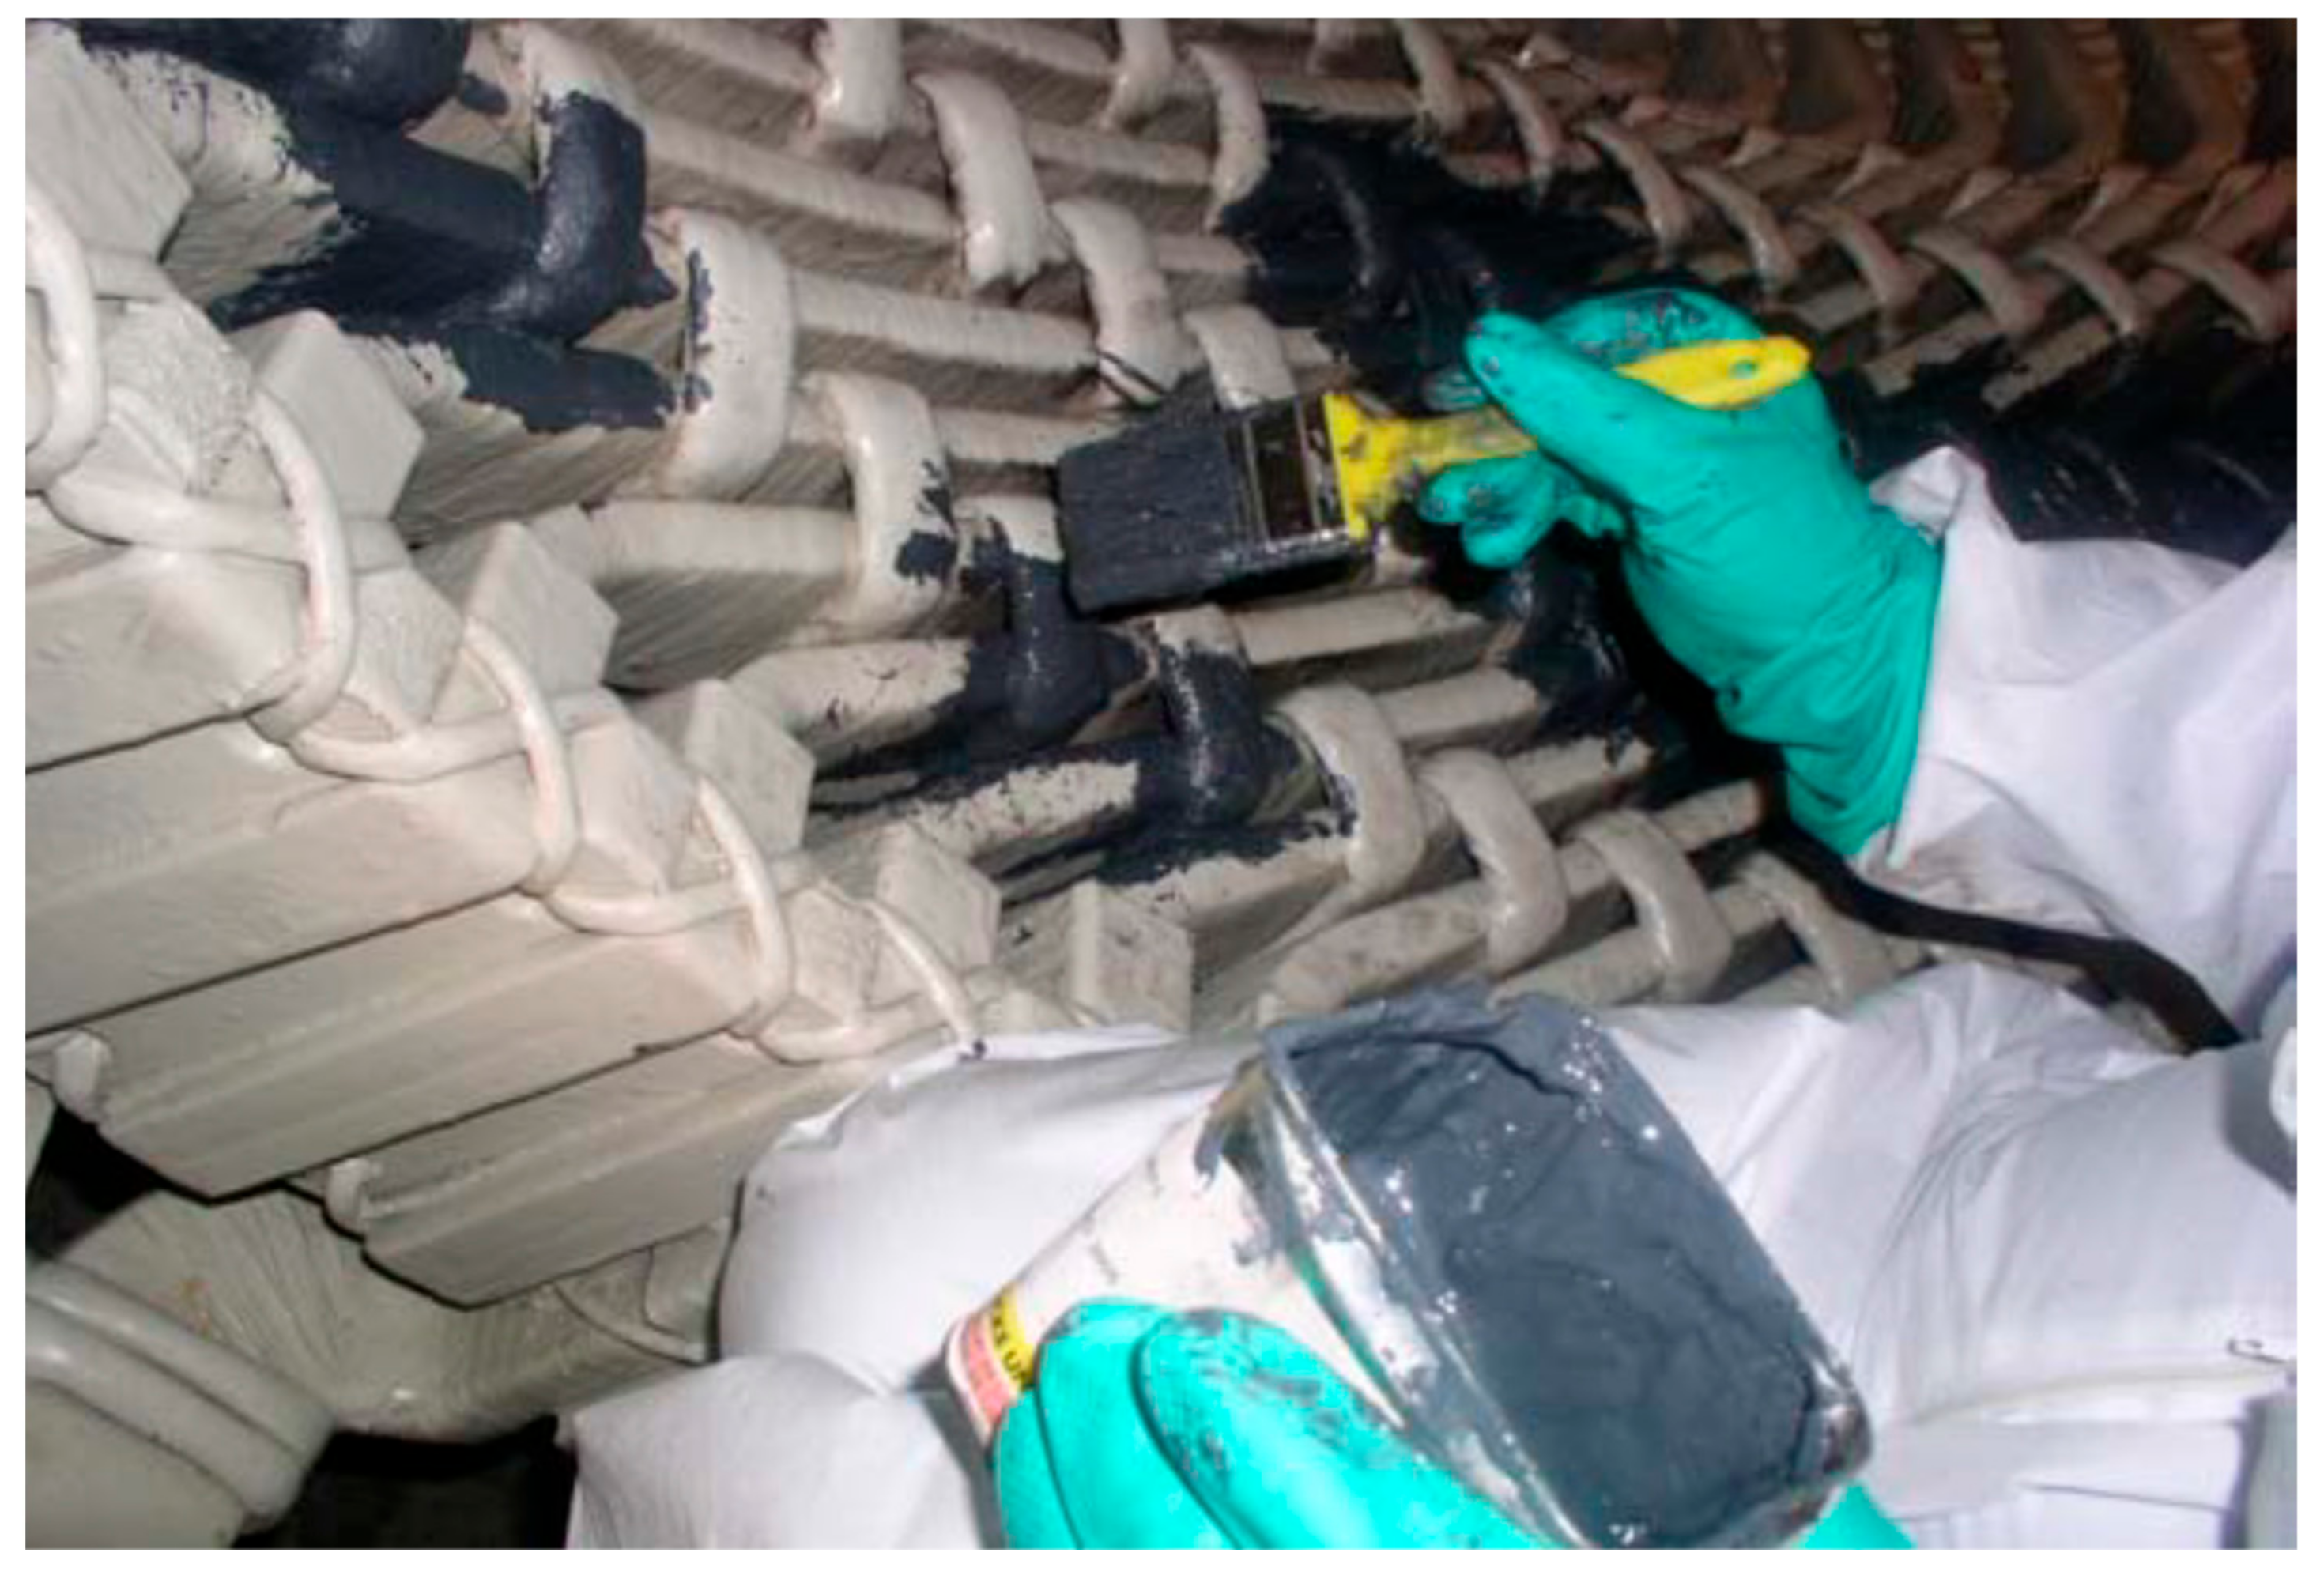
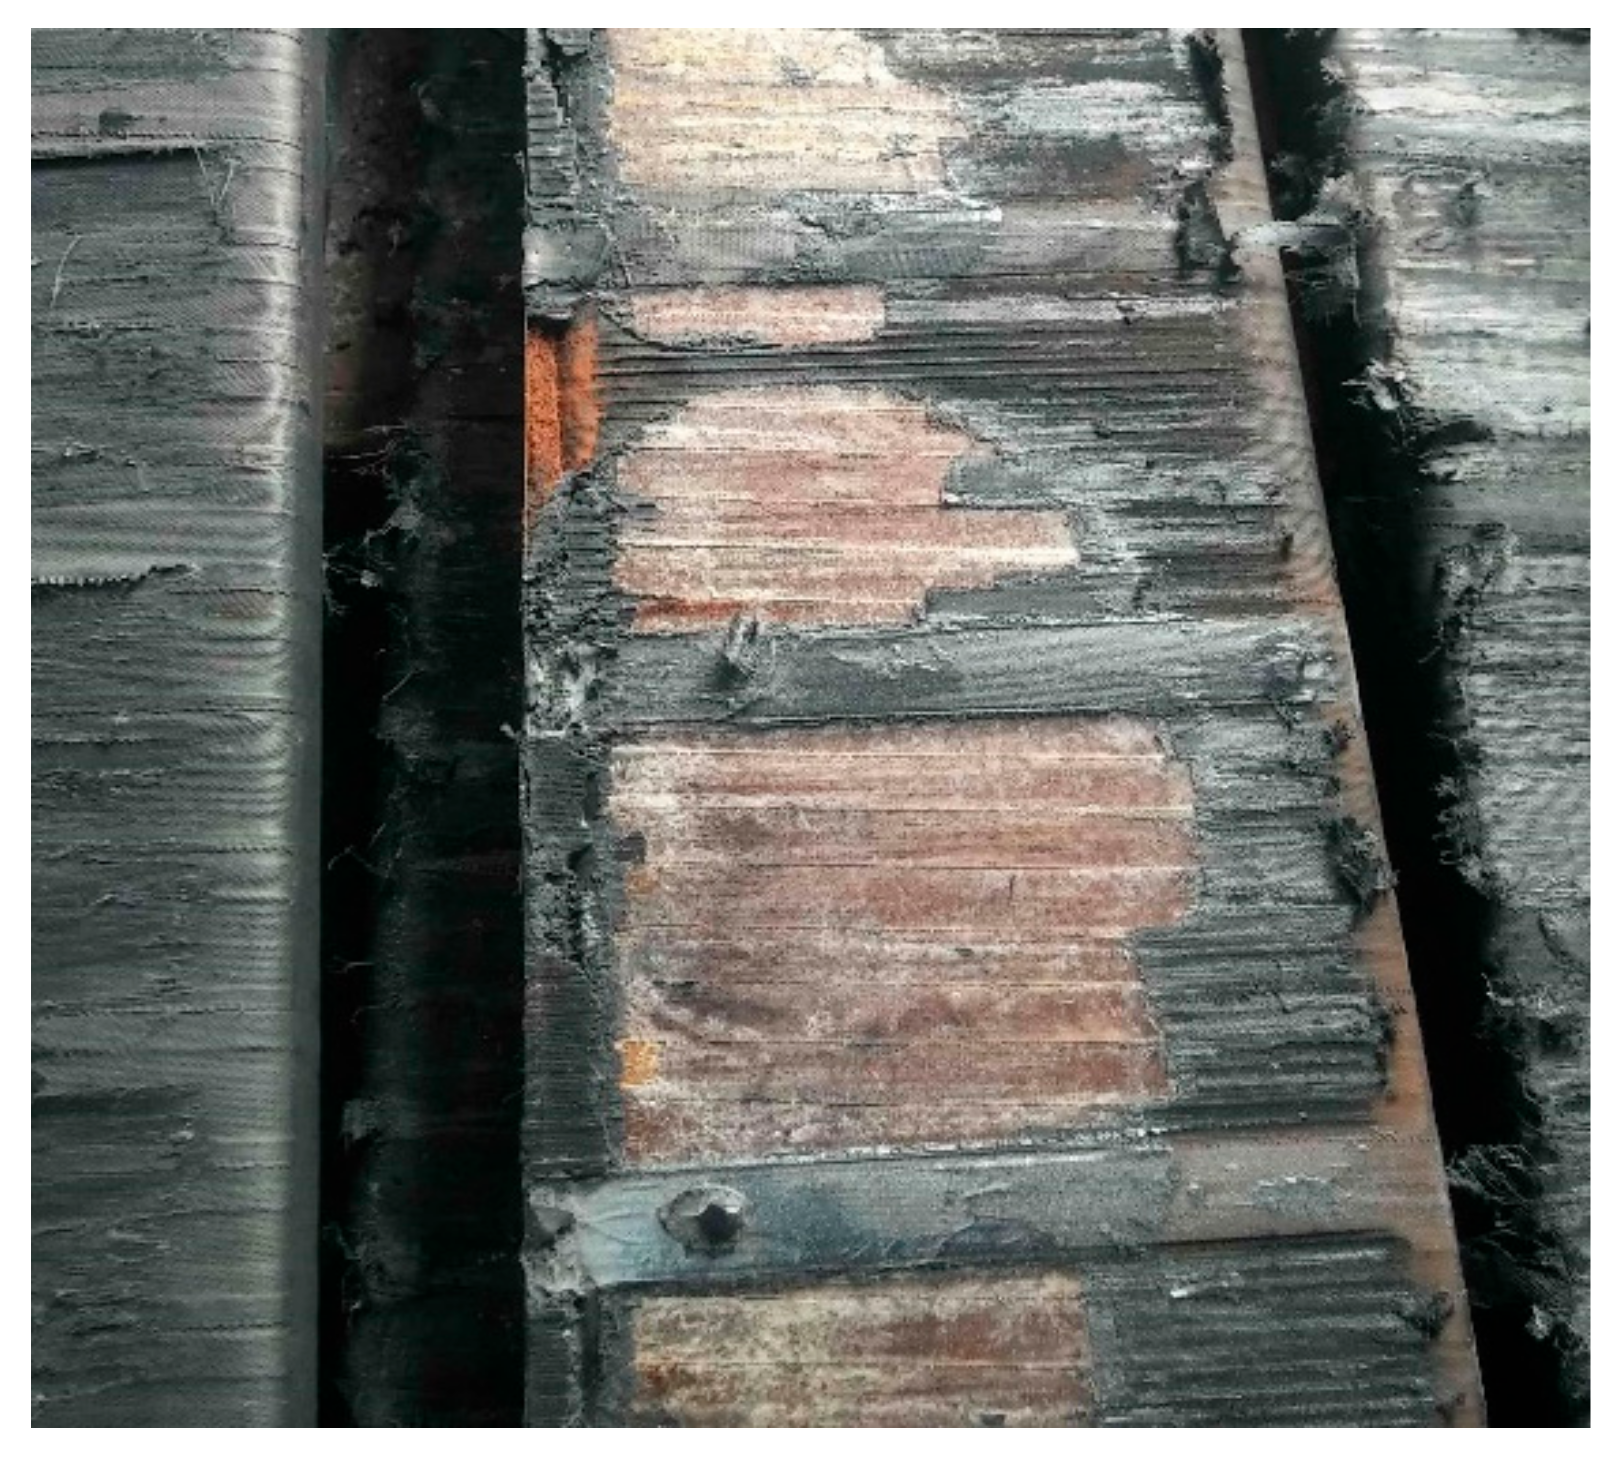
Figure 1 shows a serious degradation of the insulation system of the stator bars due to mechanical and electrical stresses, both of which were caused by PDs that occurred during the EM operation time. Τhe results of inspections and tests showed that the loosening of bars inside the slot is still at an initial stage except for some weak bars located in the bottom area of the stator core already at a critical stage. Given the above circumstances, preventative and/or corrective maintenance actions were performed in order to prevent the worsening of the EM condition. The standard conductive resin injection was chosen in order to tighten the bars inside their slots, to restore a proper contact between the insulation surface and core slot walls, and to inhibit further mechanical erosion and PD activity. These actions are shown in
Figure 2,
Figure 3 and
Figure 4. It must be noted that
Figure 1,
Figure 2,
Figure 3 and
Figure 4 were captured during real on-site maintenance actions on the aforementioned SG.
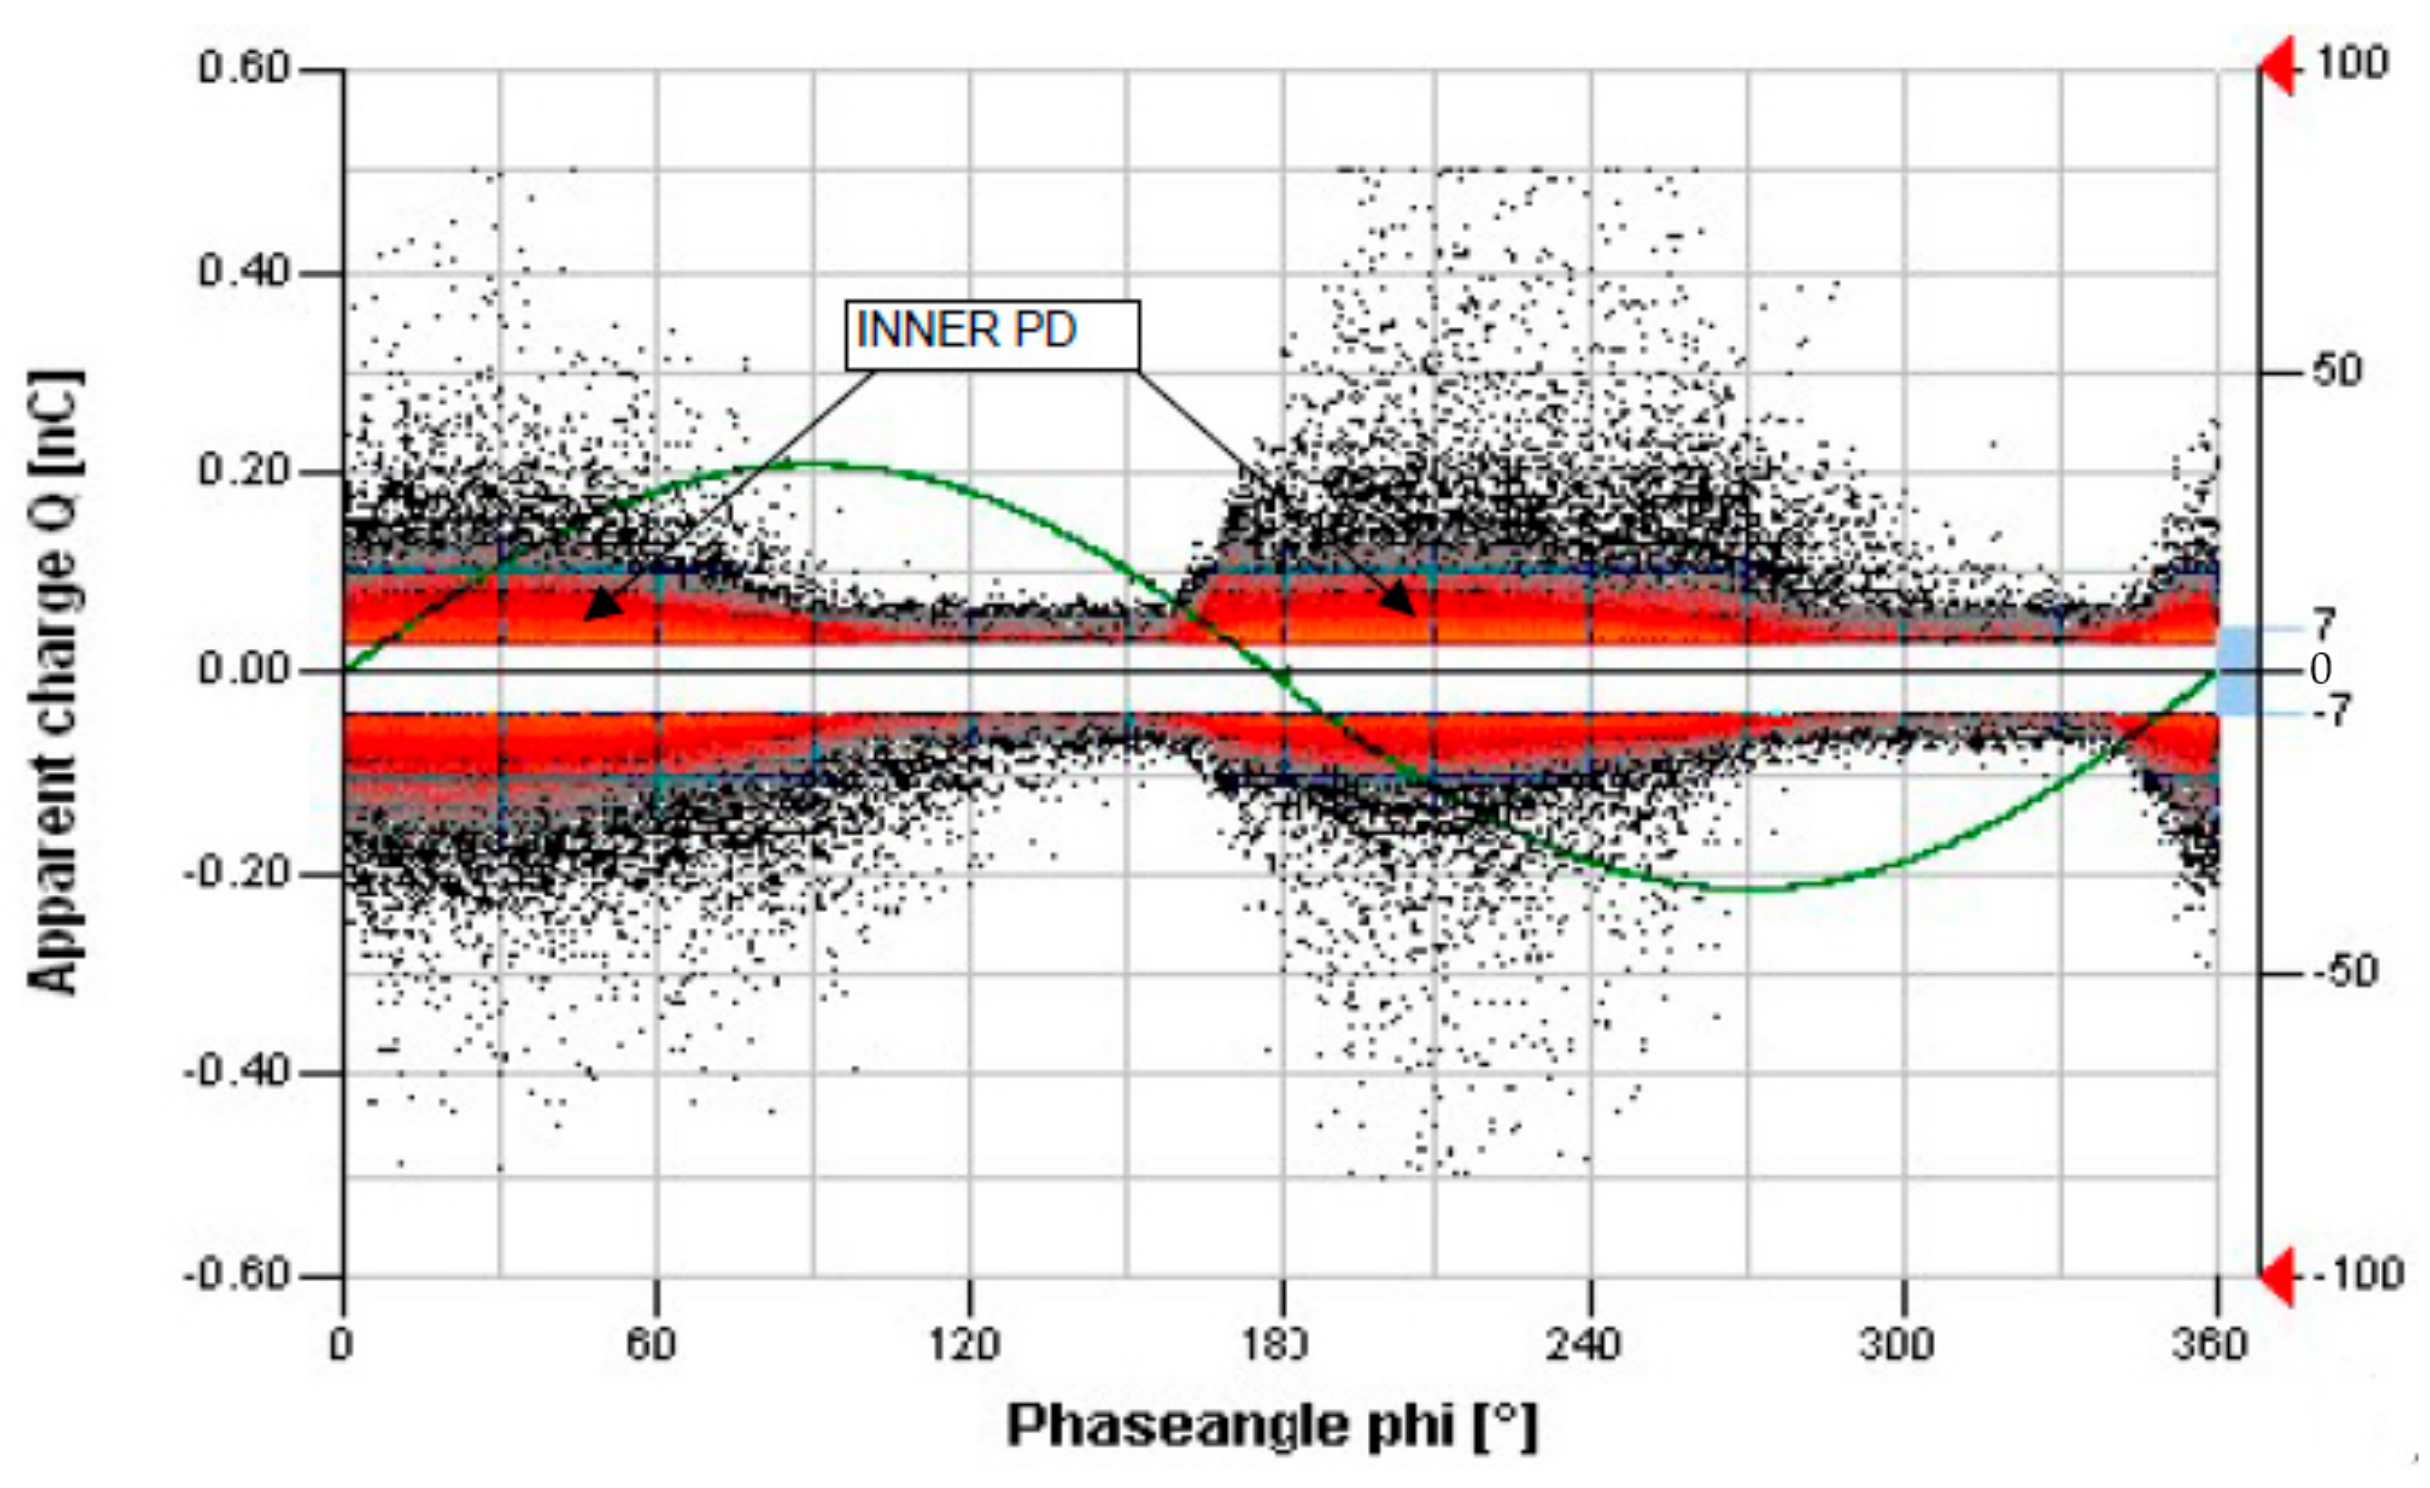
The PDs were inner PDs arising from stress within the voids of the main insulation, surface PDs on the surfaces of the end-windings, and PDs between the insulation surfaces and the slot wall.
The factors that influence the characteristics of PDs are [
22]:
Applied Voltage: as the applied voltage increases, the PD magnitude increases;
Type of Insulating Material: the PD amplitude depends on the relative permittivity of each insulating material used for EM insulation;
Void Size and Shape: the bigger the void, the larger the discharge;
Humidity: when there are more droplets on the surface of the insulating material, the PD amplitude tends to increase;
The frequency of the PD;
The applied voltage waveform.
To combat the aforementioned issues, proper maintenance plays a key role in detecting probable problems and, therefore, PD monitoring is an appropriate diagnostic method, as it is the most helpful in examining the insulation condition and identifying potential machine failures.
2.2. PD Measurement—General Information
Considering all of the above, it becomes clear that detecting PDs is a very important and useful diagnostic method in order to prevent possible failures in insulation systems. Moreover, PD measurement is a non-destructive diagnostic technique.
The principle of PD measurement is measuring the pulses, generated by charge displacements occurring within or on the stator winding insulation system. These pulses are captured using PD couplers temporary connected to the generator terminals.
The standard PD test (IEC 60034-27) consists of installing a set of coupling capacitors at the EM terminals and monitoring the high frequency currents that flow through them in the case of PDs in the insulation. This can be done in an on-line or an off-line mode [
23,
24].
In Offline PD tests, locations in the insulation system with weak dielectric conditions can be detected. The influence of noise is not as an important problem as for the Online PD test and it is easier to pinpoint the localization of the various fault areas. Moreover, Offline PD testing enables determination of PD inception and extinction voltage. On the other hand, since the EMs do not operate under real conditions, voltage stresses in the winding and mechanical stresses may not be representative. Furthermore, EMs must be taken out of operation, which may incur economic consequences. Finally, an external power supply is necessary.
Online PD testing [
11,
25] provides permanent monitoring of PDs as well as continuous information on stator winding conditions. It is possible to observe abnormal situations or sudden changes in the behaviour of the stator windings and to predict if the SG’s insulation is close enough to degradation. Furthermore, Online PD measurements provide information about the real insulation condition and the aging progress of the generator. The machine operates under real conditions, and a separate power supply is not necessary. A serious problem is the difficulty in determining the origin of the failure since the electrical noise obscures the fault. Installation of sensors is required.
2.3. PD Measurements under Real Conditions
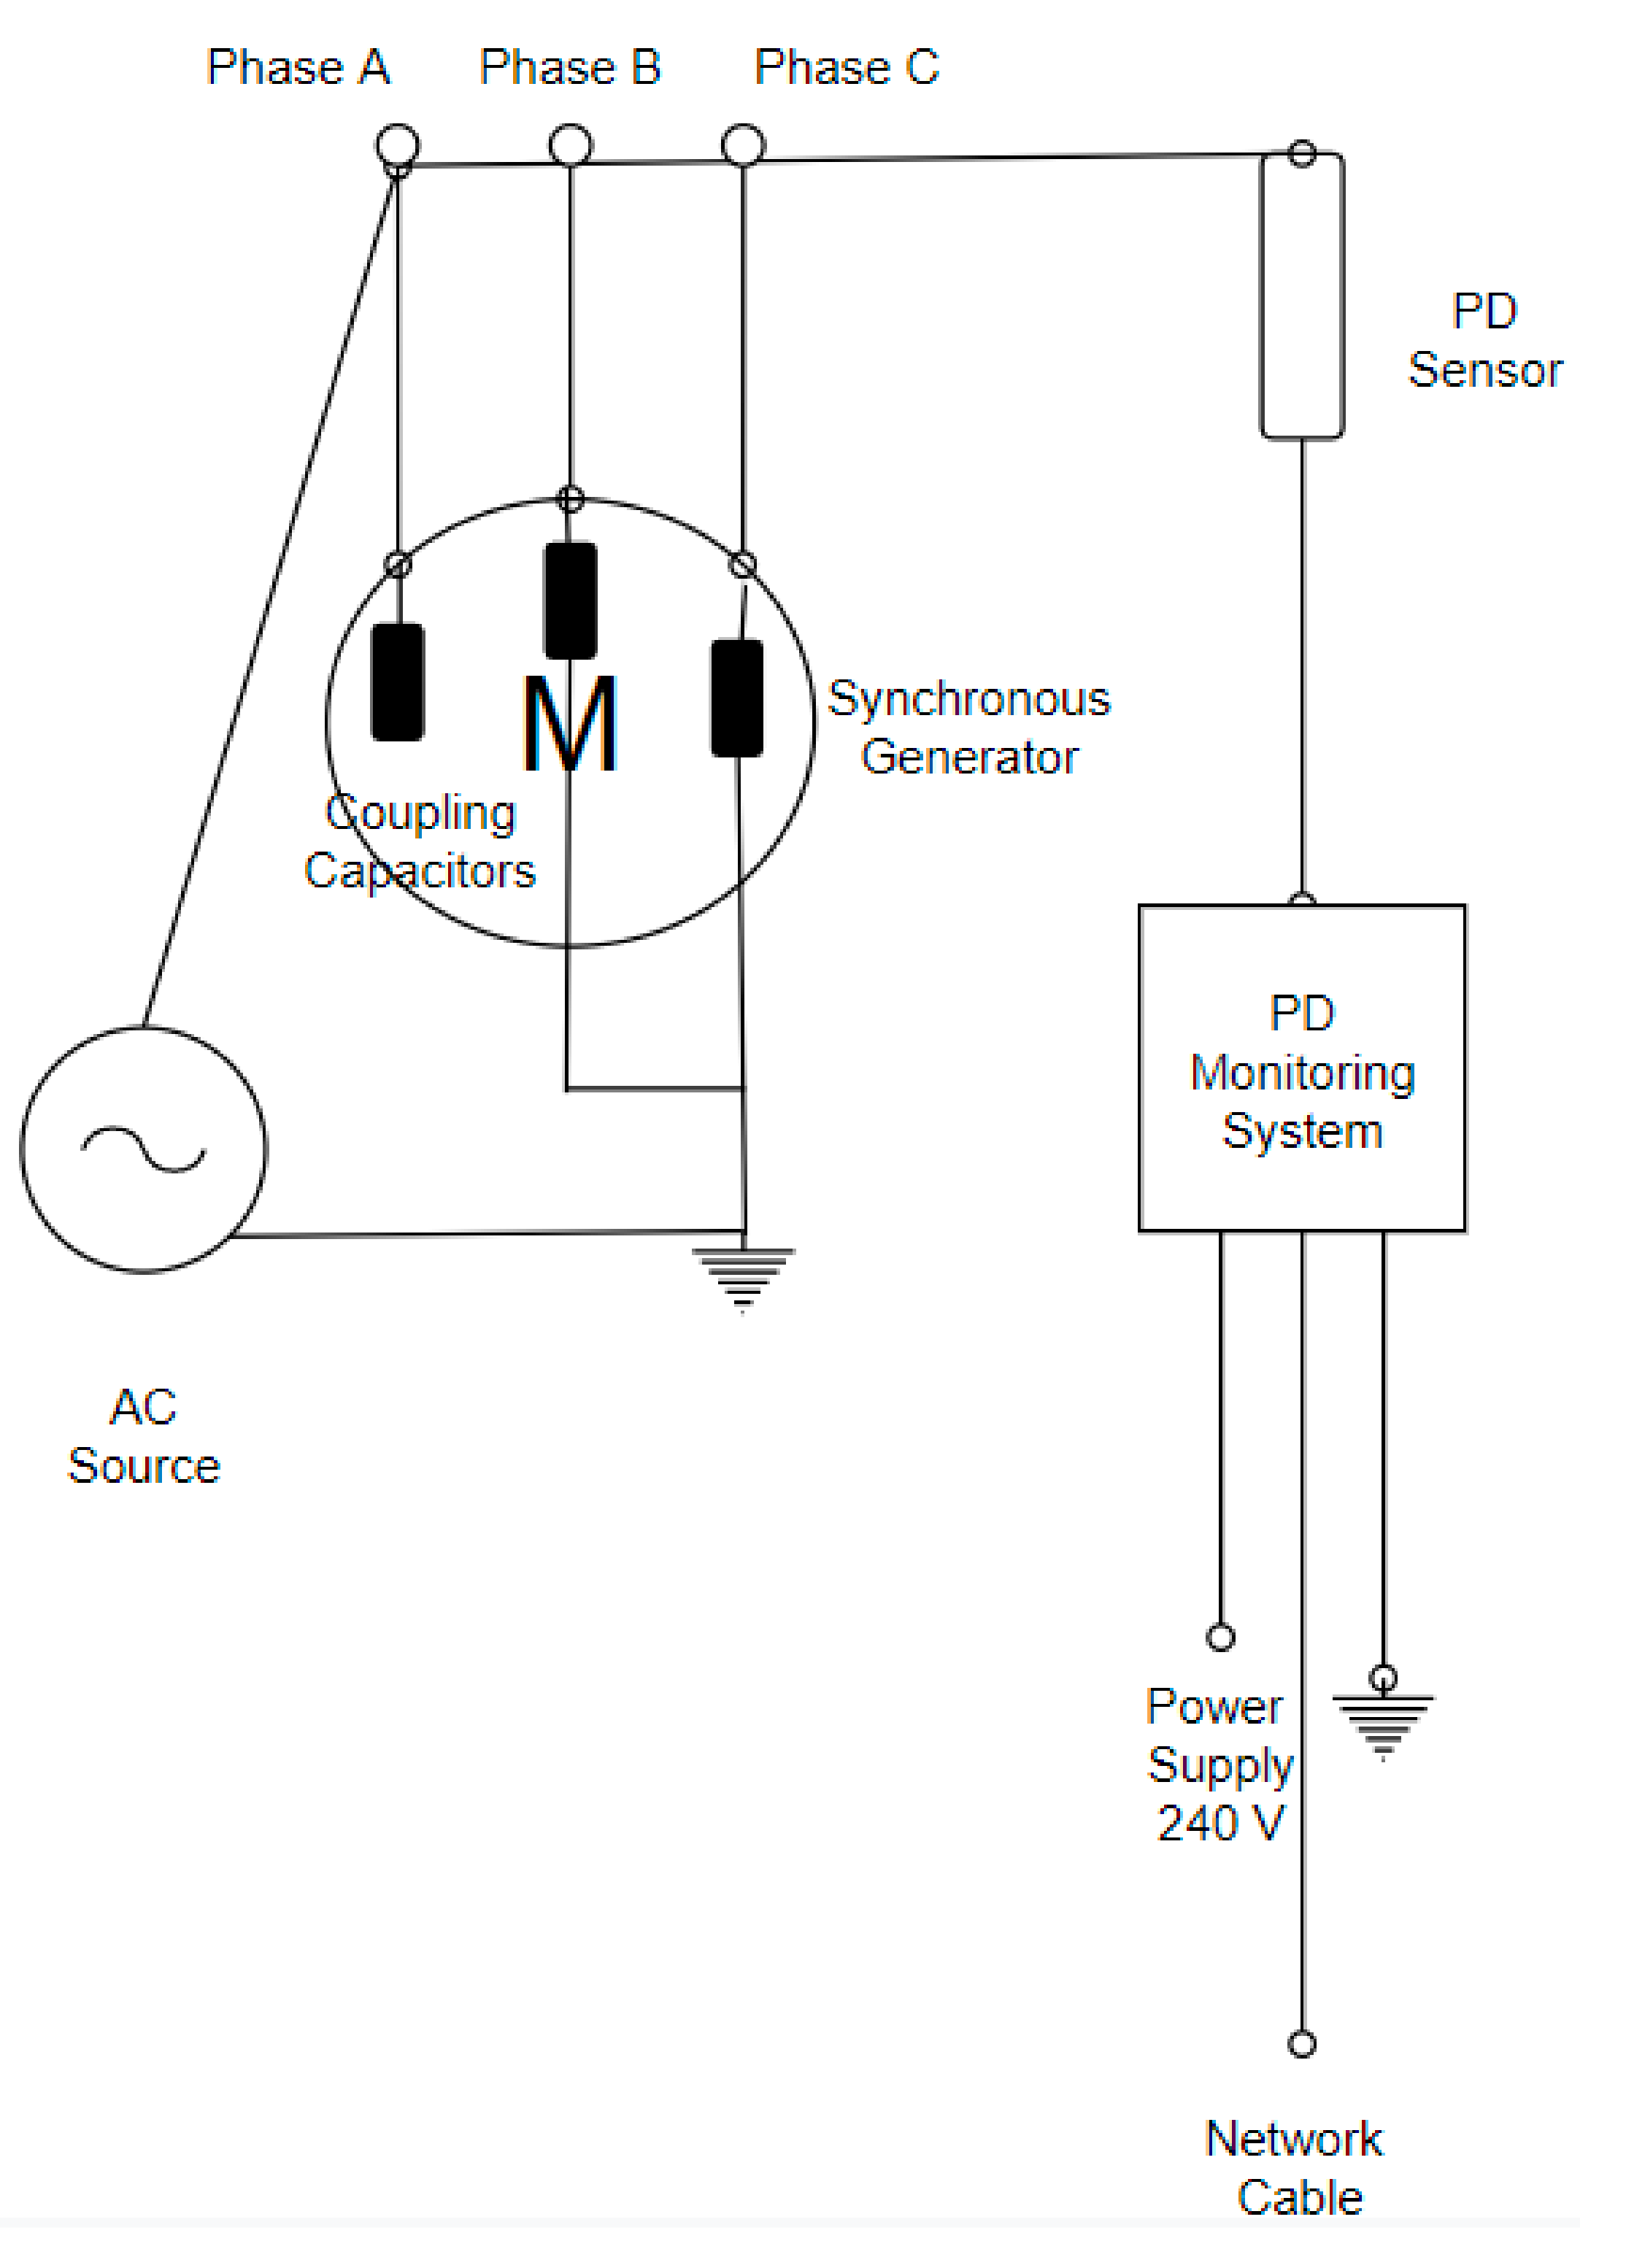
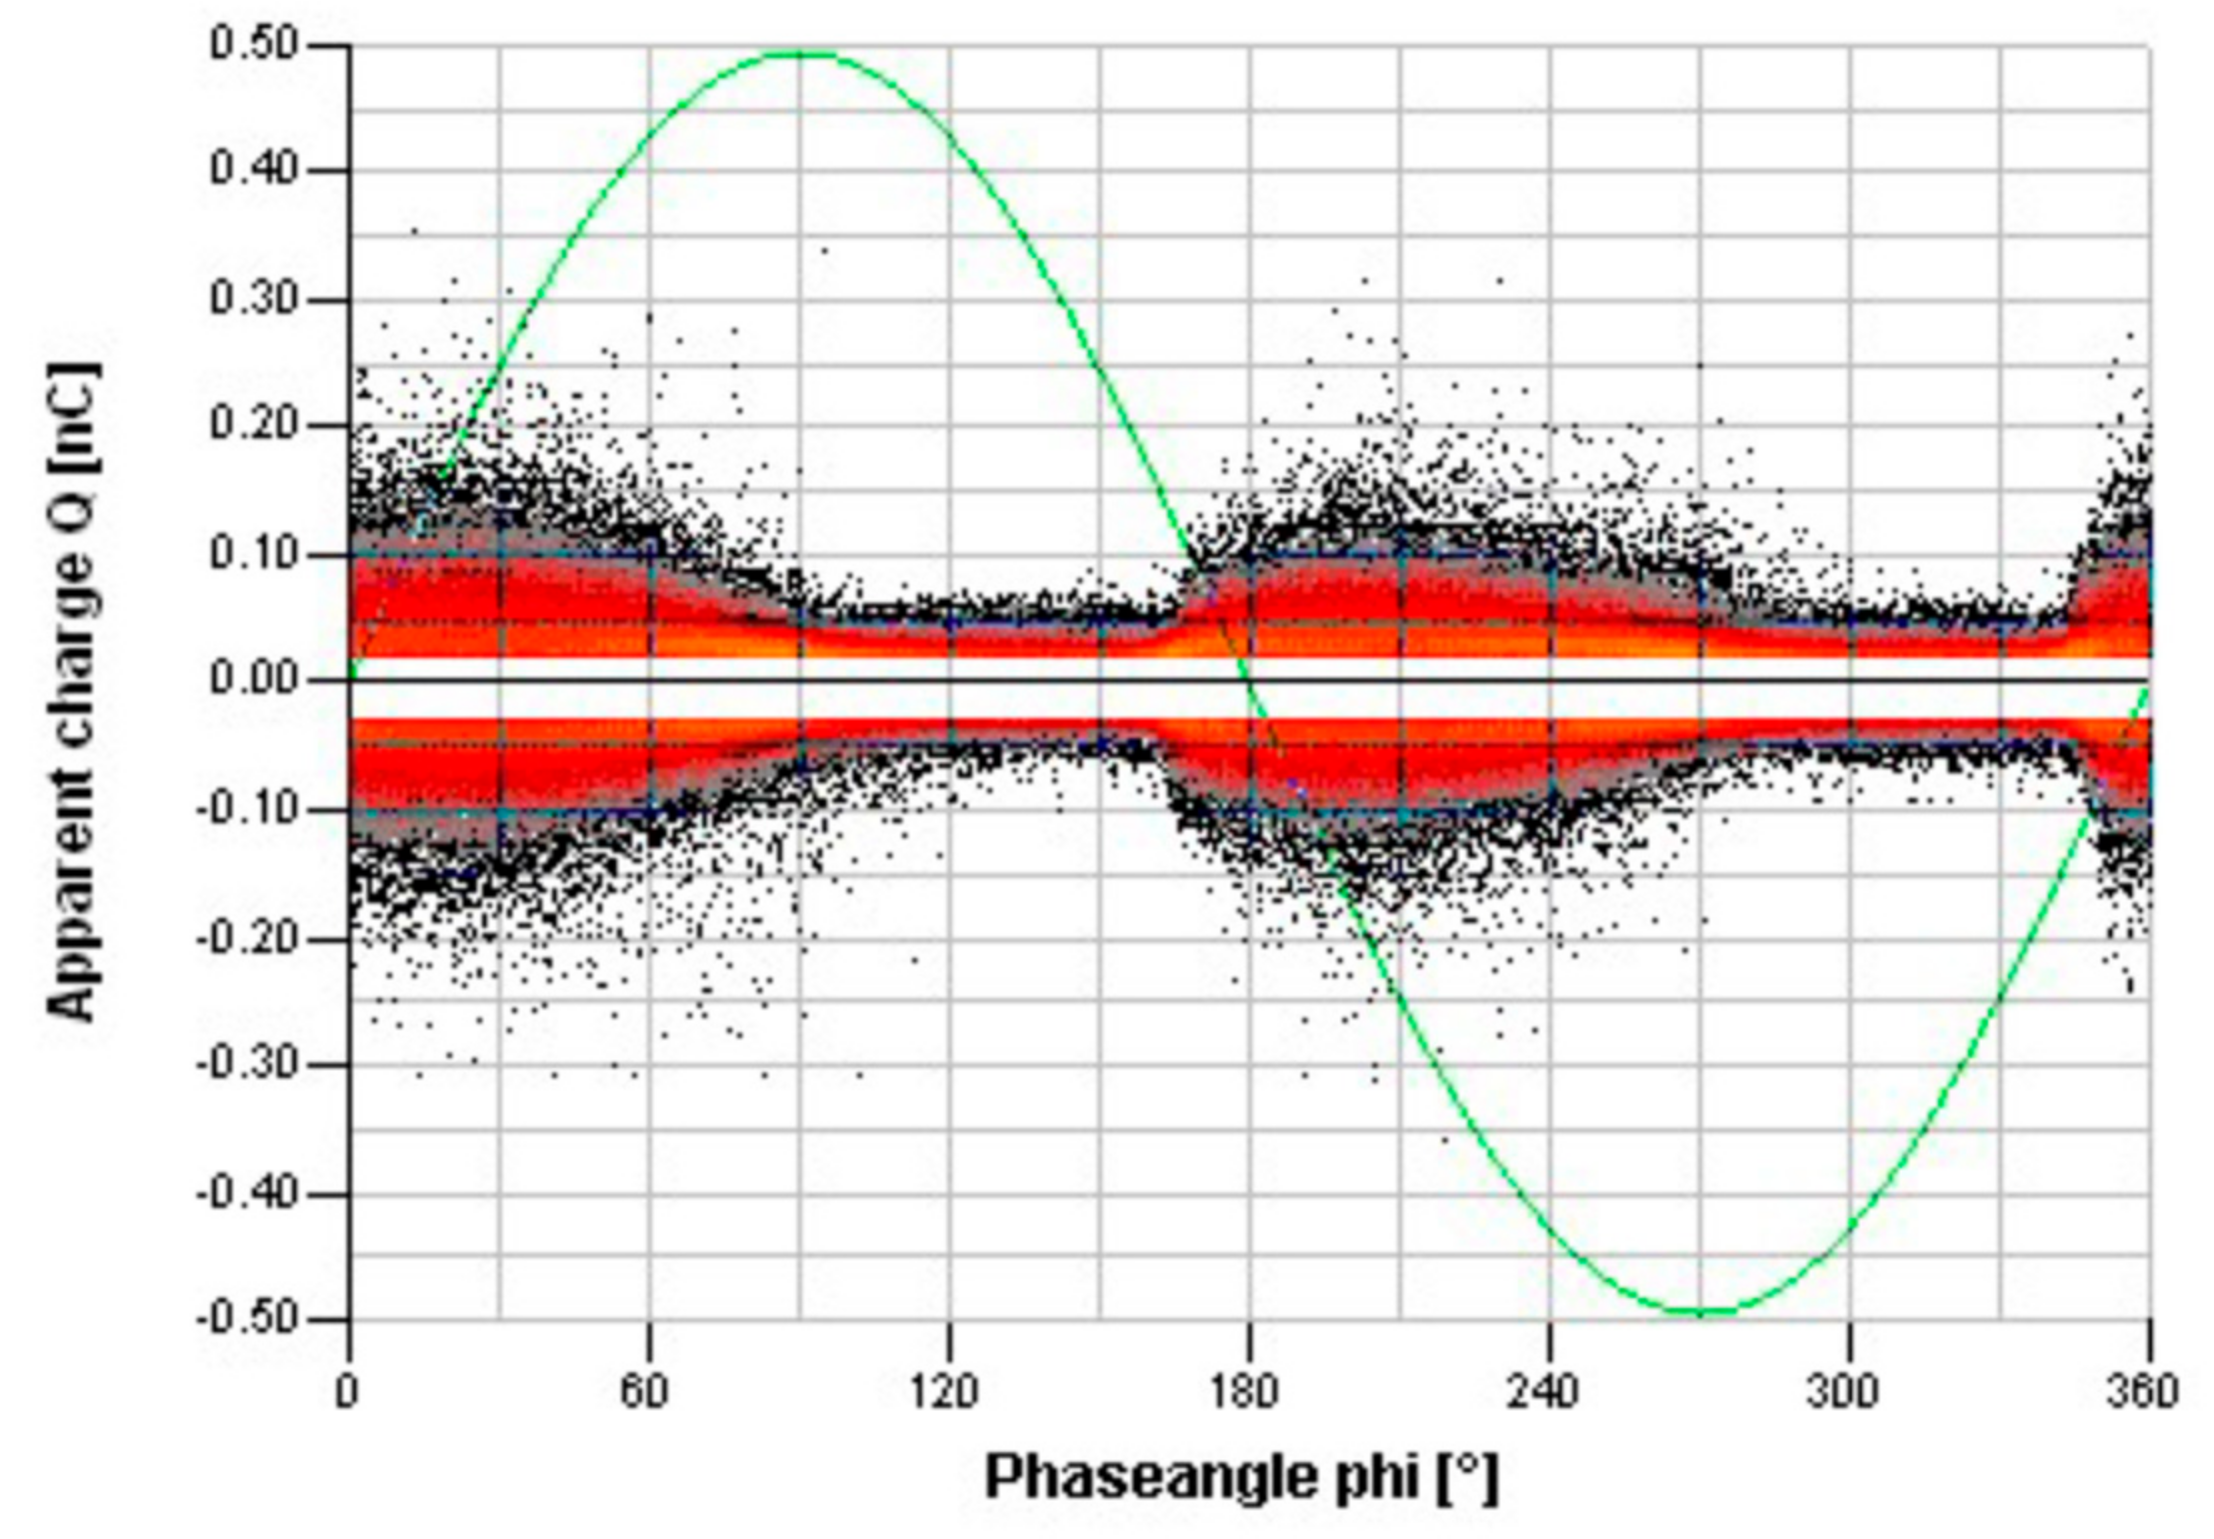
In this section, the PD measurements that were conducted on the aforementioned SG are analysed. Each phase of the generator was tested separately. The PD measurement was carried out on both sides of each generator phase: the phase was energized before the start point side, and the capacitive coupler was connected the high voltage side, Subsequently, this phase was energized on the HV side, and the capacitive coupler was connected on the star point side. The test voltage on each phase was increased in steps of 0.2 kV up to the nominal generator phase voltage. PD activity was measured and recorded in each step. The PD measurement results are presented in Phase-Resolved Partial Discharge (PRPD) diagrams, three-dimensional diagrams that show the PD activity related to the AC cycle.
The Online PD monitoring procedure dictates proper installation of PD couplers, a connection box, and the portable measurement device in order to perform manual or fully automatic periodic measurements.
Figure 5 shows the Online PD measurement arrangement. Coupling capacitors are connected to each phase of the SG, while Phase A is connected to the PD sensor, which sends the data to the PD Monitoring System. An ethernet cable connects the PD monitoring system to a personal computer where data are processed.
The measurements of PDs were conducted with an acquisition time of 20 se the Dead time was 7 μs and there were 1002 periods. It is possible to identify the nature of the different PDs through appropriate data-handling techniques. Surface PDs arise on the surfaces of end-windings and they have a low risk factor. Slot PDs arise inside and between insulation surfaces and slot walls due to the presence of air gaps and a lack of slot corona protection. Inner PDs have a very low risk factor. Online PD measurements at different reactive load and winding temperatures could confirm the presence of slot PDs, which can cause serious problems.
Figure 6 and
Figure 7 show the PD activity at one of the phases (phase A) of the SG occurring at phase voltage (PRPD) [
26]). The visualization of the graphs reveals a reduction in PD activity between 2010 and 2011 due to maintenance actions that took place on the insulation, as shown in
Figure 2,
Figure 3 and
Figure 4.
3. PD Model
3.1. Capacitive Model
Research would benefit from a PD model able to simulate the way epoxy resin reacts under varying conditions encountered in industrial applications. It is very important to investigate the PD activity on epoxy resin when there is a void inside the insulation, when this void becomes bigger or smaller, and when the voltage changes.
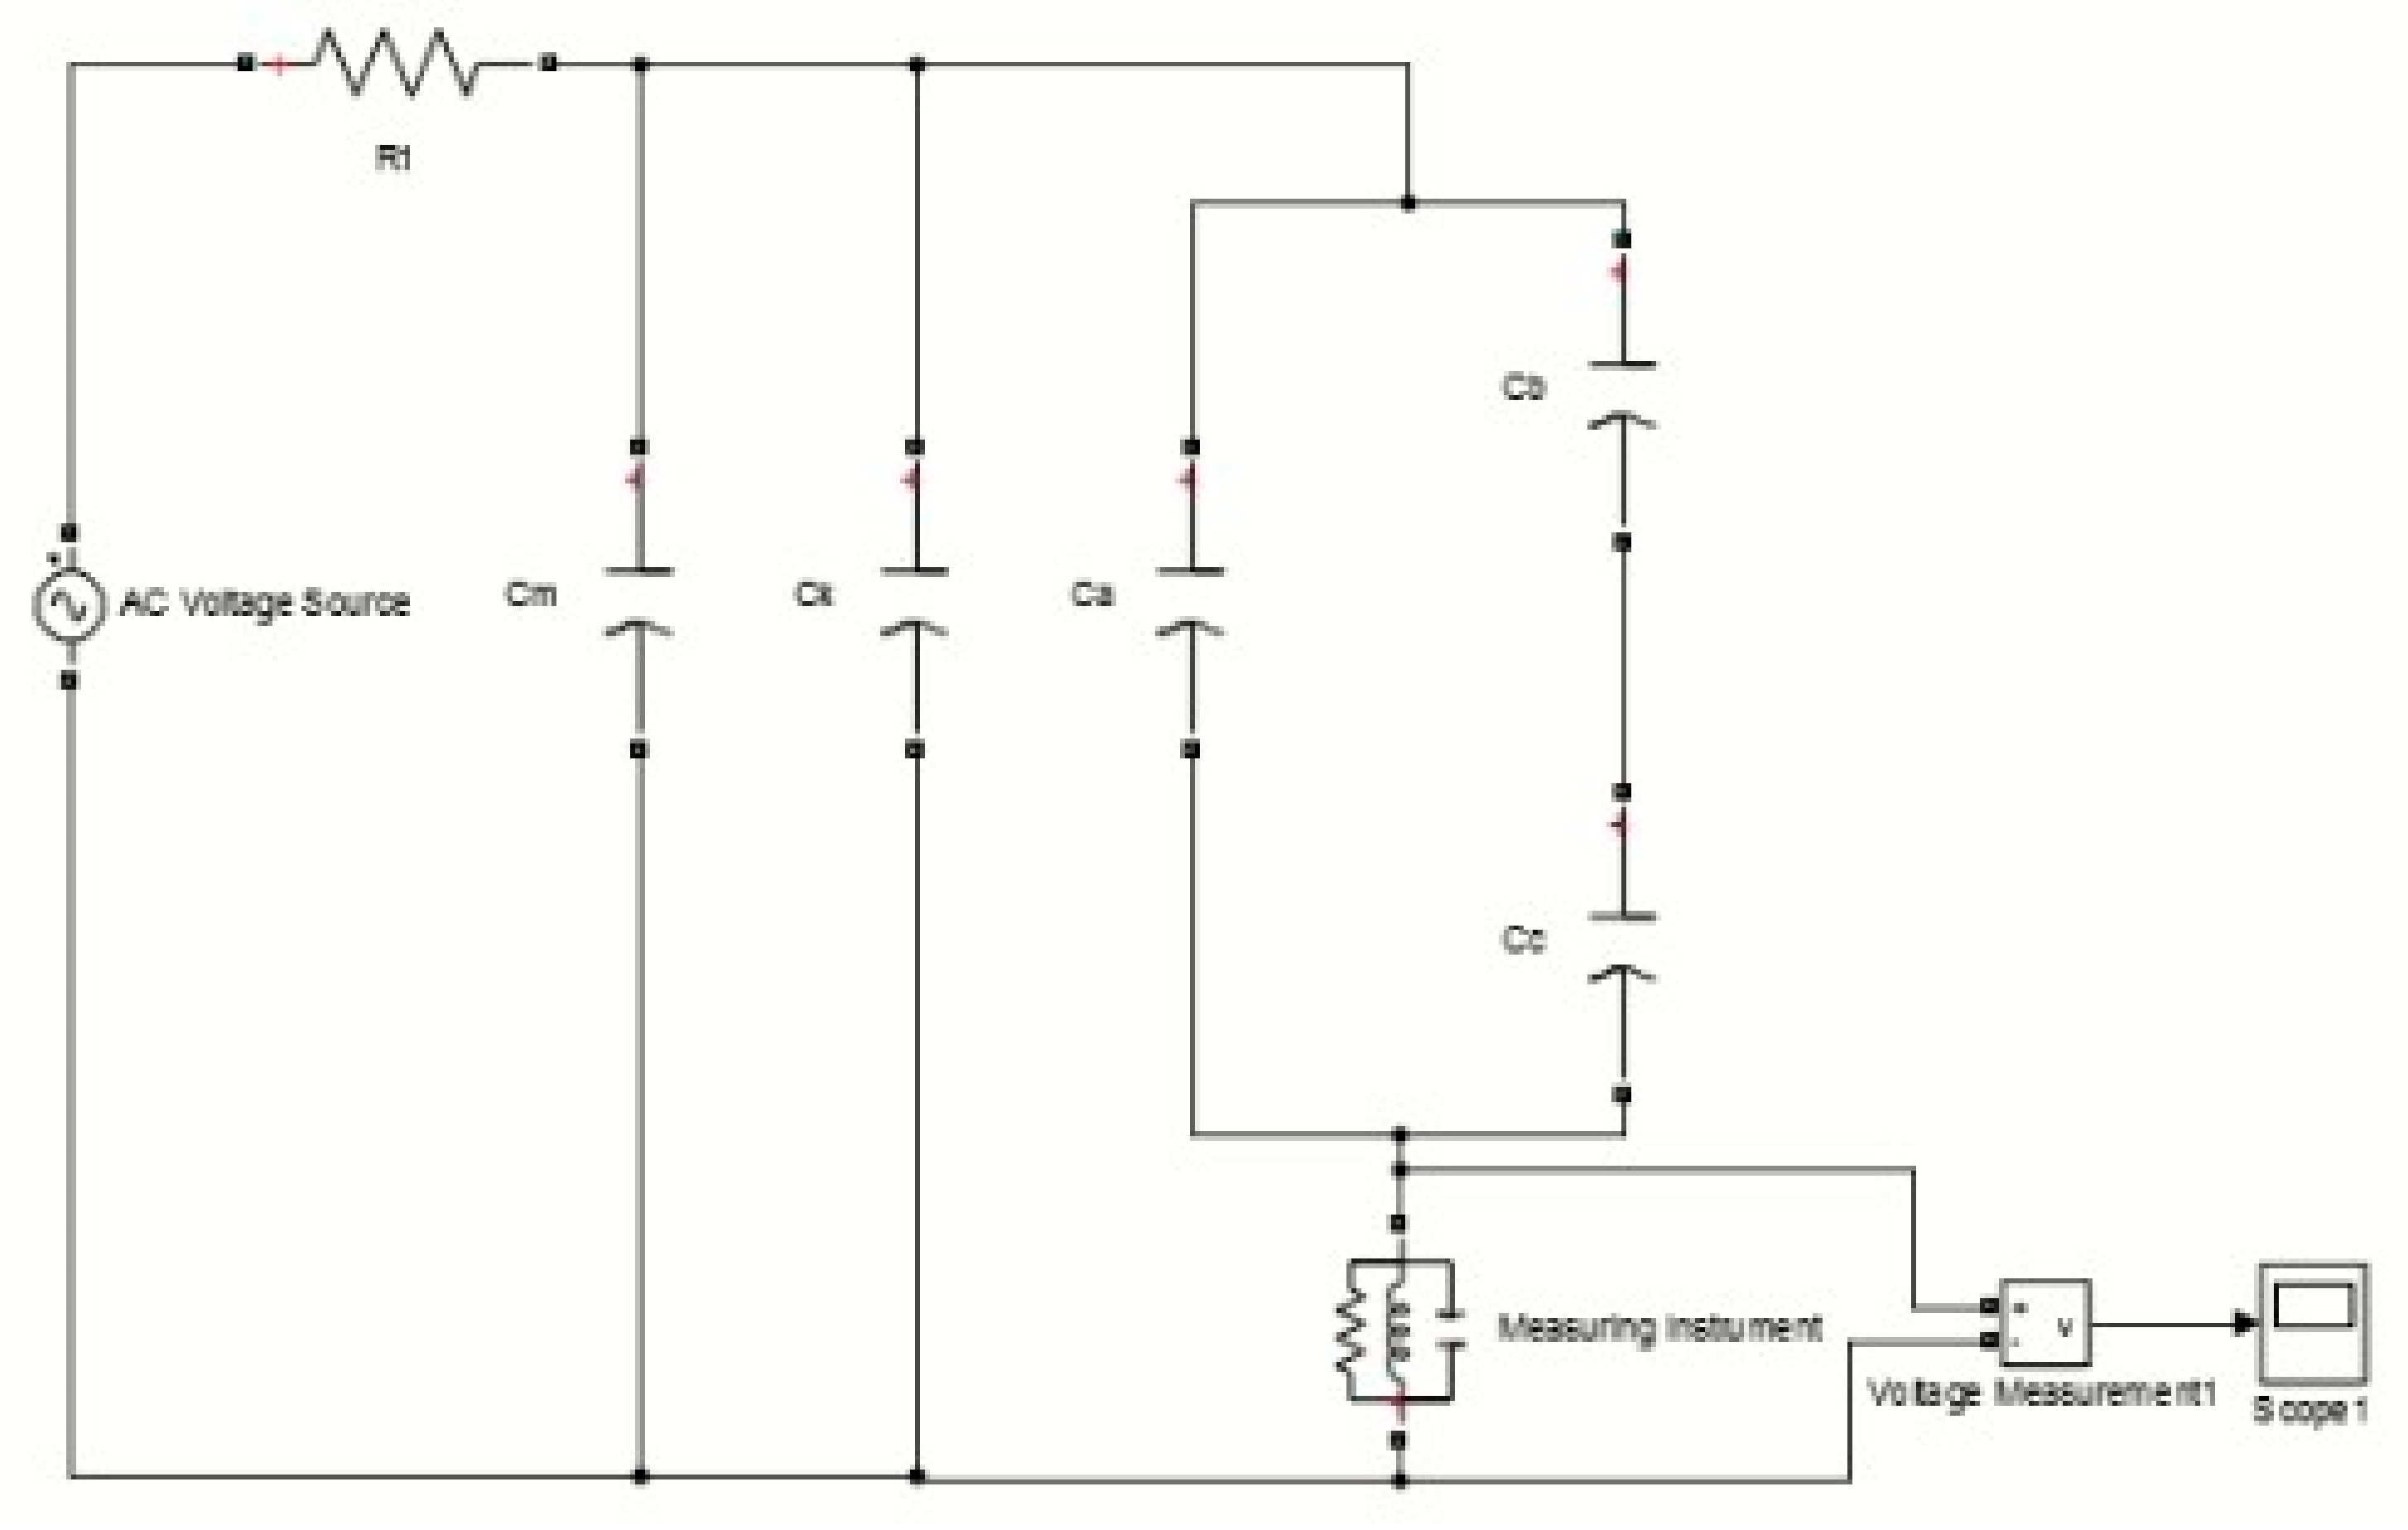
The PD model chosen is the capacitive model, a widely known and accepted model for PD studies in solid insulation materials. This model, referred to as the conventional method for detecting PD, is capable of describing mainly internal discharges, surface discharges as well as corona discharges. The capacitive model is an approximative representation of what happens inside an enclosed cavity. The classical capacitance model consists of three capacitors, which indicate the test object (
: Capacitance of the void in the solid material,
: Capacitance of the insulation material connected to the void,
: Capacitance of the remaining insulation material). The MATLAB/Simulink model (IEC 60270 Standard), which was created in order to simulate the PD, is shown in
Figure 8. The circuit consists of [
27,
28,
29,
30,
31]:
One AC High Voltage (HV) Source;
One resistor (R1), which plays the role of a HV filter and it is used in order to reduce the noise of the AC HV Source;
Two capacitors (: HV measuring capacitor,: Coupling capacitor, which must have low inductance in order to keep PD pulses low as well as act as a filter. These two capacitors consist of the most common sensor for measuring PDs in EM, as when a PD occurs, coupling capacitors provide the test object with a displacement current, which is measurable by the measuring capacitor and the MI);
Three capacitors, which indicate the test object;
One Measuring Impedance (MI) RLC, which is used in order to collect the PD signals.
The capacities
,
,
are calculated, considering the insulation material, by:
where
is the dielectric constant in vacuum,
is the relative permittivity (dielectric constant) of the insulating material,
is the length,
is the weight and
is the height of the test object,
is the radius, and
is the height of the void.
When AC voltage
is applied to the insulation material and it reaches a voltage higher than the insulation is able to withstand, a discharge occurs [
32,
33,
34]. The voltage
appears in the void according to [
33,
34]:
When a partial discharge takes place, a charge will be transferred from one side of the void to the other, and the voltage due to the PD (
) will appear on
. The charge is too small to be measured; therefore, instead of the charge, the apparent charge is measured, and it is calculated by:
3.2. Simulation Results
Table 1 shows the simulation parameters for the epoxy resin. Tests specifying the values for measuring the capacitor, coupling capacitor,
,
, and
were conducted in addition to consulting other research work [
27,
28,
29,
30]. Epoxy resin is the insulating material used in the aforementioned SG and thus used in the capacitive model.
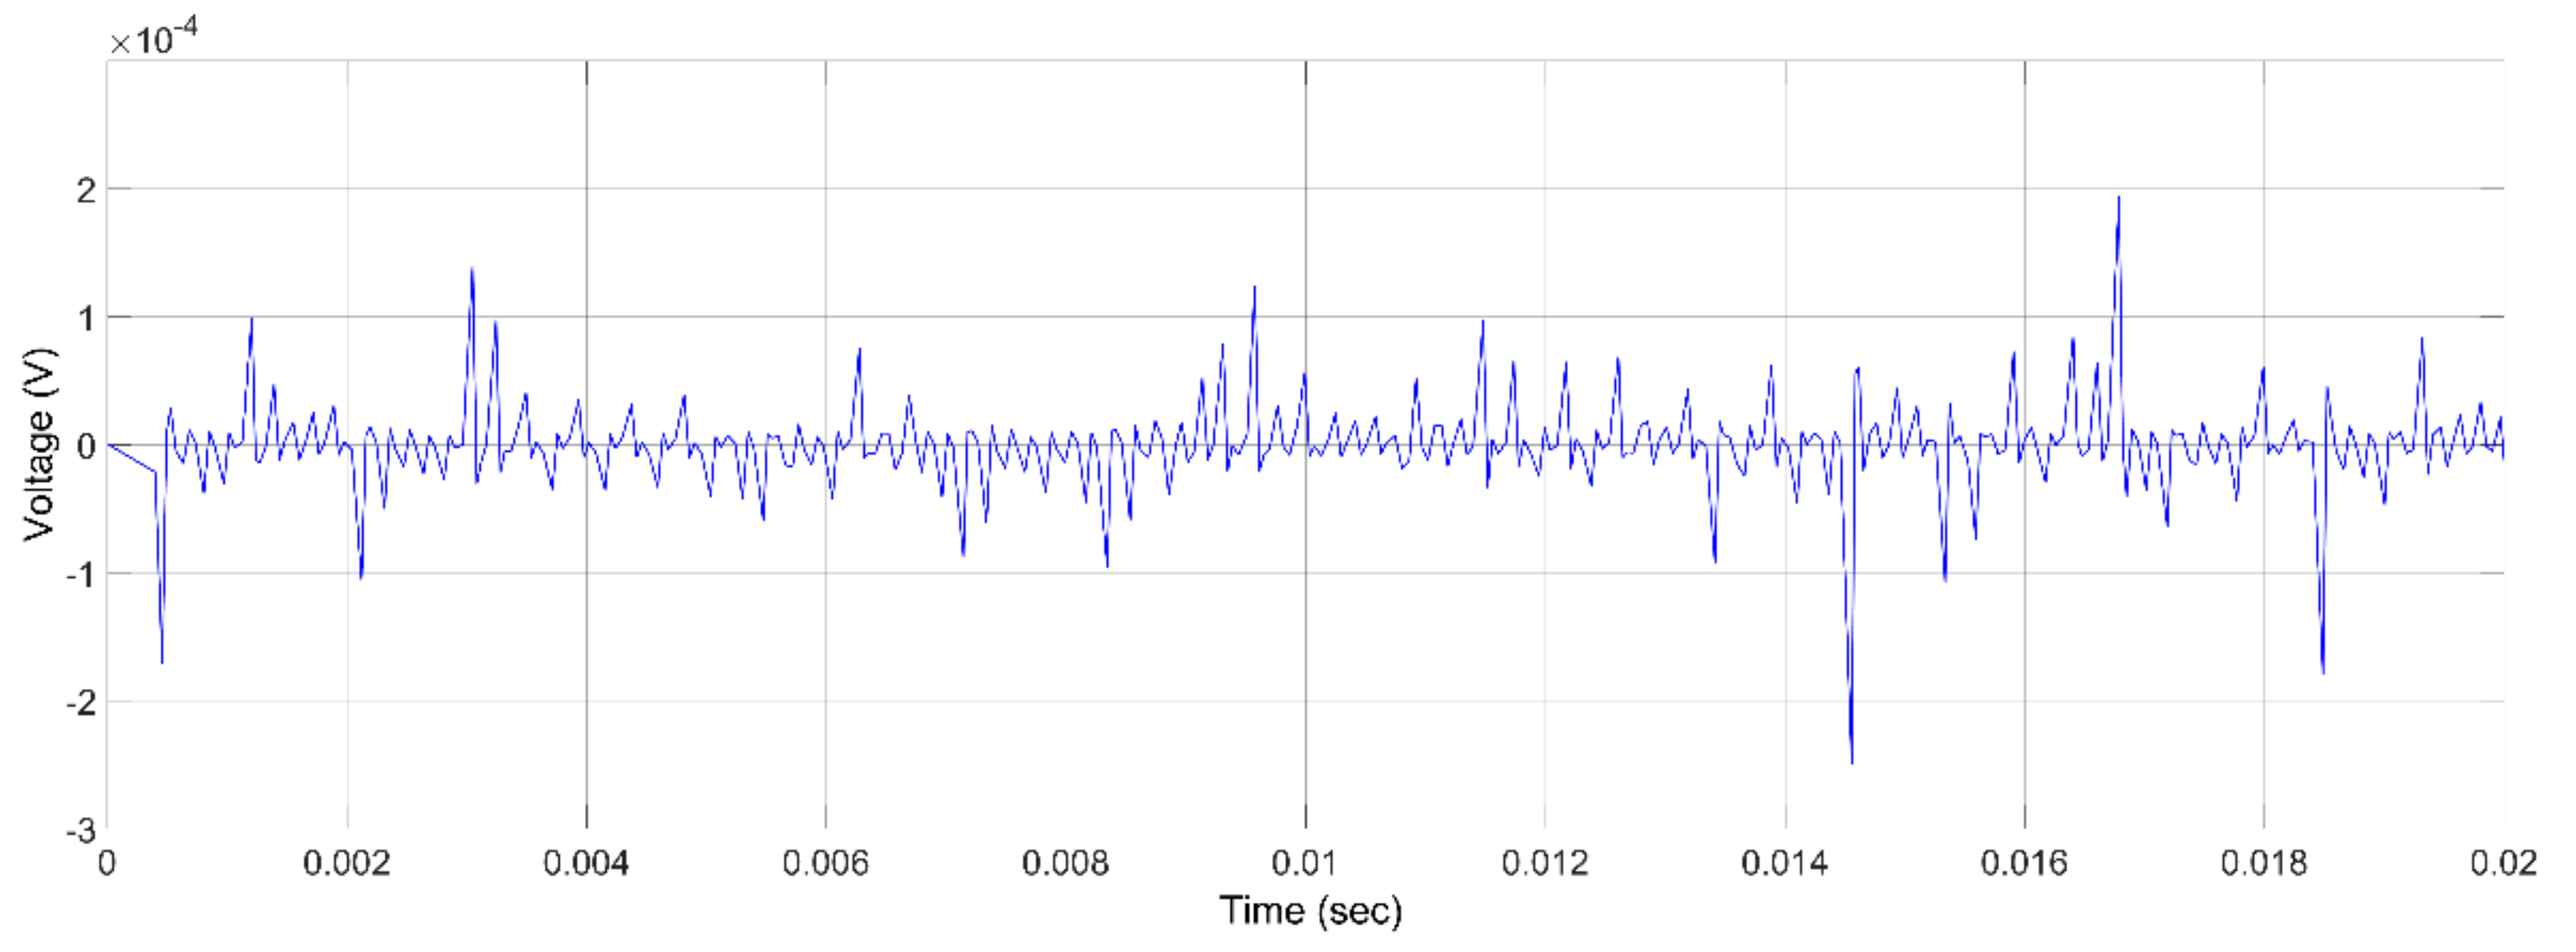
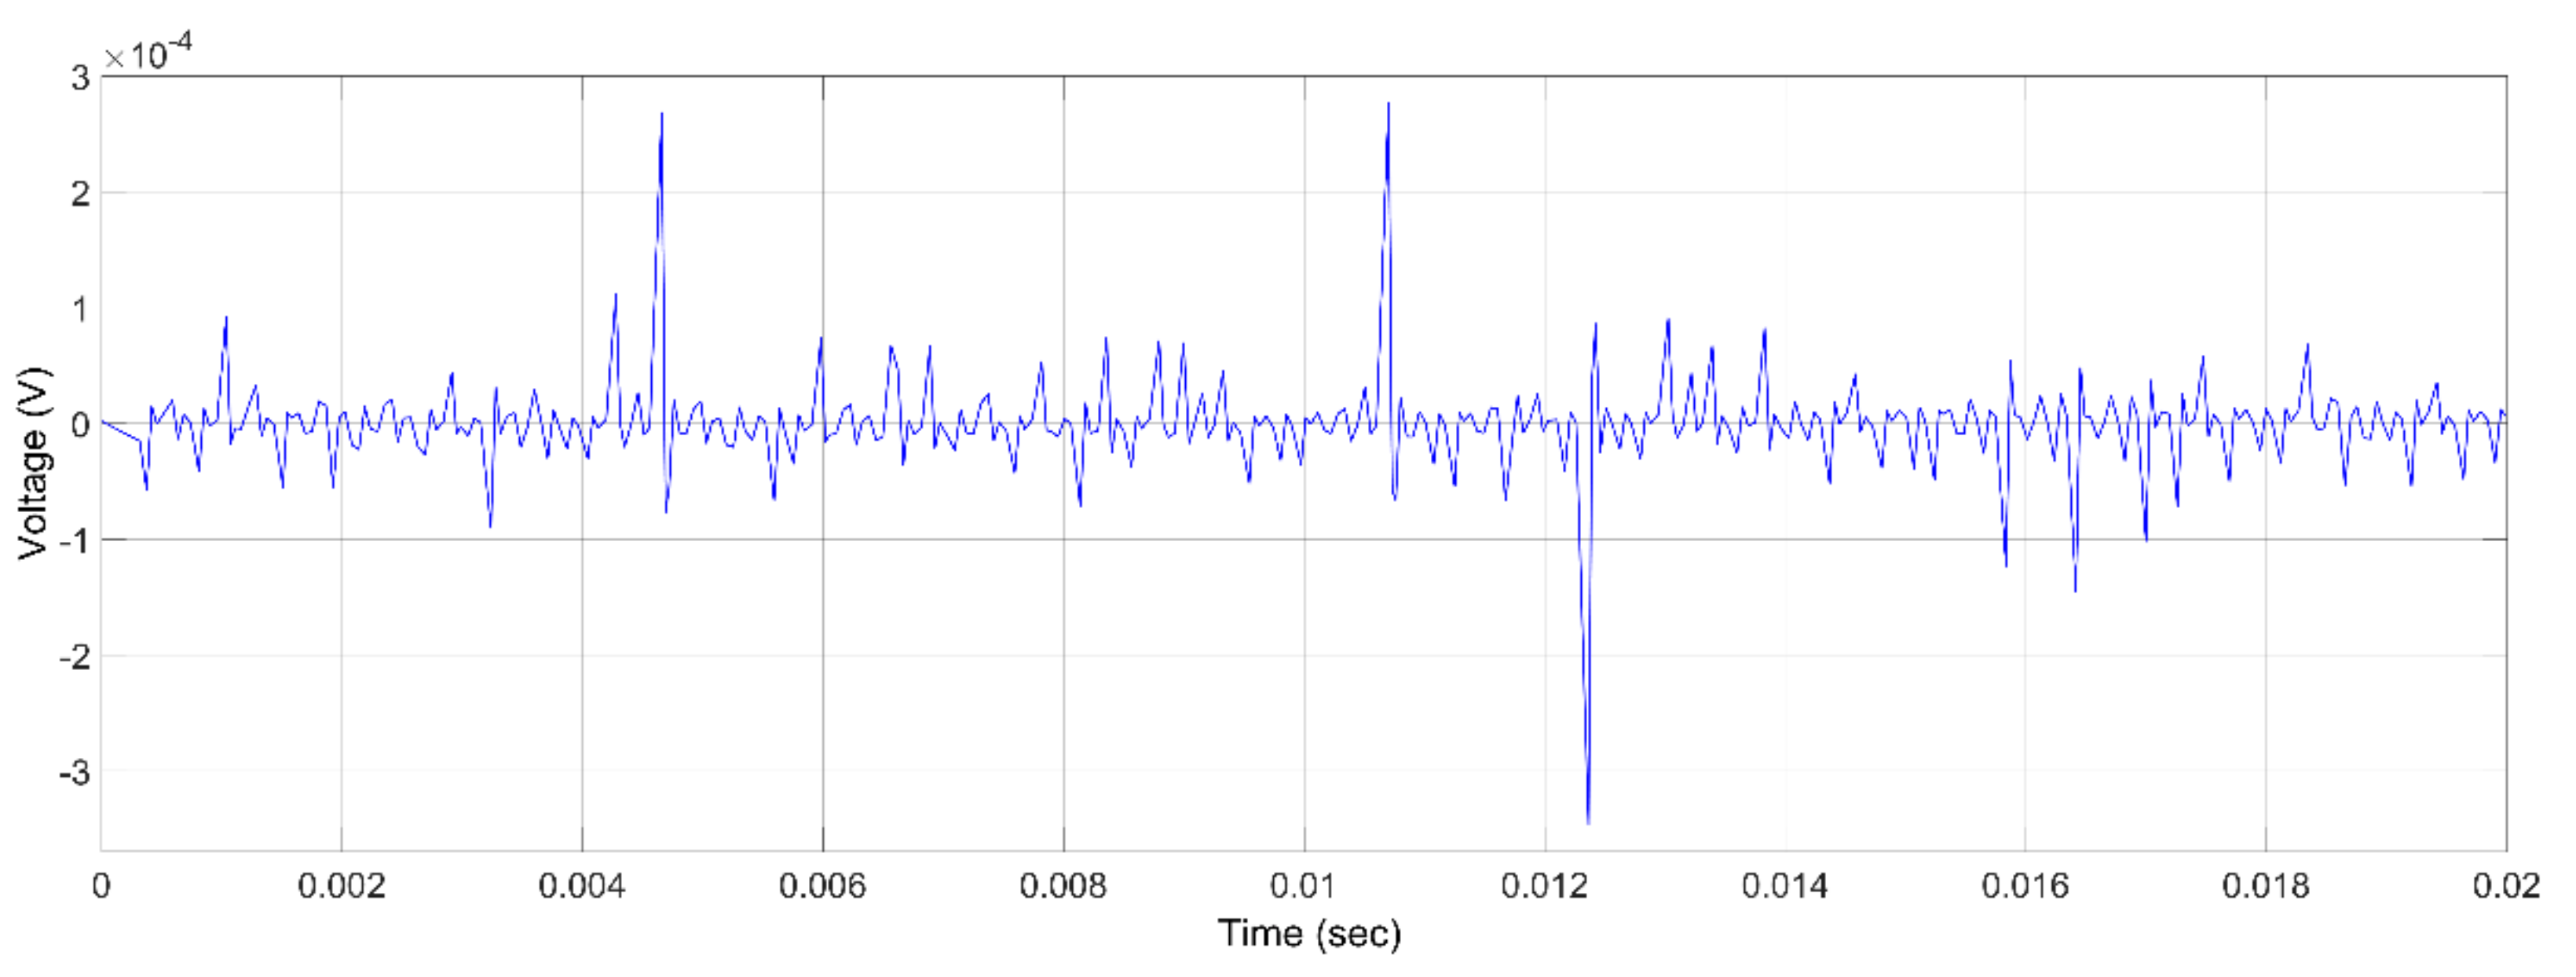
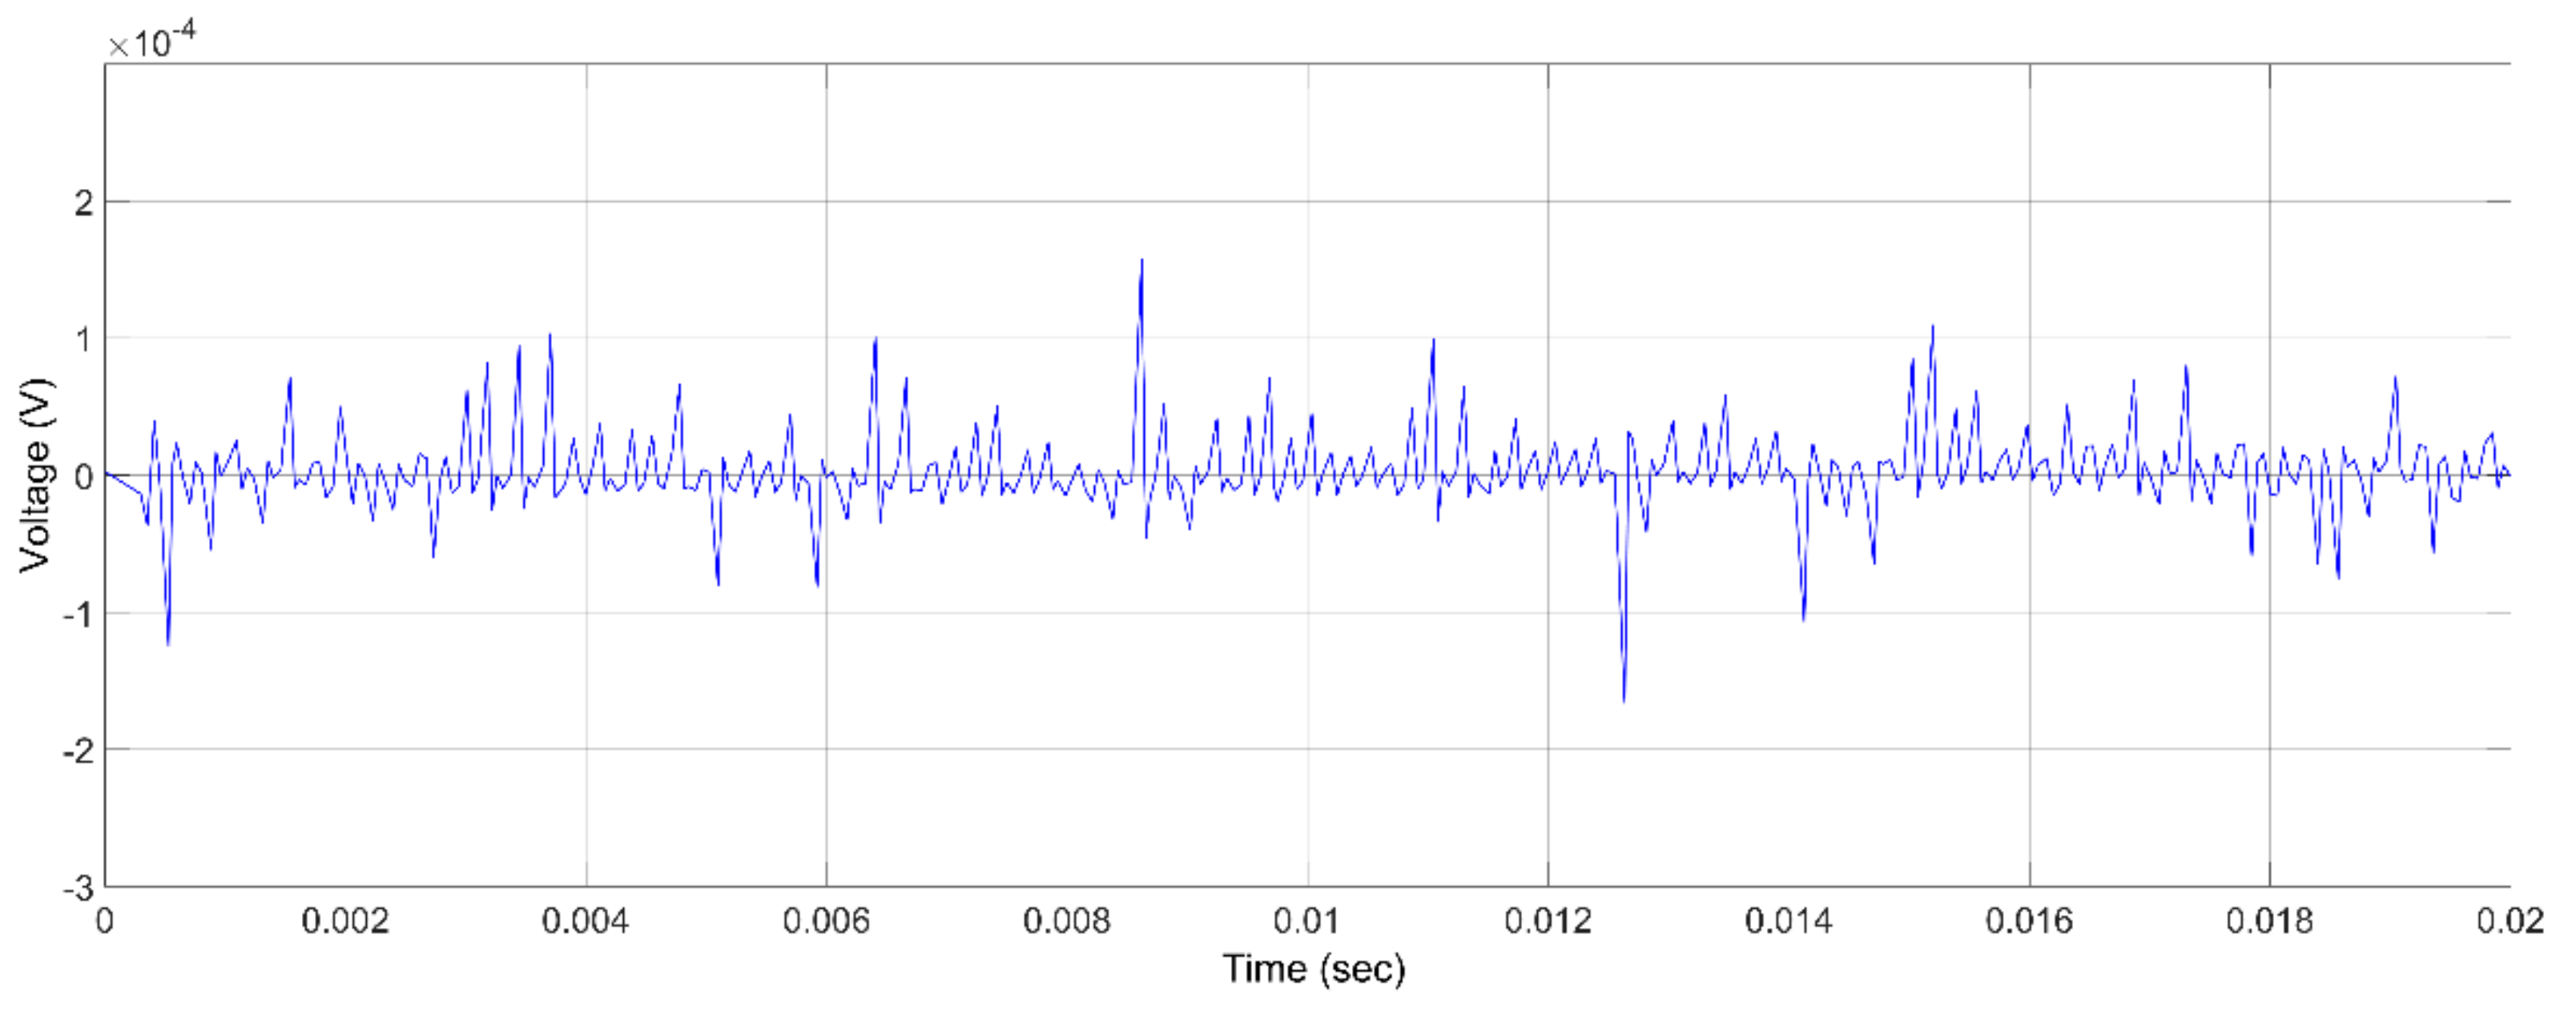
The applied voltages, used for the simulations, were the same as the voltages used in the PD measurements of the SG, described below. PD characteristics do not appear for a long time period and that is why the simulation time was chosen to be 0.02 s. Some results of the simulations are shown in the next figures.
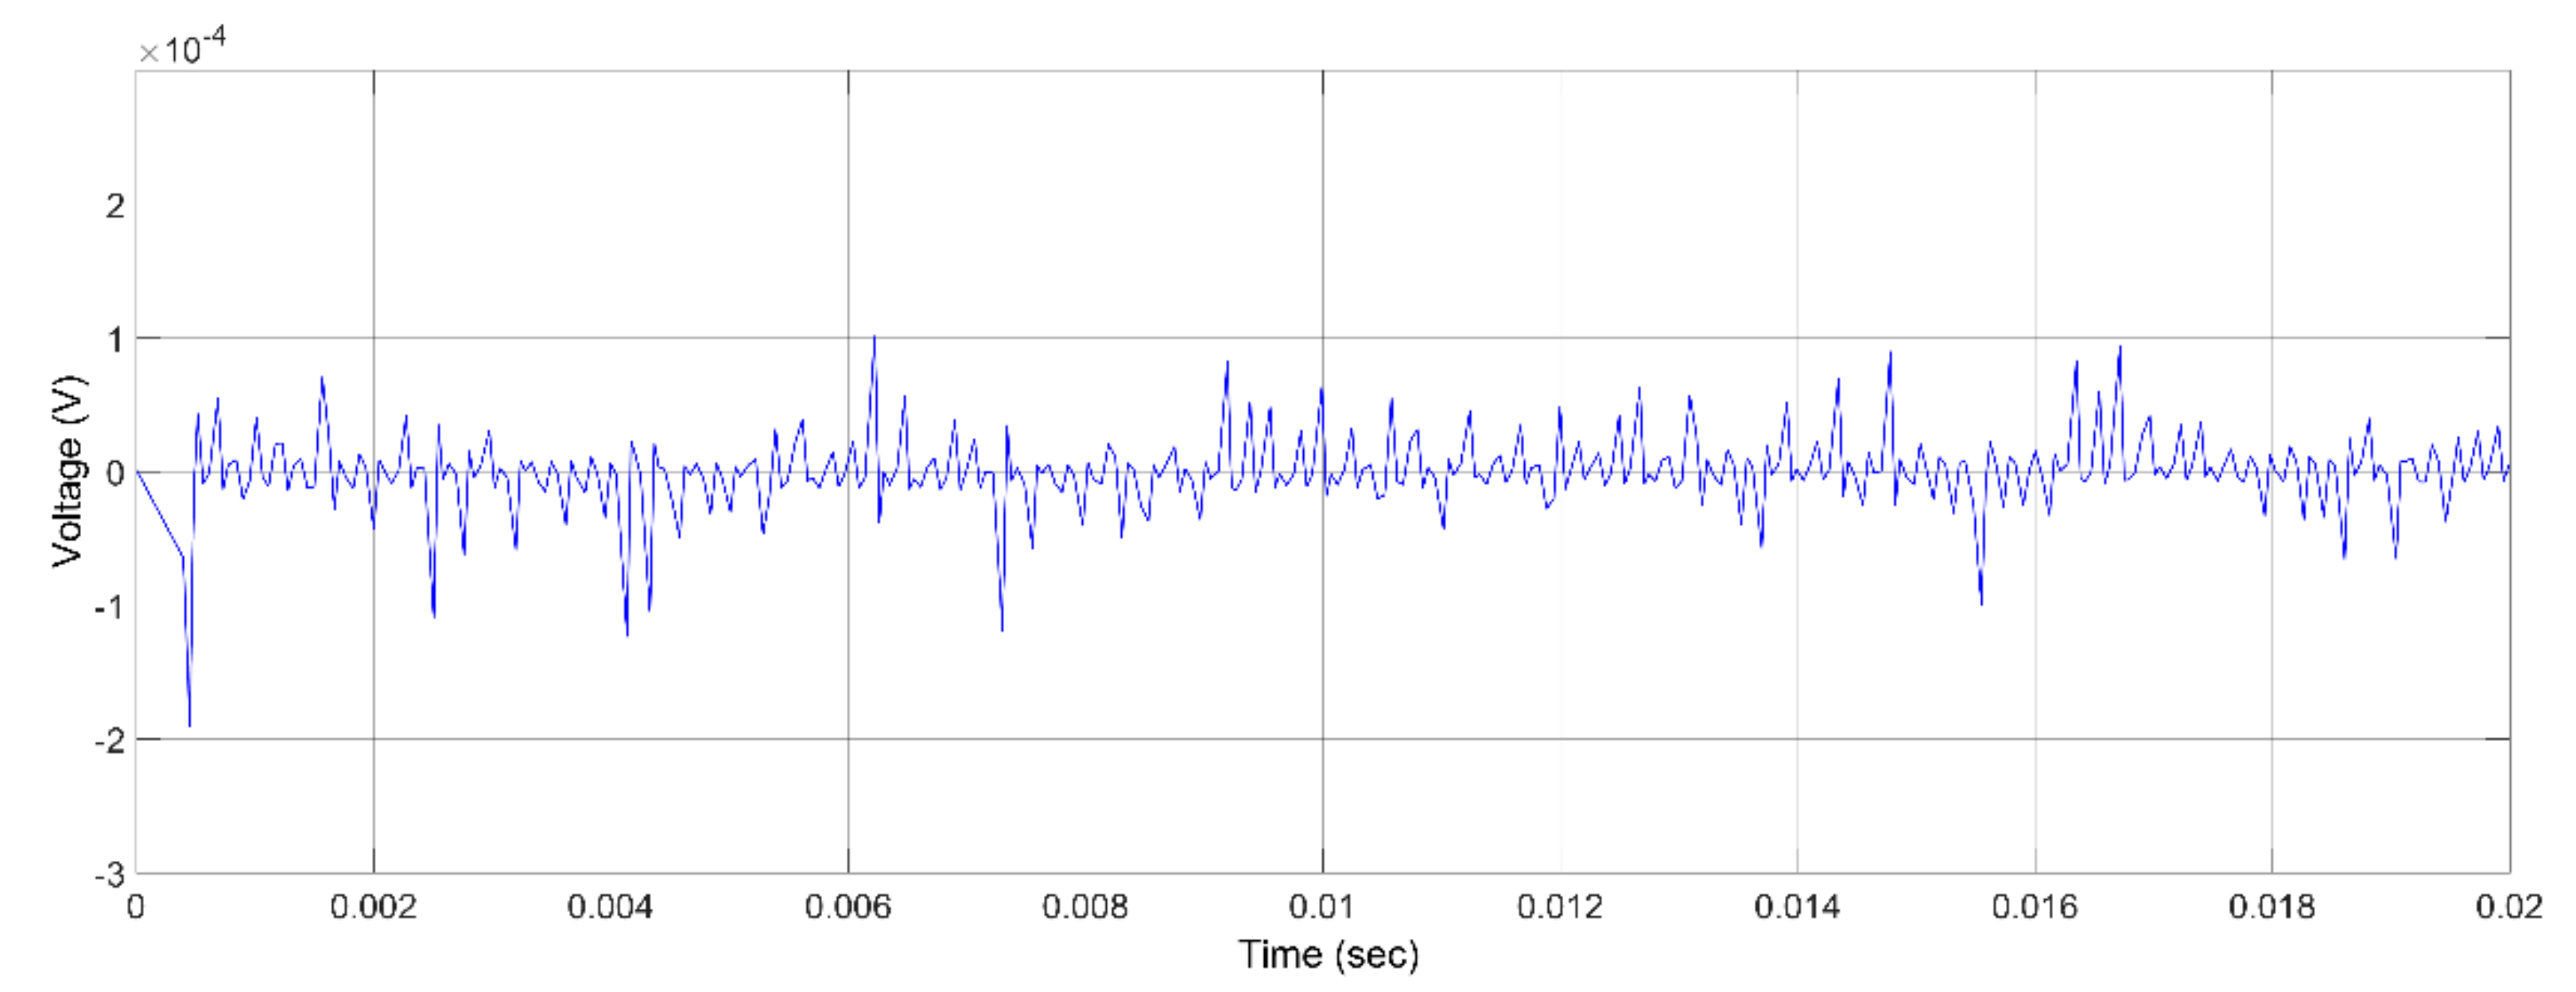
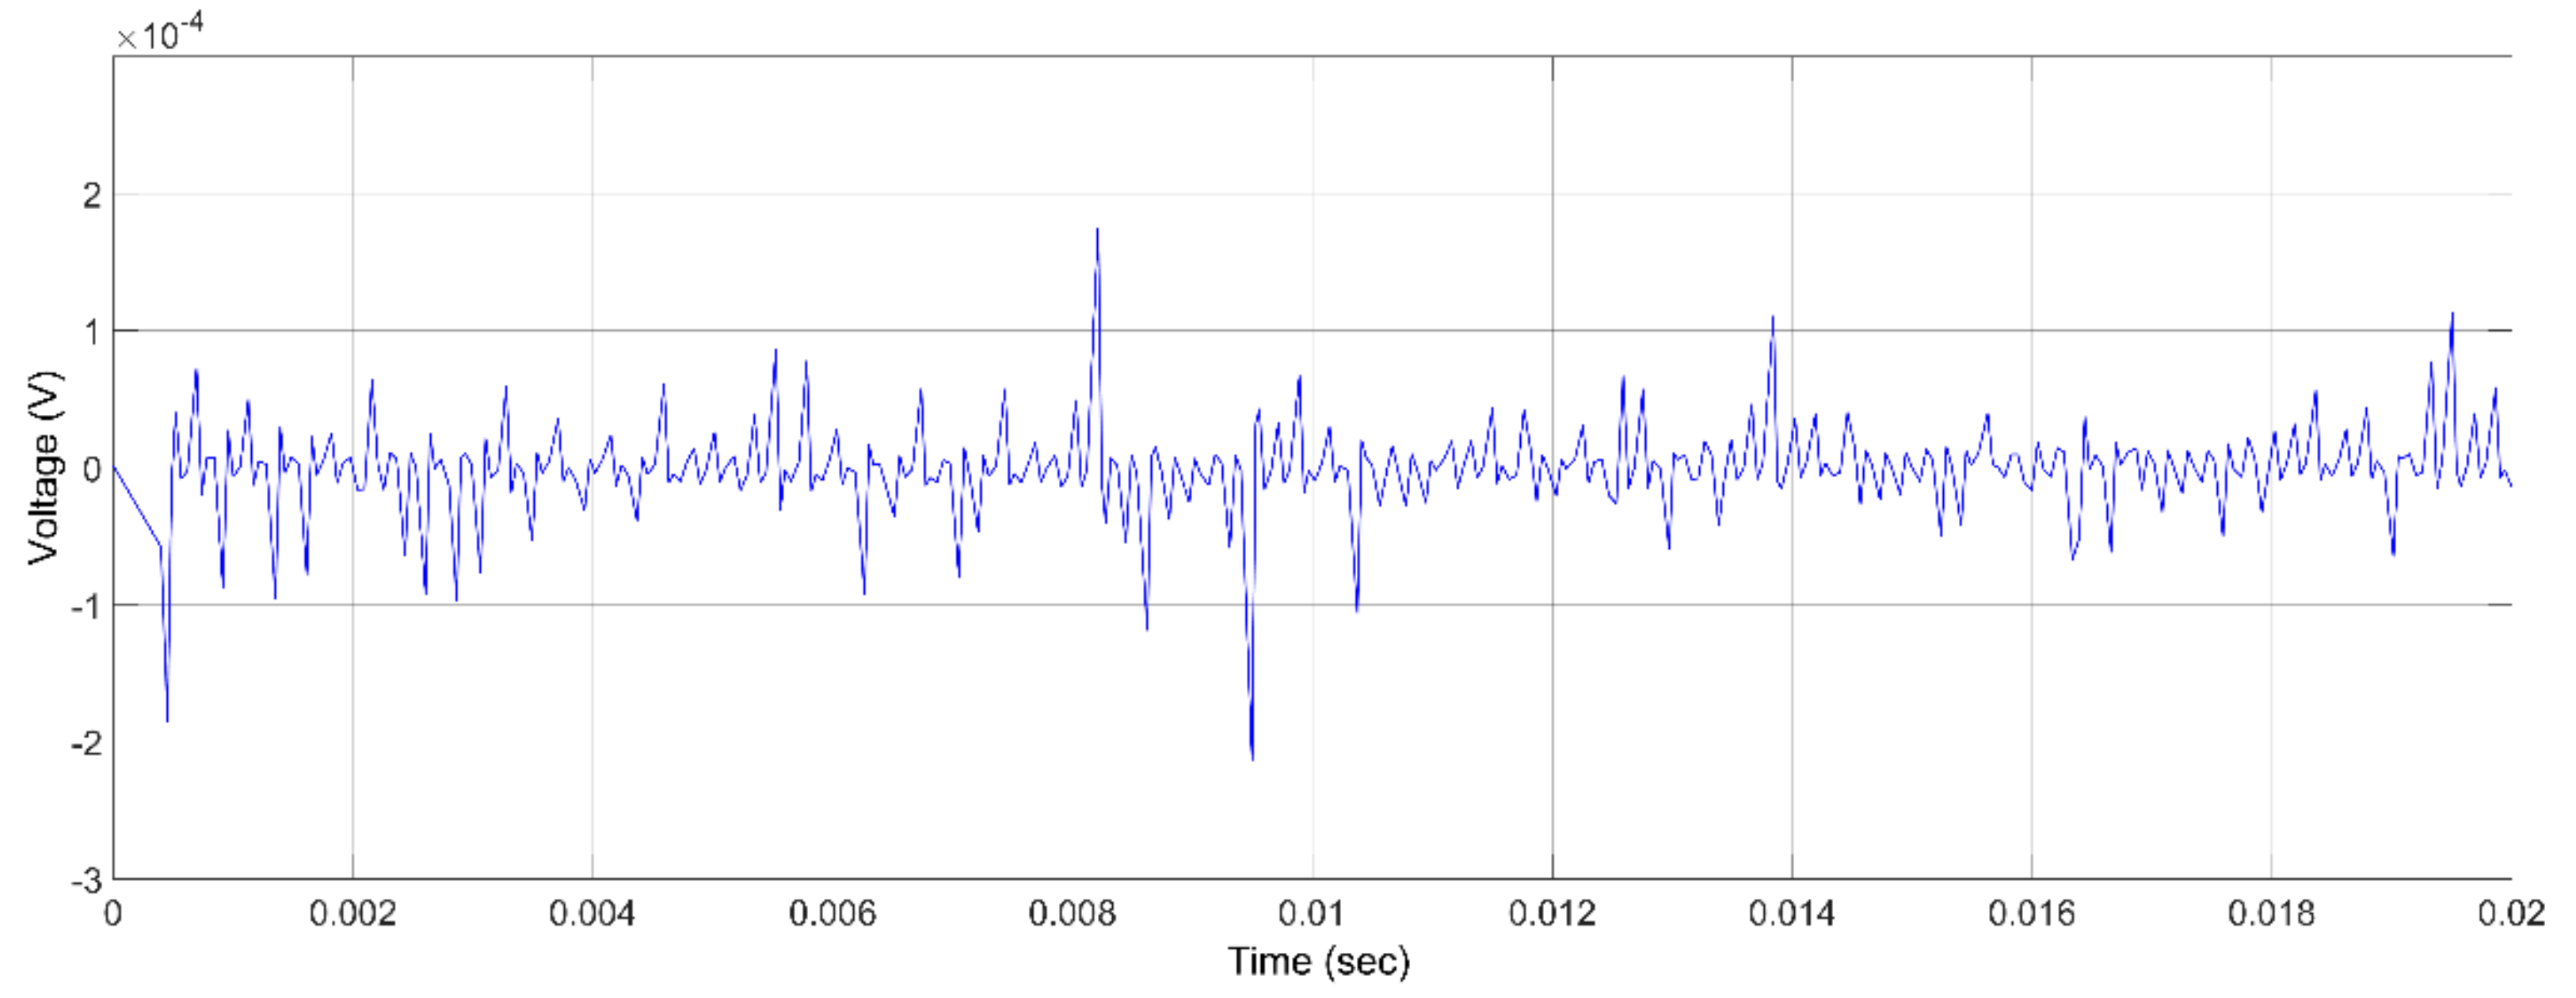
Figure 9,
Figure 10 and
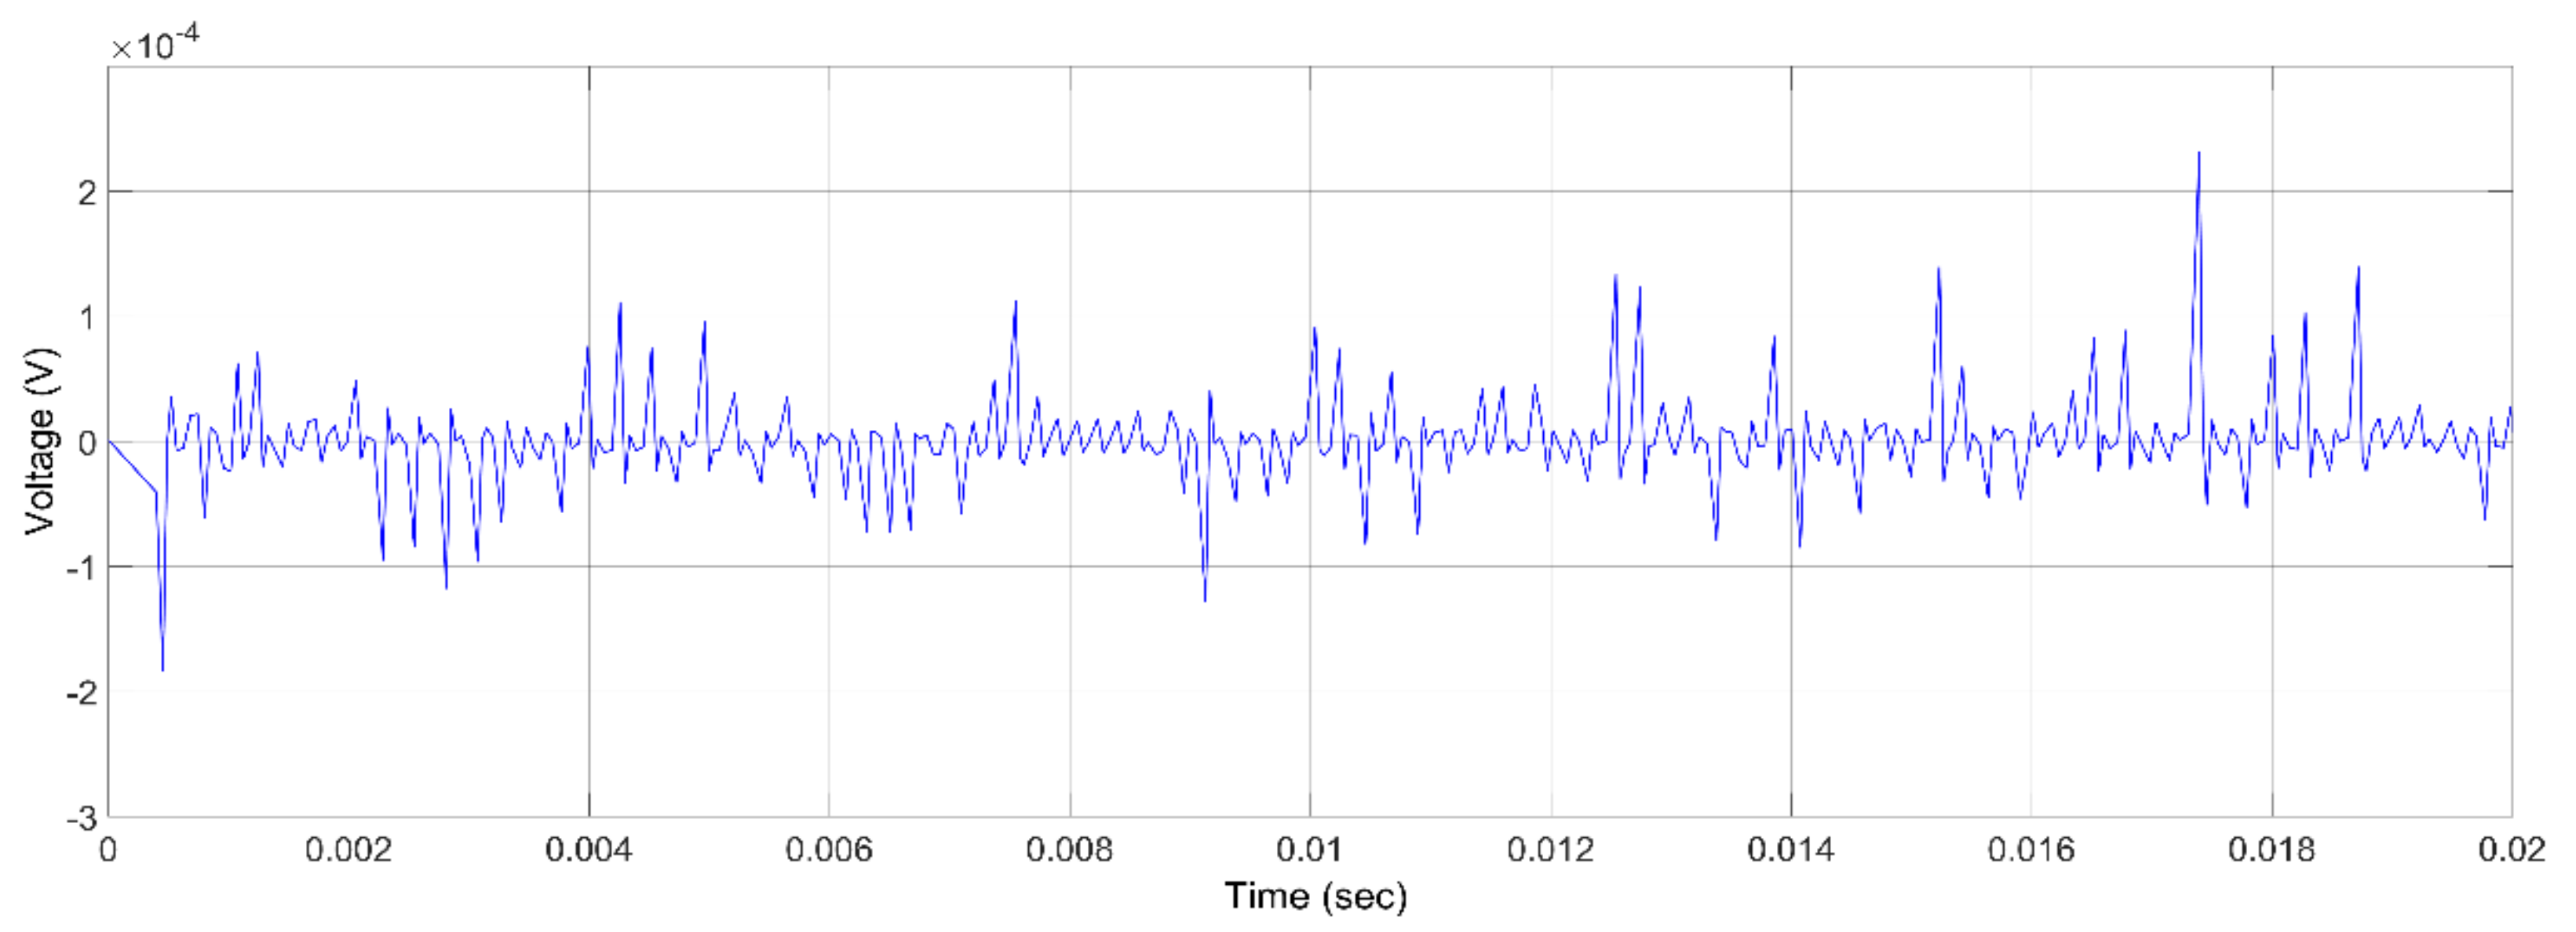
Figure 11 show the resulting PDs at 5 kV, 10 kV, and 15 kV respectively. PDs are shown as spikes in these figures. More specifically, in
Figure 9, the most important spikes are at 0.015 s, 0.017 s, and 0.019 s, in
Figure 10, the spikes are at 0.0005 s and 0.017 s, and in
Figure 11, the spikes are at 0.005 s, 0.011 s, 0.0125 s, and 0.0165 s. It is obvious, that while increasing the applied voltage, both the number and the amplitude of the PD increase.
3.3. Simulation Results—Half Height of the Void
The same simulations were performed with some changes in the volume of the void. The height of the void varied by half the value and the radius was kept stable.
Table 2 shows how the capacities change according to the variable volume of the void. As mentioned above, in
Figure 12, the most important spikes (PDs) are at 0.0005 s, 0.0037 s, and 0.018 s, in
Figure 13, the spikes are at 0.0004 s and 0.0022 s, and in
Figure 14, the spikes are at 0.0003 s.
3.4. Simulation Results—Half Radius of the Void
The same simulations were performed with the height of the radius changed by half and the height kept stable.
Table 3 shows how the capacities change according to the above changes. As mentioned above, in
Figure 15, the most important spikes (PDs) are at 0.0005 s, 0.001 s, and 0.018 s, in
Figure 16, the spikes are at 0.0004 s, 0.008 s, and 0.009 s, and in
Figure 17, the spikes are at 0.009 s and 0.0013 s.
Comparing the above figures, it becomes clear that when the volume of the void was reduced, either by reducing the radius or the height of the void, the PDs were reduced. The aforementioned results are similar to results of other research, which indicate that PD activity is related to void geometry and applied voltage [
34,
35].
4. Effect of Humidity on PDs
The presence of humidity leads to an increase in electrical stresses, resulting in an increase in PD activity and thus affecting the state of EM insulation (possible deterioration). There are some papers and research works which claim that the presence of humidity may decrease the number of PDs and PD activity. There are no clear results from previous research whether humidity leads to an increase or a decrease in PD activity [
36]. Moreover, some test results showed that if the relative humidity is increased, the magnitude of the PDs will be increased as well. The absolute humidity should be taken into consideration [
37,
38] as it affects the Partial Discharge Inception Voltage (PDIV). References [
39,
40] show that an increase in absolute humidity leads to a pertinent increase in PDIV, while other research work [
41] disagrees with the aforementioned results.
Experiments were carried out to investigate the effect of humidity on flashover voltages. The sample was epoxy resin, which is the same insulation material used for the previous simulations and the aforementioned SG. The studied factors were water droplet volume, water conductivity, water droplet distance from the electrodes, and the number of water droplets on the epoxy resin surface.
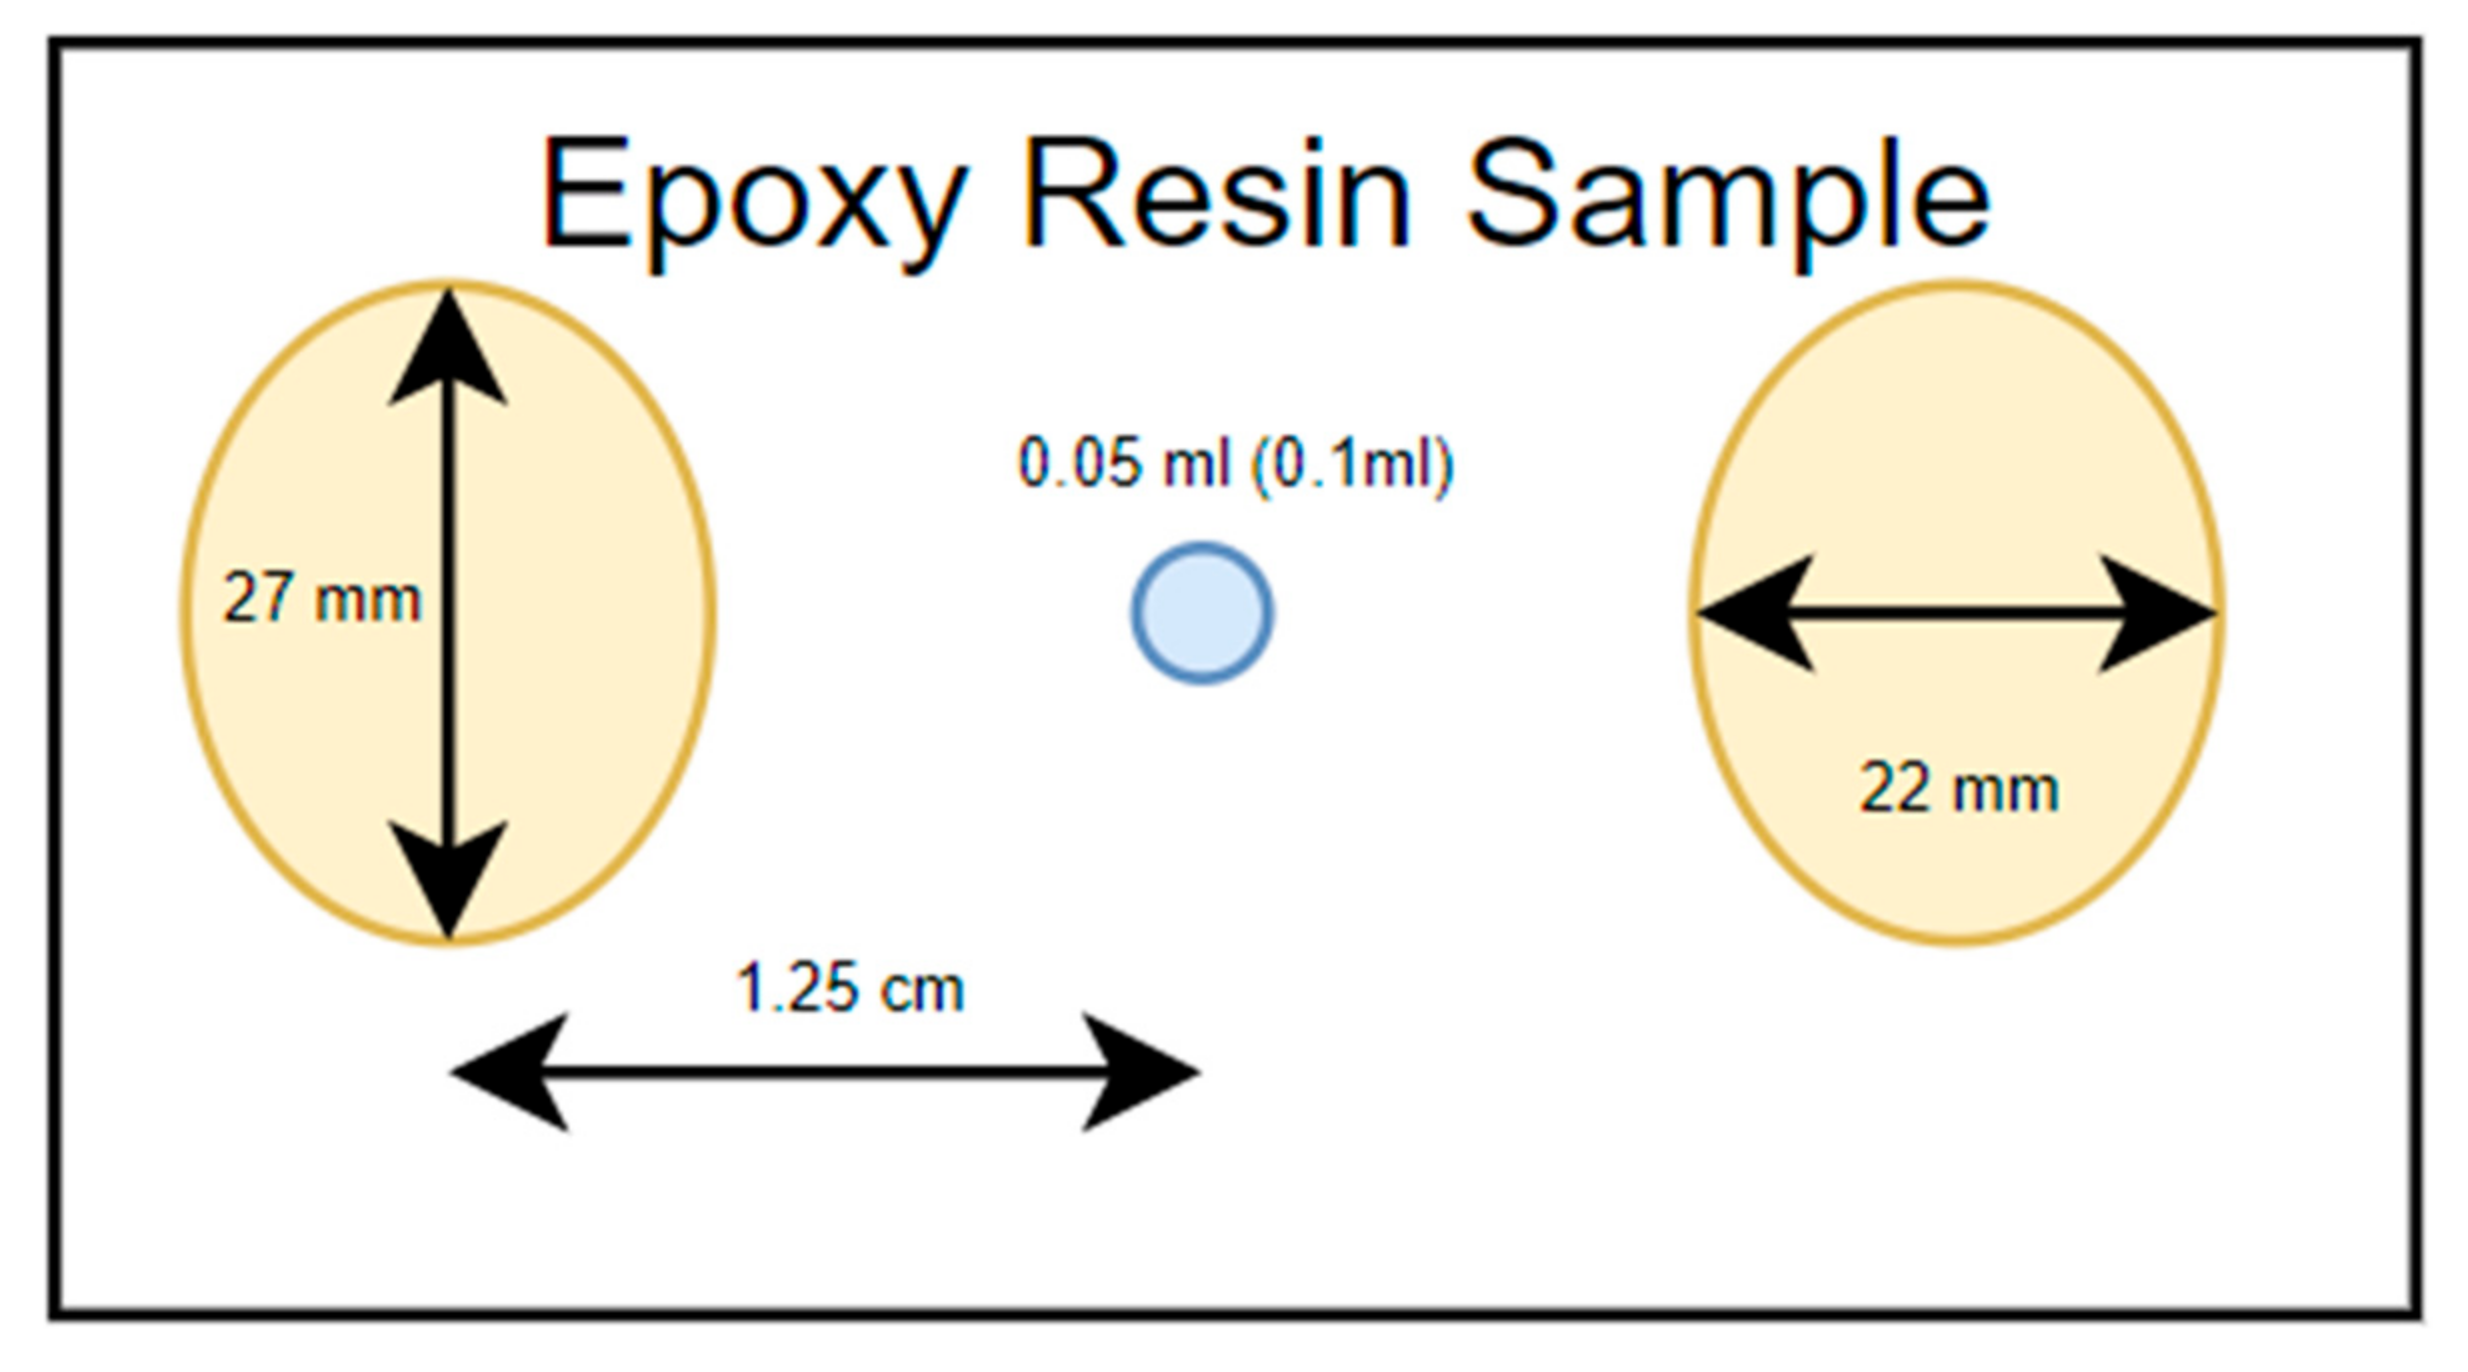
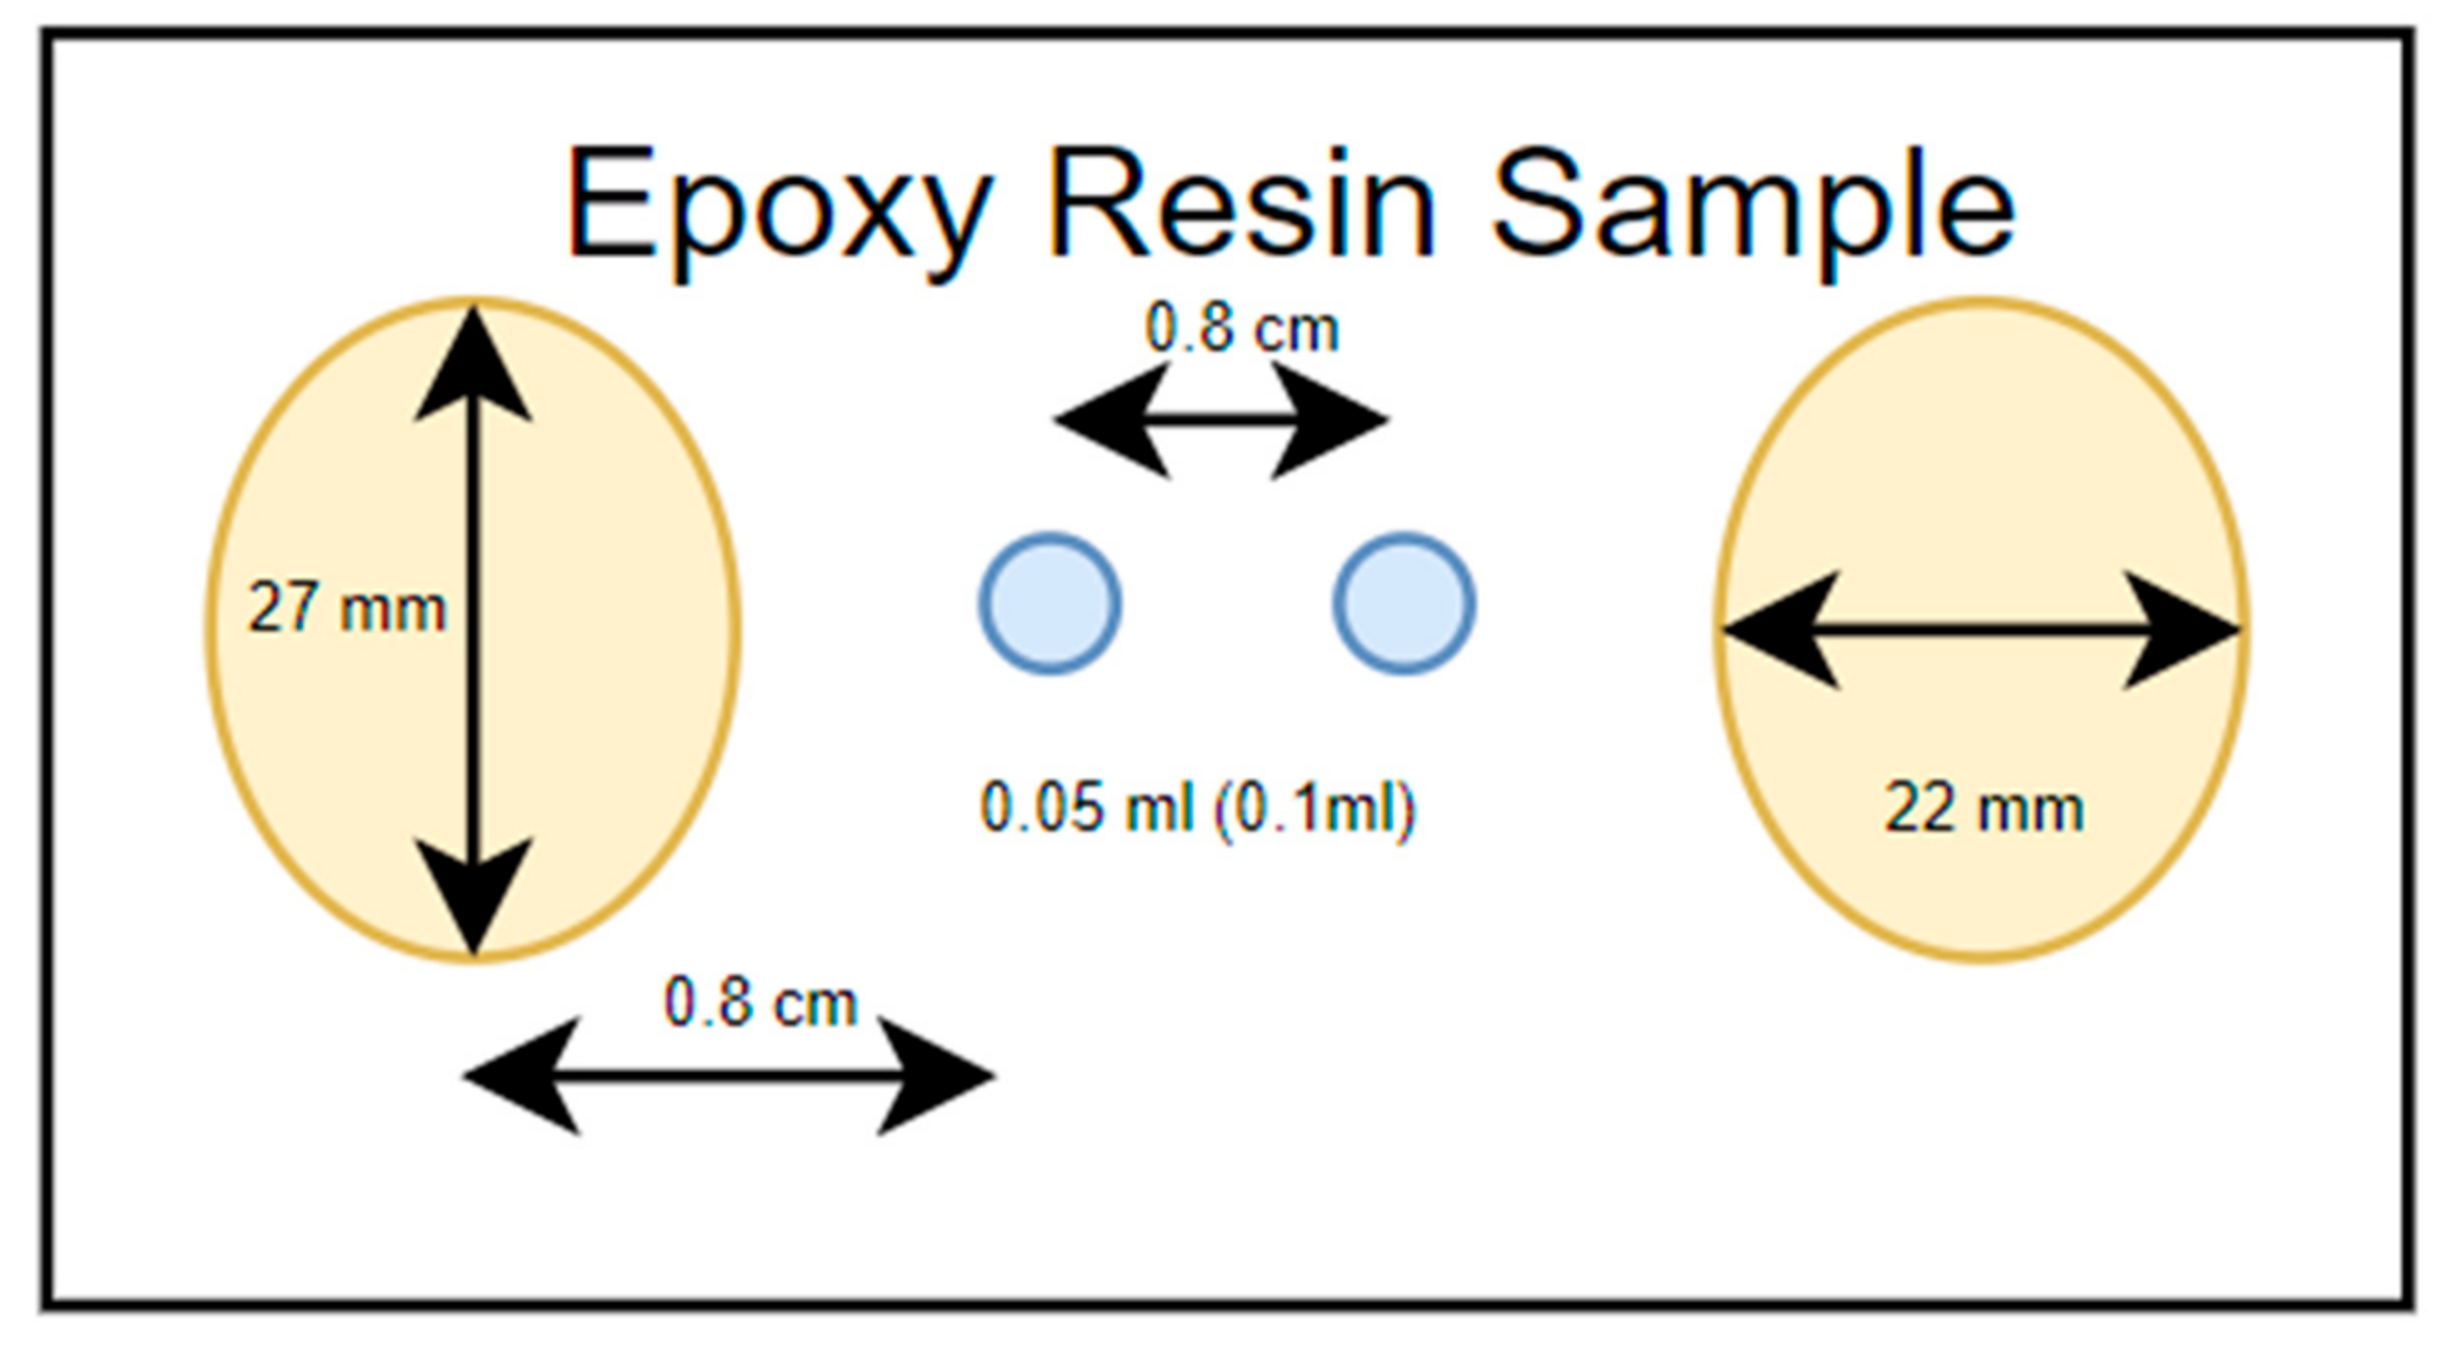
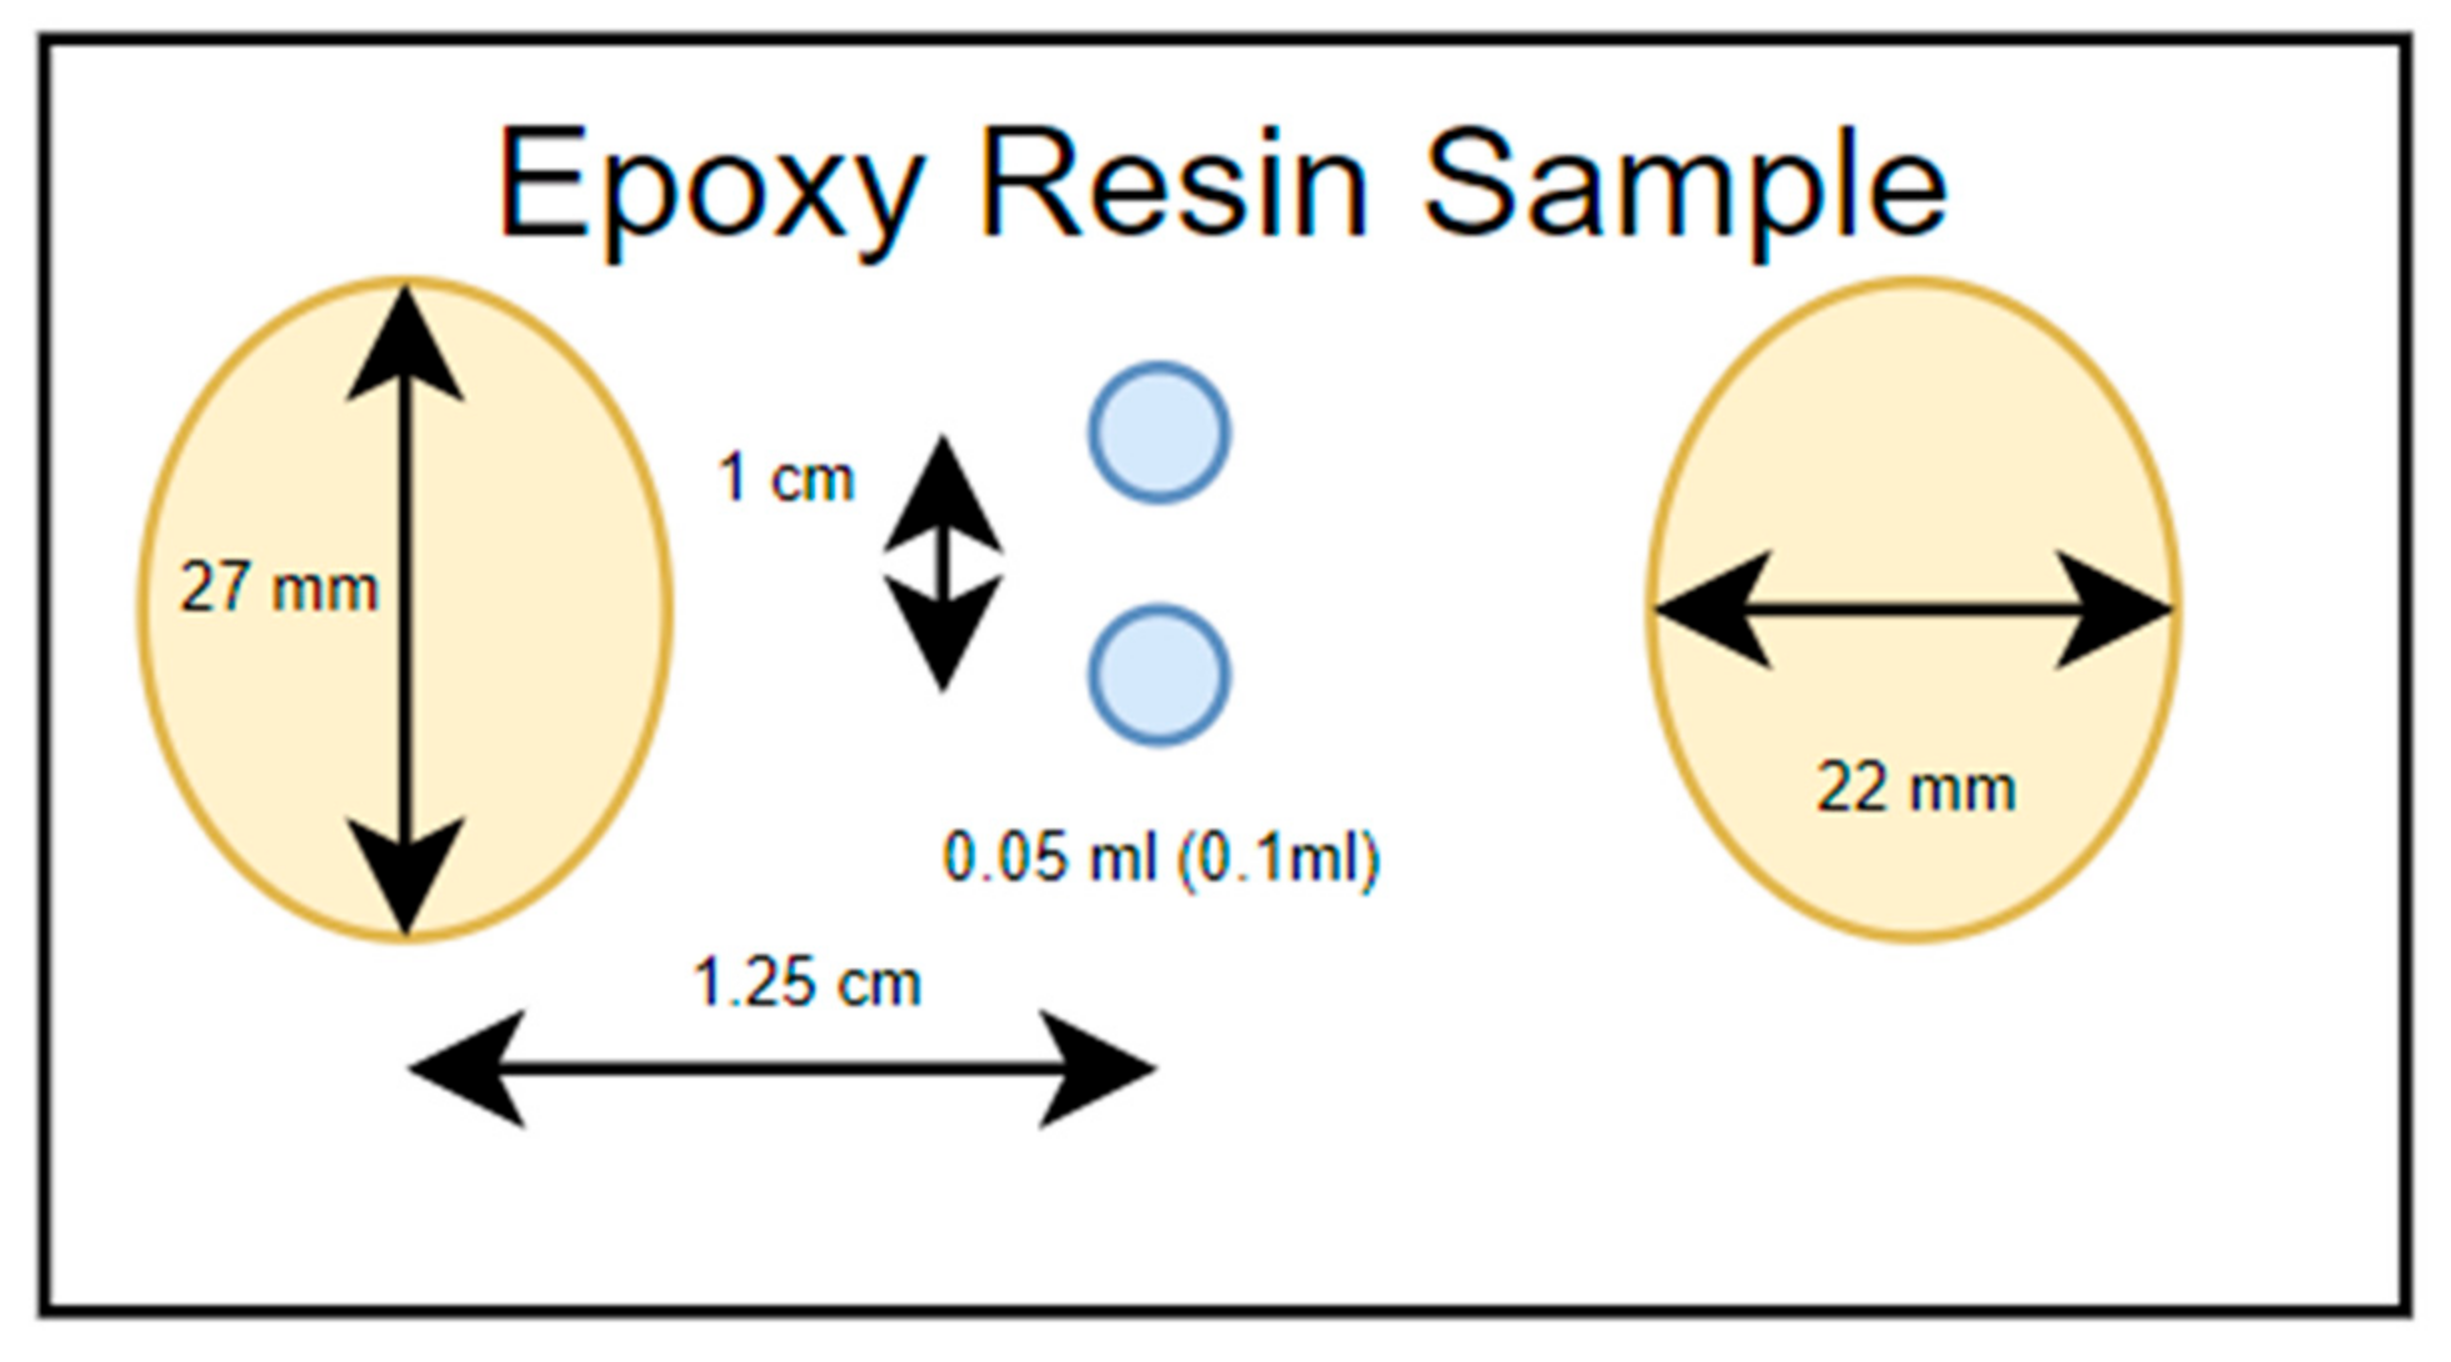
Eight different water droplet setups were chosen (
Figure 18,
Figure 19,
Figure 20 and
Figure 21), which one by one, were positioned on the sample surface of the epoxy resin. Eight different water conductivies were used, from 1.4 μS/cm to 10,000 μS/cm, in order to investigate how they affect the PD. The experiment procedure was analyzed in-depth in previous work [
42]:
After the flashover occurred, the voltage was recorded and the same water droplet arrangement was positioned on the epoxy resin surface. The voltage was raised up to the previous voltage minus 1.2 kV, and the arrangement stayed for 5 min. If flashover did not happen, the voltage was raised by 0.4 kV and so on. When the flashover occurred, the final voltage was recorded and used in order to create
Figure 22, containing the results of the different water droplet arrangements. The reason for allowing the voltage value for 5 min at each voltage level was because a certain time was required for the droplets to deform and for the surface discharges to start.
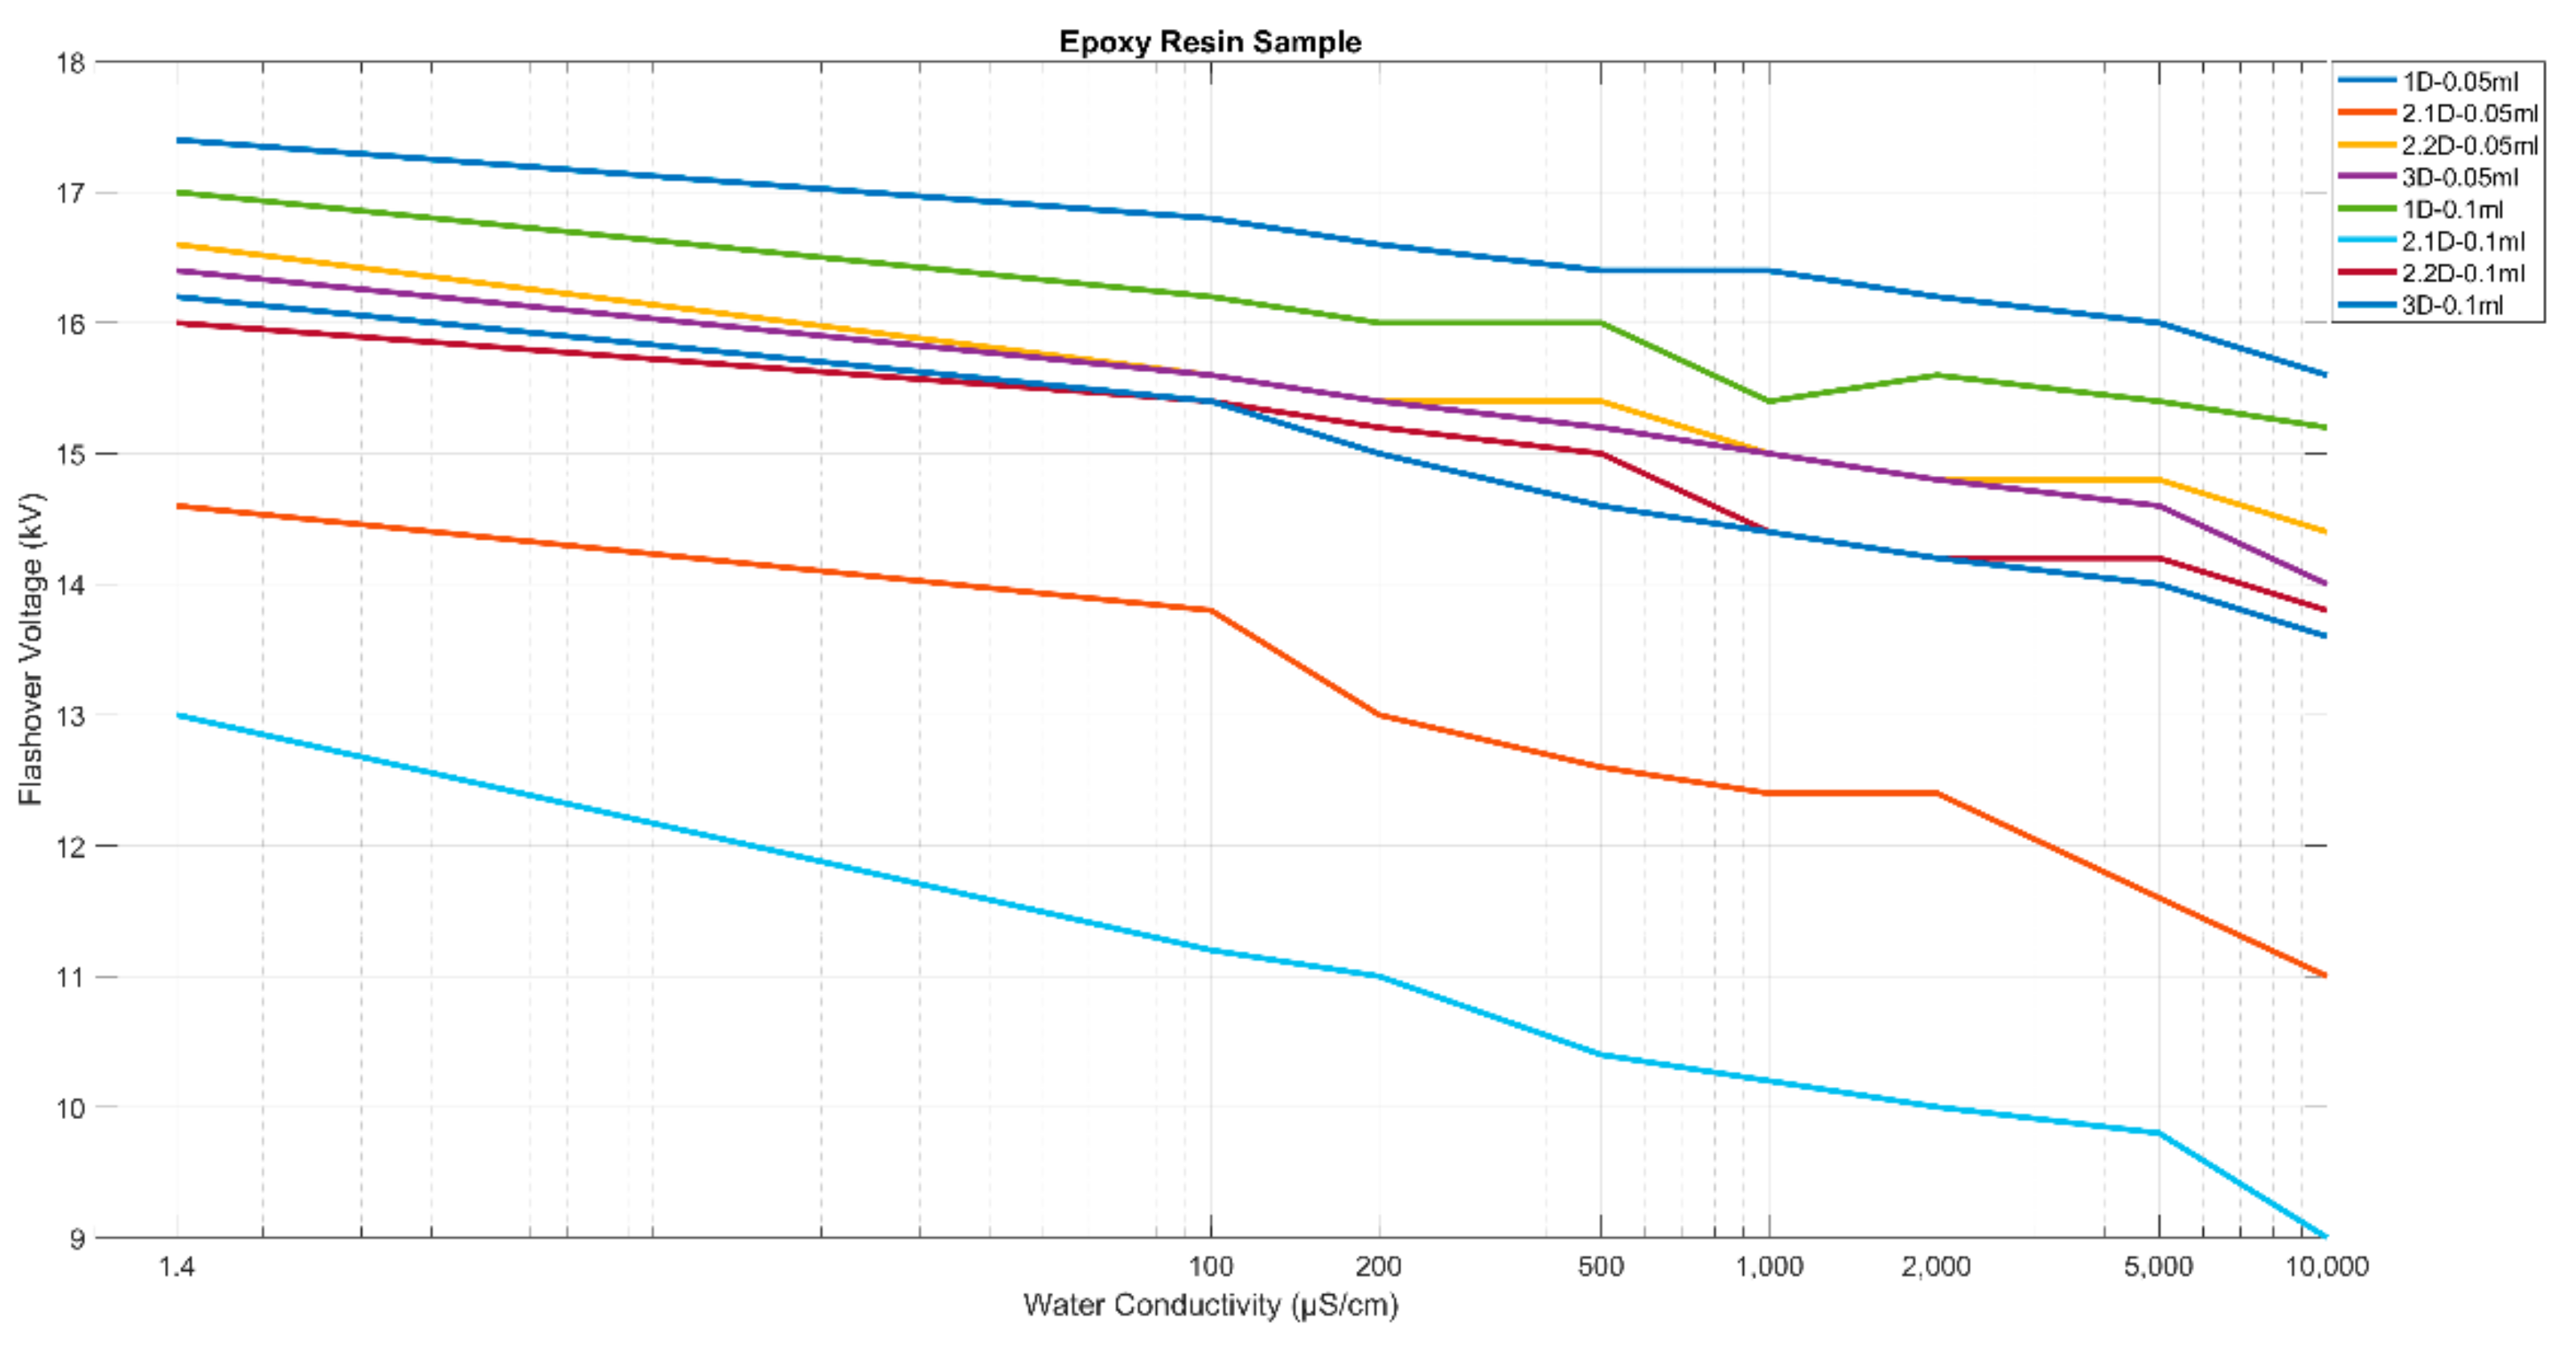
Figure 22 shows the variation of the flashover voltage with water conductivity for the epoxy resin sample. The colours of the different lines are explained next to the diagram.
First, the water conductivity affects the flashover voltage, e.g., when the water conductivity increases, the flashover voltage decreases. Furthermore, in most experiments, the flashover voltage of the arrangements of 0.1 mL was less compared to the same arrangement of 0.05 mL. Moreover, the more droplets on the sample surface, the lower the flashover voltage. Last but not least, the two-droplet arrangement one next to the other presents the minimum values of the flashover voltage, and this happens because the droplets are closer to the electrodes.
5. Discussion
EMs are one of the most significant elements in industry and in generating electric-ity. Long lifespan and proper operation are of paramount importance. The EM insulation system condition is one of the defining factors of its overall health condition [
43,
44]. One of the most widely used insulation materials is epoxy resin, as it has many advantages, such as tensile strength [
45], and this paper aimed to study the influence of various factors on epoxy resin. Delaminations and voids in a solid dielectric could lead to the deterioration and the degradation of the insulation system. If a void of a certain volume is present in a solid insulation material, this could lead to more PDs as well as a higher amplitude of PDs as the applied voltage increases. In addition to this, as the volume of the void increases, PDs increase as well.
The MATLAB/Simulink model proposed in this paper was created in order to simulate the way that a common insulation material that is used in various EMs, epoxy resin, reacts to different situations. The combination of these results with the experimental tests, which give significant information about the humidity and how it affects epoxy resin, leads to a more general point of view of this insulation material. According to simulation results, it is obvious that when increasing the applied voltage, both the number and the amplitude of the PDs increase. In addition to this, when the volume of the void is increased, the PDs increase.
Another important factor in the epoxy resin condition seems to be humidity. Other research efforts present different approaches on how humidity affects PD activity and flashover voltages, as mentioned above. According to experiments, humidity affects the deterioration of the insulation because it is related to the increase in flashover voltage as well as the PD activity. The factors that affect the PD activity are water conductivity, the distance of the water droplets from the electrodes, and the volume and number of droplets on the sample surface. As the number of droplets or the volume increases, the flashover voltage decreases and facilitates PD occurrence. In addition, when the water droplets are closer to electrodes, the flashover voltage decreases. Finally, the water conductivity affects flashover voltages and PD activity, as the smallest values for flashover voltages occur in experiments with the highest value of water conductivity.
During the experiments, one could notice the following: before the breakup of the water droplets there was an oscillation and a characteristic noise. More specifically, in the two-droplet arrangement with one droplet next to the other, the two droplets were approaching each other before the PD occurred. On the other hand, in the three-droplet arrangement, most of the time, the middle droplet was the one that deformed and broke up. Further experiments will be developed in the future in order to verify the conclusions across a wider range of machines and cases. Both the simulations and the experiments can be used in order to examine the effect of the PDs on EMs, as PD activity is both a cause and a symptom of the insulation aging. As mentioned above, one of the main problems that occurs in EMs is PDs, which occur due to various defects on their insulation system. The presence of PDs can lead to insulation degradation and failure. As such, it is very important to detect the PDs immediately either via Offline or Online PD tests, as described above. First, the installation of an Online PD monitoring system is recommended in order to prevent an abnormal situation or sudden changes in the behaviour of stator winding. An Online PD monitoring system can give important information about future insulation conditions, possible faults, and problems. Online PD tests are more expensive but they offer better results in EM monitoring. In any case, the systematic cleaning of the EMs, aimed to reduce humidity and contamination to minimize the presence of PDs, should always be considered.
6. Conclusions
The purpose of this manuscript is to discuss the factors affecting the PD and their detection in EMs and especially epoxy resin, one of the most significant components of EMs’ insulation system. Epoxy resin was chosen, as it is used not only on the insulation system of the SG described above but also in many other similar systems. It was therefore essential for this research effort to simulate the insulation of this SG in order to investigate how the above (and many other) factors affect its “health” condition and prognose possible faults. PD tests, Offline or Online, are the most suitable tests for evaluating the insulation condition. Offline tests are mainly used for determining the point where a potential fault starts, while Online PD tests are able to monitor the insulation condition continuously during operation.
The simulation results show that, when increasing the applied voltage, the number and the amplitude of PDs increase. Furthermore, if the volume of the void decreases, the PDs decrease. Other factors that play a significant role in PDs are humidity and contamination. Experiments with epoxy resin samples and different droplet arrangements were carried out in order to investigate which factors can affect the PDs and provided interesting results. Water droplet conductivity, the distance of the water droplets from the electrodes, and the volume and number of the water droplets on the surface of the epoxy resin affect the flashover performance and the PDs.
As for future work, experiments with different water conductivities and water droplet arrangements would be useful in confirming the results and providing statistical significance. As for the simulations, more iterations with different geometries and dimensions of voids would be useful. The simulations and the experiments could be combined with the onsite measurements of PDs across a wider range of existing SGs in power plants in order to determine the situation of their insulation system for planning maintenance actions more efficiently.
Author Contributions
Conceptualization, D.V., A.K., M.G.D. and J.A.A.-D.; methodology, D.V., A.K., M.G.D. and J.A.A.-D.; software, D.V.; validation, D.V., A.K., M.G.D. and J.A.A.-D.; formal analysis, D.V., A.K., M.G.D. and J.A.A.-D.; investigation, D.V., A.K., M.G.D. and J.A.A.-D.; resources, D.V., A.K. and M.G.D.; data curation, D.V.; writing—original draft preparation, D.V., A.K., M.G.D. and J.A.A.-D.; writing—review and editing, D.V., A.K., M.G.D. and J.A.A.-D.; visualization, D.V., A.K., M.G.D. and J.A.A.-D.; supervision, A.K., M.G.D. and J.A.A.-D.; project administration, D.V., A.K., M.G.D. and J.A.A.-D.; funding acquisition, A.K. All authors have read and agreed to the published version of the manuscript.
Funding
This research received no external funding.
Institutional Review Board Statement
Not applicable.
Informed Consent Statement
Not applicable.
Data Availability Statement
Not applicable.
Acknowledgments
The authors of this paper would like to thank Pericles Stratigopoulos, Director of Komotini Power Plant, Public Power Corporation S.A.—Hellas, for providing the pictures and the results of the PD measurements for this SG.
Conflicts of Interest
The authors declare no conflict of interest.
Abbreviations
The following abbreviations are used in this manuscript:
| EMs | Electrical Rotating Machines |
| HV | High Voltage |
| MI | Measuring Impedance |
| PDs | Partial Discharges |
| PDIV | Partial Discharge Inception Voltage |
| PRPD | Phase Resolved Partial Discharge |
| SGs | Synchronous Generators |
| TEAM | Thermal, Electrical, Ambient, and Mechanical |
References
- Afrandideh, S.; Milasi, M.E.; Haghjoo, F.; Cruz, S.M.A. Turn to Turn Fault Detection, Discrimination, and Faulty Region Identification in the Stator and Rotor Windings of Synchronous Machines Based on the Rotational Magnetic Field Distortion. IEEE Trans. Energy Convers. 2020, 35, 292–301. [Google Scholar] [CrossRef]
- Stone, G.C.; Boulter, E.A.; Culbert, I.; Dhirani, H. Electrical Insulation for Rotating Machines: Design, Evaluation, Aging, Testing, and Repair; A John Wiley & Sons, Inc.: Toronto, ON, Canada, 2004. [Google Scholar]
- Shankar, R.; Dave, S. Degradation and Diagnostics of Electrical Machines. Master’s Thesis, Department of Electrical Engineering, Chalmers University of Technology, Gothenburg, Sweden, 2021. [Google Scholar]
- Seri, P.; Ghosh, R.; Montanari, G.C. An Unsupervised Approach to Partial Discharge Monitoring in Rotating Machines: Detection to Diagnosis with Reduced Need of Expert Support. IEEE Trans. Energy Convers. 2021, 36, 2485–2492. [Google Scholar] [CrossRef]
- Madonna, V.; Giangrande, P.; Zhao, W.; Zhang, H.; Gerada, C.; Galea, M. On the Design of Partial Discharge-Free Low Voltage Electrical Machines. In Proceedings of the 2019 IEEE International Electric Machines & Drives Conference (IEMDC), San Diego, CA, USA, 12–15 May 2019; pp. 1837–1842. [Google Scholar]
- Hemmati, R.; Wu, F.; El-Refaie, A. Survey of Insulation Systems in Electrical Machines. In Proceedings of the 2019 IEEE International Electric Machines & Drives Conference (IEMDC), San Diego, CA, USA, 12–15 May 2019; pp. 2069–2076. [Google Scholar]
- Muto, H. Dielectric Breakdown and Partial Discharge Properties of Nanocomposites for Epoxy/Mica Insulation system in Large-size Rotating Machines. In Proceedings of the 2020 International Symposium on Electrical Insulating Materials (ISEIM), Tokyo, Japan, 13–17 September 2020. [Google Scholar]
- Brütsch, R.; Chapman, M. Insulating systems for high voltage rotating machines and reliability considerations. In Proceedings of the 2010 IEEE International Symposium on Electrical Insulation, San Diego, CA, USA, 6–9 June 2010; pp. 1–5. [Google Scholar]
- Nathaniel, T. Diagnostics of Stator Insulation by Dielectric Response and Variable Frequency Partial Discharge Measurements. Ph.D. Thesis, KTH Royal Institute of Technology Stockholm, Stockholm, Sweden, November 2006. [Google Scholar]
- Madonna, V.; Giangrande, P.; Zhao, W.; Buticchi, G.; Zhang, H.; Gerada, C.; Galea, M. Reliability vs. Performances of Electrical Machines: Partial Discharges Issue. In Proceedings of the 2019 IEEE Workshop on Electrical Machines Design, Control and Diagnosis (WEMDCD), Athens, Greece, 22–23 April 2019; pp. 77–82. [Google Scholar]
- Luo, Y.; Li, Z.; Wang, H. A Review of Online Partial Discharge Measurement of Large Generators. Energies 2017, 10, 1694. [Google Scholar] [CrossRef] [Green Version]
- Montanari, G.C. Insulation Diagnosis of High Voltage Apparatus by Partial Discharge Investigation. In Proceedings of the 2006 IEEE 8th International Conference on Properties & Applications of Dielectric Materials, Bali, Indonesia, 26–30 June 2006; pp. 1–11. [Google Scholar]
- Pan, C.; Chen, G.; Tang, J.; Wu, K. Numerical modeling of partial discharges in a solid dielectric-bounded cavity: A review. IEEE Trans. Dielectr. Electr. Insul. 2019, 26, 981–1000. [Google Scholar] [CrossRef] [Green Version]
- Moghadam, D.E.; Herold, C.; Zbinden, R. Effects of Resins on Partial Discharge Activity and Lifetime of Insulation Systems Used in eDrive Motors and Automotive Industries. In Proceedings of the 2020 IEEE Electrical Insulation Conference (EIC), Knoxville, TN, USA, 22 June–3 July 2020; pp. 221–224. [Google Scholar]
- Höpner, V.N.; Volmir, E.W. Insulation Life Span of Low-Voltage Electric Motors—A Survey. Energies 2021, 14, 1738. [Google Scholar] [CrossRef]
- Wang, P.; Hui, S.; Akram, S.; Zhou, K.; Nazir, M.T.; Chen, Y.; Dong, H.; Javed, M.S.; Ul Haq, I. Influence of Repetitive Square Voltage Duty Cycle on the Electrical Tree Characteristics of Epoxy Resin. Polymers 2020, 12, 2215. [Google Scholar] [CrossRef] [PubMed]
- Stone, G.C. Partial discharge diagnostics and electrical equipment insulation condition assessment. IEEE Trans. Dielectr. Electr. Insul. 2005, 12, 891–904. [Google Scholar] [CrossRef]
- Sabat, A.; Karmakar, S. Simulation of Partial Discharge in High Voltage Power Equipment. Int. J. Electr. Eng. Inform. 2011, 3, 234–247. [Google Scholar] [CrossRef]
- Danikas, M.G.; Adamidis, G. Partial discharges in epoxy resin voids and the interpretational possibilities and limitations of Pedersen’s model. Archiv fuer Elektrotech. 1997, 80, 105–110. [Google Scholar] [CrossRef]
- Lv, Z.; Rowland, S.M.; Chen, S.; Zheng, H.; Iddrissu, I. Evolution of partial discharges during early tree propagation in epoxy resin. IEEE Trans. Dielectr. Electr. Insul. 2017, 24, 2995–3003. [Google Scholar] [CrossRef]
- Fenger, M.; Stone, G. Investigations into the Effect of Humidity on Stator Winding Partial Discharges. IEEE Trans. Dielectr. Electr. Insul. 2005, 12, 341–365. [Google Scholar] [CrossRef]
- Pandit, I.; Sinha, A.K.; Kumar, P.; Hati, A.S. Partial Discharge in Solid Insulating Materials, Causes, Effects and Factors of Dependence–A Comparative Investigation. IJEREEE 2018, 4, 190–196. [Google Scholar]
- Waldi, E.P.; Murakami, Y.; Nagao, M. Effect of humidity on breakdown of low density polyethylene film due to partial discharge. In Proceedings of the Condition Monitoring and Diagnosis International Conference on, Beijing, China, 21–24 April 2008; pp. 655–658. [Google Scholar]
- Nawawi, Z.; Murakami, Y.; Hozumi, N.; Nagao, M. Effect of Humidity on Time Lag of Partial Discharge in Insulation-Gap-Insulation System. In Proceedings of the Properties and Applications of Dielectric Materials, 8th International Conference on Bali, Bali, Indonesia, 26–30 June 2006; pp. 199–203. [Google Scholar]
- Danikas, M.G.; Sarathi, R. Electrical machine insulation: Traditional insulating materials, Nanocomposite polymers and the question of electrical trees. Funktechnikplus J. 2014, 1, 7–32. [Google Scholar]
- Illias, H.; Yuan, T.S.; Bakar, A.H.A.; Mokhlis, H.; Chen, G.; Lewin, P.L. Partial discharge patterns in high voltage insulation. In Proceedings of the 2012 IEEE International Conference on Power and Energy (PECon), Kota Kinabalu, Malaysia, 2–5 December 2012; pp. 750–755. [Google Scholar]
- Sharma, P.; Bhanddakkar, A. Simulation Model of Partial Discharge in Power Equipment. IJEER 2015, 3, 149–155. [Google Scholar]
- di Silvestre, M.L.; Miceli, R.; Romano, P.; Viola, F. Simplified Hybrid PD Model in Voids: Pattern Validation. In Proceedings of the 4th International Conference on Power Engineering, Energy and Electrical Drives, Istanbul, Turkey, 13–17 May 2013. [Google Scholar]
- Gunawardana, S.D.M.S.; Kanchana, A.A.T.; Wijesingha, P.M.; Perera, H.A.P.B.; Samarasinghe, R.; Lucas, J.R. A Matlab Simulink Model for a Partial Discharge Measuring System. In Electrical Engineering Conference; University of Moratuwa: Sri Jayawardanapura Kotte, Sri Lanka, 2015. [Google Scholar]
- Srinivasa, D.; Harish, B.; Harisha, K. Analysis Study on Partial Discharge Magnitudes to the Parallel and Perpendicular Axis of a Cylindrical Cavity. Int. J. Eng. Trends Technol. (IJETT) 2017, 45, 334–337. [Google Scholar]
- Aakre, T.G.; Ildstad, E.; Hvidsten, S. Partial discharge inception voltage of voids enclosed in epoxy/mica versus voltage frequency and temperature. IEEE Trans. Dielectr. Electr. Insul. 2020, 27, 214–221. [Google Scholar] [CrossRef]
- Girish, S.K.; Sumangala, D.B.V. Analysis of Partial Discharge Activity in Pressboards Using MATLAB SIMULINK. Int. J. Adv. Eng. Res. Dev. 2017, 4, 255–260. [Google Scholar]
- Singh, N.; Debdas, S.; Chauhan, R. Simulation and experimental study of Partial Dischage in insulating material for High Voltage Power Equipements. Int. J. Sci. Eng. Res. 2013, 4, 1677–1684. [Google Scholar]
- Gaurkar, B.P.; Bonde, U.G. Partial Discharge Testing of Insulator using MATLAB Simulink. Int. J. Sci. Res. Dev. 2017, 5. [Google Scholar]
- Kumar, D.; Singh, R. Simulation of Partial Discharge for Different Insulation Material Using MATLAB. Int. J. Sci. Res. Dev. (IJSRD) 2015, 3, 660–663. [Google Scholar]
- Warren, V. Partial discharge testing: A progress report. In Proceedings of the Iris Rotating Machinery Conference, Santa Monica, CA, USA, 20–23 June 2011; pp. 1–17. [Google Scholar]
- Driendl, N.; Pauli, F.; Hameyer, K. Influence of Ambient Conditions on the Qualification Tests of the Interturn Insulation in Low-Voltage Electrical Machines. In IEEE Transactions on Industrial Electronics; IEEE: New York, NY, USA, 2021. [Google Scholar]
- Nawawi, Z.; Hozumi, Y.M.N.; Nagao, M. Effect of Humidity on Partial Discharge Characteristics. In Proceedings of the 7th International Conference on Properties and Applications of Dielectric Materials, Nagoya, Japan, 1–5 June 2003; Volume 30. [Google Scholar]
- Moonesan, M.; Jayaram, S.; Cherney, E. Effect of Temperature and Humidity on Surface Discharge Activities under High Voltage Unipolar Pulses. In Proceedings of the ESA Annual Meeting on Electrostatics, Pomona, CA, USA, 16–18 June 2015; Volume 31. [Google Scholar]
- Dang, H. Investigation of the Effects of Humidity and Surface Charge on Partial Discharge in Insulator Posts under DC Voltage. Master’s Thesis, University of Manitoba, Winnipeg, MB, Canada, 2020. [Google Scholar]
- Rahman, M.F.; Rao, B.N.; Nirgude, P.M. Influence of moisture on partial discharge characteristics of oil impregnated pressboard under non-uniform field. In Proceedings of the International Symposium on High Voltage Engineering, Buenos Aires, Argentina, 28 August–1 September 2017; Volume 34, pp. 1–6. [Google Scholar]
- Verginadis, D.; Danikas, M.G.; Sarathi, R. Study of the Phenomena of Surface Discharges and Flashover in Nanocomposite Epoxy Resin Under the Influence of Homogeneous Electric Fields. Eng. Technol. Appl. Res. (ETASR) 2019, 9, 4315–4321. [Google Scholar]
- Verginadis, D.; Antonino-Daviu, J.; Karlis, A.; Danikas, M.G. Diagnosis of Stator Faults in Synchronous Generators: Short Review and Practical Case. In Proceedings of the 2020 International Conference on Electrical Machines (ICEM), Gothenburg, Sweden, 23–26 August 2020; pp. 1328–1334. [Google Scholar]
- Hassan, W.; Hussain, G.A.; Mahmood, F.; Amin, S.; Lehtonen, M. Effects of Environmental Factors on Partial Discharge Activity and Estimation of Insulation Lifetime in Electrical Machines. IEEE Access 2020, 8, 108491–108502. [Google Scholar] [CrossRef]
- Credo, A.; Villani, M.; Popescu, M.; Riviere, N. Application of Epoxy Resin in Synchronous Reluctance motors with fluid-shaped barriers for e mobility. In IEEE Transactions on Industry Applications; IEEE: New York, NY, USA, 2021. [Google Scholar]
Figure 1.
Electrical Erosion (2012)—Stator Bars.
Figure 1.
Electrical Erosion (2012)—Stator Bars.
Figure 2.
Restating ties with glass roving and resin.
Figure 2.
Restating ties with glass roving and resin.
Figure 3.
Restored ties with glass roving and resin.
Figure 3.
Restored ties with glass roving and resin.
Figure 4.
Painting of the restored area with resin.
Figure 4.
Painting of the restored area with resin.
Figure 5.
Online PD Measurement Arrangement.
Figure 5.
Online PD Measurement Arrangement.
Figure 6.
PD activity in Phase U (2010).
Figure 6.
PD activity in Phase U (2010).
Figure 7.
PD activity in Phase U (2011).
Figure 7.
PD activity in Phase U (2011).
Figure 8.
Capacitive PD Model—Simulink.
Figure 8.
Capacitive PD Model—Simulink.
Figure 12.
PD at 5 kV-Half Height.
Figure 12.
PD at 5 kV-Half Height.
Figure 13.
PD at 10 kV-Half Height.
Figure 13.
PD at 10 kV-Half Height.
Figure 14.
PD at 15 kV-Half Height.
Figure 14.
PD at 15 kV-Half Height.
Figure 15.
PD at 5 kV-Half Radius.
Figure 15.
PD at 5 kV-Half Radius.
Figure 16.
PD at 10 kV-Half Radius.
Figure 16.
PD at 10 kV-Half Radius.
Figure 17.
PD at 15 kV-Half Radius.
Figure 17.
PD at 15 kV-Half Radius.
Figure 18.
One-Droplet Arrangement (1D).
Figure 18.
One-Droplet Arrangement (1D).
Figure 19.
Two-Droplets Arrangement with one next to the other (2.1D).
Figure 19.
Two-Droplets Arrangement with one next to the other (2.1D).
Figure 20.
Two-Droplets Arrangement with one on top of the other (2.2D).
Figure 20.
Two-Droplets Arrangement with one on top of the other (2.2D).
Figure 21.
Three-Droplet Arrangement (3D).
Figure 21.
Three-Droplet Arrangement (3D).
Figure 22.
Comparison of different flashover voltages for the epoxy resin sample.
Figure 22.
Comparison of different flashover voltages for the epoxy resin sample.
Table 1.
Simulation Parameters (Epoxy Resin).
Table 1.
Simulation Parameters (Epoxy Resin).
| Parameter | Value |
|---|
| Measuring Capacitor | 1000 pF |
| Coupling Capacitor | 1000 μF |
| Dielectric Constant | 8.85 × 10⁻¹² F/m |
| Relative Permittivity | 3.6 |
| 50 Ω |
| 0.60 mH |
| 0.45 μF |
| 4.460 × 10⁻¹² F |
| 5.56062 × 10⁻¹⁴ F |
| 1.39015 × 10⁻¹³ F |
Table 2.
Simulation Parameters (Epoxy Resin).
Table 2.
Simulation Parameters (Epoxy Resin).
| Parameter | Value |
|---|
| 4.460 × 10⁻¹² F |
| 5.26795 × 10⁻¹⁴ F |
| 2.78031 × 10⁻¹³ F |
Table 3.
Simulation Parameters (Epoxy Resin).
Table 3.
Simulation Parameters (Epoxy Resin).
| Parameter | Value |
|---|
| 4.46197 × 10⁻¹² F |
| 1.93077 × 10⁻¹⁴ F |
| 3.47539 × 10⁻¹⁴ F |
| Publisher’s Note: MDPI stays neutral with regard to jurisdictional claims in published maps and institutional affiliations. |
© 2021 by the authors. Licensee MDPI, Basel, Switzerland. This article is an open access article distributed under the terms and conditions of the Creative Commons Attribution (CC BY) license (https://creativecommons.org/licenses/by/4.0/).


 ,
, 


