
Energetic Potential for Biological Methanation in Anaerobic Sewage Sludge Digesters in Austria


Abstract
:1. Introduction
2. Biogas Quality and State of the Art in Biogas Upgrading
2.1. Biogas Composition
2.2. Quality Standards for Biogas Grid-Injection in Austria
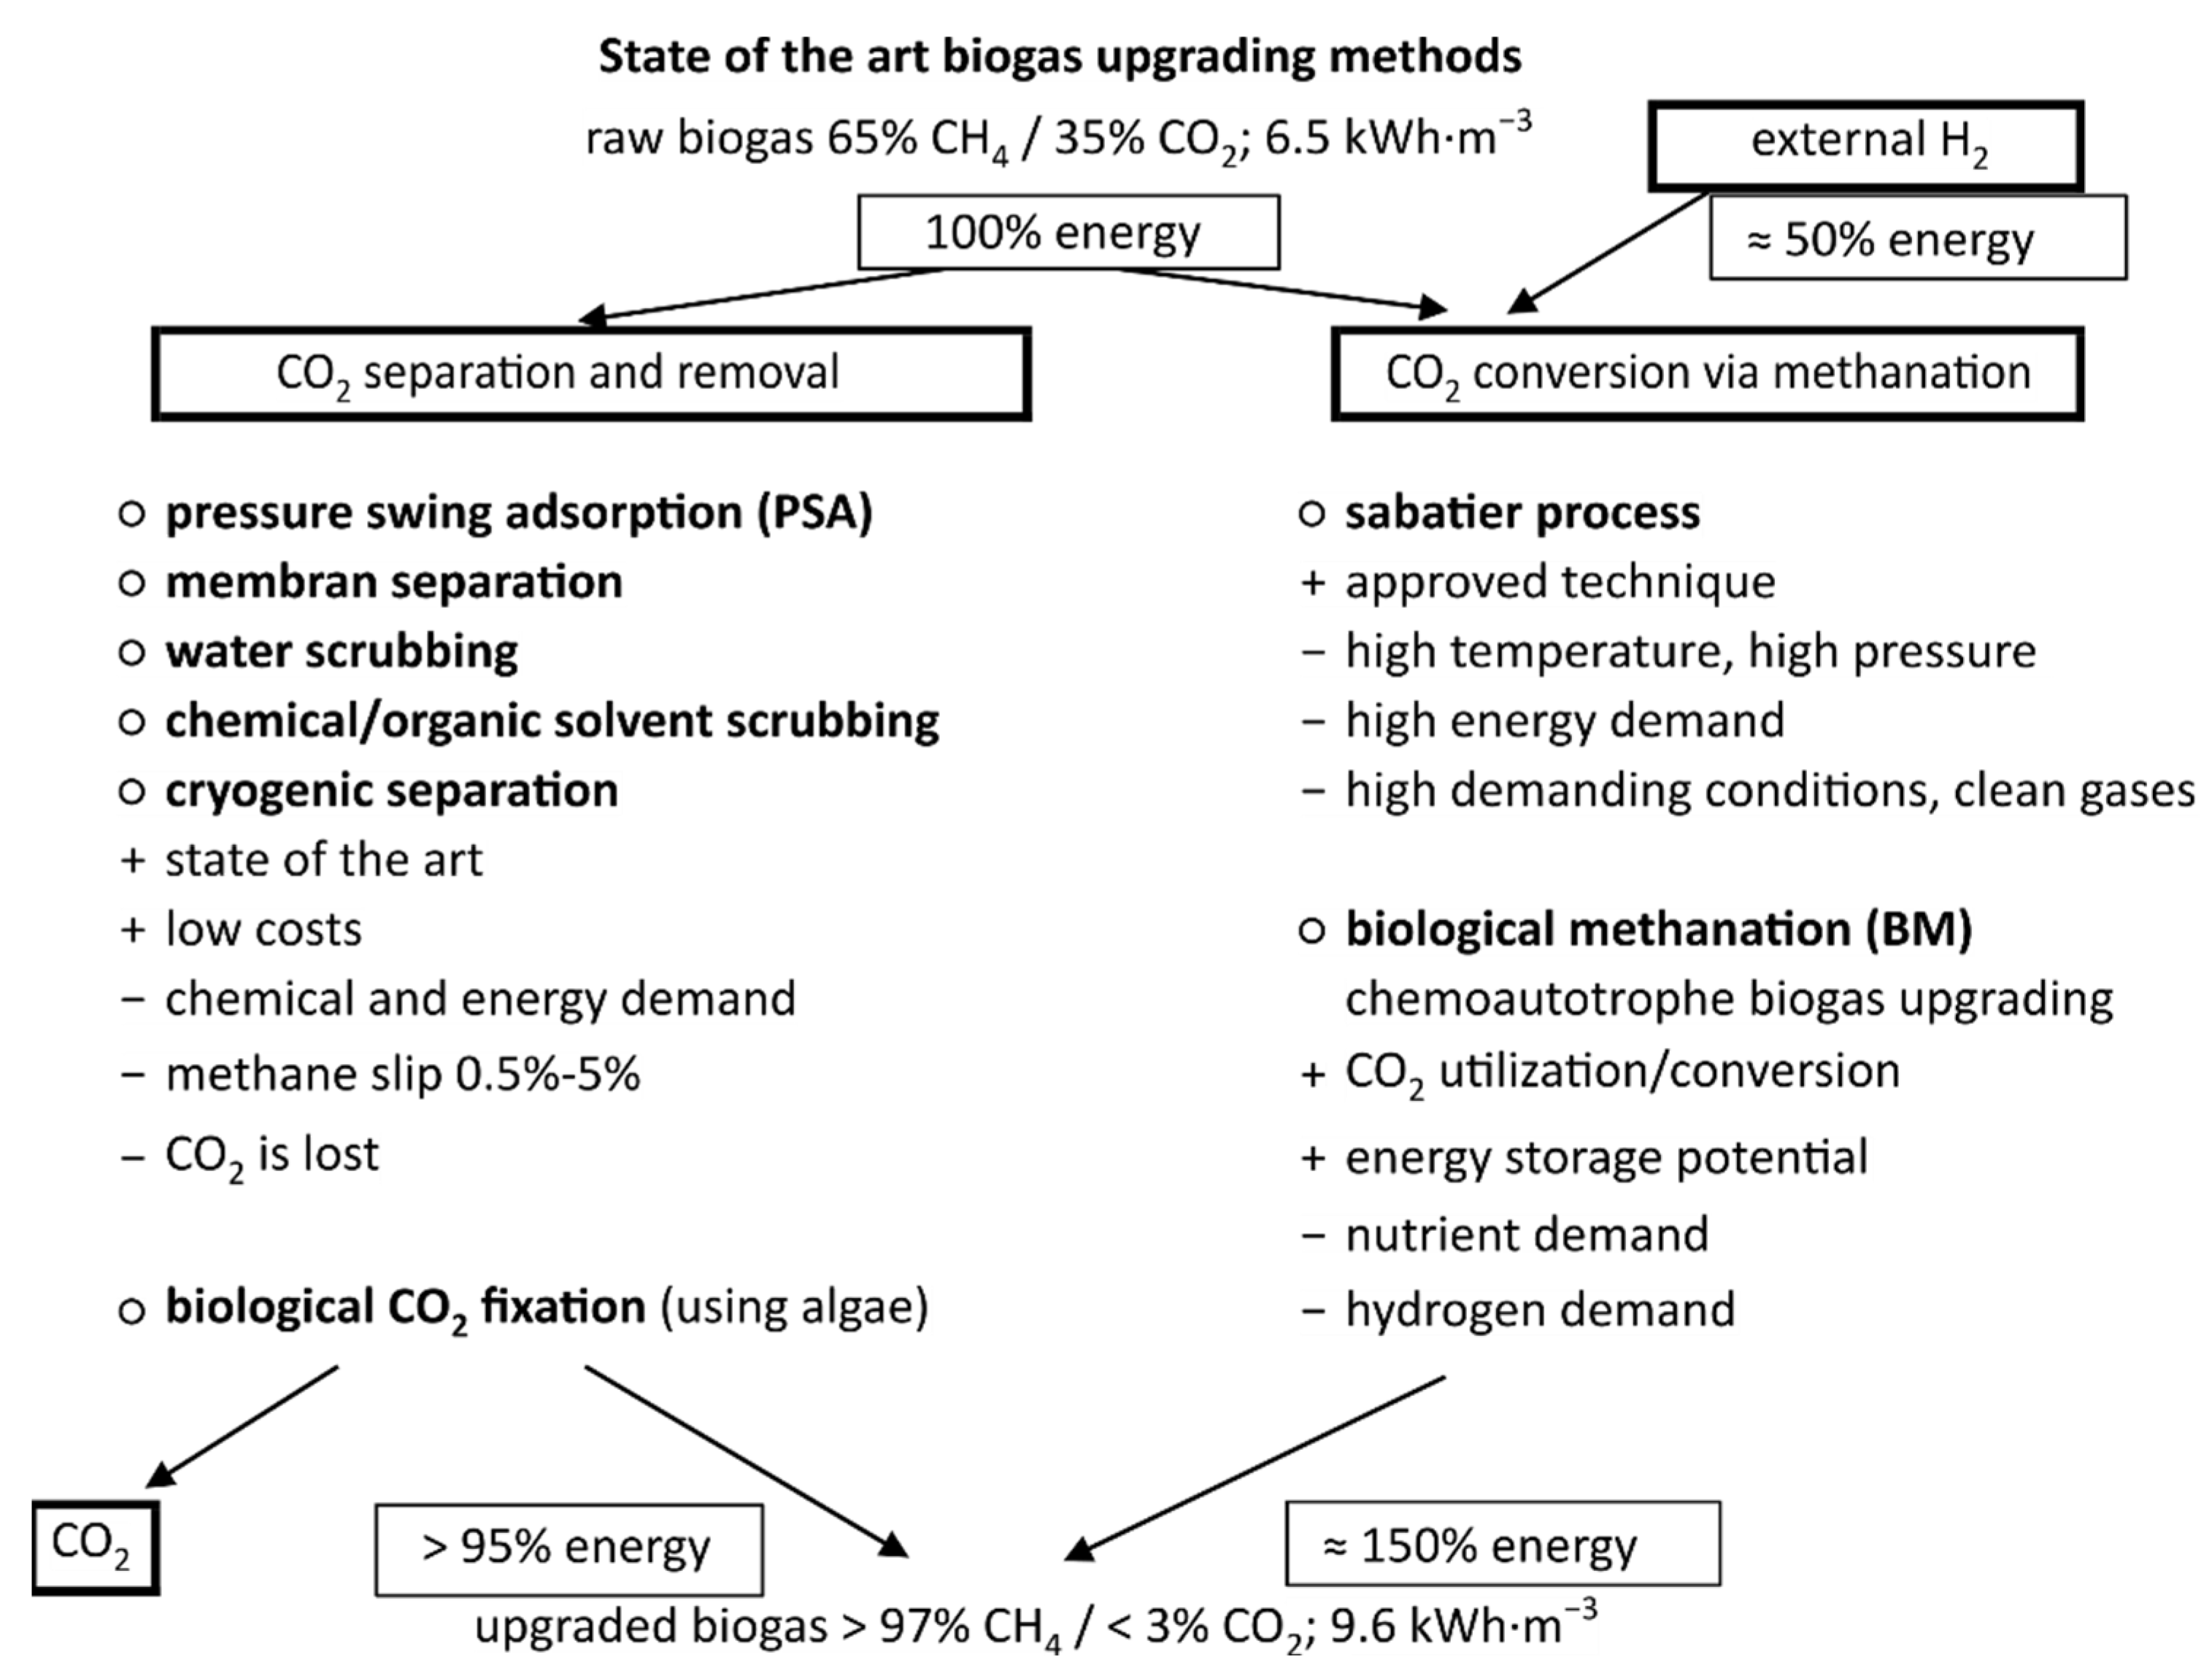
2.3. State of the Art in Biogas Upgrading to Quality Standards Required for Grid Injection
2.3.1. Biogas Upgrading via CO2 Separation and Removal
2.3.2. Biogas Upgrading with CO2 Conversion through Methanation
2.4. Biogas Production in Agricultural Biogas Plants and Sewage Sludge Digesters in Austria
3. Materials and Methods
3.1. Survey on Anaerobic Sewage Sludge Digestion in Austria
3.2. Energy Flows for Electricity, and Bio- and Natural Gas, at a National Level
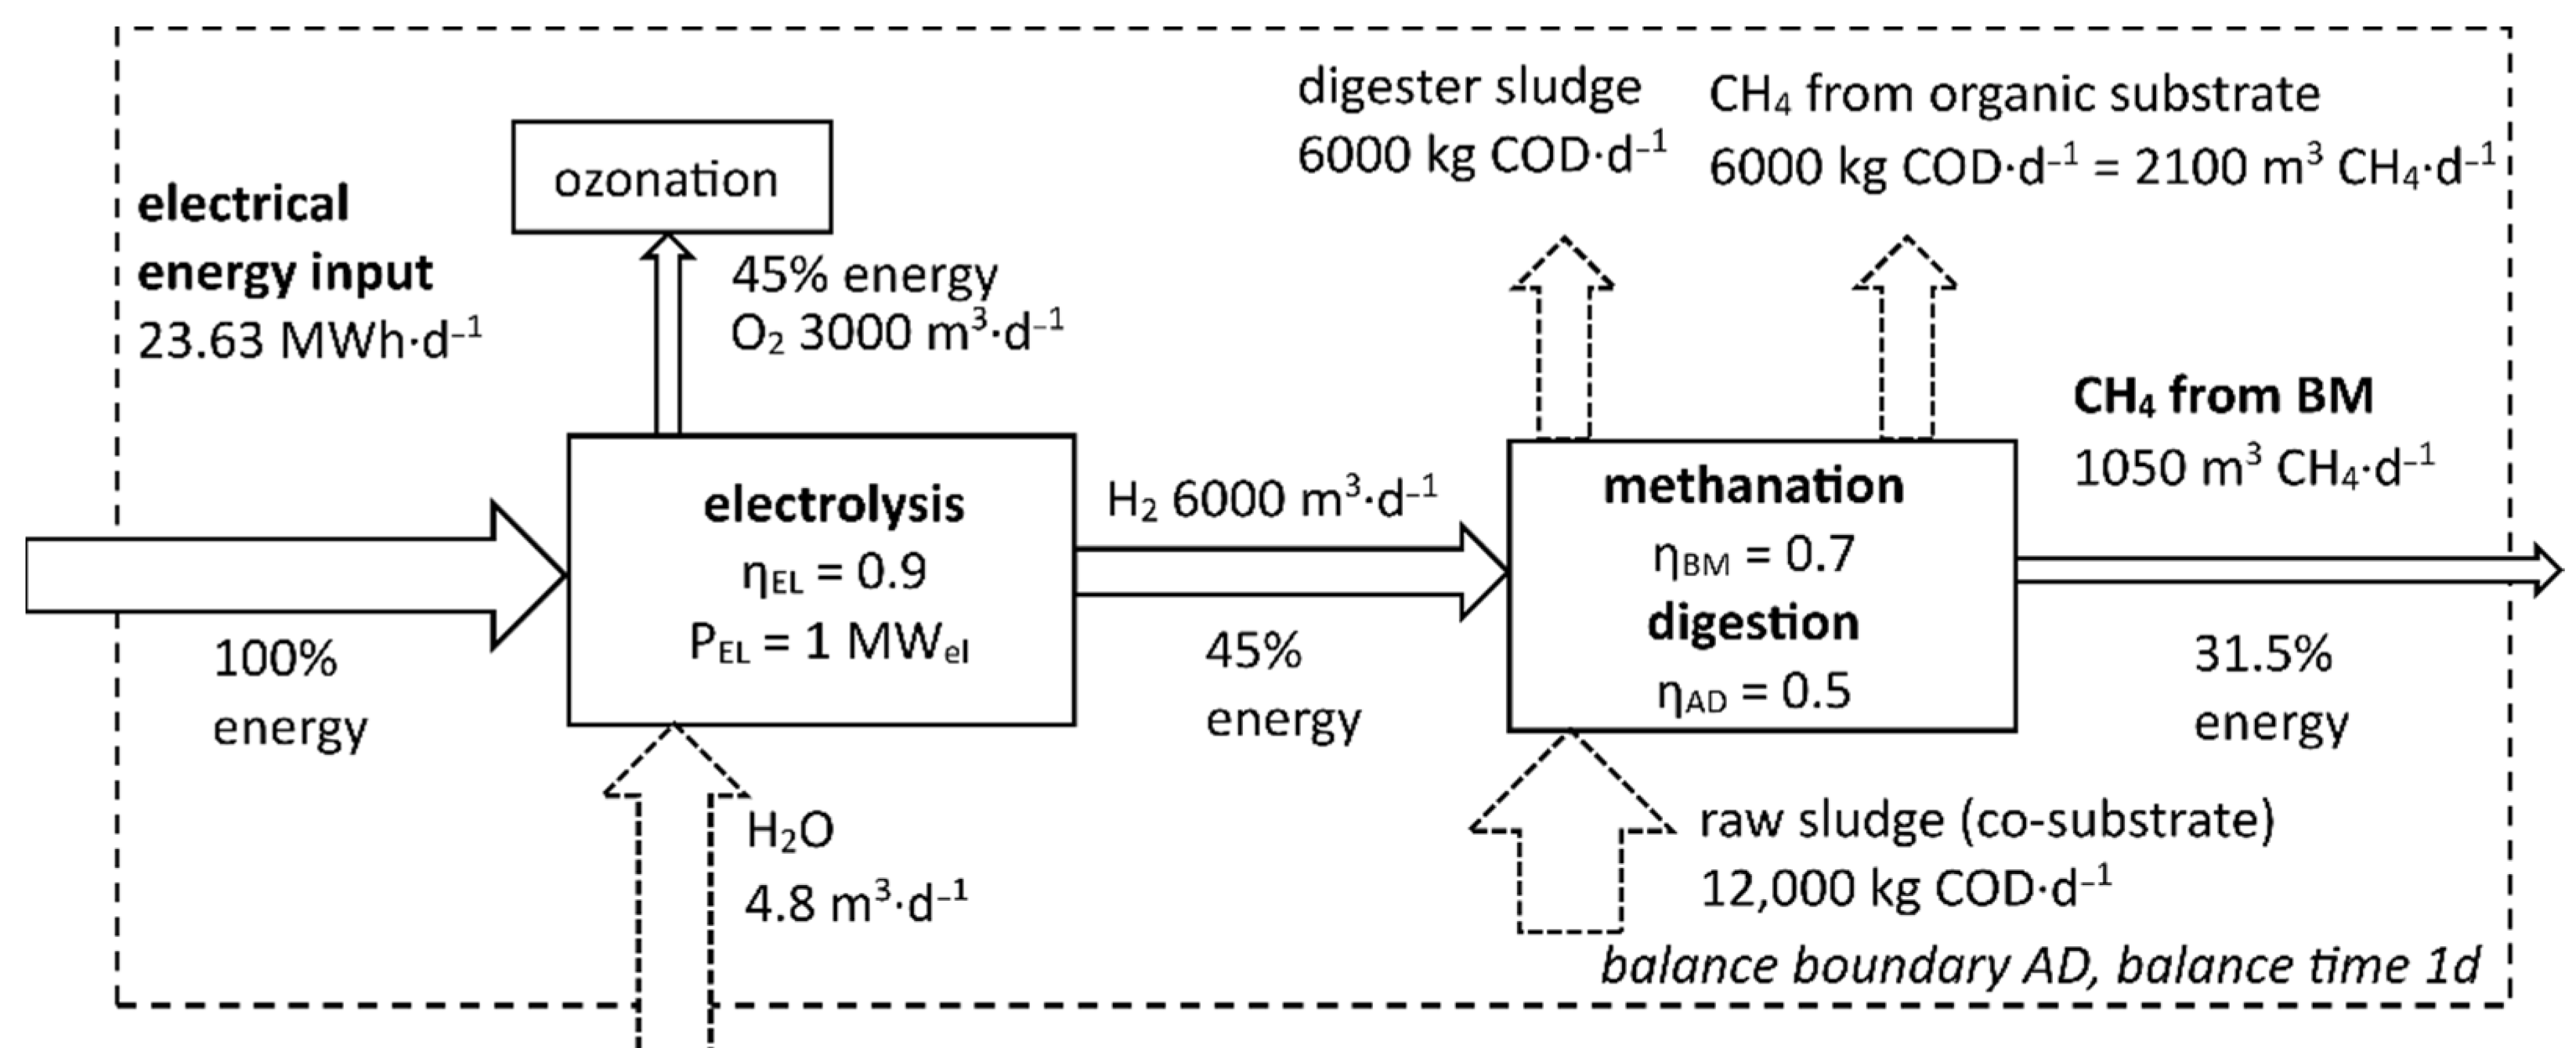
3.3. Maximum Volume-Specific Biological Methanation Rate
4. Results
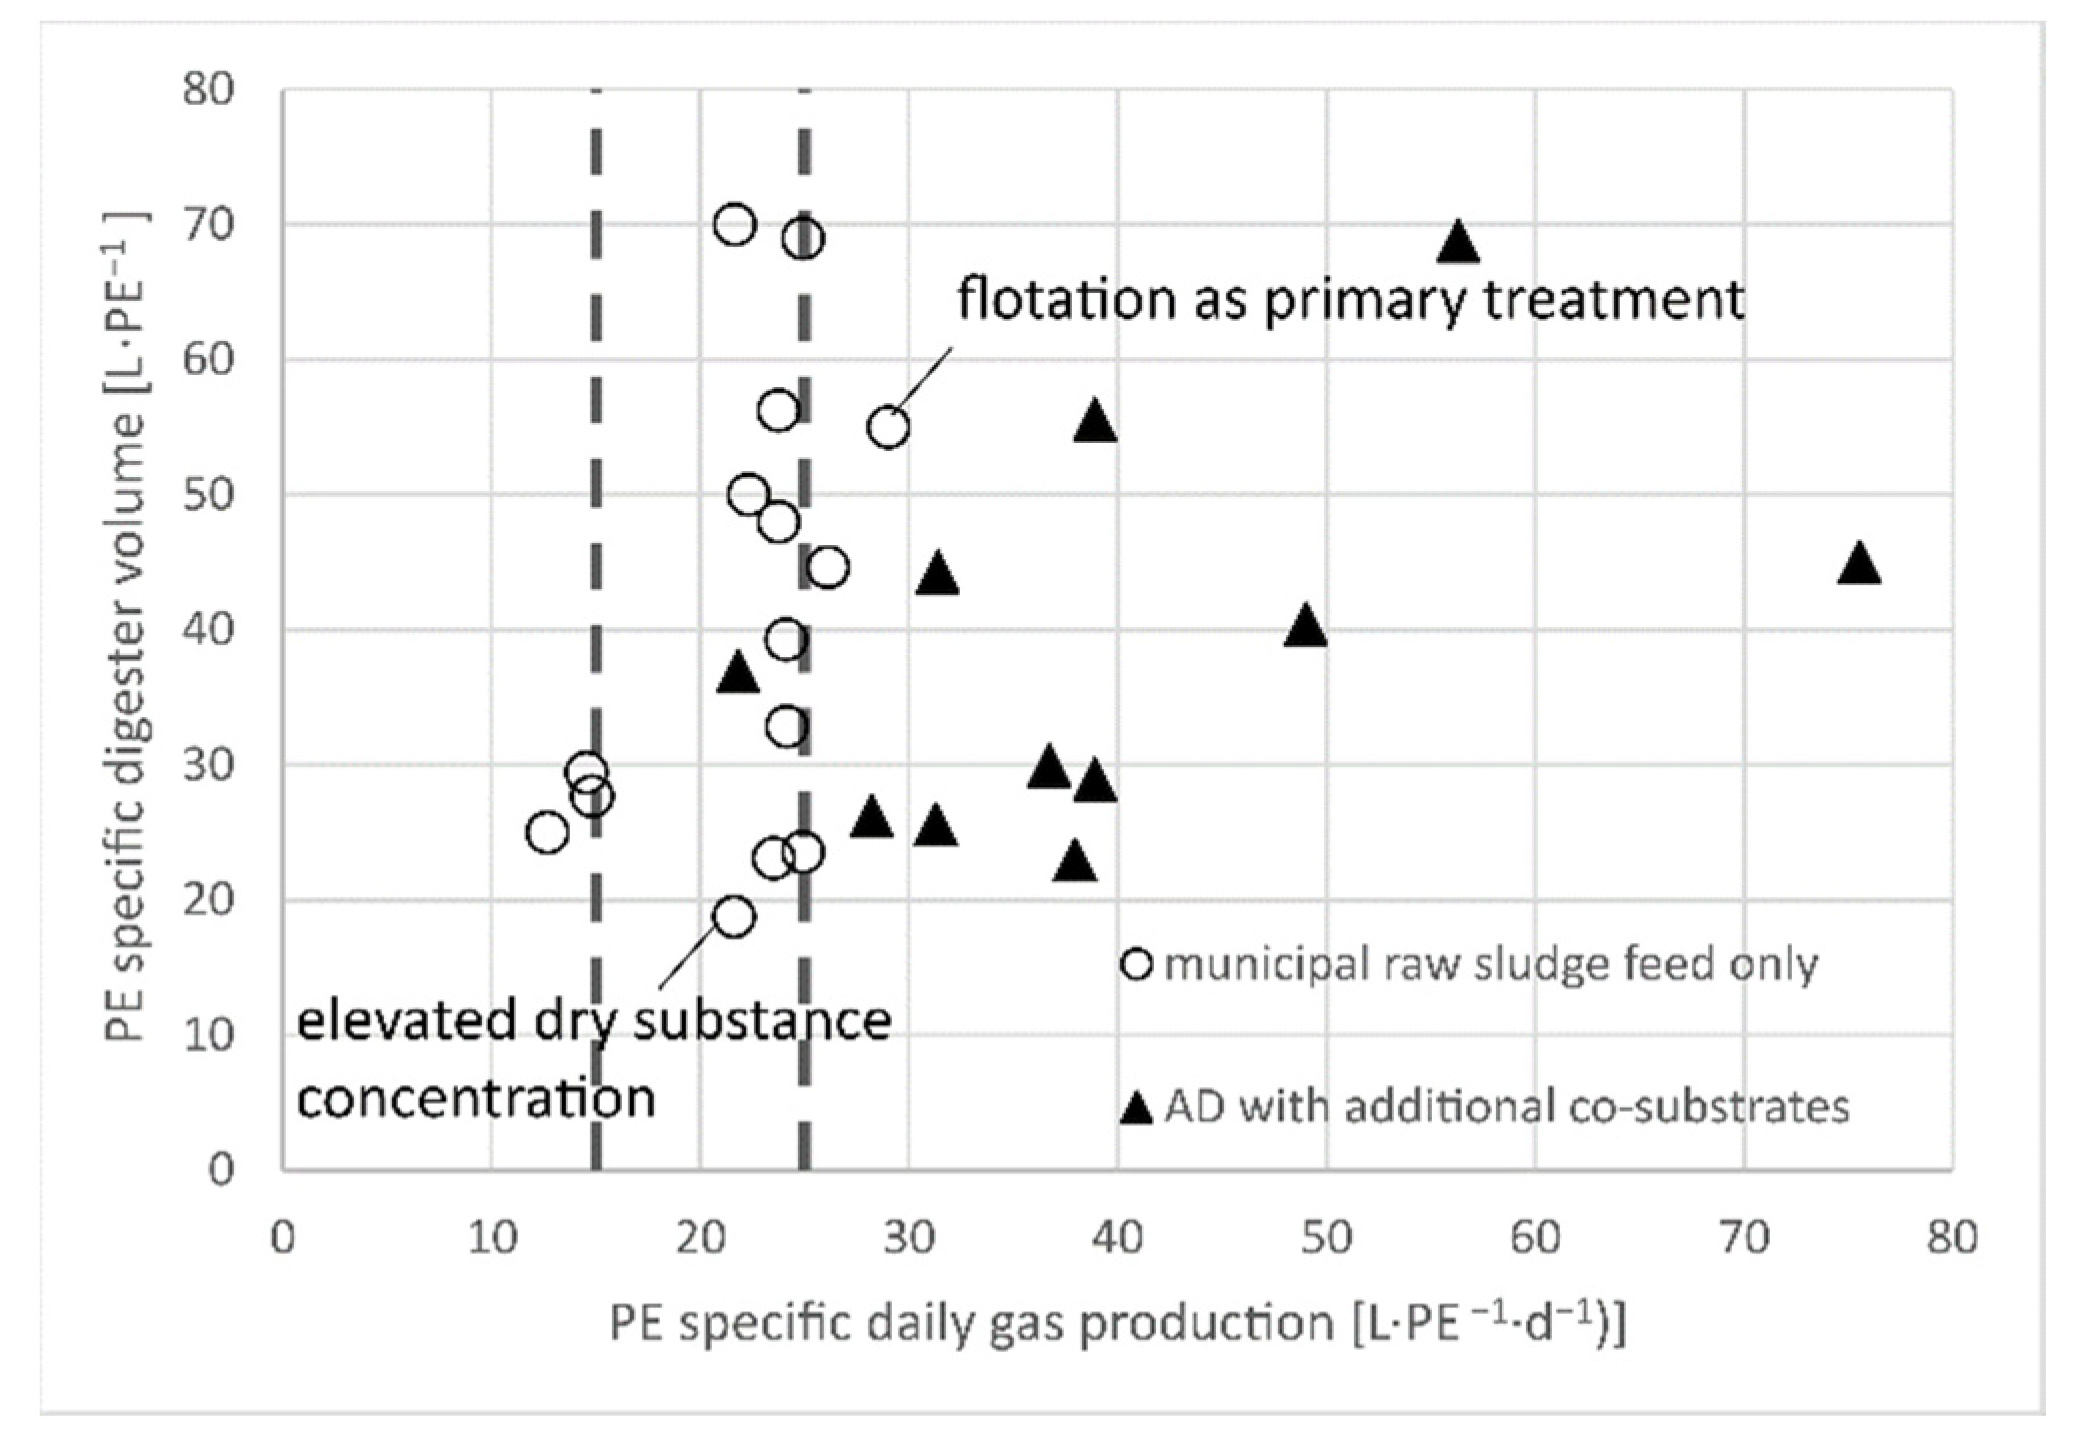
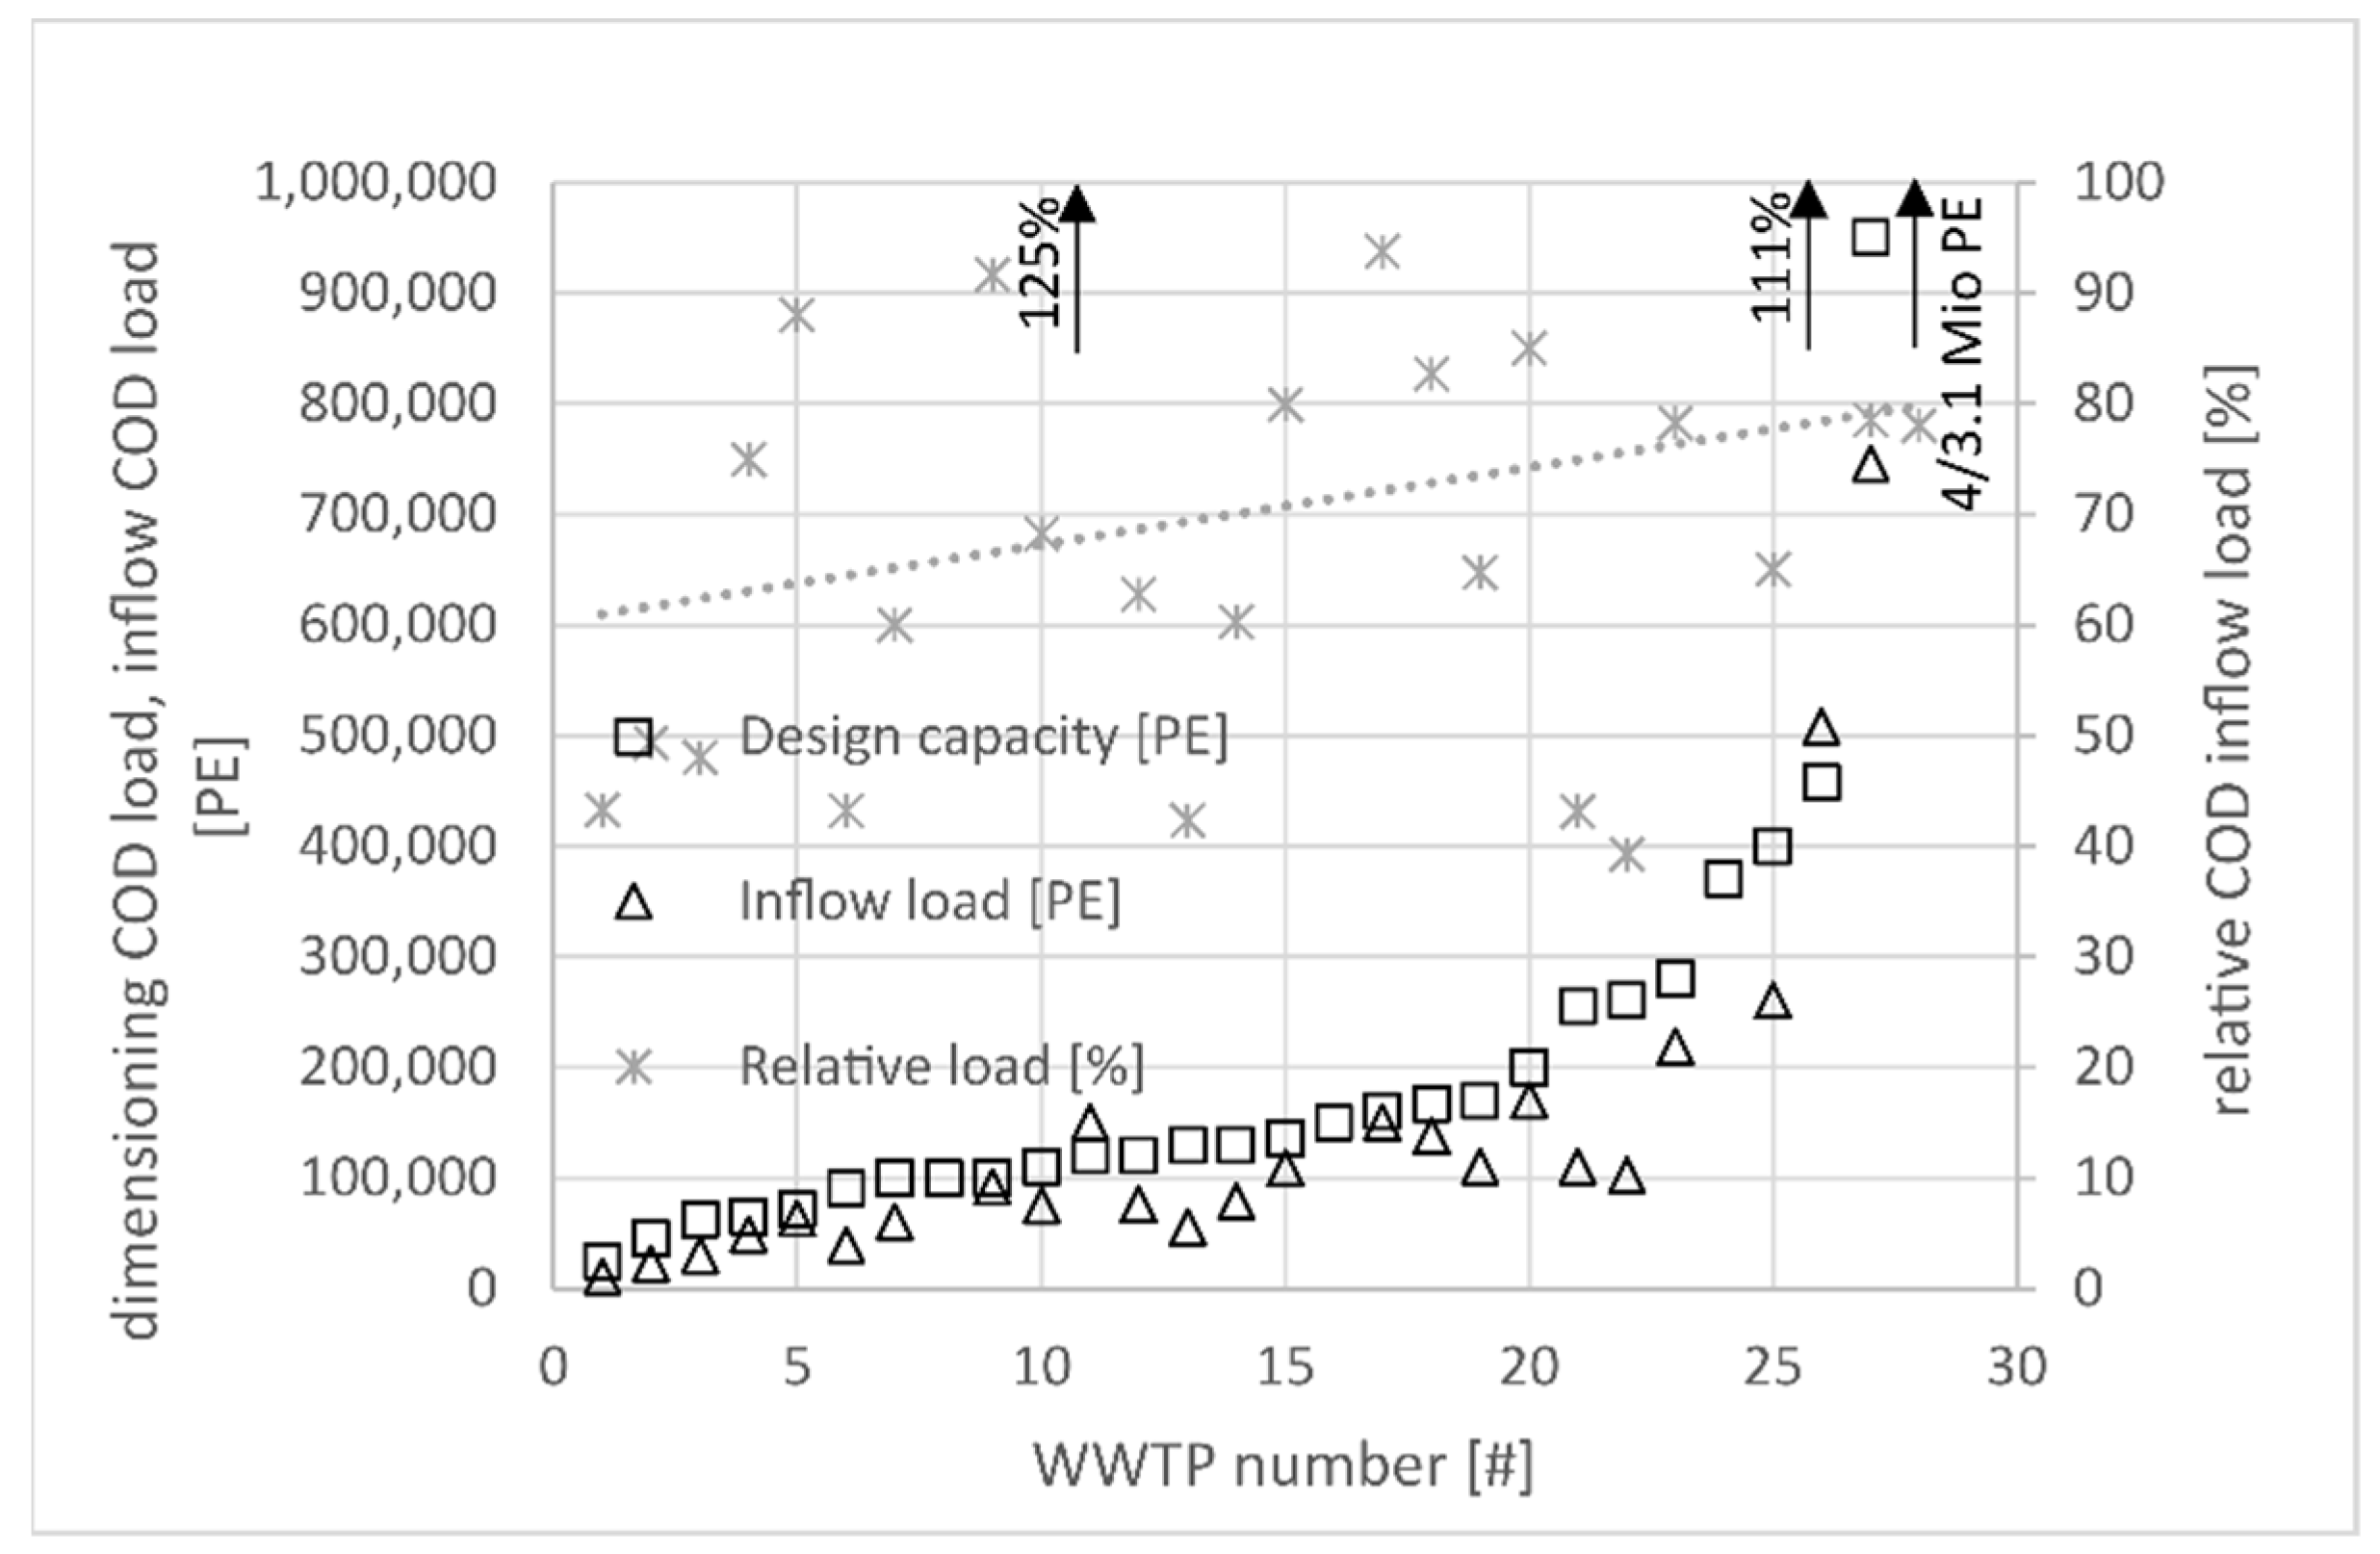
4.1. Survey Data
4.2. Potential for Long-Term Energy Storage Using BM Considering Different Efficiencies
4.3. Extrapolation of the Efficiency of Biological Methanation Transforming Electricity into Biomethane
4.4. Maximum BM Capacity in Austria’s Sewage Sludge Digesters
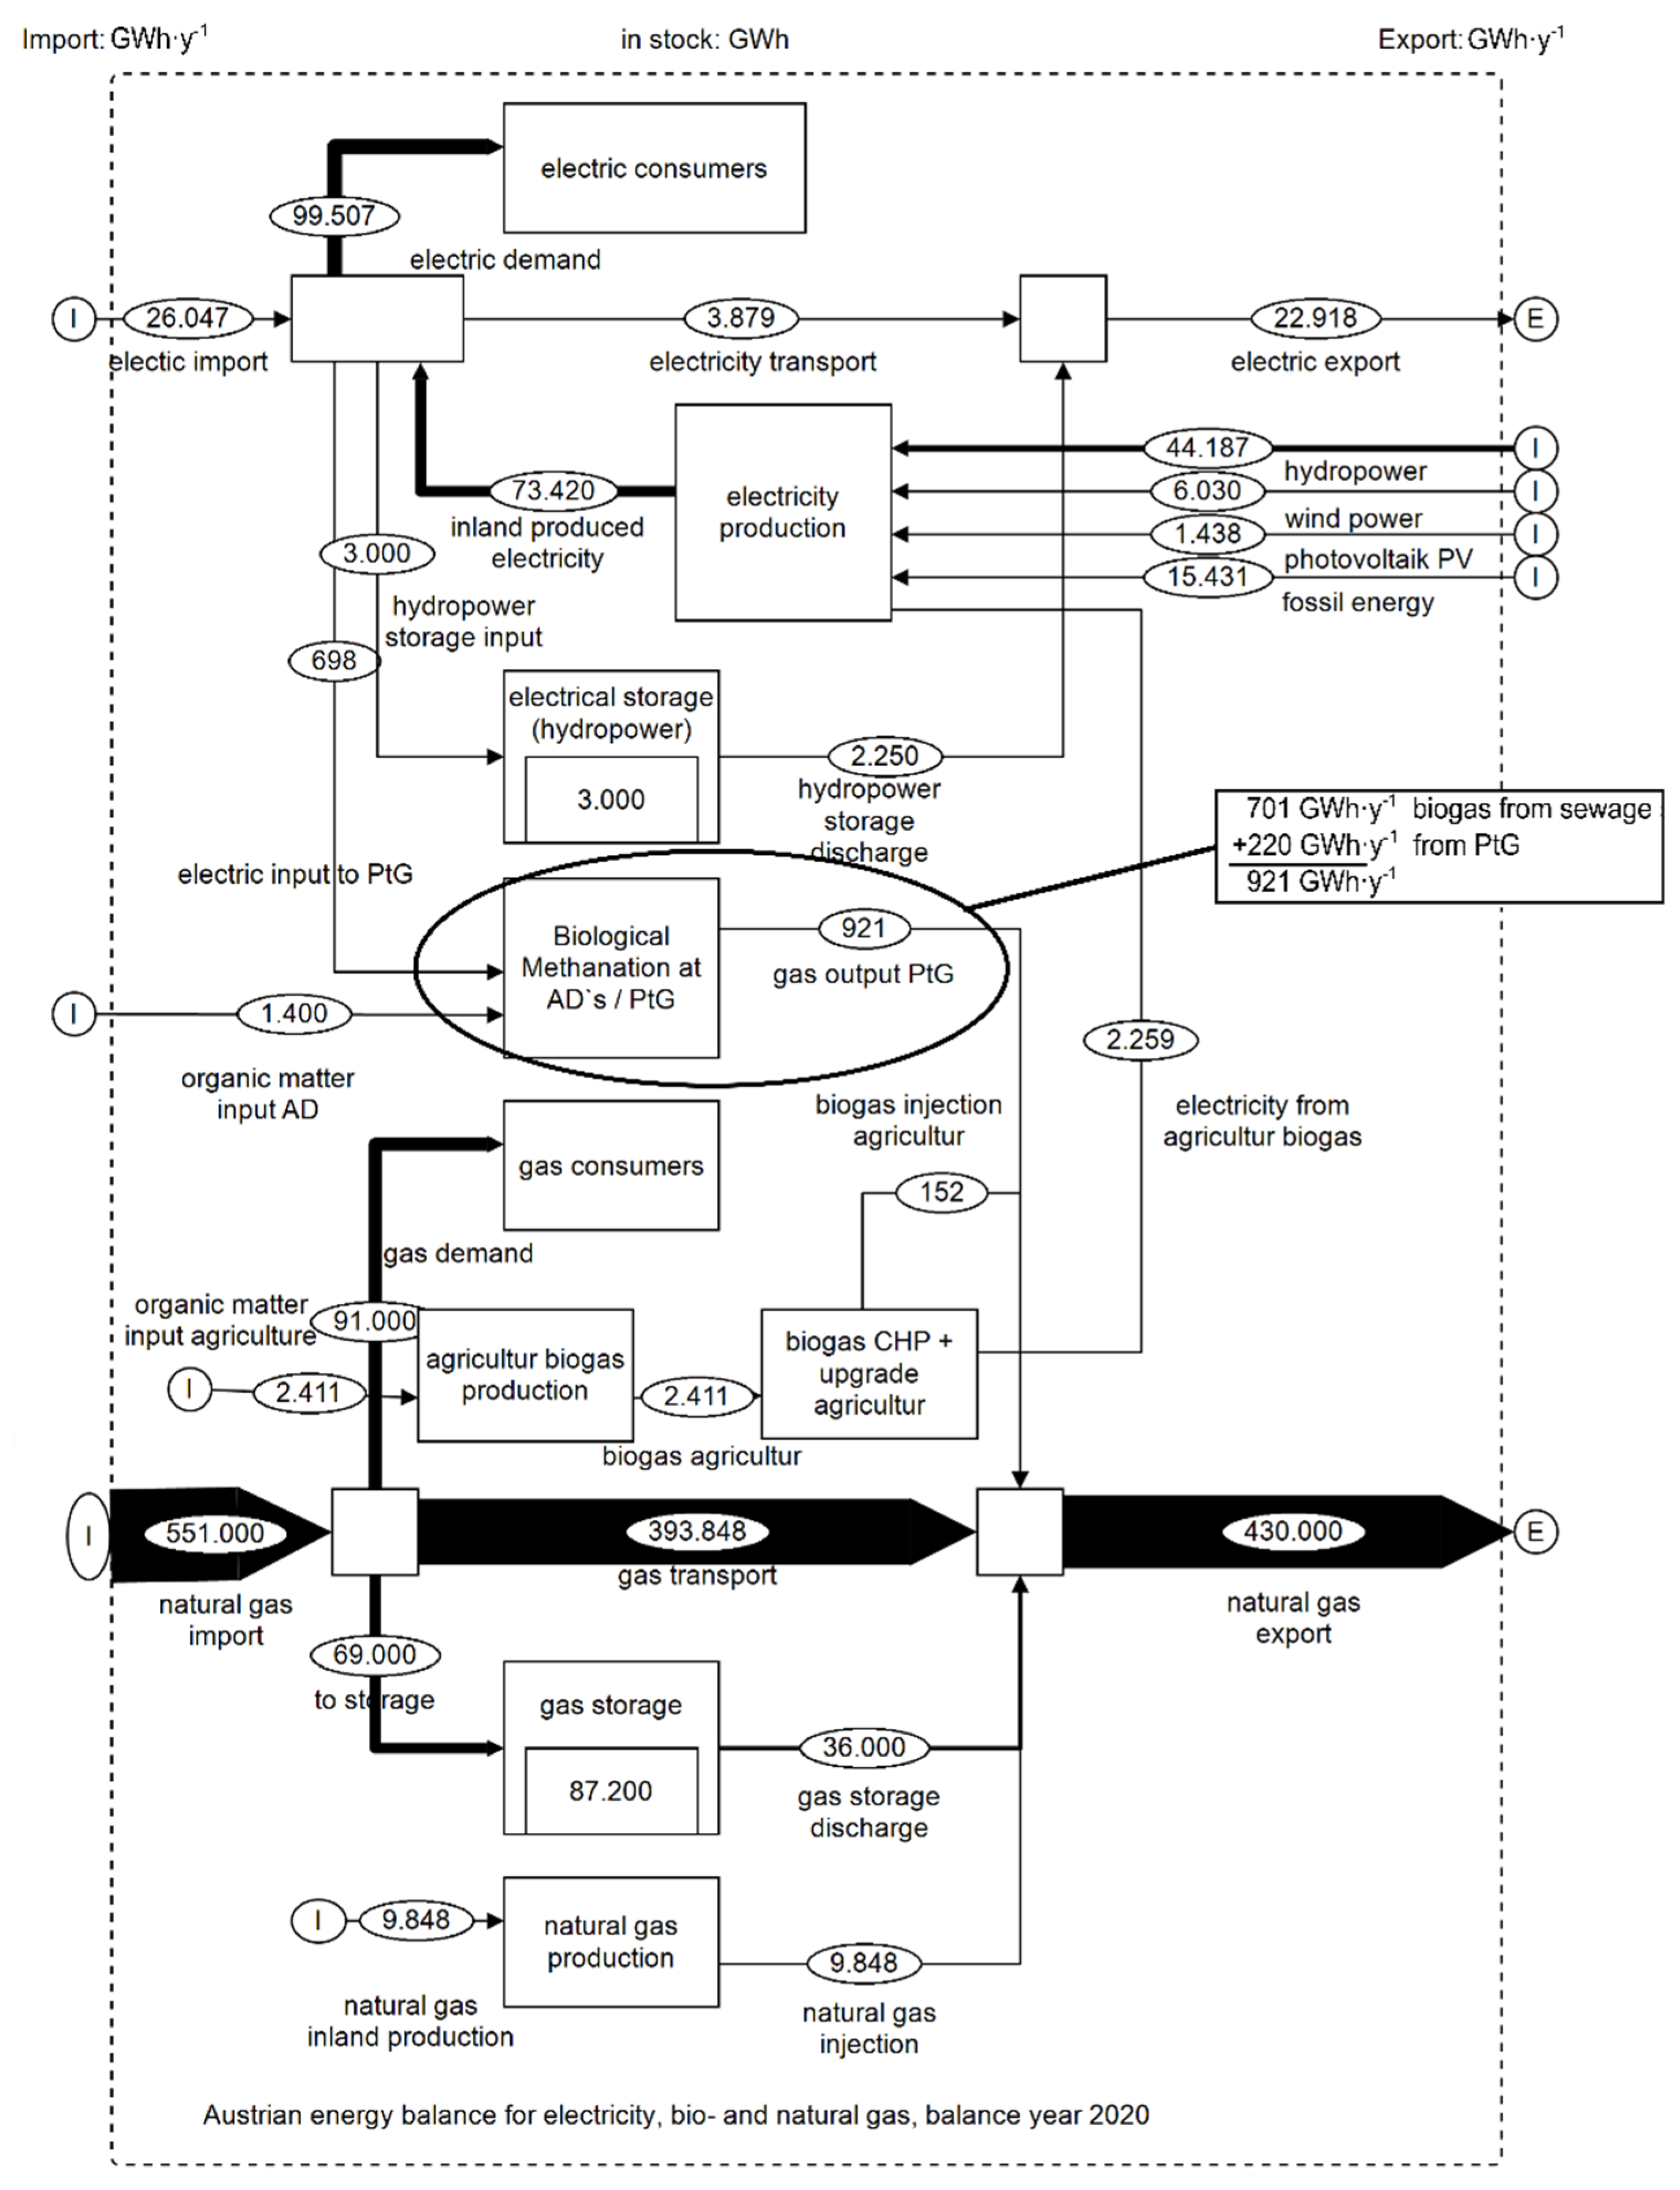
4.5. SANKEY Diagram for Energy Flows through Austrian including BM at ADs
5. Summary
Author Contributions
Funding
Institutional Review Board Statement
Informed Consent Statement
Data Availability Statement
Acknowledgments
Conflicts of Interest
References
- IG Windkraft. Windenergie in Österreich (Wind Energy in Austria). 2019. Available online: https://www.igwindkraft.at (accessed on 15 February 2021).
- Austria Forum. Liste Österreichischer Kraftwerke (List of Austrian Power Plants). 2020. Available online: https://austria-forum.org/af/AustriaWiki/Liste_%C3%B6sterreichischer_Kraftwerke (accessed on 17 July 2021).
- E-Control. Bestandsstatistik Kraftwerkpark (Inventory Statistics of the Power Plant Park). 2020. Available online: https://www.e-control.at/statistik/strom/bestandsstatistik (accessed on 17 July 2021).
- Resch, G.; Burgholzer, B.; Totschnig, G.; Lettner, G.; Auer, H.; Geipel, J.; Haas, R. Stromzukunft Österreich 2030—Analyse der Erfordernisse und Konsequenzen eines Ambitionierten Ausbaus Erneuerbarer Energien (The Future of Electricity in Austria 2030—Analysis of the Requirements and Consequences of an Ambitious Expansion of Renewable Energies). TU Wien, Institut für Energiesystem und Elektrische Antrieb, Energy Economics Group (EEG). 2017. Available online: https://www.igwindkraft.at/mmedia/download/2018.02.05/1517824995073289.pdf (accessed on 15 July 2021).
- E-Control. Betriebsstatistik—Monatliche Erdgasbilanz 2020 (Operating Statistics—Monthly Natural Gas Balance 2020). 2021. Available online: https://www.e-control.at/statistik/g-statistik/archiv/betriebsstatistik/betriebsstatistik2020 (accessed on 15 July 2021).
- BMNT. Mission 2030 Die Österreichische Klima und Energiestrategie (Mission 2030 The Austrian Climate and Energy Strategy) Federal Ministry Republic of Austria Agricuture, Regions and Tourism. 2018. Available online: www.mission2030.bmnt.gv.at (accessed on 10 June 2021).
- European Union. The Role of Gas Storage in Internal Market and in Ensuring Security of Supply. 2014. Available online: https://ec.europa.eu/energy/sites/ener/files/documents/REPORT-Gas%20Storage-20150728.pdf (accessed on 9 September 2021).
- Gas Infrastructure Europe. GSE Storage Map, May 2012, Techn. Ber. Gas Infrastructure Europe. Available online: https://mapcarta.com/W48363377 (accessed on 17 July 2021).
- Schäfer, M.; Gretzschel, O.; Steinmetz, H. The Possible Roles of Wastewater Treatment Plants in Sector Coupling. Energies 2020, 13, 2088. [Google Scholar] [CrossRef] [Green Version]
- Fu, P.; Pudjianto, D.; Zhang, X.; Strbac, G. Integration of Hydrogen into Multi-Energy Systems Optimisation. Energies 2020, 13, 1606. [Google Scholar] [CrossRef] [Green Version]
- Bachman, N. Sustainable Biogas Production in Municipal Wastewater Treatment Plants; IEA Bioenergy: Cork, Ireland, 2015; 20p, ISBN 978-1-910154-22-9. [Google Scholar]
- Gujer, W.; Zehnder, A.J.B. Conversion Processes in Anaerobic Digestion. Water Sci. Technol. 1983, 15, 127–167. [Google Scholar] [CrossRef]
- Persson, M.; Jonsson, O.; Wellinger, A. Biogas Upgrading to Vehicle Fuel Standards and Grid Injection. In IEA Bioenergy Task; IEA Bioenergy: Cork, Ireland. 2006. Available online: http://www.iea-biogas.net/files/daten-redaktion/download/publi-task37/upgrading_report_final.pdf (accessed on 18 June 2021).
- Soreanu, G.; Béland, M.; Falletta, P.; Edmonson, K.; Svoboda, L.; Al-Jamal, M.; Seto, P. Approaches concerning siloxane removal from biogas—A review. Can. Biosyst. Eng. 2011, 53, 8–18. [Google Scholar]
- Munoz, R.C.; Meier, L.; Diaz, I.; Jeison, D. A review on the state-of-the-art of physical/chemical and biological technologies for biogas upgrading. Rev. Environ. Sci. Bio/Technol. 2015, 14, 727–759. [Google Scholar] [CrossRef] [Green Version]
- ÖVGW. Richtlinie (Guideline) G31. Erdgas in Österreich—Gasbeschaffenheit (Natural Gas in Austria—Gas Quality) Österreichischer Verein für Gas- und Wasserfach. 2001. Available online: https://portal.ovgw.at (accessed on 11 June 2021).
- ÖVGW. Richtlinie G33 (2006) Regenerative Gase—Biogas (Regenerative Gases—Biogas) Österreichischer Verein für Gas- und Wasserfach. Available online: https://www.biogas-netzeinspeisung.at/rechtliche-planung/einspeisung-in-das-oeffentliche-gasnetz/oevgw-g33.html (accessed on 9 September 2021).
- ÖVGW. Richtlinie (Guideline) G B210. Regeneratives Gas—Biogas (Guideline G B210 Regenerative Gas—Biogas), 2021, Österreichischer Verein für Gas- und Wasserfach. Available online: https://portal.ovgw.at/pls/f?p=101:203::::RP,203:P203_ID,P203_FROM_PAGE_ID:1075524,202 (accessed on 9 September 2021).
- Kim, S.; Choi, K.; Chung, J. Reduction in carbon dioxide and production of methane by biological reaction in the electronics industry. Int. J. Hydrogen Energy 2013, 38, 3488–3496. [Google Scholar] [CrossRef]
- Schäfer, M. Ein Methodischer Ansatz zur Bereitstellung Energetischer Flexibilität durch einen Anpassungsfähigen Kläranlagenbetrieb. (A Methodical Approach to Providing Energy Flexibility through an Adaptable Wastewater Treatment Plant Operation); Institut Wasser Infrastruktur Ressourcen 5/2019; Technische Universität Kaiserslautern: Kaiserslautern, Germany, 2019; ISSN1 2570-1460. ISBN1 978-3-95974-108-8. Available online: https://kluedo.ub.uni-kl.de/frontdoor/deliver/index/docId/5608/file/SR_WIR_Band-5_Dissertation_Sch%c3%a4fer.pdf (accessed on 1 June 2021)ISBN2 978-3-95974-108-8. ISSN2 2570-1460.
- Bassani, I.; Kougias, P.G.; Treu, L.; Angelidaki, I. Biogas Upgrading via Hydrogenotrophic Methanogenesis in Two-Stage Continuous Stirred Tank Reactors at Mesophilic and Thermophilic Conditions. Environ. Sci. Technol. 2015, 49, 12585–12593. [Google Scholar] [CrossRef] [PubMed]
- Bassani, I.; Kougias, P.G.; Angelidaki, I. In situ biogas upgrading in thermophilic granular UASB reactor: Key factors affecting the hydrogen mass transfer rate. Bioresour. Technol. 2016, 221, 485–491. [Google Scholar] [CrossRef] [PubMed] [Green Version]
- Xu, H.; Wang, K.; Zhang, X.; Gong, H.; Xia, Y.; Holmes, D.E. Application of in situ H2-assisted biogas upgrading in high-rate anaerobic wastewater treatment. Bioresour. Technol. 2019, 299, 122598. [Google Scholar] [CrossRef] [PubMed]
- Lee, J.C.; Kim, J.H.; Chang, W.S.; Pak, D. Biological conversion of CO2 to CH4 using hydrogenotrophic methanogen in a fixed bed reactor. J. Chem. Technol. Biotechnol. 2012, 87, 844–847. [Google Scholar] [CrossRef]
- Burkhardt, M.; Busch, G. Methanation of hydrogen and carbon dioxide. Appl. Energy 2013, 111, 74–79. [Google Scholar] [CrossRef]
- Strübing, D.; Huber, B.; Lebuhn, M.; Drewes, J.E.; Koch, K. High performance biological methanation in a thermophilic anaerobic trickle bed reactor. Bioresour. Technol. 2017, 245, 1176–1183. [Google Scholar] [CrossRef] [PubMed]
- Porté, H.; Kougias, P.G.; Alfaro, N.; Treu, L.; Campanaro, S.; Angelidaki, I. Process performance and microbial community structure in thermophilic trickling biofilter reactors for biogas upgrading. Sci. Total Environ. 2018, 655, 529–538. [Google Scholar] [CrossRef] [PubMed]
- Luo, G.; Angelidaki, I. Hollow fiber membrane based H2 diffusion for efficient in situ biogas upgrading in an anaerobic reactor. Appl. Microbiol. Biotechnol. 2013, 97, 3739–3744. [Google Scholar] [CrossRef] [PubMed]
- Díaz, I.; Pérez, C.; Alfaro, N.; Fdz-Polanco, F. A feasibility study on the bioconversion of CO2 and H2 to biomethane by gas sparging through polymeric membranes. Bioresour. Technol. 2015, 185, 246–253. [Google Scholar] [CrossRef] [PubMed]
- IEA Bioenergy. IEA Bioenergy Task 37—Country Reports Summaries 2019. 2020. Available online: https://task37.ieabioenergy.com/country-reports.html?file=files/daten-redaktion/download/publications/country-reports/Summary/IEA%20Task%2037%20Country%20Report%20Summaries%202019.pdf (accessed on 9 July 2020).
- IEA Bioenergy. IEA Bioenergy Task 37—Country Reports Summary 2014. 2015. Available online: http://task37.ieabioenergy.com/country-reports.html (accessed on 9 July 2020).
- ÖWAV. Branchenbild der Österreichischen Abwasserwirtschaft 2020 (Image of the Austrian Wastewater Industry in 2020). 2019. Available online: https://www.oewav.at/Publikationen (accessed on 9 July 2020).
- ÖWAV. Branchenbild der Österreichischen Abwasserwirtschaft 2016 (Image of the Austrian Wastewater Industry in 2016). 2015. Available online: https://www.oewav.at/Kontext/WebService/SecureFileAccess.aspx?fileguid={e0758c47-28af-4dd3-aaeb-b76d282a92c3} (accessed on 9 September 2021).
- Luo, G.; Angelidaki, I. Co-digestion of manure and whey for in situ biogas upgrading by the addition of H2: Process performance and microbial insights. Appl. Microbiol. Biotechnol. 2012, 97, 1373–1381. [Google Scholar] [CrossRef] [PubMed]
- Tauber, J.; Svardal, K.; Krampe, J. BioMAra—Biologische Methanisierung in Faulbehältern Kommunaler Abwasserreinigungsanlagen 2. Zwischenbericht (BioMAra—Biological Methanation in Digesters in Municipal Wastewater Treatment Plants 2nd Interim Report). TU Wien, Institut for Water Quality and Ressource Management, Wien, Austria. 2020. Available online: https://iwr.tuwien.ac.at/wasser/forschung/projekte/projekte/biomara/ (accessed on 19 July 2020).
- Österreichischer Biomasseverband. Basisdaten 2019 Bioenergie (Austrian Biomass Association, Basic Data 2019 Bioenergy). 2019. Available online: www.biomasserverband.at (accessed on 19 July 2020).
- Cencic, O. Nonlinear data reconciliation in material flow analysis with software STAN. Sustain. Environ. Res. 2016, 26, 291–298. [Google Scholar] [CrossRef] [Green Version]
- E-Control. Statistikbroschüre 2019 (Statistics Brochure 2019). Energy-Control Austria, A-1010 Wien. 2019. Available online: www.e-control.at (accessed on 9 July 2020).
- Statistik Austria. Österreich-Energiebilanzen 1970–2018 (Austria Energy Balances 1970–2018). Bundesanstalt “Statistik Österreich” Guglgasse 13, 1110 Wien. 2019. Available online: http://www.statistik-austria.com/web_de/statistiken/energie_umwelt_innovation_mobilitaet/energie_und_umwelt/energie/energiebilanzen/120091.html (accessed on 22 July 2020).
- Ebswien. Kläranlage—Zahlen, Daten, Fakten (Sewage Treatment Plant—Numbers, Data, Facts). 2021. Available online: https://www.ebswien.at/klaeranlage/ (accessed on 17 July 2021).
- Lindtner, S.; Leitfaden für die Erstellung eines Energiekonzeptes Kommunaler Kläranlagen (Guidelines for Creating an Energy Concept for Municipal Sewage Treatment Plants). Lebensministerium, Austria. 2008. Available online: http://www.abwasserenergie.at/fileadmin/energie_aus_abwasser/user_upload/energieleitfaden_endversion.pdf (accessed on 17 July 2021).
- Haberkern, B.; Maier, W.; Schneider, U. Steigerung der Energieeffizienz auf Kommunalen Kläranlagen (Increasing Energy Efficiency in Municipal Wastewater Treatment Plants). Umweltbundesamt Texte 11/08. 2008. Available online: https://www.umweltbundesamt.de/sites/default/files/medien/publikation/long/3347.pdf (accessed on 9 September 2021).
- VSA—Verband Schweizer Abwasser- und Gewässerschutz-Fachleute. Energie in ARA, Leitfaden zur Energieoptimierung auf Abwasserreinigungsanlagen. (Energy in WWTPs, Guidelines for Energy Optimization in Wastewater Treatment Plants). Handbuch im Auftrag des Bundesamtes für Energie und des VSA, Verband Schweizer Abwasser- und Gewässerschutzfachleute, Schweiz. 2010. Available online: www.bafu.admin.ch (accessed on 15 July 2020).
- Sterner, M.; Stadler, I. Energiespeicher—Bedarf, Technologien, Integration (Energy Storage—Needs, Technologies, Integration); Springer Vieweg: Wiesbaden, Germany, 2017. [Google Scholar] [CrossRef]
- Thema, M.; Bauer, F.; Sterner, M. Power-to-Gas: Electrolysis and methanation status review. Renew. Sustain. Energy Rev. 2019, 112, 775–787. [Google Scholar] [CrossRef]
- E-Control. Betriebsstatistik—Gesamte Versorgung in Österreich—Bilanz Elektrischer Energie (Operating Statistics—Total Supply in Austria—Electrical Energy Balance). 2020. Available online: https://www.e-control.at/documents/1785851/1811609/BStGes-JR1_Bilanz.xlsx/c971e00f-b4e1-4a39-b4fe-d16d0fba7041?t=1596094961816 (accessed on 17 July 2021).


| Hydropower | Gas Grid | Sum | ||||
|---|---|---|---|---|---|---|
| (114 Plants) | (9 Storage Facilities) | |||||
| Storage Plants (60) | Pump Storage Plants (54) | |||||
| power | storage | (GW) | - | 3.4 (2) | 30.6 (4) | 34 |
| discharge | (GW) | 5.4 (1) | 3.4 (2) | 37.4 (4) | 46.2 | |
| capacity | storage | (GWh) | 3000 (1) | 87,200 (3) | 90,200 | |
| Parameter | Unit | Biogas Composition | Quality According Austrian Standards ÖVGW G31 [16] and ÖVGW G33 [17] | |
|---|---|---|---|---|
| methane | CH4 | (%) | 53–70 | >97 |
| carbon dioxide | CO2 | (%) | 30–47 | ≤2 |
| oxygen | O2 | (%) | 0–1 | 0.5 |
| nitrogen | N2 | (%) | 0–3 | ≤5 |
| ammonia | NH4 | (mg·m−3) | <100 | technical free |
| hydrogen sulfide | H2S | (mg·m−3) | <1000 | ≤5 |
| water—dewpoint | H2O | (°C) | ≤37 °C, 1 bar | ≤−8 °C, 40 bar |
| calorific value | Hi | (kWh·m−3) | 6.7–8.4 | 10.7–12.8 |
| Wobbe Index | Wi | (kWh·m−3) | 6.9–9.5 | 13.3–15.7 |
| Country | Reference | Total Biogas Production from Sewage Sludge, Industrial Wastewater, Biowaste, Aggricultural Residuals and Landfills | Number of Biogas Plants Agricultur and Sewage Sludge AD’s | Biogas Production in WWTPs Sewage Sludge Digestion only | Number of WWTPs Including AD | |
|---|---|---|---|---|---|---|
| Year | GWh·y−1 | GWh·y−1 | % of Total | # | ||
| Australia | 2017 | 1587 (3) | 242 | 381 (3) | 24% | 52 |
| Austria | 2020 | 1613 (1) | 287 | n.a. | n.a. | n.a. |
| Brazil | 2016 | 5219 | 165 | 210 | 4% | 10 |
| Canada | 2019 | n.a. | 150 | n.a. | n.a. | 31 |
| Denmark | 2018 | 3723 | 172 | 308 | 8% | 51 |
| Finland | 2017 | 692 | 96 | 126 | 18% | 16 |
| France | 2017 | 3527 (2) | 687 | 442 (2) | 8% | 88 |
| Germany | 2019 | 52,158 (2) | 10,551 | 3657 (2) | 7% | 1274 |
| Norway | 2010 | 500 | 129 | 164 | 33% | 129 |
| South Korea | 2017 | 2815 | 119 | 630 | 38% | 36 |
| Sweden | 2018 | 2044 | 280 | 715 | 40% | 138 |
| Switzerland | 2018 | 1454 | 634 | 633 | 49% | 473 |
| The Netherlands | 2018 | 3465 | 262 | 640 | 20% | 80 |
| United Kingdom | 2018 | 23,762 (1) | 994 | 4266 (1) | 11% | 163 |
| sum | sum | sum | mean | sum | ||
| 102,559 | 14,640 | 12,885 | 23% | 2678 | ||
| WWTP | Design | Inflow | Relative | Digesters | Digester | Co-Substrate | Specific | Specific | Gas Grid | Yearly | |
|---|---|---|---|---|---|---|---|---|---|---|---|
| Capacity | Load | Load | Number | Volume | Share | Gas Production | AD Volume | Connection | Gas Production | ||
| # | (PECOD) | (PECOD) | (%) | (-) | (m3) | (% COD) | (L · PE−1 · d−1) | (L · PE−1) | (Yes / No) | (m3 · y−1) | |
| 1 | 24,500 | 10,600 | 43 | 1 | 1690 | 0 | 24.91 | 68.98 | No | 96,360 | |
| 2 | 45,000 | 22,200 | 49 | 1 | 1300 | 36 | 38.91 | 28.89 | Yes | 315,279 | |
| 3 | 62,500 | 30,012 | 48 | 1 | 1600 | 5 | 31.29 | 25.60 | Yes | 342,768 | |
| 4 | 65,000 | 48,690 | 75 | 1 | 1800 | 0 | 14.82 | 27.69 | Yes | 263,394 | |
| 5 | 71,670 | 63,070 | 88 | 2 | 3200 | 0 | 26.11 | 44.65 | Yes | 601,088 | |
| 6 | 90,000 | 38,850 | 43 | 2 | 5000 | 5 | 38.92 | 55.56 | Yes | 551,953 | |
| 7 | 100,000 | 60,000 | 60 | 2 | 7000 | 0 | 21.67 | 70.00 | Yes | 474,500 | |
| 8 | 100,000 | - | - | 2 | 4600 | - | 46.00 | - | 730,000 | ||
| 9 | 100,000 | 91,663 | 92 | 1 | 2500 | 0 | 12.69 | 25.00 | - | 424,680 | |
| 10 | 110,000 | 75,000 | 68 | 2 | 5500 | 0 | 22.32 | 50.00 | Yes | 610,946 | |
| 11 | 120,000 | 150,000 | 125 | 3 | 8250 | 43 | 56.32 | 68.75 | Yes | 3,083,520 | |
| 12 | 120,000 | 75,309 | 63 | 2 | 5400 | 47 | 75.53 | 45.00 | Yes | 2,076,263 | |
| 13 | 130,000 | 55,000 | 42 | 2 | 4800 | 5 | 21.82 | 36.92 | No | 438,000 | |
| 14 | 130,000 | 78,300 | 60 | 2 | 3000 | 0 | 23.51 | 23.08 | Yes | 672,000 | |
| 15 | 135,500 | 108,300 | 80 | 2 | 6000 | 6 | 31.39 | 44.28 | Yes | 1,241,000 | |
| 16 | 150,000 | - | - | 3 | 7200 | - | 48.00 | - | 1,095,000 | ||
| 17 | 160,000 | 150,000 | 94 | 2 | 9000 | 0 | 23.74 | 56.25 | Yes | 1,300,000 | |
| 18 | 167,000 | 138,000 | 83 | 2 | 5000 | 23 | 36.72 | 29.94 | Yes | 1,849,384 | |
| 19 | 170,000 | 110,000 | 65 | 2 | 5000 | 0 | 14.55 | 29.41 | No (1) | 584,000 | |
| 20 | 200,000 | 170,000 | 85 | 2 | 11,000 | 0 | 29.01 | 55.00 | n.a. | 1,800,000 | |
| 21 | 255,000 | 110,000 | 43 | 2 | 6000 | 0 | 24.91 | 23.53 | Yes | 1,000,000 | |
| 22 | 260,000 | 102,000 | 39 | 2 | 10,500 | 45 | 49.02 | 40.38 | Yes (2) | 1,825,000 | |
| 23 | 280,000 | 219,000 | 78 | 3 | 11,000 | 0 | 24.13 | 39.29 | No | 1,928,832 | |
| 24 | 370,000 | - | - | 2 | 8000 | - | - | 21.62 | - | - | |
| 25 | 400,000 | 260,000 | 65 | 2 | 9200 | 20 | 37.93 | 23.00 | Yes | 3,600,000 | |
| 26 | 457,579 | 507,913 | 111 | 5 | 12,000 | 5 | 28.23 | 26.22 | Yes | 5,232,742 | |
| 27 | 950,000 | 745,625 | 78 | 3 | 31,200 | 0 | 24.14 | 32.84 | Yes (2) | 6,570,000 | |
| 28 (3) | 4,000,000 | 3,120,000 | 78 | 6 | 75,000 | 0 | 21.60 | 18.75 | No | 24,600,000 | |
| sum | 9,223,749 | 6,539,532 | 62 | 261,740 | 22.01 (4)/40.72 (5) | 18 Yes/5 No | 63,306,709 | ||||
| mean | 70 | 4 | 10 | 30.17 (6) | 39.45 | ≈411 GWh·y−1 |
| Category | Number of WWTPs | Sum | Share | Biogas | Energy |
|---|---|---|---|---|---|
| Design Capacity | Including AD | Production | Production | ||
| PECOD | # | PECOD | [-] | Mio m3·y−1 | GWh·y−1 |
| >50,000 | 59 | 13.6 Mio | 90% | 76.45 | 734 |
| >20,000 | 137 | 14.8 Mio | 98% | 83.19 | 799 |
| All | 164 | 15.1 Mio | 100% | 84.88 | 815 |
| Country | Reference | Total Biogas Production from Sewage Sludge, Industrial Wastewater, Biowaste, Aggricultural Residuals and Landfills | Number of Biogas Plants Agricultur and Sewage Sludge AD’s | Biogas Production in WWTPs Sewage Sludge Digestion Only | Number of WWTPs Including AD | |
|---|---|---|---|---|---|---|
| Year | GWh·y−1 | GWh·y−1 | % of Total | # | ||
| Austria | 2020 | 1715 (1) | 315 | 815 (2) | 44% (2) | 164 (3) |
| Gas | Classic AD | Anaerobic Digestion Including In Situ Methanation | ||||||||
|---|---|---|---|---|---|---|---|---|---|---|
| Components | without BM | ηBM = 0.7 | ηBM = 0.8 | ηBM = 0.93 | ηBM = 1.0 | |||||
| Daily Volume | Share | Daily Volume | Share | Daily Volume | Share | Daily Volume | Share | Daily Volume | Share | |
| (m3·d−1) | (%) | (m3·d−1) | (%) | (m3·d−1) | (%) | (m3·d−1) | (%) | (m3·d−1) | (%) | |
| H2 input | 0 | - | 5600 | - | 5600 | - | 5600 | - | 5600 | - |
| CH4 | 2100 | 60% | 3150 | 64% | 3220 | 70% | 3500 | 88% | 3500 | 100% |
| CO2 | 1400 | 40% | 350 | 7% | 280 | 6% | 108 | 2% | 0 | 0% |
| H2 | 0 | 0% | 1400 | 29% | 1120 | 24% | 392 | 10% | 0 | 0% |
| sum output | 3500 | 100% | 5300 | 100% | 4620 | 100% | 4000 | 100% | 3500 | 100% |
Publisher’s Note: MDPI stays neutral with regard to jurisdictional claims in published maps and institutional affiliations. |
© 2021 by the authors. Licensee MDPI, Basel, Switzerland. This article is an open access article distributed under the terms and conditions of the Creative Commons Attribution (CC BY) license (https://creativecommons.org/licenses/by/4.0/).
Share and Cite
Tauber, J.; Ramsbacher, A.; Svardal, K.; Krampe, J. Energetic Potential for Biological Methanation in Anaerobic Sewage Sludge Digesters in Austria. Energies 2021, 14, 6618. https://doi.org/10.3390/en14206618
Tauber J, Ramsbacher A, Svardal K, Krampe J. Energetic Potential for Biological Methanation in Anaerobic Sewage Sludge Digesters in Austria. Energies. 2021; 14(20):6618. https://doi.org/10.3390/en14206618
Chicago/Turabian StyleTauber, Joseph, Andreas Ramsbacher, Karl Svardal, and Jörg Krampe. 2021. "Energetic Potential for Biological Methanation in Anaerobic Sewage Sludge Digesters in Austria" Energies 14, no. 20: 6618. https://doi.org/10.3390/en14206618
APA StyleTauber, J., Ramsbacher, A., Svardal, K., & Krampe, J. (2021). Energetic Potential for Biological Methanation in Anaerobic Sewage Sludge Digesters in Austria. Energies, 14(20), 6618. https://doi.org/10.3390/en14206618